1. Introduction
Recent years, renewable energy techniques have attracted more attention because of classical fuel resources declining and concerns over environmental pollution. IT-SOFCs operating at 600-800
oC are of great interests due to fuel flexibility and appropriate for a great variety of applications [
1,
2,
3,
4]. However, one of the greatest difficulties by choosing an appropriate cathode material is because of the increased Rp and poor ORR activity [
5,
6]. Nowadays, many researchers are paying more attention to develop mixed ionic-electronic conductors (MIECs).
Due to layered structure, lower polarization resistances and higher catalytic activities of double perovskite (DP) and Ruddlesden-Popper (RP) , they are widely investigated as cathode materials for IT-SOFCs [
7,
8,
9,
10,
11]. Cation-ordered LnBaCo
2O
5+d oxides have been paid more attention due to faster oxygen ion diffusion and higher electrical conductivity [
12,
13,
14]. Shao Z.P. et al. [
15] ever did a systematic study of PrBaCo
2O
5+δ + Sm
0.2Ce
0.8O
1.9 composites as electrodes of SOFC, in which reckoned that improved performance of 70 wt% PBC+30 wt% SDC was due to a reduction of oxygen-ions diffusion path. Moreover, Wang H.R. et al. [
16] recently studied that PrBaCo
2O
5+d (PBC)+ NdMnO
3 composite cathode in reversible solid oxide cells, and got the conclusion that PBC-NdMnO
3 (NM) composites showed good electrochemical performances and reversible cycle performance. Furthermore, Sr and Fe doping in PrBaCo
2O
5+d enhanced thermal expansion behavior and ORR activity [
17]. Wang S.R. et al.[
17] recently studied that maxmium power density of PrBa
0.5Sr
0.5Co
1.5Fe
0.5O
5+δ (PBSCF) | BaZr
0.1Ce
0.7Y
0.1Yb
0.1O
3-δ (BZCYYb) | NiO-BZCYYb | NiO-BZCYYb single cell at 750
oC was 958.75 mW cm
-2 using dry H
2 as fuel.
Solution impregnation technique is one of the widely used techniques to prepare nano-structured SOFC cathodes with good electrochemical performance [
18,
19,
20,
21,
22,
23,
24,
25,
26]. There are several reports available on application of solution impregnation of SOFC cathodes. Li J. et al. [
6] ever did a systematic research on the electrochemical performance of La
2NiO
4-impregnated PBSCF cathode for SOFC, and they got the conclusion that PBSCF with LN impregnation of an average thickness (9 nm) showed lowest initial polarization resistance of 0.51 Ω cm
2 and highest power density of 0.71 W/cm
2 . They also reckoned that LN had higher oxygen surface exchange coefficient and LN coating depressed Sr segregation . Chen K.F. et al. ever reported that a BaO infiltrated LSCF exhibited better tolerance and resistance towards Cr poisoning due to preventing excess Sr deficiency at the A-site of LSCF and thus preventing Cr poisoning effect [
27]. Huang J.Y. et al. recently reported that infiltration of BaCO
3 into LSCF could increase the performance of the single cell and it could deliver a peak power density of 1.30 W cm
–2 at 800 °C [
28].
To make better usage of DP and RP, RP-impregnated DP cathode was investigated by solution impregnation in the present study. The effect of LN impregnation on the electrochemical performances of La1-xPrxBa0.5Sr0.5Co1.5Fe0.5O5+δ(LPBSCF, x=0.3) electrode was investigated. Moreover, the effect of different impregnation loadings of LN was simultaneously studied under SOFC operating conditions. Results clearly showed that impregnation LN can decrease electrode polarization resistance of La1-xPrxBa0.5Sr0.5Co1.5Fe0.5O5+δ(LPBSCF, x=0.3) cathodes and increased single cell stability.
2. Experimental
2.1. Powder Preparation
A series of La1-xPrxBa0.5Sr0.5Co1.5Fe0.5O5+δ (x=1,0.3,0) were synthesized using the traditional sol–gel method. Firstly, all metal nitrates (La, Pr, Ba, Sr, Co, and Fe) (Sigma Corporation,99.9% trace metal basis) were weighed and dissolved in distilled water at stoichiometric ratios. Secondly, citrate acid (CA) (n(metal cations):n(CA)=1:1.5) was added to the solution, while ethylenediaminetetraacetic acid (EDTA) (n(metal cations):n(EDTA)=1:1) was mixed with NH3.H2O and stirred at 80 °C for 4 h. Finally, three types of powders were sintered at 900, 950, and 1000 °C for 4 h to identify the crystalline phase formation.
2.2. Symmetrical Half-Cells and Single Cells Fabrication
The procedure for making symmetrical cells was as follows: a dense Gd0.1Ce0.9O1.95(GDC) electrolyte disc pellet with a diameter of Φ16 mm was obtained from Handan Technology Co. La1-xPrxBa0.5Sr0.5Co1.5Fe0.5O5+δ (LPBSCF) (x=1,0.3,0) powder was mixed with terpineol solvents and ethyl cellulose binders to create uniform cathode slurries. These slurries were then screen-printed on both sides of the GDC pellet and sintered at 1050 °C for 3 h to form uniform LPBSCF cathodes.
La(NO3)3 and Ni(NO3)2 solution (0.08 mol/L; Aladdin Industrial Corporation) were infiltrated into LPBSCF(x=0.3) cathodes and fired at 950 °C for 2 h. Each side of La2NiO4 loading was 0.64 and 1.28 mg/cm2 (referred to as LPBSCF3-LN-0.04M and LPBSCF3-LN-0.08M, respectively). Pt paste was applied onto the surface of the LPBSCF-LN electrode as a current collector and heated in an oven at 200 °C for 2 h. A silver paste was used to connect the wires. LN solution was dried and calcined in air at 950 °C for 2 h to form LN powder for phase identification. The chemical compatibility of LPBSCF(x=0.3) and LN powders was confirmed at 1000 °C for 3 h.
Commercial SOFC button half-cells (NiO-YSZ|YSZ|GDC) with a diameter of Φ16 mm (Ningbo Qingbang Company) were obtained for performance testing. The cathode slurry was applied onto the GDC layer (surface area of 0.2826 cm2) and fired at 1050 °C for 3 h. The impregnation and sintering methods for LPBSCF3-LN-0.04M were the same as those for the symmetrical cell mentioned above.
2.3. Electrochemical and Microstructural Characterization
The electrochemical performances of LPBSCF and LN-LPBSCF cathodes were evaluated using the three-electrode method at 700 °C, employing an electrochemical workstation (Shanghai Chenhua). The potential at a cathodic current of 200 mA cm-2 was recorded at 700 °C for 40 h. Electrochemical impedance spectroscopy (EIS) curves were collected under open circuit voltage (OCV) conditions (0.1 Hz to 100 kHz) with a signal amplitude of 10 mV. Rp was obtained from the difference between the high- and low-frequency intercepts. The current (I)-voltage (V) and current (I)-power (P) of single-cells were obtained using hydrogen (3% H2O/97% H2) fuel (Corrtest CS, Wuhan CorrTest Instruments Corp., Ltd.) with a flow rate of 40 mL/min at 800 °C.
The phase formation and chemical compatibility of the powders were tested by X-Ray diffraction (XRD; Bruker, D8 Advances) from 10° to 80° (2θ). Scanning electron microscopy (SEM, ZEISS) and transmission electron microscopy (TEM, Titan G2 60-300) were used to examine the powder morphology. The surfaces and cross-sections of the LPBSCF3, LPBSCF3-LN-0.04M, and LPBSCF3-LN-0.08M cathodes and single cells were examined using SEM (NEON 40ESB) and energy dispersive spectroscopy (EDS). Focused ion beam scanning electron microscopy (FIB-SEM, Helios G4 PFIB, CXe DualBeam) was used to characterize the microstructure and elemental mapping of a typical cross-section of the LPBSCF3-LN-0.04M cathode.
3. Results and Discussion
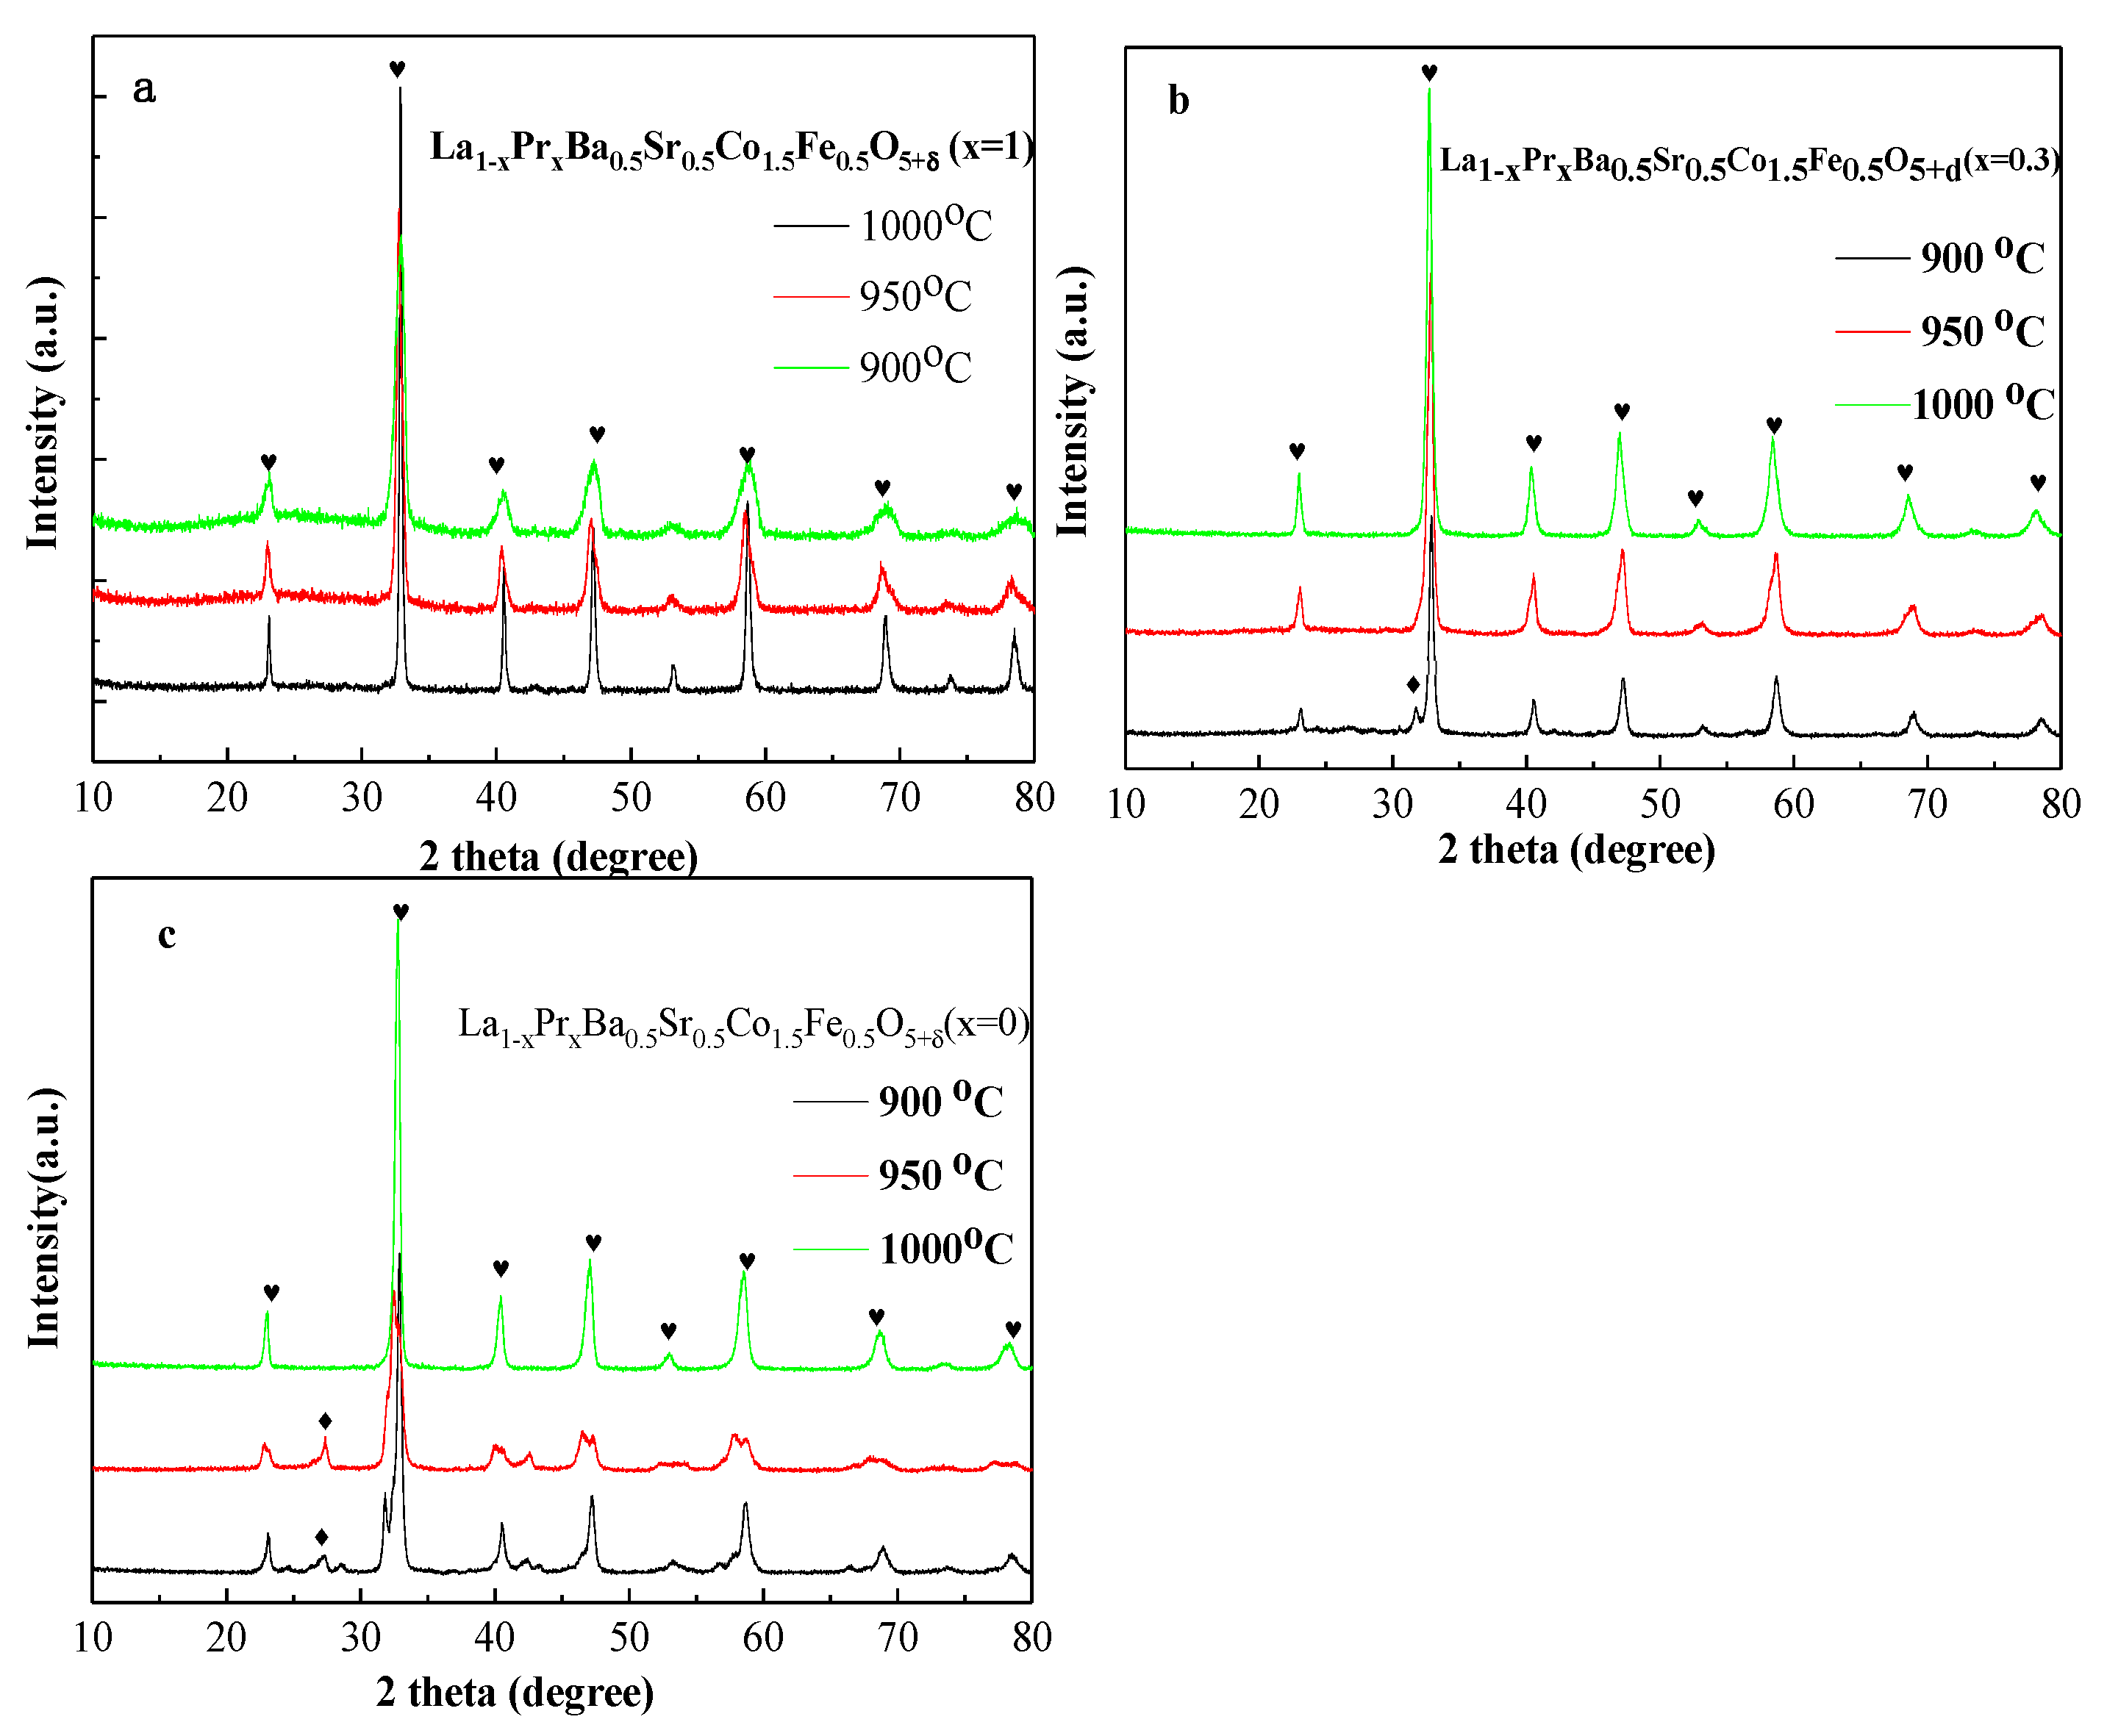
Figure 1(a–c) illustrates the XRD patterns for La
1-xPr
xBa
0.5Sr
0.5Co
1.5Fe
0.5O
5+δ (LPBSCF) (x=1,0.3,0) powders firing at different temperatures (900–1000 °C). No impurity phase was observed when sol–gel was fired at 1000 °C for all powders. As shown in Fig. 1b, a small peak was obtained at approximately 30° when LPBSCF(x=0.3) was fired at 900 °C, which was related to SrFeO
4 with JCPDS of 29-1305. Two peaks were also obtained when LPBSCF(x=0) was fired at 900 and 950 °C, correlating to BaFe
2O
4 with JCPDS of 26-0158 by Jade software. The pure phase LPBSCF(x=1,0.3,0) was obtained by the EDTA-citrate method at 1000 °C.
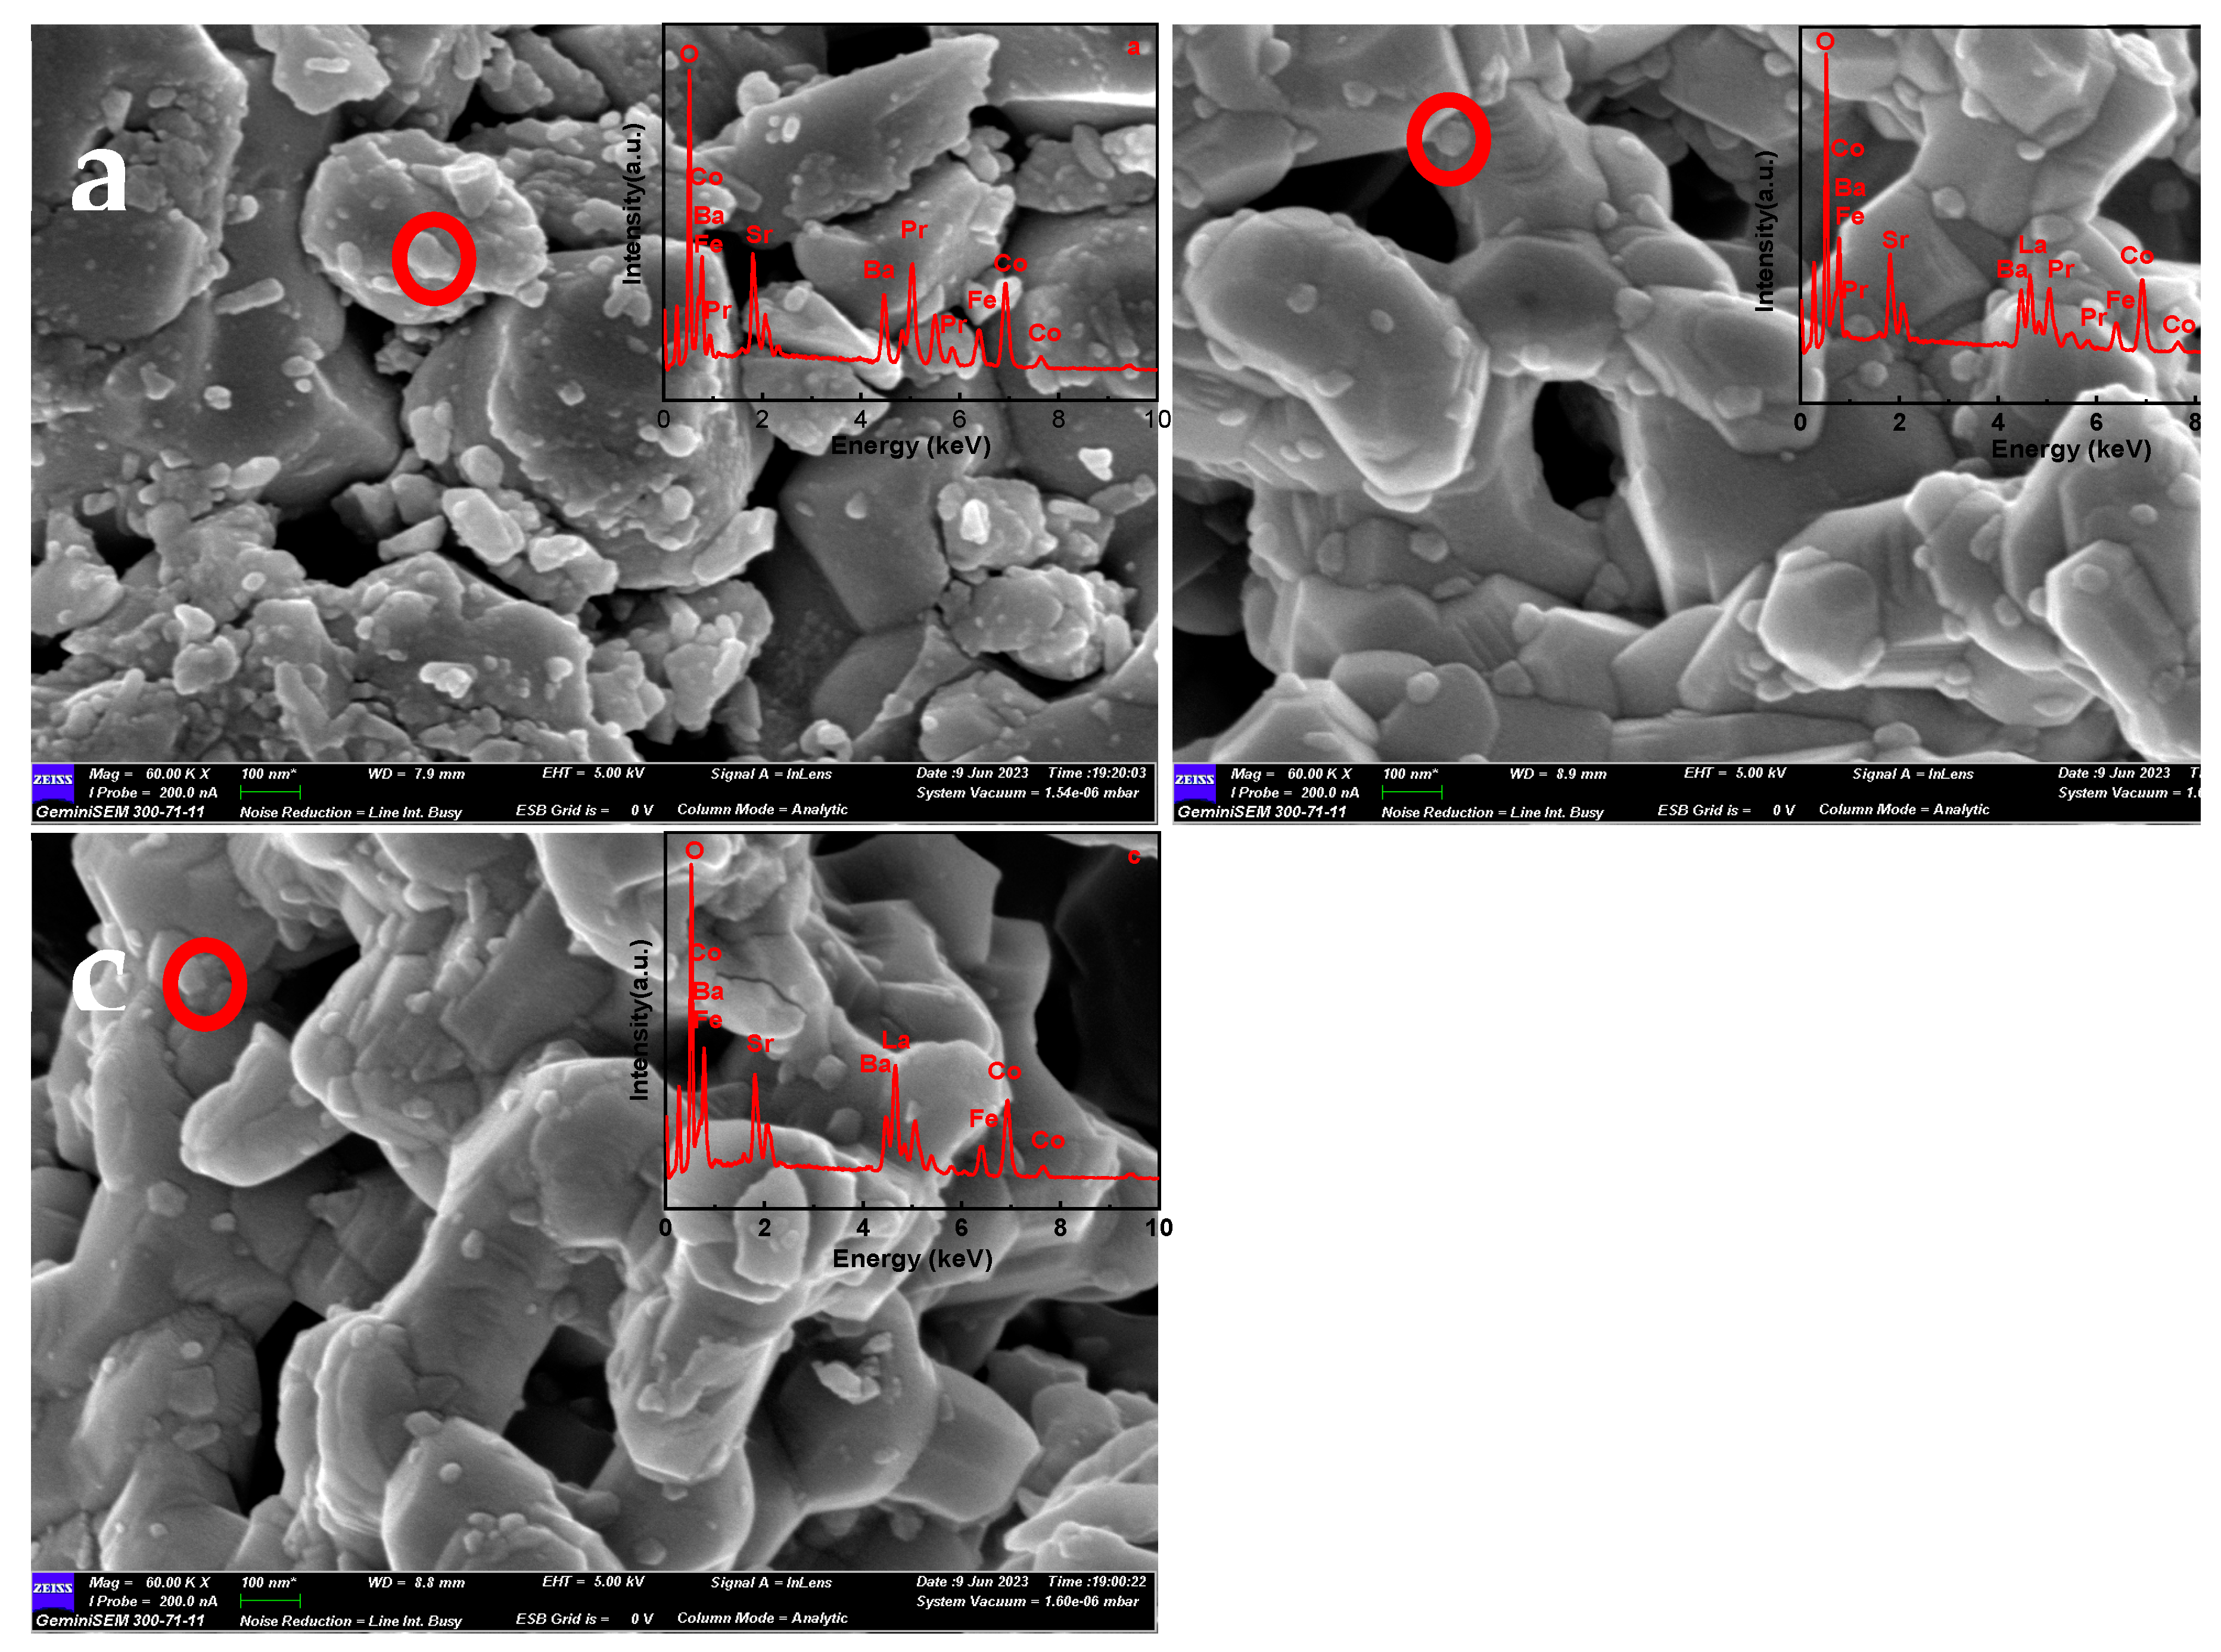
To identify powder morphology, Fig. 2a shows that LPBSCF(x=1) particles firing at 1000 °C were dispersed, with some irregular particles (at approximately 30–200 nm). The inset of Fig. 2a shows that the EDX spectrum contains only the Pr, Ba, Sr, Co, Fe, and O spectra. According to the quantitative EDS results, the atomic ratios of Pa, Ba, Sr, Co, Fe, and O were 8.46%, 4.93%, 5.76%, 13.98%, 4.77%, and 62.09%, respectively.
Figure 2b shows that the average size of the LBSCF (x=0.3) was approximately 200 nm, and compared to that of Fig. 2a, the particles were more uniform in shape. According to the EDS results, the atomic ratios of La, Pr, Ba, Sr, Co, Fe, and O were 6.05%, 2.45%, 4.63%, 5.26%,12.84%, 4.27%, and 64.51%, respectively. Moreover, the LPBSCF(x=0) particles were well distributed and connected, as shown in
Figure 2c. The average particle size was approximately 220 nm.
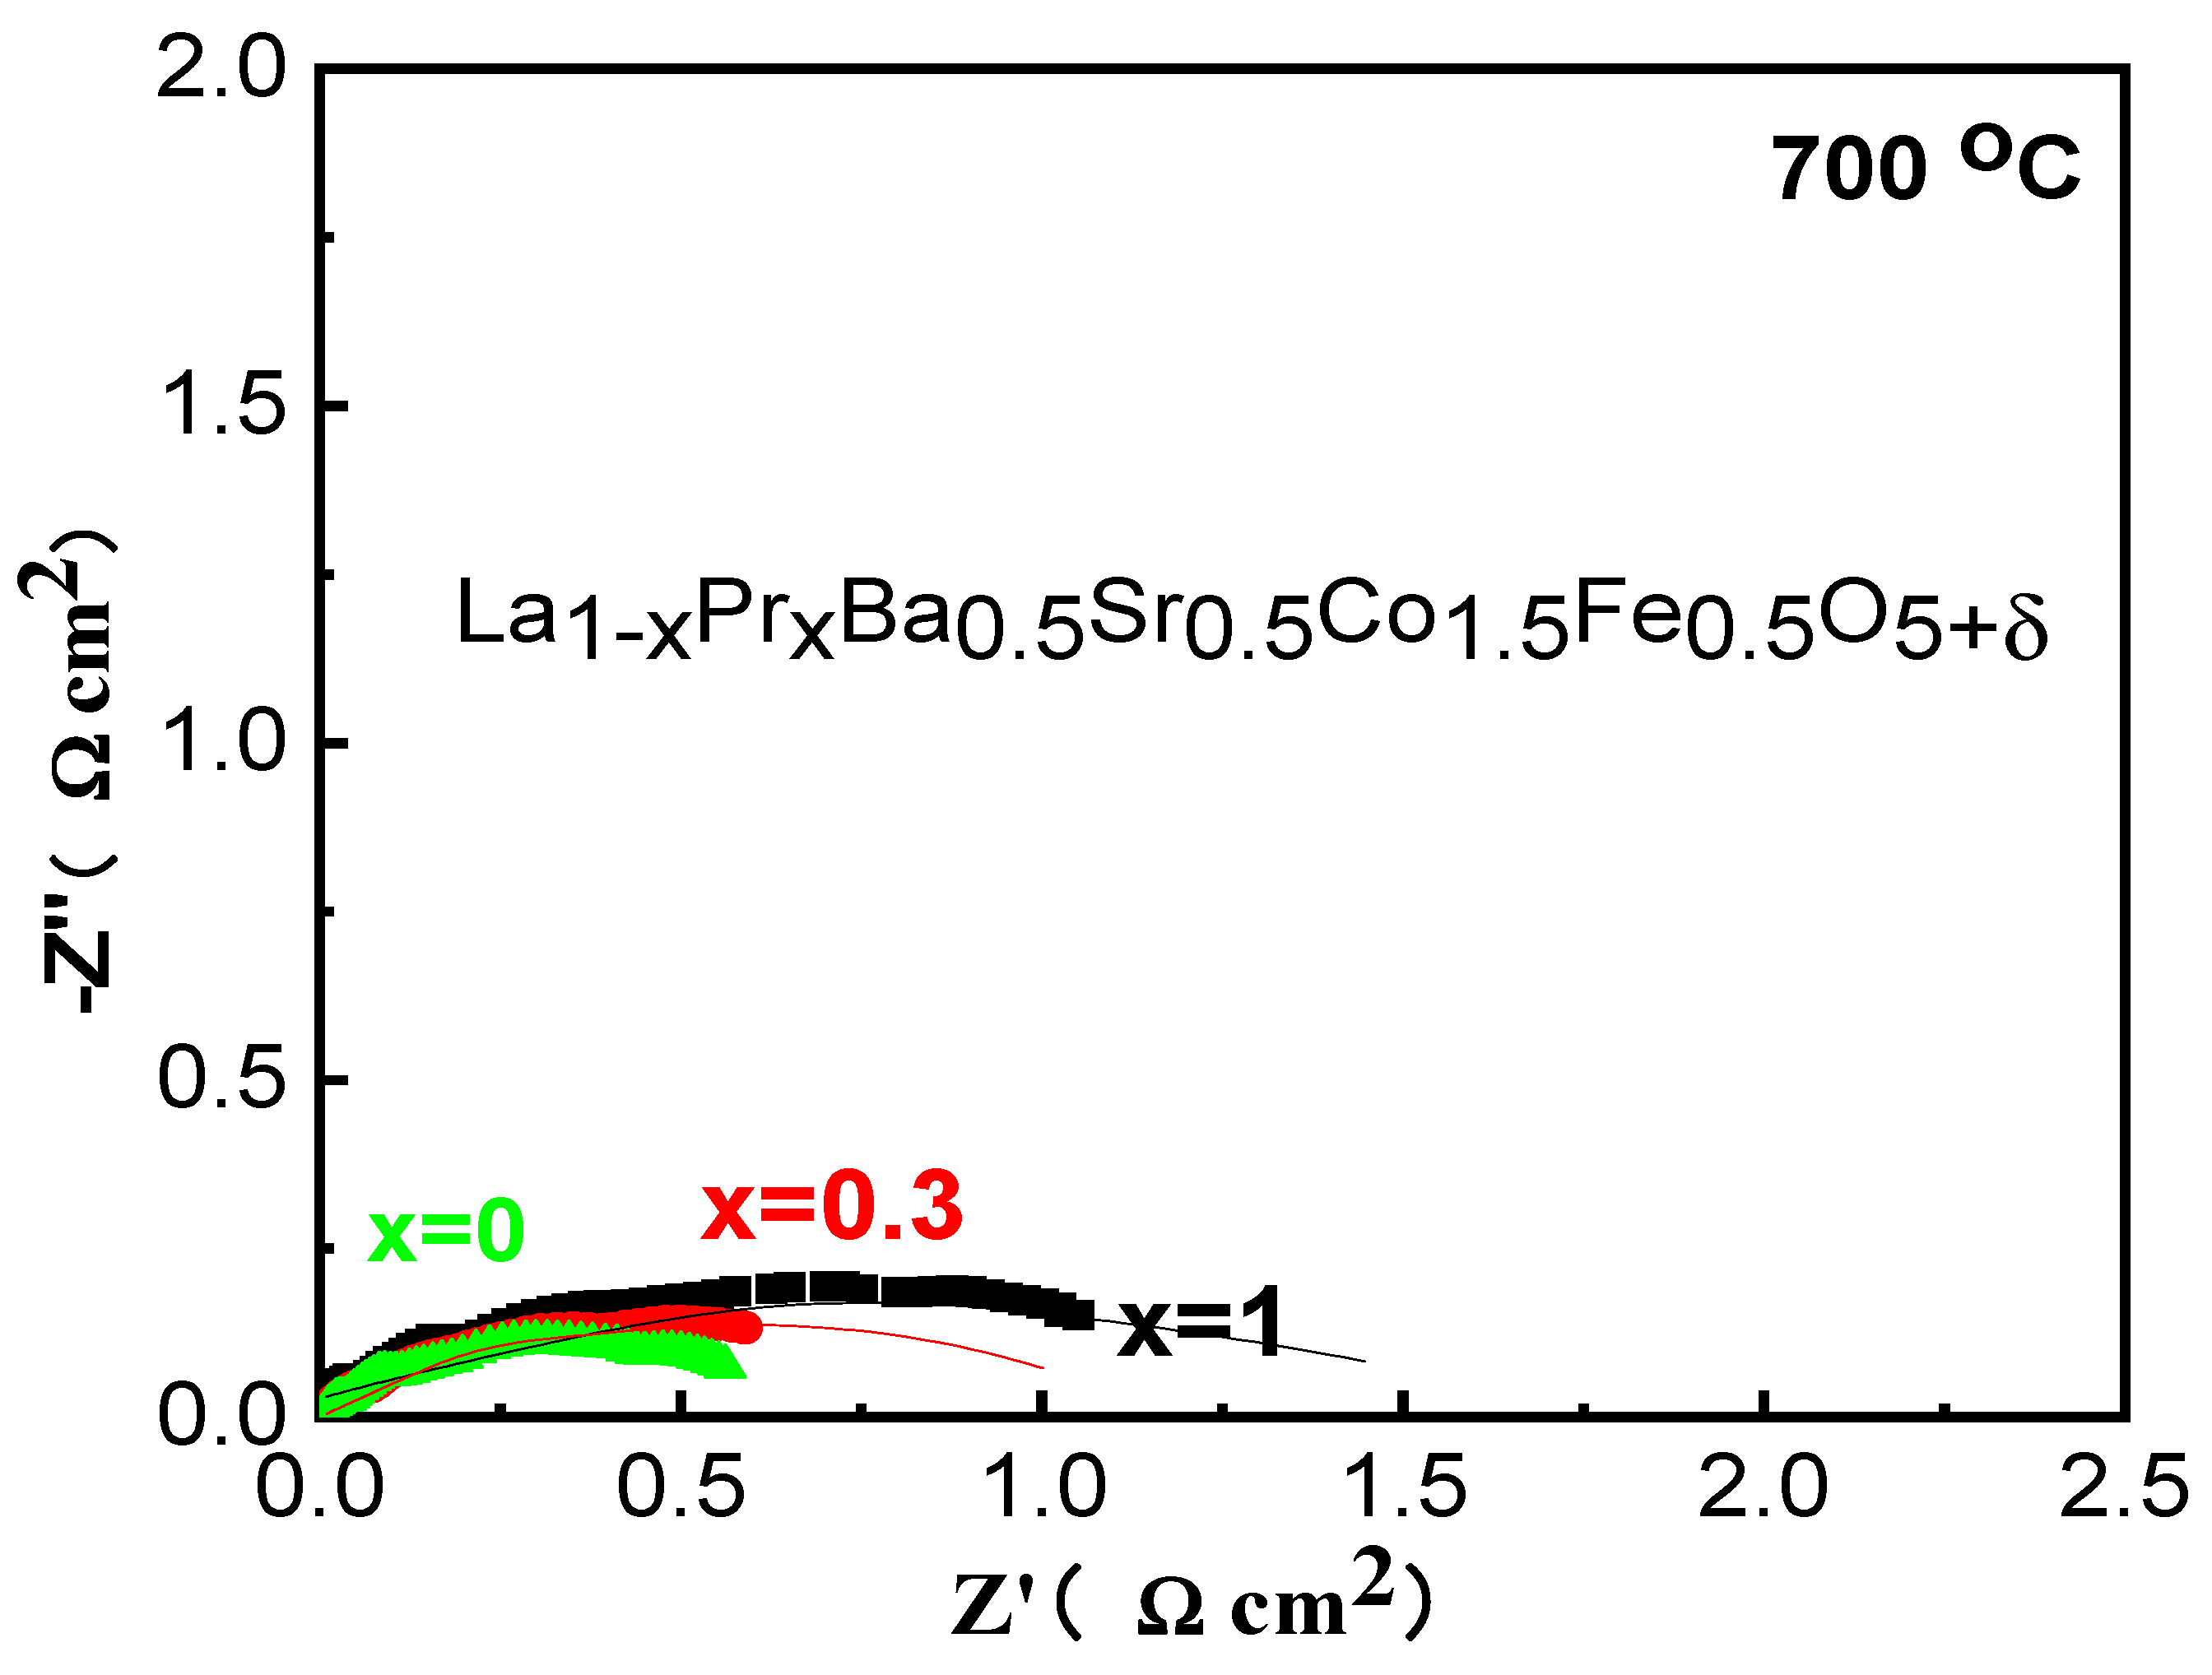
In order to test the impedance of LPBSCF electrode at lower temperature, the initial EIS of three LPBSCF (x=1,0.3,0) cathodes firing at 1000 °C were acquired in air at 700 °C under open circuit condition (
Figure 3a–c). The R
P of LPBSCF (x=0.3) was 0.5 cm
2, which was lower than that of LPBSCF (x=1, 0), and the Rp values of LPBSCF(x=0.3) were smaller than those in previous studies [
6], which might indicate that the interface of the cathode and electrolyte connected well with each other. Deconvoluting EIS at 700 °C into R
PH and R
PL were obtained, which are listed in
Table 1. LPBSCF (x=0.3) exhibited a relatively lower R
PL than LPBSCF(x=1,0), indicating that the surface reaction products were relatively easily transported away from the surface [
6].
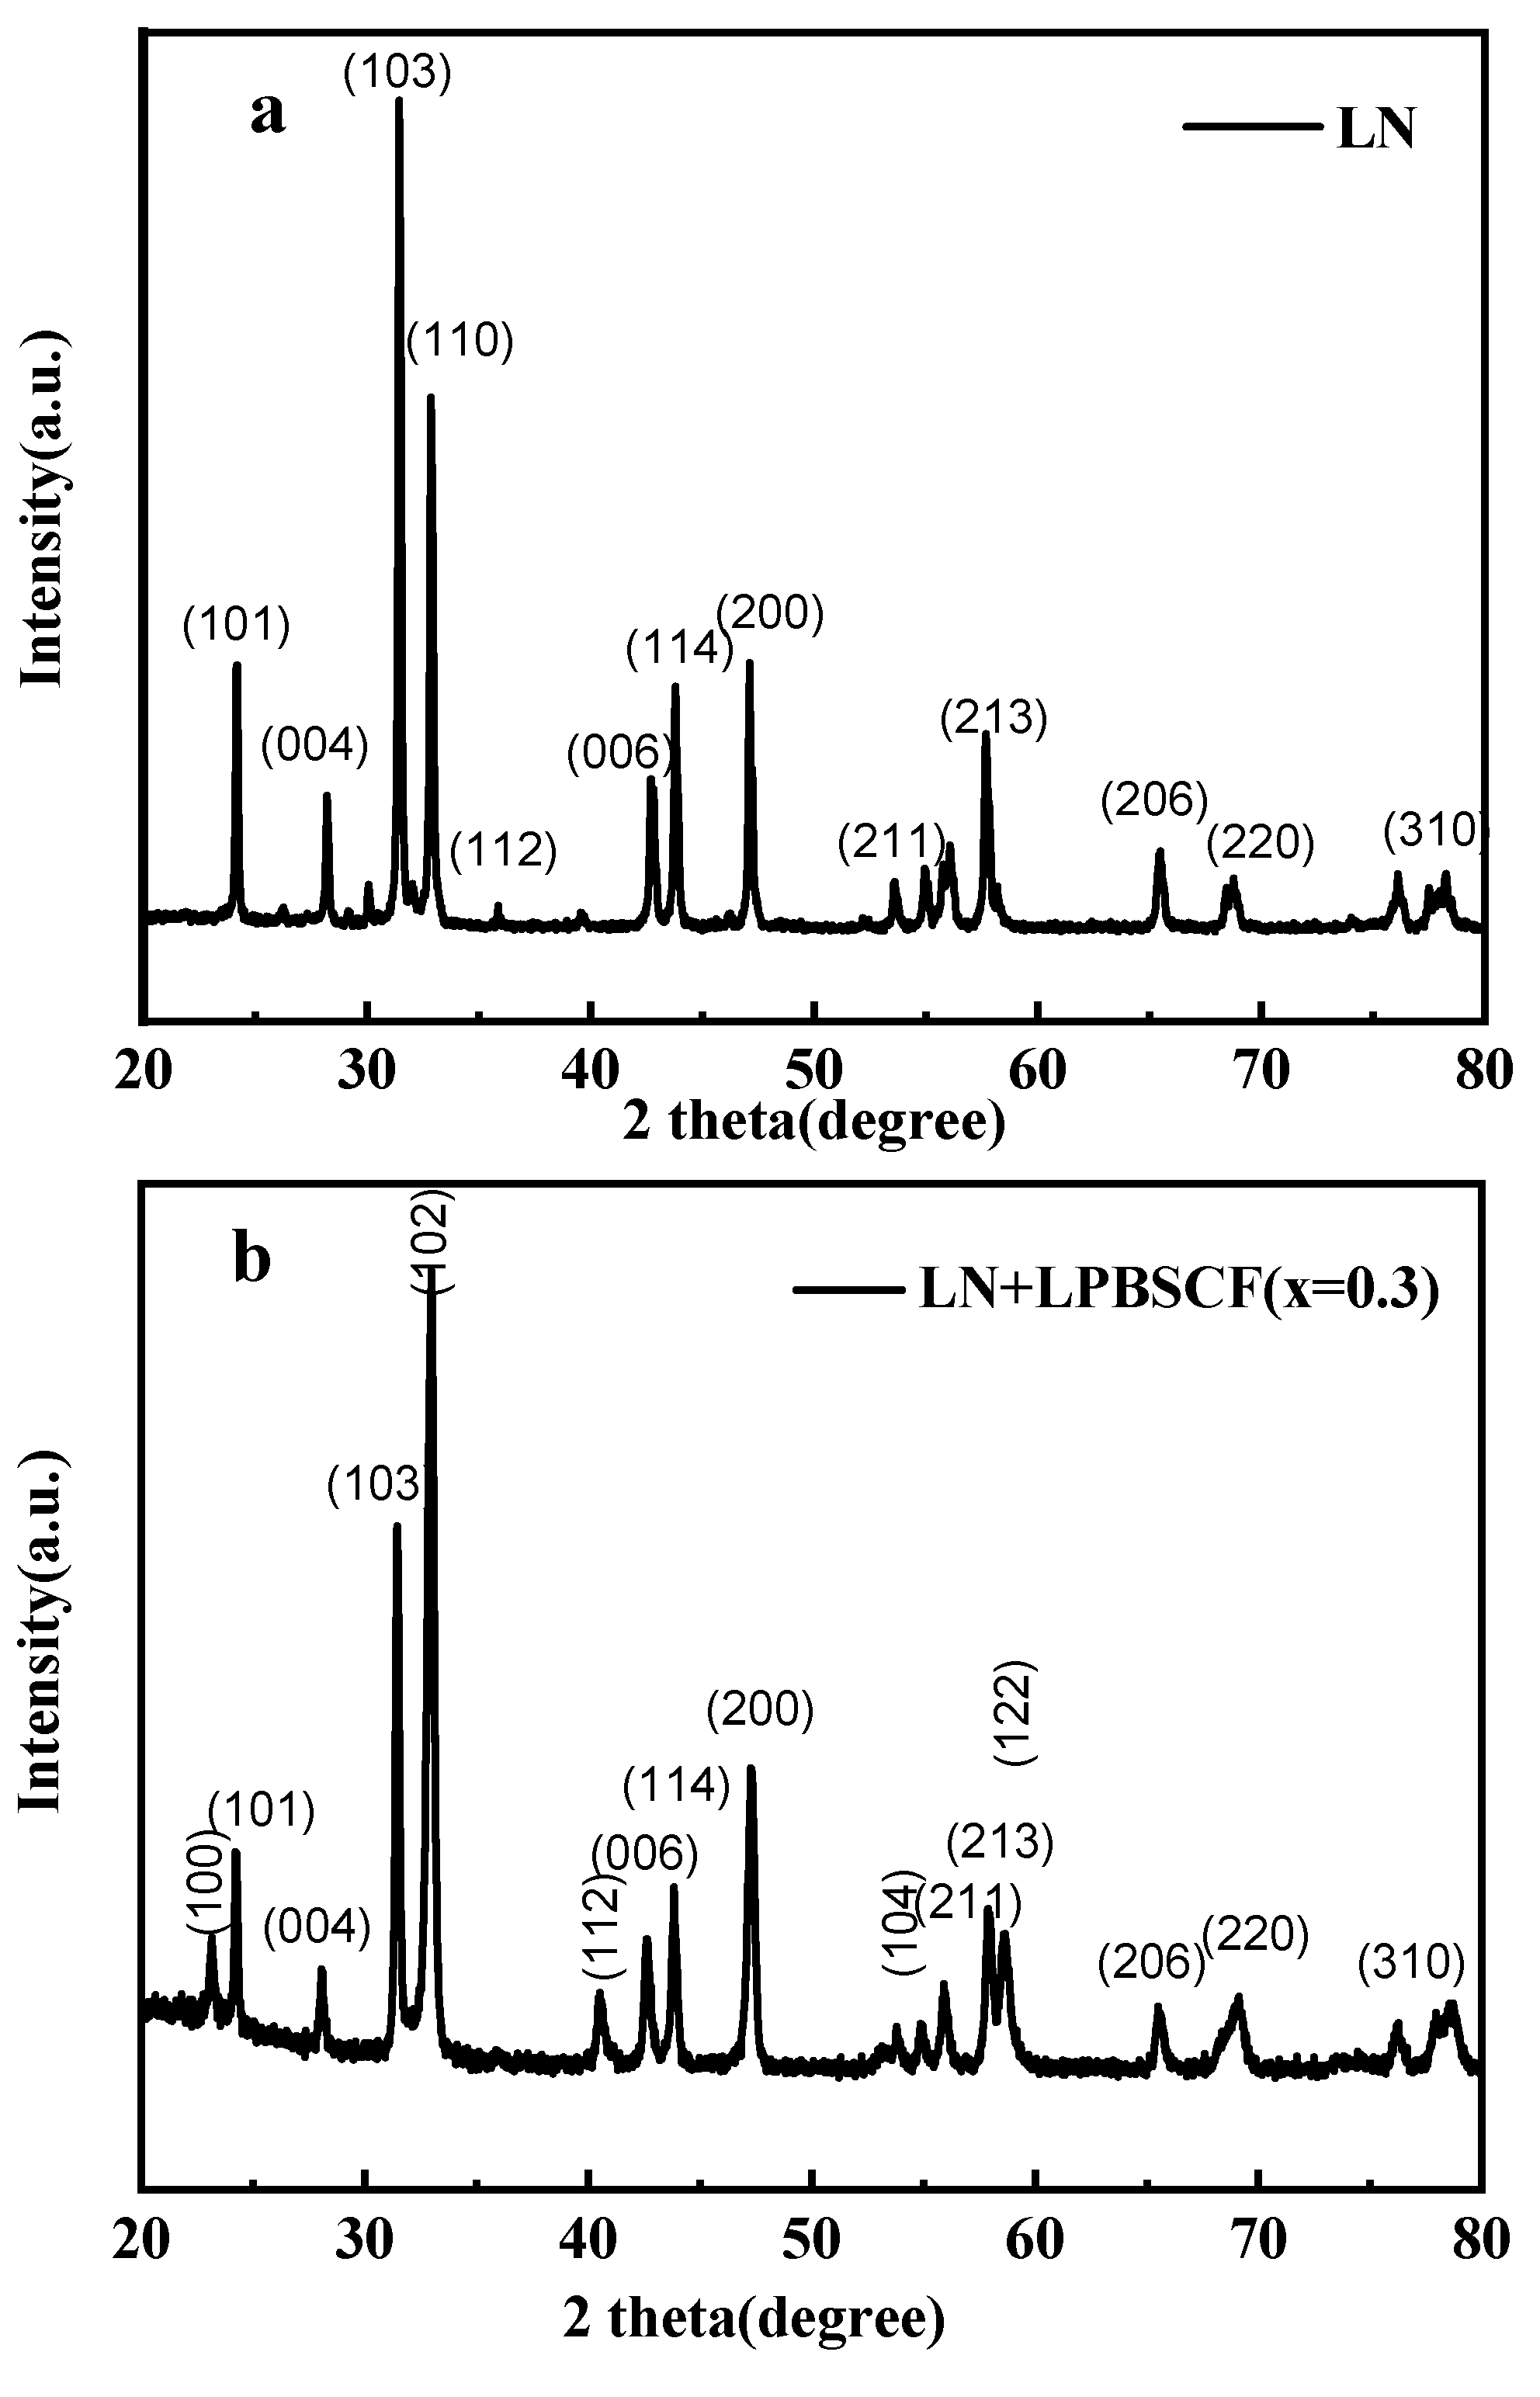
In this study, pure phase La
2NiO
4 (LN) was obtained using the EDTA-citrate method, as shown in
Figure 4a. To confirm the chemical compatibility of LN and LPBSCF(x=0.3), these powders were co-fired at 1000 °C for 3 h. According to the results shown in
Figure 4b, all powders formed a pure phase with their crystal plane index, and no other impurity peaks were observed. The crystal plane index was determined based on previous studies [
29,
30].
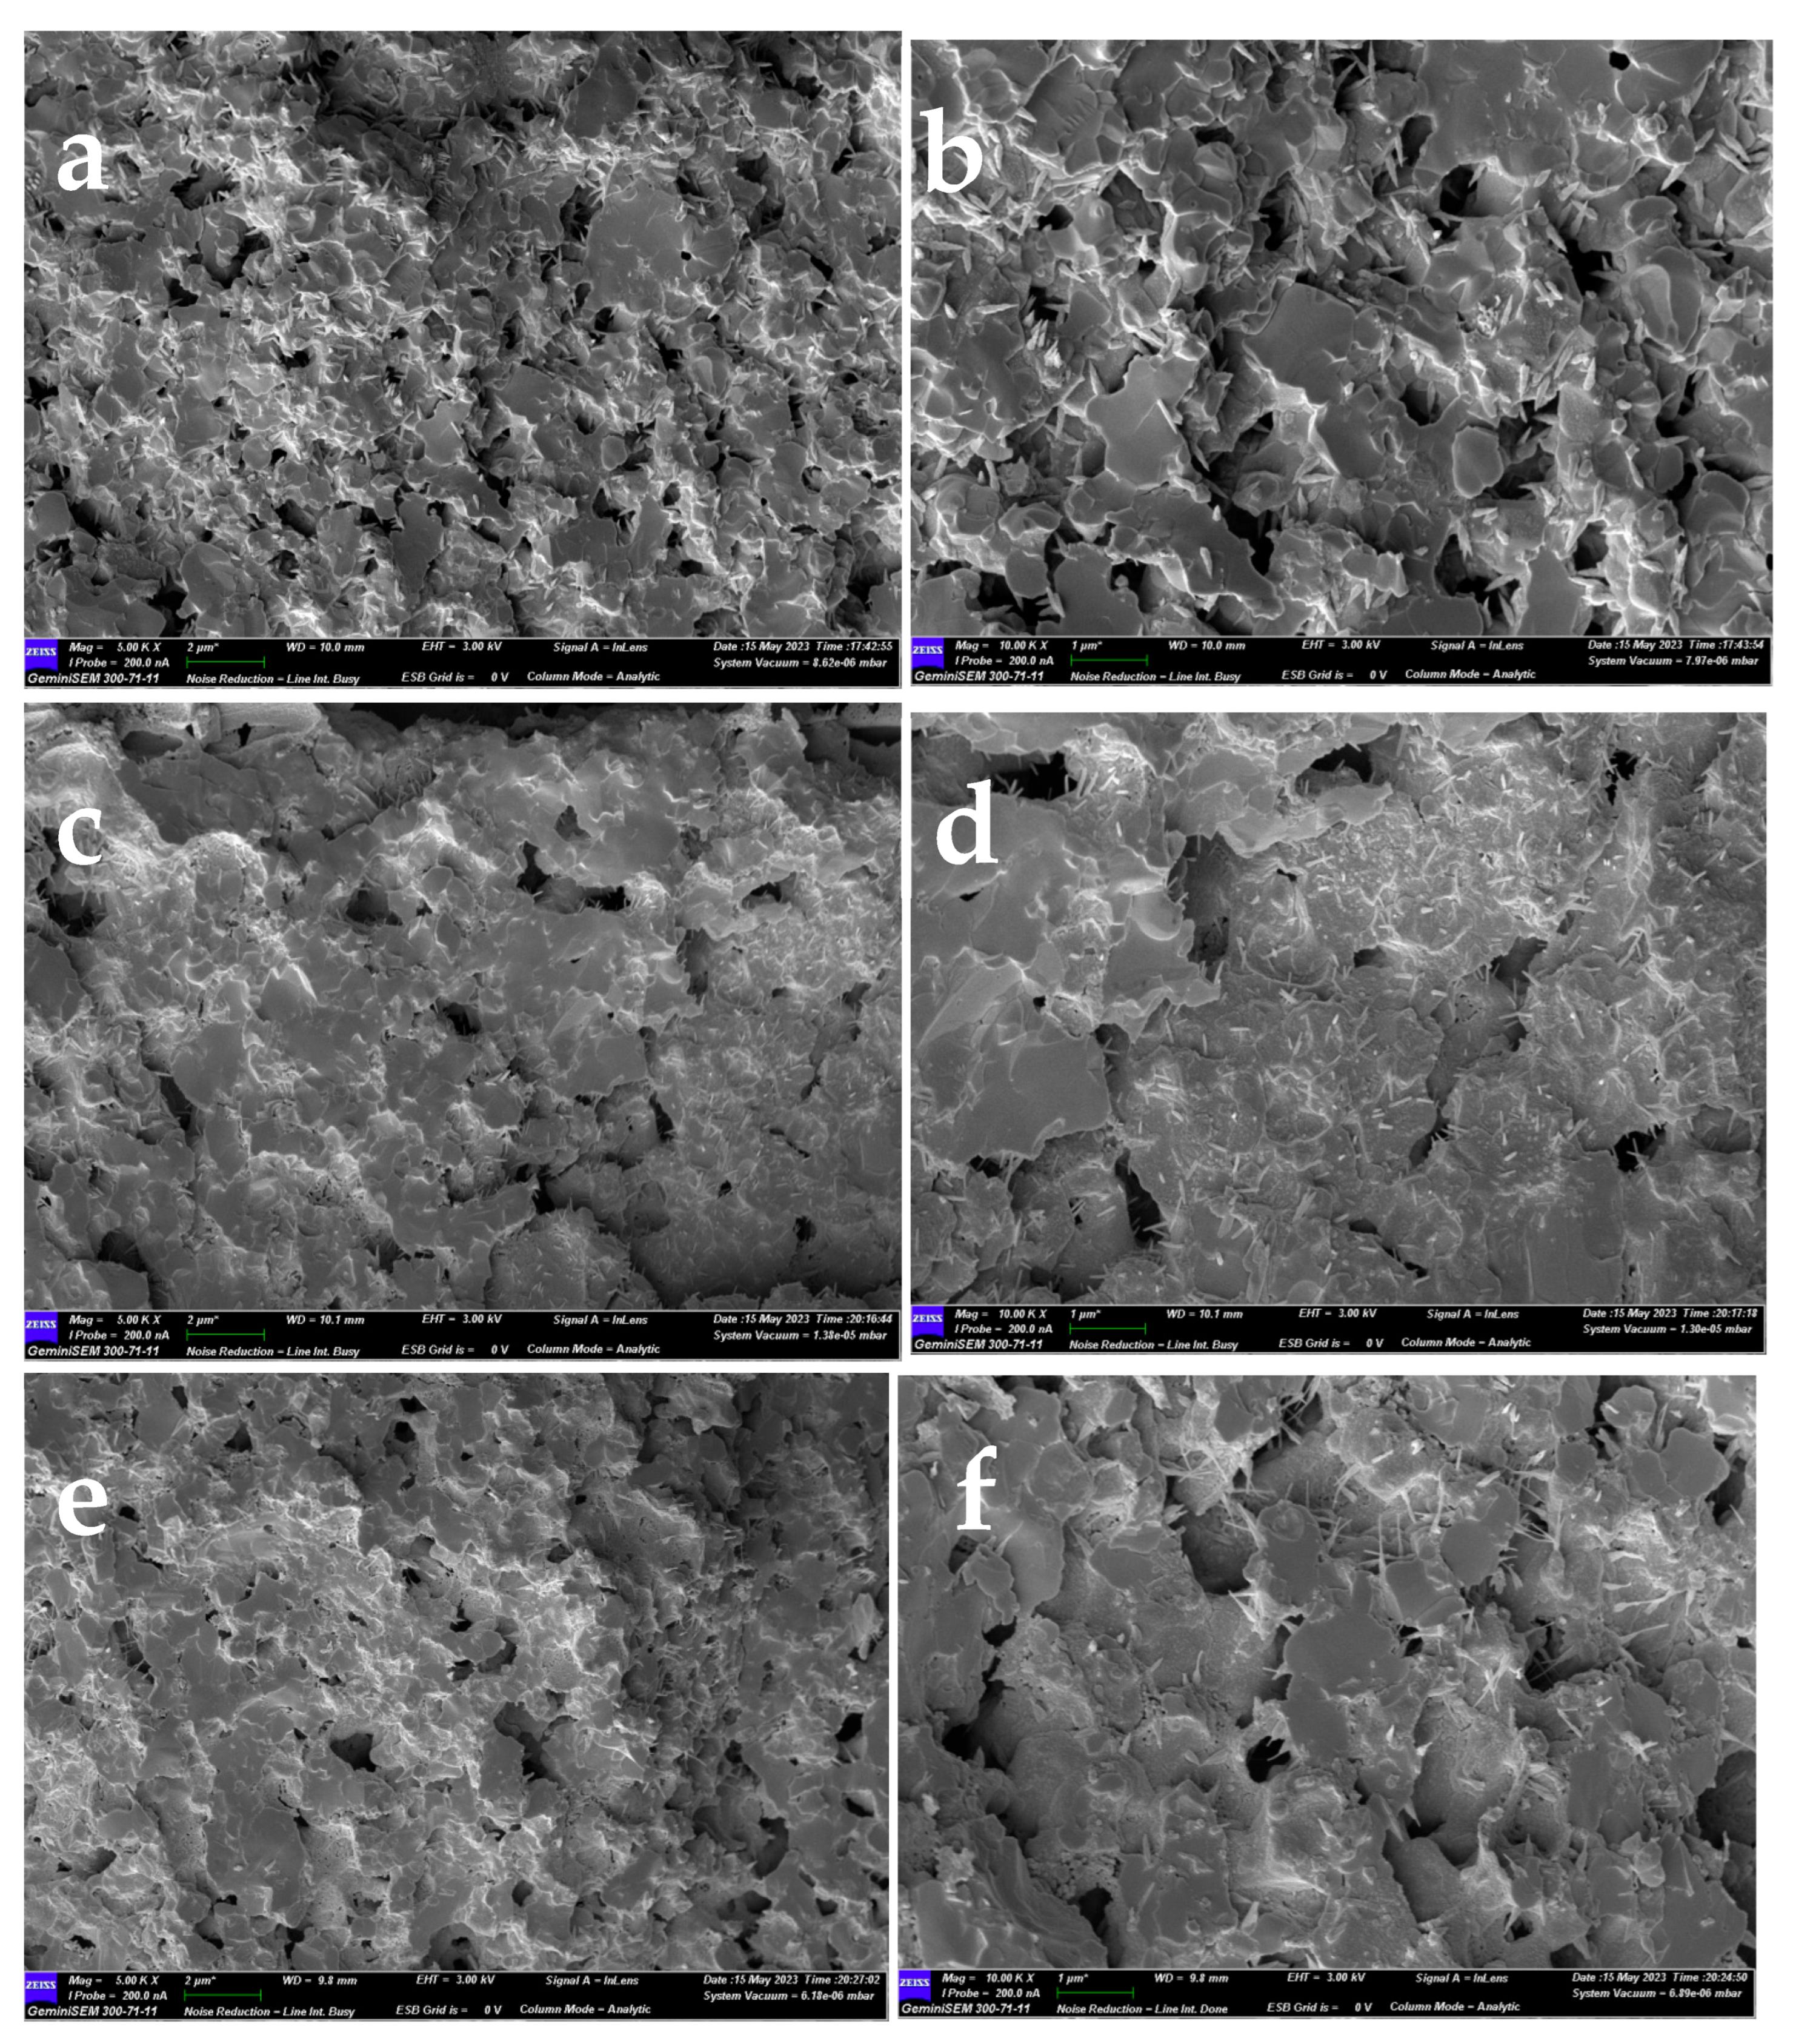
Figure 5 shows the cross-sectional SEM images of the LPBSCF3, LPBSCF3-LN-0.04M, and LPBSCF3-LN-0.08M electrodes before the electrochemical tests. The size of the LPBSCF3 particles had a width size of 0.5–1 µm. The surfaces were smooth, and the distribution of different pores was uniform (
Figure 5a,b). After impregnation with LN 0.04 M and 0.08 M (Figs. 5c,d and e,f, respectively), there were significant microstructural changes. The surfaces of the LPBSCF3 particles were rough, and more needle-like particles were observed (
Figure 5c,e). More needle-like particles are depicted in
Figure 5e compared to
Figure 5c, indicating that more LN particles covered the surface of the LPBSCF3 particles. Moreover, according to the SEM results, the porosity of LPBSCF3-LN-0.04M and LPBSCF3-LN-0.08M were less than that of LPBSCF3.
To identify the internal cross-sectional microstructure of the LPBSCF3-LN-0.04M cathodes.
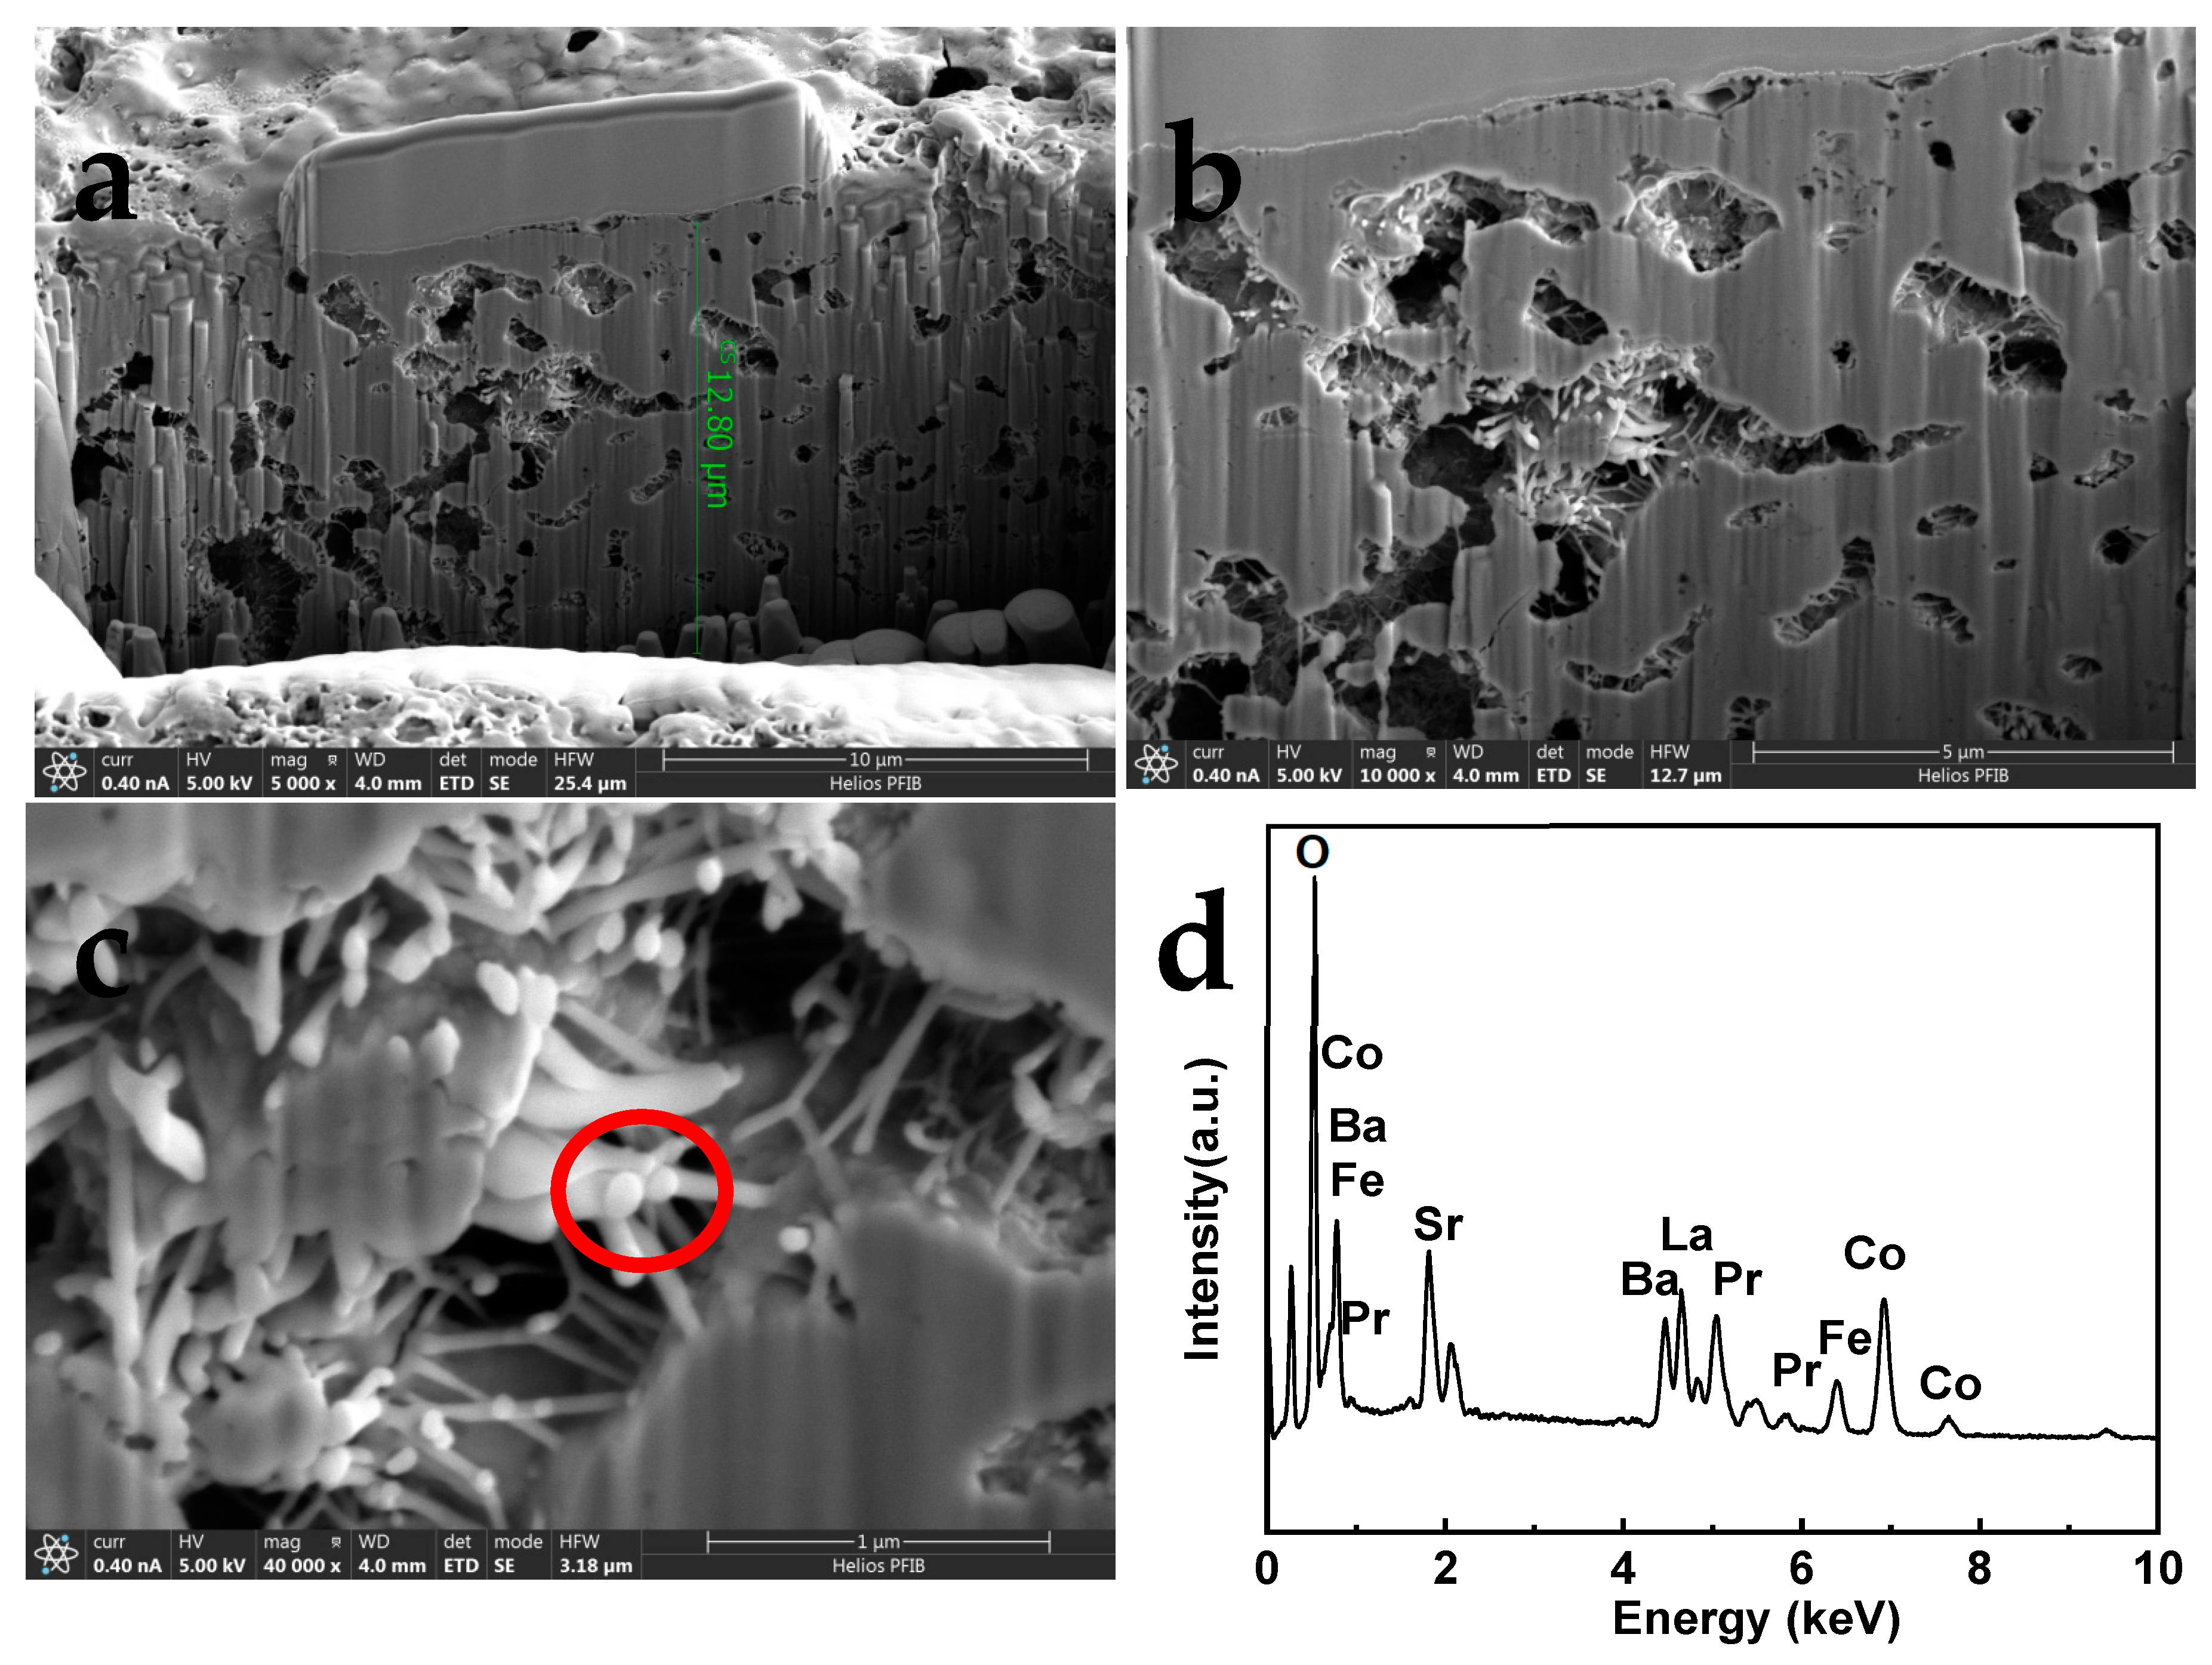
Figure 6 shows a cross-sectional image of the LPBSCF3-LN-0.04M cathode obtained by FIB-SEM.
Figure 6a shows the internal width of the cathode, which is approximately 12.80 um. The pores were homogeneously distributed in the bulk of the cathode. Moreover, needle-like particles were located inside the LPBSCF3 cathode, detected within the electrode bulk, and their size was approximately 100 nm (
Figure 6b,c). EDS analysis illustrates the presence of La and Ni, as well as Pr, Ba, Sr, Co, Fe, and O, as shown in
Figure 6d.
Figure 5.
Cross-sectional micro structures of (a) LPBSCF3 cathode; (b) impregnated LPBSCF3-LN-0.04M cathode; (c) impregnated LPBSCF3-LN-0.08M cathode.
Figure 5.
Cross-sectional micro structures of (a) LPBSCF3 cathode; (b) impregnated LPBSCF3-LN-0.04M cathode; (c) impregnated LPBSCF3-LN-0.08M cathode.
Figure 6.
FIB-SEM of cross-section micro structures of impregnated LPBSCF3-LN-0.04M cathode.
Figure 6.
FIB-SEM of cross-section micro structures of impregnated LPBSCF3-LN-0.04M cathode.
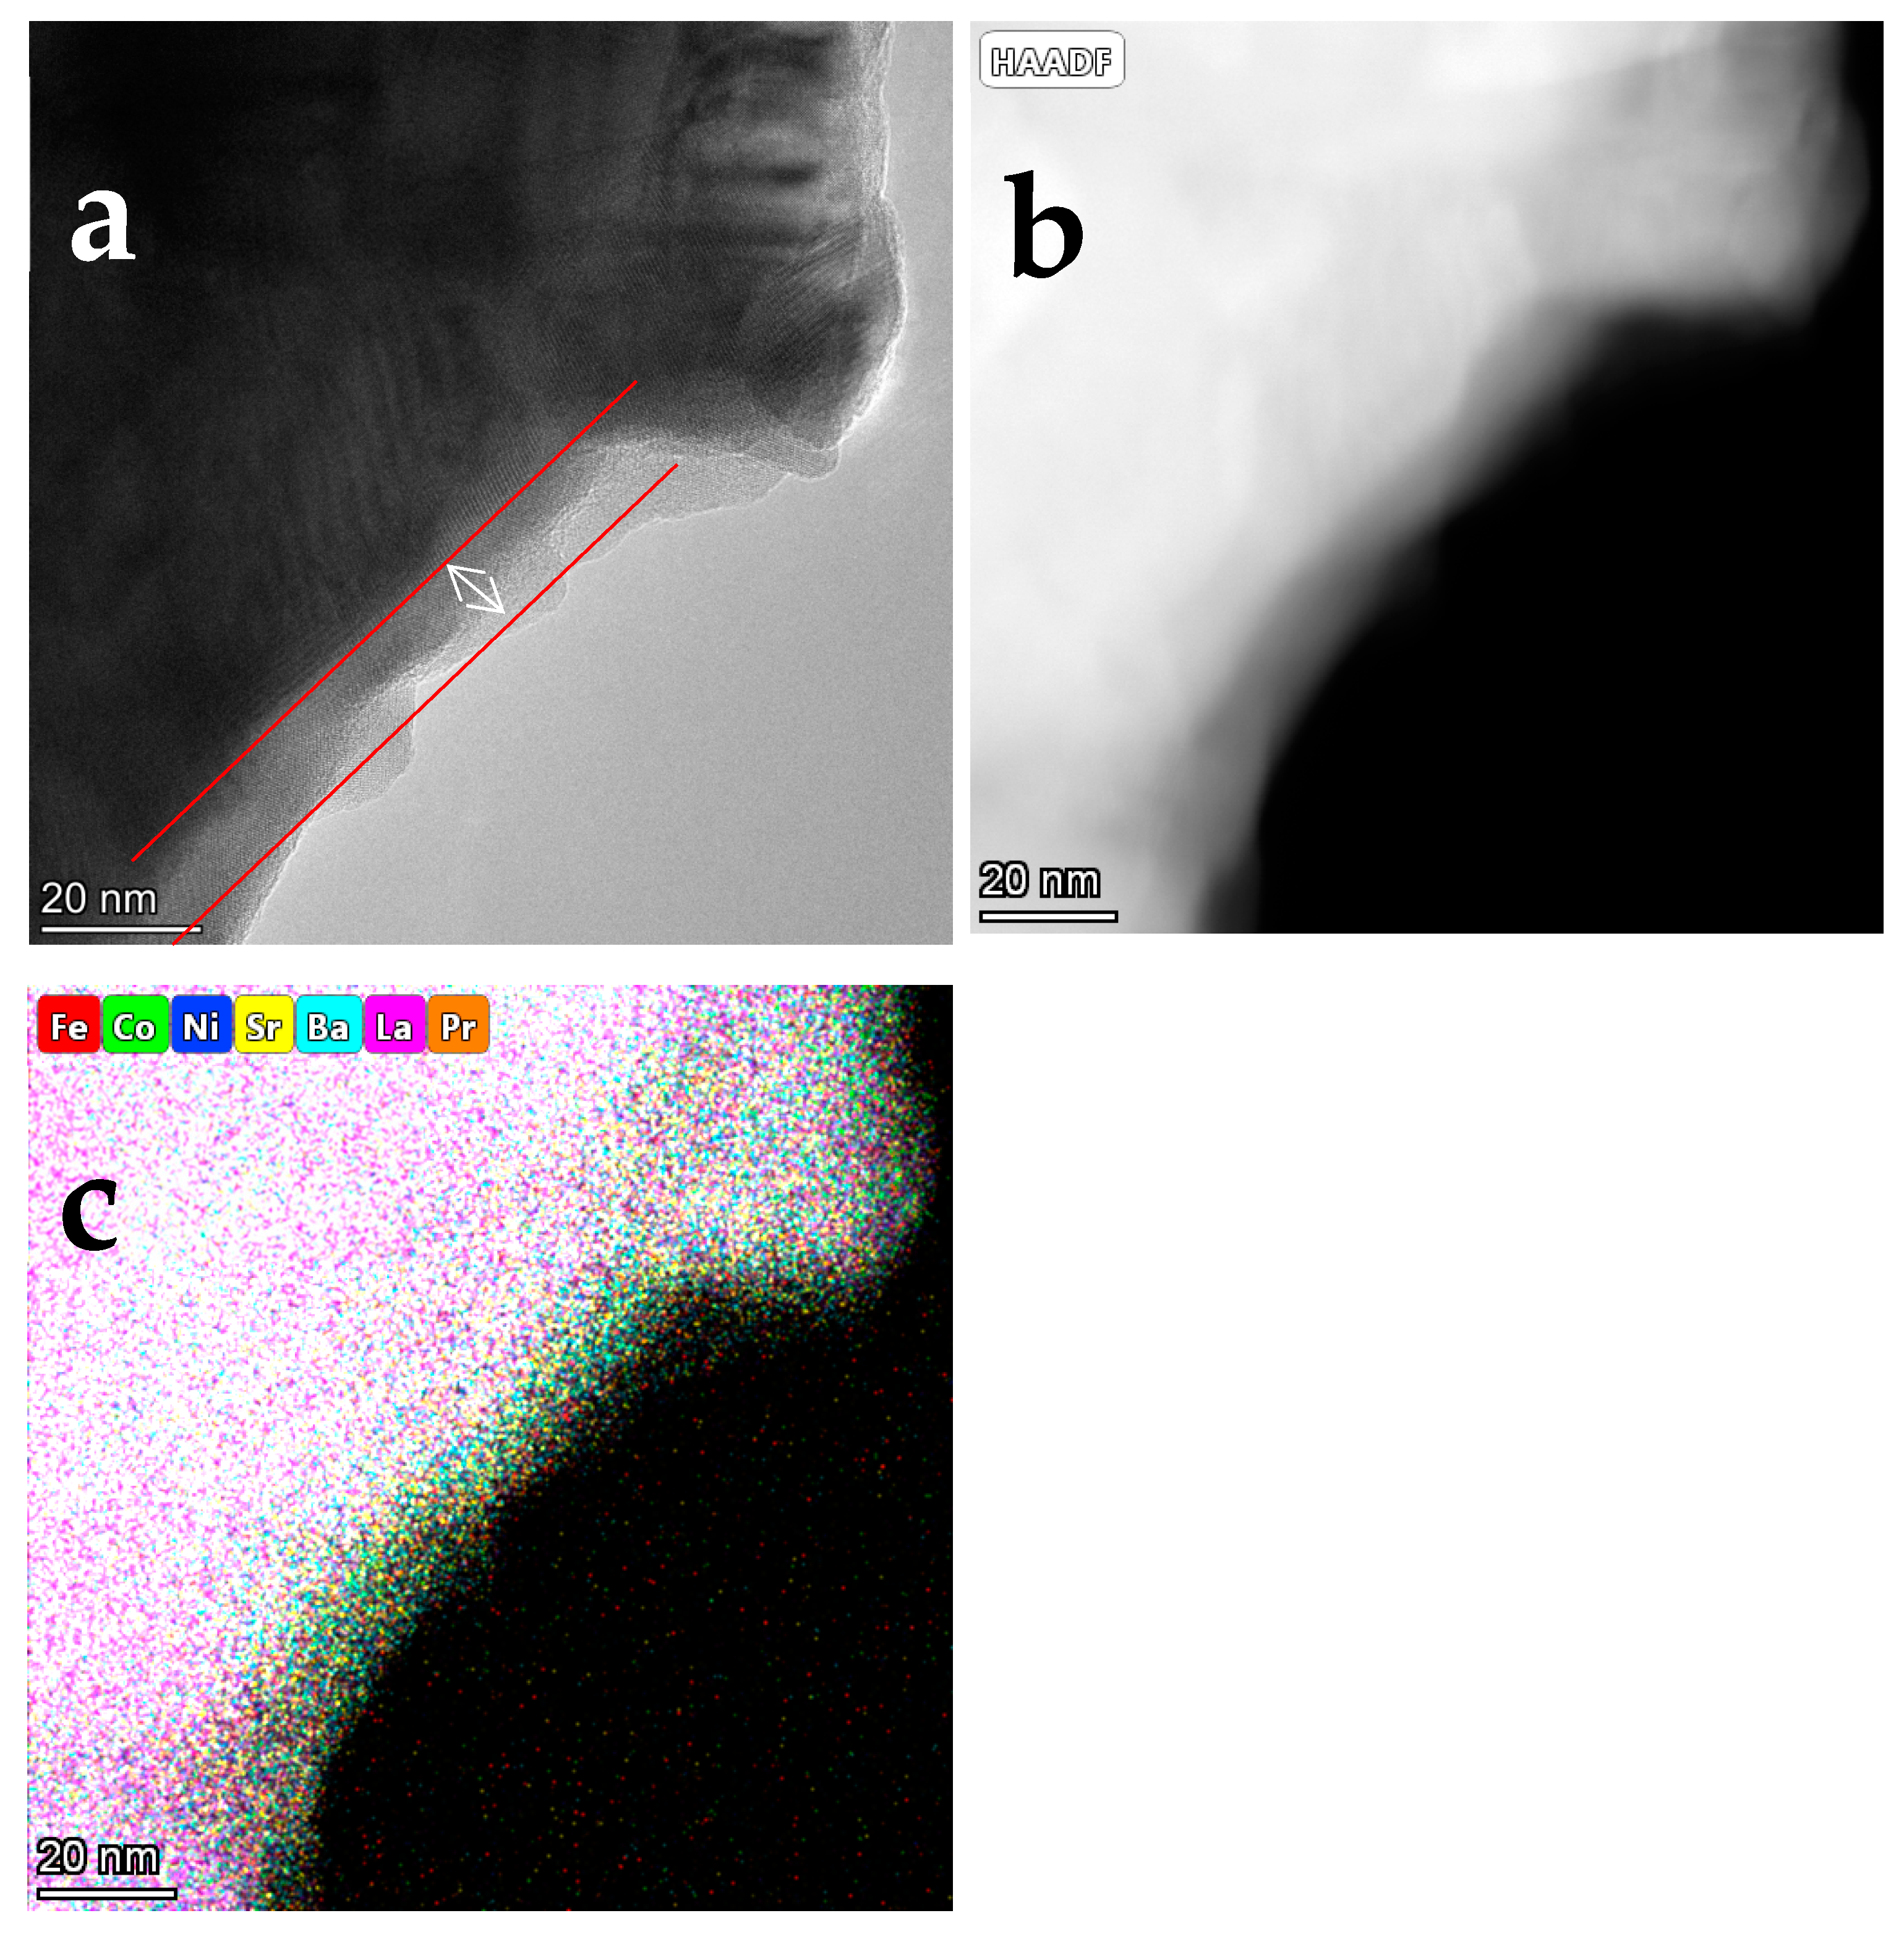
To identify the needle-like particles, the LPBSCF3-LN-0.04M cathodes were peeled directly from the symmetrical cell.
Figure 7 shows the TEM and EDS elemental maps of the LPBSCF3-LN-0.04M cathodes. Notably, a very thin layer covered the top of the LPBSCF3 particles, with an average thickness of approximately 6 nm. However, according to the EDS mapping results, it cannot be concluded that the composition of the thin layer is LN, which differs from what has been previously reported regarding the formation of the core-shell structure of LN-PBSCF cathodes From our perspective, this could be owing to the different preparation procedures using different solvents and surfactants.
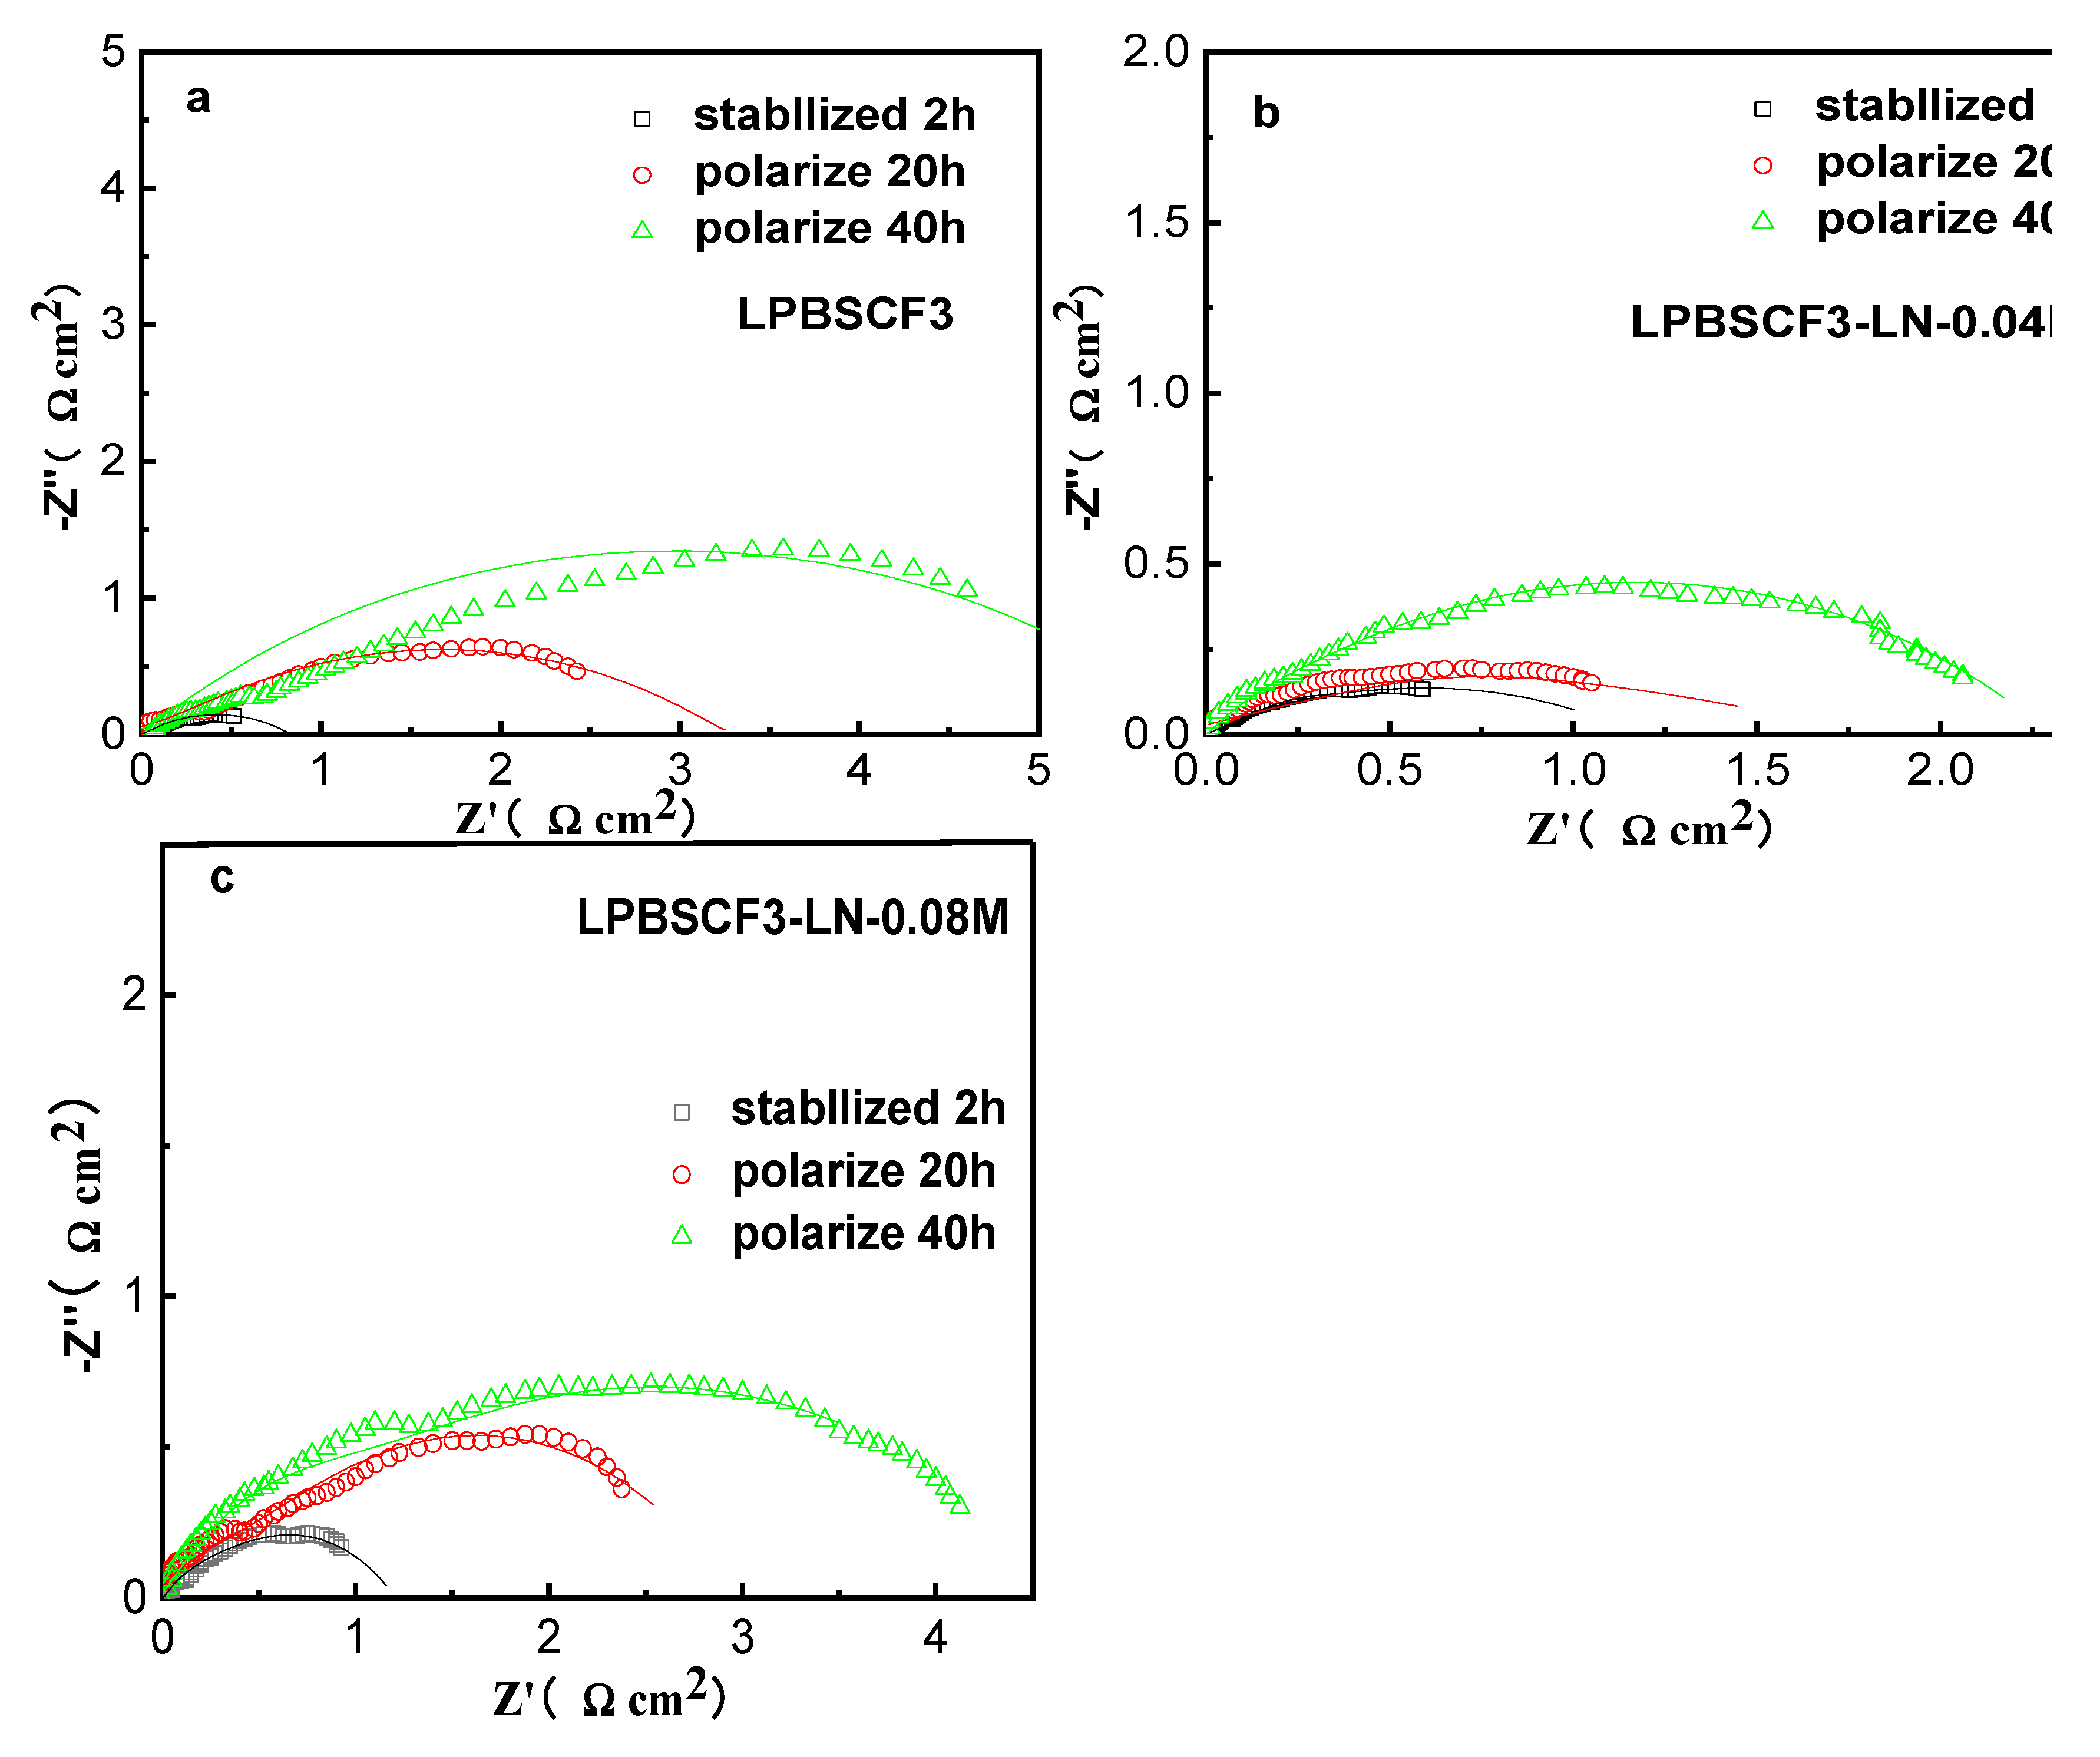
The stability of the electrochemical performances of the cathodes was assessed through EIS under cathodic current polarization at 200 mA/cm
2 at 700 °C for 40 h, as shown in
Figure 8. The obtained R
PH and R
PL values are listed in
Table 2. Notably, R
P for LPBSCF3 was 0.6 Ωcm
2, which was the lowest among those for LPBSCF3-LN-0.04M(0.7 Ωcm
2) and LPBSCF3-LN-0.08M (1.2 Ωcm
2). The R
P of low LN impregnation loading-LPBSCF3 was similar to that of LPBSCF3; however, a higher impregnation of LN in LPBSCF3-LN-0.08M compromised its benefit. Impregnation LPBSCF with the appropriate amount of LN (high k*∼10
-6 cm s
-1 at 590 °C) [
31] could promote oxygen adsorption-dissociation processes and create more O
2- on the cathode surface. However, this study showed that a higher impregnation LN (0.08M) prevented surface O
2- from being transported quickly into the cathode bulk due to low D* for LN (10
-8 cm
2 s
-1 for LN) [
32], therefore, LPBSCF3-LN-0.04M demonstrated a relatively lower value of R
PL and R
P. Moreover, they all then increased to some values after approximately 40 h. By calculating the increase ratio of Rp from t=2 h to t=40 h, LPBSCF3-LN-0.04M exhibited a relatively lower increase of Rp over time due to the increase in polarization time. These results indicate that by optimizing the impregnation loading amount of LN and utilizing the synergistic effect of LN and LPBSCF, LPBSCF3-LN-0.04M cathodes could demonstrate a relatively stable performance against current polarization compared to the LPBSCF3 and LPBSCF3-LN-0.08M cathodes.
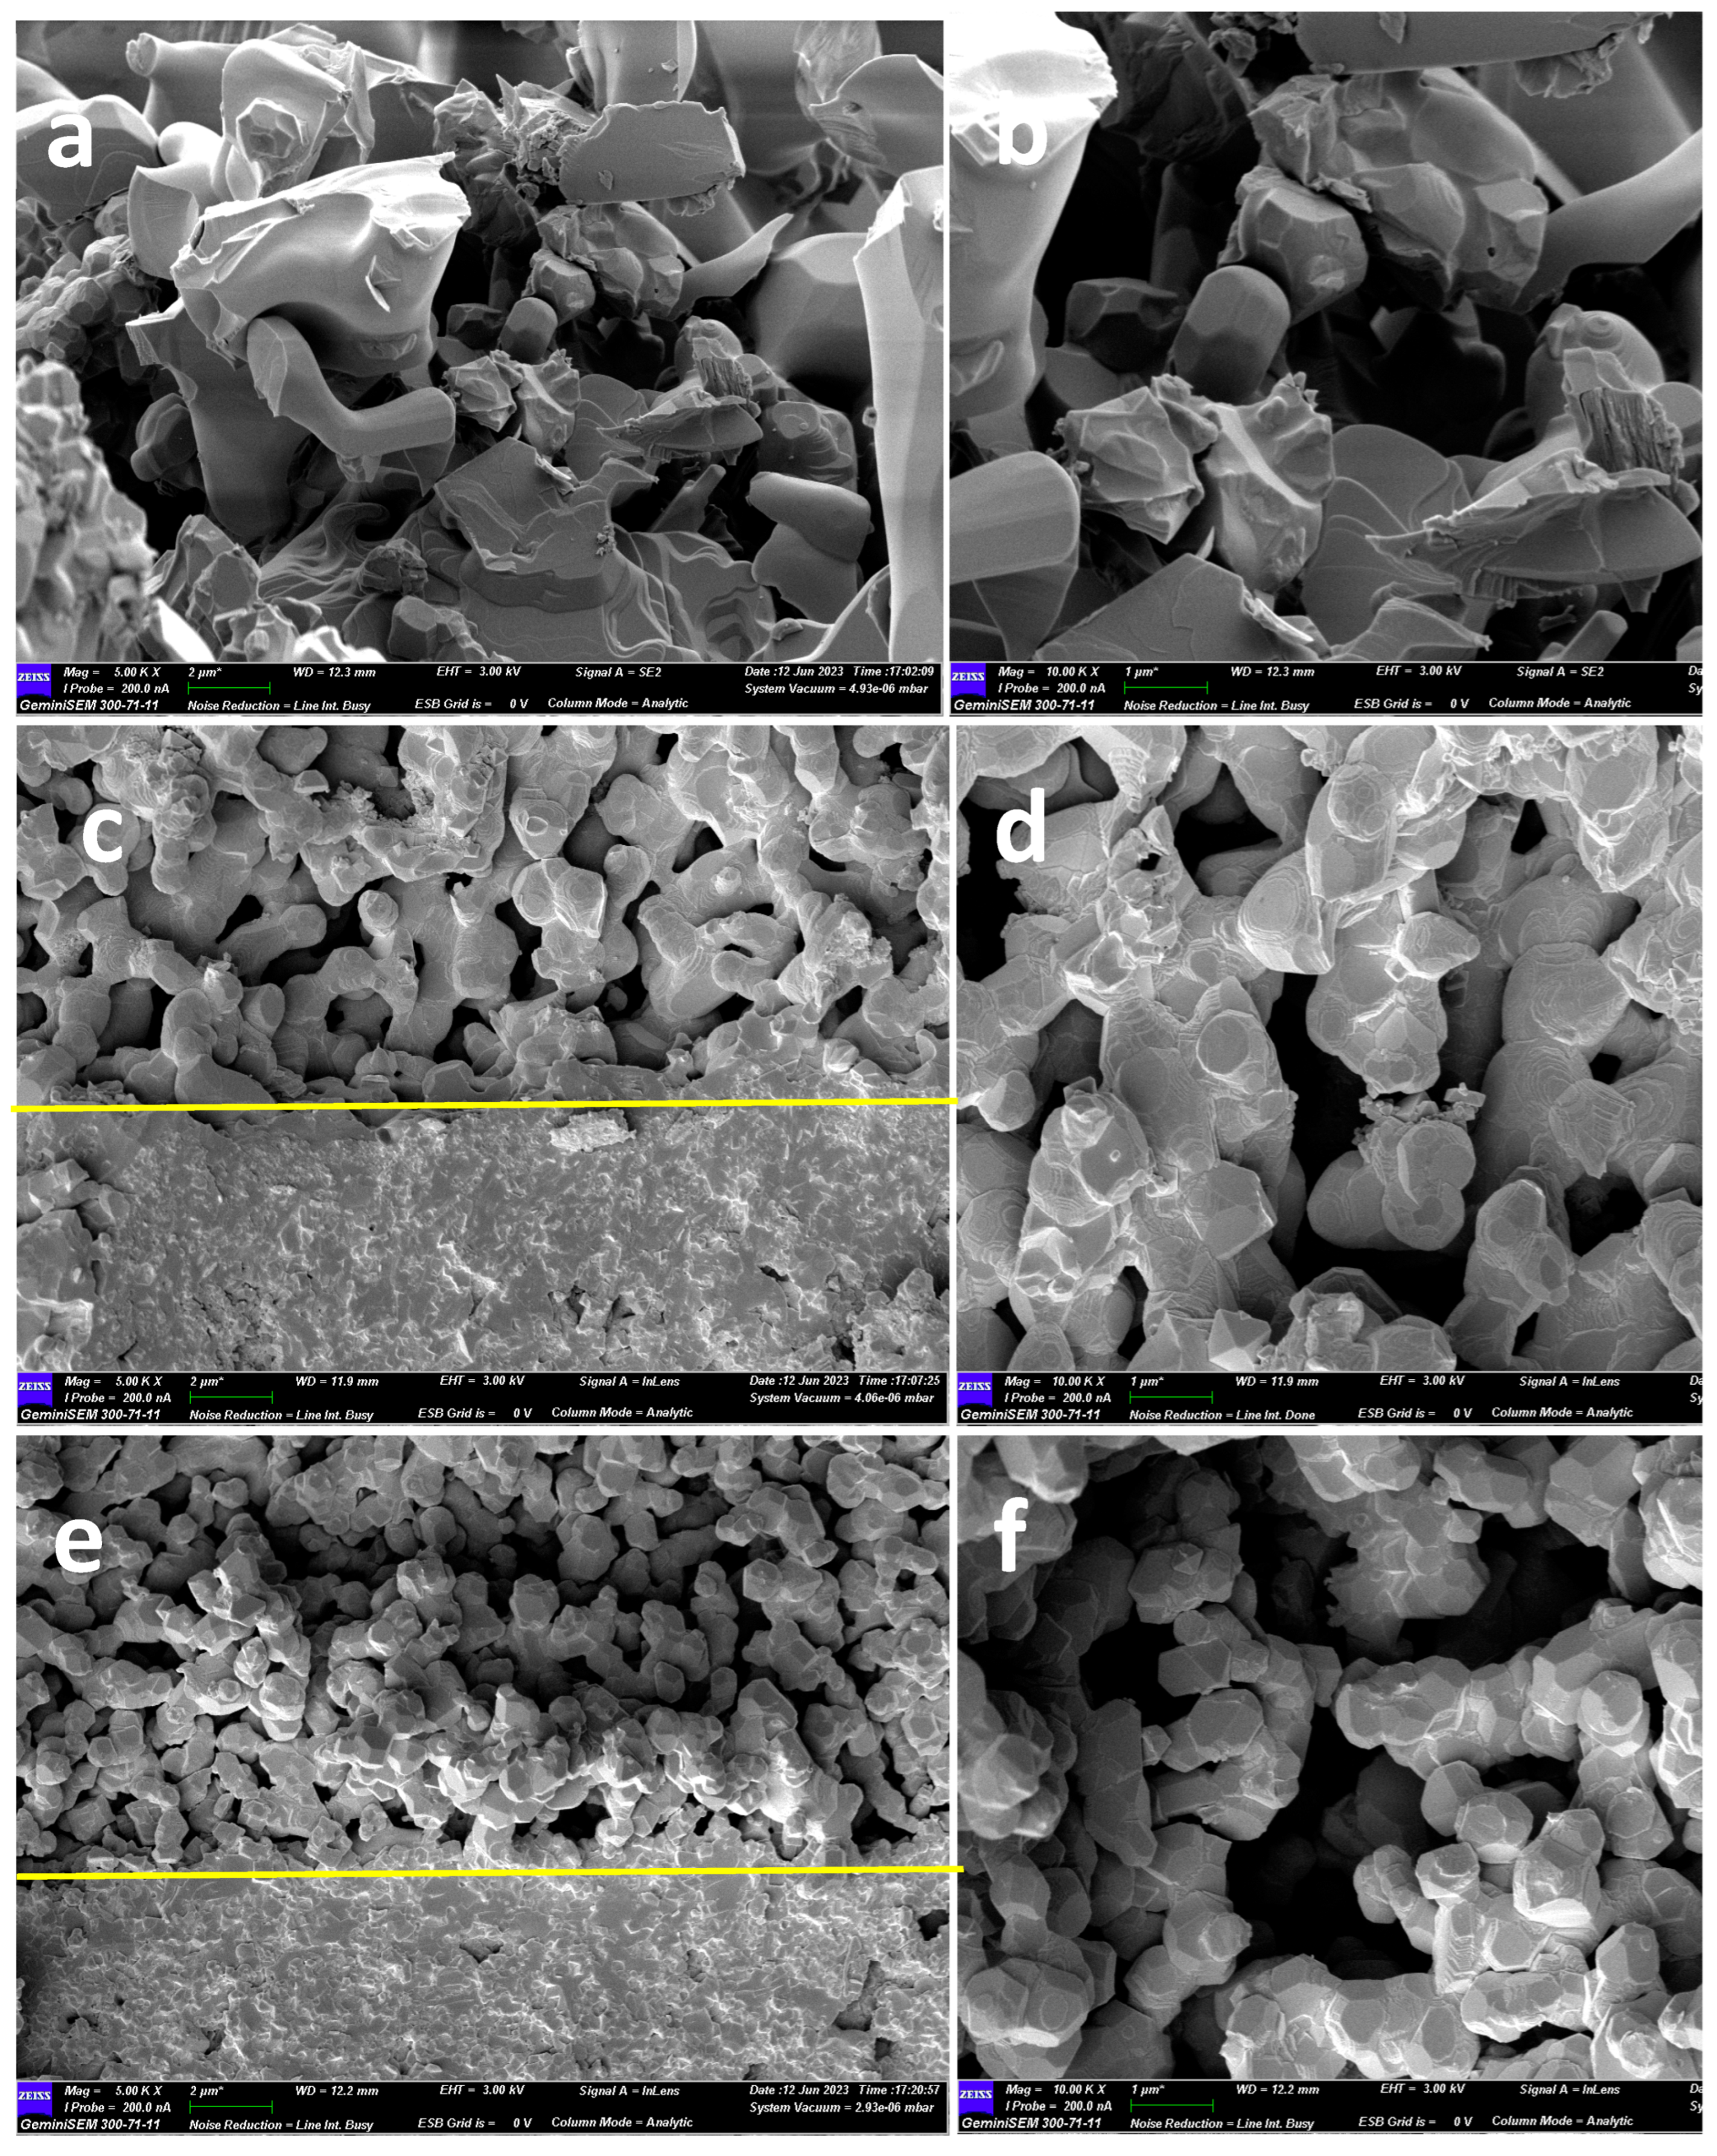
Figure 9 shows the cross-sectional SEM images of the LPBSCF3, LPBSCF3-LN-0.04M, and LPBSCF3-LN-0.08M electrodes after electrochemical tests. As shown in
Figure 9c, there was a good connection between LPBSCF3-LN-0.04M and GDC. Compared with
Figure 5, there were significant microstructural changes after the tests. No needle-like particles were observed in Figs. 9d and 9f. Moreover, the cathode surfaces became much rougher.
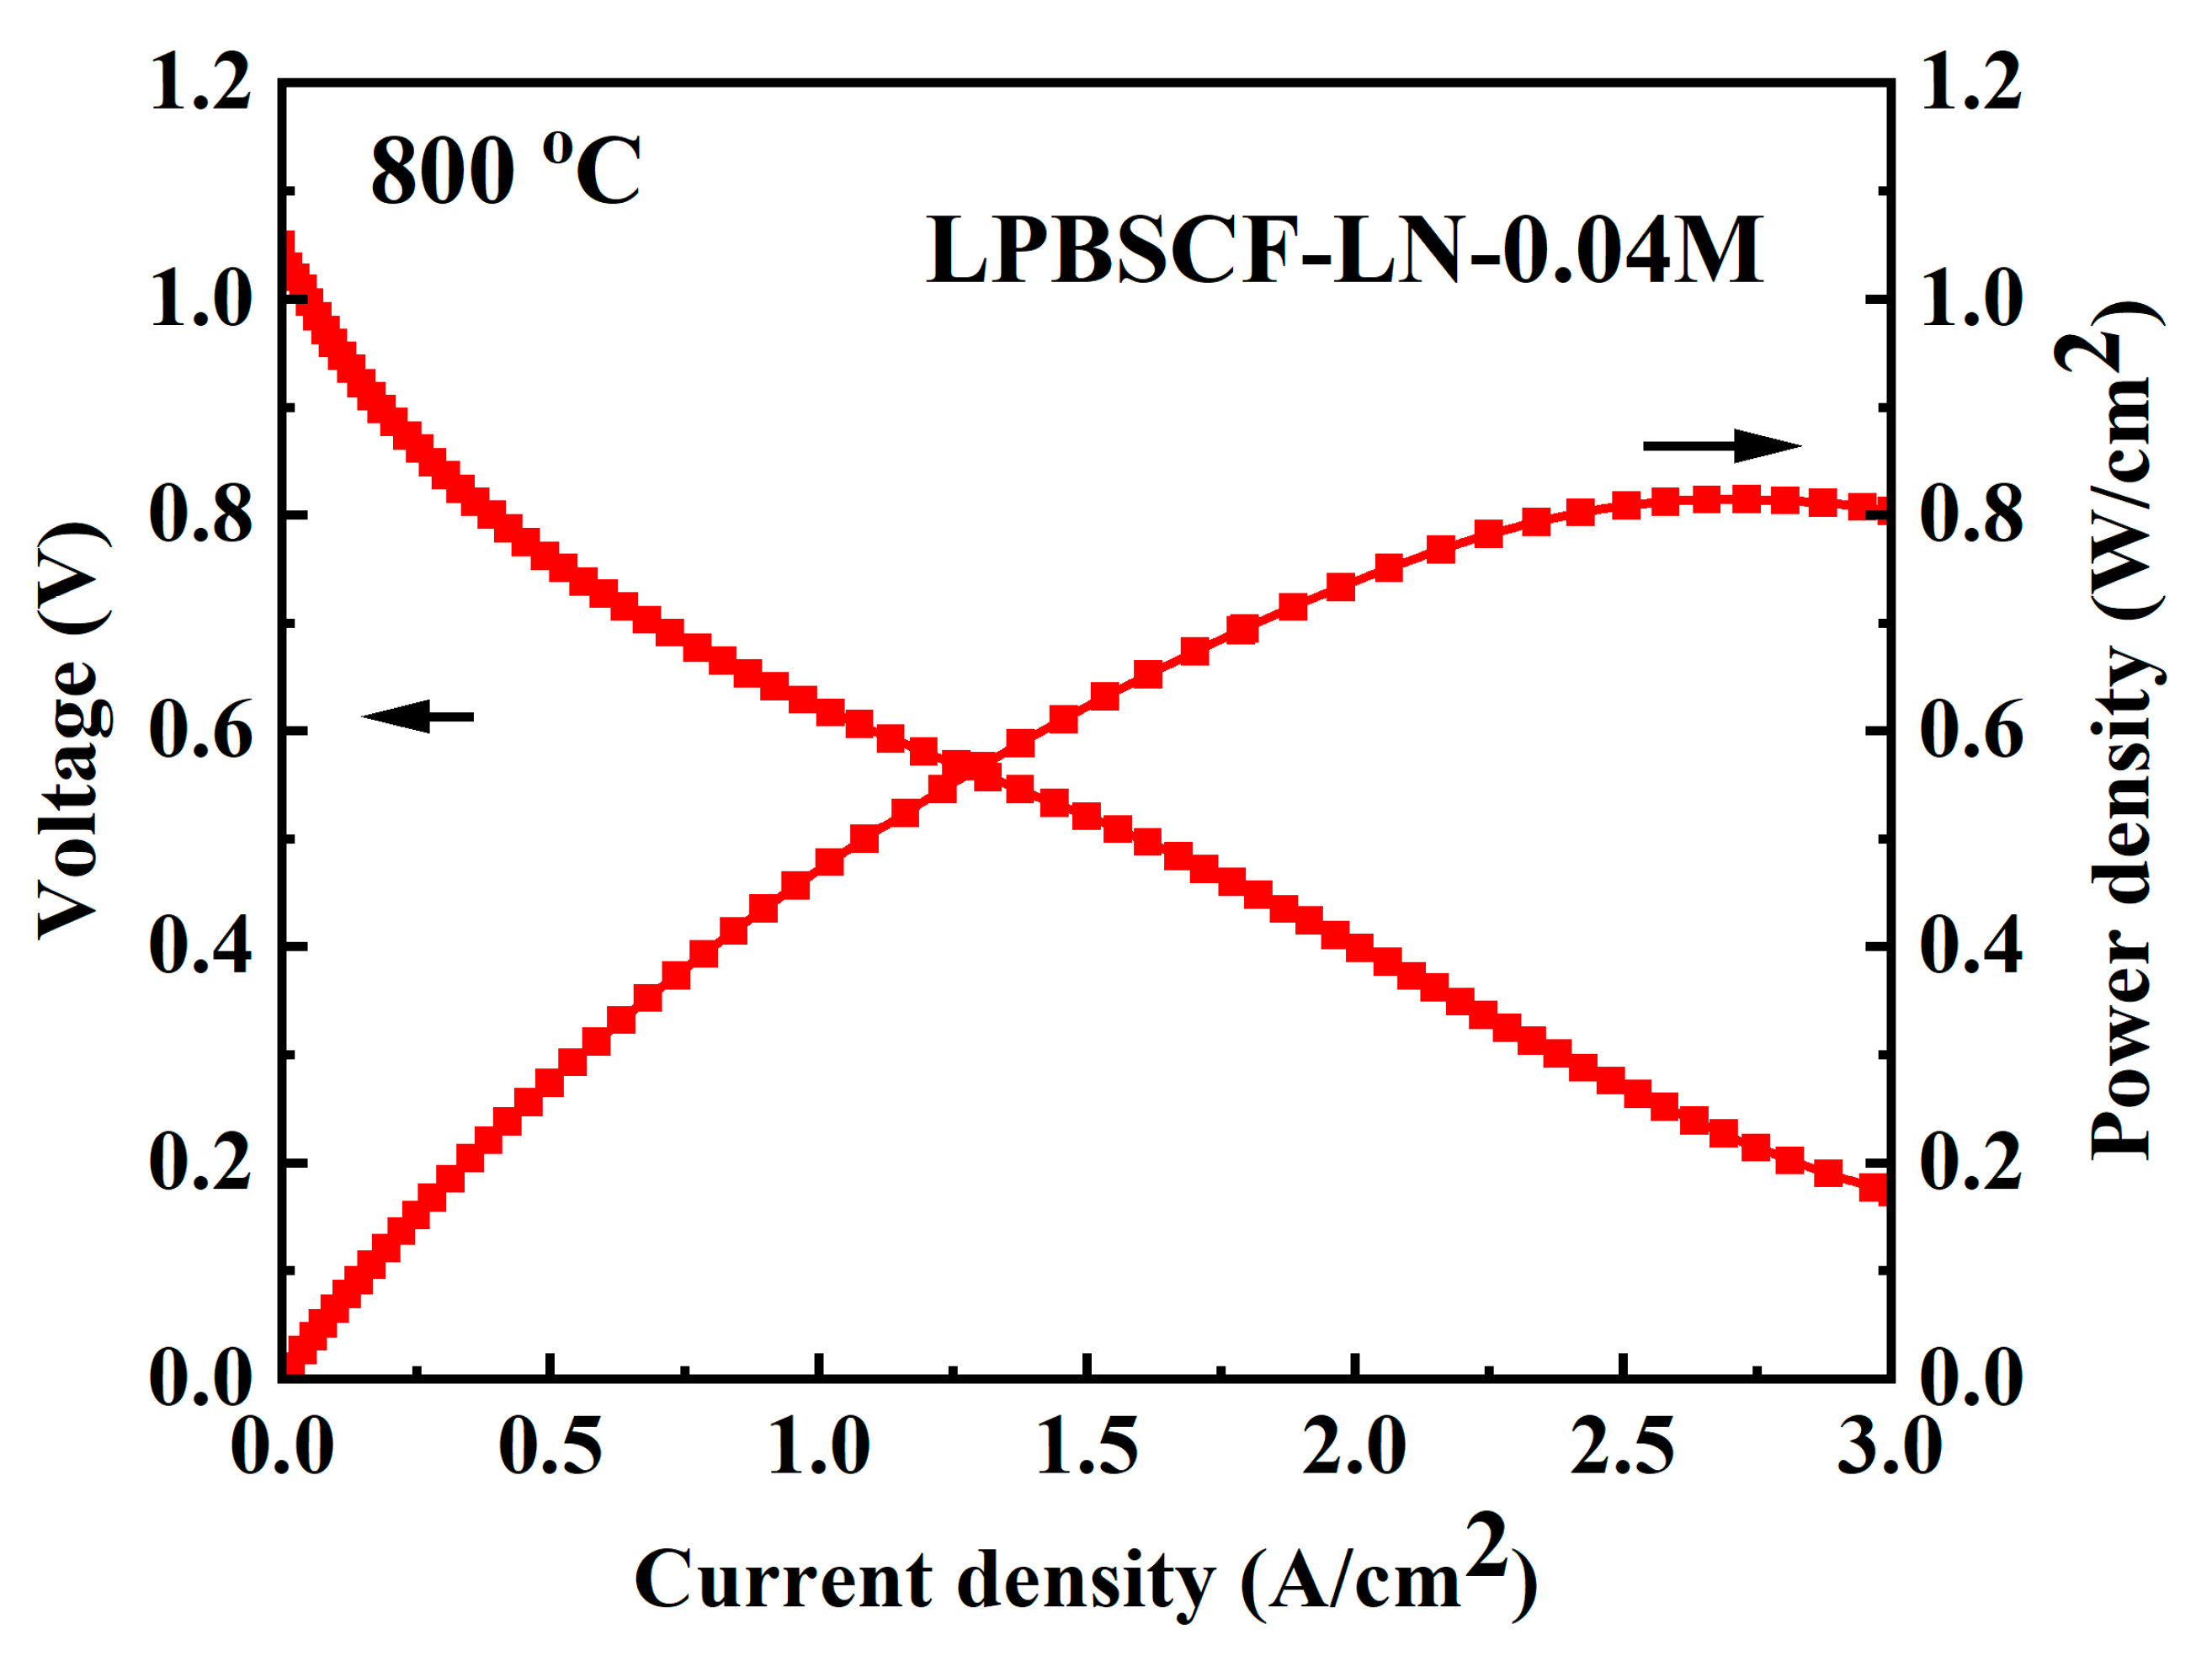
Figure 10 shows the electrochemical performances of the LPBSCF3-LN-0.04M single button cell (NiO-YSZ|YSZ|GDC|LPBSCF3-LN-0.04M) at 800 °C. The OCV of the single cell closely matched theoretical values of 1.1 V, indicating the absence of cracks in the button cell, whereas the single cell with the LPBSCF3-LN-0.04M cathode demonstrated an MPD of 800 mW/cm
2. Moreover, Figure S1 shows the single-cell performance of LPBSCF3, indicating that the MPD was 743 mW/cm
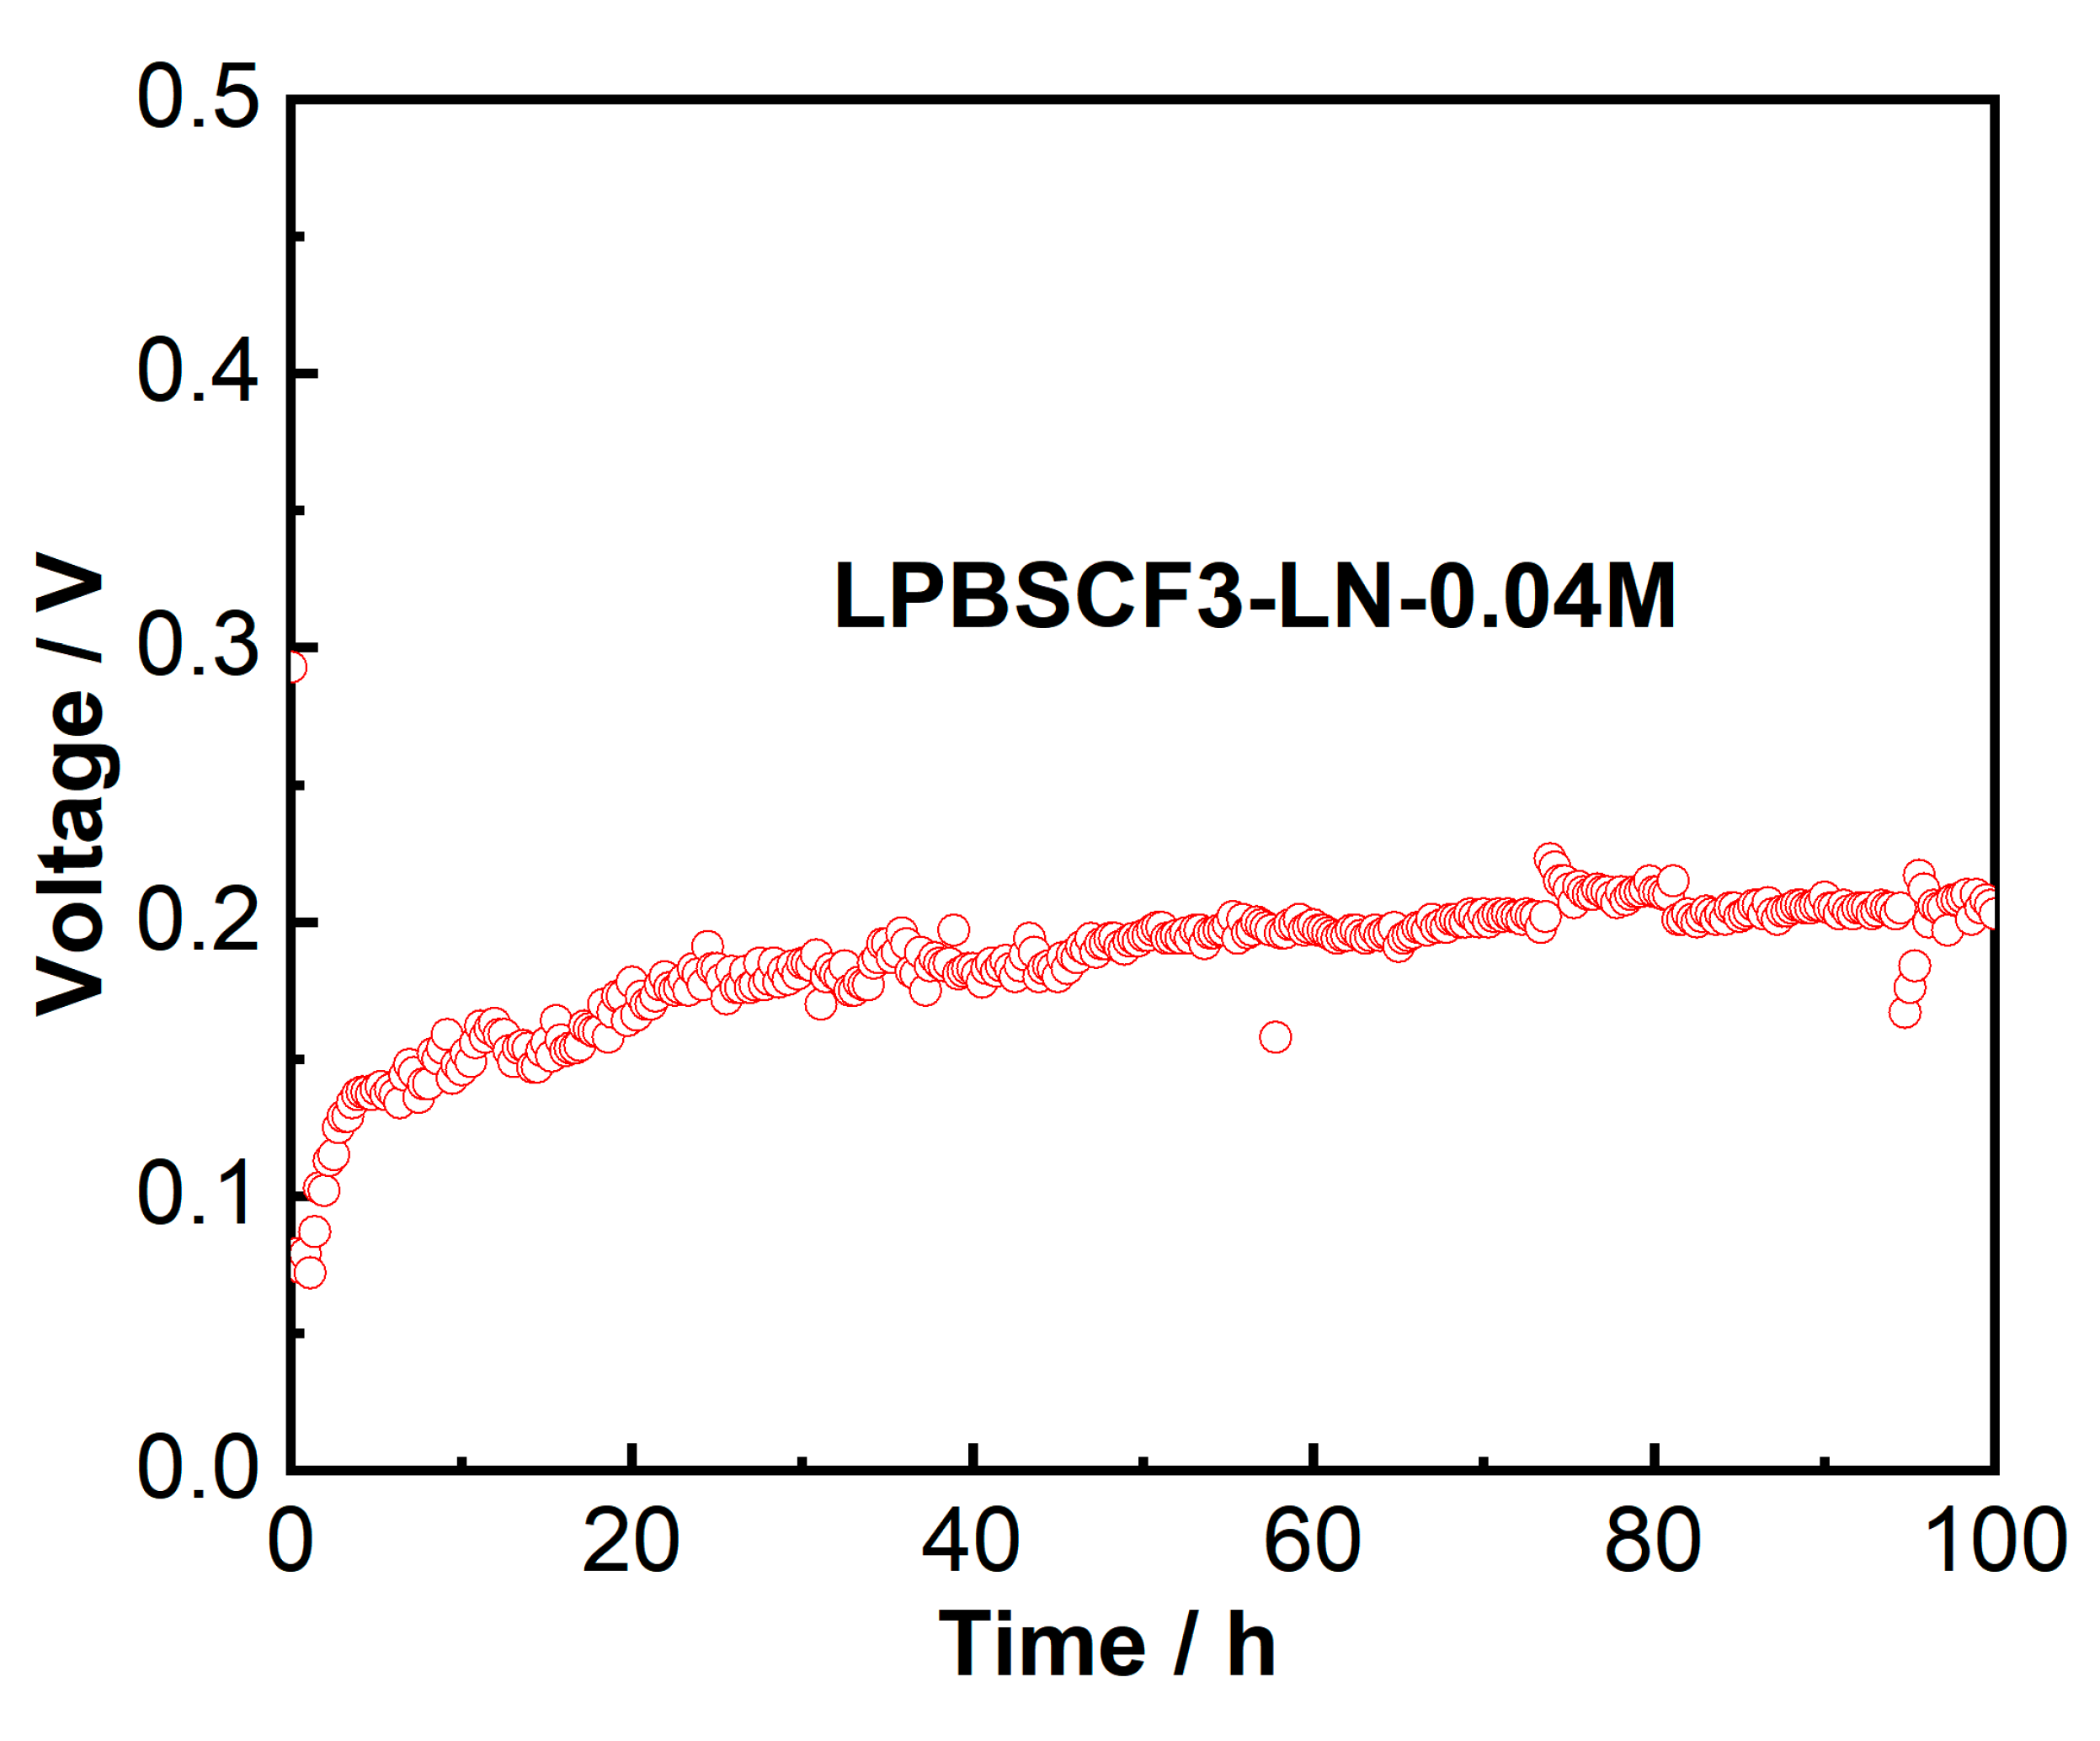
2 at 800 °C, which was lower than that of the LPBSCF3-LN-0.04M single cell. The curving point of the I–V curve was presumably due to the button cell being in an activated state in the early stage when switching from low to high temperatures; however, after stable testing, a sudden change occurred. The tests were optimized in the next step. More importantly, the (NiO-YSZ|YSZ|GDC|LPBSCF3-LN-0.04M) cell showed excellent operating stability during the galvanostatic test at 800 °C for 100 h, as shown in
Figure 11.
Figure 1.
XRD of La1-xPrxBa0.5Sr0.5Co1.5Fe0.5O5+δ (x=1, 0.3 and 0) powders calcined at 900, 950 and 1000 °C for 3 h in air. a:x=1,b:x=0.3,c:x=0.
Figure 1.
XRD of La1-xPrxBa0.5Sr0.5Co1.5Fe0.5O5+δ (x=1, 0.3 and 0) powders calcined at 900, 950 and 1000 °C for 3 h in air. a:x=1,b:x=0.3,c:x=0.
Figure 2.
SEM images for La1-xPrxBa0.5Sr0.5Co1.5Fe0.5O5+δ(LPBSCF) (x=1, 0.3 and 0) powders fired at 1000 °C for 3 h in air and EDS spectra of powders.
Figure 2.
SEM images for La1-xPrxBa0.5Sr0.5Co1.5Fe0.5O5+δ(LPBSCF) (x=1, 0.3 and 0) powders fired at 1000 °C for 3 h in air and EDS spectra of powders.
Figure 3.
Electrochemical impedance spectra acquired with La1-xPrxBa0.5Sr0.5Co1.5Fe0.5O5+δ (x=1, 0.3 and 0) cathodes measured at 700 oC in air. The insert is the equivalent circuit for data fitting.
Figure 3.
Electrochemical impedance spectra acquired with La1-xPrxBa0.5Sr0.5Co1.5Fe0.5O5+δ (x=1, 0.3 and 0) cathodes measured at 700 oC in air. The insert is the equivalent circuit for data fitting.
Figure 4.
XRD of La2NiO4 (LN) powders fired from its nitrates solution calcined at 1000 °C for 3 h (a), and XRD pattern of La1-xPrxBa0.5Sr0.5Co1.5Fe0.5O5+δ (x=0.3, LPBSCF3) and LN powders’ compatibility test (b).
Figure 4.
XRD of La2NiO4 (LN) powders fired from its nitrates solution calcined at 1000 °C for 3 h (a), and XRD pattern of La1-xPrxBa0.5Sr0.5Co1.5Fe0.5O5+δ (x=0.3, LPBSCF3) and LN powders’ compatibility test (b).
Figure 7.
TEM of impregnated LPBSCF3-LN-0.04M cathode under high magnifications.
Figure 7.
TEM of impregnated LPBSCF3-LN-0.04M cathode under high magnifications.
Figure 8.
Electrochemical impedance spectra of LPBSCF3 (a) and impregnated LPBSCF3-LN-0.04M (b), impregnated LPBSCF3-LN-0.08 M (c) cathodes using Ag as collectors, and polarization resistances of these three cathodes as a function of temperature (d) at a constant current density of 200 mA/cm2 at 700 oC for 40 h in symmetrical cells.
Figure 9.
Cross-sectional micro structure of (a,b) LPBSCF3 cathode; (c,d) impregnated LPBSCF3-LN-0.04M cathode; (e,f) impregnated LPBSCF3-LN-0.08M cathode at a constant current density of 200 mA/cm2 at 700 oC for 40 h in symmetrical cells.
Figure 9.
Cross-sectional micro structure of (a,b) LPBSCF3 cathode; (c,d) impregnated LPBSCF3-LN-0.04M cathode; (e,f) impregnated LPBSCF3-LN-0.08M cathode at a constant current density of 200 mA/cm2 at 700 oC for 40 h in symmetrical cells.
Figure 10.
I-V-P curves of Ni-YSZ anode-supported single cells using impregnated LPBSCF3-LN-0.04M as the cathode at 800 oC.
Figure 10.
I-V-P curves of Ni-YSZ anode-supported single cells using impregnated LPBSCF3-LN-0.04M as the cathode at 800 oC.
Figure 11.
Stability test of impregnated LPBSCF3-LN-0.04M anode-supported single cells tested at a constant current density of 100 mA/cm2 at 800 oC for 100 h.
Figure 11.
Stability test of impregnated LPBSCF3-LN-0.04M anode-supported single cells tested at a constant current density of 100 mA/cm2 at 800 oC for 100 h.
Table 1.
Polarization resistances of prepared La1-xPrxBa0.5Sr0.5Co1.5Fe0.5O5+δ (x=1, 0.3 and 0) cathodes under open circuit condition at 700 oC.
Table 1.
Polarization resistances of prepared La1-xPrxBa0.5Sr0.5Co1.5Fe0.5O5+δ (x=1, 0.3 and 0) cathodes under open circuit condition at 700 oC.
| 700 oC Stable 2h |
LPBSCF(x=1) |
LPBSCF(x=0.3) |
LPBSCF(x=0) |
RP/Ω·cm2
|
1.2 |
0.5 |
0.6 |
RPH/Ω·cm2
|
0.1 |
0.1 |
0.1 |
RPL/Ω·cm2
|
1.1 |
0.4 |
0.5 |
Table 2.
Summarized polarization resistances of prepared LPBSCF (x= 0.3),LPBSCF(x=0.3)-LN-0.04 M and LPBSCF(x=0.3)-LN-0.08 M cathodes before and after cathodic current of 200 mA/cm2 at 700 oC for 40 h.
Table 2.
Summarized polarization resistances of prepared LPBSCF (x= 0.3),LPBSCF(x=0.3)-LN-0.04 M and LPBSCF(x=0.3)-LN-0.08 M cathodes before and after cathodic current of 200 mA/cm2 at 700 oC for 40 h.
| 0mA/cm2
|
LPBSCF3
Stable 2h |
LPBSCF3-LN-0.04M
Stable 2h |
LPBSCF3-LN-0.08 M
Stable 2h |
| RP
|
0.6 |
0.7 |
1.2 |
| RPH
|
0.1 |
0.1 |
0.1 |
| RPL
|
0.5 |
0.6 |
1.1 |
| 200mA/cm2
|
20h |
40h |
20h |
40h |
20h |
40h |
| RP
|
2.7 |
5 |
1.2 |
2.2 |
2.5 |
4.3 |
| RPH
|
0.2 |
0.3 |
0.2 |
0.1 |
0.2 |
0.2 |
| RPL
|
2.5 |
4.8 |
1.0 |
2.1 |
2.3 |
4.1 |
