1. Introduction
Non-communicable diseases (NCDs), also known as lifestyle-related diseases, are a group of diseases that are not contagious and result from a combination of genetic, behavioral, physiological and environmental factors. The predominant NCDs are cardiovascular diseases (CVD), neoplasms, diabetes mellitus and chronic respiratory diseases [
1]. NCSs have emerged as serious threats to health systems globally, as they are held responsible for higher rates of morbidity and mortality than all other causes combined [
2], in both the developed and the underdeveloped world [
3]. The early detection of NCDs is of paramount importance, since it allows the timely treatment which, consequently, secures higher probability of successful outcome [
4].
Metabolic syndrome (MetS) represents a significant health challenge, characterized by a cluster of metabolic dysregulations including insulin resistance, central obesity, dyslipidemia, and hypertension. Multiple acquired and genetic entities are involved in the pathogenesis of MetS most of which contribute to insulin resistance and chronic micro-inflammation [
5]. Most notably, accelerating economic development, an aging population, changes in lifestyle, and obesity are all contributing to the rising prevalence of MetS. The global prevalence of MetS is estimated to be between 20 and 25%. If not treated, MetS leads to an increased risk of developing diabetes mellitus, cardiovascular diseases (CVDs), cancer [
6] and chronic kidney disease [
7]. Moreover, MetS has been associated with Alzheimer’s disease [
8,
9], neuroinflammation and neurodegeneration [
10] female and male infertility [
11,
12], chronic obstructive pulmonary disease (COPD) [
13,
14], autoimmune disorders [
15,
16,
17] and even ocular [
18,
19] and dental diseases [
20,
21,
22].
This predisposition to cardiovascular diseases and type 2 diabetes has further broadened to include complications such as non-alcoholic fatty liver disease, chronic prothrombotic and proinflammatory states, and sleep apnoea. Despite efforts by various global health organizations, achieving a universal consensus on the precise definition of MetS remains a significant challenge for healthcare practitioners and researchers [
5,
23,
24]. The widespread prevalence of MetS leads to substantial socio-economic costs due to its associated significant morbidity and mortality. Recognized as a global pandemic, MetS places immense pressure on healthcare systems worldwide. Thus, accurately predicting populations at high risk for MetS and proactively implementing prevention measures have become essential in contemporary healthcare management [
25,
26].
In response to these challenges, recent years have witnessed a paradigm shift towards leveraging advanced technological methods like machine learning (ML) for understanding and predicting MetS. While traditional analytical methods like linear and logistic regression have their merits, they often come with limitations, including stringent assumptions and challenges in managing multicollinearity. In contrast, ML offers a more nuanced and adaptable approach, potentially overcoming these limitations and providing deeper insights into MetS. This shift towards innovative computational techniques marks a significant advancement in metabolic health research [
27].
Delving into the specifics of ML, various models such as decision trees, random forests, support vector machines, and k-NN classifiers have demonstrated notable success in diagnosing MetS. Their ability to employ non-invasive features for prediction sets these models apart, eliminating the need for invasive testing procedures. Furthermore, the capability of ML to intricately analyze metabolic patterns significantly enhances the specificity and sensitivity of MetS diagnosis [
28,
29,
30].
Acknowledging the critical role of early and accurate diagnosis in managing MetS, our research is geared towards a comprehensive comparative analysis of 16 machine learning methods. This study aims to not only highlight the unique capabilities of each method in predicting MetS but also to showcase the diverse applications of ML in this vital health field. By implementing a Borda count method, we plan to refine our data according to the relevance of variables identified by the top-performing models. This methodological approach is anticipated to significantly improve the accuracy of our analysis and contribute to the development of more effective management and prevention strategies for MetS, thus addressing a major public health concern.
Recent progress in predicting metabolic syndrome (MetS) has notably utilized machine learning techniques. A pivotal study”Metabolic Syndrome Prediction Models Using Machine Learning” [
27] was a crucial work that investigated the efficacy of these methods in MetS prediction, with a novel focus on incorporating Sasang constitution types from traditional Korean medicine into the models. This integration significantly increased the sensitivity of multiple machine learning methodologies, highlighting a unique synergy between traditional medical insights and modern predictive algorithms.
Further, “Metabolic Syndrome Prediction Models” [
26] presented a breakthrough in predicting MetS for nonobese Koreans, incorporating both clinical and genetic polymorphism data. This study highlighted the importance of genetic factors in MetS models, particularly for nonobese persons who are often underrepresented in such studies. Notably, models using Naïve Bayes classification performed better, especially when genetic information was included.
2. Materials and Methods
2.1. Data
In this study, were analyzed data from the Laboratory Information System (LIS) database of the Medical Laboratory Department at the General Hospital of Amfissa, Greece, covering the period from 2017 to 2022. The focus of our study was a group of 77 individuals, comprising 38 men and 39 women, who met the three laboratory criteria for the diagnosis of Metabolic Syndrome (MetS) as defined by the revised US National Cholesterol Education Program’s Adult Treatment Panel III (NCEP ATP III). These criteria include fasting glucose levels exceeding 100 mg/dL, triglycerides over 150 mg/dL, and HDL cholesterol levels below 40 mg/dL for men and below 50 mg/dL for women. We compared the MetS group with a control group of 63 individuals (31 men and 32 women) who did not meet any of the diagnostic criteria for MetS. The study evaluated a range of variables, including Gender, Age, Glucose, Triglycerides, HDL (High-Density Lipoprotein), SGOT (Serum Glutamic-Oxaloacetic Transaminase), SGPT (Serum Glutamic-Pyruvic Transaminase), GGT (Gamma-Glutamyl Transferase), ALP (Alkaline Phosphatase), HBA1c (Hemoglobin A1c), Urea, Uric Acid, WBC (White Blood Cells), ANC (Absolute Neutrophil Count), ANL (Absolute Neutrophil to Lymphocyte ratio), PLT (Platelet Count), MPV (Mean Platelet Volume), HT (Hematocrit), and Hg (Hemoglobin). The analysis of these variables aimed to enhance the understanding and prediction of MetS, thus contributing to the improvement of diagnosis and treatment strategies.
2.2. Data Preprocessing
In our study, data preprocessing was a critical step, essential for the effective application of sophisticated analytical techniques in machine learning. Understanding the importance of this phase, certain pivotal variables associated with Metabolic Syndrome (MetS), specifically glucose (GLU), triglycerides (TRIG), and high-density lipoprotein cholesterol (HDL) (US National Cholesterol Education Program’s Adult Treatment Panel III (NCEP ATP III)), were removed to mitigate the risk of model overfitting.
By excluding these direct diagnostic markers, the models were enabled to explore and leverage other informative yet less direct indicators in the dataset. This approach was intended to unearth subtle patterns that might be eclipsed by the more direct MetS indicators, thus providing a broader perspective on the disease’s markers.
Following the exclusion of these variables, a comprehensive series of data adjustments was undertaken to optimize the dataset for machine learning analysis. Our adjustments included type inference for correct data categorization, imputation of missing values, and encoding of categorical variables. Additionally, we applied Z-score normalization to ensure uniformity in feature scale, which is crucial for comparative evaluation of machine learning models and enhancing algorithmic computations. Subsequently, the dataset was divided into training and testing subsets to establish a structured methodology for evaluation.
Finally, to underscore the consistency and reproducibility of our analysis, a session seed was meticulously established. This practice lays a solid foundation for future implementations of machine learning models, ensuring that results are reliable and can be replicated in further studies. Through these detailed preprocessing steps, our dataset was transformed into a robust foundation, setting the stage for an in-depth evaluation of the predictive capabilities of 16 machine learning models in diagnosing MetS.
2.3. Machine Learning Models and Evaluation
A thorough examination of machine learning techniques was carried out, including algorithms such as Quadratic Discriminant Analysis, Naive Bayes, Linear Discriminant Analysis, CatBoost Classifier, Extra Trees Classifier, Random Forest Classifier, Gradient Boosting Classifier, Light Gradient Boosting Machine, Ada Boost Classifier, Extreme Gradient Boosting, Logistic Regression, Ridge Classifier, Decision Tree Classifier, Dummy Classifier, and SVM. An ensemble methodology based on Borda Count was used to improve forecast precision even further.
To ensure robust model evaluation, the study is employing nested 10-fold cross-validation technique, which has been shown to outperform typical k-fold cross-validation in terms of predicted accuracy. An outer k-fold cross-validation loop is used in nested cross-validation to offer a comprehensive assessment of the best model’s performance. Each outer fold uses an inner cross-validation loop to fine-tune the model’s parameters at the same time [
23].
The performance of each method was painstakingly tested across a range of measures, including AUC, Recall, Precision, F1-score, Kappa, MCC, Time (in Sec), and total accuracy. The models’ comparative efficacy was principally assessed using their AUC values, with the detailed metrics summarized in
Table 1 [
24]. In the world of diagnostic instruments, the importance of sensitivity over specificity is heightened by the urgency of diagnosis and subsequent intervention, unless specificity is significantly degraded [
25].
Borda count approach was used for feature importance aggregation among several models. For each model, features were ranked in order of relevance, with the most important feature receiving the highest rating and the least important receiving the lowest. These ranks were then aggregated using the Borda count method. The Borda score was calculated by adding the ranks of each feature from best three models. Instead of relying on a single model’s feature importance, which could be skewed or overfit to a specific dataset, the aggregated Borda scores provided a more holistic and robust perspective of feature significance. This technique ensured that the most relevant traits were consistently recognized as such across various models, improving the dependability of the isolated features and setting the framework for creating more robust ensemble models in later rounds of the study.
3. Results
3.1. Cumulative Insights: Unveiling Model Outcomes
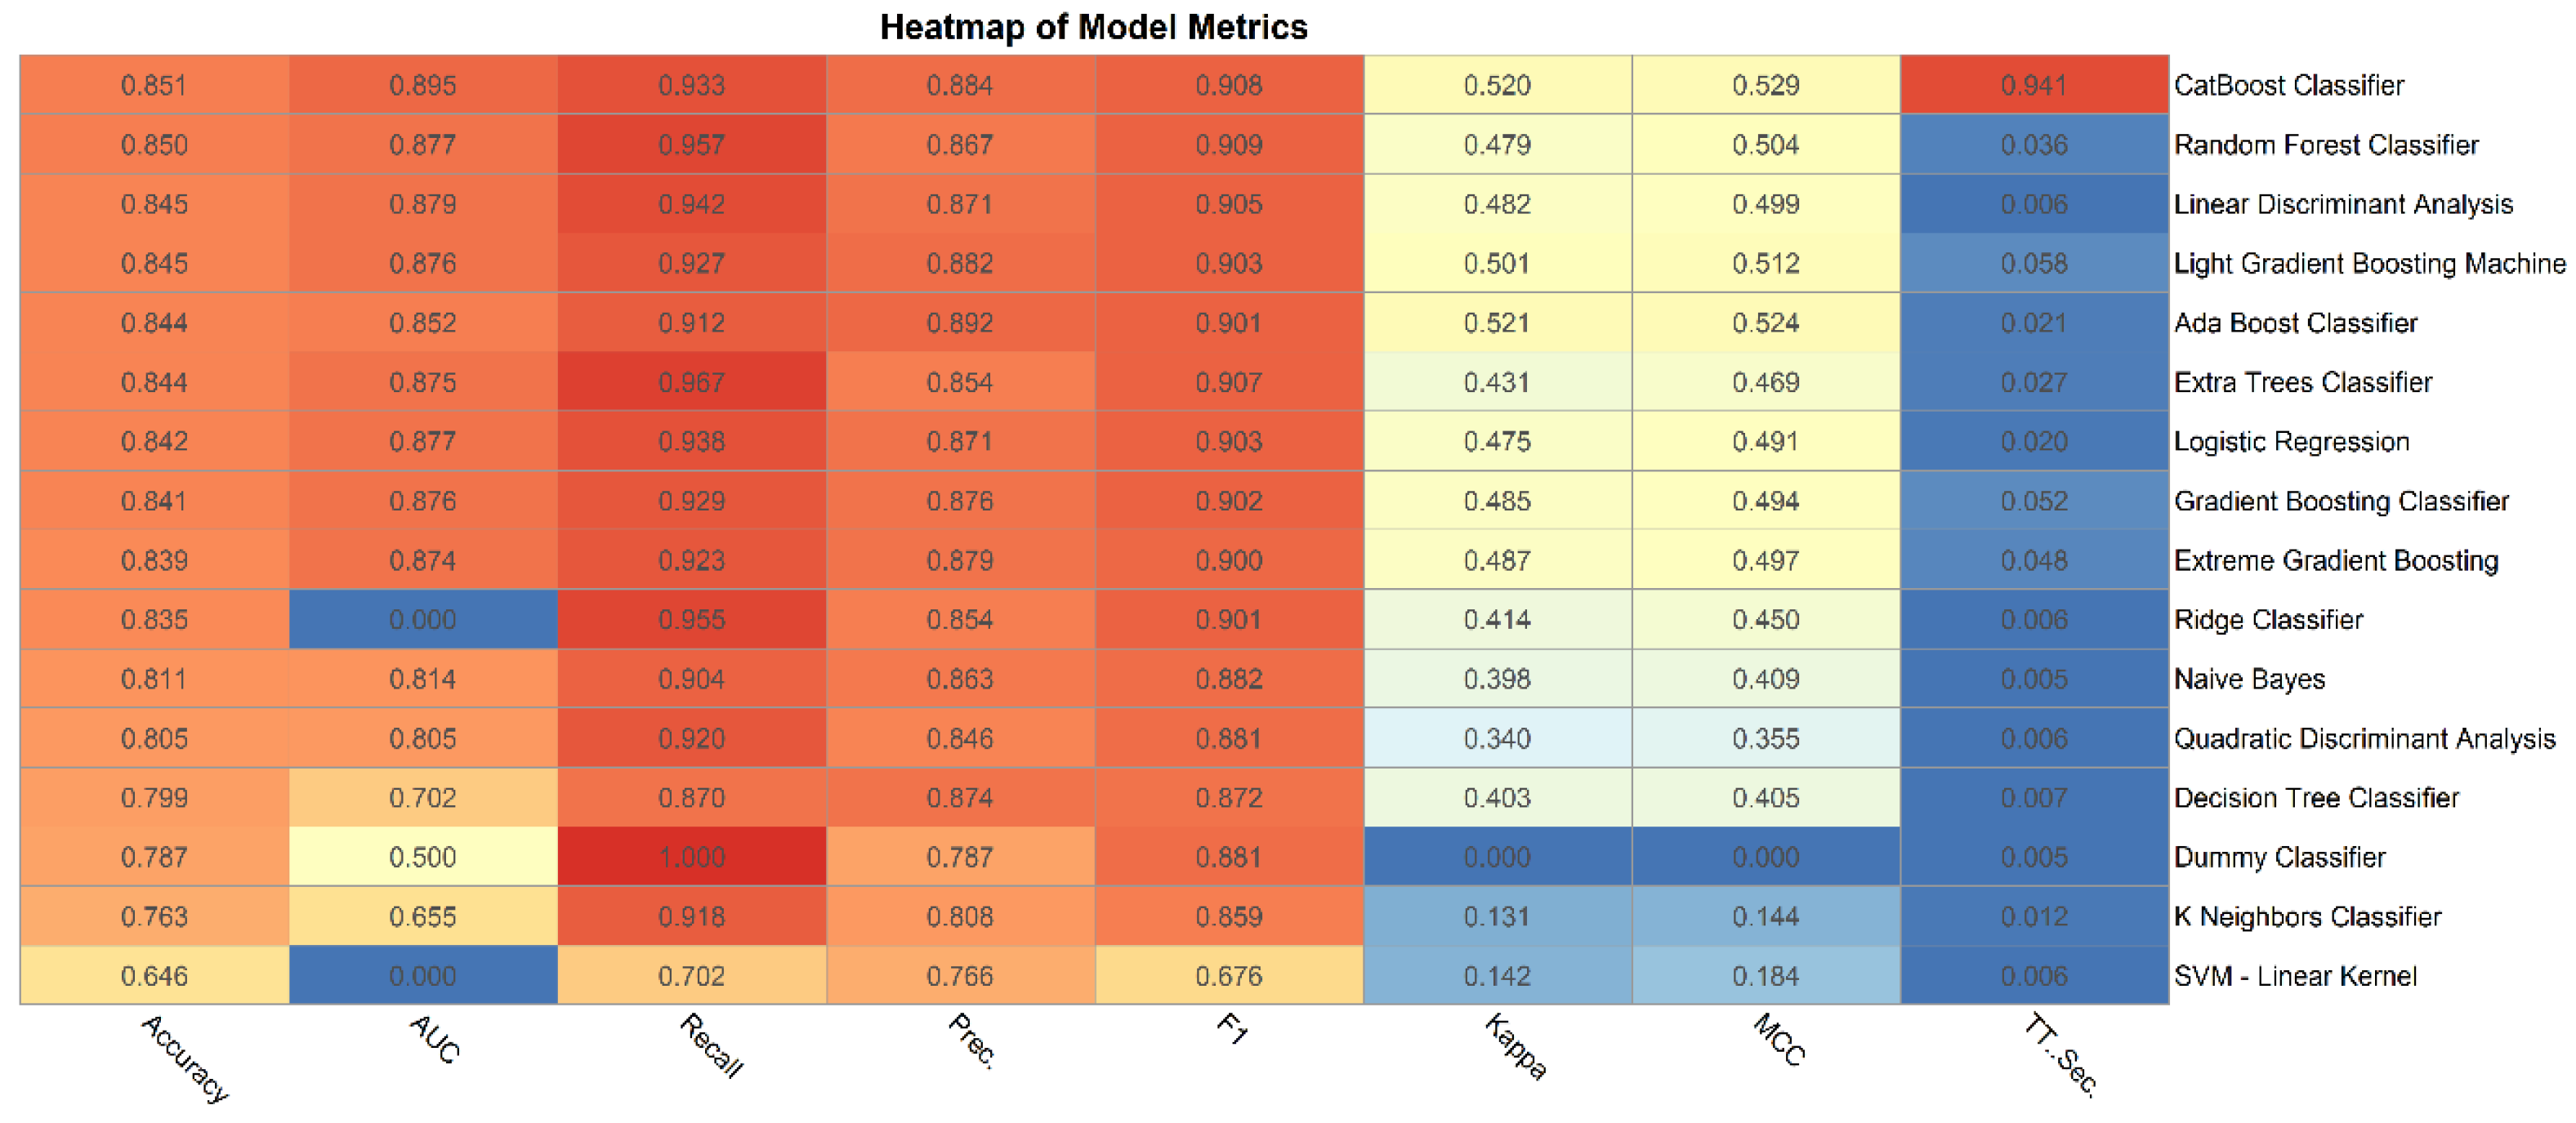
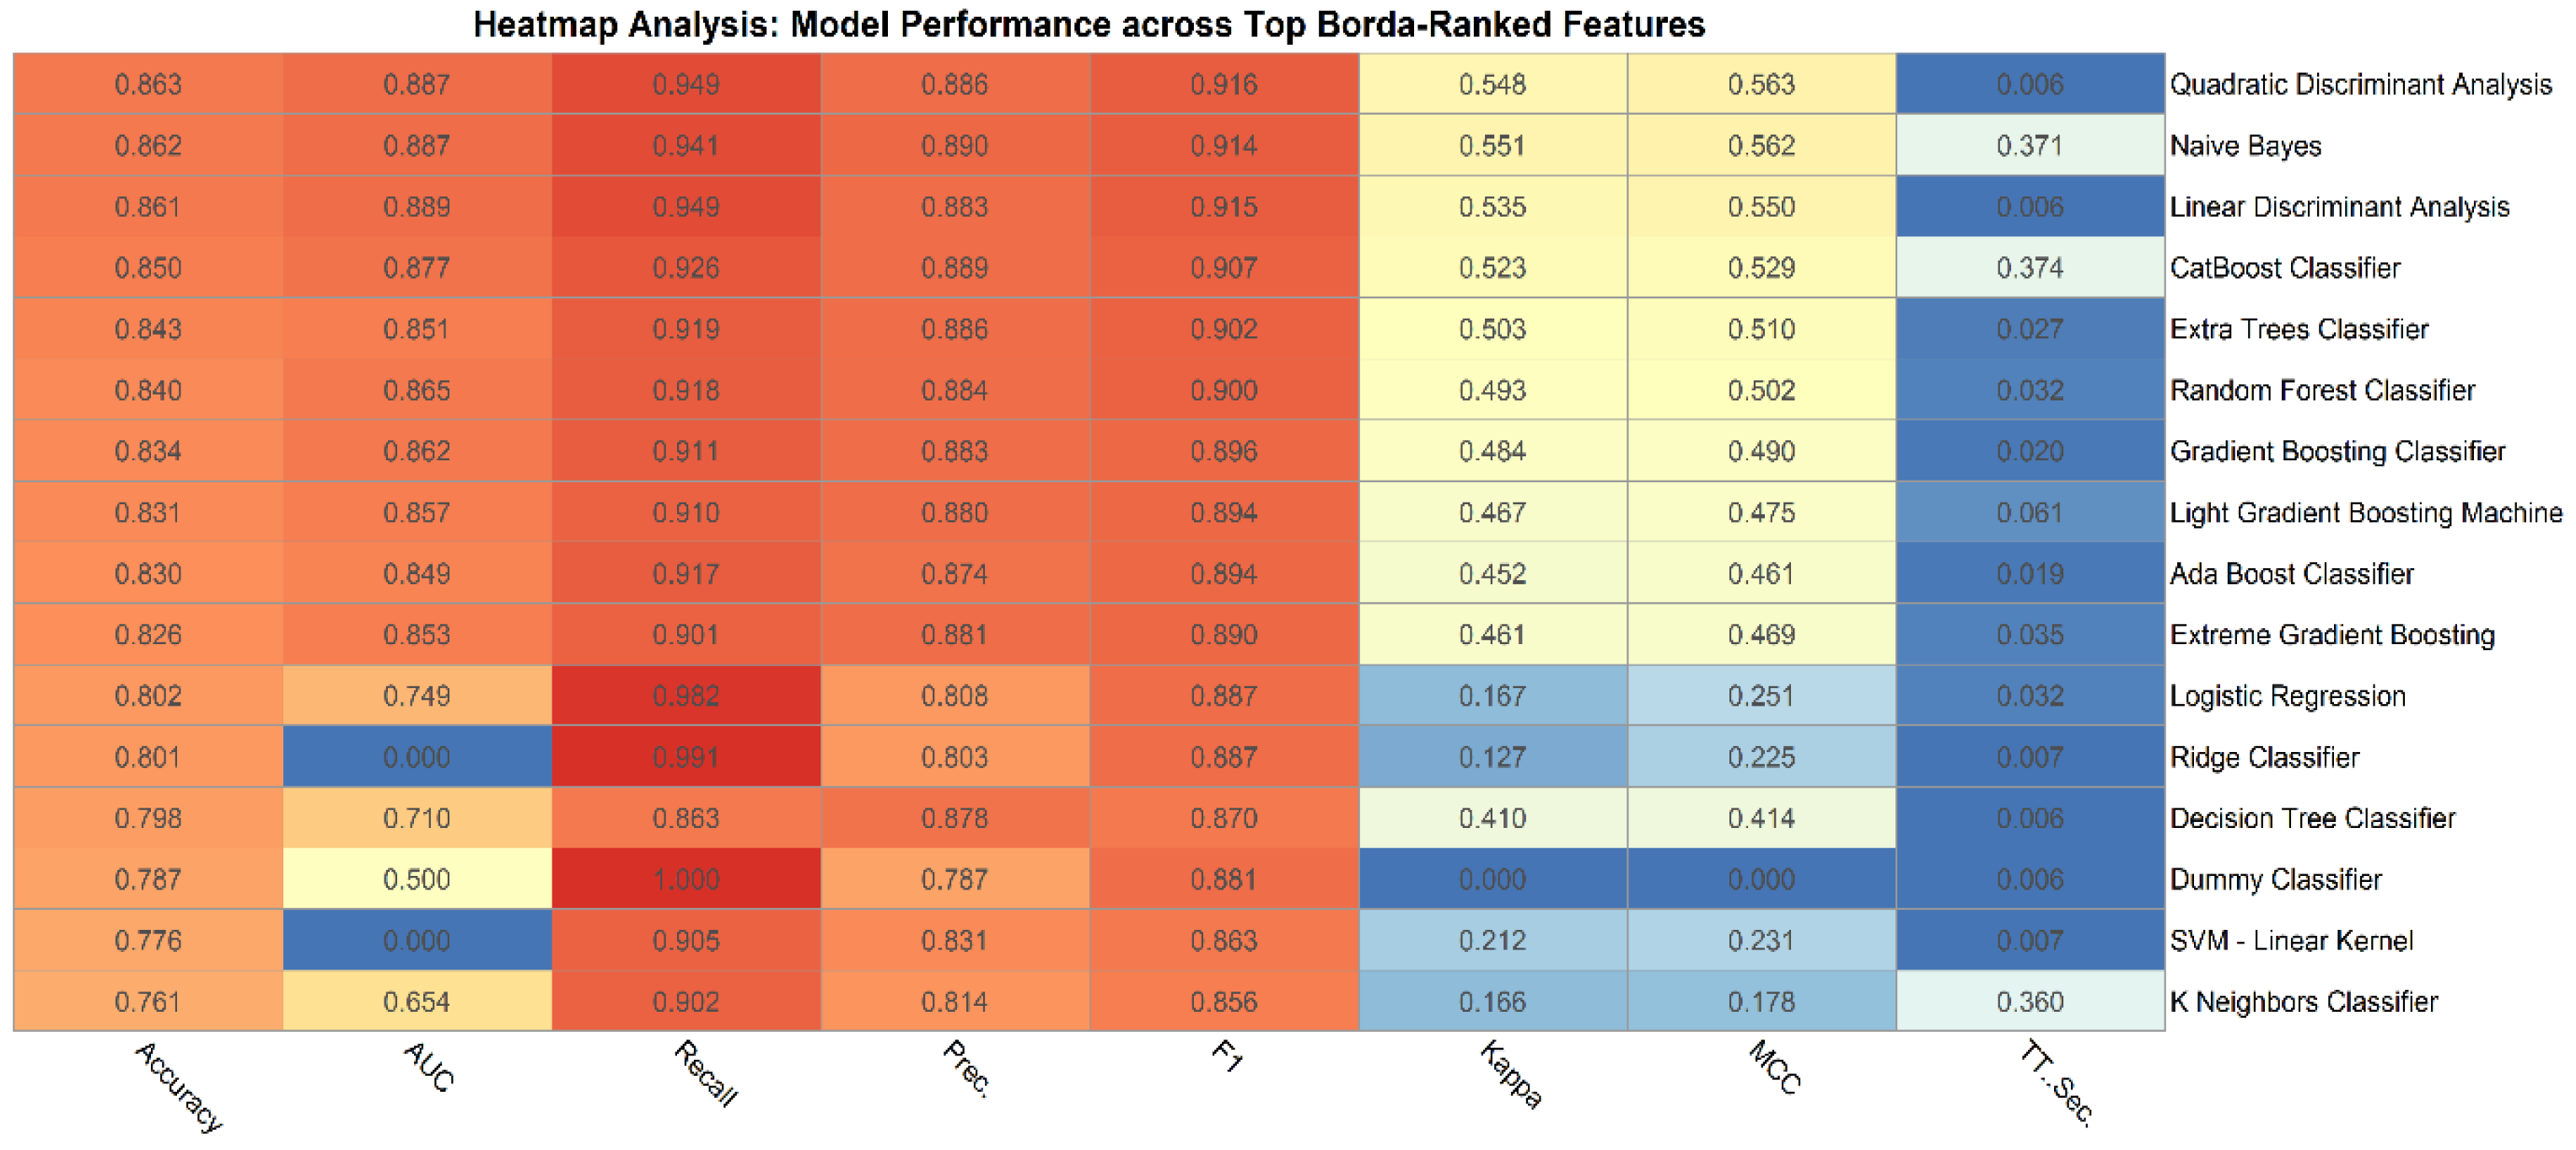
A heatmap was used to compare performance metrics across 16 machine learning algorithms for the initial dataset of 24 features. Each algorithm was evaluated based on key metrics: Accuracy, AUC (Area Under the Curve), Recall, Precision, Kappa, MCC (Matthews Correlation Coefficient), F1, and T-Sec (Time in Seconds). The heatmap (
Figure 1) provides an intuitive and visually appealing depiction of these results.
3.2. Visual Representations
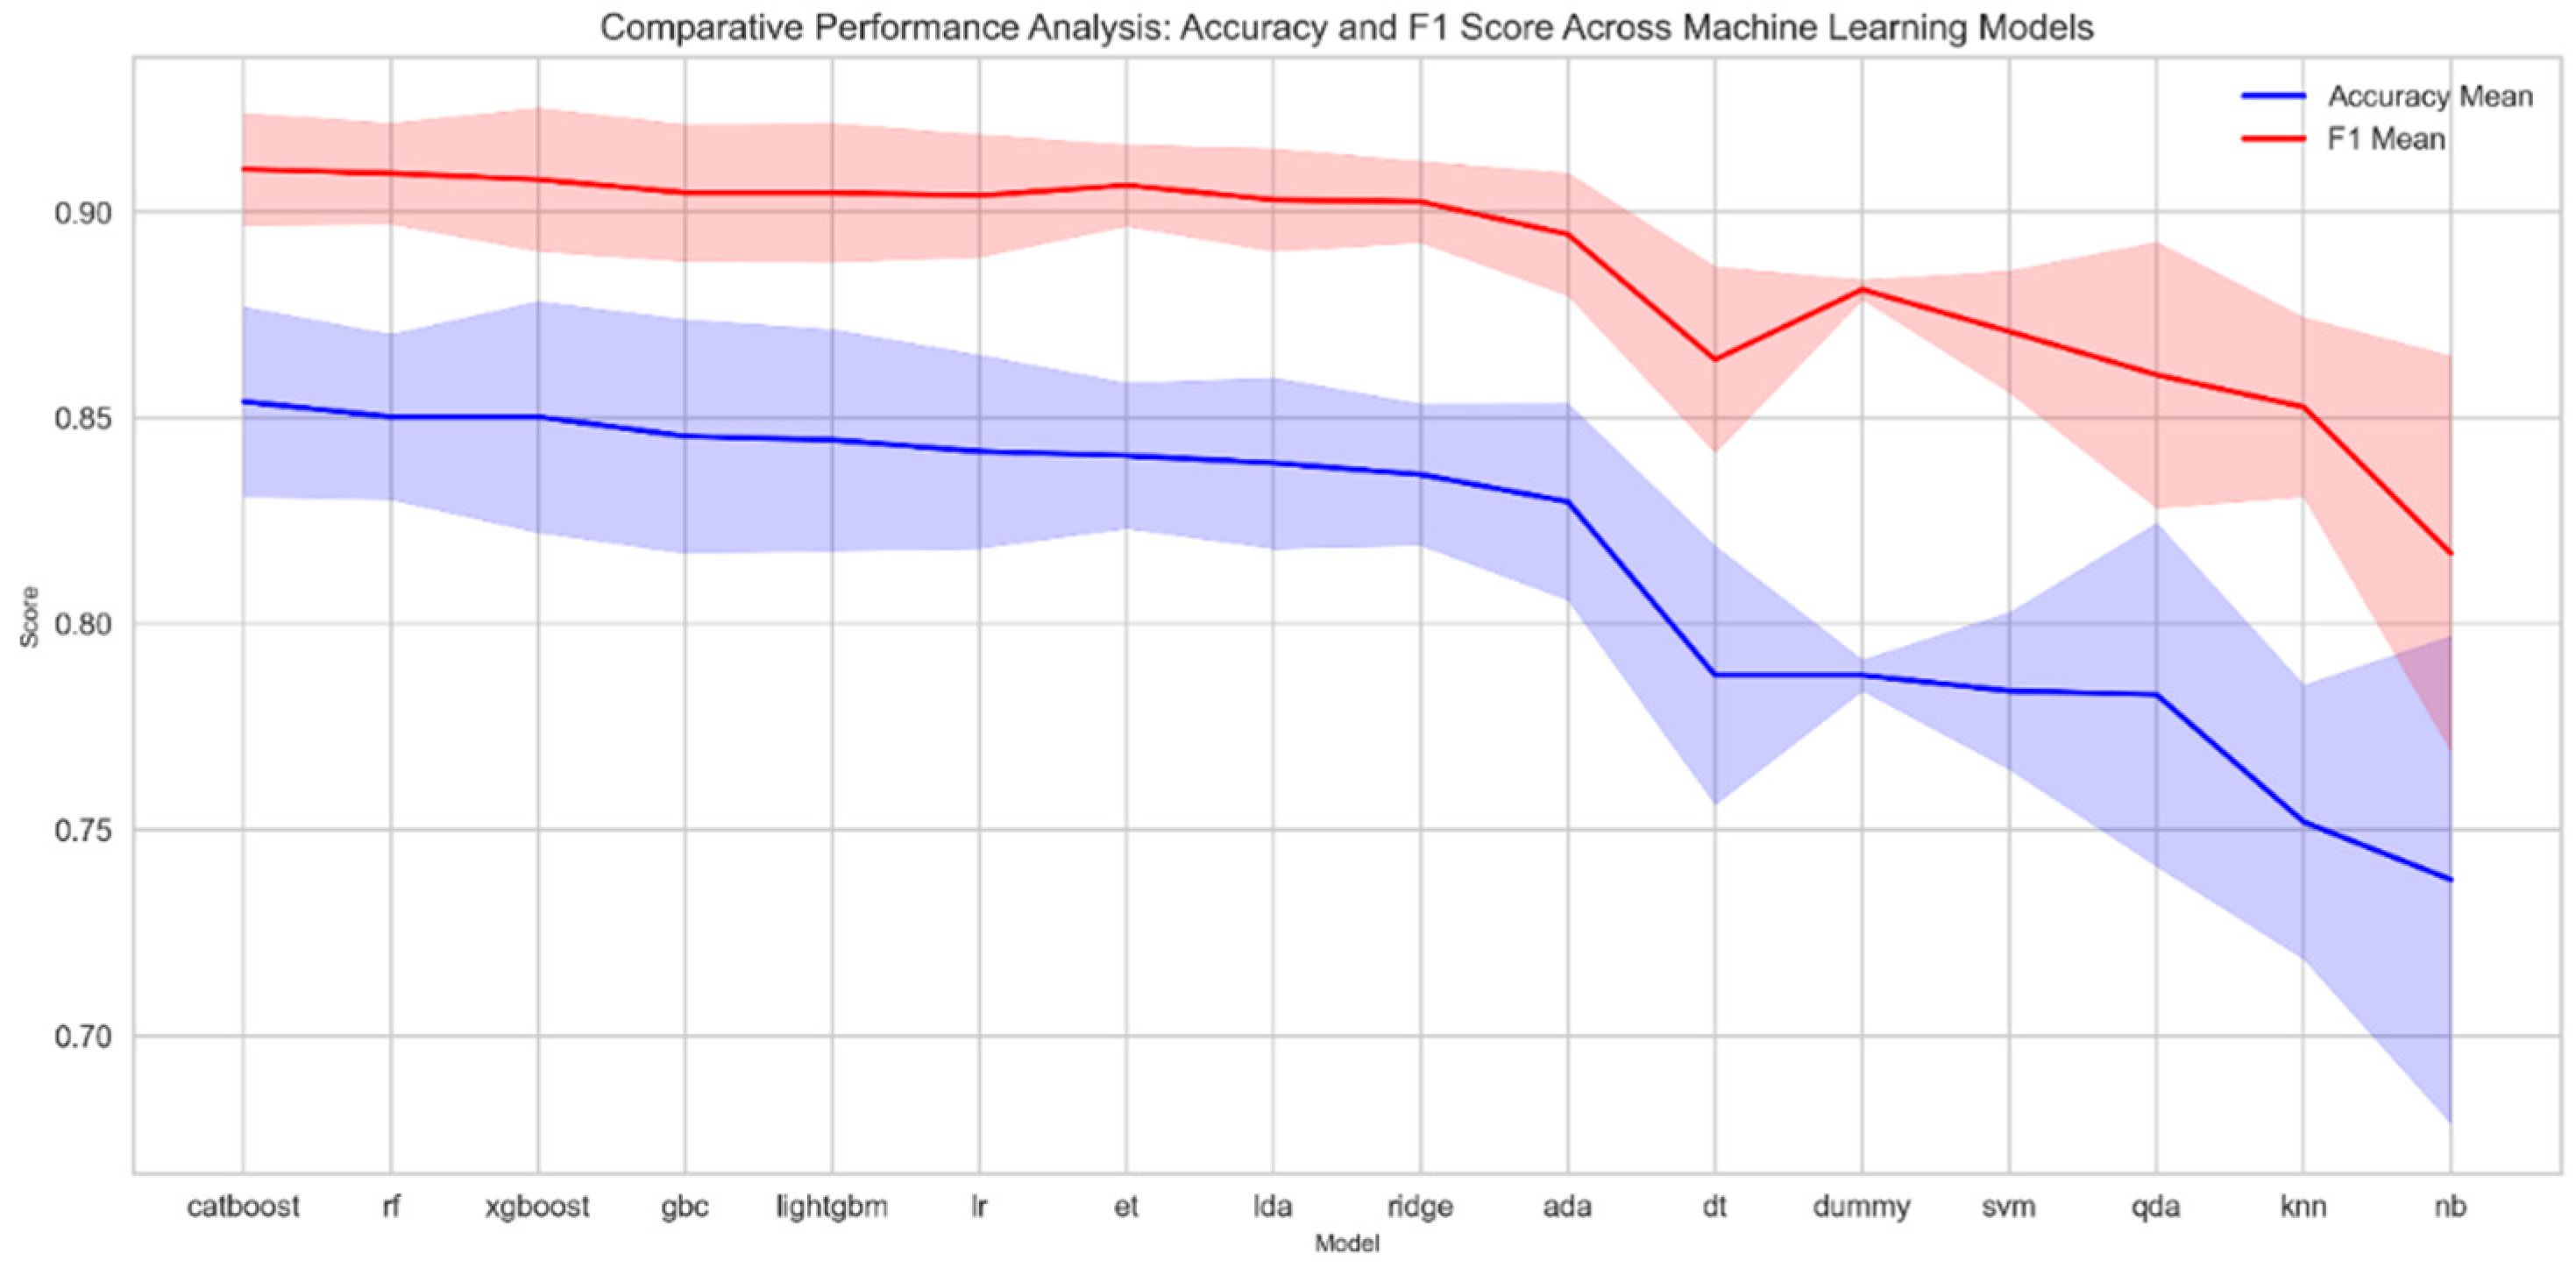
A 10-fold cross-validation technique was implemented to achieve a detailed understanding of the model’s performance. To highlight the variability and reliability of model outcomes, a shaded region plot was designed (
Figure 2). This plot emphasizes the mean values of both accuracy and F1 score for each model.
3.3. Feature Importance Analysis
Understanding the significance of individual features is crucial for interpreting the predictive power and functionality of our models. Based on performance metrics, the top three models identified were CatBoost, Random Forest, and XGBoost. A detailed feature importance analysis was conducted to understand the decision-making process of these models.
3.3.1. Individual Models
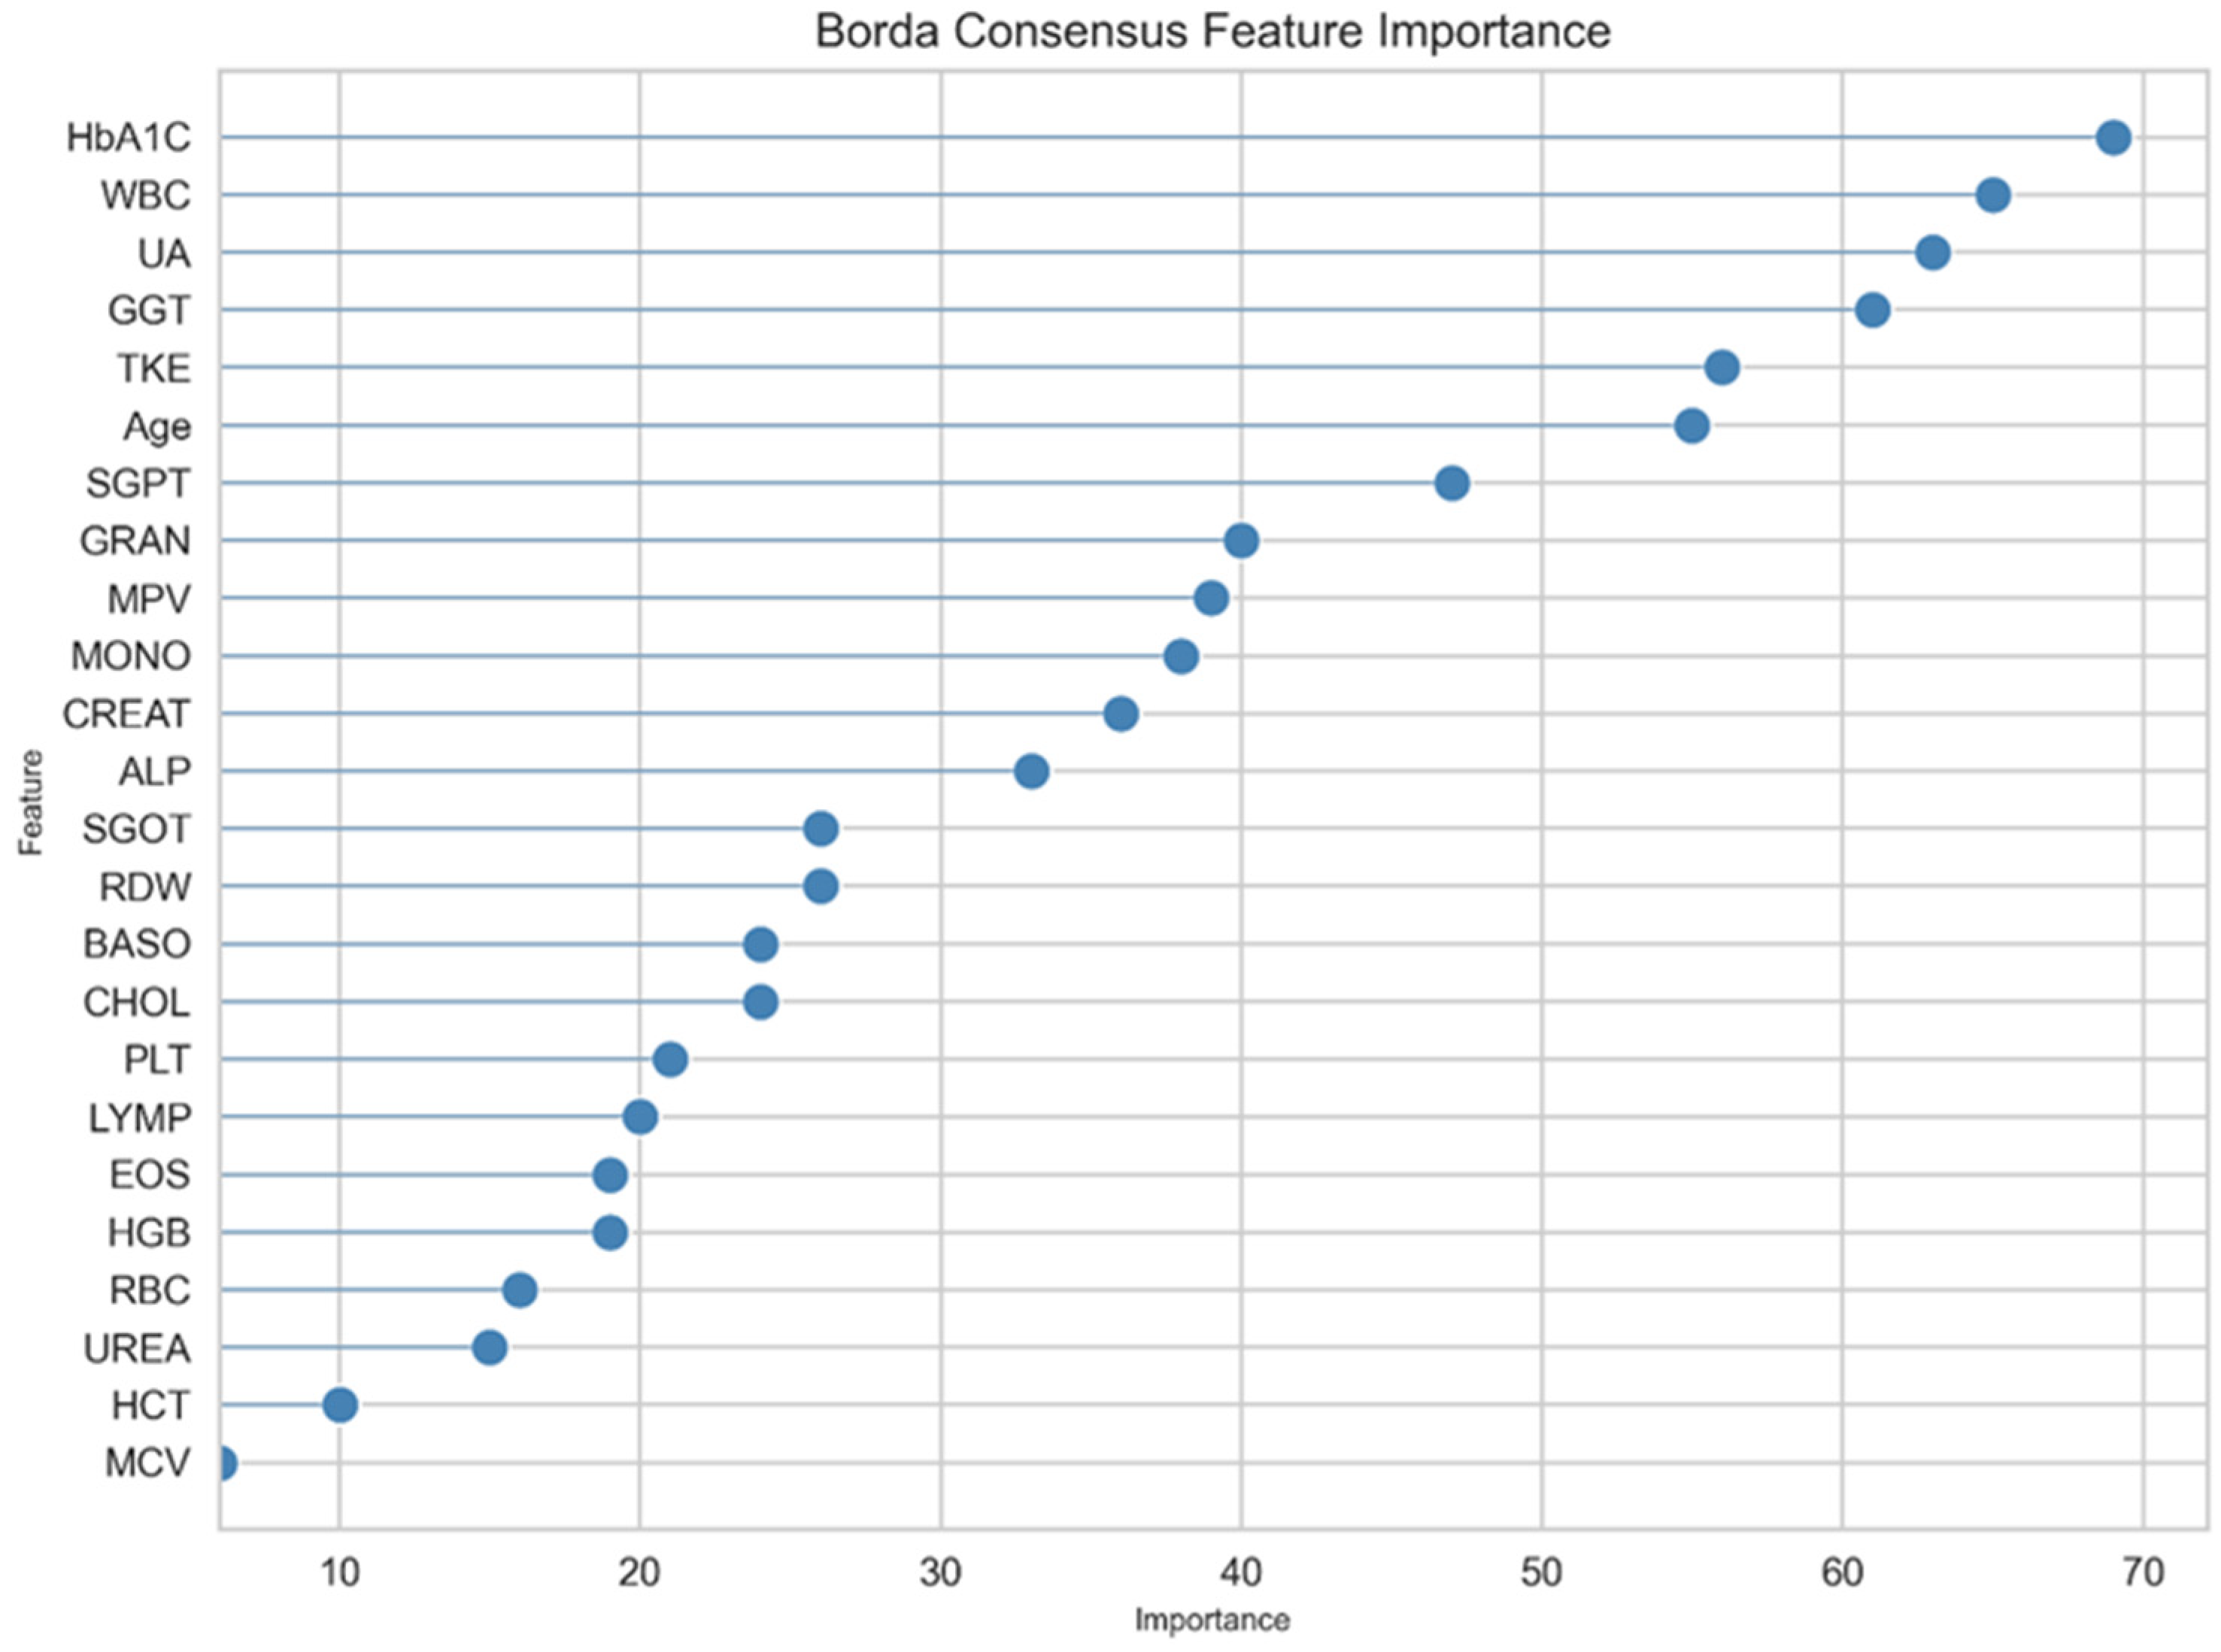
Various machine learning models demonstrated distinct feature prioritization. The top three models were evaluated to ascertain the most influential predictors based on their contributions to the models. The CatBoost model identifies Hemoglobin A1C (HbA1C) as the most significant predictor, followed by White Blood Cells (WBC), Uric Acid (UA), and Gamma-Glutamyl Transferase (GGT). Conversely, Eosinophils (EOS) and Alkaline Phosphatase (ALP) are found to be less predictive. Similarly, the Random Forest model also ranks HbA1C as the primary predictive feature, with UA closely following in significance. It acknowledges the importance of WBC and GGT but assigns lower predictive value to Mean Platelet Volume (MPV) and Granulocytes (GRAN). Meanwhile, the XGBoost model echoes these trends, reaffirming the central role of HbA1C and also underscoring the relevance of WBC and GGT. However, it places more emphasis on the GRAN feature, marking a slight departure from the CatBoost model’s findings.
3.3.2. Borda Count Ensemble Feature Importance
The ensemble method integrates the predictions from the previously discussed three models, combining their distinct strengths for enhanced predictive power. The feature importance analysis of this ensemble approach (
Figure 3) offers a comprehensive perspective on which features are most influential in the collective decision-making process of the ensemble model.
3.3.3. Sequential Feature Addition Based on Borda Importance
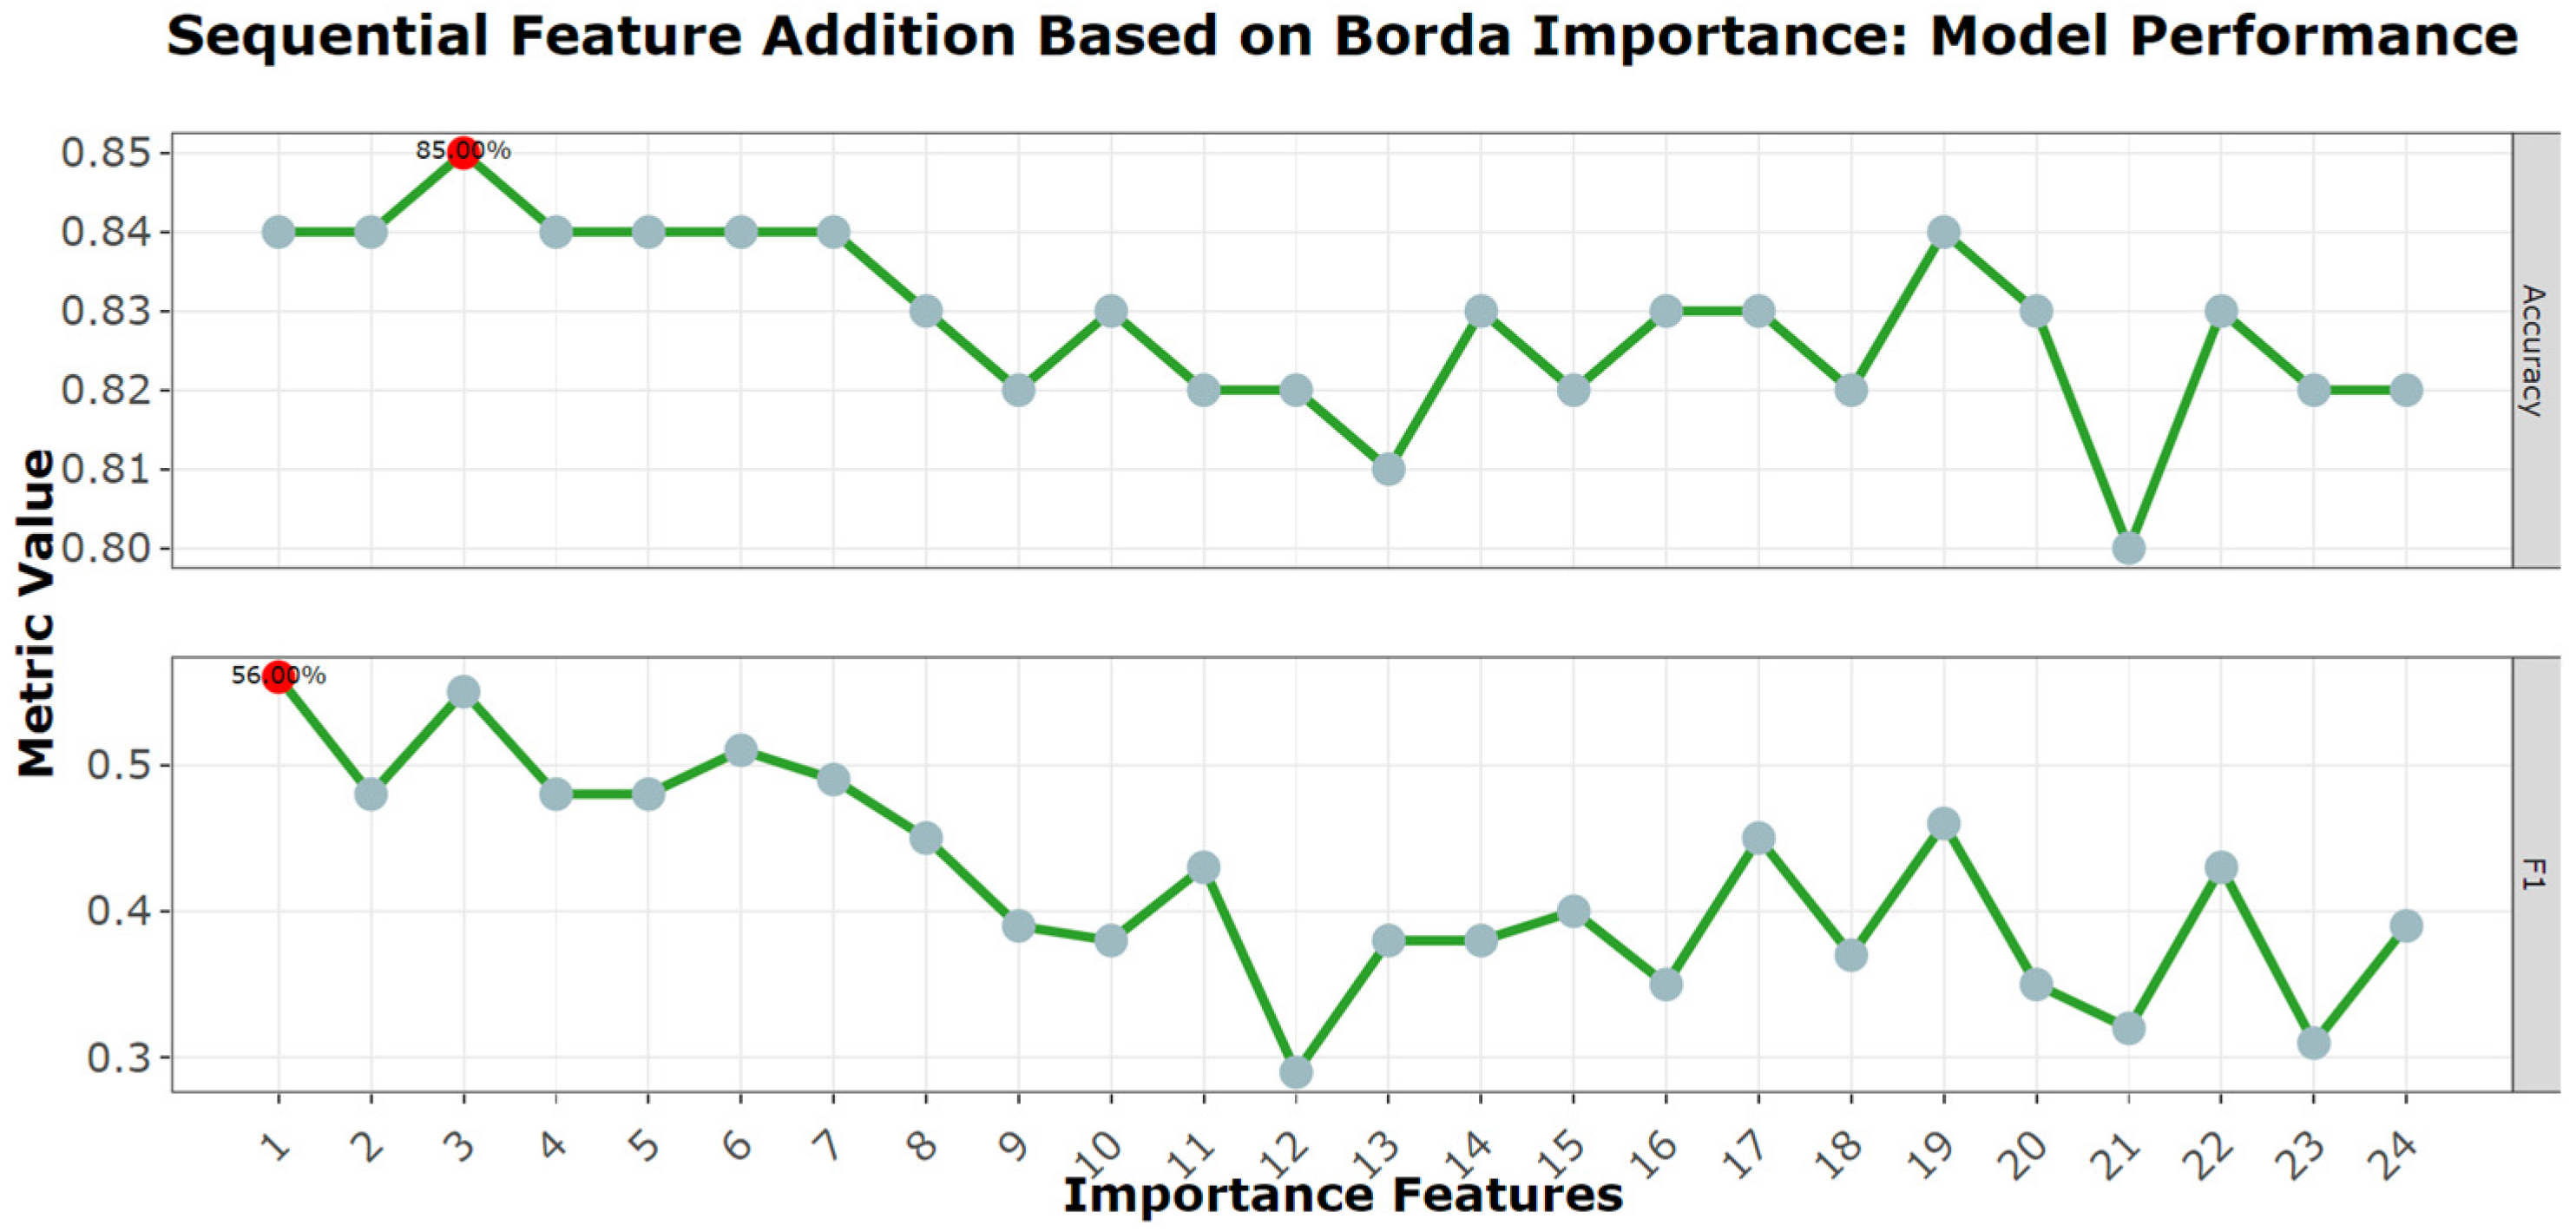
To further illustrate the cumulative impact of features as they are added sequentially based on their Borda importance, a detailed graph was constructed using the KNN algorithm (
Figure 4). KNN was used to determine both accuracy and F1 score for each incremental addition in each feature. The x-axis in this plot lists the features in order of Borda significance, adding one feature each time, and the y-axis shows the associated model accuracy. When the model just includes the first feature (as rated by Borda significance), the F1 score is 56%. Interestingly, a higher accuracy of 85% is attained in the three first features; when the first three features—HbA1C, WBC, and UA—are included, the F1 score is reported to be 55%. This minor decrease in the F1 score, despite the addition of new variables, implies that there isn’t a significant difference in importance between these features in terms of predictive potential. Based on these findings, the first three features, HbA1C, WBC, and UA, were chosen to create a new comparison for the 16 algorithms that only used these three data. The goal was to investigate if an ensemble approach, which integrates ideas from various algorithms, may improve the model’s performance even further when compared to the KNN-based evaluation.
3.4. Ensemble Model Results
To determine the efficacy of the selected three features—HbA1C, WBC, and UA—in predicting metabolic conditions, various ensemble models were constructed and evaluated. The heatmap presented (
Figure 5) elucidates the performance of these models across a myriad of metrics, including accuracy, AUC, recall, precision, F1 score, Kappa, and MCC.
3.5. Clustering Analysis Post-Ensemble Method: Insights before and after Feature Selection
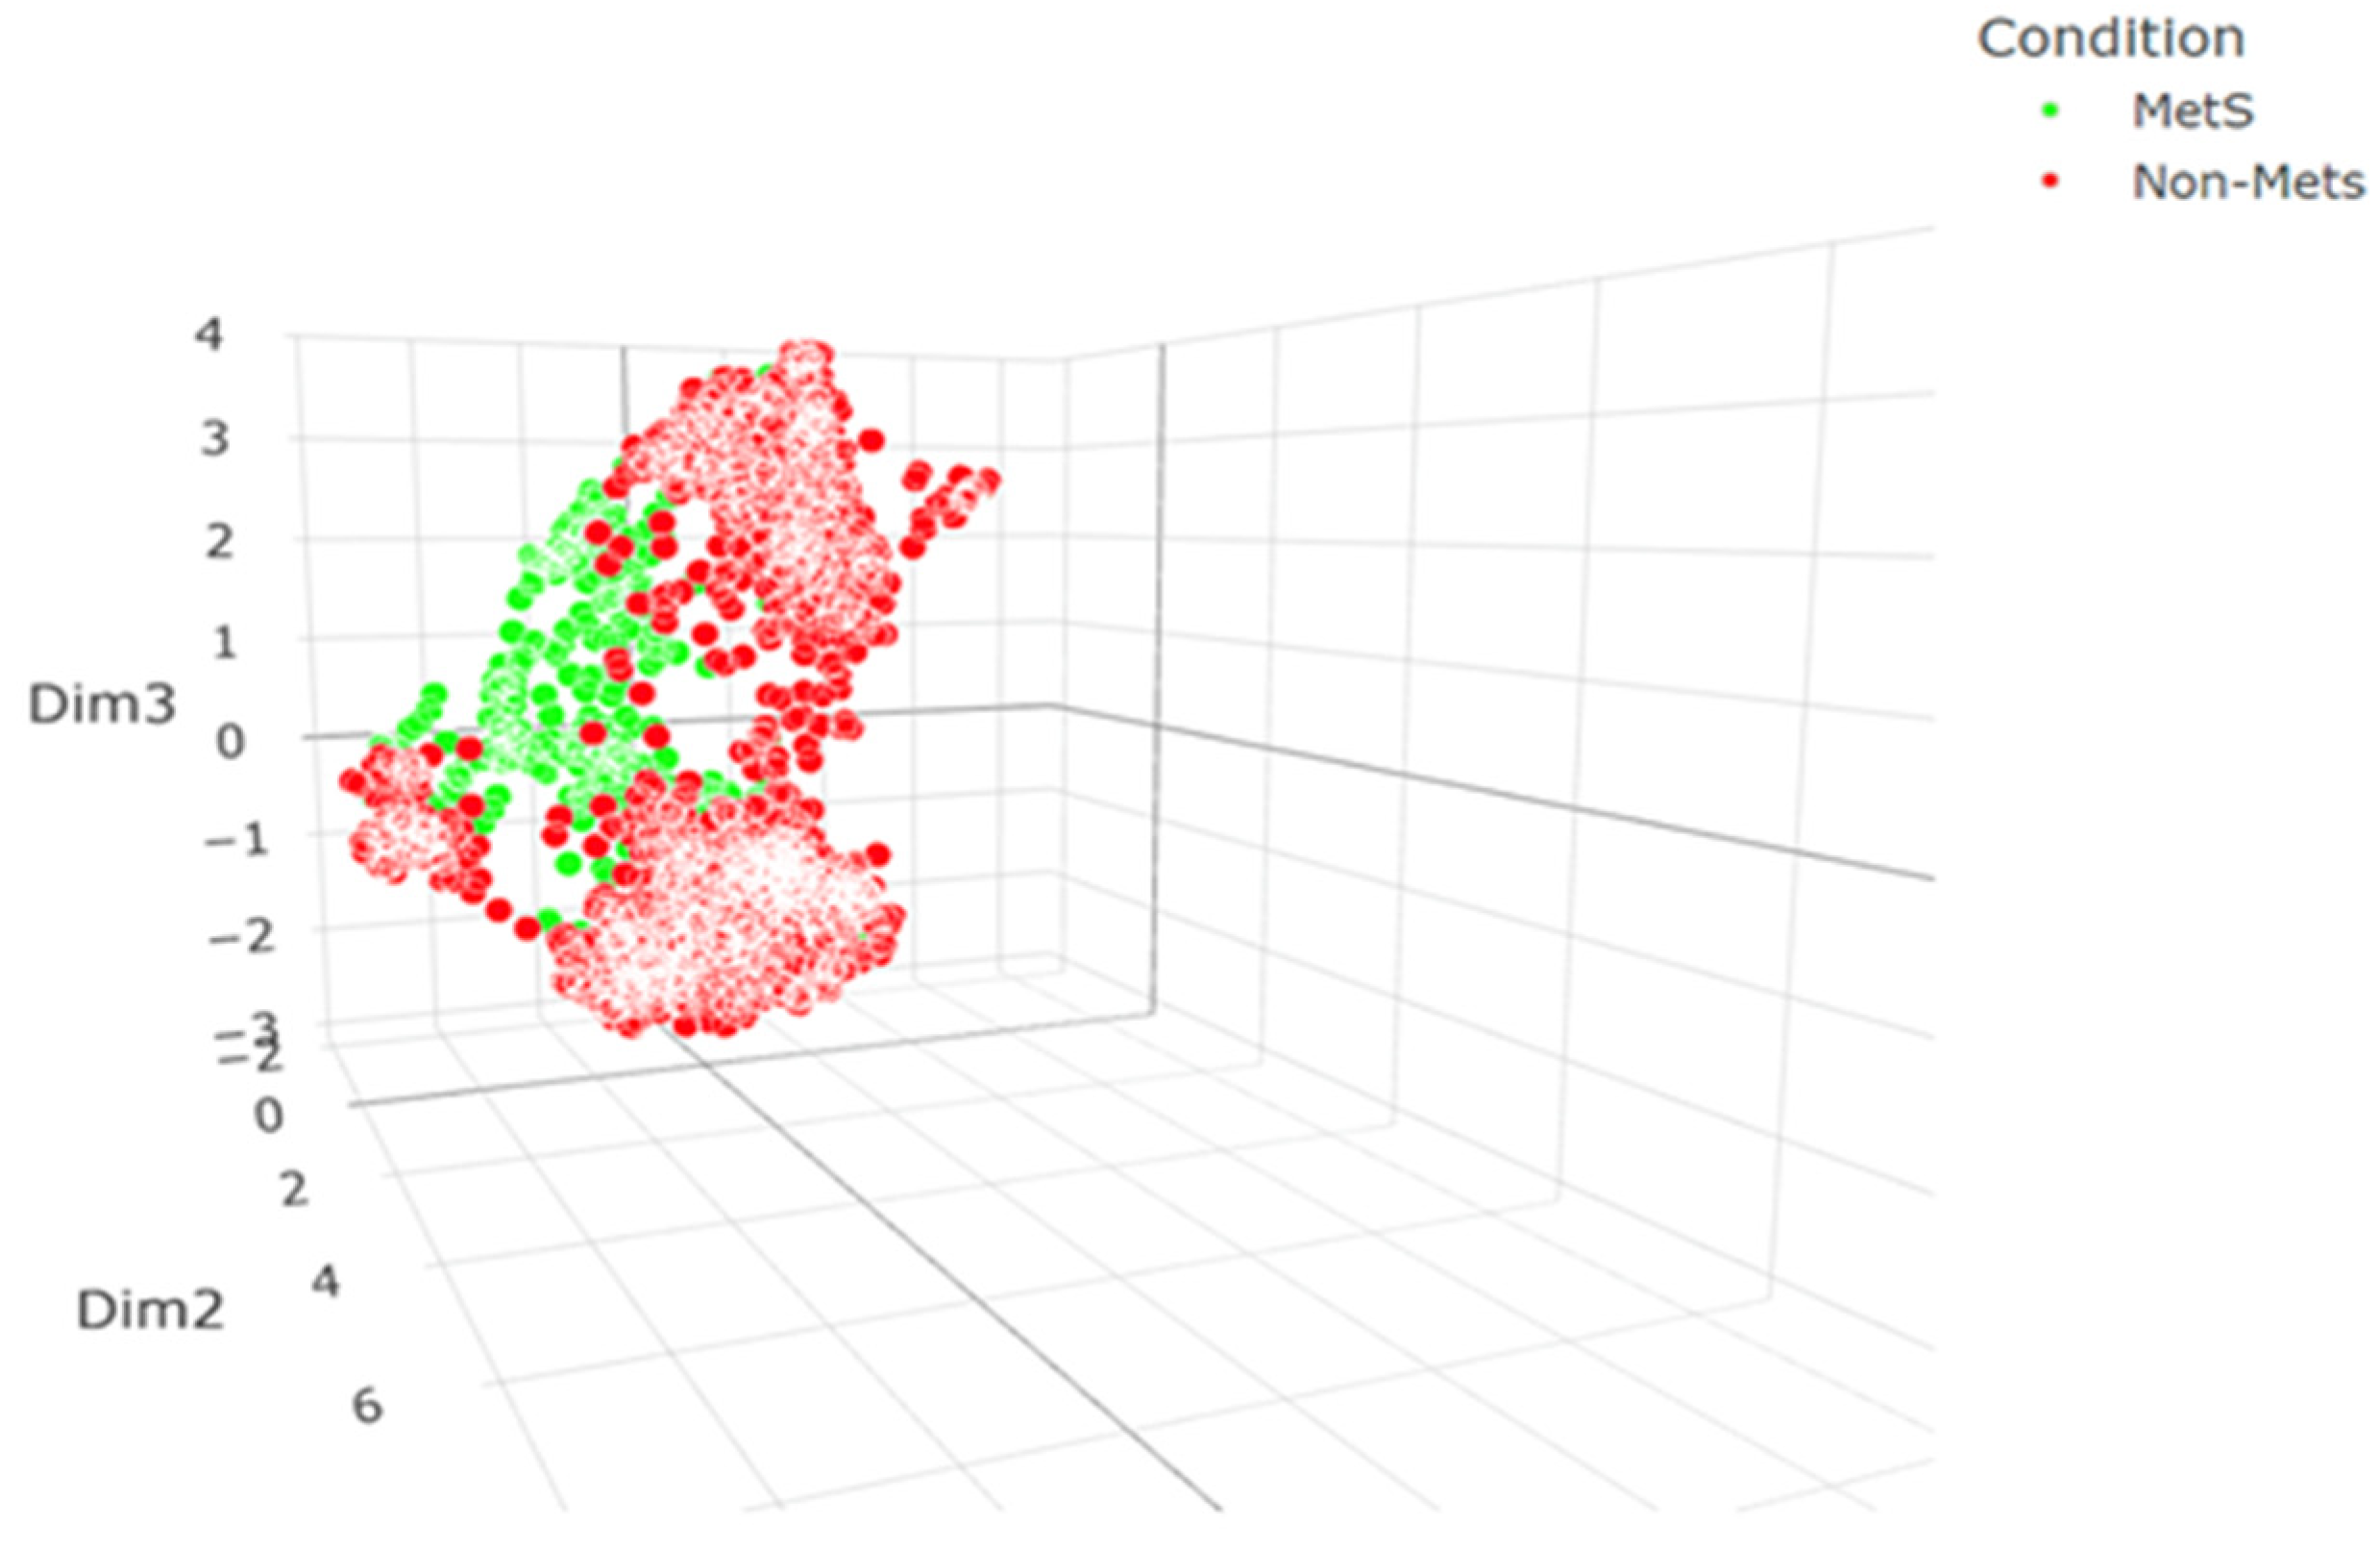
Our clustering analysis was enhanced through the application of a Uniform Manifold Approximation and Projection (UMAP) algorithm, which revealed distinctive patterns in our dataset comprising patients with and without metabolic syndrome (Mets and Non-Mets). Initially, the UMAP algorithm was applied to the entire feature set, resulting in clusters that, while indicative of an underlying structure, showed considerable overlap between the two patient groups (
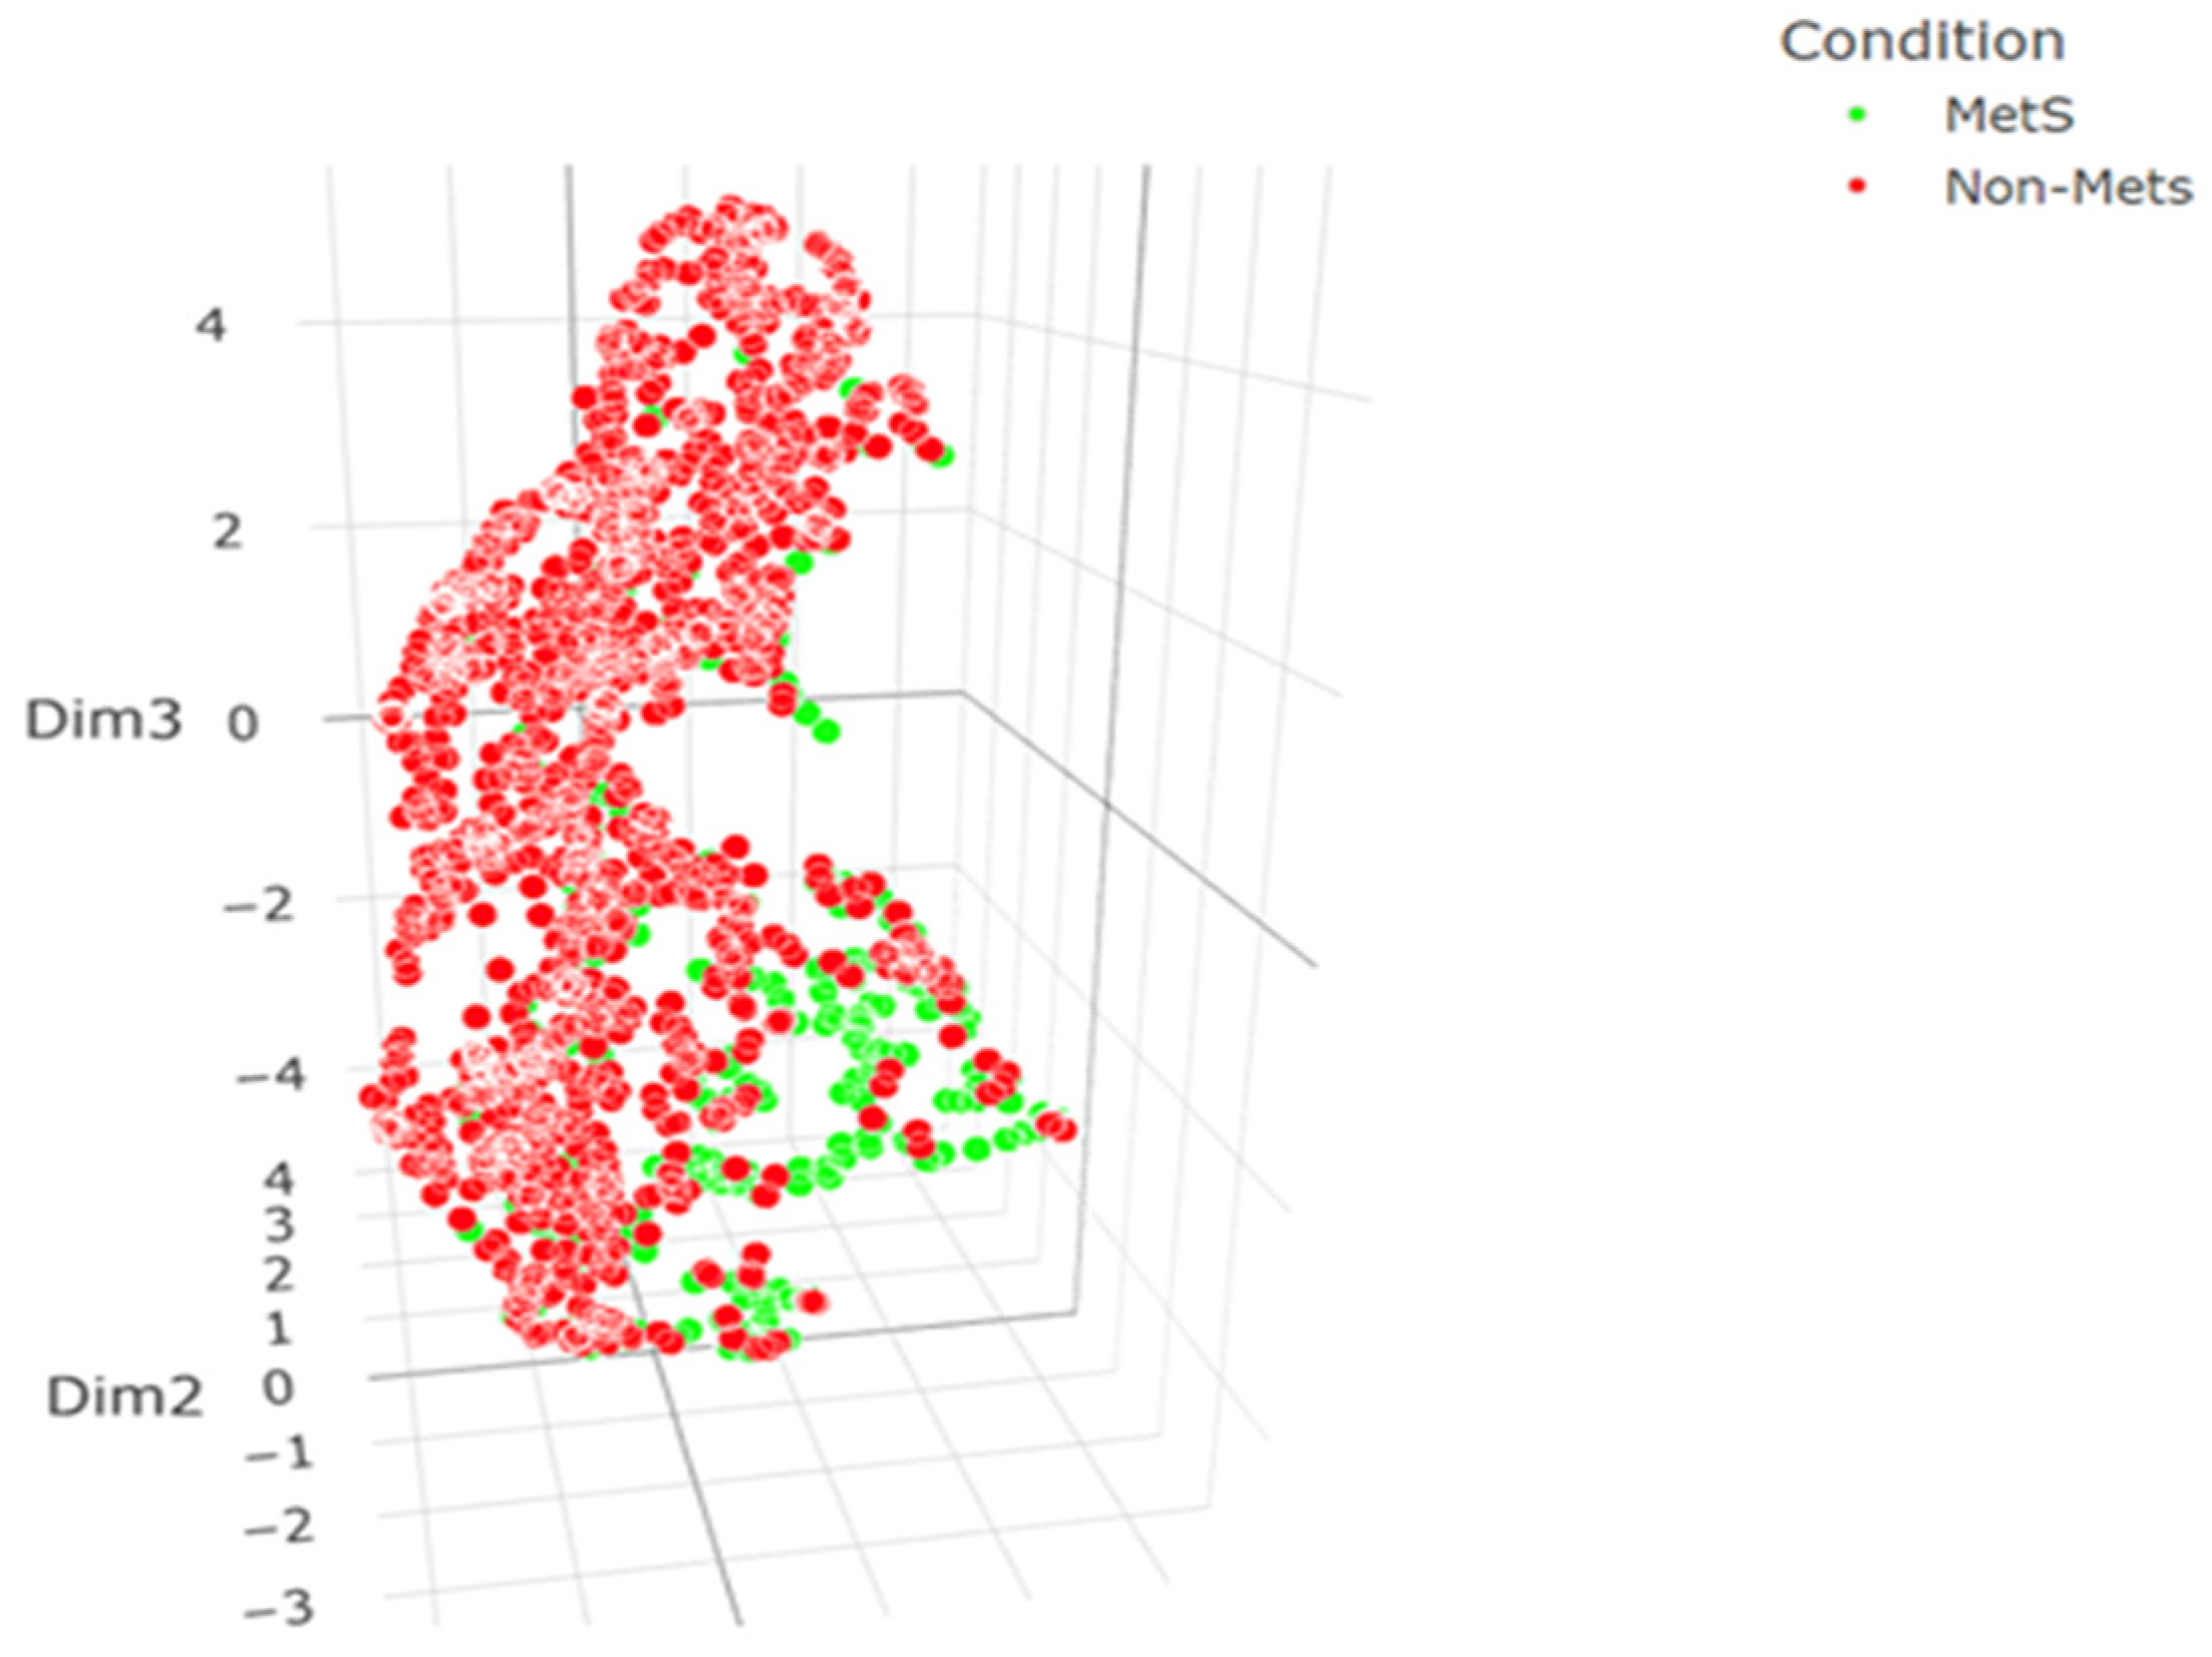
Figure 6). This overlap suggested an absence of clear delineation, potentially due to the confounding influence of less discriminative features. Subsequently, our approach was refined by focusing on the three most important features, as determined by a Borda count ensemble feature importance method. Remarkably, the resultant clusters exhibited a more pronounced separation, with less overlap and more defined grouping (
Figure 7). This improvement visually suggests that the selected features capture the essence of the data more effectively, offering a more lucid distinction between Mets and Non-Mets patients. To substantiate these visual observations, we conducted a quantitative analysis, wherein metrics such as silhouette scores and Dunn index were computed pre- and post-feature selection. The post-selection results showed a marginally lower silhouette score but improved Dunn index and Calinski-Harabasz score, indicating better-defined clusters despite an increase in within-cluster variance. These mixed results underscore the complexity of the dataset and the trade-off between cluster separation and cohesion. Overall, there is an improvement in clustering performance with the top 3 features (
Table 1). Our findings elucidate the potential of ensemble-based feature selection in enhancing the interpretability of clustering outcomes, which is pivotal for advancing precision medicine in the context of metabolic syndrome.
3.6. Model Comparisons
A thorough analysis of the various models using metrics such as AUC, accuracy, recall, precision, Kappa, MCC, and F1 Score offers a nuanced understanding of their performance. The CatBoost Classifier, stands out with an impressive AUC of 0.941, underlining its capability in class differentiation. While models like the Random Forest Classifier and CatBoost Classifier exhibit strong results in the Kappa and MCC metrics, others like Ridge Classifier and Naive Bayes indicate areas of improvement, especially in terms of recall. The varied performance serves as a reminder of the criticality of selecting models in alignment with specific project objectives, be it a focus on precision or recall.
The ensemble methods bring in a fresh perspective. Despite relying on only three of the original 24 features, many ensemble models demonstrated remarkable performance. This achievement reaffirms the importance of the selected features: HbA1C, WBC, and UA in diagnosing metabolic conditions. For instance, the Random Forest model, even with a reduced feature set, exhibits commendable accuracy and F1 score. Such outcomes from ensemble methods underline the potential of feature reduction, especially when it’s backed by a solid selection rationale like Borda importance.
Furthermore, the T-Sec metric emphasizes the balance between model performance and computational efficiency. While some models are time-efficient, others demand more computational resources, a factor to be considered especially in real-time applications. To summarize, the combination of individual model outcomes with ensemble method results, alongside the feature importance plots, equips readers with a comprehensive understanding of the results. It provides clarity on both the performance of each model and the influence of each feature within those models and their ensemble counterparts.
4. Discussion
Our findings indicate that ensemble models, particularly those utilizing the Borda count method, significantly enhance predictive accuracy for MetS. This suggests that combining multiple ML models can better capture the complex nature of MetS. Future research should explore the integration of additional variables and larger datasets to further validate these results.
In conclusion the ensemble methods, particularly, demonstrate impressive performance despite a significantly reduced feature set. The three chosen features—HbA1C, WBC, and UA—emerge as critical predictors of metabolic conditions, with their importance magnified against the backdrop of more comprehensive models. Notably, while models like CatBoost and Random Forest, known for their reliance on a diverse feature set, show high accuracy and F1 scores, they are outperformed by simpler algorithms such as Quadratic Discriminant Analysis, Naive Bayes, and Linear Discriminant Analysis in the ensemble context. This shift underlines the importance of feature selection in both understanding metabolic states and in the strategic choice of algorithms for predictive accuracy.
A compelling insight from the heatmap analysis, both pre- and post-ensemble method application, is the notable change in model rankings. Models based on linear analysis gain prominence, overshadowing traditionally dominant models like CatBoost and Random Forest. This shift highlights the significant impact of feature reduction on model efficacy. Furthermore, certain anomalies, especially in the KNN algorithm, suggest the potential for overfitting or challenges associated with a limited feature set, emphasizing the need for rigorous model validation for broader applicability.
In contrast, the performance metrics of models using the full feature set offer a benchmark for comparison. These metrics reveal varied performance across models, with the CatBoost Classifier excelling in class differentiation due to its high AUC value. Conversely, models with lower Recall scores, like the Ridge Classifier and Naive Bayes, indicate challenges in accurately identifying true positives. The T-Sec metric underscores the importance of balancing predictive accuracy with computational efficiency, especially in real-time diagnostic applications.
The ensemble methods in our study exemplify the power of combining predictions from various machine learning algorithms to create a model that often surpasses the accuracy of individual components. These methods not only enhanced performance but also emphasized the effectiveness of a smaller feature set. By concentrating on just three critical features out of the initial 24, the ensemble approach achieved remarkable results, underscoring its ability to extract valuable insights from minimal data.
These performance measures highlight the ensemble’s ability to harness the strengths of individual models while mitigating their weaknesses. The Random Forest model, for example, typically benefits from a diverse feature set but achieved notable accuracy and F1 scores even with the reduced feature set. This finding illustrates the ensemble’s capability to enhance both feature selection and model performance. Moreover, the ensemble method offers a holistic view of feature relevance, providing a consensus on the most crucial variables for predicting metabolic states. This collective intelligence is invaluable in real-world applications, where understanding the interplay of various factors is crucial.
6. Conclusions
In conclusion, our study highlights the superior performance of the CatBoost Classifier in predicting MetS, as evidenced by its high AUC score. The effectiveness of ensemble models, especially with feature reduction to HbA1C, WBC, and UA, underscores the importance of strategic feature selection in improving diagnostic accuracy.
The varied performances across models like the Random Forest and Ridge Classifier underline the importance of matching model selection with specific project objectives, such as precision or recall. Further emphasizing the efficacy of strategic feature selection, our exploration of ensemble methods demonstrates remarkable predictive power by focusing on just three critical features—HbA1C, WBC, and UA. This not only showcases the potential of feature reduction but also accentuates the importance of each feature in MetS diagnosis. The study also brings to light the crucial balance between model performance and computational efficiency, an important consideration for real-time applications. Altogether, the integration of individual and ensemble model outcomes, coupled with feature importance analysis, provides a holistic understanding of machine learning’s applicability in MetS prediction, contributing significantly to the advancement of non-invasive diagnostic tools and opening new avenues for future research in optimizing machine learning models for healthcare applications.
Author Contributions
Conceptualization, PP and AV; methodology, PP; software, PP; validation, PP, DR, and AS; formal analysis, PP; investigation, AS, DR, PP; resources, AS; data curation, AV; writing—original draft preparation, PP, AS and DR; writing—review and editing, PP, DR, and AS; visualization, PP; supervision, AV; project administration, PP; funding acquisition, AV. All authors have read and agreed to the published version of the manuscript.
Funding
This research received no external funding.
Institutional Review Board Statement
Not applicable.
Informed Consent Statement
Not applicable.
Data Availability Statement
PaplomatasP/Machine-Learning-for-Metabolic-Syndrome: Enhancing Metabolic Syndrome Detection through Blood Tests Using Advanced Machine Learning (
github.com).
Conflicts of Interest
The authors declare no conflicts of interest.
References
- NCDs Main NCDs. Available online: http://www.emro.who.int/noncommunicable-diseases/diseases/diseases.html (accessed on 19 May 2024).
- Wang, Y.; Wang, J. Modelling and Prediction of Global Non-Communicable Diseases. BMC Public Health 2020, 20, 822. [Google Scholar] [CrossRef] [PubMed]
- Saklayen, M.G. The Global Epidemic of the Metabolic Syndrome. Curr Hypertens Rep 2018, 20, 12. [Google Scholar] [CrossRef] [PubMed]
- Madadizadeh, F.; Bahrampour, A.; Mousavi, S.M.; Montazeri, M. Using Advanced Statistical Models to Predict the Non-Communicable Diseases. Iran J Public Health 2015, 44, 1714–1715. [Google Scholar] [PubMed]
- Fahed, G.; Aoun, L.; Bou Zerdan, M.; Allam, S.; Bou Zerdan, M.; Bouferraa, Y.; Assi, H.I. Metabolic Syndrome: Updates on Pathophysiology and Management in 2021. IJMS 2022, 23, 786. [Google Scholar] [CrossRef] [PubMed]
- Mili, N.; Paschou, S.A.; Goulis, D.G.; Dimopoulos, M.-A.; Lambrinoudaki, I.; Psaltopoulou, T. Obesity, Metabolic Syndrome, and Cancer: Pathophysiological and Therapeutic Associations. Endocrine 2021, 74, 478–497. [Google Scholar] [CrossRef] [PubMed]
- Lin, L.; Tan, W.; Pan, X.; Tian, E.; Wu, Z.; Yang, J. Metabolic Syndrome-Related Kidney Injury: A Review and Update. Front. Endocrinol. 2022, 13. [Google Scholar] [CrossRef] [PubMed]
- Li, J.; Zhang, Y.; Lu, T.; Liang, R.; Wu, Z.; Liu, M.; Qin, L.; Chen, H.; Yan, X.; Deng, S.; et al. Identification of Diagnostic Genes for Both Alzheimer’s Disease and Metabolic Syndrome by the Machine Learning Algorithm. Front. Immunol. 2022, 13. [Google Scholar] [CrossRef] [PubMed]
- Ali, A.; Ali, A.; Ahmad, W.; Ahmad, N.; Khan, S.; Nuruddin, S.M.; Husain, I. Deciphering the Role of WNT Signaling in Metabolic Syndrome-Linked Alzheimer’s Disease. Mol Neurobiol 2020, 57, 302–314. [Google Scholar] [CrossRef] [PubMed]
- Więckowska-Gacek, A.; Mietelska-Porowska, A.; Wydrych, M.; Wojda, U. Western Diet as a Trigger of Alzheimer’s Disease: From Metabolic Syndrome and Systemic Inflammation to Neuroinflammation and Neurodegeneration. Ageing Res Rev 2021, 70, 101397. [Google Scholar] [CrossRef] [PubMed]
- He, Y.; Lu, Y.; Zhu, Q.; Wang, Y.; Lindheim, S.R.; Qi, J.; Li, X.; Ding, Y.; Shi, Y.; Wei, D.; et al. Influence of Metabolic Syndrome on Female Fertility and in Vitro Fertilization Outcomes in PCOS Women. Am J Obstet Gynecol 2019, 221, e1–e138. [Google Scholar] [CrossRef] [PubMed]
- Goulis, D.G.; Tarlatzis, B.C. Metabolic Syndrome and Reproduction: I. Testicular Function. Gynecological Endocrinology 2008, 24, 33–39. [Google Scholar] [CrossRef] [PubMed]
- Fekete, M.; Szollosi, G.; Tarantini, S.; Lehoczki, A.; Nemeth, A.N.; Bodola, C.; Varga, L.; Varga, J.T. Metabolic Syndrome in Patients with COPD: Causes and Pathophysiological Consequences. Physiol Int 2022. [Google Scholar] [CrossRef] [PubMed]
- Clini, E.; Crisafulli, E.; Radaeli, A.; Malerba, M. COPD and the Metabolic Syndrome: An Intriguing Association. Intern Emerg Med 2013, 8, 283–289. [Google Scholar] [CrossRef]
- Medina, G.; Vera-Lastra, O.; Peralta-Amaro, A.L.; Jiménez-Arellano, M.P.; Saavedra, M.A.; Cruz-Domínguez, M.P.; Jara, L.J. Metabolic Syndrome, Autoimmunity and Rheumatic Diseases. Pharmacol Res 2018, 133, 277–288. [Google Scholar] [CrossRef] [PubMed]
- Wang, Y.; Huang, Z.; Xiao, Y.; Wan, W.; Yang, X. The Shared Biomarkers and Pathways of Systemic Lupus Erythematosus and Metabolic Syndrome Analyzed by Bioinformatics Combining Machine Learning Algorithm and Single-Cell Sequencing Analysis. Front Immunol 2022, 13, 1015882. [Google Scholar] [CrossRef] [PubMed]
- Ünlü, B.; Türsen, Ü. Autoimmune Skin Diseases and the Metabolic Syndrome. Clin Dermatol 2018, 36, 67–71. [Google Scholar] [CrossRef] [PubMed]
- Lima-Fontes, M.; Barata, P.; Falcão, M.; Carneiro, Â. Ocular Findings in Metabolic Syndrome: A Review. Porto Biomed J 2020, 5, e104. [Google Scholar] [CrossRef] [PubMed]
- Roddy, G.W. Metabolic Syndrome and the Aging Retina. Curr Opin Ophthalmol 2021, 32, 280–287. [Google Scholar] [CrossRef] [PubMed]
- Wang, M.; Zhang, Y.H.; Yan, F.H. Research progress in the association of periodontitis and metabolic syndrome. Zhonghua Kou Qiang Yi Xue Za Zhi 2021, 56, 1138–1143. [Google Scholar] [CrossRef] [PubMed]
- Kim, O.S.; Shin, M.H.; Kweon, S.S.; Lee, Y.H.; Kim, O.J.; Kim, Y.J.; Chung, H.J. The Severity of Periodontitis and Metabolic Syndrome in Korean Population: The Dong-Gu Study. Journal of Periodontal Research 2018, 53, 362–368. [Google Scholar] [CrossRef] [PubMed]
- Lu, Y.; Egedeuzu, C.S.; Taylor, P.G.; Wong, L.S. Development of Improved Spectrophotometric Assays for Biocatalytic Silyl Ether Hydrolysis. Biomolecules 2024, 14, 492. [Google Scholar] [CrossRef] [PubMed]
- Xu, W.; Zhang, Z.; Hu, K.; Fang, P.; Li, R.; Kong, D.; Xuan, M.; Yue, Y.; She, D.; Xue, Y. Identifying Metabolic Syndrome Easily and Cost Effectively Using Non-Invasive Methods with Machine Learning Models. DMSO 2023, Volume 16, 2141–2151. [Google Scholar] [CrossRef]
- Chew, N.W.S.; Ng, C.H.; Tan, D.J.H.; Kong, G.; Lin, C.; Chin, Y.H.; Lim, W.H.; Huang, D.Q.; Quek, J.; Fu, C.E.; et al. The Global Burden of Metabolic Disease: Data from 2000 to 2019. Cell Metabolism 2023, 35, 414–428.e3. [Google Scholar] [CrossRef] [PubMed]
- Kassi, E.; Pervanidou, P.; Kaltsas, G.; Chrousos, G. Metabolic Syndrome: Definitions and Controversies. BMC Med 2011, 9, 48. [Google Scholar] [CrossRef] [PubMed]
- Choe, E.K.; Rhee, H.; Lee, S.; Shin, E.; Oh, S.-W.; Lee, J.-E.; Choi, S.H. Metabolic Syndrome Prediction Using Machine Learning Models with Genetic and Clinical Information from a Nonobese Healthy Population. Genomics Inform 2018, 16, e31. [Google Scholar] [CrossRef]
- Park, J.-E.; Mun, S.; Lee, S. Metabolic Syndrome Prediction Models Using Machine Learning and Sasang Constitution Type. Evidence-Based Complementary and Alternative Medicine 2021, 2021, 1–7. [Google Scholar] [CrossRef] [PubMed]
- Datta, S.; Schraplau, A.; Freitas Da Cruz, H.; Philipp Sachs, J.; Mayer, F.; Bottinger, E. A Machine Learning Approach for Non-Invasive Diagnosis of Metabolic Syndrome. In Proceedings of the 2019 IEEE 19th International Conference on Bioinformatics and Bioengineering (BIBE); IEEE: Athens, Greece, October 2019; pp. 933–940. [Google Scholar]
- Karimi-Alavijeh, F.; Jalili, S.; Sadeghi, M. Predicting Metabolic Syndrome Using Decision Tree and Support Vector Machine Methods. ARYA Atheroscler 2016, 12, 146–152. [Google Scholar] [PubMed]
- Behadada, O.; Abi-Ayad, M.; Kontonatsios, G.; Trovati, M. Automatic Diagnosis Metabolic Syndrome via a $$k-$$ Nearest Neighbour Classifier. In Green, Pervasive, and Cloud Computing; Au, M.H.A., Castiglione, A., Choo, K.-K.R., Palmieri, F., Li, K.-C., Eds.; Lecture Notes in Computer Science; Springer International Publishing: Cham, 2017; Volume 10232, pp. 627–637. ISBN 978-3-319-57185-0. [Google Scholar]
- Kim, J.; Mun, S.; Lee, S.; Jeong, K.; Baek, Y. Prediction of Metabolic and Pre-Metabolic Syndromes Using Machine Learning Models with Anthropometric, Lifestyle, and Biochemical Factors from a Middle-Aged Population in Korea. BMC Public Health 2022, 22, 664. [Google Scholar] [CrossRef] [PubMed]
|
Disclaimer/Publisher’s Note: The statements, opinions and data contained in all publications are solely those of the individual author(s) and contributor(s) and not of MDPI and/or the editor(s). MDPI and/or the editor(s) disclaim responsibility for any injury to people or property resulting from any ideas, methods, instructions or products referred to in the content. |
© 2024 by the authors. Licensee MDPI, Basel, Switzerland. This article is an open access article distributed under the terms and conditions of the Creative Commons Attribution (CC BY) license (https://creativecommons.org/licenses/by/4.0/).
