Preprint
Article

Comparitive Chloroplast Genomics of Nine Endangered Habenaria Species and Phylogenetic Relationship of Orchidaceae

Altmetrics

Downloads

97

Views

43

Comments

0

Submitted:

08 June 2024

Posted:

10 June 2024

You are already at the latest version

Alerts
Abstract
Habenaria, a member of Orchidaceae family is the cosmopolitan distributions, which has significant medicinal and ornamental values. Regardless of morphology and molecular data that have been studied in recent times, the phylogenetic relationship is still under debate. Here, we sequenced, assembled, and annotated the whole chloroplast (cp) genome of two species (Habenaria aitchisonii Rchb.f. and Habenaria tibetica Schltr.ex Limpricht) of Habenaria grown on the Qinghai-Tibetan Plateau (QTP), and combined with seven already published cp genomes which may assist to uncover their genomic profiling. The two genomes ranged from 155259-155269 bp in length and both encoded 132 genes, including 86 protein, 38 tRNA and 8 rRNA. In the cp genomes, the tandem repeats (797), SSRs (2195) and diverse loci (3214) were identified. Comparative analyses of codon usage, amino frequency, microsatellite, oligo repeats and transition and transversion substitutions showed similarities among the species. Moreover, we identified 16 highly polymorphic regions with nucleotide diversity above 0.02, which may be suitable for robust authentic barcoding and inferring in the phylogeny of Habenaria species. Among the polymorphic regions, positive selection was significantly exerted on the several genes such as cemA, petA, and ycf1. This may suggest that the important adaptation stratagem for two Habenaria species on the QTP. The phylogenetic relationship displayed that H.aitchisonii and H. tibetica have closer relationship than others and the rest seven species clustered in the other three groups. Our findings also supported the idea that Habenaria could be divided into different sections. This study enriched the genomics resources of Habenaria, which may be helpful for the conservation efforts of these endangered species.
Keywords: 
Subject: Biology and Life Sciences  -   Ecology, Evolution, Behavior and Systematics

1. Background

Habenarai (Orchidinae, Orchidoidea, Orchidaceae) is a large genus and has more than 891 species [1], which dispersed widely across the tropical, subtropical, temperate, and alpine regions in the world [2,3]. The genus had great ornamental value, but its tubers also had significant therapeutic properties that could be used to cure diuretics, swelling, waist strength and kidney, treating lumbago, and hernia [4,5,6]. Additionally, people frequently use it to cook meals to cure HIV/AIDs in several regions of Africa [7]. However, as the variation in the morphology, such as tuber, spurred lip, long column, U-shaped wide anther, long caudide, naked viscidium and free stigma [2,8], the new descriptions of Habenaria species are still going on [9,10,11,12], and the phylogenetics relationship in the genus is still on controversy [13,14,15].
Plastome occupied the quadripartite structure, which consisted of two inverted repeats (IRa and IRb), a large single-copy (LSC) and small single-copy (SSC) regions [16,17]. The size of their genomes ranged from 107kb to 218kb [17]. Like the nuclear genome, there also existed variations such as deletion, insertion, loss, and single nucleotide mutation in certain regions [18,19]. The polymorphism of the chloroplast genome displayed the evolution profiling of the paternal inheritance of the species and could be applied in population genetics, phylogenetics and barcoding for plants [20]. Due to the polymorphism of plastome, several studies have been performed to resolve taxonomic problems and their phylogenetic relationships with high resolution in Orchidaceae [19,21,22]. These studies could not only provide the information to resolve the taxonomic discrepancies of plant lineages, but also supply in-depth insight into the evolution of the plastomes [18,19,23].
Adaptive evolution reflects the adaptability of the species during the evolution process in which natural selection always acts on genetic variation, genetic recombination, and gene flow [24,25]. Therefore, exploring the selection character that species suffer in their evolutionary process is another hot spot in the chloroplast genome analyses. Yang et al (2002) showed that heterogeneity for the plastid matK and rbcL genes in different species of the family of mangrove genus [26]. In recent years, many studies detected positively selected chloroplast genes through checking Ka (non-synonymous substitution) and Ks (synonymous substitutions) [23,27,28].
Habenaria aitchisonii Rchb.f. and Habenaria tibetica Schltr.ex Limpricht belongs to Habenaria genus and grew on the QTP or adjacent region [3,11], especially the latter, which was the endemic endangered species only distributed in shrub meadow or alpine meadow. Ecological and biogeographical forces have a great impact on the chloroplast genome rate heterogeneity [26]. In general, substitution rates of cp genomes displayed minimal evolution [28]. Previous studies discovered that the positive selection could accelerate the Ka value, yet it does not affect the Ks value [29]. However, there is little known about the evolution and adaptation profiling of Habenaria species.
In this study, the two Habenaria species (H. aitchisonii and H. tibetica) grown on the QTP were sequenced through the next-generation Illumina platform. Combined with the 40 species of cp genomes of Orchidaceae, we aimed to: (1) compare the cp genome structure of species within the Habenaria genus; (2) construct the phylogeny of Habenaria species in Orchidaceae; (3) investigate selective or adaptive evolution in the cp genomes of Habenaria species.

2. Results

2.1. Chloroplast Genome of Habenaria aitchisonii and Habenaria tibetica

Habenaria aitchisonii and Habenaria tibetica chloroplast genomes were sequenced with the Illumina sequencing platform and the two genomes were obtained 155, 259 bp (GenBank accession number: OQ701055) and 155, 269 bp (GenBank accession number: OQ701056) in length, respectively. Both species occupied the typical quadripartite structures (Figure 1a and 1b), in which the IRs were separated by the SSC and LSC regions. The LSC regions had lengths of 84,234bp and 84,143bp in H.aitchisonii and H.tibetica respectively and displayed 91bp constriction in the H.tibetica, furthermore the SSC regions were 17,643bp and 17,646bp in H.aitchisonii and H.tibetica respectively and expended 3bp in the later. Similarly, the IR regions appeared 49bp expansion in the H.tibetica as well. The cp genomes of both species encoded 132 genes, including 86 proteins, 38 tRNA and 8 rRNA. Among them, we found 20 genes duplicated in IR regions, including 4RNA gene (rrn16, rrn23, rrn4.5 and rrn5), 7 tRNA gene (trnA-UGC, trnH-GUG, trnI-CAU, trnL-CAA, trnN-GUU, trnR-ACG and trnV-GAC) and 8 protein-coding genes (ndhB, rpl2, rpl23, rps12, rps19, rps7, ycf1 and ycf2). In addition, and 17 genes had one intron and 1 had two introns (Clp P) (Table S1 and Table 1). The ycf1 gene was also observed truncated at the junction of IR/SSC with a function copy (Figure 1). The GC content was quite similar between the two species (36.83 % and 36.84%). However, the IR region had the highest GC content (42.91% to 42.86%), the SSC regions had the least GC content (29.38% to 29.40%).

2.2. Comparation of Plastome Features of the Habenaria Genus

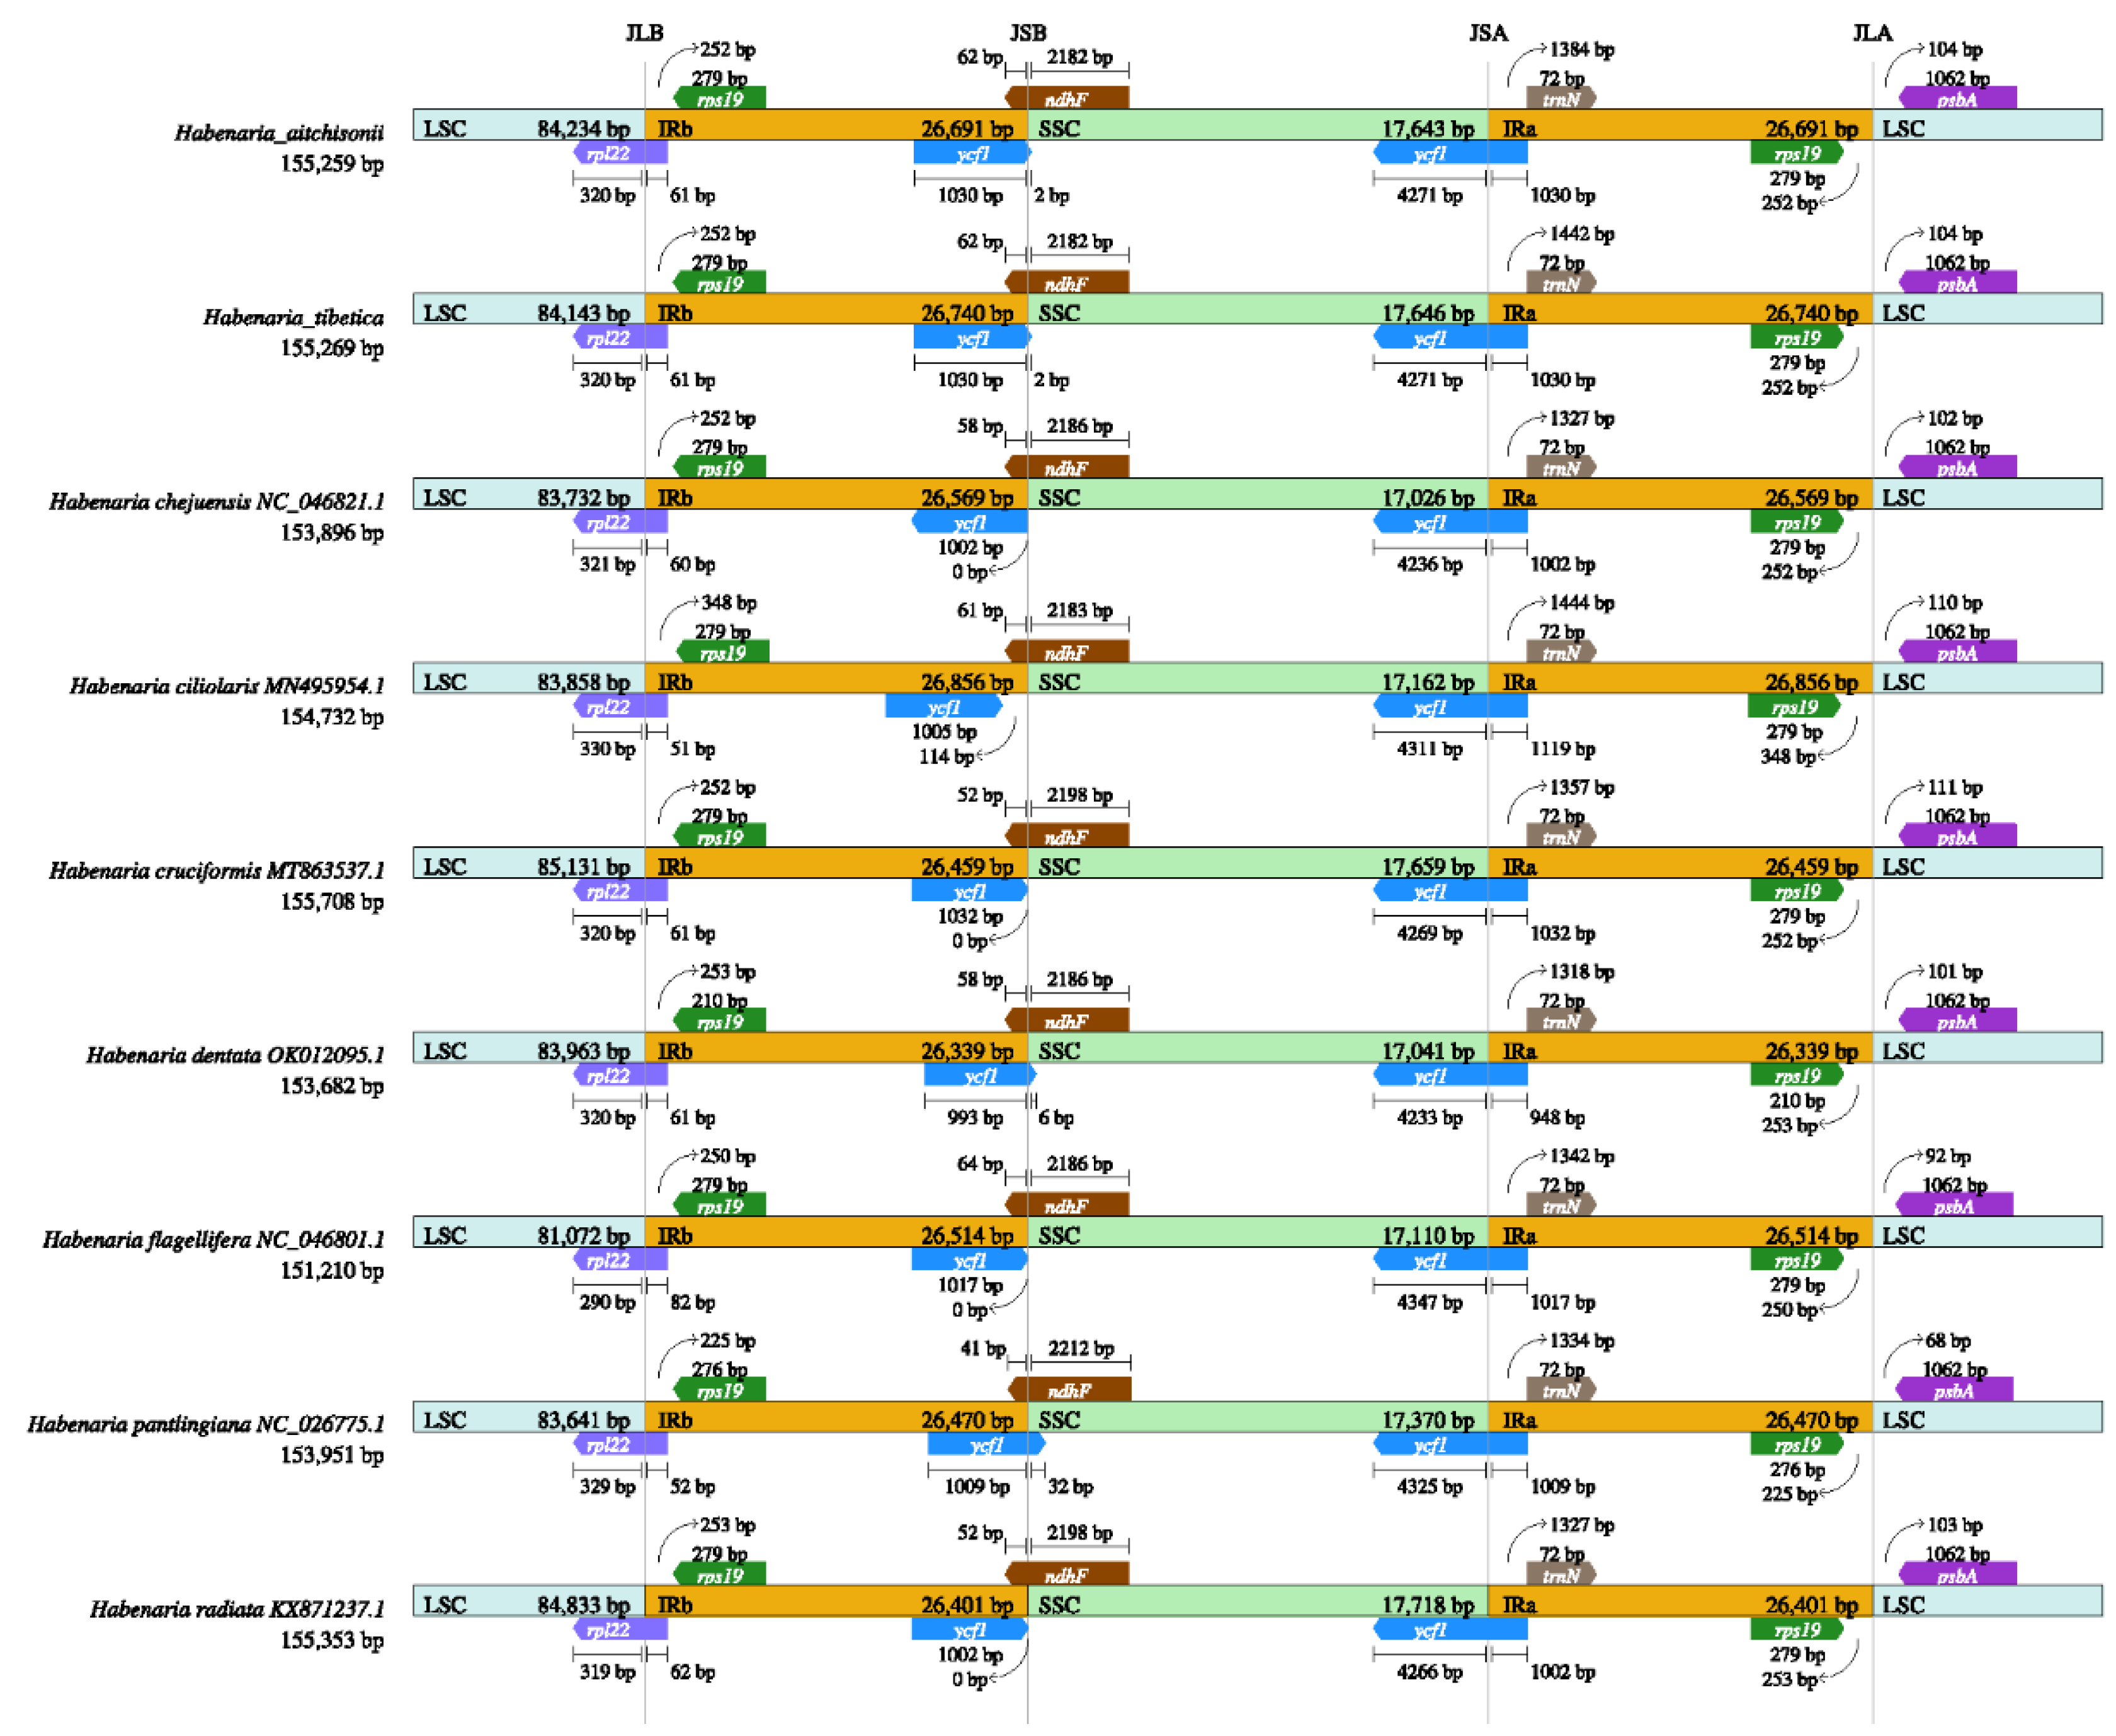
To know about the cp genome feature of the Habenaria genus, we compared the H. aitchisonii and H. tibetica with the other seven species. It appeared that the plastome structure of all the species was very conserved (Figure 2; Table S1). Complete plastome sizes ranged from 151,210bp (H. flagellifera) to 155,708bp (H. cruciformis), the LSC length from 81,072bp (H. flagellifera) to 85,131bp (H. cruciformis), IR region length from 26,399bp (H. dentata) to 26,856bp (H. ciliolaris); SSC length from 17,026bp (H. chejuensis) to 17,718bp (H. radiata) (Figure 2, Table 1). Moreover, the GC content of all plastome ranged from 36.60% to 37.90%. ‘
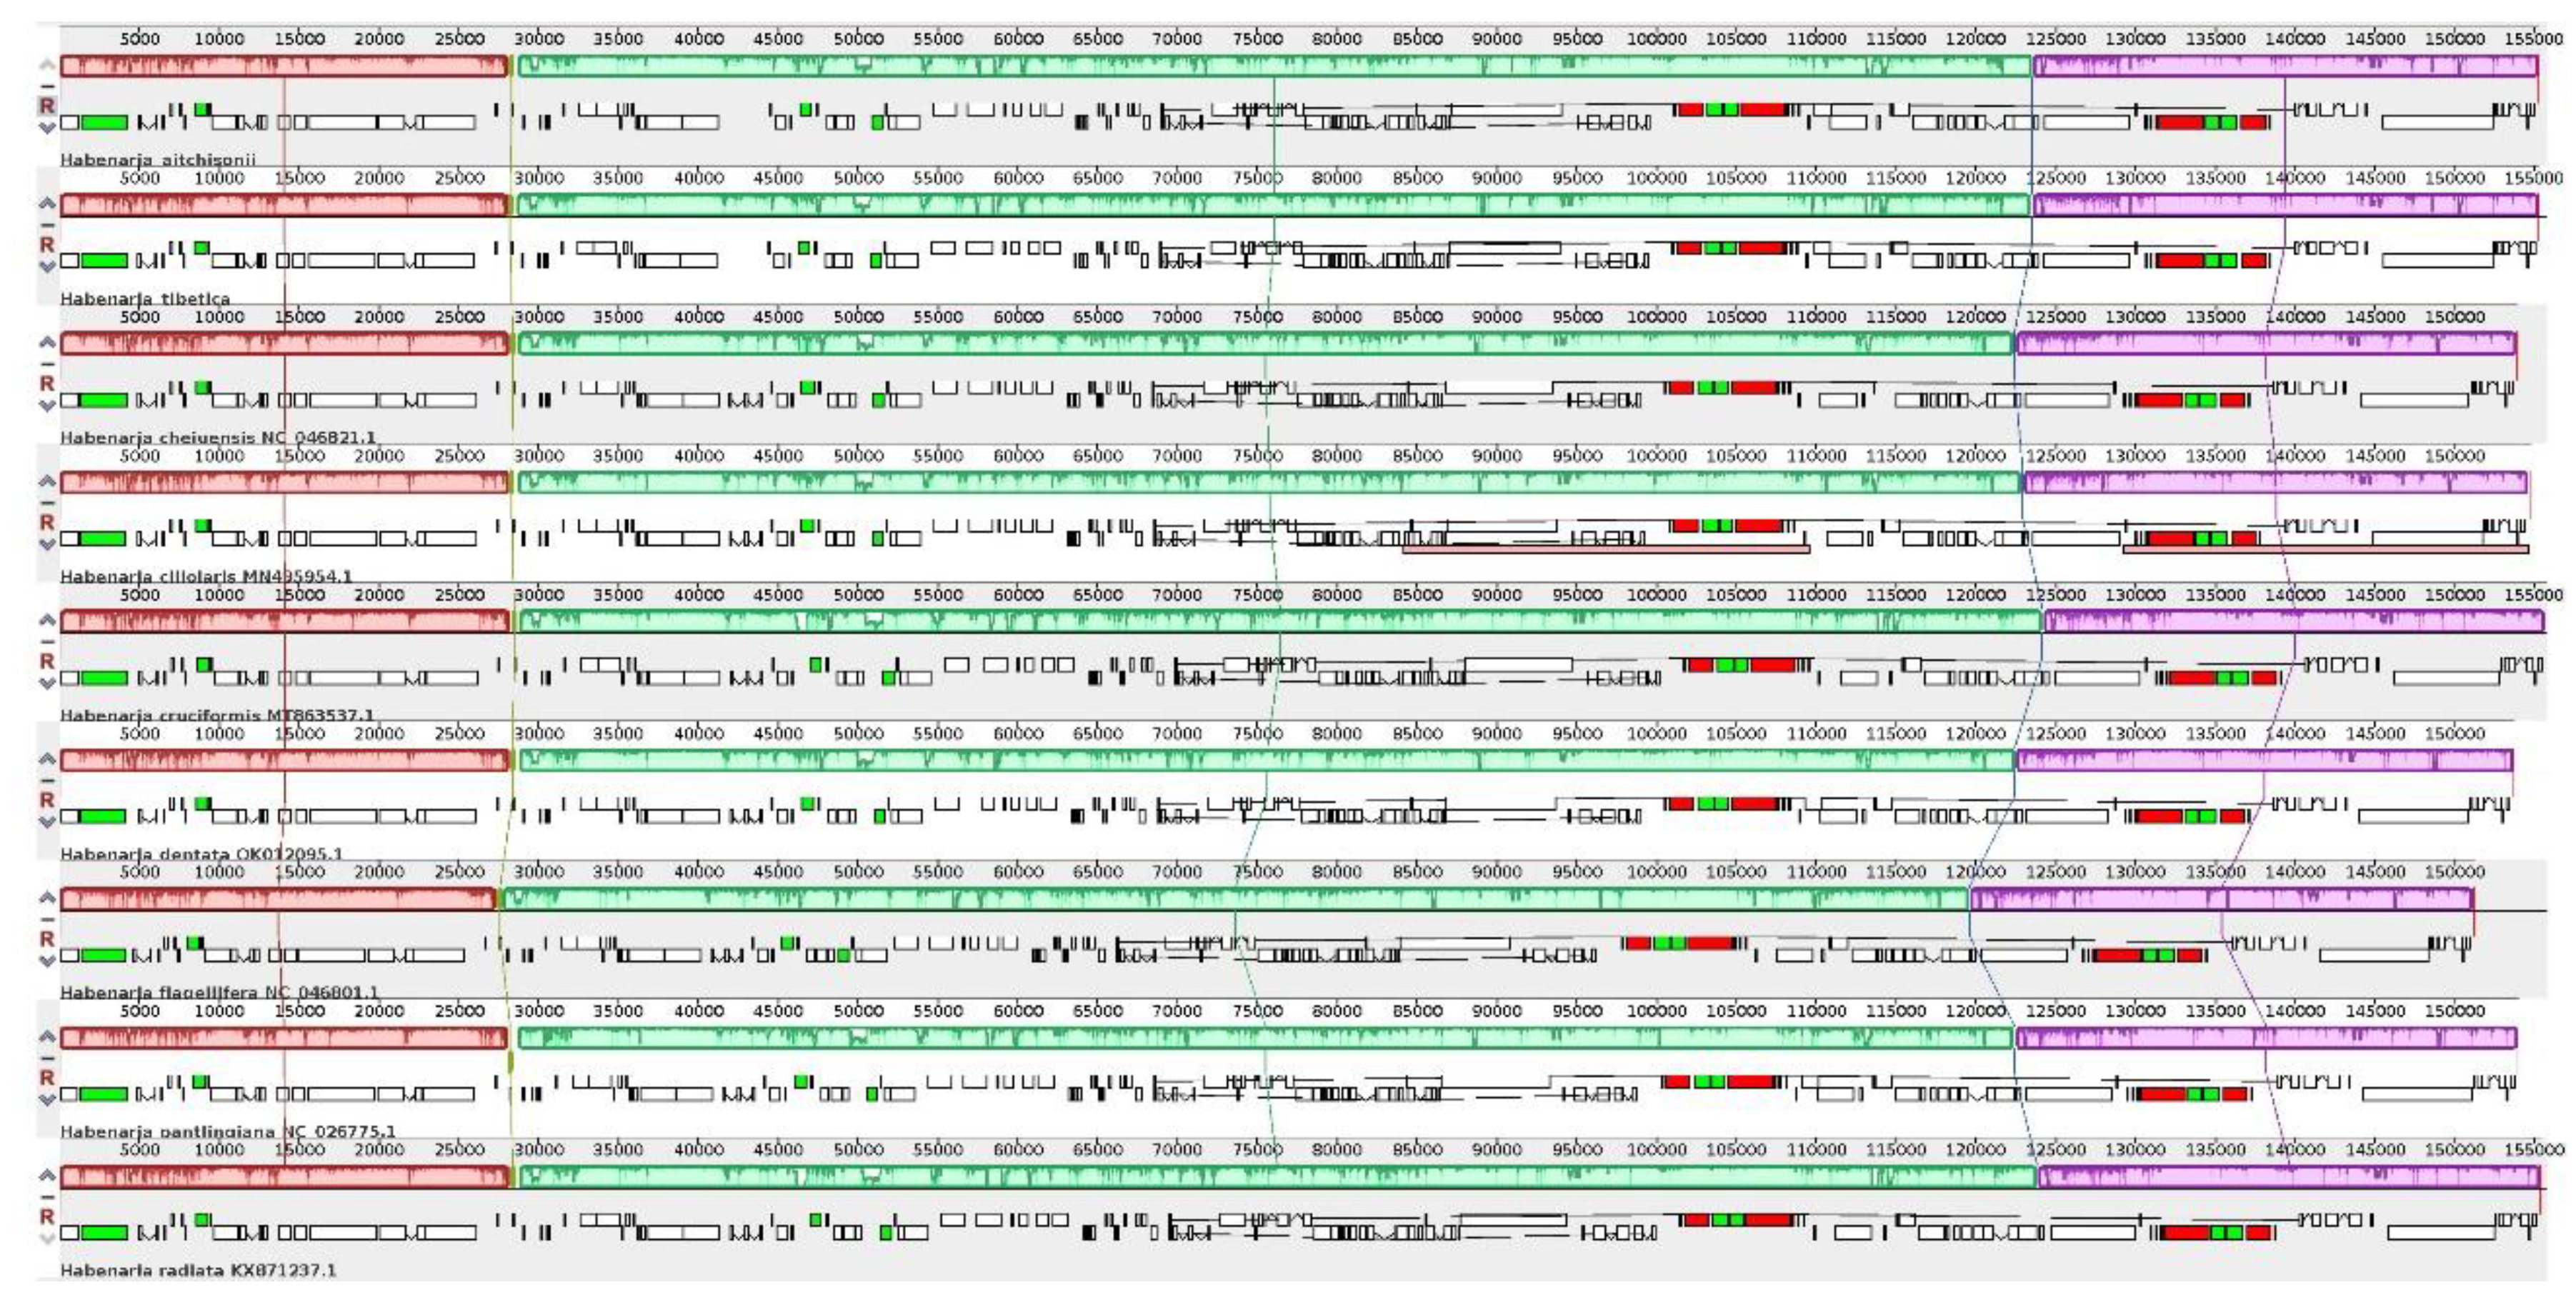
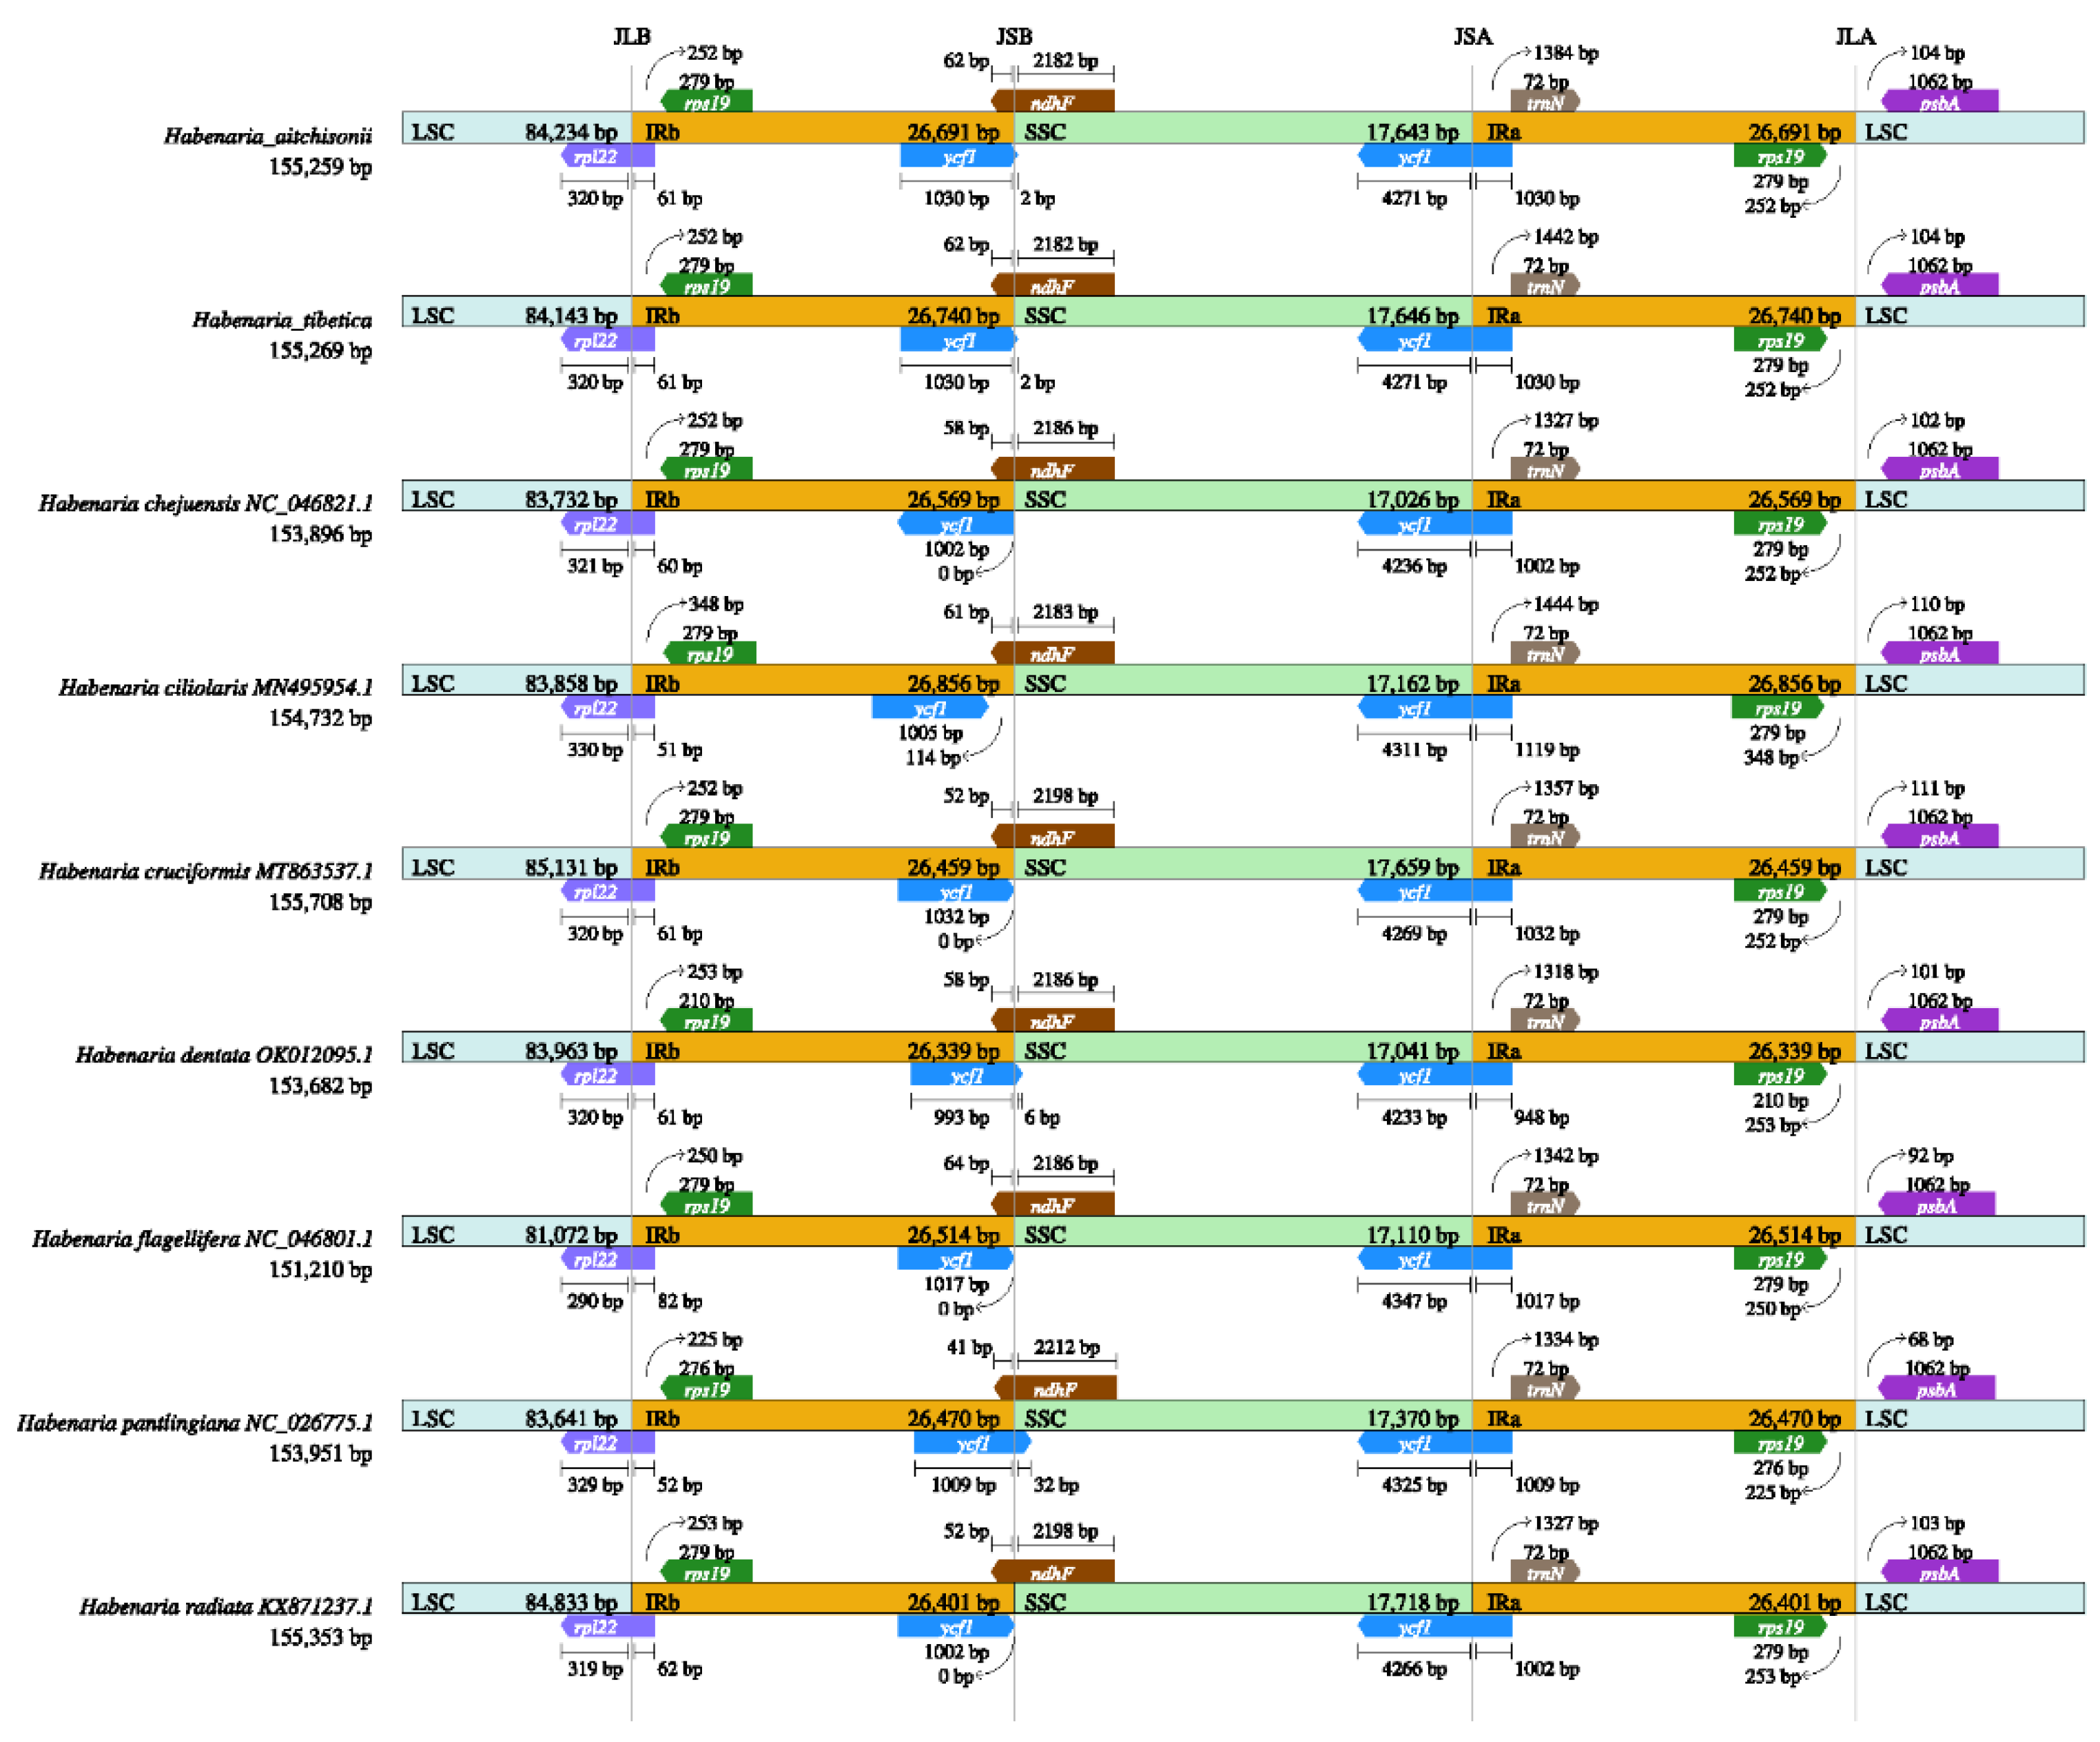
Mauve-based analysis showed similarity in gene arrangement and gene content in the Habenaria genus (Figure 2). The rearrangement of genes did not happen in the nine plastomes and the differences appeared in the intron-contained RNA regions. All plastomes displayed similarity among the LSC/IRb and SSC/IRa junctions (Figure 3). rpl22 and ycf1 existed in the junction region, respectively. However, at the IRb and SSC junctions exhibited a bit of difference, In H. pantling plastome ycf1 clearly covered the junction’s region and others close to the junction regions. Interestingly, the ycf1 gene displayed inverted in the plastome in H. chejuensis (Figure 3).

2.3. Relative Synonymous Codon usage and Amino Acid Frequency

RSCU frequency plays an important role in reflecting mutation bias during evolution. To know the codon usage and amino acid frequency, RSCU and amino acid frequency were analyzed in the plastomes. H. aitchisonii and H. tibetica had 79,767bp and 79,749bp protein-coding genes, respectively. The two plastomes had similar RSCU frequencies (Figure S1 and Table S2). Among the protein-coding genes, Leucine was the most abundant amino acid (10.35% and 10.34%). The Serine (7.91% and 7.09%) and Arginine (5.96% and 5.95%) were the second and third places. Whereas only 461 (1.73%) encoded tryptophan, which is the least frequent amino acid (Figure S1 and Table S2). There were 29 and 28 codons displayed clearly biased usage (RSCU>1) in H. aitchisonii and H. tibetica, respectively. However, the tryptophan seems no biased usage in both species (RSCU=1) (Table S2). Further, codons usage appeared bias in H. aitchisonii and H. tibetica compared with other species (Figure 4; Table S3). The results displayed that the four parameters involved in codon usage bias were a bit higher than other seven Habenaria species, Goodyera, Anoetochilus and Vanilla, while the CAI and CBI appeared the lower (Figure 4).

2.4. Analysis of Microsatellites and Oligonucleotide Repeats

A total of 233 SSRs and 232 SSRs were identified in the plastome of H. aitchisonii and H. tibetica, respectively. Among them, 136 SSRs (58.40%) existed in the LSC region, 52 SSRs (22.30%) in the IR region and 45 SSRs (19.30%) in the SSC region in the former. Similarly, there were 134 SSRs (57.80%), 46 SSRs (19.80%) and 52 SSRs (22.40%) in LSC, IR and SSC regions in the latter, respectively (Table S4a). In both species, 99 SSRs appeared in the intergenic region.
To know about the SSRs in the Habenaria genus, we compared all 2195 SSRs in the nine species.The mononucleotide, dinucleotide, trinucleotide, tetranucleotide, pentanucleotide, and hexanucleotide of these SSRs accounted for 67.26, 5.65, 27.43, 1.82, 0.68 and 0.23%, respectively. In all 27 types of SSRs, the A/T was the largest group, AAG/CTT types and AAT/ATT were the second and third group (Figure 5a). In the nine species, H. pantlingiana had more unique types (4), H. flagellifera had 3, H. chejenensis and H. radiata had one. The rest of the species appeared no unique SSR type.
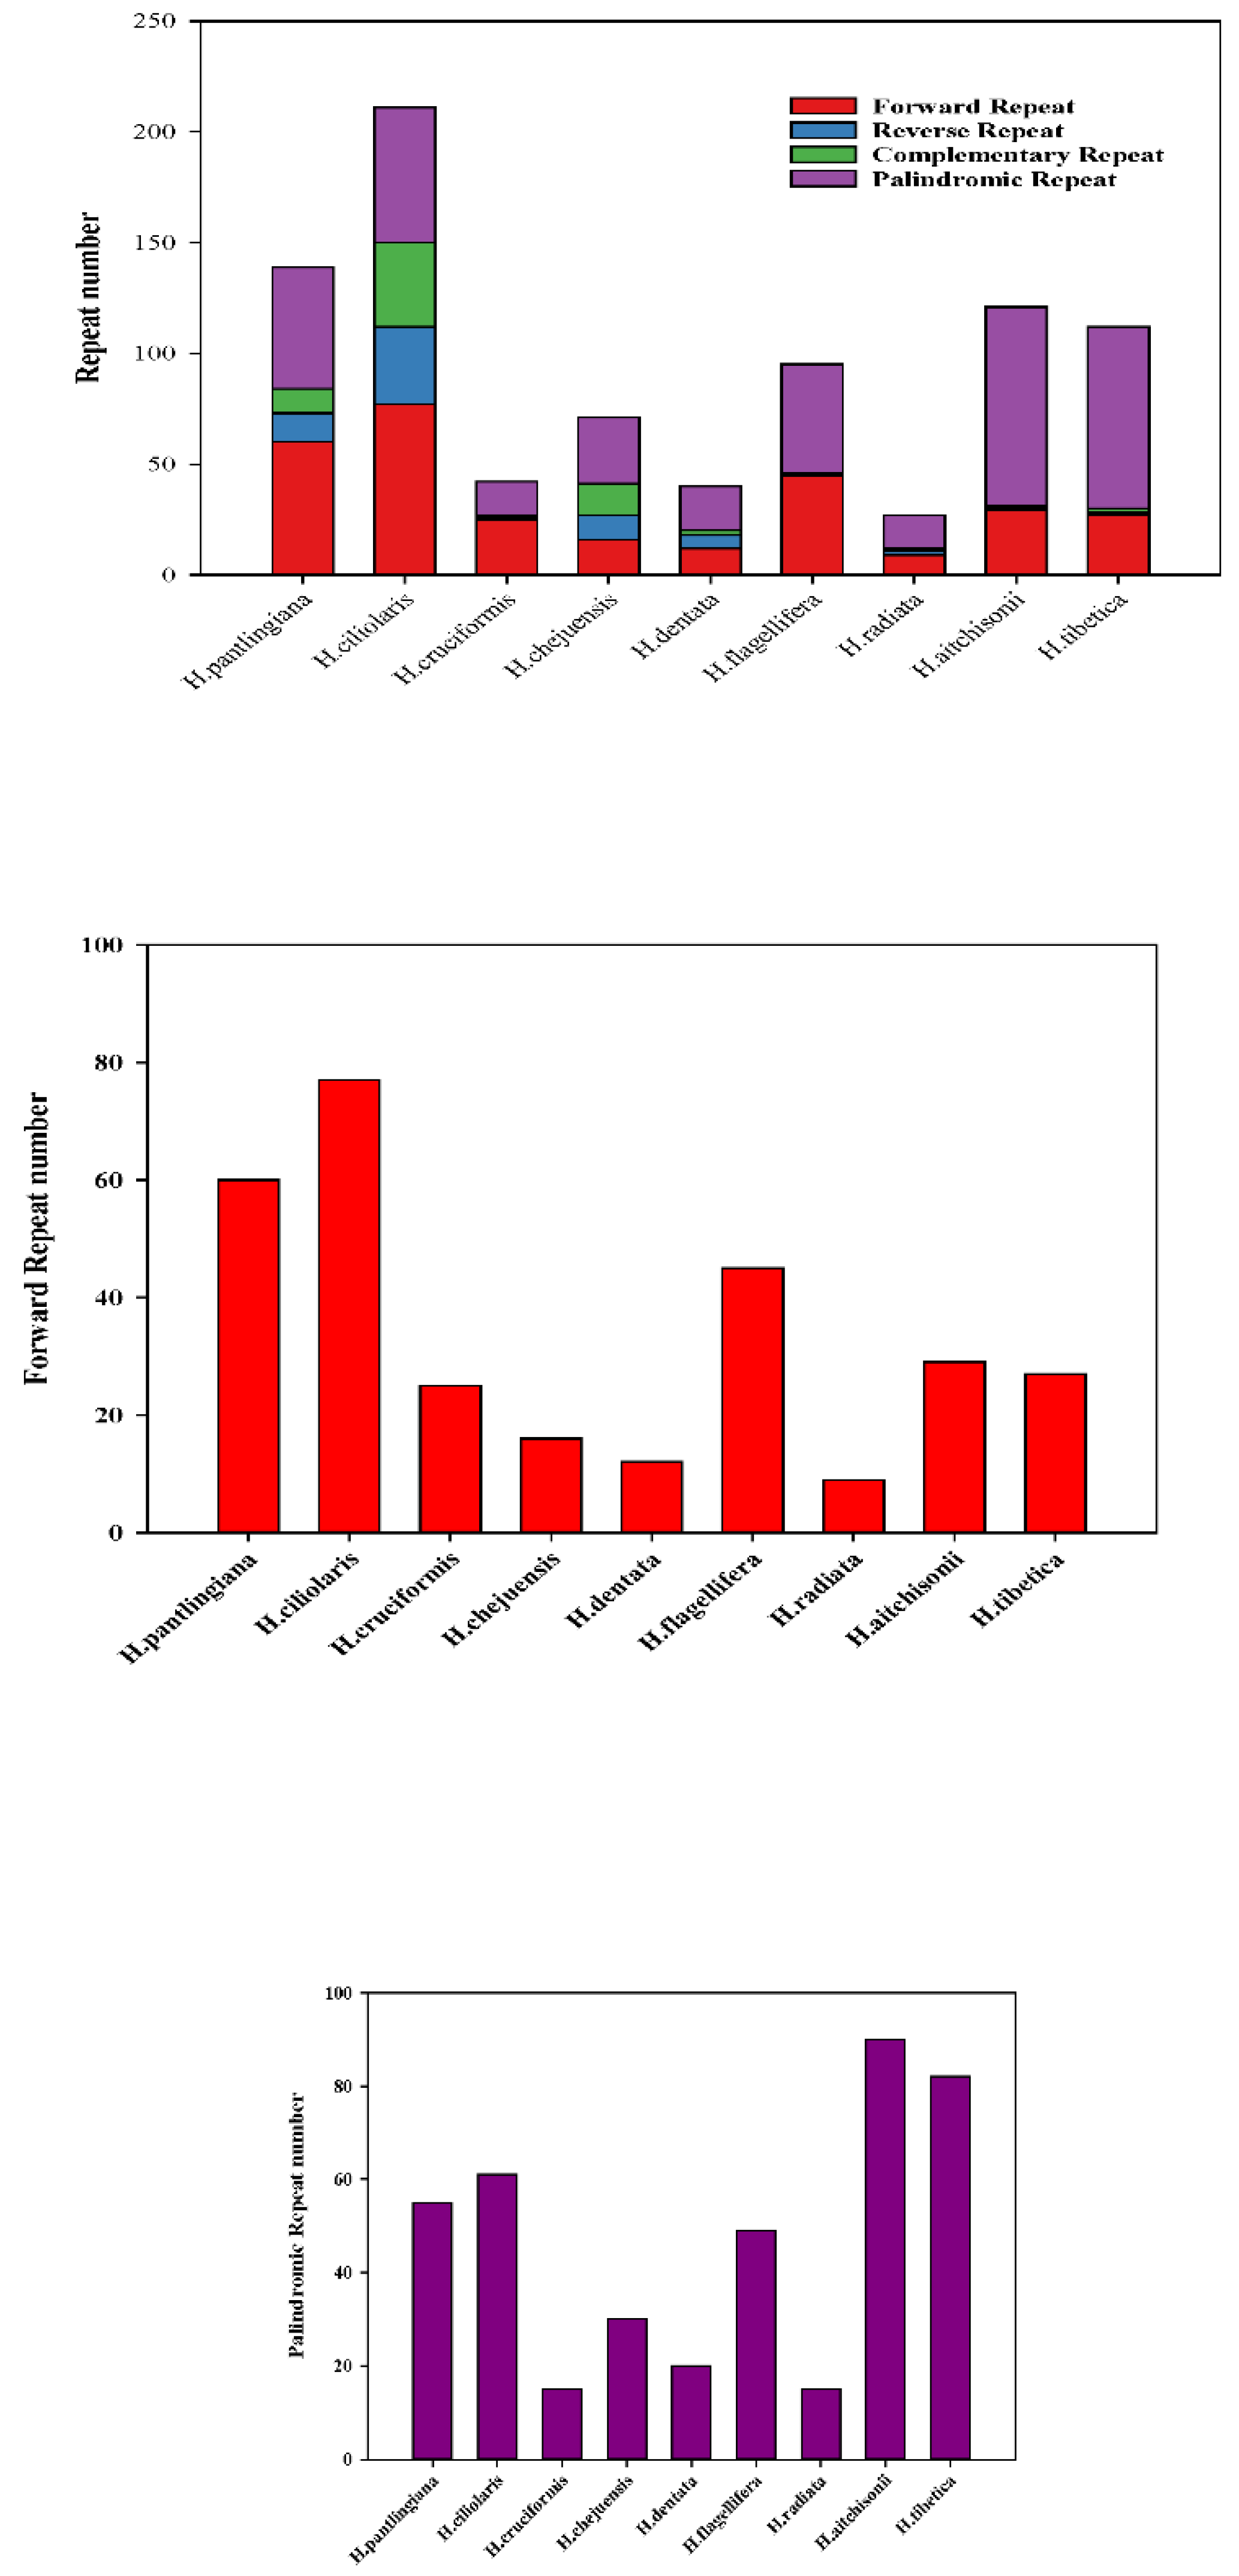
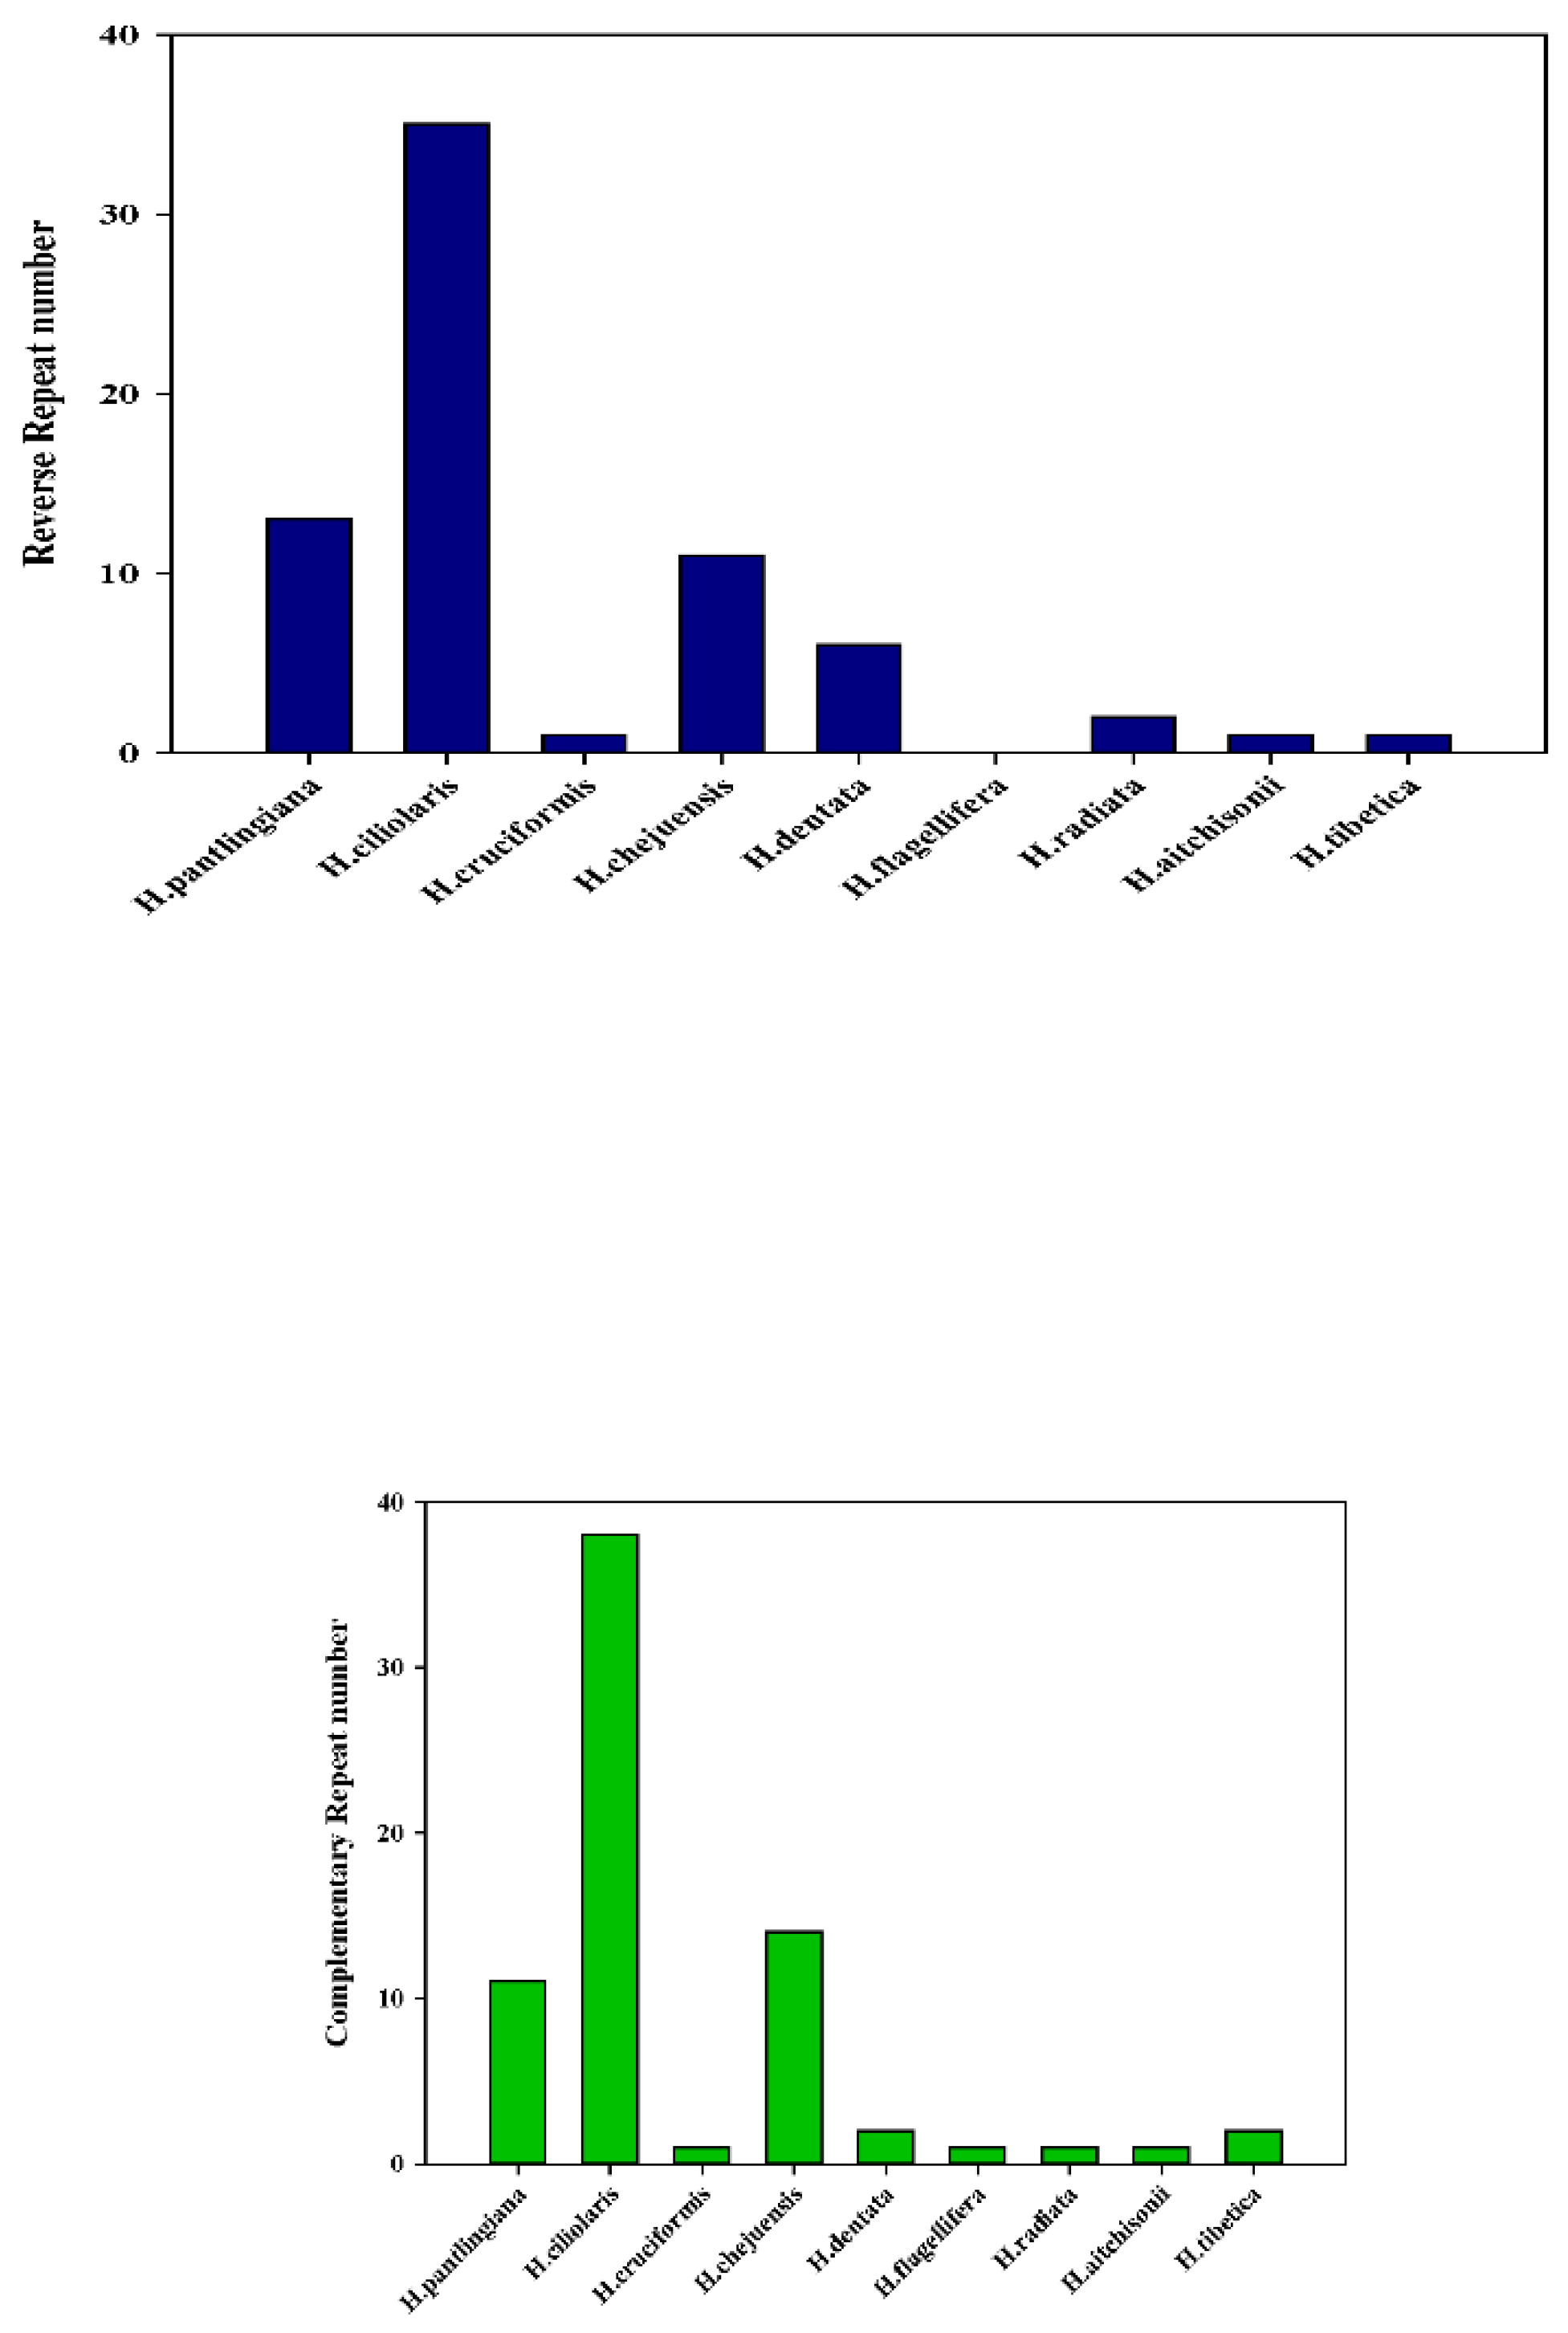
To compare the oligonucleotide repeats in all nine species, we applied the REPuter software. As Figure 5b shows, the total number showed clearly different among the nine plastomes (Table S4b). H.ciliolaris had the most repeats(211) than others while the H. radiata had the least (26) (Figure 5b-a). At the same time, H. ciliolaris had the most forward repeats (77) while the H. radiata had the least (9) (Figure 5b-b). In the reverse repeat(5b-c), H. ciliolaris had the largest number (35) while H. flagellifera had none. In the palindromic repeat, H. aitchisonii and H. tibetica are the first and second largest, respectively. While the H. cruciformis and H. radiata had the least (Figure 5b-d). In the complementary repeat, four species (H. cruciformis, H. flagellifera, H. radiata and H. aitchisonii) had one and H. ciliolaris had the most (38) (Figure 5b-e).

2.5. Identification of Polymorphic Loci

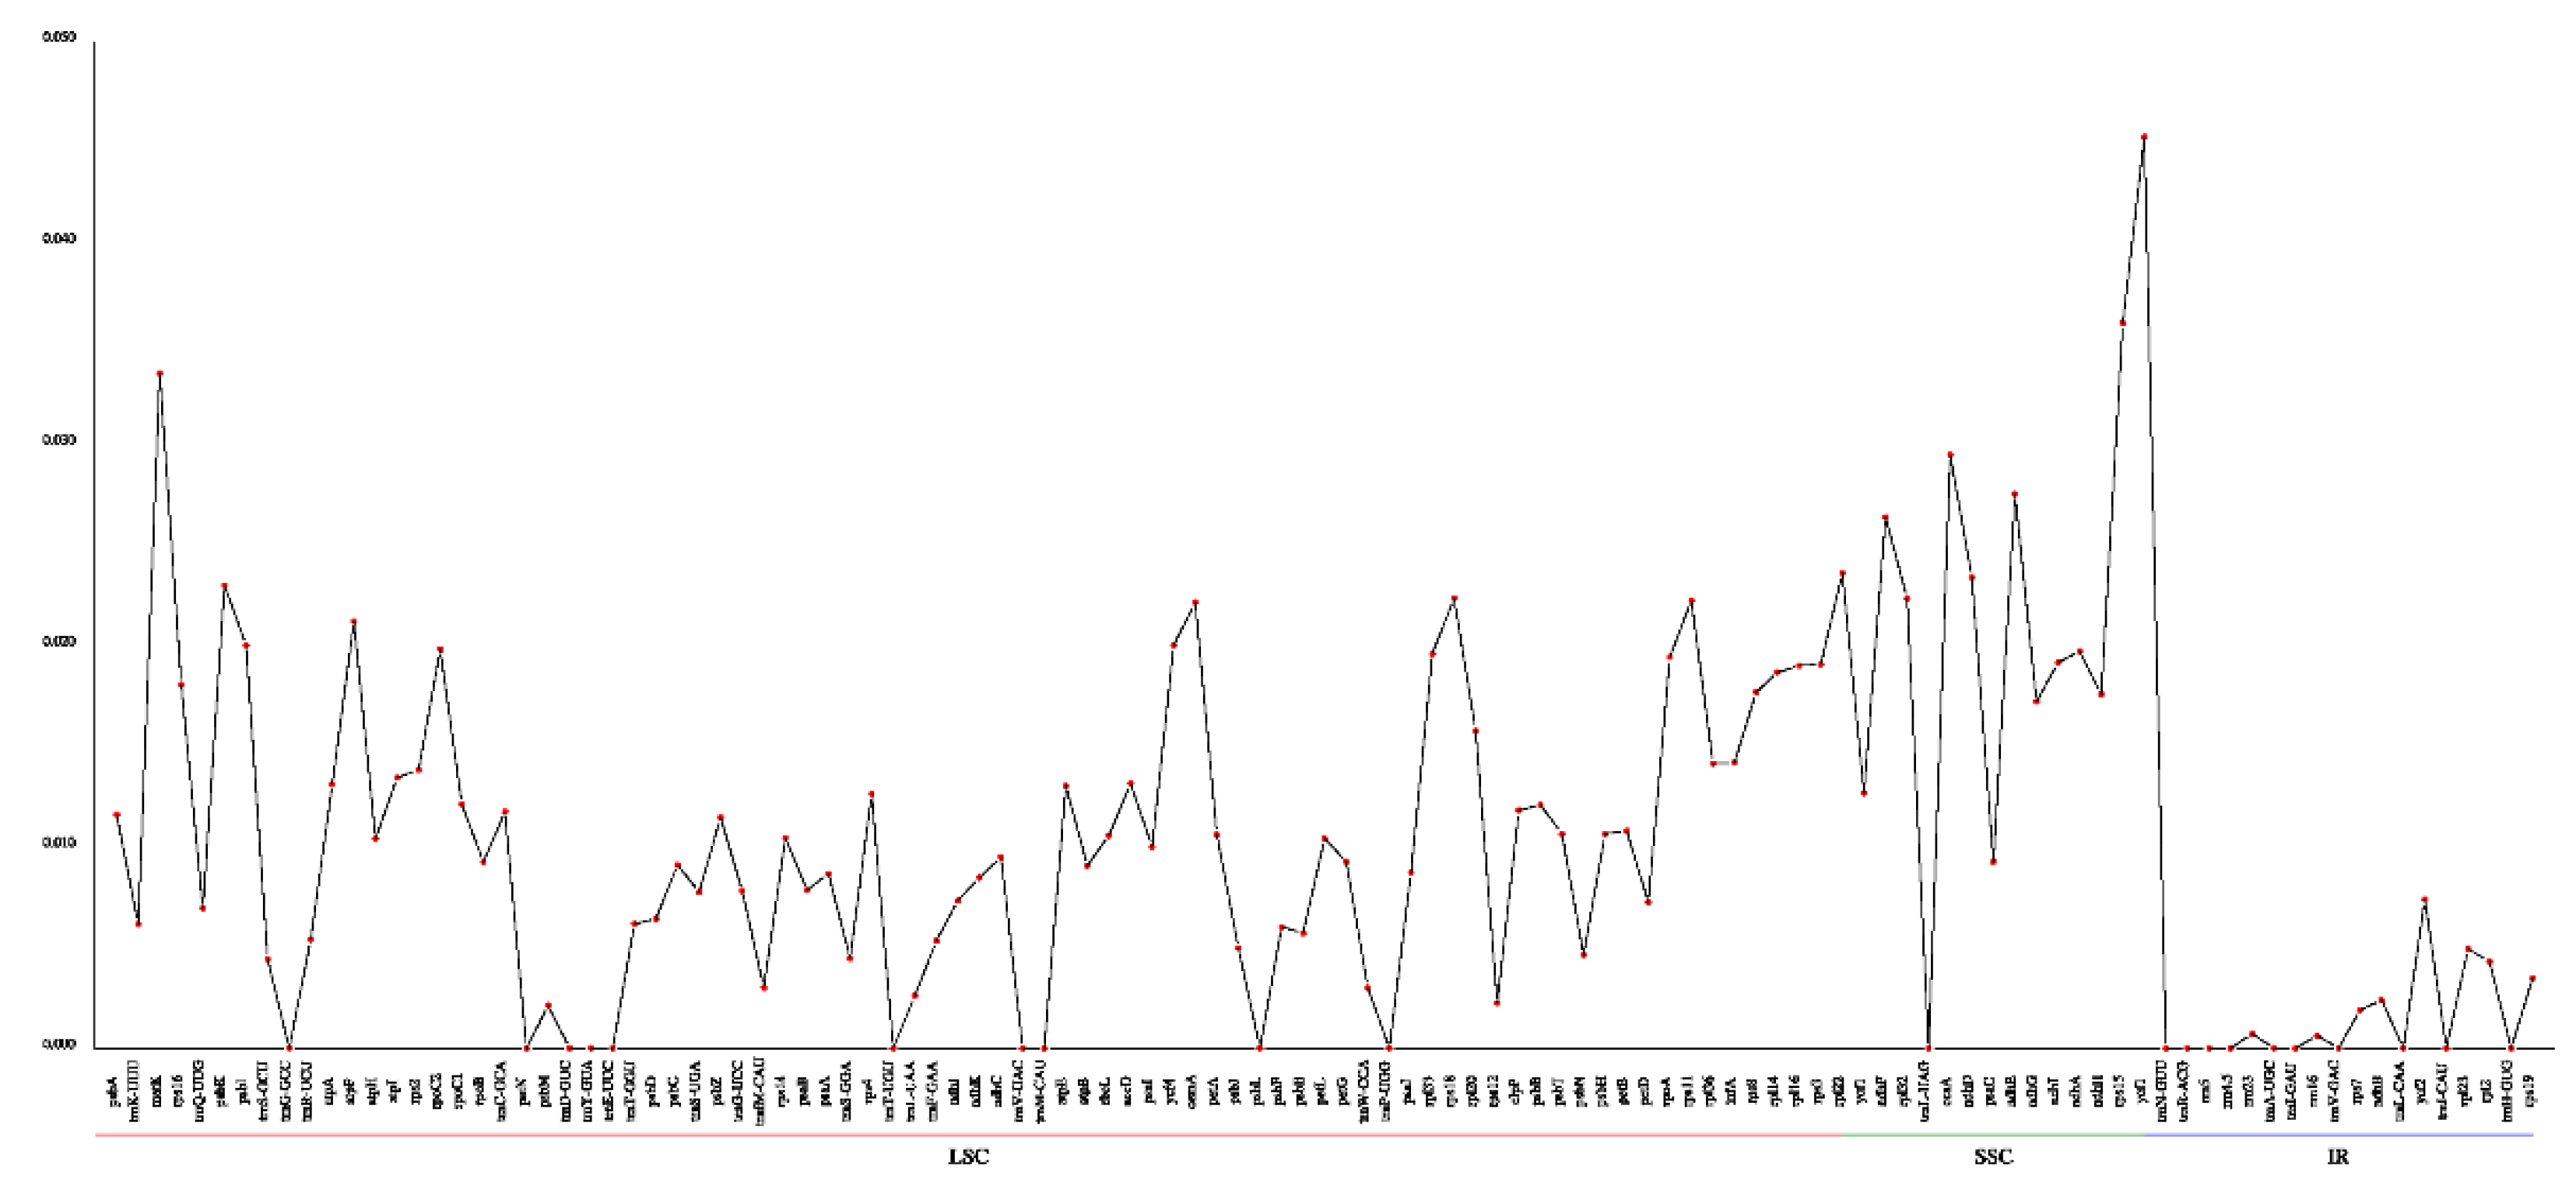
To understand the nucleotide polymorphic profiling, the cp genomes of nine Habenaria species were analyzed with DnaSP software. As Figure 6 showed, LSC, SSC and IR regions exhibited clearly differences in polymorphic loci. In the IR region, the Pi value changed a bit and the value ranged from 0-0.0074, with an average 0.0001431. The highest polymorphism appeared in SSC regions with an average value 0.021857. The highest Pi value was 0.04527(ycf1). The LSC region had the highest Pi value larger than 0.0001431, despite the average value being 0.010343(Figure 6; Table S5).

2.6. Molecular Evolution Analysis

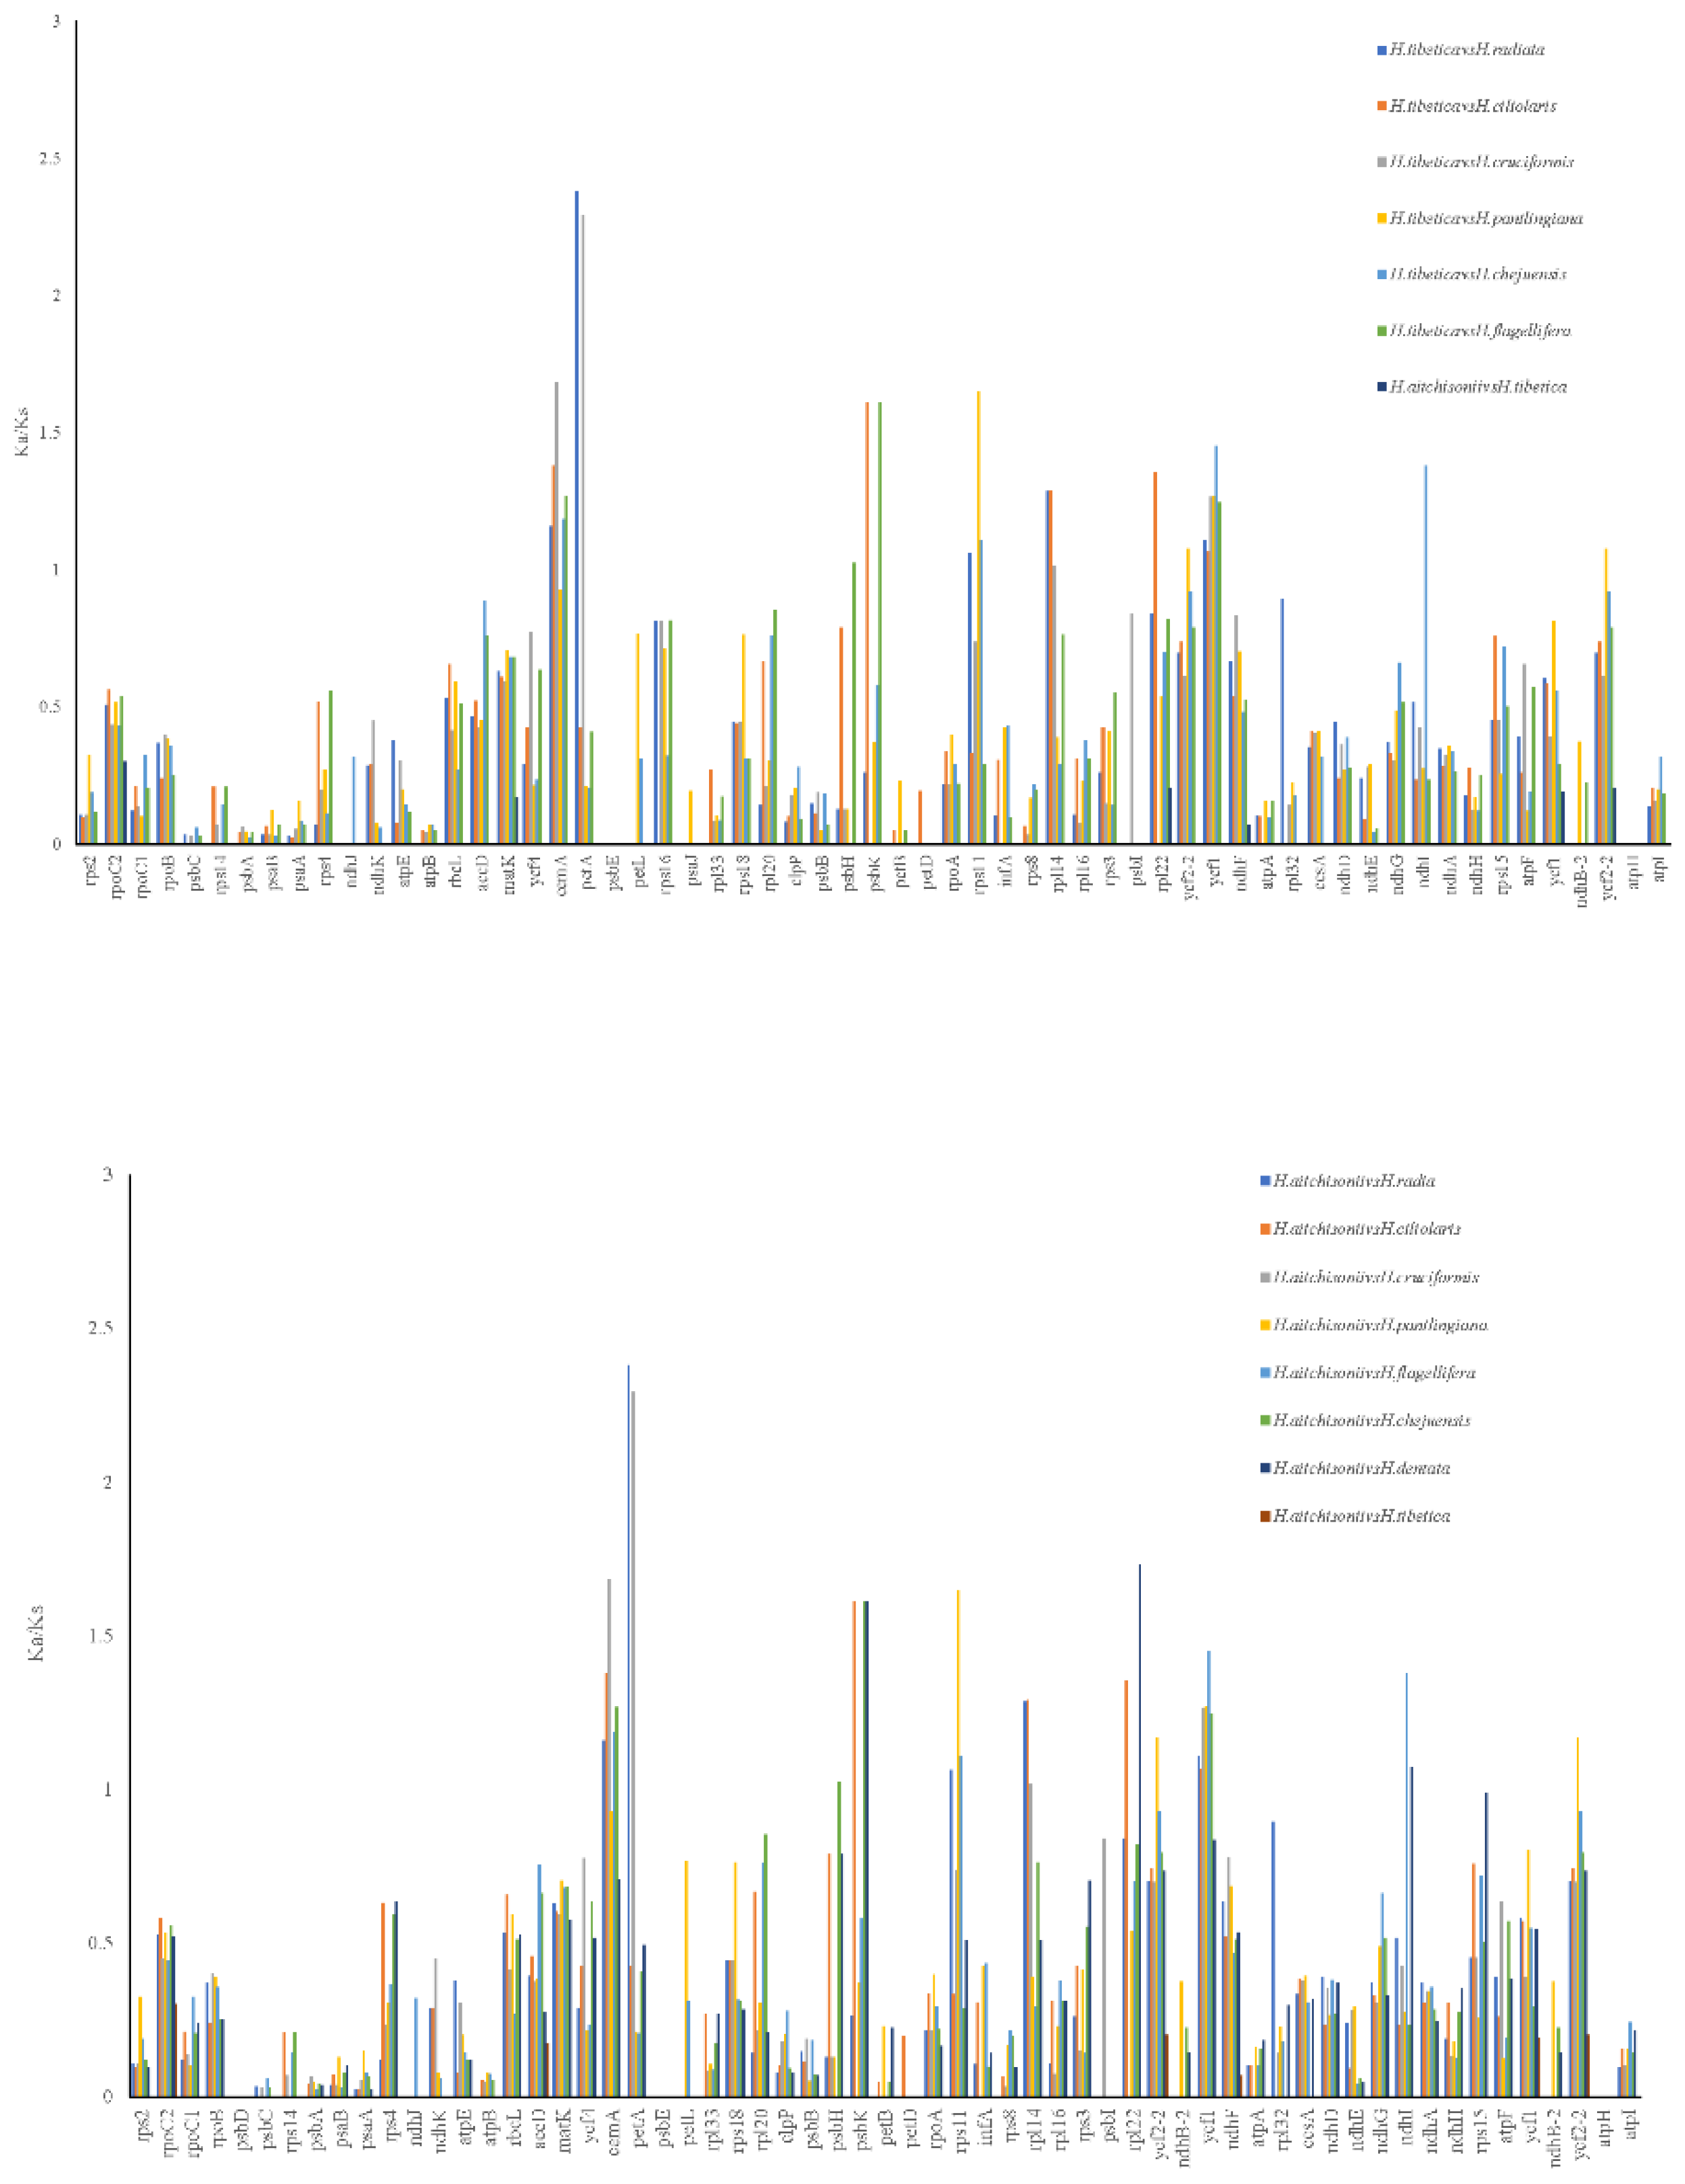
The pairwise Ka/Ks were analyzed in nine species of Habenaria (Figure 7), which reflected the selected pressure on the sequences. H.aitchisonii and H.tibetica species displayed no positive sites (Ka/Ks>1) or neutral sites (Ka/Ks=1). Only six genes exhibited purified pressure and most genes had no changes in Ka or Ks (Table S6). However, either H. aitchisonii and H. tibetica and other species in Habenaria could calculate 3, 4 or 5 genes suffering the positive selection. These genes included cemA, petA, rps11, rpl14, ycf1, psbK, rpl22, ycf2, ycf2-2, psbH, and ndhⅠ (Table S6). To check the positive selection genes of Habenaria, the cemA, petA, rps11, rpl14, ycf1, psbK, rpl22, ycf2, ycf2-2, psbH, and ndhⅠ were analyzed in the H. aitchisonii and H.tibetica branch and other close related species(Table S7), all the genes had no significant posterior probabilities on the H. aitchisonii and H. tibetica branch(Table S4).However, six genes petA, rps11, ndhⅠ, rpl22, ycf1 and ycf2 displayed the sites with positive selection in the BEB test. Among them petA, ndhⅠ, rpl22, ycf1 and ycf2 had more than one positive selective site. Moreover, two sites appeared ndhⅠ, rpl22, ycf1 and ycf2 genes on the H. aitchisonii and H. tibetica branch (Table 2; Table S7). These results suggested that the two species had suffering the adaptation evolution on the QTP.

2.7. Phylogenetic Relationship Analysis

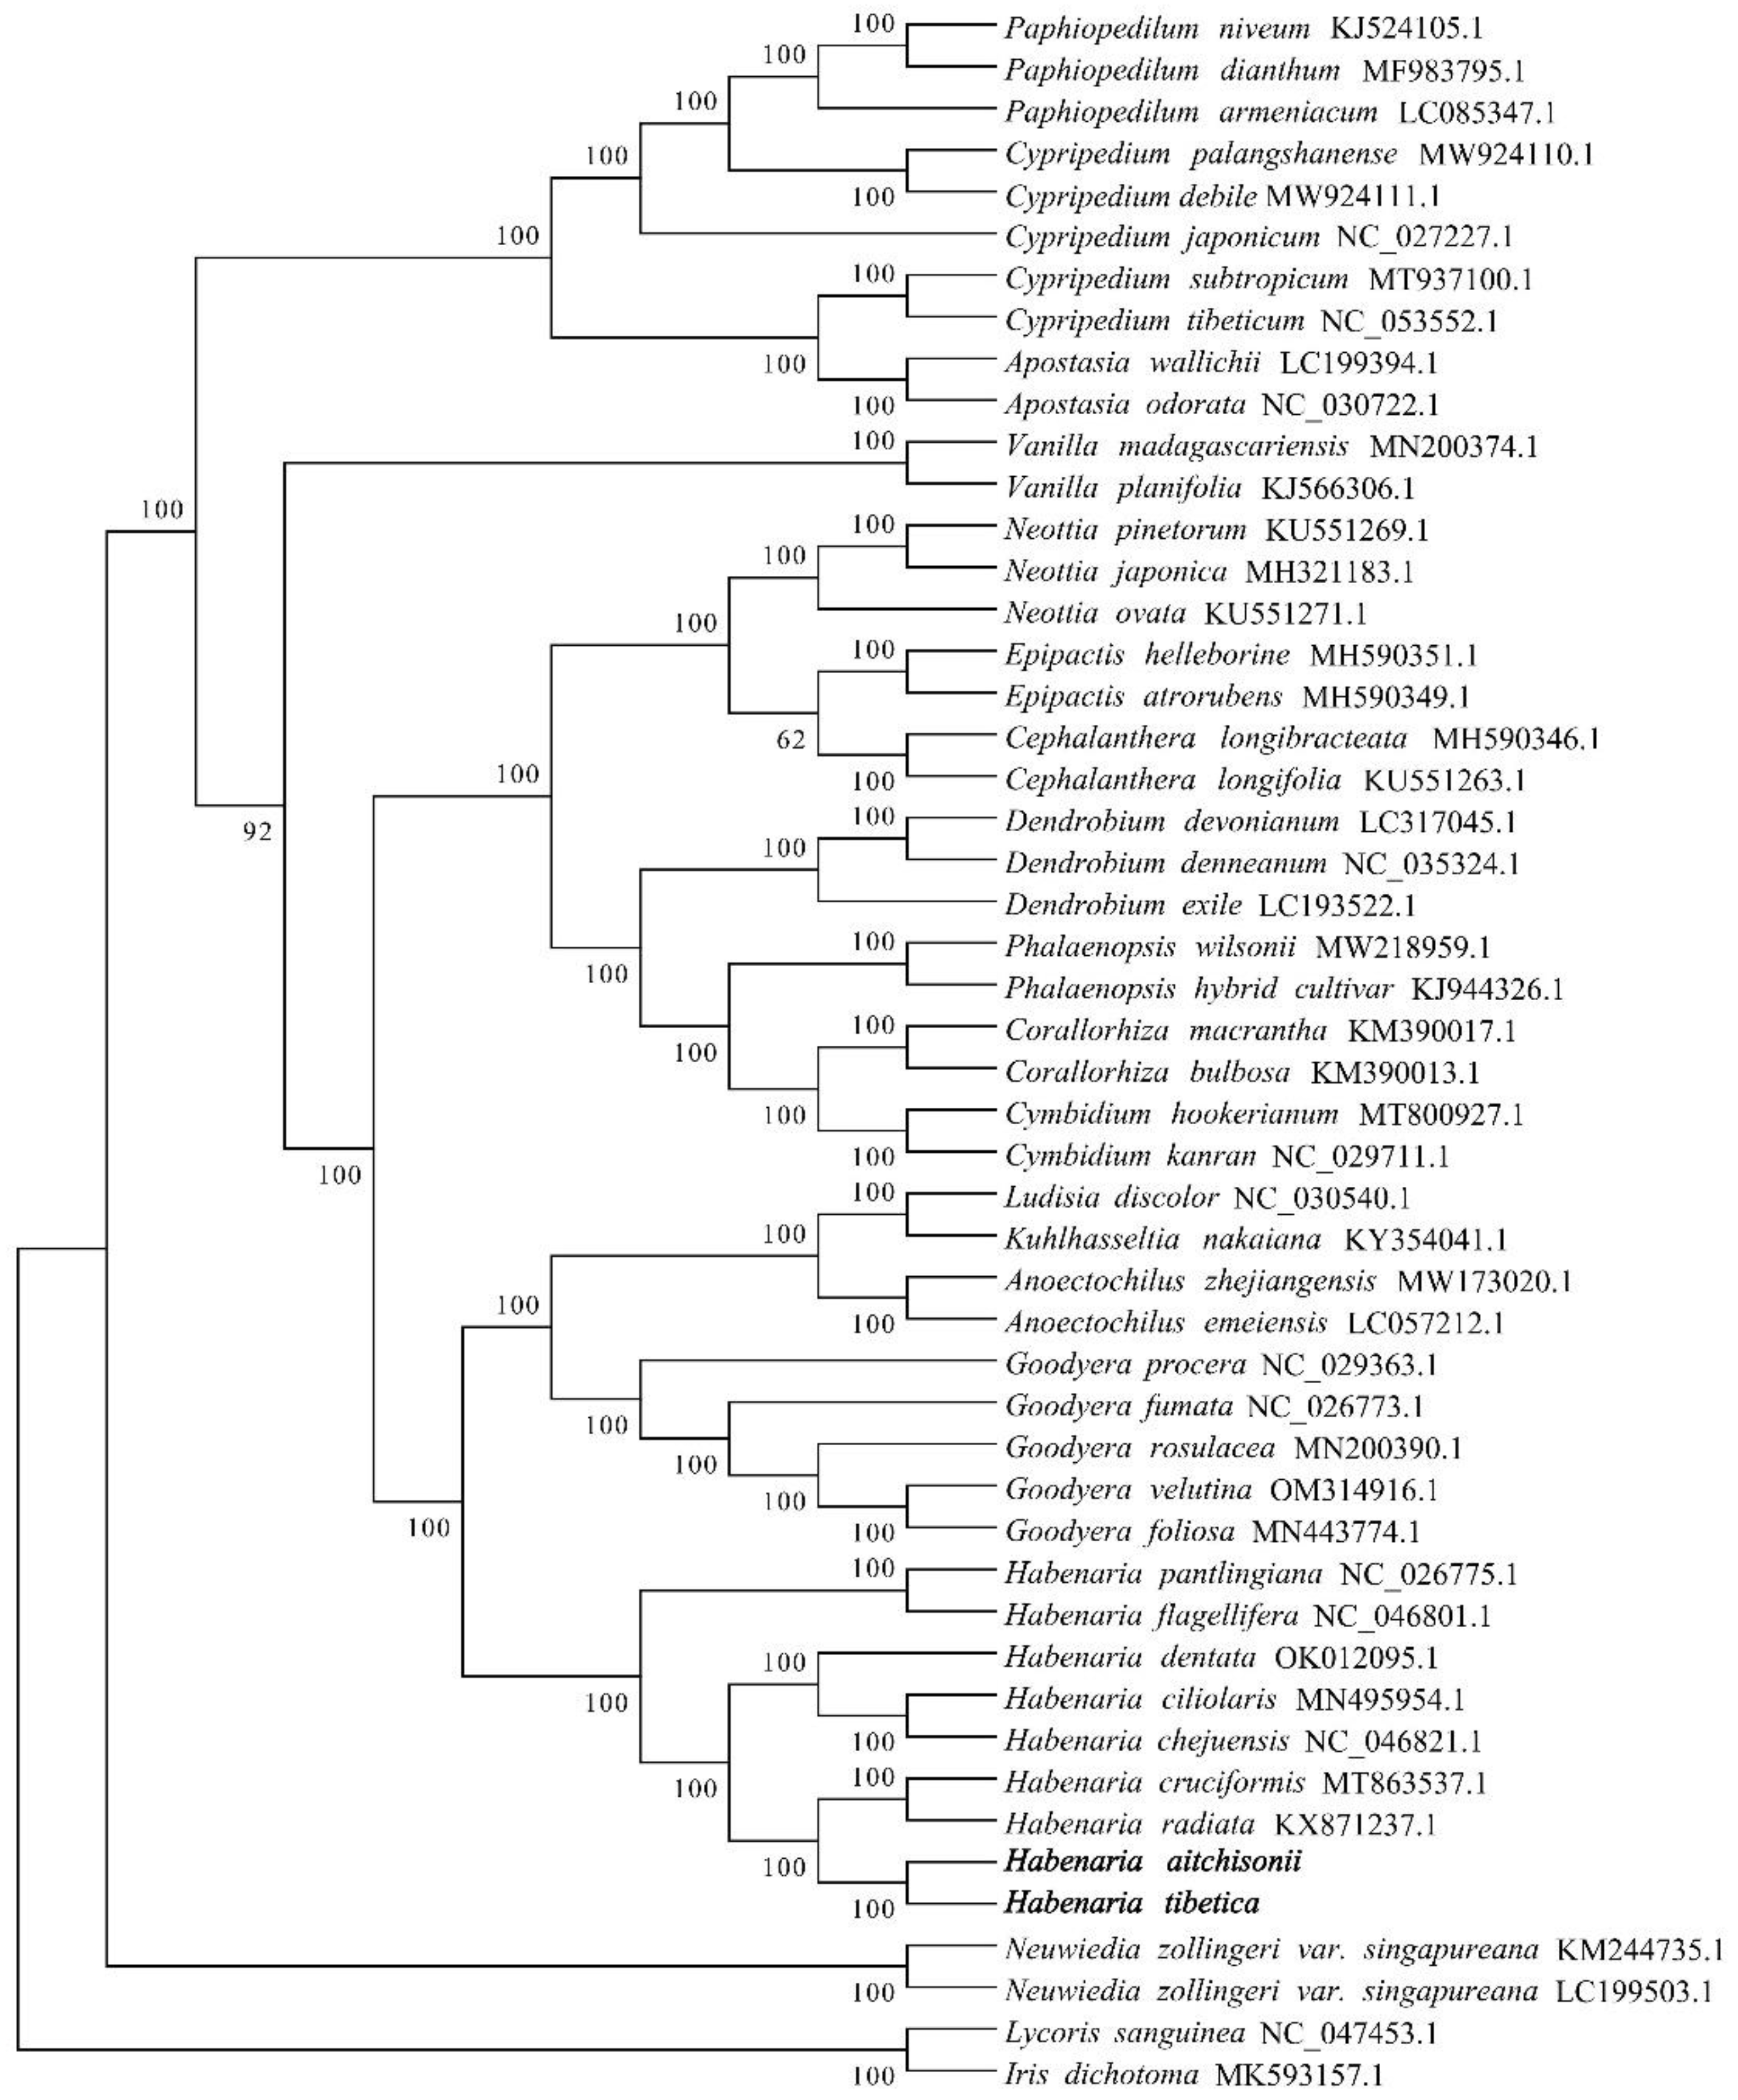
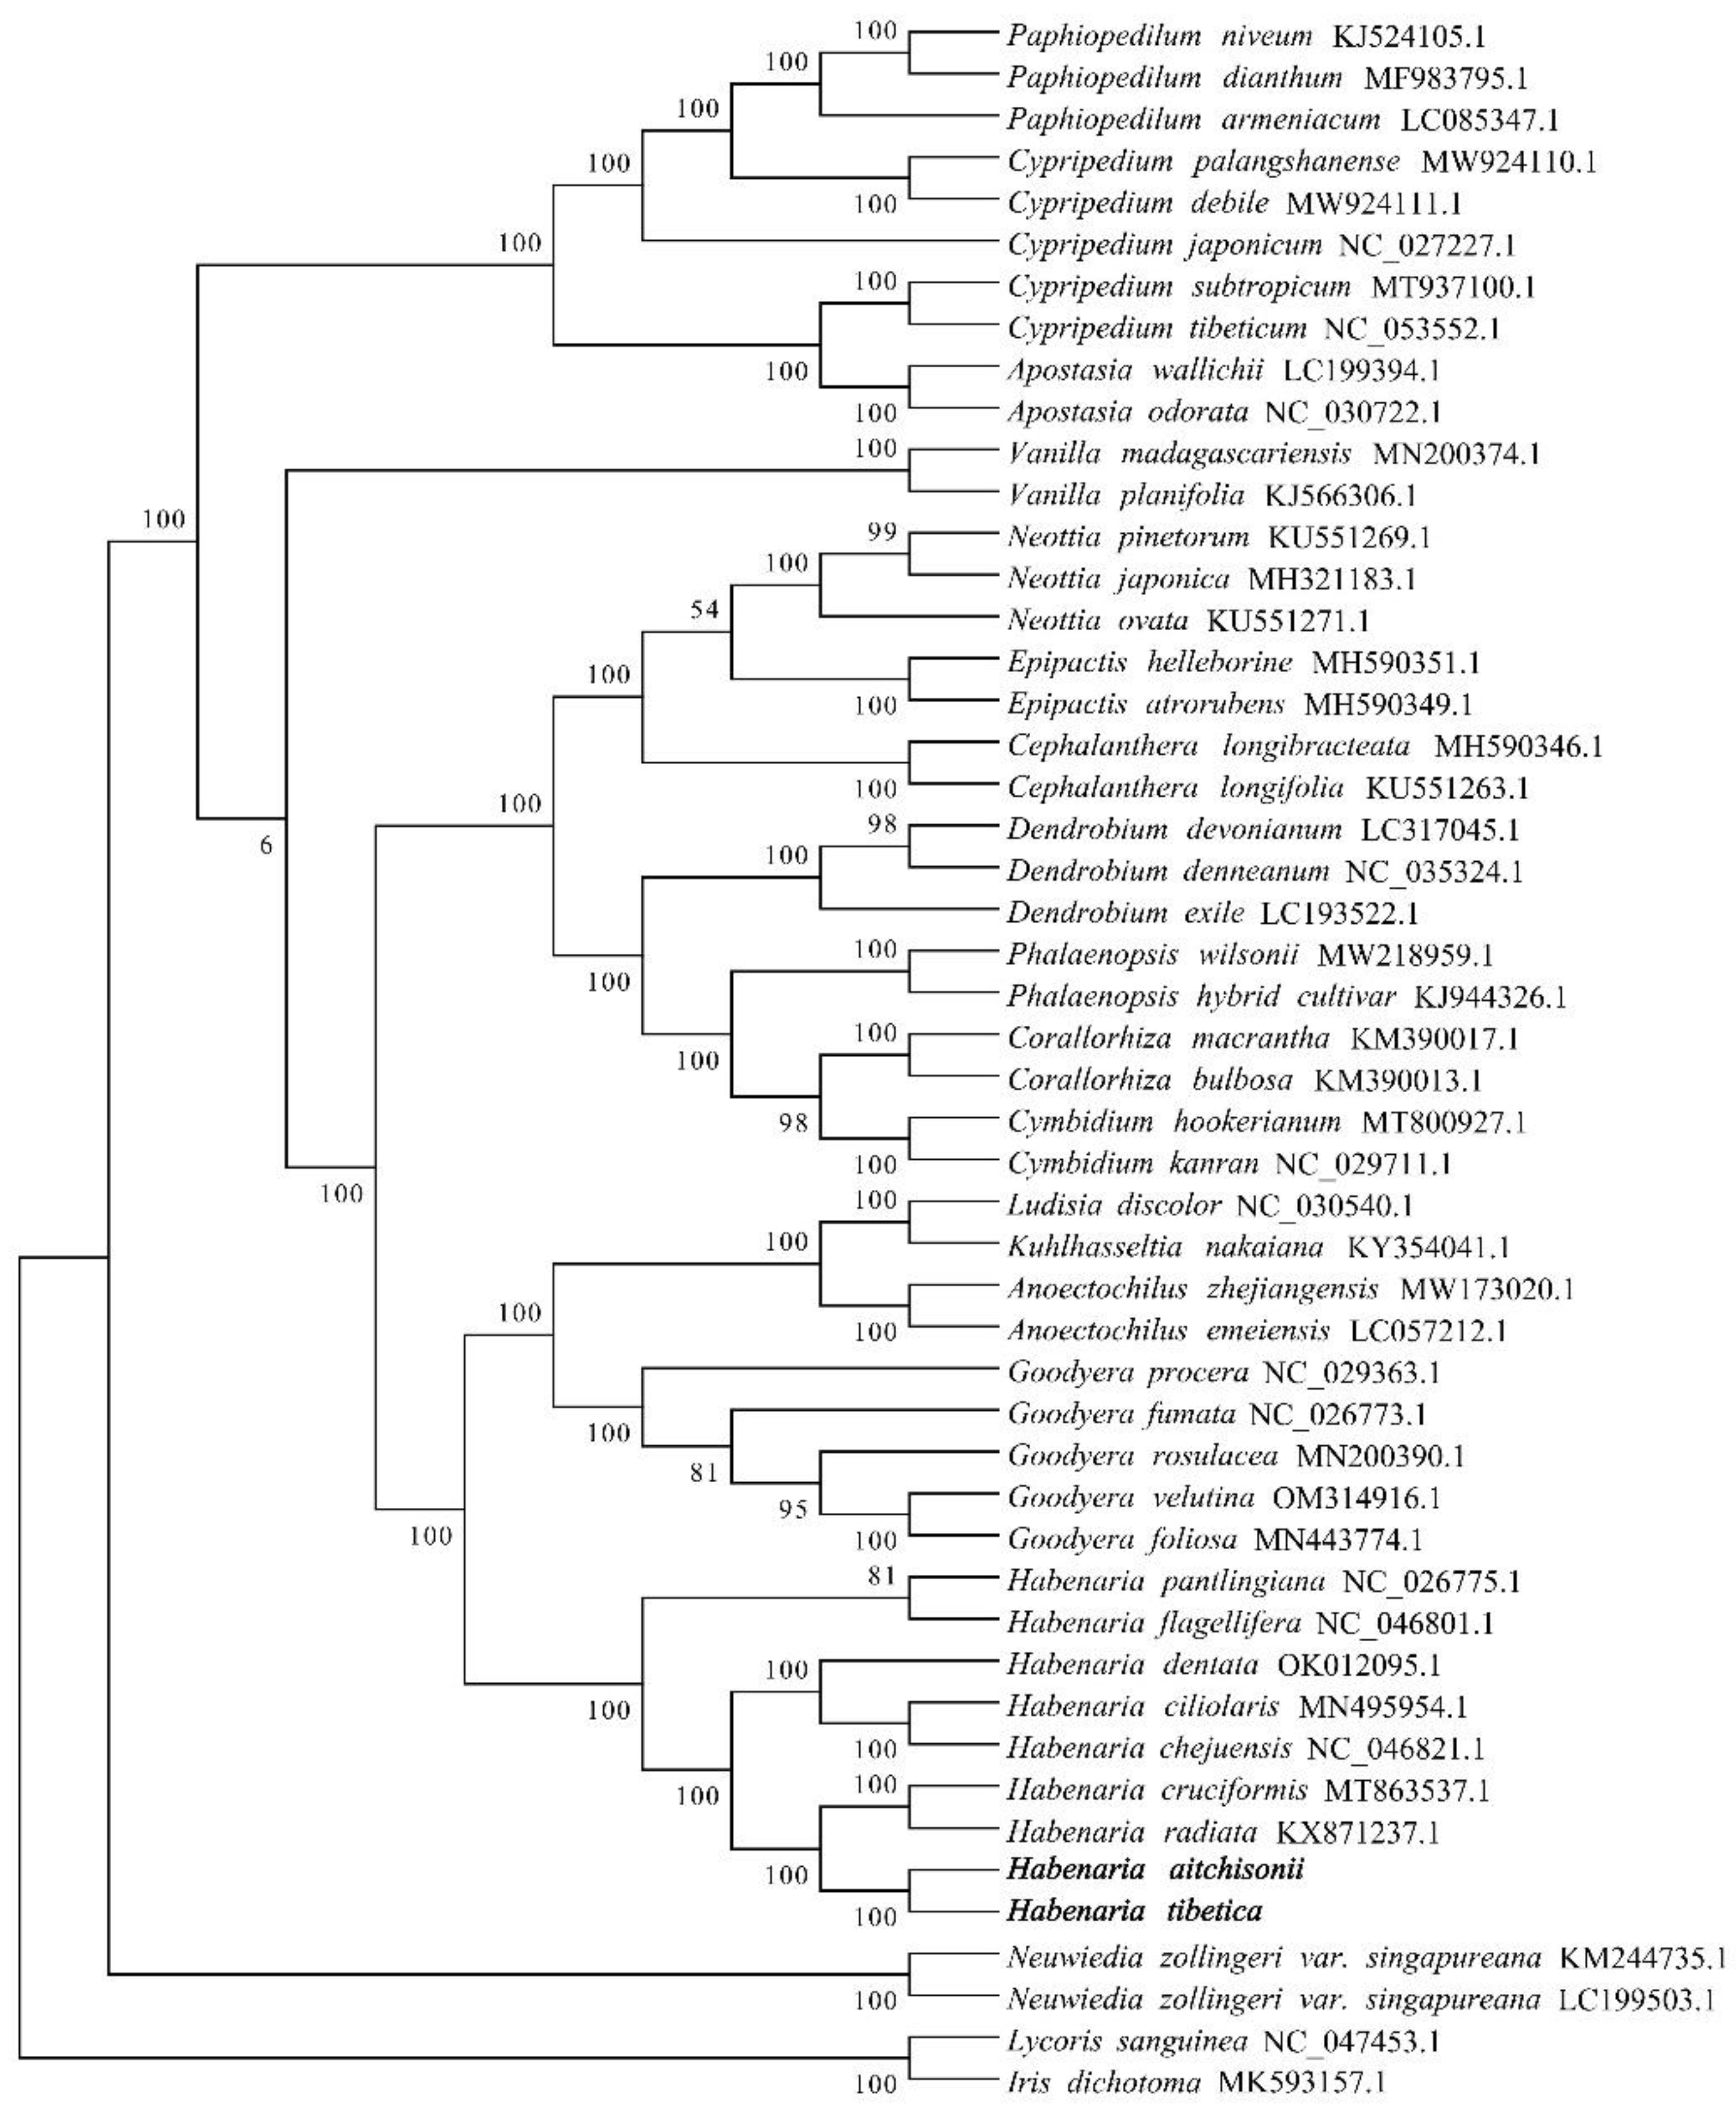
To understand the phylogenetic relationship between H. aitchisonii and H. tibetica and other species of Orchid, we constructed the phylogenetic trees with 51 cp genomes (Table S8). The phylogenetic trees showed that the H. aitchisonii and H. tibetica were clustered together with 100% bootstrap support (Figure 8). The nine species of Habenaria were clustered in one clade and had closely relationship with Goodyeras. In the Habenaria clades the H. pantingiana and H. flagellifera were grouped together, H. dentata, H. ciliolaris, and H. chejuensis were clustered in other branches. While the H. crucicifomis and H. radiata appeared as two parallel branches.

3. Discussion

Here, we sequenced and assembled H.aitchisonii and H.tibetica grown on the QTP (Figure 1), our result displayed that the chloroplast genomes of two species were very similar in structure and cp genome size. Combined with the published cp genomes [22,30], our result also displayed that the species of Habenaria was 153,682-155,708bp, which is smaller than that of Cypripedium [30] and larger than that of Vanilla, Cyrtosia, Gastrodia and Epipogium species [22]. Moreover, the GC content of the nine Habenaria species ranged from 36.60% to 37.90% (Table 1), and the average GC content was 36.95%, which was a bit larger than the average GC content of orchid plastomes (36.40%)[30] and Cypripedium species (31.8%)[21].GC content might be related to the ancestral feature of monocot genomes[31], secondly, selection and mating system also could drive GC content and GC3 usage[32].We suggest that high GC content of Habenaria species may be related to the mutation from these process.
Gene number and gene order are another evolution characterization of the cp genomes. A previous study reported that the average number of 124 orchid species was 113 genes [21]. However, our results displayed that most of the species had more than 130 coding-genes except H. radiata (113 genes) (Table 1), which also a bit more than Cypripedium (128-130 genes). That may be caused by the more duplication genes. In the two new species, more than 20 genes were duplicated. Ndh genes were lost or deleted in Cypripedium and other orchid species [22,30]. Interestingly, our results displayed that the species of Habenaria contained all 11 ndh genes (Table S6). Ndh genes involved in photosynthesis or plastome stability [21]. Therefore, the ndh genes would play important roles in Habenaria adaptations.
Highly variable regions could be used to design the markers in phylogenetic and biogeographic analysis [33]. In the study, the highest polymorphism appeared in SSC regions had the highest average Pi value of 0.021857 and ycf1 displayed the high Pi value (Figure 6). This result was consistent with the Blumea species [18]. Except for the conserved IR regions, the LSC regions also displayed high variations (matK-rps16, psbK-psbI, atpA-atpF, rps2-rpoC2, ycf4-cemA, rpl33-rps18, and rps11-rpl36) (Figure 6; Table S3). Which may suggest that this region has the potential for markers. Moreover, 16 genes (atpF, matK, ycf4, cemA, psbK, rps18, psbI, rps11, rpl22, rps15, ycf1, ndhF, rpl32, ccsA, ndhD and ndhE) were detected with nucleotide diversity more than 0.02 (Figure 7; Table S4). Among these loci, ndhF, rps15, ccsA, and rpl32 have been detected as highly variable regions in different species [18,21]. Therefore, the high variation information identified in this study has the potential to be exploited as candidate barcode sequences in the phylogenetic analysis of Habenaria. Moreover,
233 SSRs and 232 SSRs were identified in the plastome of two new species and more SSRs exited in IGS regions (Figure 5a; Table S4a). Among the six types, more than sixty are mononucleotides, the results were in accord with other species [18,21]. Moreover, our results identified 27 types of SSR in the nine Habenaria that is less than that of the Cypripedium [21]. This may be due to the Cyripedium having larger chloroplast genomes and enlarged IR regions. In Cypripedium, the cp genome expansion is associated with the proliferation of IGS regions [21]. Therefore, repeat regions in the study may help for population genetics studies of Habenaria.
Habenaria is a large genus and most species of Habenaria are terrestrial orchids and nearly cosmopolitan, occurring in the tropical, subtropical, temperate, and alpine regions [2,3]. In the ML tree, our results displayed that the Habenaria is not the monophyletic and the nine species could be divided into five different groups (Figure 8). Among them, the two new species (H. aitchisonii and H. tibetica) clustered together with 100% bootstrap support. Interestingly, the two species were grown on the QTP and showed similar morphological characteristics [3]. The two species both had two basal subopposite leaves, petals slightly 2-lobed, raceme with flower, lip deeply 3-lobed and spur slightly clavate [3]. Our results with whole cp genomes also displayed that the two species had close relationship. The results are also supported by the previous studies [9,10]. Using the rbcL+matK+ITS, the Habeniara could be divided into eleven clades and the species from tropical and alpine regions could group into different subclades [10]. Subclade I most from the tropical region and Subclade II was the alpine species. Our results showed that H. chejuensis, H. ciliolaris and H. dentata were group into another branches (Figure 8), which may originate in tropical regions [10]. Although the cp genomes data here still quite limited and couldn’t clarify the phylogenetic relationship in the Habenaria genus, our results still provide the cue that the cp genomes could solve the phylogenetic inference when more cp genome information obtained in the future.
In the previous study, some chloroplast genes were proved to be the target of natural selections [23,26,27,28,34]. Our results showed that there were no genes subjected to natural selection between two alpine species (Ka/Ks<1). However, Both the new species had more than 3 genes had Ka/Ks>1 compared with others. These genes included cemA, petA, rps11, rpl14, ycf1, psbK, rpl22, ycf2, ycf2-2, psbH, and ndhⅠ (Figure 7). To further understand the positive genes in Habenaria genus, codon model was used in ten genes [24,25]. Codon sites with higher posterior were another aspect sign of divergent selective pressure [24,25]. The results also displayed that the six genes may be under positive selection significantly (Table 2; Table S7). These results suggested that the positive selections had been happened in the species of two alpine species. Besides the genes associated with photosynthesis (petA, psbH), NADH-dehyrogenase subunits(ndhⅠ), self-replication process gene (rps11, rpl22) and ycf1, ycf2 also displayed positive selection. Photosynthesis system and NADH-dehyrogenase contributed light harvest and electron transport to produce ATP, were suffering to positive selection in Allium [34]. Here, our results were consistent with their conclusion. Moreover, our results also discovered that genes related to cp ribosome (rpl22 and rpl11) had significant positive selection. This may suggest that protein synthesis play the important roles in two alpine species stress adaptation.
The QTP is the largest and highest plateau in the world and one of the important hotspots of biodiversity [35]. Orchid species are extremely sensitive to environmental change [36]. Acharya et al (2011) thought that the precipitation and temperature could affect the abundance and distribution of the orchid species [37]. Similarly, Hu et al (2022) study displayed that annual precipitation, elevation, and top-soil pH(H2O) had a large important influence on the distribution of the orchid species in the QTP[38]. Ka/Ks rations have been widely used to infer evolutionary dynamics and identify adaptive signatures among species. Ka/Ks ratios suggested that positive selection existed in Allioideae species [32] and Solanaceae species [19,23]. Here, our results also showed that positive selection have existed in two alpine Habenaria species. The precipitation, elevation, and top-soil pH (H2O) might be the potential environmental factors in the QTP.

4. Conclusions

In this study, the two new chloroplast genomes of Habenaria in the QTP were sequenced and compared genomic profiling with seven other published species. We revealed similarities in gene arrangement and gene content in the Habenaria genus. The rearrangement of genes did not happen in the nine plastomes. Comparative of tandem of codon usage, amino frequency, microsatellite, oligo repeats and transition and transversion substitutions showed similarity in the two new species. Moreover, we identified 16 highly polymorphic regions with nucleotide diversity above 0.02, which may be suitable for robust authentic barcoding and inferring in the phylogeny of Habenaria species. Among the polymorphic regions, positive selection was significantly exerted on cemA, petA, ndhⅠ, rpl22, rps11and psbH. The phylogenetic relationship displayed that H.aitchisonii and H. tibetica have more close relationship than others and the rest seven species clustered in other three groups. The data-sets of the study also enriched the genomics resources of Habenaria in Orchidaceae, which may be helpful for the conservation efforts of these endangered species.

5. Materials and Methods

5.1. Sample Collection and DNA Extraction

In the flowering season in 2021, the fresh leave of H. aitchisonii and H. tibetica were collected in Maixiu National Forestry Park (35.2619 N,1018861E, Alt.3200m) and Sanjiang Source National Park (32.9385 N, 100.7436E, Alt. 3300m), and the vouch specimen(ZDW-2021-024 and ZDW-2021-030) was deposited in the Herbarium of Northwest Institute of Plateau Biology, Chinese Academy of Sciences and voucher specimen was identified by Prof. Pengcheng Lin. The total DNA was extracted using the CTAB method [39].

5.2. Plastome Genome Sequencing, Assembling and Annotation

The high-quality DNA was sequenced with the Illumina NovaSeq 6000 sequencing Platform (Nanjing Genepioneer Biotechnologies Inc.). fastp (version 0.20.0,https://github.com/OpenGene/fastp) was used to filtrate the raw reads, and the clean reads were mapped to the chloroplast genomes in the GenBank. The contigs were obtained with SOAPdenovo2 v3.10.1(http://cab.spbu.ru/software/spades/)under kmer=55, 87 and 121[40].The scaffold was constructed by SSPACE v2.0 [41], and GapCloser was used to fill the gaps [40]. PCR amplification and Sanger sequencing were also used to confirm the assembly boundaries. The annotation of the complete chloroplast genomes was executed using DOGMA (http://dogma.ccbb.utexas.edu/) [42] and the circular chloroplast genome map was generated by OGDRAW[43].

5.3. SSRs, Codon Usages and Nucleotide Diversity Analysis

Web-based REPuter (https://bibiserv.cebitec.uni-bielefeld.de/reputer/) was used to detect repeats including forward, palindrome, reverse and complement repeats. The minimal repeat size was set to 30 bp, and the sequence identity was>90%. Simple sequence repeats (SSRs) were identified by MISA (Micro Satellite identification tool) [44] with the minimum repeats of mono-, di-, tri-, tetra-, penta- and hexanucleotides set to 8, 5, 4, 3, 3 and 3, respectively.
Codon usage analysis only 53 protein-coding genes with lengths >300bp were chosen for synonymous codon using the tool CodonW1.4.2 to avoid sampling errors (http://codonw.sourceforge.net). The overall codon usage and the relative synonymous codon usage (RSCU) were analyzed. The number of polymorphic sites and nucleotide variability (Pi) were evaluated using a sliding window with a 200bp step size and a 600bp window length implemented in DnaSP v.5.10.1[45].

5.4. Comparative Analysis of cp Genomes

The plastome of H.aitchisonii and H. tibetica were compared with the cp genomes of other species in Habenaria using mauve software to identify evolutionary events such as gene loss, duplication, rearrangement [46].The junction of the cp genomes was analyzed in IRscope [47].

5.5. Molecular Evolution Analysis

To analyze synonymous (Ks) and non-synonymous (Ka) substitution rates, the protein-coding genes of H.aitchisonii, H. tibetica and other seven closely related species in the Habenaria genus were analyzed. The corresponding functional protein-coding gene between compared species was separately aligned using MAFFT [48], and then the Ka/Ks value was calculated by the KaKs_calculator 2.0 [49] with the settings genetic code table 11 (bacterial and plant plastid code) and the NG method of calculation, developed by Nei and Gojobori as implemented in KaKs_calculator. There were genes with Ka/Ks value of “NA” in the results, indicating that were not applicable. When Ks =0, this happed (in cases with no substitutions in the alignment, or 100 percent match). To identify the positively selected genes, the branch-site model was used in PAML software (http://abacus.gene.ucl.ac.uk/software/PAML.html ).

5.6. Phylogenetic Analysis

The whole cp genome and coding-proteins of 48 species of the Orchidaceae were retrieved from the GenBank and used to construct the phylogenetic tree. The cp genomes of Iris dichotoma (Iridaceae) and Lycorris sanguinea (Amaryllidaceae) were used as the outgroup [21]. The two sets of sequences were aligned by MAFFT [46], and then the alignments were adjusted by the Gblocks program [50]. The maximum likelihood (ML) method was employed to construct phylogenetic trees by RAxMLversion 8.0 software using the GTRGAMMA model [51]. Bootstrap analysis for each branch was calculated by 1000 replications.

Availability of data and materials

The chloroplast genome sequences of H.aitchisonii and H. tibetica were submitted to the GenBank and the accession numbers were: OQ701055 and OQ701056, respectively.

Supplementary Materials

The following supporting information can be downloaded at the website of this paper posted on Preprints.org. Figure S1. Codon content of 20 amino acid and the stop codon of 81 coding genes of Habenaria aitchisonii (a)and Habenaria tibetica(b). Table S1. Comparitive of genes among Habenaria aitchisonii and Habenaria tibetica with other Habenaria species. Table S2. The codon usage and codon-anoticodon recognition pattern for Habenaria aitchisonii and Habenaria tibetica cp genome. Table S3. a Comparison of repeat sequences on Habenaria aitchisonii , Habenaria tibetica and seven related species. Table S3. b Distribution of SSRs in the Habenaria aitchisonii , Habenaria tibetica cp genome. Table S4. a The comparative analysis of codon usage bias. Table S4. b The oligonucleotide of Habenaria cp genome analysis. Table S5. Comparison of nucleotide variability (Pi) among Habenaria aitchisonii , Habenaria tibetica and related species. Table S6. The Ka/Ks ratios of protein-coding genes of Habenaria aitchisonii , Habenaria tibetica and related species. Table S7. Codon model analysis of ten cp genome genes. Table S8. List of chloroplast genomes belonging to Orchidaceae used for the phylogenetic analysis.

Author Contributions

Z-DW, L-PC, and C-WD conceived and designed the experiments. Z-JK, Z-SQ, W-M, W-H and S-SB analyzed the data. Y-X, M-J, and Z-YW participated in the material collected. Z-DW, F-M, Z-JK, S-SB and W-H prepared the manuscript and revised the manuscript. All authors read and approved the final manuscript. All authors have read and agreed to the published version of the manuscript.

Funding

This work was supported by the foundation of Qinghai Forestry and Grassland Administration (QHBY-2021-004-01), the foundation of the Qinghai Science and Technology department (2021-ZJ-734) and the fund of the Institute of Biotechnology of Medicine Herb of Qinghai Nationalities University.

Acknowledgments

We acknowledge Qinghai Forestry and Grassland Administration permitted material collected for public interest research and Nanjing Genepioneer Biotechnologies Inc. for sequencing and appreciate Chuanbei Jiang, Yue Wang, and Mingxing Yang for software help. We also thank Prof.Guo-mei Li, Mr.A-Qiong Gongsong, and Mr. Pengguo Lin for their help with the photograph and location guide. We also thank Lei Zhang, Yong-qing Li, Fu-hao Zhang, Peng-cuo Gama, Dong-peng He, and Cheng-qiang Qiao for their help in the materials collection.

Conflicts of Interest

The authors declare no competing interests.

References

  1. Govaerts, R.; Bernet, P.; Kratochvil, K.; Gerlach, G.; Carr, G.; Alrich, P.; et al. World Checklist of Orchidaceae. The board of Trustees of the Royal Botanic Gardens, Richmond, U.K, 2019.
  2. Pridgeon, A.M.; Cribb, P.J.; Chase, M.W.; Rasmussen, F.N. Genera Orchidacearum, Orchidoideae (part 1), Oxford: Oxford University Press, U.K, 2001.
  3. Chen, X.; Cribb, P.J. “Habenaria”, In Flora of China, eds Wu ZG, Raven PH, Hong DY. Beijing: Science Press, and St.Louis : Missouri Botanical Garden, 2009, 144-160.
  4. Tang, H. DNA barcoding identification and ecological suitability of important medicinal plants of Orchidaceae. Ph.D. thesis, Sichuan Agricultural University, Ya’an (China), 2016.
  5. Zhang, J.; Yang, Y.S.; Tang, J.M.; Luo, Y.J.; Lv, H.Q.; Chai, S.F. The complete chloroplast genome sequence of Habenaria dentata (Orchidaceae). Mitochondrial DNA B. Resour. 2022, 7, 969–970. [Google Scholar] [CrossRef] [PubMed]
  6. Mahnashi, M.H.; Alqahtani, Y.S.; Alyami, B.A.; Alqarni, A.O.; Alshrahili, M.A.; Abou-Salim, M.A.; Alqahtani, M.N.; Mushtaq, S.; Sadiq, A.; Jan, M.S. GC-MS analysis and various in vitro and in vivo pharmacological potential of Habenaria plantaginea Lindl. Evid-Based. Compl. Alt. Med. 2022, 7921408. [Google Scholar] [CrossRef] [PubMed]
  7. Challe, J.F.; Price, L.L. Endangered edible orchids and vulnerable gatherers in the context of HIV/AIDS in the Southern Highlands of Tanzania. J. Ethnobiol. Ethnomed. 2009, 5, 41. [Google Scholar] [CrossRef] [PubMed]
  8. Dressler, R.L. Phylogeny and classification of the orchid family. OR:Dioscorides Press, Portland, USA, 1993.
  9. Bateman, R.M.; Hollingsworth, P.M.; Preston, J.; Luo, Y.B.; Pridgeon, A.M.; Chase, M.W. Molecular phylogenetics and evolution of Orchidinae and selected Habenariinae (Orchidaceae). Bot. J. Linn. Soc. 2003, 142, 1–40. [Google Scholar] [CrossRef]
  10. Raskoti, B.B.; Ale, R. Molecular phylogeny and morphology reveal a new epiphytic species of Habenaria (Orchidaceae; Orchideae; Orchidinae) from Nepal. PLoS ONE. 2019, 14, e0223355. [Google Scholar] [CrossRef] [PubMed]
  11. Pandey, T.R.; Jin, X.H. Taxonomic revision of Habenaria josephi group (sect. Diphyllae s.l.) in the Pan Himalaya. PhytoKeys 2021, 175, 109–135. [Google Scholar] [CrossRef] [PubMed]
  12. Besi, E.E.; Hooi, W.K.; Sylvester. ; Pungga, R.; Yong, C.S.Y.; Mustafa, M.; Go, R. Rare orchid species in Malaysia: New records, recollections and amended descriptions. PLoS ONE 2022, 17, e0267485. [Google Scholar] [CrossRef] [PubMed]
  13. Batista, J.A.; Borges, K.S.; de Faria, M.W.; Proite, K.; Ramalho, A.J.; Salazar, G.A.; van den Berg, C. Molecular phylogenetics of the species-rich genus Habenaria (Orchidaceae) in the new world based on nuclear and plastid DNA sequences. Mol. Phylogenet. Evol. 2013, 67, 95–109. [Google Scholar] [CrossRef]
  14. Pedron, M.; Buzatto, C.R.; Ramalho, A.J.; Carvalho, B.M.; Radins, J.A.; Singer, R.B.; Batista, J.A. Molecular phylogenetics and taxonomic revision of Habenaria section Pentadactylae (Orchidaceae, Orchidinae). Bot. J. Linn. Soc. 2014, 175, 47–73. [Google Scholar] [CrossRef]
  15. Jin, W.T.; Jin, X.H.; Schuiteman, A.; Li, D.Z.; Xiang, X.G.; Huang, W.C.; Li, J.W.; Huang, L.Q. Molecular systematics of subtribe Orchidinae and Asian taxa of Habenariinae (Orchideae, Orchidaceae) based on plastid matK, rbcL and nuclear ITS. Mol. Phylogenet. Evol. 2014, 77, 41–53. [Google Scholar] [CrossRef]
  16. Smith, D.R. Mutation rates in plastid genomes: They are lower than you might think. Genome Biol. Evol. 2015, 7, 1227–1234. [Google Scholar] [CrossRef] [PubMed]
  17. Daniell, H.; Lin, C.S.; Yu, M.; Chang, W.J. Chloroplast genomes: Diversity, evolution, and applications in genetic engineering. Genome Biol. 2016, 17, 134. [Google Scholar] [CrossRef] [PubMed]
  18. Abdullah. ; Mehmood, F.; Rahim, A.; Heidari, P.; Ahmed, I.; Poczai, P. Comparative plastome analysis of Blumea, with implications for genome evolution and phylogeny of Asteroideae. Ecol. Evol. 2021, 11, 7810–7826. [Google Scholar] [CrossRef] [PubMed]
  19. Mehmood, F.; Abdullah. ; Ubaid, Z.; Shahzadi, I.; Ahmed, I.; Waheed, M.T.; Poczai, P.; Mirza, B. Plastid genomics of Nicotiana (Solanaceae): insights into molecular evolution, positive selection and the origin of the maternal genome of Aztec tobacco (Nicotiana rustica). Peer J 2020, 8, e9552. [Google Scholar] [CrossRef] [PubMed]
  20. Palmer, J.D. Comparative organization of chloroplast genomes. Ann. Rev. Genet. 1985, 19, 325–354. [Google Scholar] [CrossRef] [PubMed]
  21. Zhang, J.Y.; Liao, M.; Cheng, Y.H.; Feng, Y.; Ju, W.B.; Deng, H.N.; Li, X.; Plenkovi ´c-Moraj, A.; Xu, B. Comparative chloroplast genomics of seven endangered Cypripedium species and phylogenetic relationships of Orchidaceae. Front. Plant Sci. 2022, 13, 911702. [Google Scholar] [CrossRef] [PubMed]
  22. Kim, Y.K.; Jo, S.; Cheon, S.H.; Joo, M.J.; Hong, J.R.; Kwak, M.; Kim, K.J. Plastome Evolution and Phylogeny of Orchidaceae, With 24 New Sequences. Front. Plant Sci. 2020, 11, 22. [Google Scholar] [CrossRef]
  23. Zhou, D.W.; Mehmood, F.; Lin, P.C.; Cheng, T.F.; Wang, H.; Shi, S.B.; Zhang, J.K.; Meng, J.; Zheng, K.; Poczai, P. Characterization of the evolutionary pressure on Anisodus tanguticus Maxim. with complete chloroplast genome sequence. Genes (Basel) 2022, 13, 2125. [Google Scholar] [CrossRef]
  24. Yang, Z.; Bielawski, J.P. Statistical methods for detecting molecular adaptation. Trends Ecol. Evol. 2000, 15, 496–503. [Google Scholar] [CrossRef]
  25. Yang, Z.; Nielsen, R. Codon-substitution Models for detecting molecular adaptation at individual sites along specific lineages. Mol. Biol. Evol. 2002, 19, 908–917. [Google Scholar] [CrossRef]
  26. Zhang, Y.; Zhao, Q.; Shi, S.H.; Huang, Y.L.; Hasegawa, M. Detecting evolutionary rate heterogeneity among mangroves and their close terrestrial relatives. Ecol. Lett. 2002, 5, 427–432. [Google Scholar] [CrossRef]
  27. Kapralov, M.V.; Kubien, D.S.; Andersson, I.; Filatov, D.A. Changes in Rubisco kinetics during the evolution of C4 photosynthesis in Flaveria (Asteraceae) are associated with positive selection on genes encoding the enzyme. Mol. Biol. Evol. 2011, 28, 1491–1503. [Google Scholar] [CrossRef] [PubMed]
  28. Erixon, P.; Oxelman, B. Whole-gene positive selection, elevated synonymous substitution rates, duplication, and indel evolution of the chloroplast clpP1 gene. PLoS One 2008, 3, e1386. [Google Scholar] [CrossRef] [PubMed]
  29. Fan, W.B.; Wu, Y.; Yang, J.; Shahzad, K.; Li, Z.H. Comparative chloroplast genomics of Dipsacales species: insights into sequence variation, adaptive evolution, and phylogenetic relationships. Front. Plant Sci. 2018, 9, 689. [Google Scholar] [CrossRef] [PubMed]
  30. Guo, Y.Y.; Yang, J.X.; Li, H.K.; Zhao, H.S. Chloroplast genomes of two species of Cypripedium: expanded genome size and proliferation of AT-biased repeat sequences. Front. Plant Sci. 2021, 12, 609–729. [Google Scholar] [CrossRef] [PubMed]
  31. Clément, Y.; Fustier, M.A.; Nabholz, B.; Glémin, S. The bimodal distribution of genic GC content is ancestral to monocot species. Genome Biol. Evol. 2014, 7, 336–348. [Google Scholar] [CrossRef] [PubMed]
  32. Muyle, A.; Serres-Giardi, L.; Ressayre, A.; Escobar, J.; Glémin, S. GC-biased gene conversion and selection affect GC content in the Oryza genus (rice). Mol. Biol. Evol. 2011, 28, 2695–2706. [Google Scholar] [CrossRef] [PubMed]
  33. Powell, W.; Morgante, M.; Mcdevitt, R.; Vendramin, G.G.; Rafalski, J.A. Polymorphic simple sequence repeat regions in chloroplast genomes:applications to the population genetics of pines. Proc. Natl. Acad. Sci. U. S. A. 1995, 92, 7759–7763. [Google Scholar] [CrossRef] [PubMed]
  34. Xie, D.F.; Yu, H.X.; Price, M.; Xie, C.; Deng, Y.Q.; Chen, J.P.; Yu, Y.; Zhou, S.D.; He, X.J. Phylogeny of Chinese Allium species in section Daghestanica and adaptive evolution of Allium (Amaryllidaceae, Allioideae) species revealed by the Chloroplast complete genome. Front. Plant Sci. 2019, 10, 460. [Google Scholar] [CrossRef]
  35. Myers, N. , Mittermeier, R.A.; Mittermeier, C.G.; da Fonseca, G.A.; Kent, J. Biodiversity hotspots for conservation priorities. Nature 2000, 403, 853–858. [Google Scholar] [CrossRef]
  36. Wang, J.; Li, J.; Lin, W.; Deng, B.; Lin, L.; Lv, X.; Hu, Q.; Liu, K.; Fatima, M.; He, B.; et al. Genome-wide identification and adaptive evolution of CesA/Csl superfamily among species with different life forms in Orchidaceae. Front. Plant Sci. 2022, 13, 994679. [Google Scholar] [CrossRef] [PubMed]
  37. Acharya, K.P.; Vetaas, O.R.; Birks, H.J.B. Orchid species richness along Himalayan elevational gradients. J. Biogeogr. 2011, 38, 1821–1833. [Google Scholar] [CrossRef]
  38. Hu, H.; Wei, Y.; Wang, W.; Suonan, J.; Wang, S.; Chen, Z.; Guan, J.; Deng, Y. Richness and distribution of endangered orchid species under different climate scenarios on the Qinghai-Tibetan Plateau. Front. Plant Sci. 2022, 13, 948189. [Google Scholar] [CrossRef] [PubMed]
  39. Doyle, J.J.; Doyle, J.L. A rapid DNA isolation procedure for small quantities of fresh leaf tissue. Phytochem Bull. 1987, 19, 11–15. [Google Scholar]
  40. Luo, R.; Liu, B.; Xie, Y.; Li, Z.; Huang, W.; Yuan, J.; He, G.; Chen, Y.; Pan, Q.; Liu, Y.; et al. Erratum: SOAPdenovo2: an empirically improved memory-efficient short-read de novo assembler. Gigascience 2015, 4, 30. [Google Scholar] [CrossRef] [PubMed]
  41. Boetzer, M.; Henkel, C.V.; Jansen, H.J.; Butler, D.; Pirovano, W. Scaffolding pre-assembled contigs using SSPACE. Bioinformatics 2011, 27, 578–579. [Google Scholar] [CrossRef] [PubMed]
  42. Wyman, S.K.; Jansen, R.K.; Boore, J.L. Automatic annotation of organellar genomes with DOGMA. Bioinformatics 2004, 20, 3252–3255. [Google Scholar] [CrossRef] [PubMed]
  43. Lohse, M.; Drechsel, O.; Bock, R. OrganellarGenomeDRAW (OGDRAW): a tool for the easy generation of high-quality custom graphical maps of plastid and mitochondrial genomes. Curr. Genet. 2007, 52, 267–274. [Google Scholar] [CrossRef] [PubMed]
  44. Thiel, T.; Michalek, W.; Varshney, R.K.; Graner, A. Exploiting EST databases for the development and characterization of gene-derived SSR-markers in barley (Hordeum vulgare L.). Theor. Appl. Genet. 2003, 106, 411–422. [Google Scholar] [CrossRef]
  45. Rozas, J.; Ferrer-Mata, A.; Sánchez-DelBarrio, J.C.; Guirao-Rico, S.; Librado, P.; Ramos-Onsins, SE.; Sánchez-Gracia, A. DnaSP 6: DNA sequence polymorphism analysis of large data sets. Mol. Biol. Evol. 2017, 34, 3299–3302. [Google Scholar] [CrossRef]
  46. Darling, A.C.; Mau, B.; Blattner, F.R.; Perna, N.T. Mauve: multiple alignment of conserved genomic sequence with rearrangements. Genome Res. 2004, 14, 1394–1403. [Google Scholar] [CrossRef] [PubMed]
  47. Amiryousefi, A.; Hyvönen, J.; Poczai, P. IRscope: an online program to visualize the junction sites of chloroplast genomes. Bioinformatics 2018, 34, 3030–3031. [Google Scholar] [CrossRef] [PubMed]
  48. Katoh, K.; Standley, D.M. MAFFT multiple sequence alignment software version 7: improvements in performance and usability. Mol. Biol. Evol. 2013, 30, 772–780. [Google Scholar] [CrossRef] [PubMed]
  49. Wang, D.; Liu, F.; Wang, L.; Huang, S.; Yu, J. Nonsynonymous substitution rate (Ka) is a relatively consistent parameter for defining fast-evolving and slow-evolving protein-coding genes. Biol. Direct 2011, 6, 13. [Google Scholar] [CrossRef]
  50. Castresana, J. Selection of conserved blocks from multiple alignments for their use in phylogenetic analysis. Mol. Biol. Evol. 2000, 17, 540–552. [Google Scholar] [CrossRef]
  51. Stamatakis, A. RAxML version 8: a tool for phylogenetic analysis and post-analysis of large phylogenies. Bioinformatics 2014, 30, 1312–1313. [Google Scholar] [CrossRef]
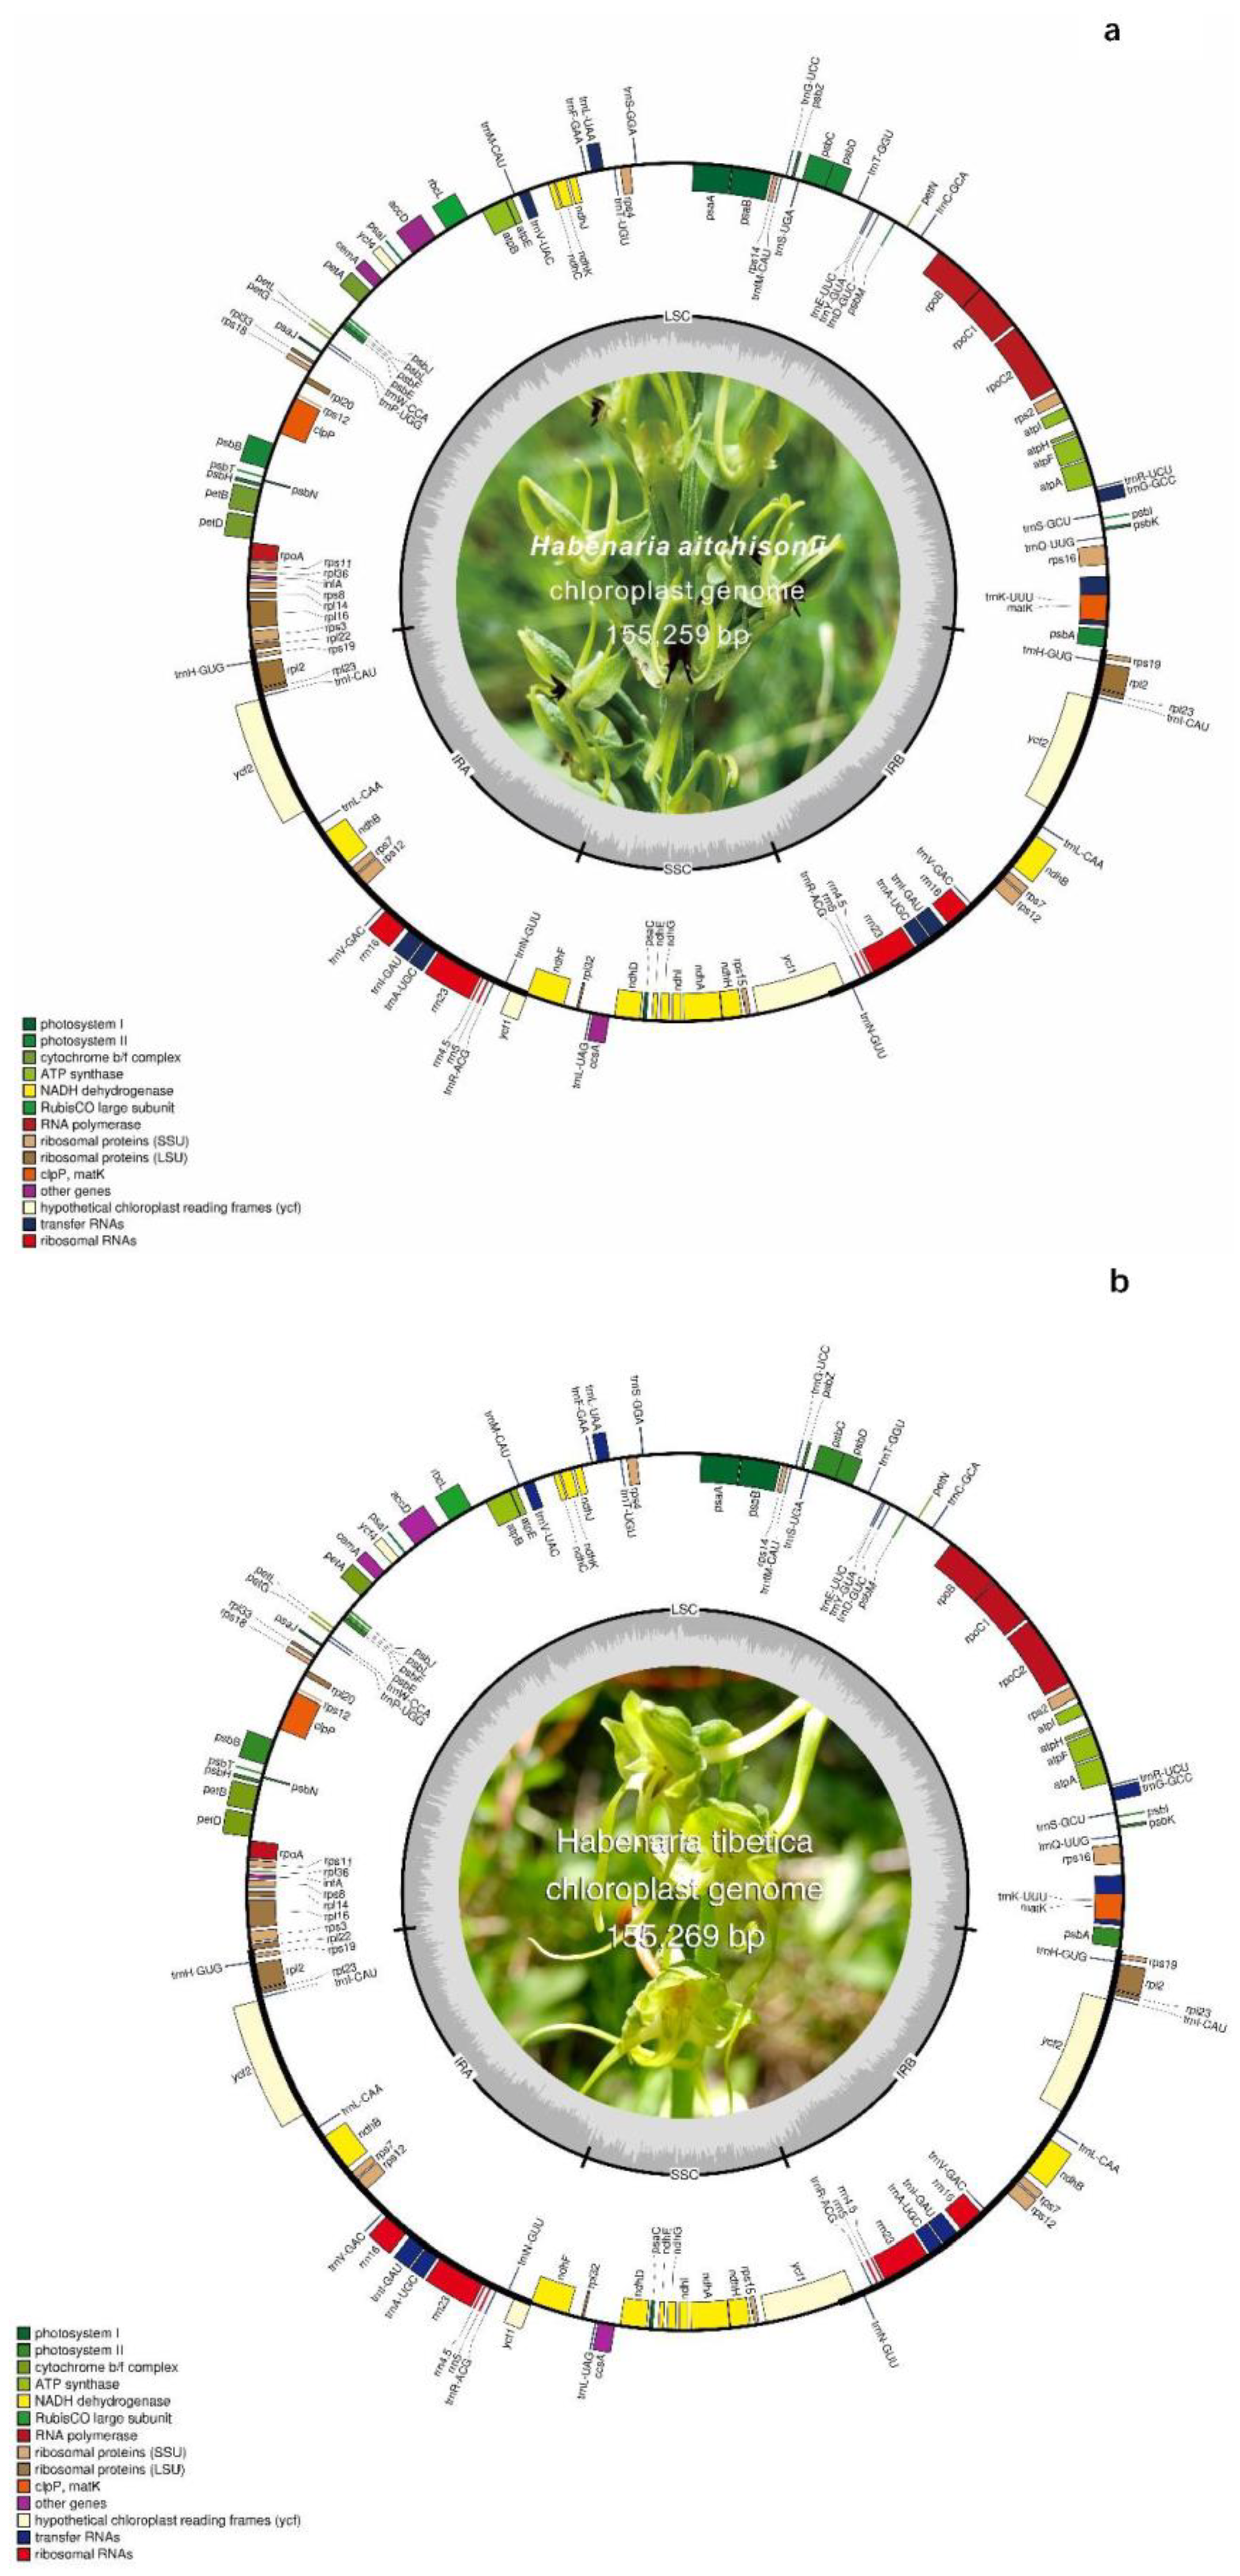
Figure 1. Chloroplast genome maps of Habenaria aitchisonii Rchb.f.(a) and Habenaria tibetica Schltr.ex Limpricht H. (b). Genes of different functional groups are displayed in color-coded. The darker gray color in the inner correspond to the GC content, regions of the large single-copy (LSC), small single copy (SSC) and inverted repeat (IRA and IRB) are indicated.
Preprints 108772 g001
Figure 2. Mauve alignment of organization of the plastomes of nine Habenaria species based on collinear blocks. The green part is inversion of single copy and the small blocks of various color represents genes (the black is tRNA, the red is rRNA, the white is protein-coding and the green is intron-containing tRNA).
Preprints 108772 g002
Figure 3. Analyses of expansion and contraction of inverted repeats in the nine Habenaria chloroplast genomes.
Preprints 108772 g003
Figure 4. The comparative analysis of codon usage bias in Habenaria and other species. (Habenaria 1: seven other Habenaria species; Habenaria 2: H.tibetica and H.aitchisonii).(A) ENC effective number of codons;(B) GC3s GC of synonymous codons in 3rd position;(C) G3s GC of synonymous codons in 3rd position;(D) CBI codon bias index;(E) CAI codon adaptation index;(F) Fop Frequency of optimal codons index.
Preprints 108772 g004
Figure 5. Comparison of SSR profiling and the oligonucleotide repeats in the nine Habenaria species. (a. SSR profiling; b. oligonucleotide repeats).
Preprints 108772 g005aPreprints 108772 g005b
Figure 6. Nucleotide variability values compared between the nine chloroplast genomes of Habenaria species using the window sliding analysis.
Preprints 108772 g006
Figure 7. The pairwise Ka/Ks were analyzed in nine species of Habenaria.
Preprints 108772 g007
Figure 8. The Phylogenetic relationships of two new Habenaria species and related species of Orchidaceae using ML method. Bootstrap values were shown at the nodes.
Preprints 108772 g008aPreprints 108772 g008b
Table 1. General characteristics of the chloroplast genomes of the nine Habenaria species. Comparison analyses of H.aitchisonii and H. tibetica with other close species.
Genome feature H. aitchisonii H.tibetica H.dentata H.cruciformis H.ciliolaris H.radiata H.flagellifera H.checiformis H.pantlingiana
Genome Size(bp) 155,259 155,269 153,682 155,708 154,544 155, 353 155,298 153,896 153,951
LSC (bp) 84,234 84,143 83,963 85,131 84,032 84, 833 85,749 83,732 83,641
SSC (bp) 17,643 17,646 17,041 17,659 19,602 17, 718 18,373 17,026 17,370
IR (bp) 26,691 26,740 26,339 26,459 25,455 26,401 25,595 26,569 26,470
GC content (%) 36.83 36.84 36.62 36.60 37.90 36.60 37.90 36.70 36.60
Total numberof genes 132 132 133 131 132 113 130 131 133
Protein-coding gene 86 86 87 79 86 79 81 85 87
tRNA 38 38 37 30 38 30 37 38 38
rRNA 8 8 8 4 8 4 8 8 8
Table 2. The potential positive selection test based on the branch-site model.
Gene name Null hypothesis Alternative hypothesis Significant test
InL df ω InL df ω BEB p-value
cemA -1967.69 1 1 -1971.76 3 0.547 104K p<0.05
petA -2147.03 1 1 -2147.03 3 1.000 none p>0.05
rps11 -1126.26 1 1 -1124.08 3 999.0 38V,82A,88T p<0.05
ndhi -1371.40 1 1 -1369.59 3 147.6 38I,95F p<0.05
psbH -493.70 1 1 -492.37 3 999.0 10S p<0.05
psbK -462.73 1 1 -462.73 3 2.140 none p>0.05
rpl14 -851.21 1 1 -850.77 3 52.192 17Q,119P p>0.05
rpl22 -1130.19 1 1 -1130.11 3 1.643 120V p>0.05
ycf1 -23972.75 1 1 -23972.75 3 1.000 none p<0.05
ycf2 -16608.99 1 1 -16608.99 3 1.000 None p<0.05
Disclaimer/Publisher’s Note: The statements, opinions and data contained in all publications are solely those of the individual author(s) and contributor(s) and not of MDPI and/or the editor(s). MDPI and/or the editor(s) disclaim responsibility for any injury to people or property resulting from any ideas, methods, instructions or products referred to in the content.
Copyright: This open access article is published under a Creative Commons CC BY 4.0 license, which permit the free download, distribution, and reuse, provided that the author and preprint are cited in any reuse.
Prerpints.org logo

Preprints.org is a free preprint server supported by MDPI in Basel, Switzerland.

Subscribe

© 2024 MDPI (Basel, Switzerland) unless otherwise stated