Submitted:

07 June 2024

Posted:

11 June 2024

You are already at the latest version

Abstract
An analysis of 1300+ existing ACE mutations revealed that 400+ are damaging and led us to hy-pothesize that carriers of heterozygous loss-of-function (LoF) ACE mutations (which result in low ACE levels) could be at risk for the development of late-onset Alzheimer’s disease (AD) [Danilov, 2024]. Here we quantified blood ACE levels in EDTA-plasma from 41patients with 10 different heterozygous ACE mutations, as well as 33 controls, and estimated the effect of these mutations on ACE phenotype using a set of mAbs to ACE and two ACE substrates. We found that relatively frequent (~1%) AD-associated ACE mutations in the N domain of ACE, Y215C and G325R are truly damaging and, likely, transport-deficient, with ACE levels in plasma only ~50% of controls. Another AD-associated ACE mutation, R1250Q, in the cytoplasmic tail, did not cause a decrease in ACE and, likely, did not affect surface ACE expression. We have also developed a method to identify patients with anti-catalytic mutations in the N domain. These mutations may result in reduced degradation of amyloid beta peptide Aβ42, an important component for amyloid deposition. Consequently, these could pose a risk factor for the development of AD. Therefore, a systematic analysis of blood ACE levels in patients with all ACE mutations has potential to identify individuals at an increased risk of late-onset AD. These individuals may benefit from future preventive or therapeutic interventions involving a combination of chemical and pharmacological chaperones, as well as proteasome inhibitors, aiming to enhance ACE protein traffic. This approach has been previously demonstrated in a cell model of the transport-deficient ACE mutation, Q1069R [Danilov, 2010].
Keywords: 
Subject: 
Medicine and Pharmacology  -   Neuroscience and Neurology

1. Introduction

Alzheimer’s disease (AD) is the most common cause of dementia and a growing global health concern, afflicting about 35 million people worldwide. Extracellular β-amyloid peptide (Aβ42) deposition in senile plaques [1] is considered to initiate a cascade of events leading to AD development. Multiple genes have been linked to AD risk, but AD etiology remains incompletely understood. Rare cases of early-onset familial AD are associated with mutations in amyloid precursor protein APP, and presenilins (PS1 and PS2), while late-onset AD is multifactorial and associated with mutations and polymorphic alleles in APOE, and up to 40 [2,3] other different genetic risk loci involved in vascular dysfunction, immunity and inflammation, cholesterol metabolism, endocytosis, and ubiquitination.
One such gene associated with AD risk is the gene for Angiotensin-Converting Enzyme (ACE, CD143, EC 3.4.15.1) [4,5,6]. ACE is a Zn2+-dipeptidyl carboxypeptidase which metabolizes a number of metabolically active peptides and is a central component of the renin-angiotensin system. It plays key roles in blood pressure control, the development of vascular pathology, and innate immunity (reviewed in [7,8]. The mechanism responsible for the association of “ACE gene – AD” may be direct and straightforward. Specifically, the N domain active center of ACE degrades in vitro the major Aβ component of the plaques, Aβ42 [9]. Therefore, less ACE may result in increased Aβ42 levels and a higher risk of AD.
Recently, we analyzed multiple existing sequencing databases for ACE mutations and found 1300+ ACE mutations, among which 400+ were potentially damaging [10]. High predicted frequency of damaging ACE mutations (about 3% in general population) suggests that a significant number of individuals could therefore have very low ACE activity. These data inspired the hypothesis that carriers of heterozygous loss of function (LoF) ACE mutations may be at increased risk for Alzheimer’s because they have only one functional allele and thus are expected to have only half the normal level of ACE activity. While most homozygous carriers of LoF ACE mutations die in utero [11,12], heterozygous ones may function quite normally, except for the enhanced risk of Aβ42 accumulation and, as a result, late-onset AD development [10].
The aim of this current work was to establish an approach to quantify blood ACE levels in EDTA-plasma from patients with different ACE mutations (the only source of blood ACE in sequencing facilities) and estimate the effect of these ACE mutations on different characteristics of ACE phenotype (including catalytic properties) using a set of mAbs to ACE and two ACE substrates.
We found that quite frequent (about 1%) AD-associated ACE mutations, Y215C [6] and G325R [5], are truly damaging and likely transport-deficient, because most of the carriers of these mutations possessed only about half ACE in the blood in comparison to control patients without ACE mutations. Patients with another relatively frequent ACE mutation, R1250Q, which is also associated with AD [13], had practically normal blood ACE levels, indicating that mechanism of association this ACE mutation with AD may be different from that for ACE mutations Y215C and G325R (which could be simply due to decrease in surface ACE expression). We also established an approach to detect patients with damaging anti-catalytic mutations in the N domain active center, which could be AD-associated, because Aβ42 is preferentially degraded by this domain [9].
This analysis's key finding is identifying patients carrying transport-deficient ACE mutations, resulting in low ACE levels, who could benefit from preventive or therapeutic interventions. These interventions may involve a combination of chemical and pharmacological agents, such as centrally acting ACE inhibitors, along with chaperones and proteasome inhibitors, aimed at restoring impaired surface ACE expression. This approach has been previously successful in addressing another transport-deficient ACE mutation (Q1069R), known to cause Renal Tubular Dysgenesis (RTD) [14].

2. Materials and Methods

Study Participants

The collection of human blood samples was approved by the Ethics Committee of the Petrovsky National Research Centre of Surgery, Moscow, Russia, and the protocol for whole exome screening of newborns was reviewed and approved by the Ethics Committee of the Kulakov National Medical Research Center for Obstetrics, Gynecology and Perinatology (protocol No. 9 from 10.22.2020). All corresponding procedures were carried out in accordance with institutional guidelines and the Code of Ethics of the World Medical Association (Declaration of Helsinki). All patients provided written informed consent for sample collection, subsequent analysis, and publication thereof. The parents of the newborns gave written informed consent for the use of any data for scientific purposes. The whole study included blood samples from 35 adults, 17 with ACE mutations and 18 controls, and blood samples from 39 newborns, 24 with ACE mutations and 15 controls.

Whole Exome Sequencing

Genomic DNA isolation, quality assessment, DNA library preparation, further enrichment according to the “RSMU exome” protocol" and sequencing were performed as recently described [15] with SureSelect Human All Exon v7 baits (Agilent Technologies). Enriched DNA libraries were sequenced on DNBSEQ G-400 (MGI Tech) in PE100 mode to target mean coverage above 100x.
The quality control of the obtained paired fastq files was made by FastQC v0.11.9. [16]. Based on the quality metrics, the fastq files were trimmed using BBDuk by BBMap: https://github.com/BioInfoTools/BBMap. Reads were aligned to the indexed reference genome GRCh37 using bwa-mem2. SAM files were converted into BAM files and sorted using SAMtools v1.10 to check the percentage of the aligned reads [17]. Duplicates in the resulting bam files were marked using Picard MarkDuplicates v2.22.4:Broad Institute GitHub: Picard. URL: https://broadinstitute.github.io/picard and were excluded from further analysis. For samples that passed quality control (with a target coverage width 10x≥95%), single-nucleotide variants (SNVs) and indels were called using the bcftoolsmpileup [18] and DeepVariant [19]. Subsequently, vcf files were obtained for each sample. After variant calling, vcf files were normalized using vtnormalize [20] and filtered by target regions extended by +-100 base pairs from each end. Variant calling data were annotated with InterVar [21].

Chemicals

ACE substrates, benzyloxycarbonyl-L-phenylalanyl-L-histidyl-L-leucine (ZPHL) and hippuryl-L-histidyl-L-leucine (HHL) were purchased from Bachem Bioscience Inc. (King of Prussia, PA) and Sigma (St. Louis, MO). Other reagents (unless otherwise indicated) were obtained from Sigma (St. Louis, MO).

Antibodies

The antibodies to human ACE used in this study recognize native conformations of the N and C domains of human ACE as described previously [22,23,24].

ACE Activity Assay

ACE activity was measured using a fluorometric assay with two ACE substrates, 2 mM ZPHL or 5 mM HHL [25,26]. The parameter ZPHL/HHL ratio was calculated as the ratio of the rates of the hydrolysis of ZPHL and HHL by the definite ACE sample [27].

Immunological Characterization of the Blood ACE

In order to quantify the amount of immunoreactive ACE protein in EDTA-plasma, we applied an immunoassay in which native ACE from plasma samples was captured by anti-ACE mAbs recognizing conformational epitopes on the surface of ACE molecules. Microtiter (96-well) plates (Corning, Corning, NY) were coated with anti-ACE mAbs via goat anti-mouse IgG (Invitrogen, Rockford, IL or IMTEK, Moscow, Russia) bridge and incubated with plasma samples diluted 10 times. Next, after washing away the unbound ACE (together with EDTA and possible ACE inhibitors) precipitated ACE activity was quantified directly in the wells of the microtiter plates fluorometrically with ZPHL or HHL as substrates [25,26]. Conformational fingerprinting of blood ACE was performed as described earlier using a set of mAbs to different epitopes of ACE [22,23].

Statistical Analysis

Values of ACE activity with different substrates for each individual, as well as other parameters characterizing ACE phenotype, were determined as mean ± SD from at least 3 independent experiments with duplicates. Significance was analyzed using the Mann-Whitney test. Predictions and scores to account for evolutionary conservation and structural features were performed using PolyPhen-2 engine [28].

Localization of AD-Associated ACE Mutations on ACE Globule

Coordinates of the X-ray model of the human somatic ACE were downloaded from the PDB accession #7Q3Y for Figure 1, 6 and S2 [29], and coordinates for truncated N domain dimer were downloaded from the PDB accession #3NXQ for Figure 4 [30]. The hydrogen atoms were added, and the resulting models were rendered in PYMOL. For Figure 7, the structure of the transmembrane domain was obtained using the homology module in Molecular Operating Environment (MOE www.chemcomp.com) [10].

3. Results and Discussion

Quantification of blood ACE in Carriers of ACE Mutations

We previously have established an approach for characterization of ACE in the blood (“blood ACE phenotyping”) which includes measurement of ACE activity, quantification of immunoreactive ACE protein, and detection of a range of conformational changes in blood ACE using a set of mAbs to ACE [22,23,25,26,31,32]. Unfortunately, most sequencing facilities operate only with EDTA-containing plasma samples. This makes impossible to directly measure ACE activity due to the EDTA-mediated extraction of zinc-ion from the active centers of the enzyme. However, it is possible to use mAbs to ACE to precipitate it from EDTA-containing plasma, and then different ACE substrates can be used to characterize various ACE mutations in detail from these EDTA-treated plasma samples.
First, we determined plasma ACE protein levels (as an estimate of ACE activity) in EDTA-plasma samples from 17 adult carriers of different ACE mutations and 18 controls using a set of multiple mAbs to ACE [25]. We also determined ACE levels in blood samples obtained from newborns (24 carriers of 8 different ACE mutations and 15 controls) using only one mAb 9B9 due to the very limited volume of these plasma samples. Altogether, we analyzed blood samples from 41 carriers of 10 different ACE mutations. Eight of these mutations are in the N-domain of the ACE protein, one mutation (L18ins) appears to be in the signal peptide region (which is cleaved during maturation), and one mutation (R1250W) is located in the cytoplasmic tail [10,13]. Note that none of these samples contained mutations in the C domain of the ACE protein.
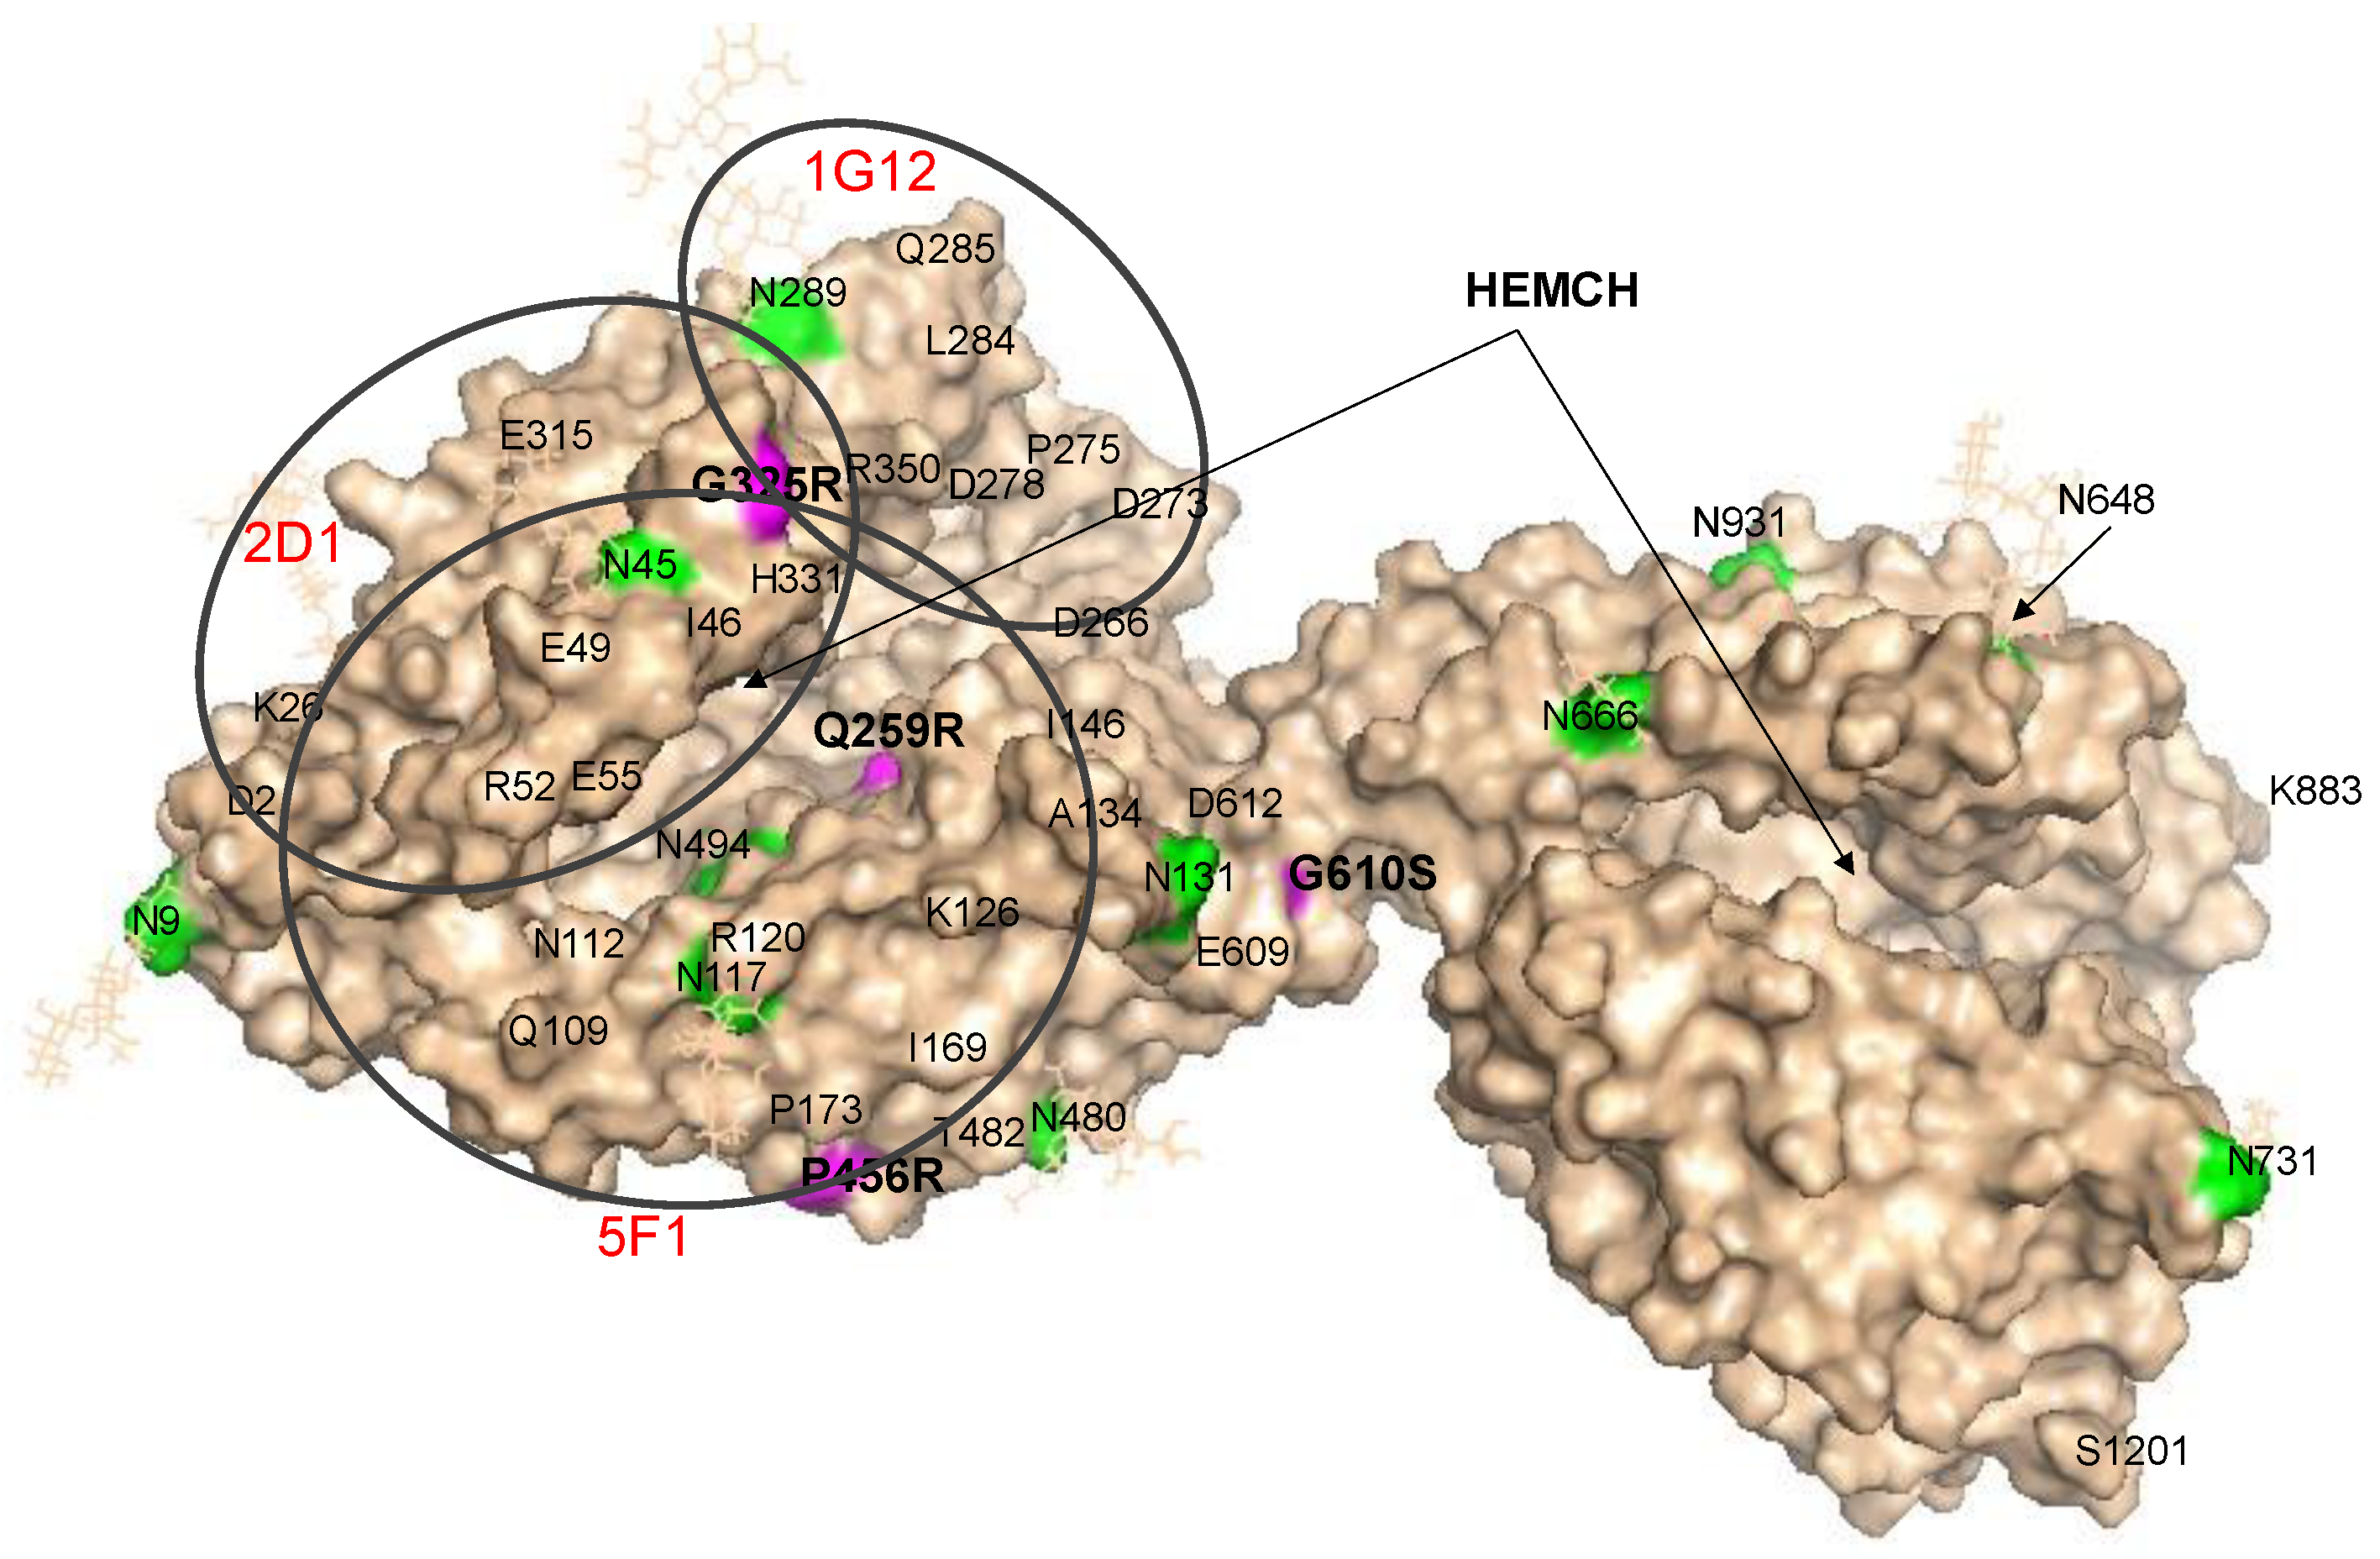
The molecular model shown in Figure 1 illustrates the locations of six visible ACE mutations in the N domain (marked by arrows and magenta color). Another mutation (R532W) is located on the opposite side of the protein structure, while the Q259R mutation is not visible because this amino acid site is inside the globule.
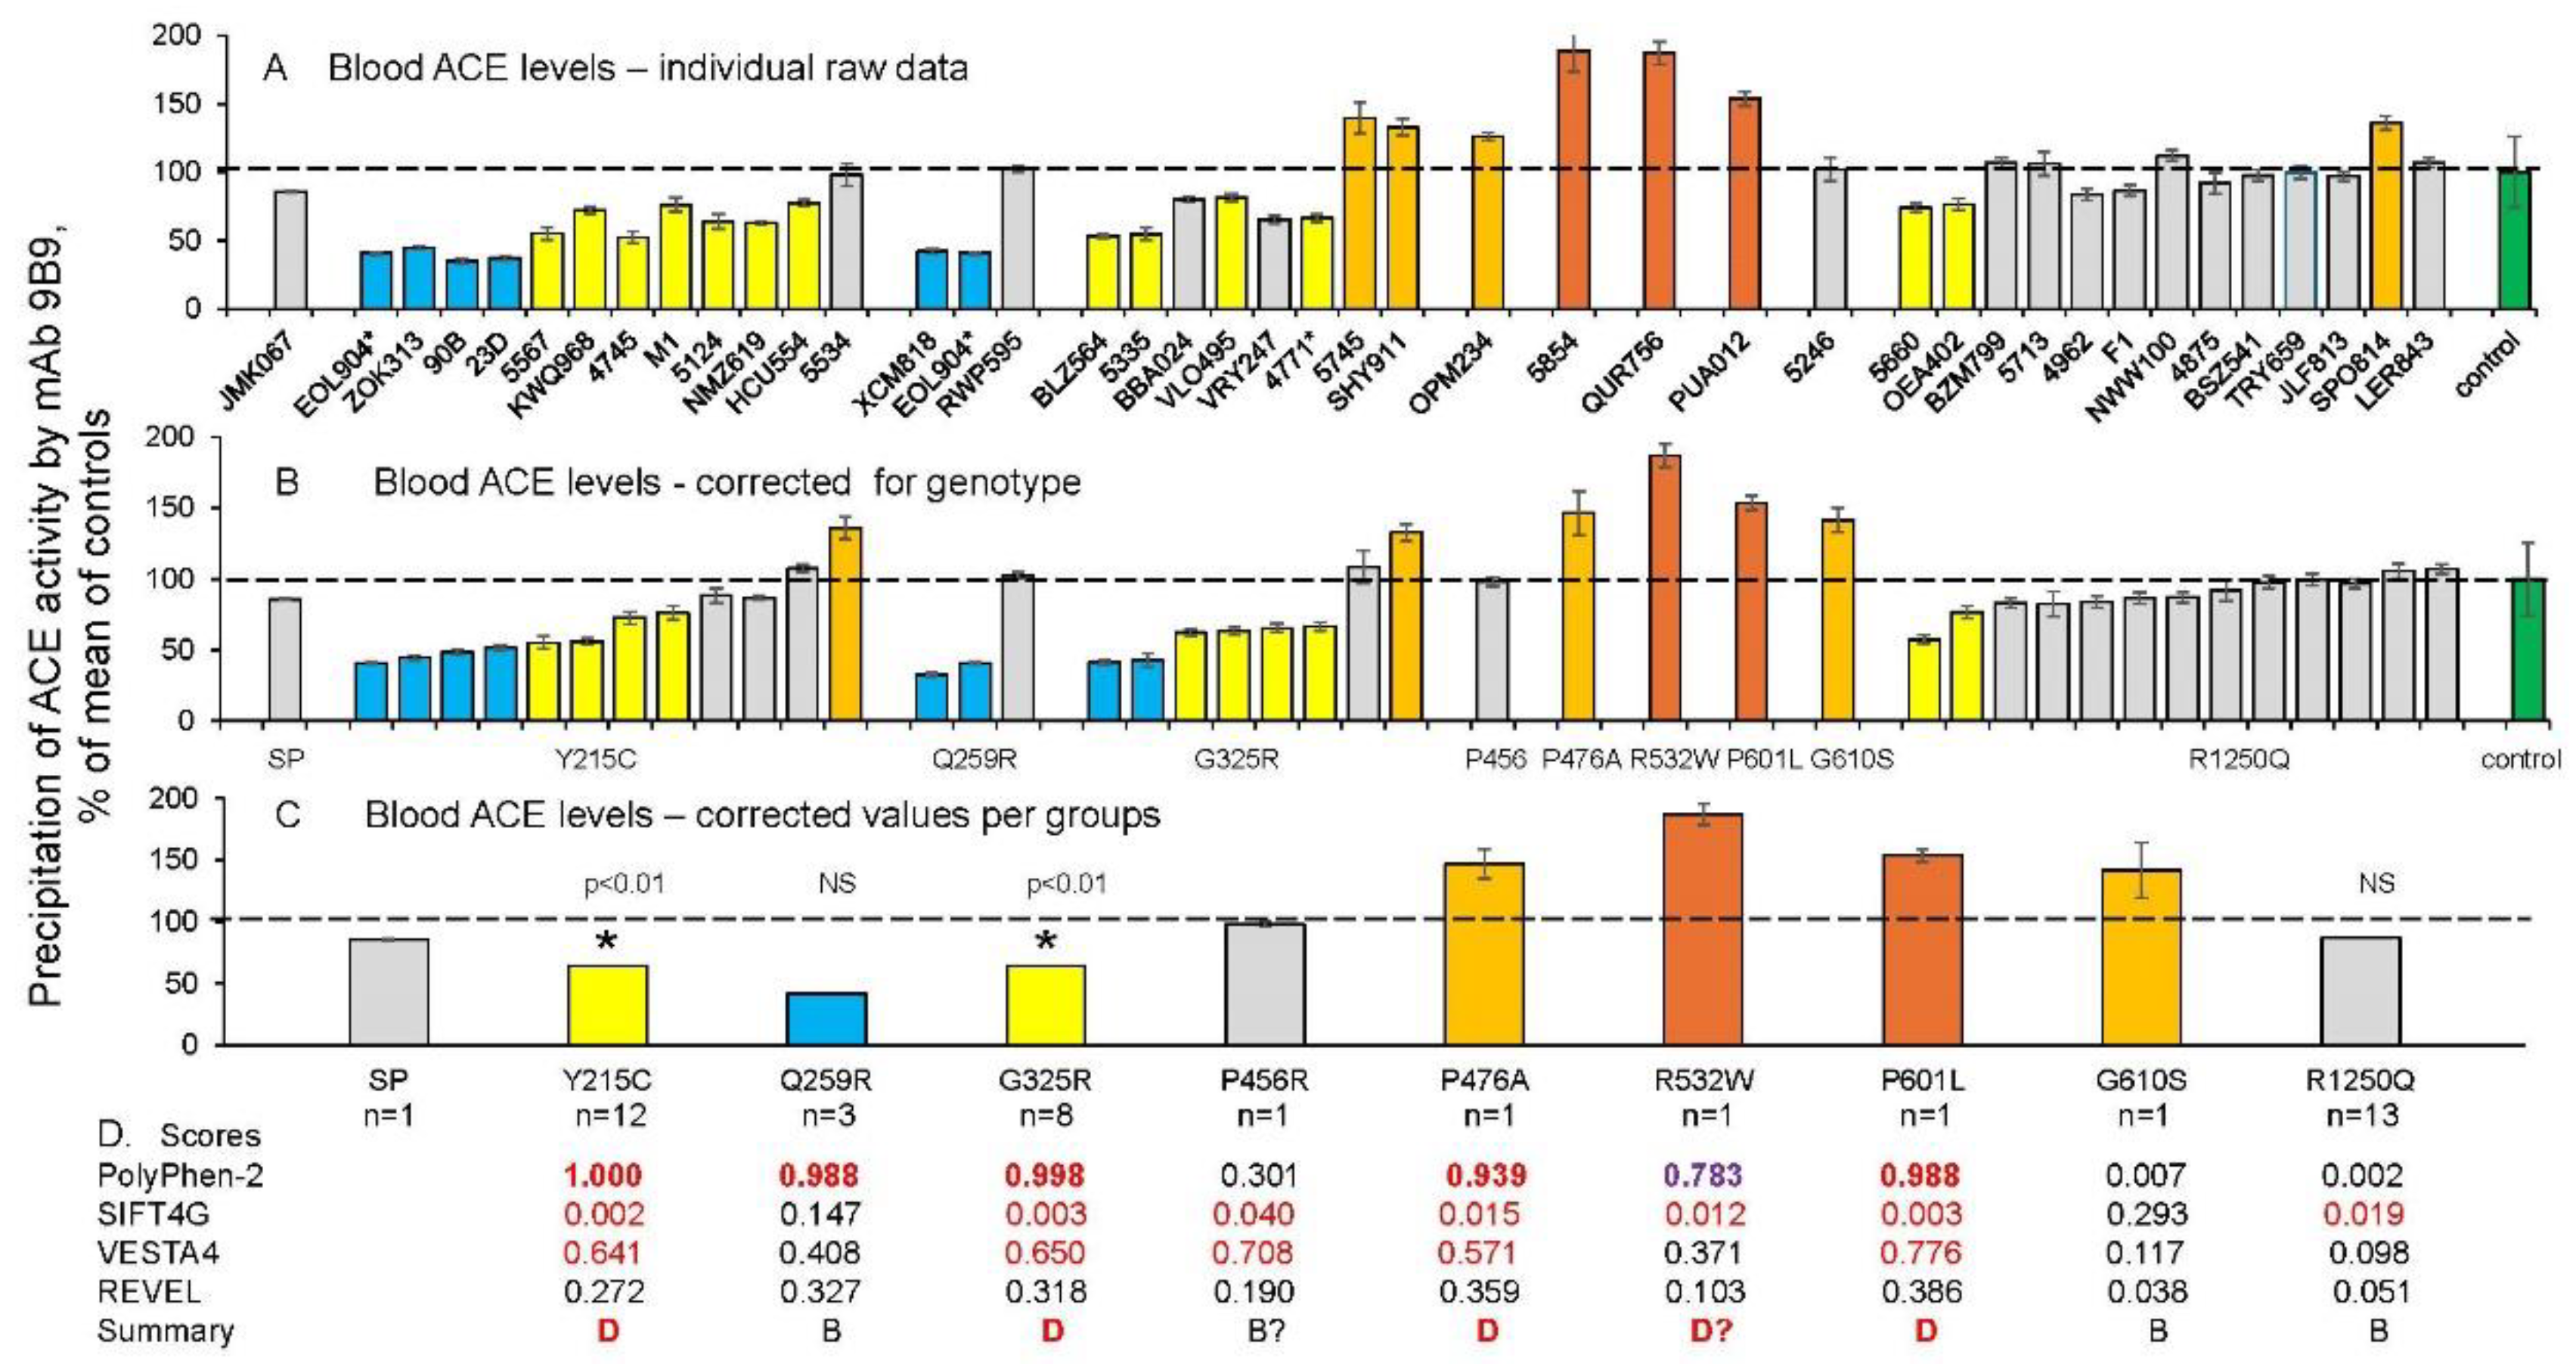
Shown in Figure 2A are ACE blood levels for all tested carriers of ACE mutations as determined using mAb 9B9.
We previously reported that a patient with ACE mutation R532W (rs4314) exhibited a highly elevated ACE plasma levels (approximately 5-fold). This elevation was attributed to a significant increase in ACE shedding, as the R532W mutant lacked the ability to bind to bilirubin and lysozyme. Consequently, the mutant protein could not adopt correct conformation on the cellular membrane [32,33]). In the current study we report the data for another subject with the R532W ACE mutation (patient QUR756) exhibits also elevated levels of ACE in plasma (Figure 2A-B), but not to such extent as in [33]. This difference in blood ACE levels between these two subjects with the R532W (rs4314) mutation may be explained in part by the fact that rs4314 results in two possible amino acid substitutions in the ACE protein - R532W and R532G. Another possible reason is that differential genomic imprinting may occur in these two patients with ACE mutation R532W (rs4314).
In addition, we found that carriers of two AD-associated mutations in the N domain of ACE, Y215C [6] and G325R [5], characterized by low ACE levels (Figure 2). These mutations are fairly common, comprising approximately 1% of the population identified to date. Thus, these mutations can be considered damaging (confirming the previously reported prediction by PolyPhen-2 score (Table S2 in [10]), and likely transport-deficient, because the blood ACE levels in samples from heterozygous carriers of these mutations were about 50% of controls (Figure 2A and B). It is worth noting that the positions of these damaging mutations are far apart on the structure of the ACE N domain (Figure 1).
In contrast, blood ACE levels were essentially normal in carriers of another frequent and AD-associated ACE mutation, R1250Q (Figure 2A and B), which is located in the cytoplasmic tail of ACE. Therefore, it is likely that the mechanism of association of this mutation with Alzheimer’s disease [13] is different than for ACE mutations Y215C and G325R.
No consistent pattern was noted in the three subjects with mutation Q259R. One possessed a normal ACE level, a second demonstrated an ~50% reduction in blood ACE (suggesting a possible transport-deficient effect), while a third Q259R carrier also had the damaging Y215C mutation as a possible explanation for the low ACE levels observed in this subject. Blood ACE levels were substantially elevated for several other ACE mutations: P476A, R532W, P601L and G610S (Figure 2A and B).
Accurate estimation of the impact of ACE mutations on blood ACE levels for any individual requires knowledge the ACE genotype on ACE I/D polymorphism, which is well known to influence blood and tissue levels of ACE [34,35,36]. Blood ACE levels in carriers of the DD genotype are 66% higher than in carriers of the II genotype [25,37]. Therefore, all values of blood ACE levels in carriers of the 10 mutations are expressed both as % mean in control samples without ACE mutations (Figure 2A), as well as after adjustment for the ACE genotype in each individual, as described in [38,39]. These adjusted results are presented in Figure 2B, which demonstrate both the influence of each mutation on blood ACE levels and inter-individual differences in these values for carriers of the same mutation.
The effects of each mutation on blood ACE levels as a group are also presented in Figure 2C. The damaging effects of Y215C on blood ACE levels were calculated as a median from the values of ACE levels for the 12 carriers of this mutation. Similarly, the damaging effects of G325R were calculated as a median from the values of ACE levels for the 8 carriers of this mutation, and the results were highly statistically significant (Figure 2C). The calculated median value for the 13 carriers of R1250Q confirms that this mutation does not influence on ACE level, while the results obtained for Q259R were statistically insignificant. Note, that only one blood sample was available from the other 6 mutations and, therefore, the putative effects of these mutations (Figure 2 and Figure S1) on blood ACE levels should be considered as preliminary estimates (Figure 2C). Nevertheless, we compared the predictive accuracy of the potential damaging effects of 9 mutations on the ACE protein using 4 different predictive tools (Figure 2D). This comparison was based upon analysis of evolutionary, population genetic and protein 3D structural constraints and generally demonstrated the accuracy of these predictions, especially using the PolyPhen-2 score.
Nevertheless, consideration of some of these mutations in more detail may be clinically and diagnostically important for personalized medicine. This potential is best exemplified by the 12 carriers of ACE mutation Y215C and 8 carriers of G325R which have been identified and analyzed. In 8 carriers of the Y215C mutation, blood ACE levels were dramatically decreased (shown as blue and yellow bars on Figure 2B), indicating that this may be a transport-deficient ACE mutation. Similarly, ACE levels were dramatically decreased in the blood of 6 carriers of G325R (also shown as blue and yellow bars on Figure 2B), these results are consistent with our previous report of another transport-deficient ACE mutation, Q1069R, characterized by half-normal ACE levels in heterozygous parents and practically absent blood ACE in a homozygous proband with renal tubular dysgenesis [14].
We recently demonstrated that transfection of HEK cells with a DNA construct carrying Y215C ACE mutant resulted in 6-10 fold less surface ACE expression than observed for WT ACE (Danilov, 2024 unpublished results), confirming our hypothesis that Y215C is a transport-deficient mutation. However, in the current study, three carriers of the Y215C mutation and one carrier of G325R have normal blood ACE levels. One person from each group even had increased ACE levels (grey and orange bars on Figure 2B). These findings may be due to at least two reasons: 1) significantly increased shedding of ACE produced by a gain-of-function mutation in the still unidentified ACE secretase, or due to mutations in the genes of ACE-binding proteins, such as albumin, lysozyme and several others, which could increase shedding of ACE and thus increase blood ACE levels; 2) a modifier gene mutation dramatically increasing surface ACE expression and thus masking the effects of the damaging Y215C ACE mutation. Analogous protecting mutations (RELN (H3447R) and APOECh (R136S)) were recently reported in carriers of PSEN-1 E280A mutations, which delayed the development of mild cognitive impairment and dementia in carriers of this PSEN1 mutation for about 20 years [40].
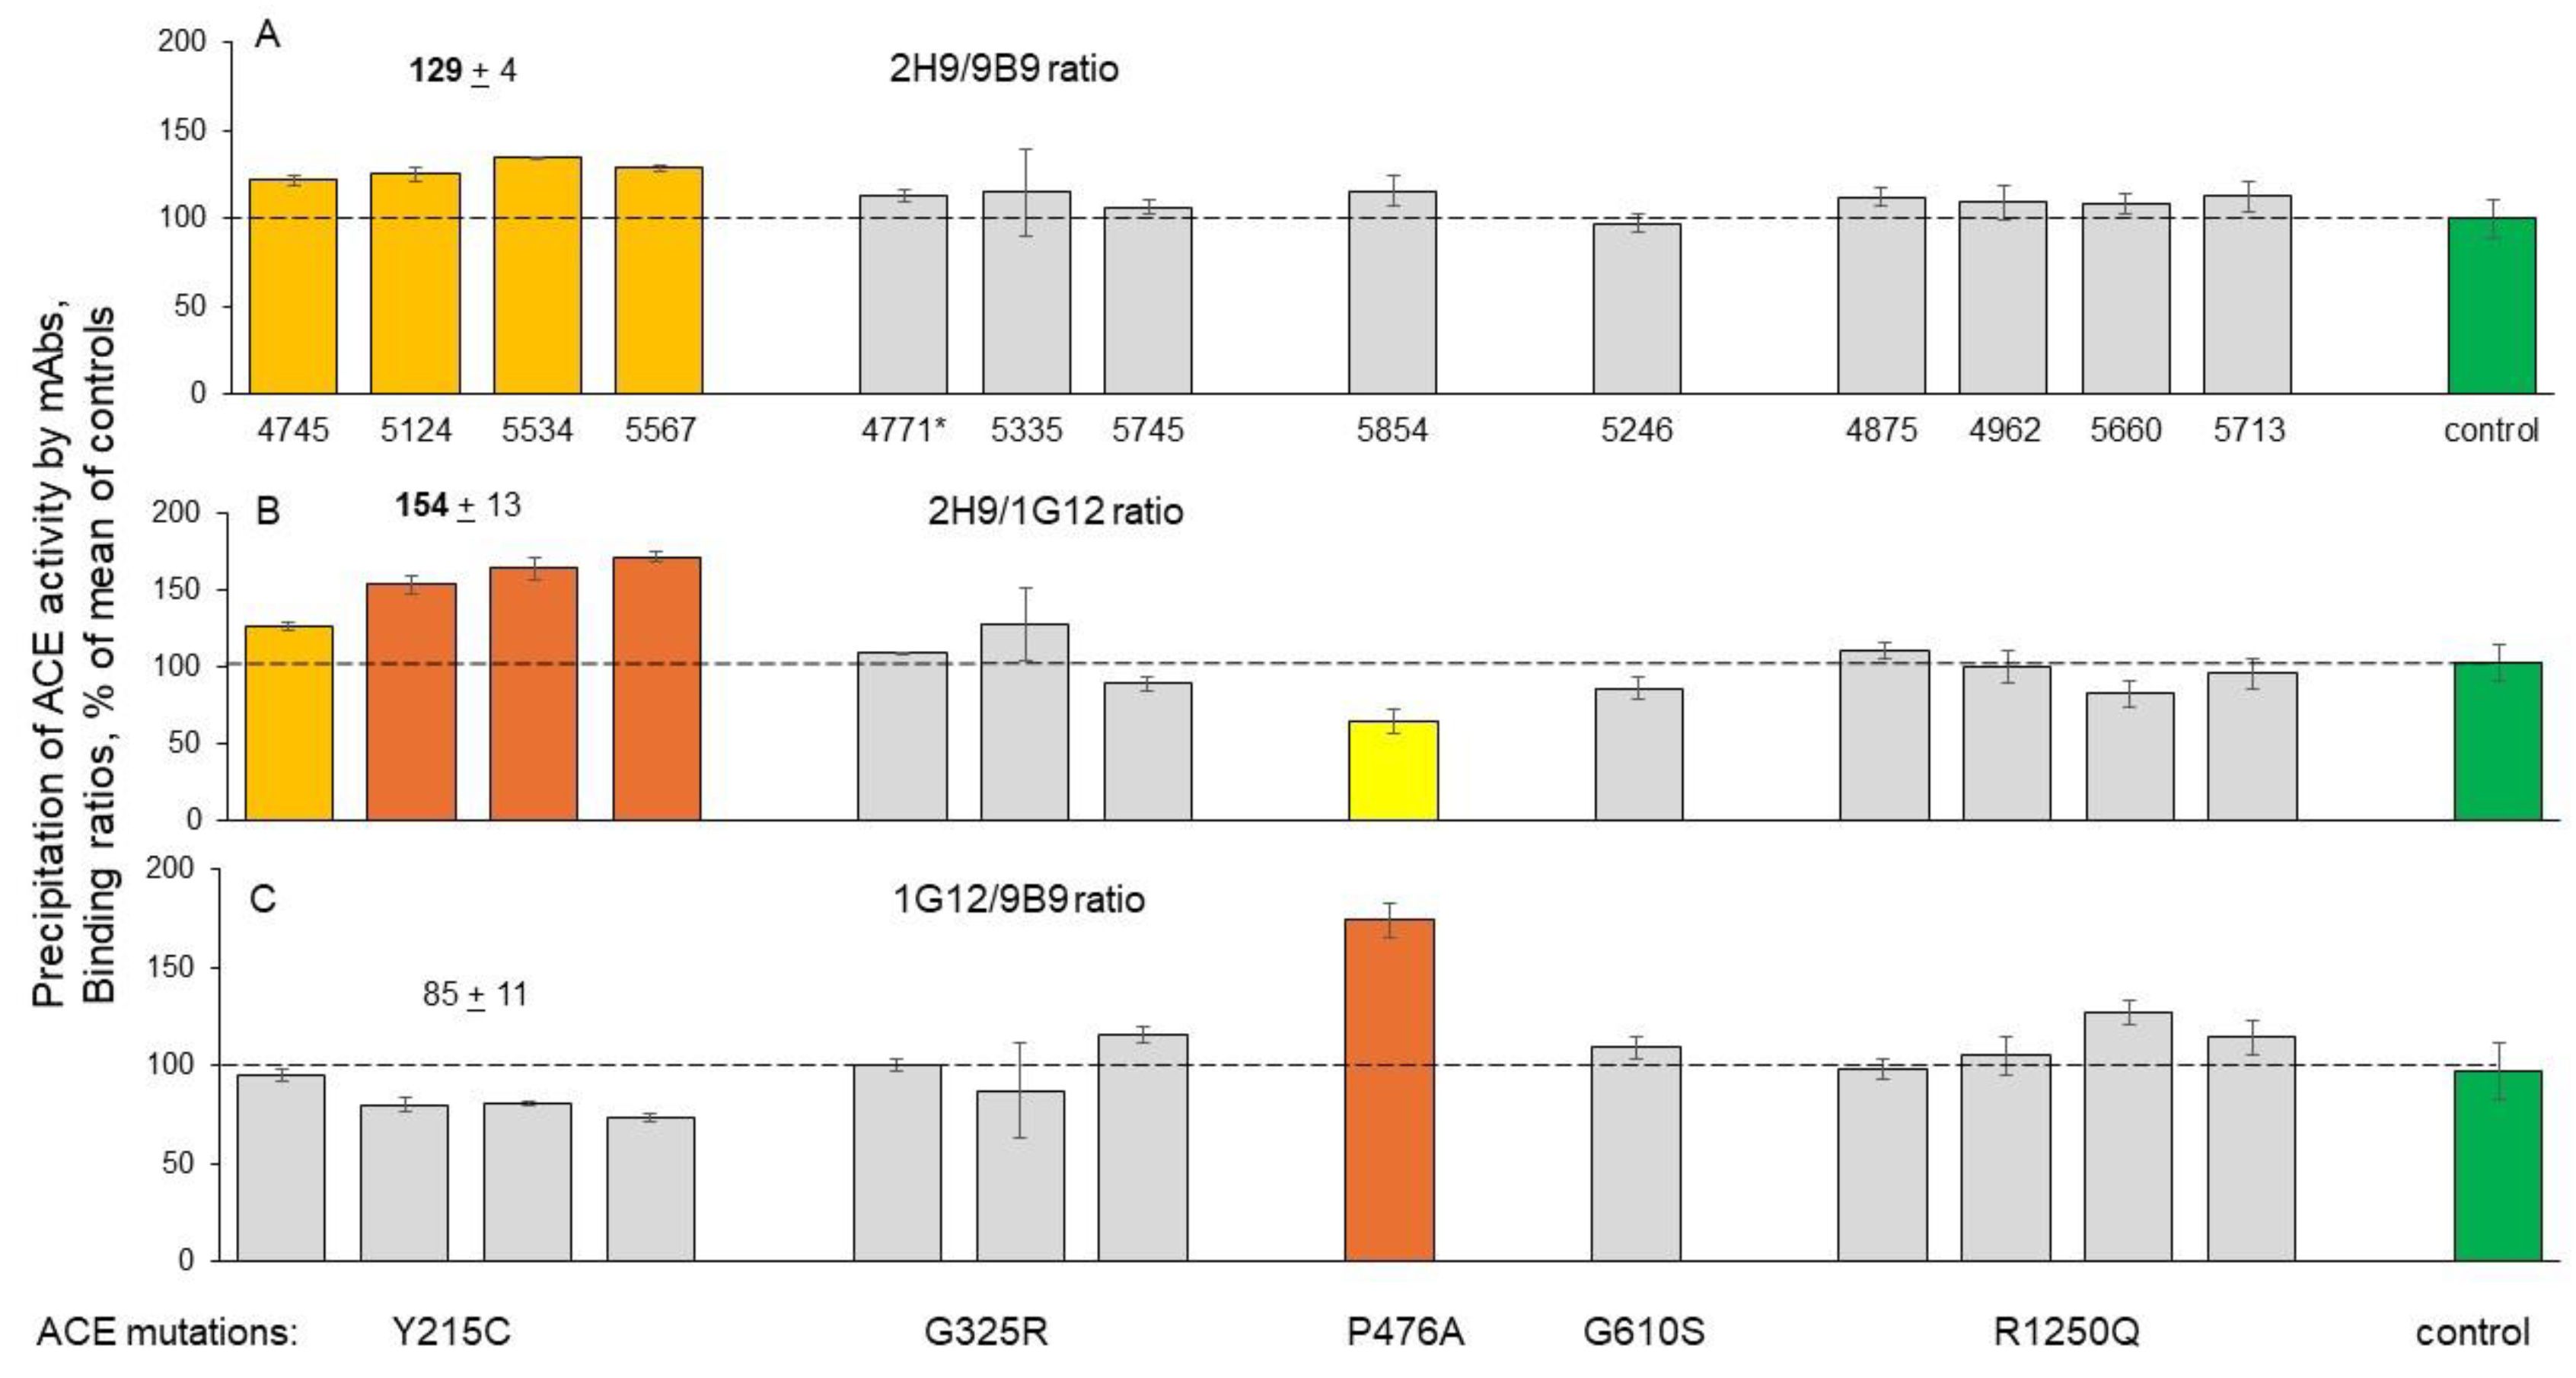
Blood ACE phenotyping provides a method for not only identifying damaging ACE mutations, but also for suggesting putative mechanisms by which these mutations could contribute to Alzheimer’s disease development. For example, a low level of ACE in the blood could be due to decreased surface ACE expression caused by a mutation that produces a transport deficiency (such as impaired trafficking of mutant ACE to the cell surface by Y215C and G325R). In this regard, it is important that Y215C mutant ACE (detailed localization is shown in Figure S2) can be detected (and quantified) in the blood using simultaneous ACE precipitation by two mAbs, one targeting the N domain (9B9 or 1G12) and another the C domain (mAb 2H9) of the enzyme. The results of this approach are presented in Figure 3.
The calculated 2H9/9B9 and 2H9/1G12 binding ratios effectively distinguish ACE with the Y215C damaging mutation from control ACE without any mutation, or from ACE with the other mutations characterized in this study, including the G325R damaging mutation (Figure 3). Both ratios, 2H9/9B9 (Figure 3A) and 2H9/1G12 (Figure 3B), are significantly higher for Y215C ACE than for the other ACE variants. This approach may have clinical utility in the future as an objective method to measure mutant ACE in the blood during therapeutic attempts to compensate for abnormal trafficking of the protein. In addition, Y215C mutant ACE is characterized by decreased values for the 9B9/i1A8 and 1G12/5F1 ratios of mAbs binding (Figure S1).
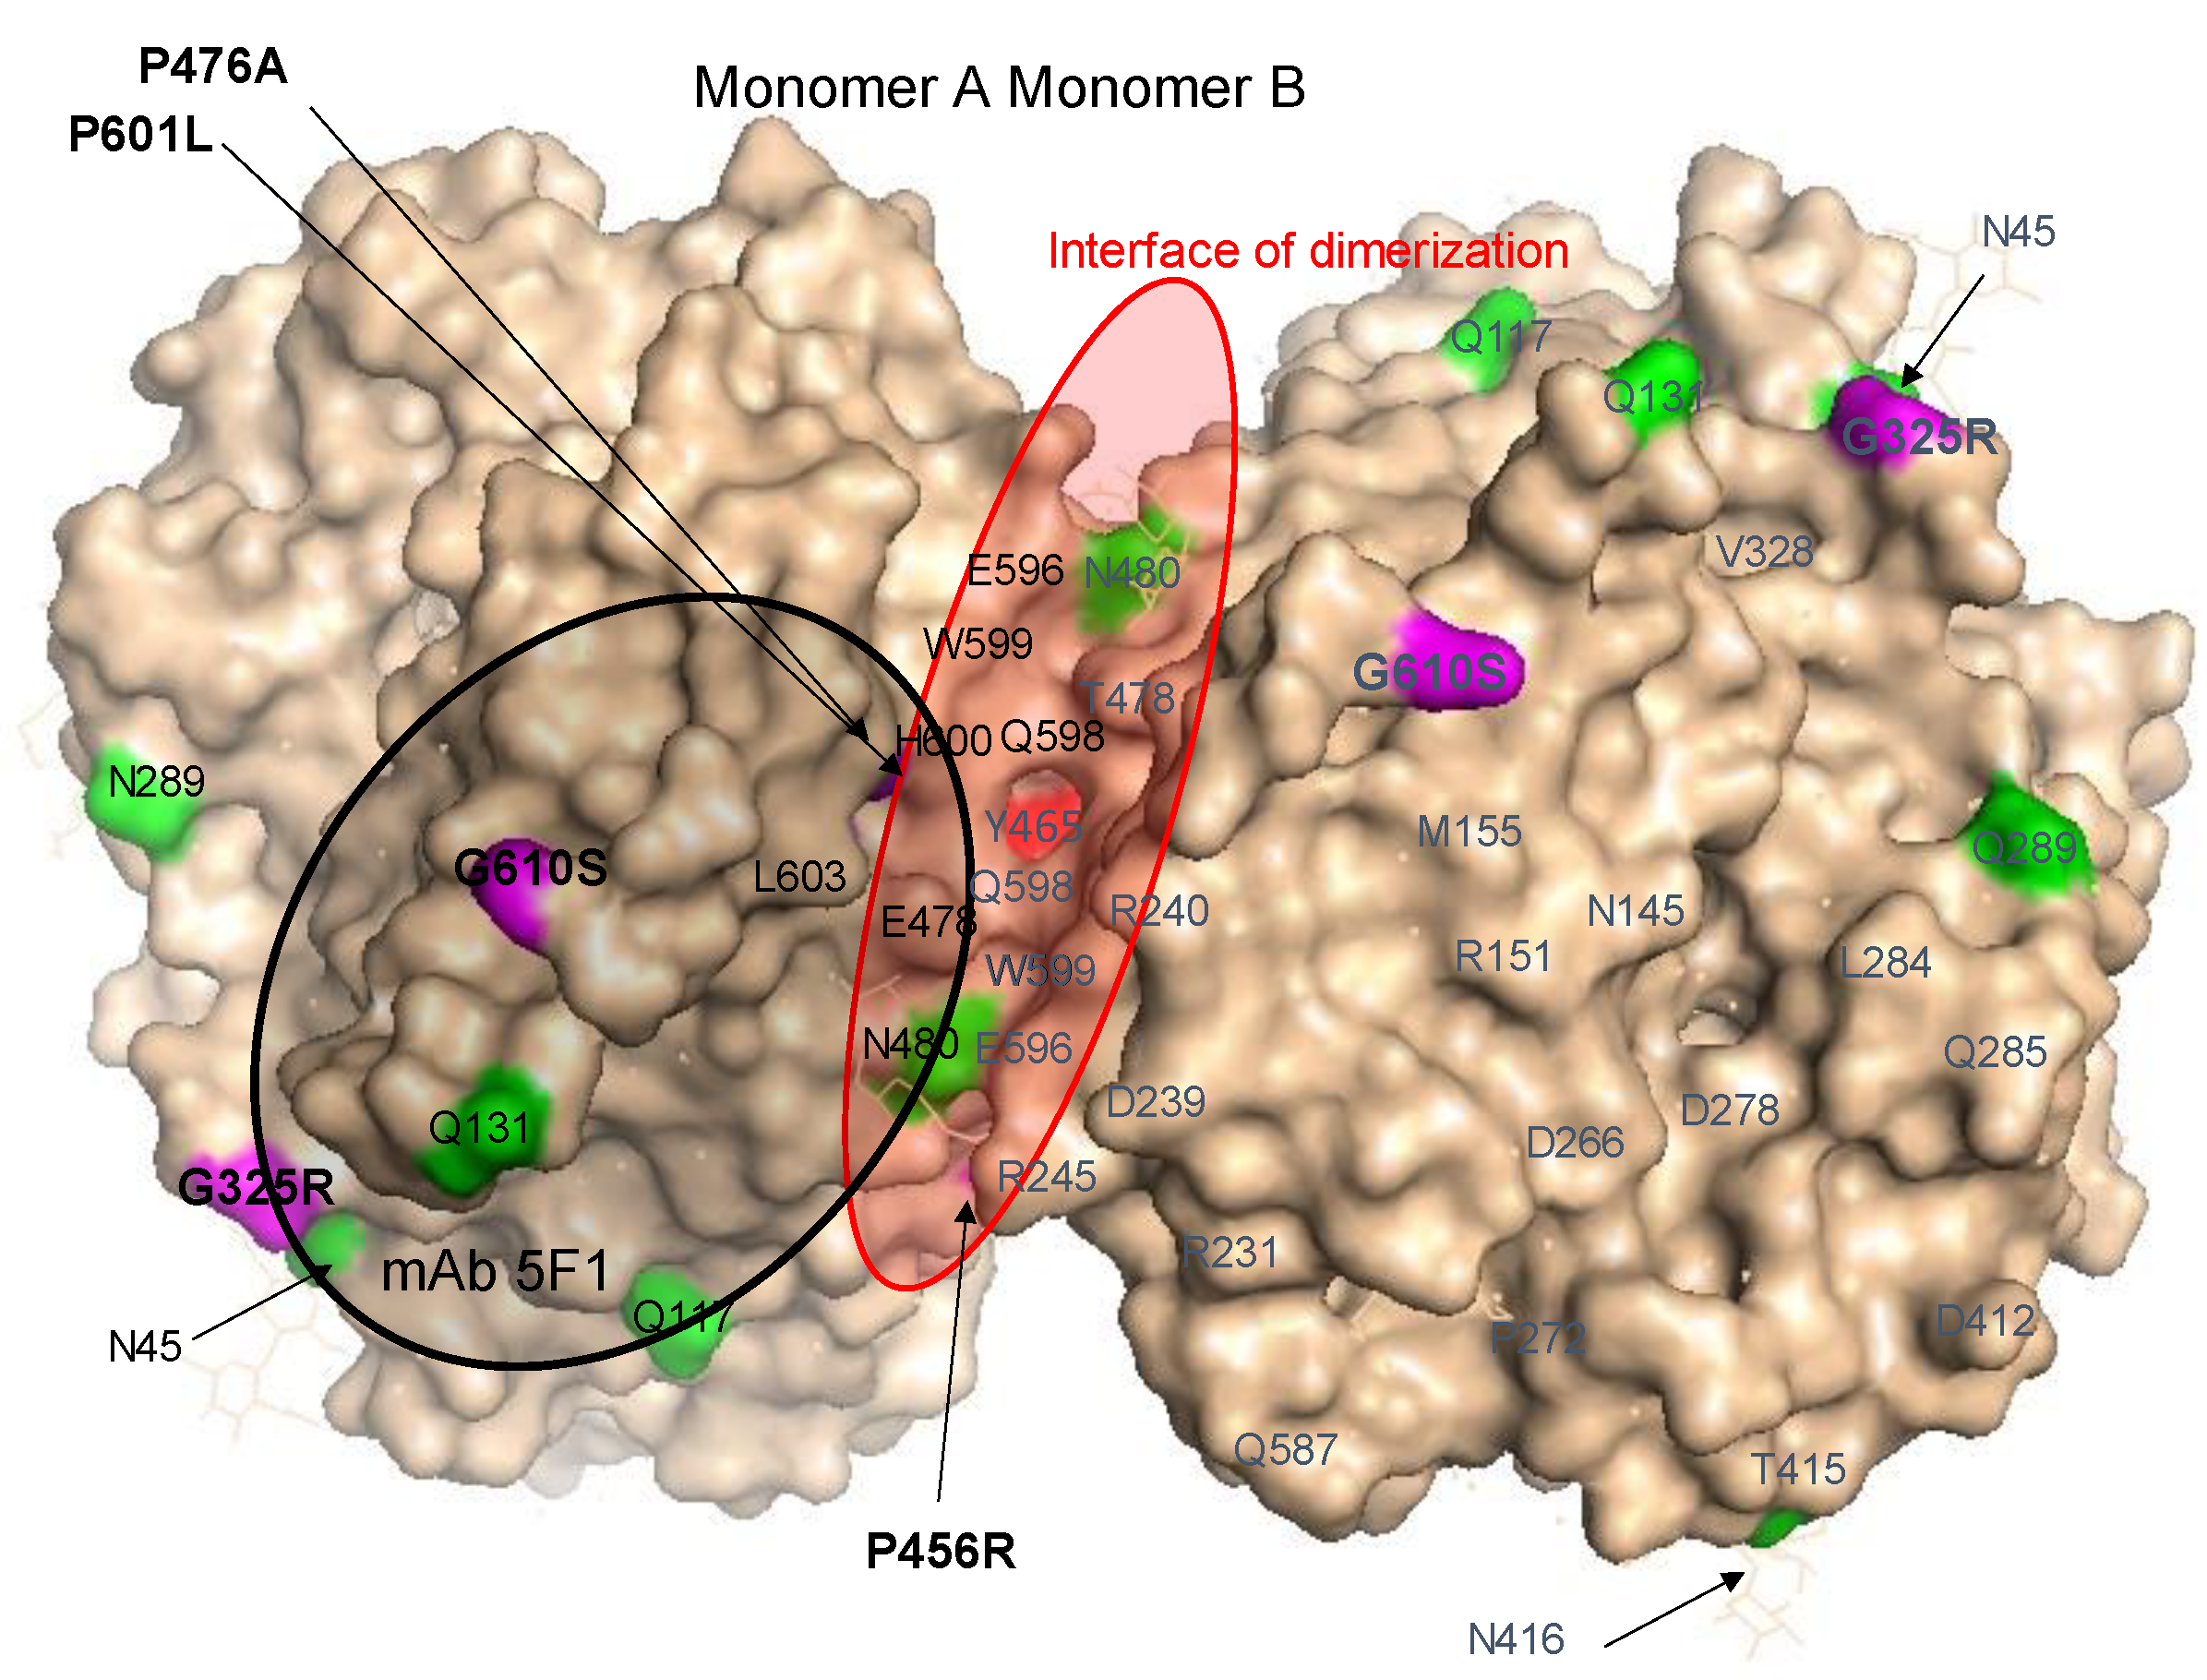
The subject with the P476A ACE mutation demonstrated significantly increased blood ACE levels estimated with not only mAb 9B9 (Figure 2A and B), but also using five other mAbs to the N domain of ACE (1G12, 2H9, i1A8, 2D1, 2D7) and one mAb, 2H9, with its epitope on the C domain but quite close to the N domain. However, the ACE level in this subject corresponded to the normal range when estimated with the mAb 5F1 to the N domain (Figure S3A). Localization of the P476A mutation in the N domain dimer and, more specifically, at the interface of ACE dimerization (Figure 4), suggests that the observed 2-fold increase in blood ACE level could be due to altered dimerization leading to higher shedding of this mutant ACE, similar to that in carriers of Y465D [41].
Thus, these results support previous predictions about the putative effects of mutations located at the interface of dimerization on ACE shedding [41,42). Note that patients with the Y465D mutation and dramatically increased (5-fold) blood ACE levels also demonstrated decreased blood ACE precipitation by mAb 5F1 [41]. The elevated 1G12/5F1 binding ratio (with ZPHL as a substrate) could be a marker of P476A ACE mutation (218% compared to control, p< 0.05) (Figure S1D).
ACE mutation G610S in an adult subject and ACE mutation P601L in a newborn patient (PUA012) are both located at the interface of N domain dimerization (Figure 4, see also [42]). The carriers of these mutations demonstrated increased blood ACE levels in comparison to control (Figure 2A and B, Figure S1, S3). The blood sample from newborn patient PUA012 was very small, so we were unable to determine the binding of different mAbs to ACE with P601L mutation. However, the G610S ACE mutation could be detected using the 1G12/5F1 binding ratio (with HHL as a substrate), suggesting that this ratio may be a marker for the G610S ACE mutation (158% from control, p< 0.05, calculated from Figure S1D).

Detection of Catalytic Abnormalities of Mutant ACEs Using EDTA-Plasma Samples

In addition to mutations that reduce ACE surface expression (such as Y215C and G325R), other types of mutations could alter ACE structure and function and potentially contribute to the development of Alzheimer’s disease. Since the peptide Ab42 is hydrolyzed in the N domain active center [9], mutations in this area of the ACE protein could decrease Ab42 hydrolysis and be a risk factor for the disease. To identify putative carriers of this type of mutation, we applied our previously established approach that involves precipitation of native ACE by mAbs from EDTA-plasma, detection of the enzyme activity with two substrates, ZPHL and HHL, and calculation of the ratio of the rates of the hydrolysis of these substrates (the ZPHL/HHL ratio) [22,26,31,43,44]. An increase in this ZPHL/HHL ratio indicates partial inhibition/denaturation of the C domain active center, while a decrease in the ZPHL/HHL ratio indicates inhibition/denaturation of the N domain active center [27].
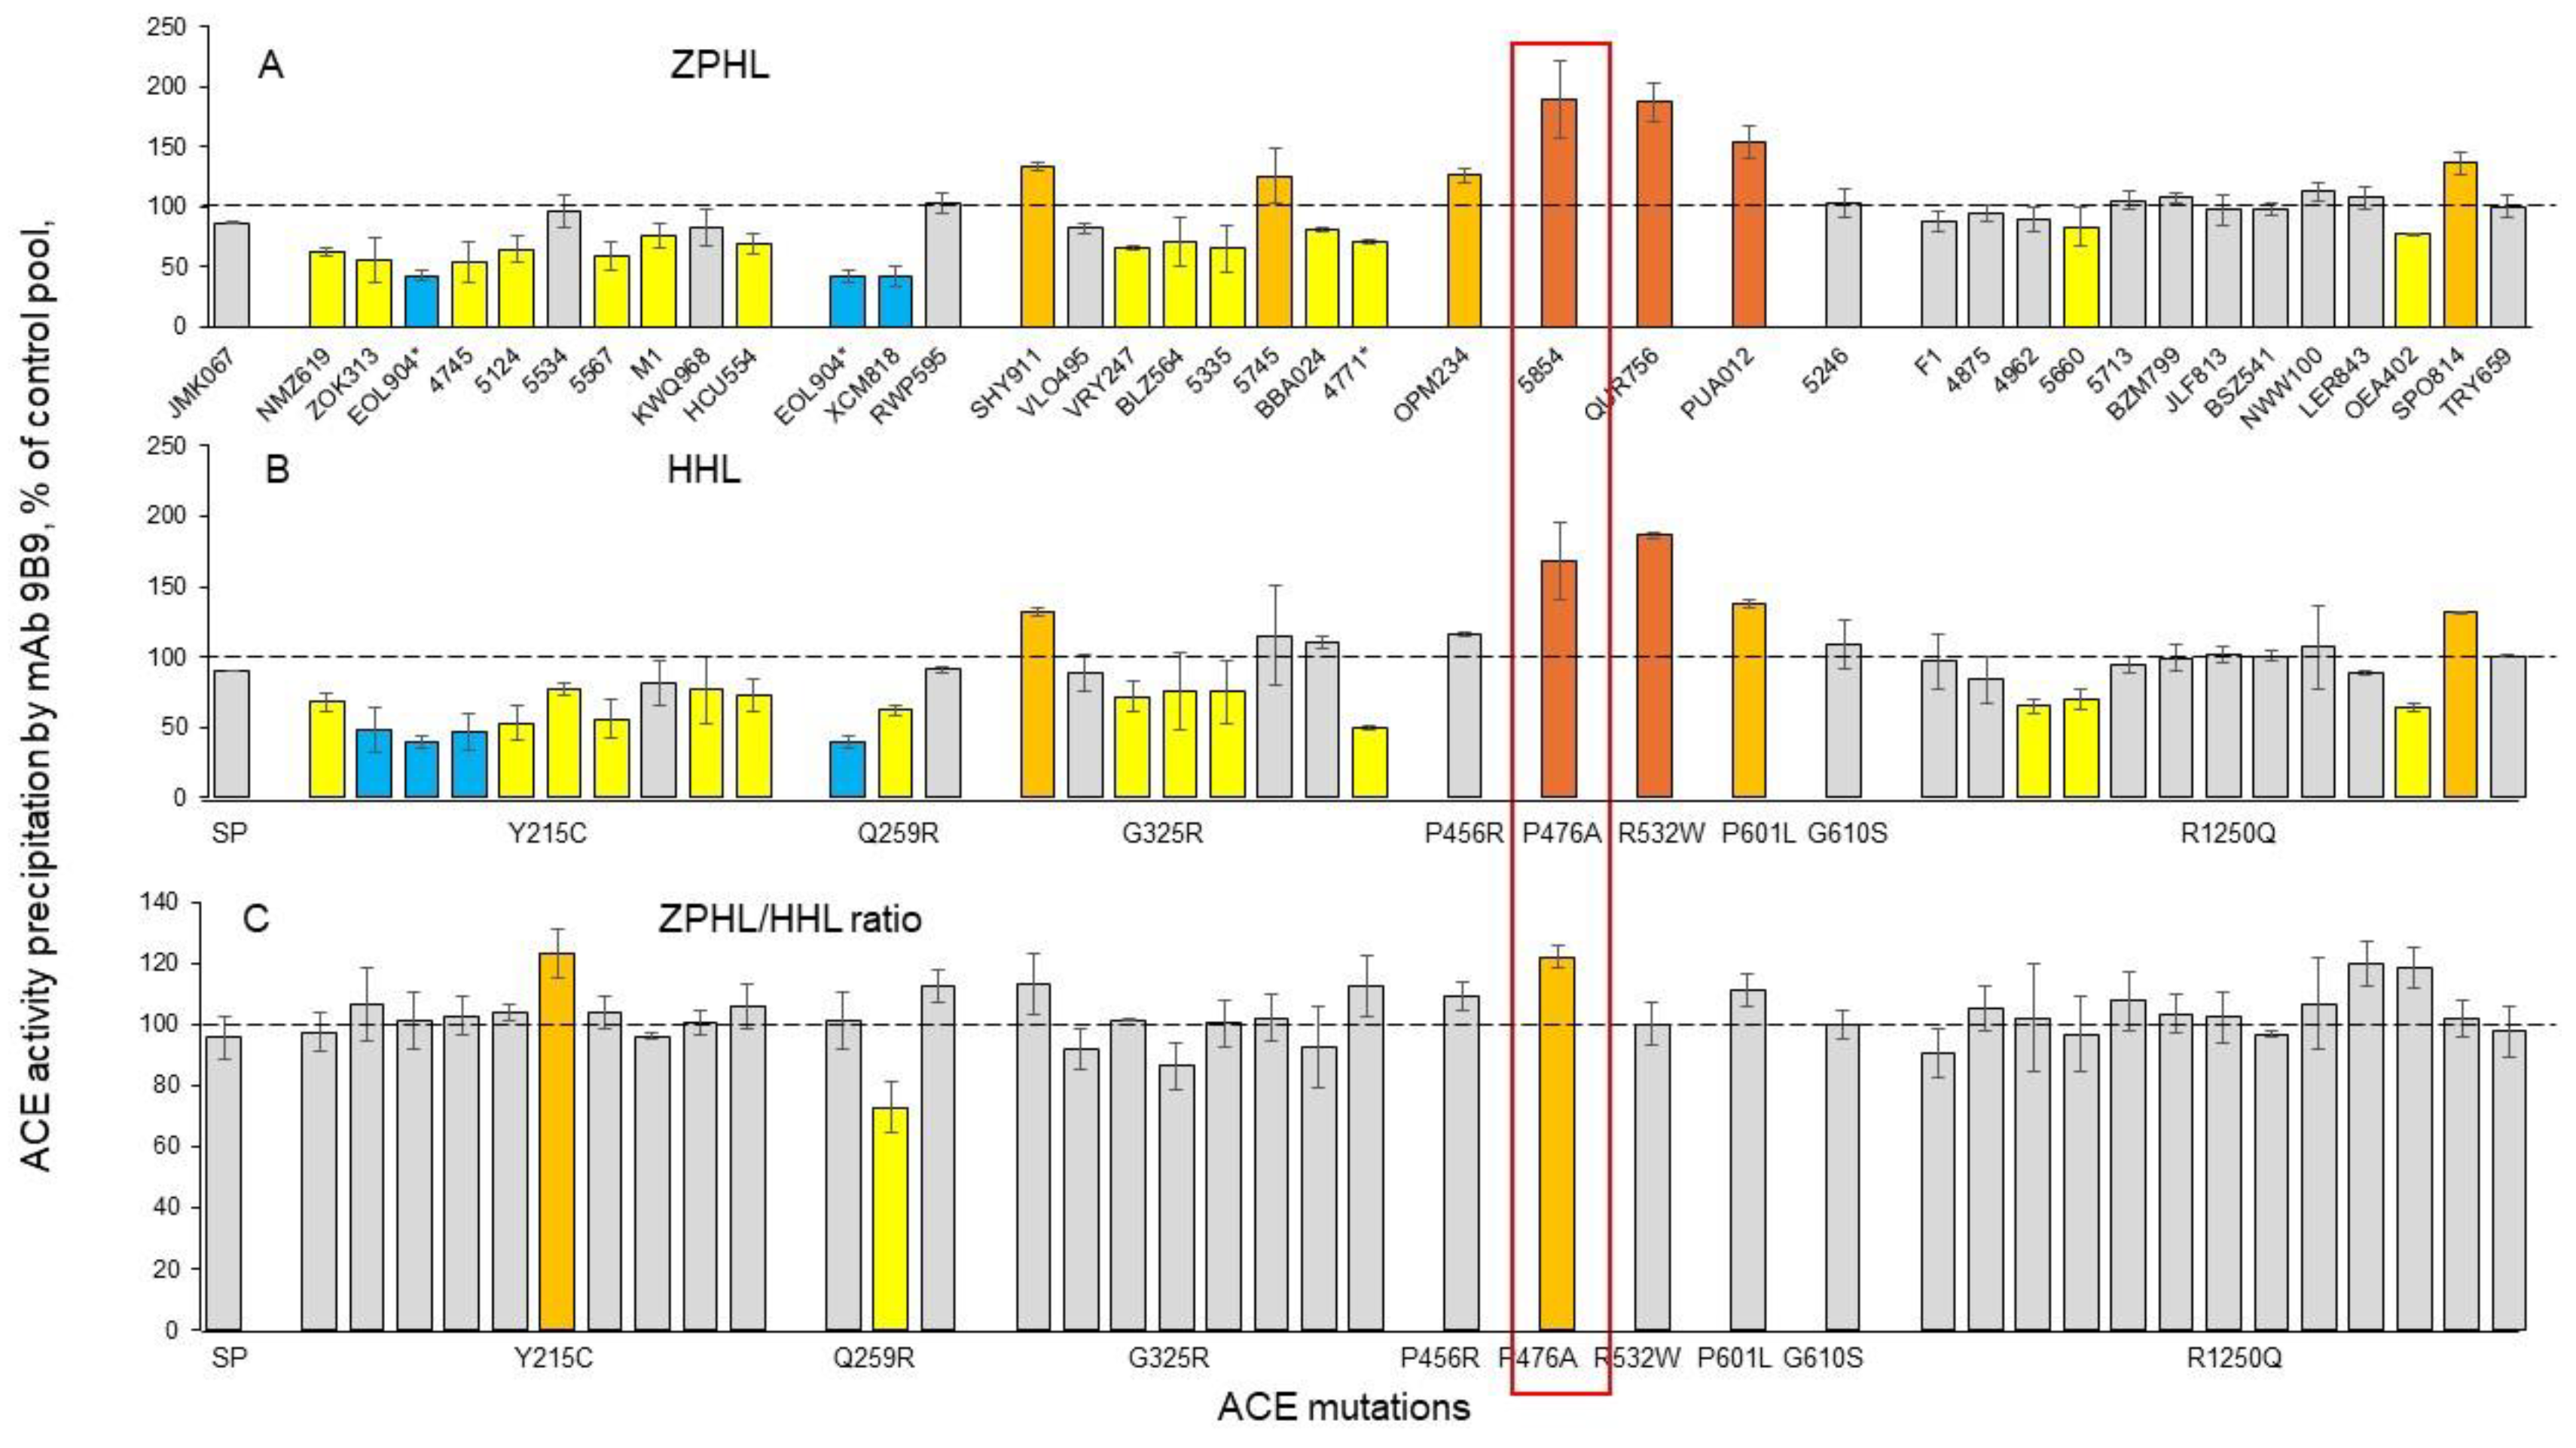
Among blood samples from the carriers of 8 mutations in the N domain (and one mutation in the cytoplasmic tail, R1250Q), we identified one carrier of the Q259R ACE mutation with a significantly decreased ZPHL/HHL ratio (using mAb 9B9) (Figure 5).
Detailed localization of the Q259R mutation on the N domain of ACE (Figure 6) clearly shows that this amino acid residue is positioned deeply inside the active center groove, just near the catalytically important residues. The location of the Q259R mutation could lead to reduced catalytic activity of the ACE N domain and might be considered as a potential risk factor for AD.
The ZPHL/HHL ratio was significantly increased in one subject (#5534) within the Y215C mutation group, and in one subject (5854) with the P476A mutation (Figure 5C). Note that #5534 is a clear outlier, as the blood ACE level was not dramatically decreased as in other carriers of the Y215C mutation (Figure 2A and B). Careful analysis of the sequence of this patient may help identify other possible genetic reasons for the normal level of ACE.
We analyzed the ZPHL/HHL ratio for normal blood ACE precipitated by different mAbs and found that this ratio was dramatically decreased when mAbs 2D1 and 5F1 were used (Figure S4A), thus confirming the previous observation that mAb 5F1 (which has an overlapping epitope with mAb 2D1[24]) is anticatalytic [45].
In contrast, blood from the subject with the P476A mutation demonstrated increased values of the ZPHL/HHL ratio when precipitated not only by mAb 9B9, but also by three weak mAbs, i1A8, 2D1 and 5F1 (Figure S4D). Thus, an increased ZPHL/HHL ratio can be considered as another marker for the P476A ACE mutation. The increased ZPHL/HHL ratio observed with the P476A mutant could be due to conformational changes in the C2loop of the N domain (residues 472-498) (Figure 7 in [29] and Figure S3E), which contains the catalytically essential residues K489 and Y498 that form a critical anchor for substrate/inhibitor binding [29,46]. The position of the mutated P476 amino acid residue is shown in Figure S3E. It is likely that the Pro substitution by Ala in the P476A mutant induces significant conformational changes that may increase catalytic activity of the N domain active center. Therefore, it seems less likely that the P476A mutation in the N domain of ACE is associated with Alzheimer’s disease. Interestingly, three other ACE mutations (P456R, P601L and G610S) that are located in the interface of ACE dimerization (Figure 4) and characterized by the increased blood ACE levels (Figure 2) did not demonstrate an increased ZPHL/HHL ratio (Figure 5C and Figure S4). A potential explanation is that these two mutations are located outside of the C2loop in the N domain (Figure S3E) and thus do not affect the catalytically essential residues K489 and Y498.
ACE with mutation G325R demonstrated an increased ZPHL/HHL ratio only when precipitated with mAb 2H9 to the C domain of ACE (Figure S4B). The reason for this observation is unclear. Detailed localization of the G325R mutation (shown in Figure 6) indicates that this amino acid residue is positioned right on the edge of the active site cleft. This position explains the anticatalytic properties of mAbs 5F1 and 2D1 (which have this residue in their epitopes) and may block the entrance to the N domain active center groove and fix movement of the jaws of the N domain active center necessary for hydrolysis [29,47]. Analysis of mAbs binding to carriers of the G325R ACE mutation demonstrated that the 1G12/5F1 and 2H9/5F1 ratios (but only with ZPHL as a substrate) can serve as markers for this mutation since they are decreased for carriers of the G325R mutation to 43% of the control level (p<0.05).
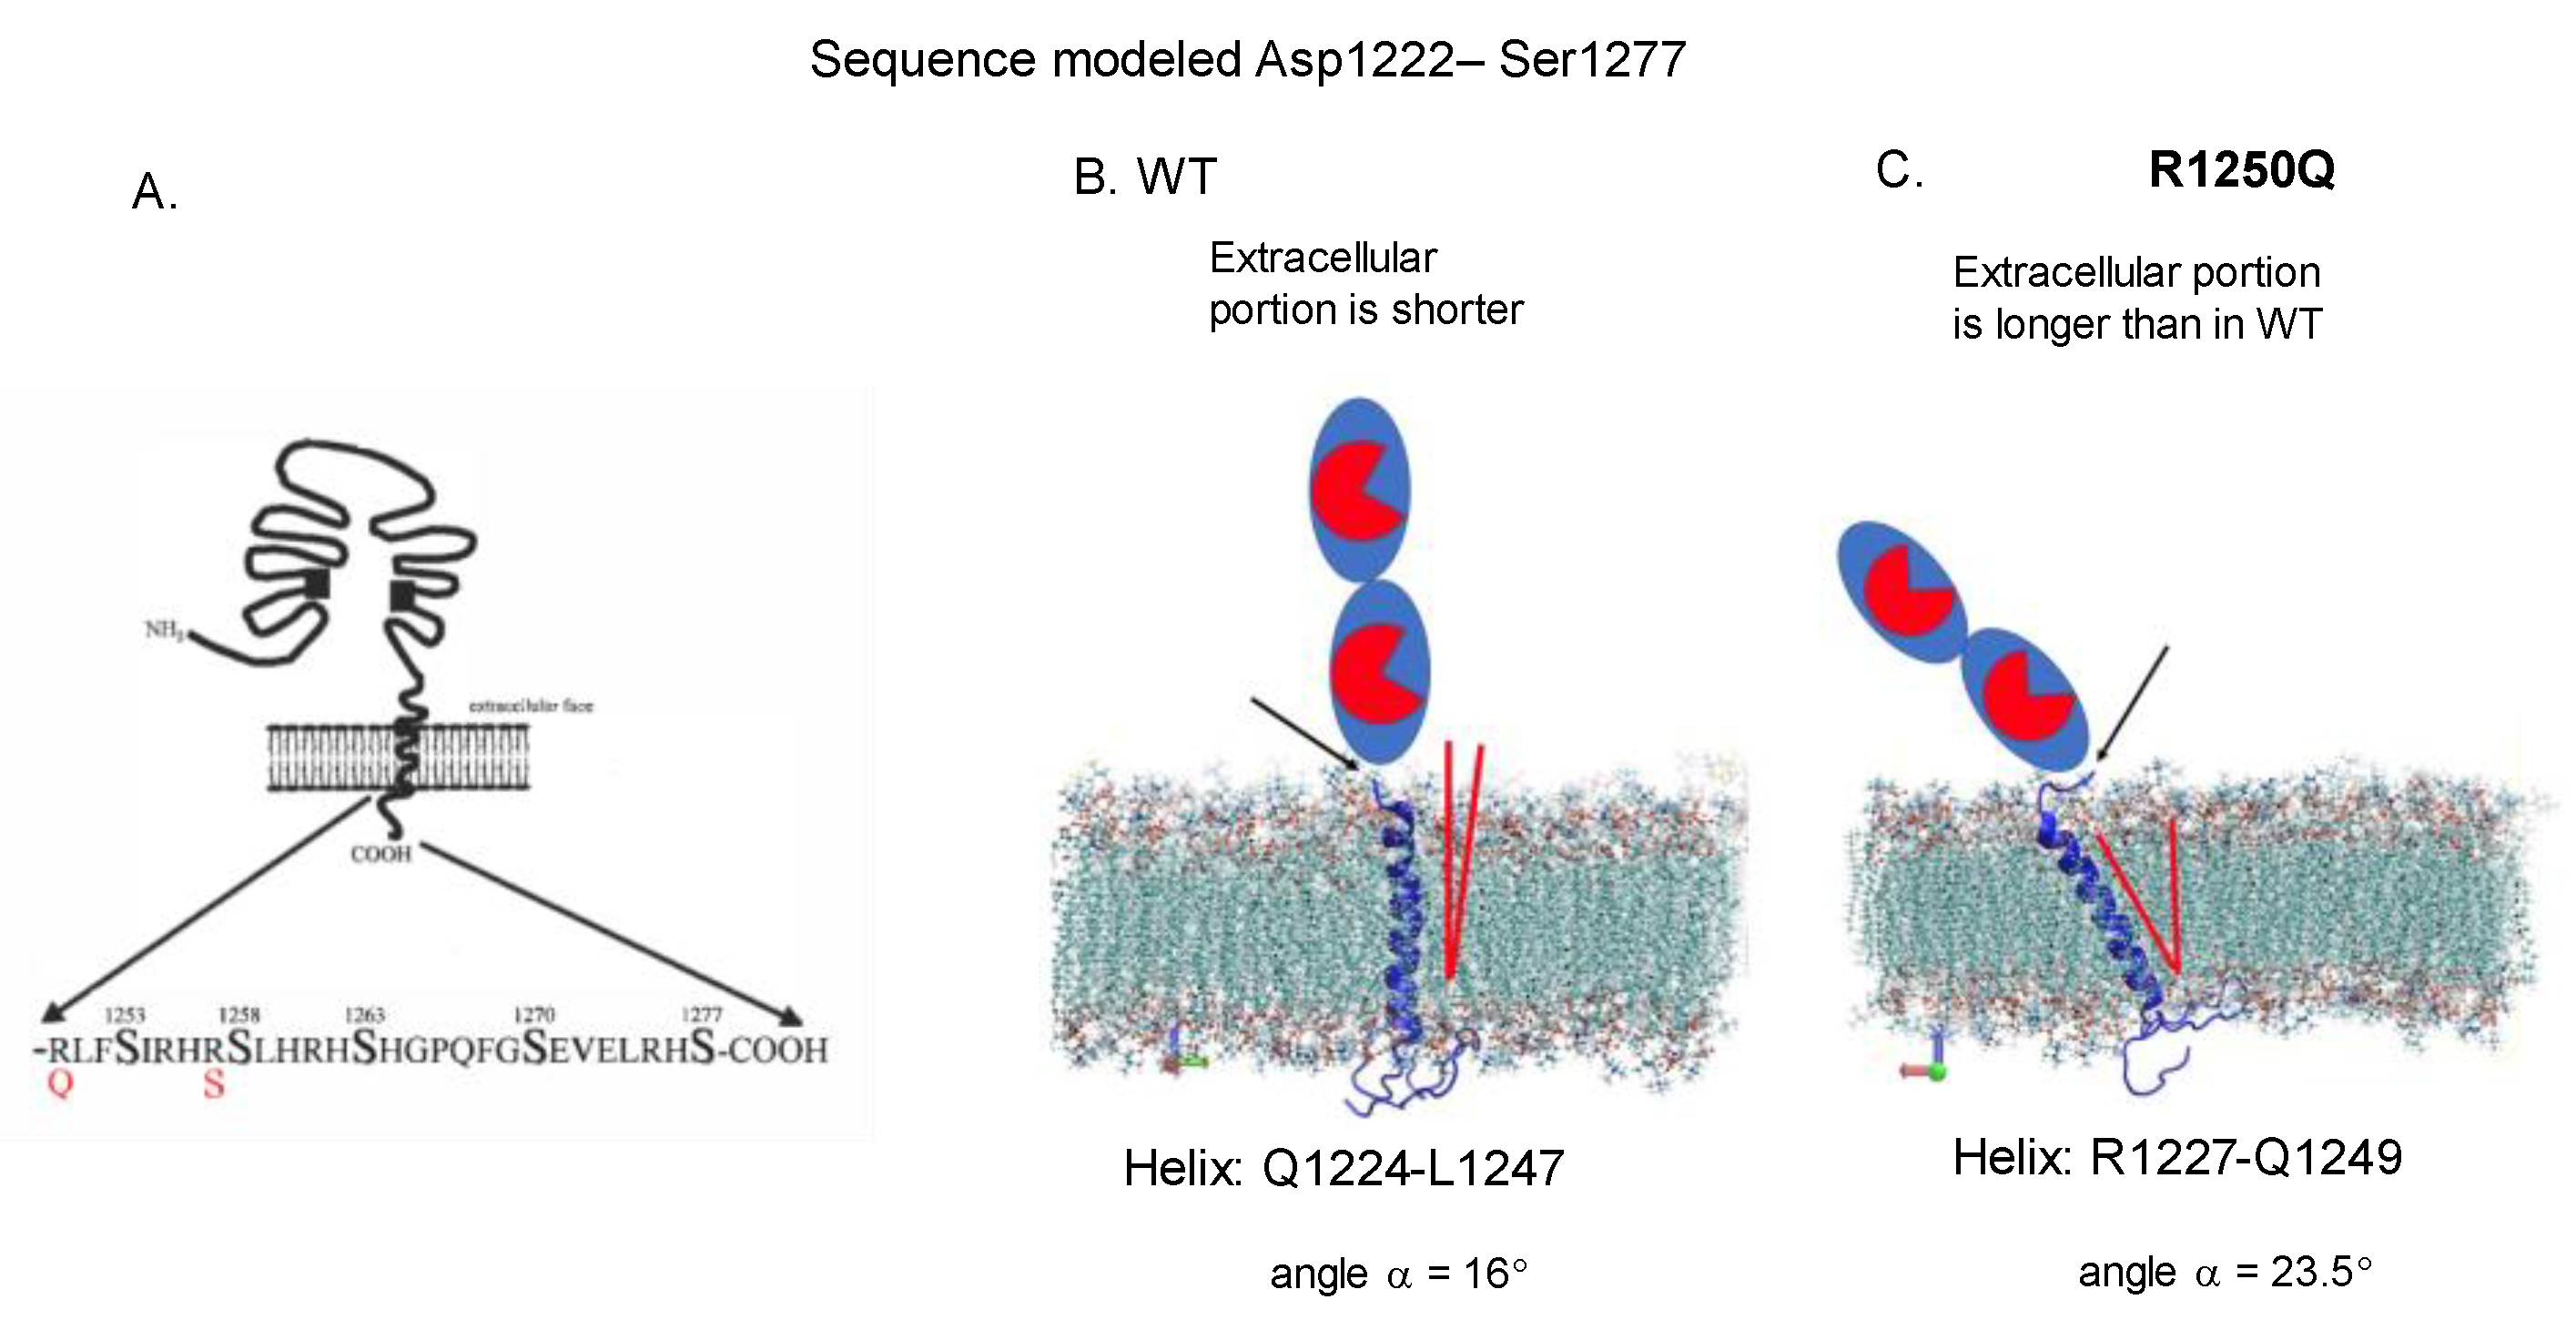
Carriers of the R1250Q mutation in the cytoplasmic tail (Figure 7) exhibited neither altered blood ACE levels (Figure 2) nor any changes in the ZPHL/HHL ratio when precipitated with different mAbs (Figure 5 and Figure S4F).
One hypothesis is that the reported association of this mutation with Alzheimer’s disease [13] may be caused by fine conformational changes in the ACE molecule induced by this substitution due to crosstalk between the extracellular and cytoplasmic portions of ACE. Hence, despite its cytoplasmic location, this mutation is likely to have direct effects on the conformation of ACE at the membrane and potentially on the extent of ACE dimerization. These effects would decrease hydrolysis of large substrates like amyloid peptide Aβ42 [10]. Interestingly, 12 out of the 13 carriers of this mutation who developed AD were women [13]. Furthermore, we observed significant differences in the conformation of urinary ACE between males and females, likely attributed to differential glycosylation patterns, particularly sialylation, in kidney ACE—the primary source of ACE in urine. The sex-specific variations in tissue ACE glycosylation identified in our study [48] may contribute to differences in disease susceptibility. It is reasonable to speculate that the R1250Q mutation could markedly disrupt Aβ42 cleavage in female carriers of this ACE mutation, while potentially exerting a different effect in males [10].
The results obtained in this study from blood ACE phenotyping in carriers of 10 different ACE mutations were added to an updated version of a Table in which blood ACE levels were estimated or quantified in the carriers of 62 ACE mutations (Table S1). Data from this Table convincingly indicates that blood ACE levels were significantly decreased in a significant number of patients with damaging ACE mutations and Alzheimer’s disease (Table S2).

4. Conclusions

1. The ACE phenotyping method utilizes the precipitation of ACE by different mAbs in combination with subsequent measurement of ACE activity [26,31,44,49] to quantitatively estimate the effects of ACE mutations. It also allowed to identify patients with transport-deficient ACE mutations, characterized by a substantial decrease in blood ACE levels (for example, carriers with the frequent ACE mutations Y215C and G325R).
2. The combination of various mAbs to ACE at our disposal [23,24] with different substrates allows for the detection (at least theoretically) of carriers of ACE mutations in the N domain active center that decrease catalytic activity. These mutations may inhibit the ability to hydrolyze N domain specific substrates, including Aβ42 [9], which could increase AD risk of AD.
3. ACE phenotyping using only EDTA-containing plasma samples precludes direct measurement of blood ACE activity in solution from an individual but can yield patterns and markers indicative of the effects of ACE mutations. This is achieved through the application of a set of mAbs to ACE molecule along with various substrates of ACE. This approach is especially useful for transport-deficient ACE mutations. Future clinical trials may be planned in carriers of these transport-deficient ACE mutations to test the effectiveness of a cocktail of chemical and pharmacological chaperones, as well as proteasome inhibitors to rescue impaired trafficking of mutant ACEs to the cell surface. Such an approach previously was successful as a “proof of concept” for an in vitro model of the rare transport-deficient ACE mutation (Q1069R) [14].
4. To estimate the effects of such therapy in future clinical trials, it will be necessary to quantify mutant ACE levels in the blood of patients. We have established such markers for both transport-deficient ACE mutations found in this study: the 2H9/1G12 binding ratio (with ZPHL as a substrate) effectively distinguishes ACE with the Y215C mutation from normal ACE or from ACE with other tested mutations, whereas the 1G12/5F1 binding ratio (also with ZPHL as a substrate) is a marker for the G325R mutation.

Supplementary Materials

The following supporting information can be downloaded at the website of this paper posted on Preprints.org., Figure S1: title; Table S1: title; Video S1: title.

Author Contributions

“Conceptualization, S.M.D2.; methodology, D.O.K.; software, V.A.B. V.V.C. validation, S.M.D., O.V.K. O.A.K. and I.O.I.; formal analysis, O..V.K.; I.O.I; S.A.T; investigation, S.M.D1.: D.V.R.; resources, D.O.K.; data curation, SMD.; writing—original draft preparation, S.M.D1, O.A.K, and S.M.D2.; writing—review and editing, S.M.D1., D.V.R.; funding acquisition. All authors have read and agreed to the published version of the manuscript.

Funding

This work was supported by grant № 075-15-2019-1789 from the Ministry of Science and Higher Education of the Russian Federation allocated to the Center for Precision Genome Editing and Genetic Technologies for Biomedicine. Work of Alex Tonevitsky and SvetlanaTonevitskaya was performed within the framework of the “Creation of Experimental Laboratories in the Natural Sciences Program” and Basic Research Program at HSE University. Work of Olga Kryukova and Olga Kost was performed within the framework of “Molecular design, structure-function analysis and regulation of enzyme systems, cellular structures, bionanomaterials: fundamental basis and applications in technology, medicine, environmental protection (Registration number 121041500039-8) at M.V. Lomonosov Moscow State University.

Institutional Review Board Statement

The study was conducted in accordance with the Declaration of Helsinki, and approved by the Institutional Review Board (or Ethics Committee) of NAME OF INSTITUTE (protocol code XXX and date of approval).

Informed Consent Statement

Informed consent was obtained from all subjects involved in the study.

Data Availability Statement

The data supporting the findings of this study are available within the article.

Conflicts of Interest

The authors declare no conflicts of interest. The funders had no role in the design of the study; in the collection, analyses, or interpretation of data; in the writing of the manuscript; or in the decision to publish the results.

References

  1. Selkoe DJ, Hardy J. The amyloid hypothesis of Alzheimer’s disease at 25 years. EMBO Mol Med 2016; 8: 595–608. [CrossRef]
  2. Sims R, Hill M, Williams J. The multiplex model of the genetics of Alzheimer’s disease. Nat Neurosci 2020; 23: 311–322. [CrossRef]
  3. Andrade-Guerrero J, Santiago-Balmaseda A, Jeronimo-Aguilar P, et al. Alzheimer’s Disease: An Updated Overview of Its Genetics. Int J Mol Sci 2023; 24: 3754. [CrossRef]
  4. Kehoe PG, Russ C, McIlory S, et al. Variation in DCP1, encoding ACE, is associated with susceptibility to Alzheimer’s disease. Nat Genet1999;21: 71–72. [CrossRef]
  5. Sassi C, Brown KS, Medway C, et al. Influence of coding variability in APP-Aβ metabolism genes in sporadic Alzheimer’s disease. PLOS One 2016; 11: e0150079. [CrossRef]
  6. Schwartzentruber J, Cooper S, Liu JZ, et al. Genome-wide meta-analysis, fine-mapping and integrative prioritization implicate new Alzheimer’s disease risk genes. Nat Genet 2021; 53: 392–402. [CrossRef]
  7. Sturrock ED, Anthony CS, Danilov SM. Peptidyl-dipeptidase a/angiotensin I-converting enzyme. Handbook of Proteolytic Enzymes, 2012; pp.480–494. [CrossRef]
  8. Bernstein KE, Ong FS, Blackwell WL, et al. A modern understanding of the traditional and nontraditional biological functions of angiotensin-converting enzyme. Pharmacol Rev 2012; 65: 1–46. [CrossRef]
  9. Zou K, Maeda T, Watanabe A, et al. Aβ42-to-Aβ40- and angiotensin-converting activities in different domains of angiotensin-converting enzyme.J Biol Chem 2009; 284: 31914–31920. [CrossRef]
  10. Danilov SM, Adzhubei IA, Kozuch AS, et al. Carriers of heterozygous loss-of-function ACE mutations are at risk for Alzheimer’s disease. Biomedicines 2024; 12: 162. [CrossRef]
  11. Corvol P, Michaud A, Gribouval O, Gasc JM, Gubler MC. Can we live without a functional renin-angiotensin system? Clin Exp Pharmacol Physiol 2008; 35: 431-433. [CrossRef]
  12. Gribouval O, Moriniere V, Pawtowski A, et al. Spectrum of mutations in the renin-angiotensin system genes in autosomal recessive renal tubular dysgenesis. Hum Mut 2011; 33: 316–326. [CrossRef]
  13. Cuddy LK, Prokopenko D, Cunningham EP, et al. Aβ-accelerated neurodegeneration caused by Alzheimer’s-associated ACE variant R1279Q is rescued by angiotensin system inhibition in mice. Sci Transl Med2020;.12: eaaz2541. [CrossRef]
  14. Danilov SM, Kalinin S, Chen Z, et al. Angiotensin I-converting enzyme Gln1069Arg mutation impairs trafficking to the cell surface resulting in selective denaturation of the C-domain. PLoS One 2010; 5: e10438. [CrossRef]
  15. Belova V, Pavlova A, Afasizhev R, et al. System analysis of the sequencing quality of human whole exome samples on BGI NGS platform. Sci Rep 2022; 12: 609. [CrossRef]
  16. Wingett SW, Andrews S. FastQ Screen: A tool for multi-genome mapping and quality control. F1000Res; 2018; 7: 138. [CrossRef]
  17. Li H, Handsaker B, Wysoker A, et al. The sequence alignment/map format and SAMtools. Bioinformatics 2009; 25: 2078–2079. [CrossRef]
  18. Li H.A statistical framework for SNP calling, mutation discovery, association mapping and population genetical parameter estimation from sequencing data. Bioinformatics 2011;27: 2987-2993. [CrossRef]
  19. Poplin R, Chang P-C, Alexander D, et al. A universal SNP and small-indel variant caller using deep neural networks. Nat Biotech 2018; 6: 983–987. [CrossRef]
  20. Tan A, Abecasis GR, Kang HM. Unified Representation of Genetic Variants. Bioinformatics 2015; 31: 2202-2204. [CrossRef]
  21. Li Q, Wang K. InterVar: Clinical interpretation of genetic variants by ACMG-AMP 2015 guideline. Am J Hum Genet 2017; 100: 1-14. [CrossRef]
  22. Danilov SM, Balyasnikova IV, Danilova AS, et al. Conformational fingerprinting of the angiotensin I-converting enzyme (ACE). 1. application in sarcoidosis. J Proteome Res 2010; 9: 5782–5793. [CrossRef]
  23. Danilov SM. Conformational fingerprinting using monoclonal antibodies (on the example of angiotensin I-converting enzyme-ACE). Mol Biol (Moscow) 2017;51: 906–920. [CrossRef]
  24. Popova IA, Lubbe L, Petukhov PF, et al. Epitope mapping of novel monoclonal antibodies to human angiotensin I-converting enzyme. Protein Sci2021; 30: 1577–1593. [CrossRef]
  25. Danilov S, Savoie F, Lenoir B, et al. Development of enzyme-linked immunoassays for human angiotensin I converting enzyme suitable for large-scale studies. J Hypertens 1996; 14: 719–727.
  26. Samokhodskaya LM, Jain MS, Kurilova OV, et al. Phenotyping angiotensin-converting enzyme in blood: A necessary approach for precision medicine. J Appl Lab Med 2021; 6: 1179–1191. [CrossRef]
  27. Danilov SM, Balyasnikova IV, Albrecht RF, Kost OA. Simultaneous determination of ACE activity with 2 substrates provides information on the status of somatic ace and allows detection of inhibitors in human blood. J Cardiovasc Pharmacol 2008; 52: 90–103. [CrossRef]
  28. Adzhubei IA, Schmidt S, Peshkin L, et al. A method and server for predicting damaging missense mutations. Nat Methods 2010; 7: 248–249. [CrossRef]
  29. Lubbe L, Sewell BT, Woodward JD, Sturrock ED. Cryo-EM reveals mechanisms of angiotensin I-converting enzyme allostery and dimerization. EMBO J 2022; 41: e110550. [CrossRef]
  30. Anthony CS, Corradi HR, Schwager SL, et al. The N domain of human angiotensin-I- converting enzyme: the role of N glycosylation and crystal structure in complex with N domain specific phosphinic inhibitor, RXP407. J Biol Chem 2010;285: 35685-35693. [CrossRef]
  31. Petrov MN, Shilo VY, Tarasov AV, et al. Conformational changes of blood ACE in uremia. PLoS One 2012; 7: e49290. [CrossRef]
  32. Danilov SM, Jain MS, Petukhov PA, et al. Blood ACE phenotyping for personalized medicine: revelation of patients with conformationally altered ACE. Biomedicines 2023;11: 534. [CrossRef]
  33. Danilov SM, Lunsdorf H, Akinbi HT, et al. Lysozyme and bilirubin bind to ACE and regulate its conformation and shedding. Sci Rep 2016; 6: 34913. [CrossRef]
  34. Rigat B, Hubert C, Alhenc-Gelas F, et al. An insertion/deletion polymorphism in the angiotensin I-converting enzyme gene accounting for half the variance of serum enzyme levels. J Clin Invest 1990; 86: 1343–1346. [CrossRef]
  35. Costerousse O, Allegrini J, Lopez M, et al. Angiotensin I-converting enzyme in human circulating mononuclear cells: genetic polymorphism of expression in T-lymphocytes. Biochem J 1993; 290 (Pt.1): 33-40. [CrossRef]
  36. Danser AH, Schalekamp MA, Bax WA, et al. Angiotensin-converting enzyme in the human heart. Effect of the deletion/insertion polymorphism. Circulation 1995; 92:1387-1388. [CrossRef]
  37. Tiret L, Rigat B, Visvikis S, et al. Evidence, from combined segregation and linkage analysis, that a variant of the angiotensin I-converting enzyme (ACE) gene controls plasma ACE levels. Am J Hum Genet 1992; 51: 197-205.
  38. Biller H, Zissel G, Ruprecht B, et al. Genotype-corrected reference values for serum angiotensin-converting enzyme. Eur Resp J 2006; 28: 1085-1090. [CrossRef]
  39. Kruit A, Grutters JC, Gerritsen WB, et al. ACE I/D-corrected Z-scores to identify normal and elevated ACE activity in sarcoidosis. Respir Med 2007; 101: 510-515. [CrossRef]
  40. Lopera F, Marino C, Chandrahas AS, et al. Resilience to autosomal dominant Alzheimer's disease in a Reelin-COLBOS heterozygous man. Nat Med 2023;29: 1243-1252. [CrossRef]
  41. Danilov SM, Gordon K, Nesterovitch AB, et al. Angiotensin I-converting enzyme mutation (Y465D) cause dramatic increase in blood ACE via accelerated ACE shedding due to changes of ACE dimerization. PLoS One 2011; 6: e25952. [CrossRef]
  42. Danilov SM, Jain MS, Petukhov PA, et al. Novel ACE mutations mimicking sarcoidosis by increasing blood ACE levels. Transl Res 2021; 230: 5–20. [CrossRef]
  43. Kryukova OV, Tikhomirova VE, Golukhova EZ, et al. Tissue Specificity of Human Angiotensin I-Converting Enzyme. PLoS One 2015; 10: e0143455. [CrossRef]
  44. Danilov SM, Tikhomirova VE, Metzger R, et al. ACE phenotyping in Gaucher disease. Mol Genet Metab 2018; 123: 501-510. [CrossRef]
  45. Danilov SM, Watermeyer JM, Balyasnikova IV, et al. Fine epitope mapping of mAb 5F1 reveals anticatalytic activity. Biochemistry2007; 46: 9019-9031.
  46. Naqvi N, Liu K, Graham RM, Husain A. Molecular basis of exopeptidase activity in the C-terminal domain of human angiotensin I-converting enzyme: insights into the origins of its exopeptidase activity. J Biol Chem 2005; 280: 6669-6675. [CrossRef]
  47. Cozier GE, Lubbe L, Sturrock ED, Acharya KR. Angiotensin-converting enzyme open for business: Structural insights into the subdomain dynamics. FEBS J 2020; 288: 2238–2256. [CrossRef]
  48. Kozuch AJ, Petukhov PA, Fagyas M, et al. Urinary ACE phenotyping as a research and diagnostic tool: identification of sex-dependent ACE immunoreactivity. Biomedicines 2023; 11: 953. [CrossRef]
  49. Danilov SM, Tikhomirova VE, Kryukova OV, et al. Conformational fingerprint of blood and tissue ACEs: Personalized approach. PLoS One 2018;13: e0209861. [CrossRef]
  50. Kohlstedt K, Shoghi F, Müller-Esterl W, Busse R, Fleming I. CK2 phosphorylates the angiotensin-converting enzyme and regulates its retention in the endothelial cell plasma membrane. Circ Res 2002; 91: 749–756. [CrossRef]
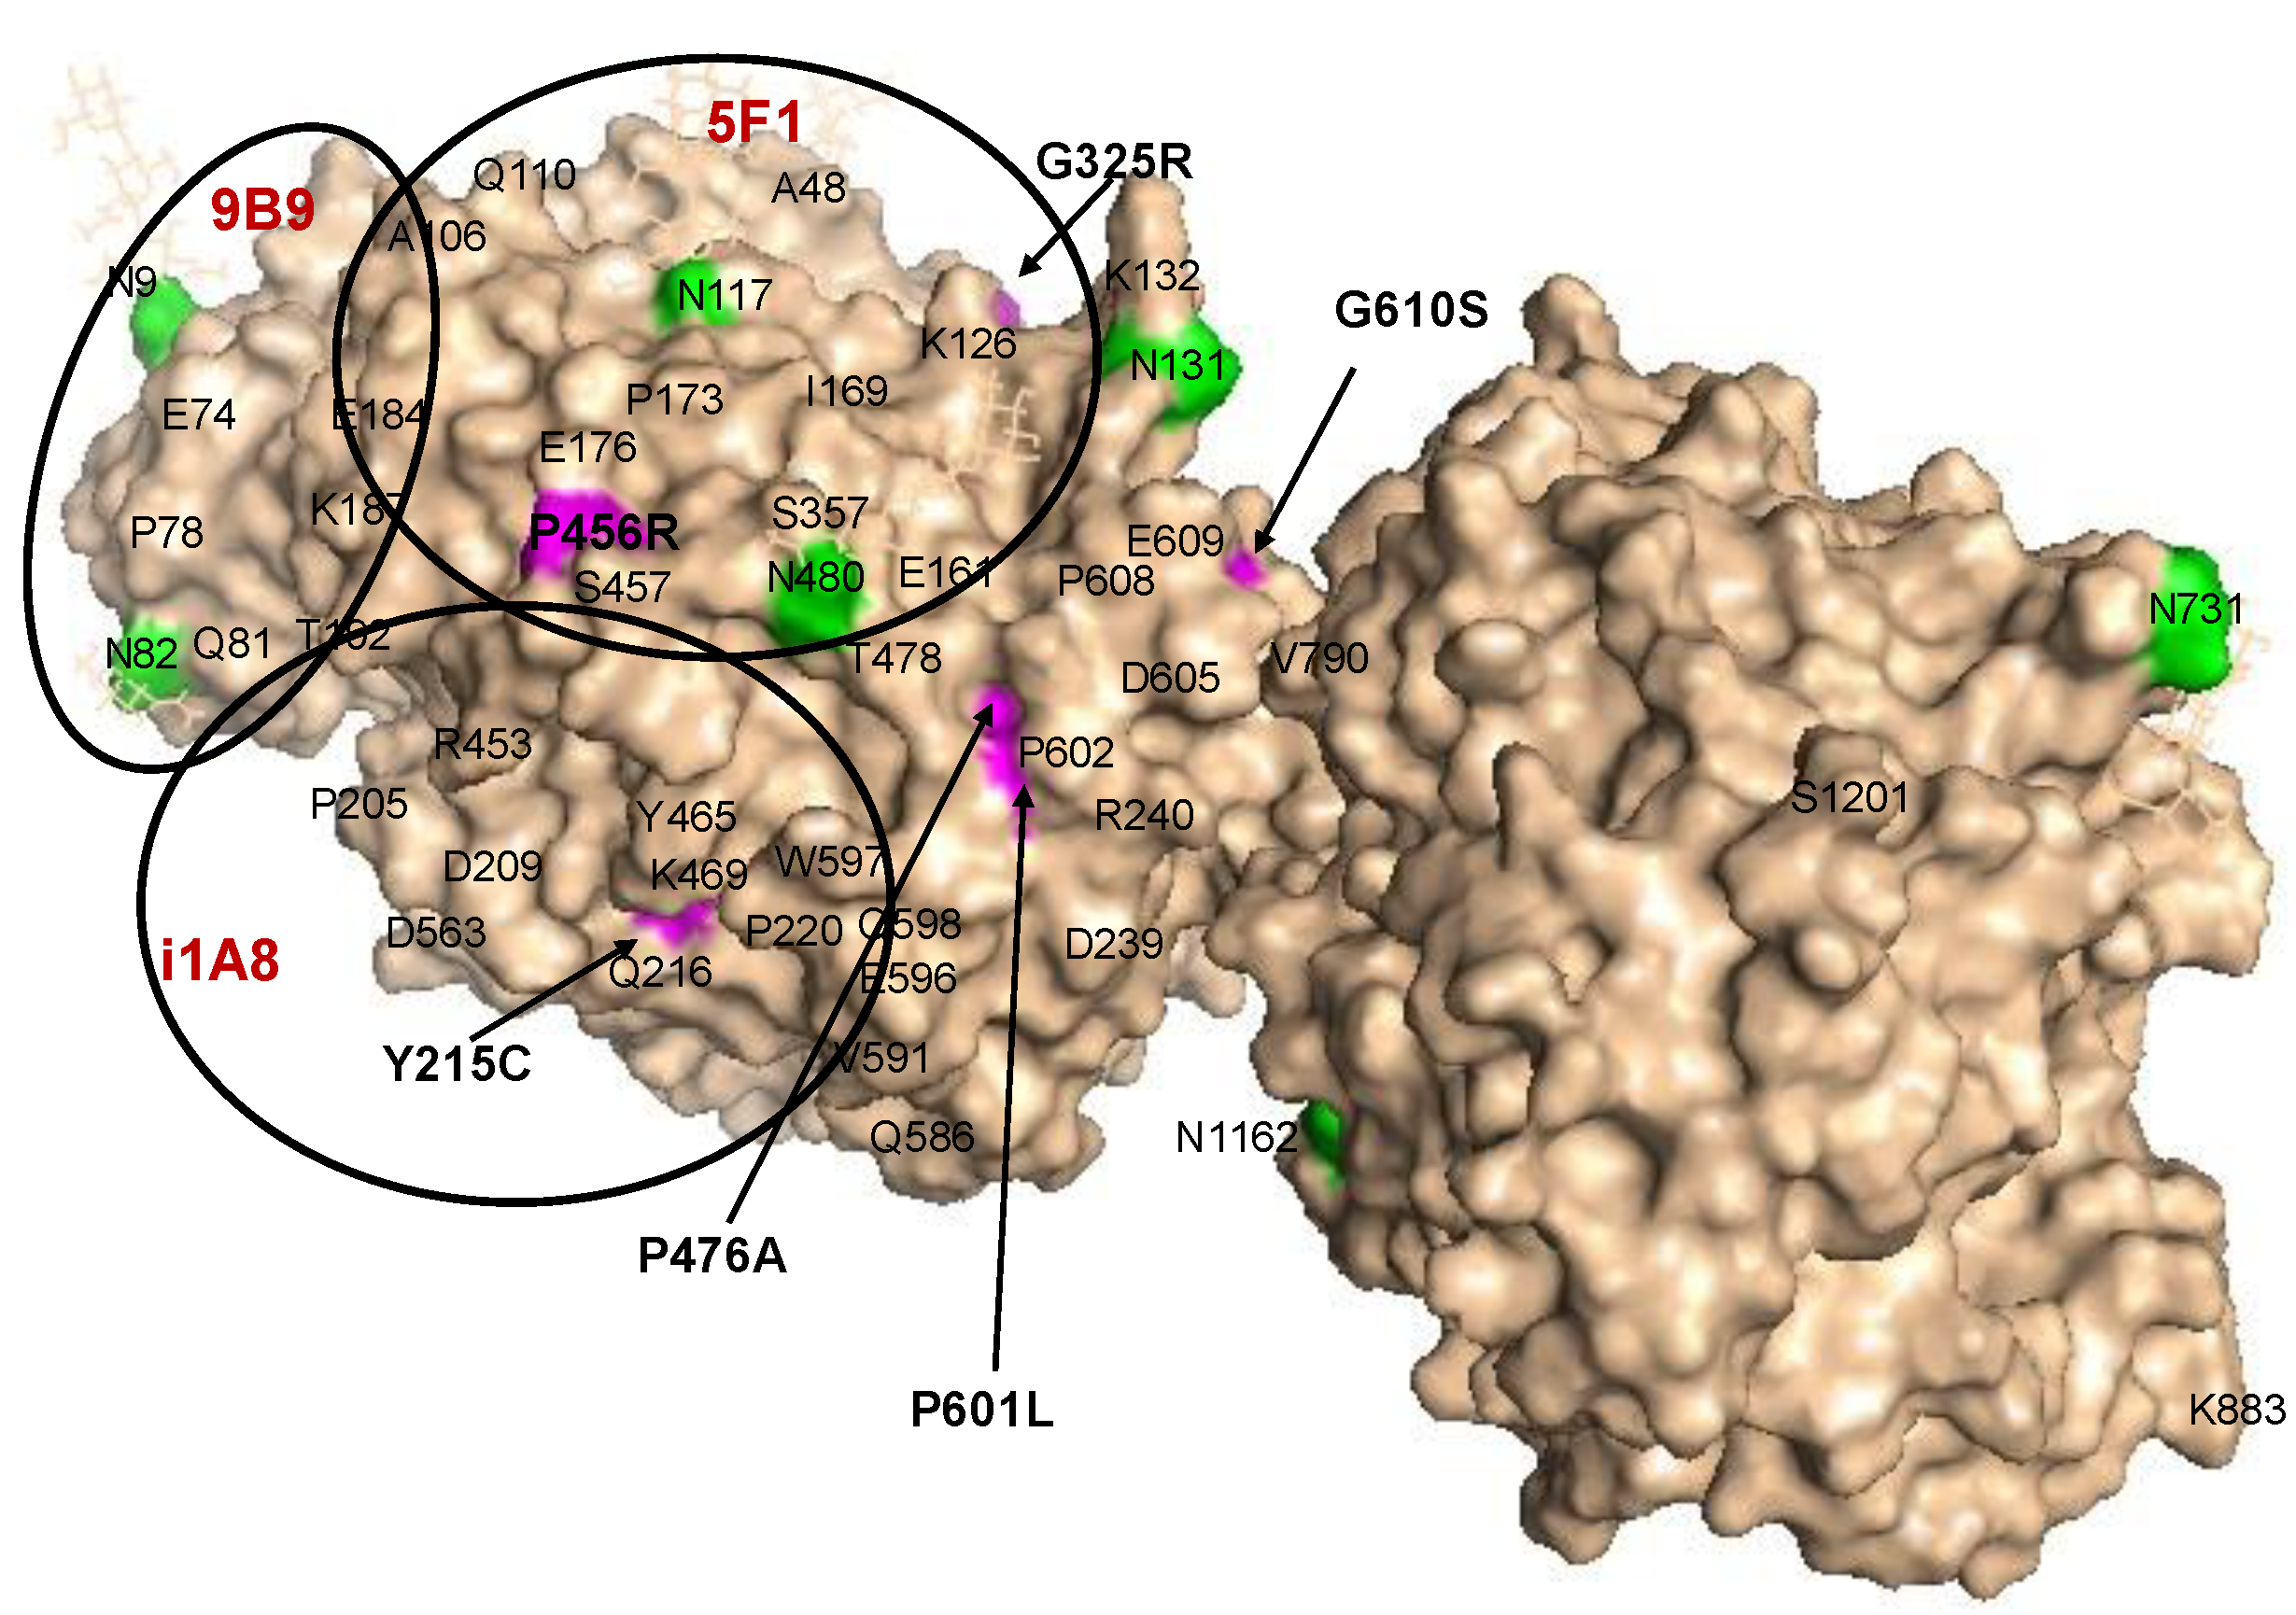
Figure 1. Localization of relevant ACE mutations in the N domain of ACE. The position of each ACE mutation is shown on the Cryo-EM structure of the truncated (1-1201) human somatic ACE (PDB 7Q3Y) [29] using molecular surface representation. Key amino acids are denoted using somatic ACE numbering. The surface is colored light beige with specific amino acid residues colored as following: ACE mutations are highlighted in magenta and additionally marked by arrows; Asn as putative glycosylation sites are highlighted in green; the last visible residue in the C-terminal end of this truncated somatic ACE is marked with its number S1201. The epitopes for several mAbs to the N domain (9B9, 5F1, i1A8) are shown as black circles for orientation with a diameter 30 Å, which corresponds to 700 Å2 of the area covered by each listed mAb.
Preprints 108697 g001
Figure 2. Quantification of blood ACE levels in carriers of ACE mutations. Blood ACE protein was precipitated from EDTA-plasma by mAb 9B9 (which binds an epitope on the N domain of ACE), and its activity was quantified fluorimetrically using ZPHL as a substrate. A) Immunoreactive ACE protein was quantified in plasma samples obtained from 41 carriers of 10 different ACE mutations. Asterisk indicates that ACE from subject 4771 had two mutations. B) Plasma ACE levels adjusted according to the donor's genotype for the I/D polymorphism [38,39]. C) ACE levels (from B) were calculated for each group of subjects with the specified ACE mutation; “n” = the number of donors in each group. For carriers of the Y215C, G325R, Q259R, and R1250Q mutations, corresponding median values were calculated and significance analyzed using the Mann-Whitney U test. ACE levels for the other mutations in which only a single subject was available for sampling were presented as the means +/- standard deviations of several independent assessments of those individual samples. Data were expressed as % of ACE levels compared to the corresponding value for control pooled plasma samples from subjects without ACE mutations (green bars). Orange and brown bars indicate samples with ACE levels higher than 120% and 150% of controls, respectively. Yellow and blue bars indicate samples with ACE levels lower than 80% and 50% of controls, respectively. D. Predictions of the potential damaging effects of 9 mutations on the ACE protein using 4 different predictive tools were derived from Table S1 [10]. Values shown in red are predicted to be damaging by the listed predictive engine; values in black are predicted to be benign.
Preprints 108697 g002
Figure 3. ACE precipitation by mAbs from the EDTA-plasma of carriers of ACE mutations. Blood ACE protein was precipitated using two mAbs to the N domain (9B9 and 1G12), and by mAb2H9 to the C domain. Precipitated ACE activity was quantified as in Figure 2. A) 2H9/9B9 binding ratio; B) 2H9/1G12 binding ratio; C) 1G12/9B9 binding ratio. The standard deviations (SD) for precipitated ACE activity for all three mAbs did not exceed 10%, therefore, their ratios were presented as mean (without individual SD). Bar coloring is the same as in Figure 2.
Preprints 108697 g003
Figure 4. Localization of P476A, P601L and G610S mutations in the N domain of ACE. Shown is a molecular surface presentation of the crystal structure for the N domain dimer of human ACE, where 7 potential Asn glycosylation sites were substituted by Gln residues (PDB 3NXQ). Key amino acids are denoted using somatic ACE numbering. The surface is indicated by light beige, with specific amino acid residues colored as follows: Asn or Asn substituted by Gln in some putative glycosylation sites [30] are highlighted in green; ACE mutations (P476A, P601L and G610S) are highlighted in magenta. The epitope for mAb5F1 to the N domain was used to test blood samples with these ACE mutations and is marked with a black circle. Interface of dimerization of the N domain [41,42] is shown as a red ellipse, with Y465 marked by bright red.
Preprints 108697 g004
Figure 5. Effects of different ACE mutations on the catalytic properties of ACEs. Blood ACE protein was precipitated from EDTA-plasma using mAb 9B9. Precipitated ACE activity was quantified fluorometrically as in Figure 2, using ZPHL (in A) and HHL (in B) as substrates. Data in C were expressed as a % of the ZPHL/HHL hydrolysis ratio obtained from control samples. Coloring of bars is the same as in Figure 2. Values for the P476A mutant are outlined in the orange box.
Preprints 108697 g005
Figure 6. Localization of Q259R and G325R mutations in the N domain of ACE. Shown is the Cryo-EM structure of the truncated (1-1201) human somatic ACE (PDB 7Q3Y) [29] using molecular surface representation. Coloring is the same as in Figure 1. ACE mutations, Q259R and G325R, are highlighted with magenta. The epitopes for mAbs to the N domain (9B9, 5F1/2D1 and 1G12) used to test these blood samples are outlined with black circles.
Preprints 108697 g006
Figure 7. Localization of AD-associated ACE mutation R1250Q in the cytoplasmic tail.A. Schema showing the localization of R1250Q ACE mutations in the cytoplasmic tail of ACE --adapted from [50].B-C. Molecular Dynamic simulations of the transmembrane and cytoplasmic domains of ACE in POPC-lipid membranes. Sequence is modeled from position Asp1222 to Ser1277. Shown for (B) is the WT helix span from Q1224 to L1247, for (C) is the R1250Q ACE mutant helix span from R1227 to Q1249. The average angles of transmembrane helices in mutant ACEs were changed in the lipid bilayers in comparison with WT ACE (From [10] - with permission from publisher).
Preprints 108697 g007
Disclaimer/Publisher’s Note: The statements, opinions and data contained in all publications are solely those of the individual author(s) and contributor(s) and not of MDPI and/or the editor(s). MDPI and/or the editor(s) disclaim responsibility for any injury to people or property resulting from any ideas, methods, instructions or products referred to in the content.
Copyright: This open access article is published under a Creative Commons CC BY 4.0 license, which permit the free download, distribution, and reuse, provided that the author and preprint are cited in any reuse.
Alerts
Prerpints.org logo

Preprints.org is a free preprint server supported by MDPI in Basel, Switzerland.

Subscribe

© 2025 MDPI (Basel, Switzerland) unless otherwise stated