1. Introduction
Breast cancer is a heterogeneous disease that can be classified into molecular subtypes based on histologically determined markers, largely the expression status of the estrogen receptor (ER), progesterone receptor (PR), as well as human epidermal growth factor (HER2) (1–3). Hormone-receptor positive breast cancers account for the majority of breast cancer cases, where the expression of these receptors serves as the basis for targeted therapies and are thus generally associated with more positive clinical outcomes (4,5). On the other hand, triple negative breast cancer (TNBC), which does not express ER, PR, or HER2, has limited susceptibility to hormonal or targeted therapy (6,7). Moreover, TNBC is also known for its more aggressive and metastatic nature and higher potential for disease recurrence (6,7). Chemotherapy remains the standard of care for the treatment of TNBC following surgery and radiation (2,6–8). PARP inhibitors, checkpoint inhibitors, and immunotherapies have been shown to have efficacy against distinct sub-populations of TNBC, demonstrating that targeted treatment strategies can be developed to improve therapy outcomes (7,9).
In recent years, the role of epigenetics in cancer development and progression has been widely recognized (10–15). Epigenetics is broadly defined as the study of heritable changes to the genome that are not attributed to an altered DNA sequence (in contrast to genetic mutations). DNA accessibility for transcription, replication, and repair are controlled by epigenetic regulators, which include histone protein and post-translational modifications, DNA methylation, non-coding RNA, and enzymes such as chromatin remodeling complexes (CRCs) (16–18). CRCs facilitate the movement of nucleosomes across the DNA, thereby allowing for control over gene expression, and are essential for processes such as growth and development as well as cancer-specific biology (16,18,19). Given their putative involvement in the tumorigenesis and development of TNBC, recent attention has been directed towards epigenetic regulators as potential therapeutic targets (14,18,19).
The nucleosome remodeling factor (NURF) is a CRC and member of the imitation switch (ISWI) family of ATP-dependent multidomain protein complexes (20,21). As is the case with CRCs from other families, NURF has been implicated in human cancers (22–27). NURF is comprised of an ATPase domain, SNF2L, a WD-repeat protein RbAP46/48, and a chromatin-binding protein, Bromodomain PHD-finger transcription factor (BPTF) (21). BPTF is the largest subunit of NURF, and is unique to and essential for its function (21,28). This, along with bromodomains being considered “druggable”, makes BPTF particularly attractive as a therapeutic target. AU1 (rac-1), the compound that is the focus of this manuscript, is a commercially available small molecule inhibitor of BPTF that has a Kd=2.8 µM for BPTF (28).
Chemotherapy treatment fails in 90% of cancer cases due to drug resistance (29). It is therefore critical to address the phenomena of multidrug resistance (MDR) that occurs in all types of cancers. Multiple mechanisms of MDR have been identified in TNBC, including altered drug metabolism, altered drug targets, DNA repair, apoptosis inhibition, autophagy, increased drug efflux, and reduced drug influx (30–33). In the context of MDR, drug efflux is facilitated by the overexpression of transporter proteins, resulting in a reduced exposure of cancer cells to antitumor drugs. ATP-binding cassettes (ABC) transporters represent a large and diverse superfamily of ATP-dependent efflux proteins (34). In TNBC, the overexpression of ABC transporters -most notably of canonical efflux pump P-glycoprotein (P-gp), multidrug resistance protein 1 (MRP1), and breast cancer resistance protein (BCRP)- has been demonstrated (31,35). Critically, approximately 40% of TNBC cases show overexpression of P-gp, making it a major obstacle in the successful treatment of cancer patients(36).
Over the course of many decades, numerous efflux pump inhibitor compounds have been developed and explored. Inhibition of efflux pumps such as P-gp can be achieved through interactions of the inhibitor in noncompetitive, competitive and allosteric processes, as well as through other mechanisms such as disruption of cell membrane lipid integrity and ATP hydrolysis (34). Four generations of P-gp inhibitors, categorized by metrics such as potency, selectivity, and drug interactions, have been developed and tested (34,37), but none have been approved for human use. The basis for failure of these inhibitors in clinical trials has been varied, including the necessity of utilizing intolerably high doses, high toxicity, drug interactions, and limited efficacies (34,37). Nevertheless, efforts have continued to explore the use of natural and/or FDA-approved compounds which demonstrate P-gp inhibition activity for adjunctive therapeutic use with chemotherapy (38–40).
In the current work, we focus on P-gp of the ABC transporter family, one of the primary contributors to chemoresistance (37,41), and report that AU1, a compound developed as a BPTF inhibitor, enhances sensitivity to chemotherapy in TNBC by interfering with the function of the multidrug resistance pump.
2. Materials and Methods
2.1. Cell Lines
Wild type 4T1 (gift from Fred Miller, Wayne State University), E0771-LMB (gift from Joseph Landry, Virginia Commonwealth University), and MDA-MB-231 (ATCC, catalog no. HTB-26) cells were cultured in complete media (DMEM (11995-065, Gibco; Waltham, MA, USA) supplemented with 10% (v/v) fetal bovine serum (FBS) (SH30066.03, Thermo Scientific; Waltham, MA, USA) and 100 U/mL penicillin G sodium and 100 μg/mL streptomycin sulfate (15140122, Gibco)). Cells were used within 20 passages and were tested and confirmed negative for mycoplasma contamination bimonthly using the MycoStrip™ 50 Kit (InvivoGen, rep-mysnc-50).
2.2. Drug Treatments
AU1 (synthesized and provided by Dr. William Pomerantz, University of Minnesota), vinblastine (S4505, SelleckChem; Houston, TX, USA) vincristine (S1241, SelleckChem; Houston, TX, USA), 5-FU (3257, Tocris; Minneapolis, MN, USA) and verapamil (HY-A0064, MedChemExpress; Monmouth Junction, NJ, USA) were dissolved in DMSO. Vinorelbine (V2264, Sigma-Aldrich; St. Louis, MO, USA) doxorubicin (D1515, Sigma-Aldrich; St. Louis, MO, USA), paclitaxel (1097, Tocris; Minneapolis, MN, USA), and cisplatin (2251, Tocris; Minneapolis, MN, USA) were dissolved in sterile distilled water or media.
Cancer cells were allowed to adhere after plating. After overnight incubation with AU1, cells were treated the following day with chemotherapeutic drugs with or without simultaneous administration of AU1 for 96 h. Experiments with endpoints beyond 96 h were either continued in AU1-treated or untreated media, as indicated. Drug- and vehicle-treated media changes were performed every two days for experiments performed in 6-well plates.
2.3. Dose-Response Assessments
Cells were plated at suitable densities (1,500 cells/well for 4T1 cells and 3,000 cells/well for E0771-LMB and MDA-MB-231 cells) in 96-well plates, allowed to adhere to the plates, pre-treated with AU1 overnight, and dosed the following day with serially diluted chemotherapies with and without AU1 for 96 h. Cells were evaluated via the MTS viability assay.
2.4. Clonogenic Survival Assay
4T1 cells plated at 300 cells/well in 6-well plates were allowed to adhere, treated with AU1 overnight as appropriate, followed by chemotherapy, AU1, or combination treatments for 96 h. Drug treatment was terminated and AU1 administration continued, as indicated, until ~ 144 h when colonies began to converge. Plates were fixed with methanol, stained with crystal violet, and manually counted. Counts were normalized with respect to the control treatment group.
2.5. Temporal Response Assay
Cells were plated at 3,000 cells/well in 6-well plates, allowed to adhere, treated with AU1 overnight as appropriate, followed by chemotherapy, AU1, or combination treatments for 96 h. Drug treatment was then terminated and AU1 administration continued or discontinued until day 20. Cells were trypsinized, stained with 0.4% trypan blue (T01282, Sigma), and counted on the indicated days using a hemocytometer; growth curves were generated from the collected data.
2.6. Determination of Apoptosis
Cells were plated at suitable densities, allowed to adhere, and pre-treated with AU1 overnight, as appropriate. The following day, cells were treated with the respective agents at the indicated concentrations for 96 h. The extent of apoptotic cell death was measured using Annexin V-FITC/Propidium iodide staining. Cells were trypsinized, washed with 1X PBS and stained according to manufacturer’s protocol (556547, Annexin V-FITC Apoptosis Detection Kit; BD Biosciences; Franklin Lakes, NJ, USA). Fluorescence was quantified via flow cytometry using BD FACS Canto II and BD FACS Diva software at the Flow Cytometry Core Facility at Virginia Commonwealth University. For all flow cytometry experiments, 10,000 cells per replicate were analyzed, and three replicates for each condition were analyzed per independent experiment unless otherwise stated. All experiments were performed with cells protected from light.
2.7. Western Blot Analysis
Western blotting was performed as previously described [
16]. Briefly, after the indicated treatments, cells were trypsinized, harvested, and washed with 1X PBS. Pellets were lysed and protein concentrations were determined via the Bradford Assay (5000205, Bio-Rad Laboratories; Hercules, CA, USA). Protein samples were loaded and subjected to SDS-polyacrylamide gel electrophoresis, transferred to polyvinylidene difluoride membrane, and blocked with 5% BSA in 1X PBS with 0.1% Tween 20 (BP337, Fisher; Hampton, NH, USA). The membrane was incubated overnight at 4 °C with the indicated primary antibodies at a dilution of 1:500 for P-gp (#A19093, ABclonal; Woburn, MA, USA) and 1:4000 for β-actin (#4970, Cell Signaling Technology) with 5% BSA in 1X PBS. The membrane was then washed, horseradish peroxidase (HRP)-conjugated anti-rabbit (#7074, Cell Signaling Technologies) secondary antibody was added at a dilution of 1:2000 with 5% BSA in 1X PBS for 2 h at room temperature, and the membrane was washed three times in 1X PBS with 0.1% Tween 20. Blots were developed using Pierce enhanced chemiluminescence reagents (32132, Thermo Scientific) on Bio-Rad ChemiDoc System. Image-J software was utilized for quantification of Western blots.
2.8. Multidrug Resistance Assay
Efflux pump activity and inhibition were assessed using the calcein-AM-based MDR Assay Kit (600370, Cayman; Ann Arbor, MI, USA). Cells were plated at a density of 150k cells/well in 6-well plates and allowed to adhere. As appropriate, AU1 was administered overnight for 30 minutes before running the assay the following day. Administration of control compounds, verapamil and cyclosporin A, as well as calcein-AM and PI were performed according to the manufacturer’s protocol. Cells were collected and analyzed using BD FACSCanto II and BD FACSDiva software. For all flow cytometry experiments, 10,000 cells per replicate were analyzed, and three replicates for each condition were analyzed per independent experiment. All experiments were performed with cells protected from light. Flow cytometry data were analyzed using Flowjo software (v9.9; Tree star Inc.; Ashland, OR, USA).
2.9. MTS Assays
The MTS assay assay was performed according to the manufacturer’s protocol (AB197010, Abcam) and absorbance, which correlates to the number of viable cell per well, and recorded at 490 nm on a Biotek ELX800 Universal Microplate Reader (Winooski, VT, USA).
2.10. Statistics
Unless otherwise indicated, all quantitative data are shown as mean ± SEM from at least three independent experiments (biological replicates), all of which were performed in triplicate or duplicates (technical replicates). GraphPad Prism 9.0 software was used for statistical analysis. All data were analyzed using either a one- or two-way ANOVA, as appropriate, with Tukey or Sidak post hoc. IC50 values were calculated using dose-response assessments fittings with four-parameter logistic regressions.
2.11. Molecular Docking
GOLD v5.6 (from Cambridge Crystallographic Data Center, Cambridge, UK) (
42) was employed to study the interactions between the AU1 small molecule ligand and the MDRP protein. The three-dimensional structure of MDRP was obtained from the published CryoEM structure (PDBID: 7A69) (
43). Protein and ligand preparations were carried out using SYBYL X2.1 (Tripos Associates, St. Louis, MO), which included addition of hydrogen and missing atoms, protonation of residues, removal of steric clashes and energy minimization. The centroid of the bound ligand from the CryoEM structure was taken as the center, and a 16-Å radius was defined as the binding site from this centroid. Docking was performed for 100 genetic algorithm runs with 100,000 iterations and early termination option was disabled. The GOLD fitness score was calculated from the contributions of hydrogen bond and van der Waals interactions between the protein and ligand (
42). From the GOLD based docking, the best-sampled pose (highest GOLD score) was selected and analyzed for interactions. Discovery Studio visualizer was used to make 2D interaction profiles (Accelrys Software, Cambridge, England,
https://discover.3ds.com) and PyMOL (
44) was used to illustrate the 3D interactions.
3. Results
3.1. Assessment of Sensitization to the BPTF Inhibitor, AU1.
A panel of FDA-approved drugs and compounds were added to genetically BPTF-silenced murine 4T1 triple negative breast cancer cells in a preliminary screen [data not shown]. Chemotherapeutic drugs that appeared to be more effective in cells with reduced BPTF expression were selected to be further assessed for activity with wildtype 4T1 cells in combination with the BPTF inhibitor, AU1, since a pharmacological strategy would be the clinically relevant approach. Dose-response curves were performed in 4T1 and E0771-LMB murine TNBC cells to identify concentrations of AU1 that did not exhibit cytotoxicity alone. The nontoxic concentration of 2.5 µM AU1, which approximates its Kd of 2.8 µM (28), was selected to be used in combination with chemotherapies in subsequent experiments (Supplemental Figure 1).
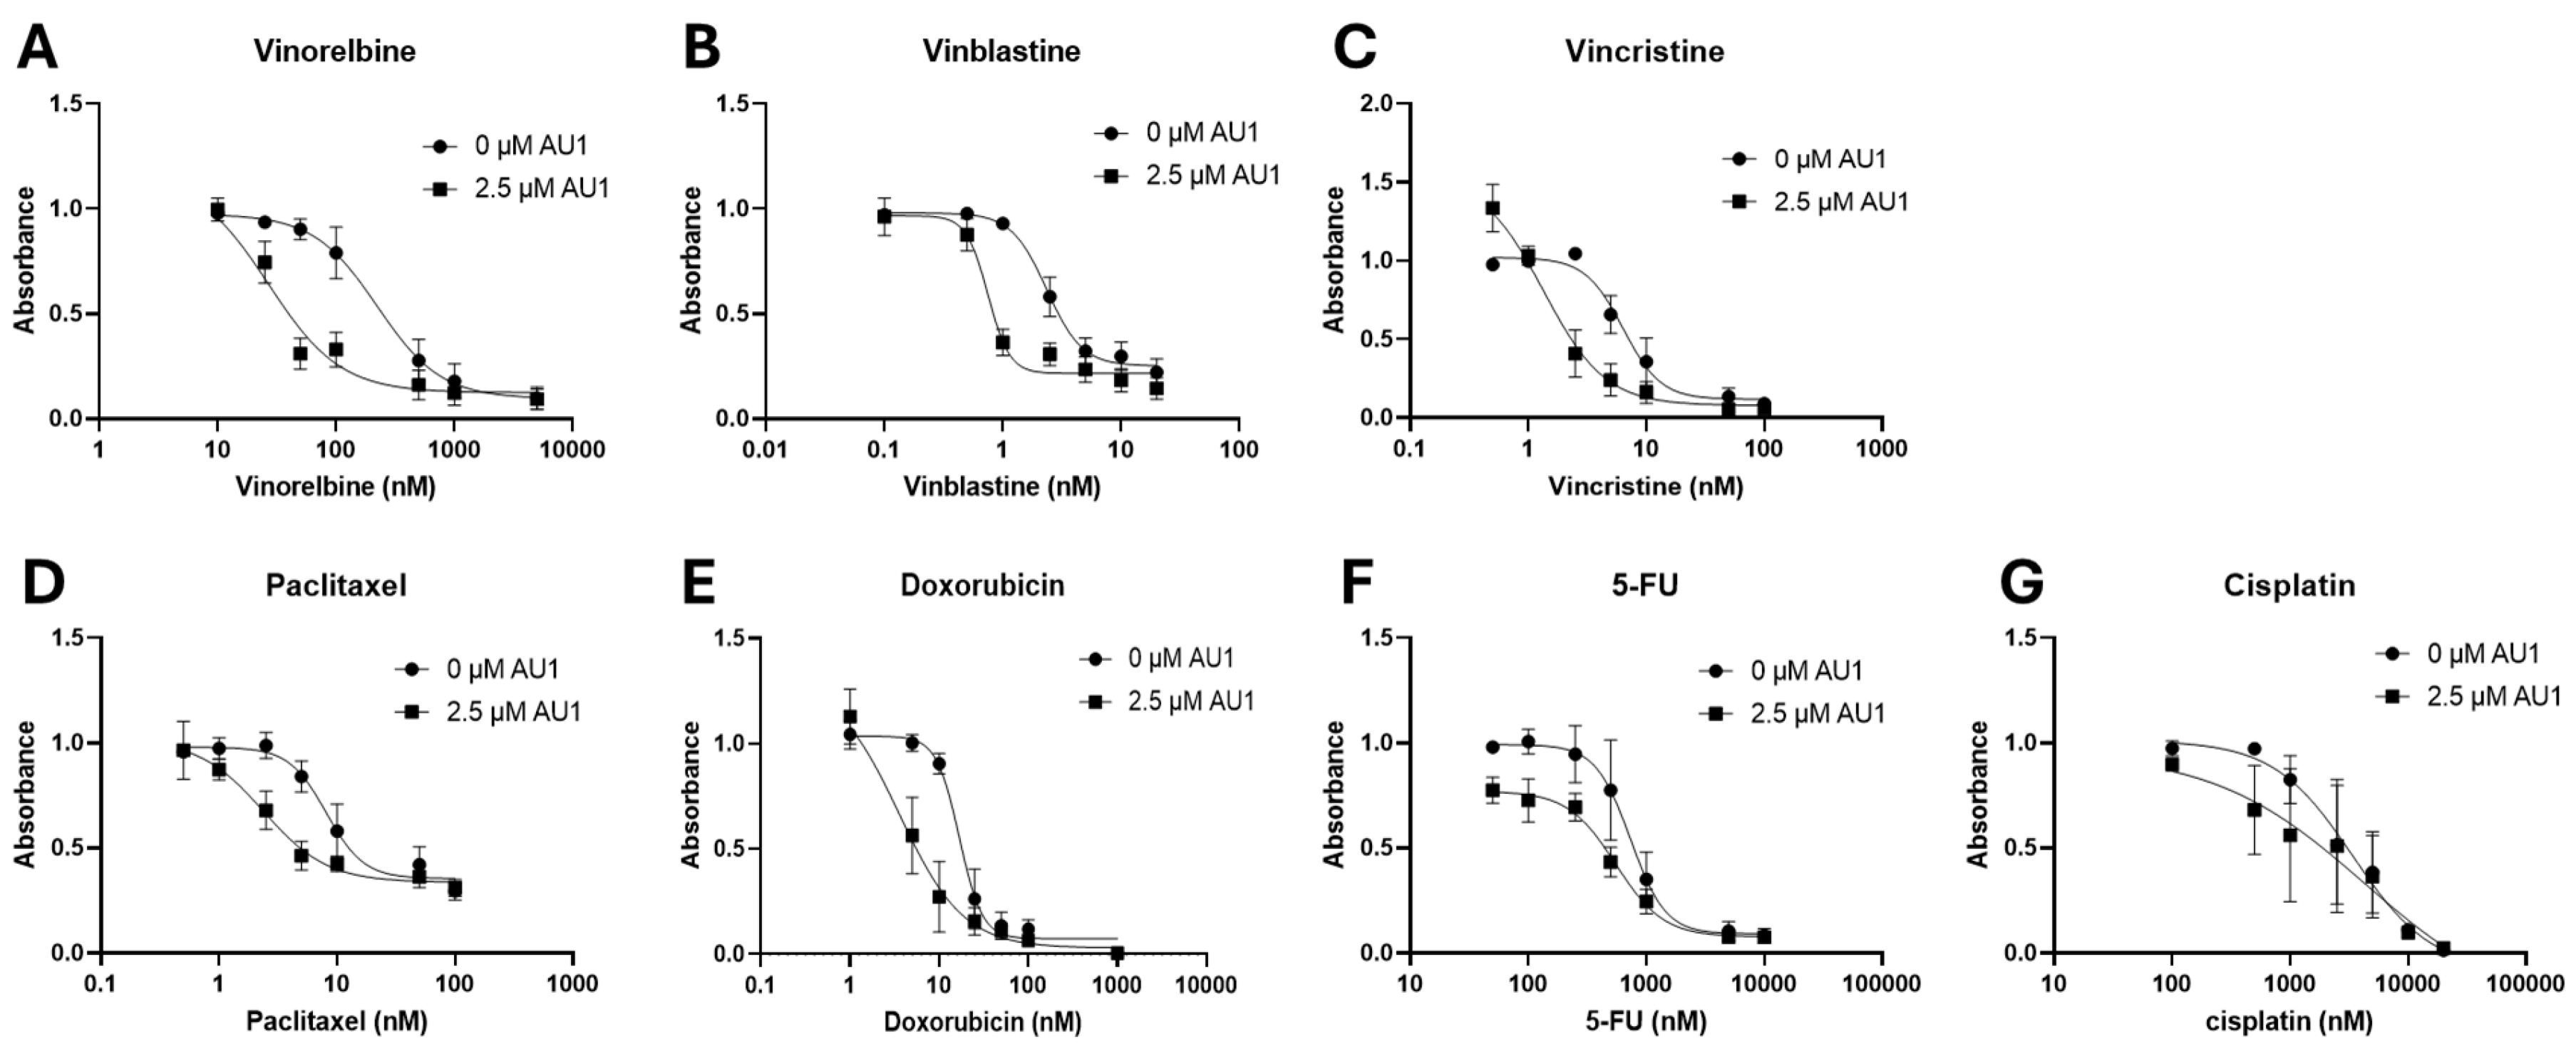
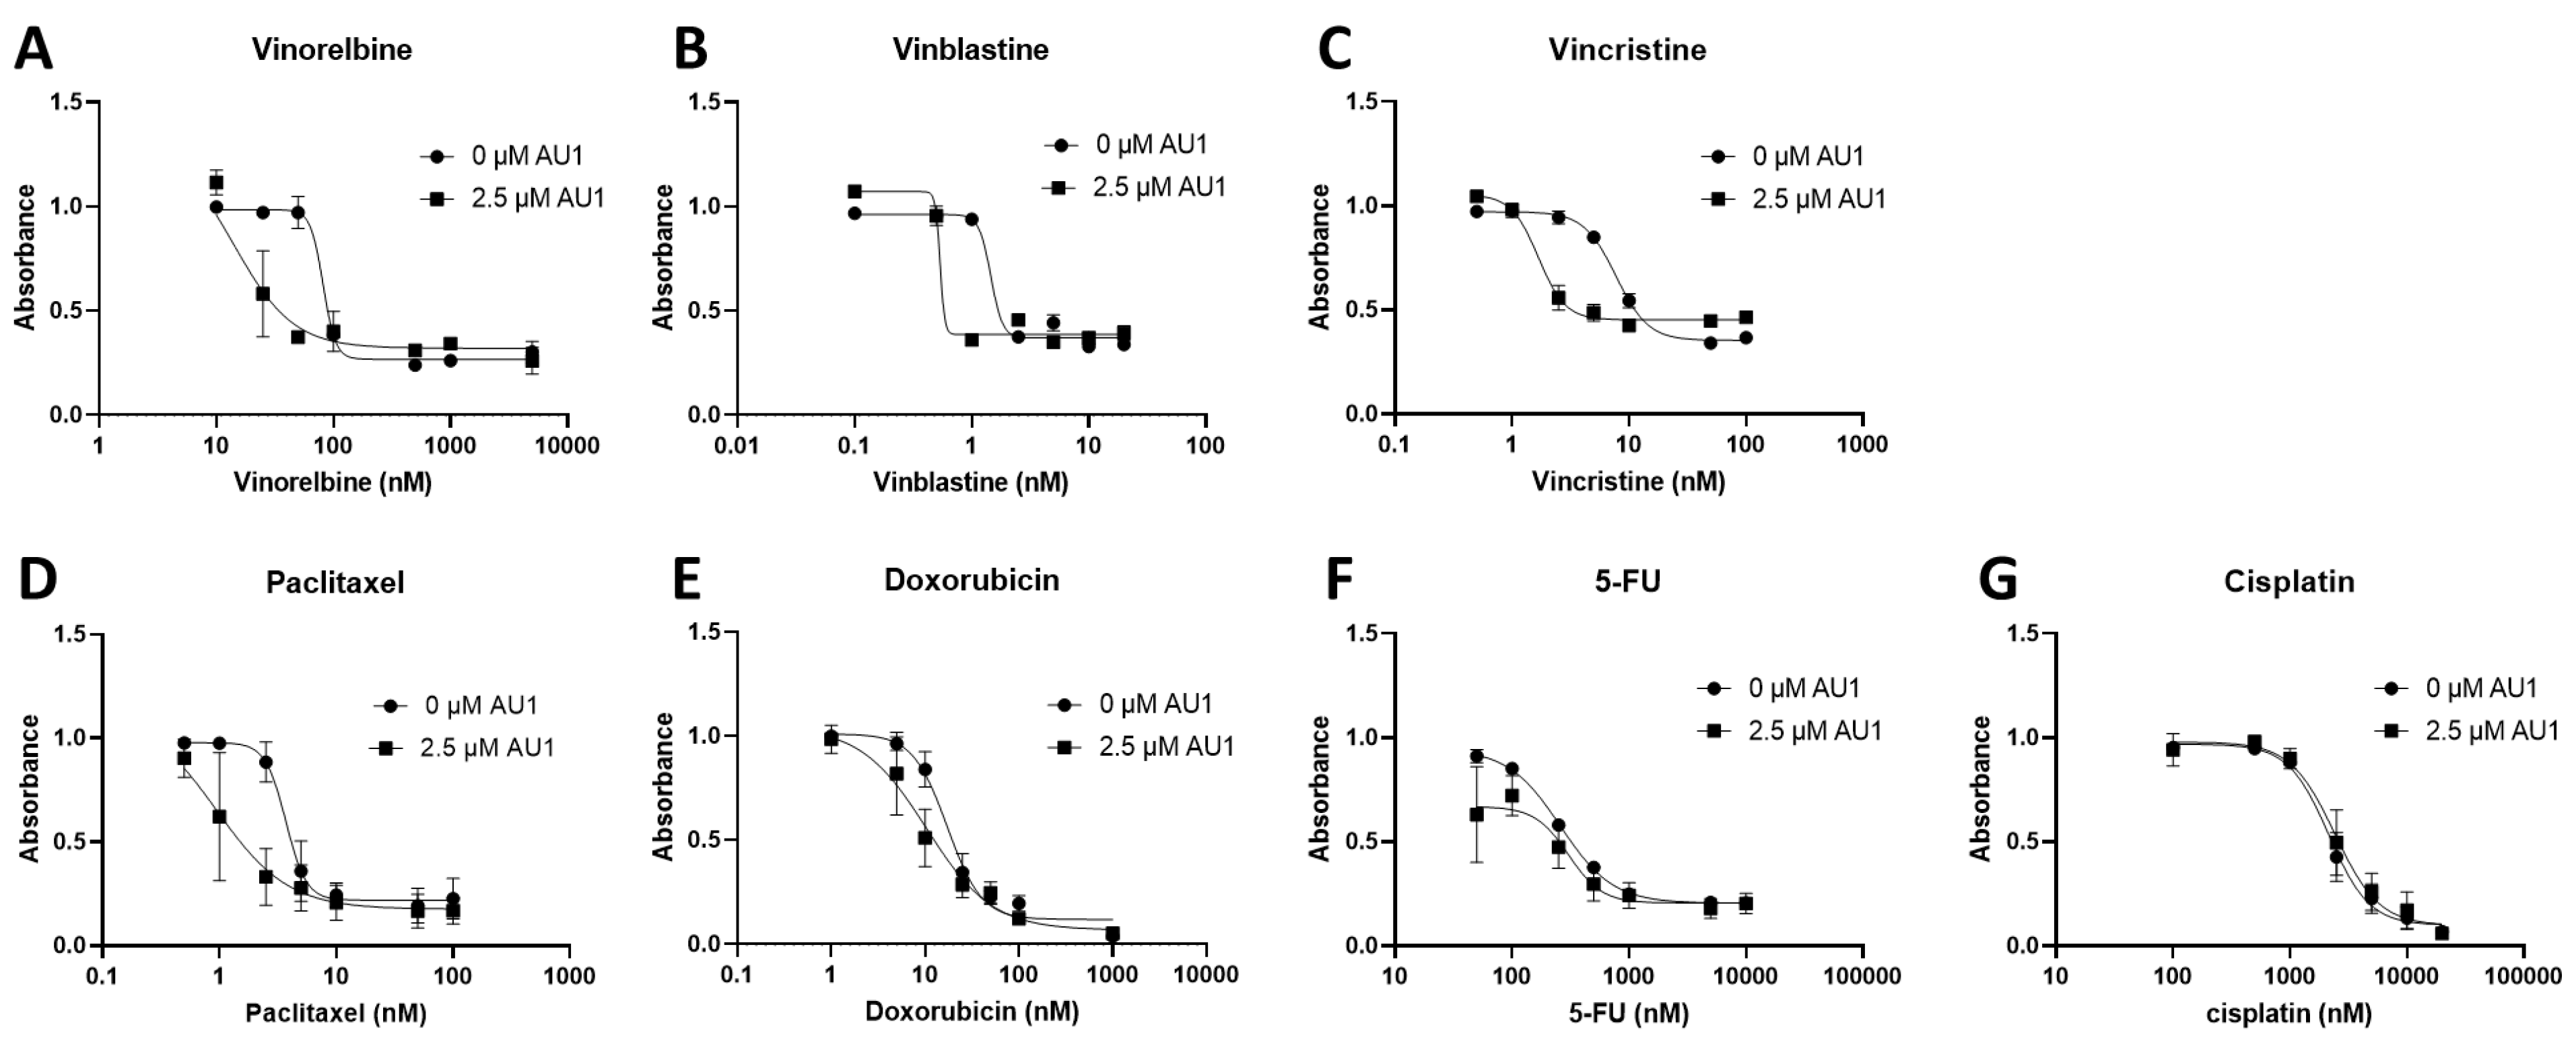
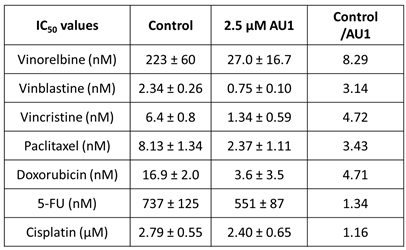
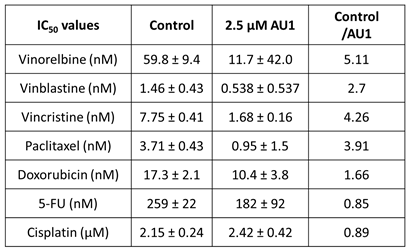
Dose-response curves for various chemotherapy treatments with and without AU1 in the 4T1 and E0771-LMB cells are shown, respectively, in
Figure 1 and
Figure 2. For each agent, IC
50 values were determined with and without AU1, and fold-change in IC
50 values, can be found for 4T1 cells in
Table 1 and E0771-LMB cells in
Table 2. The most pronounced overall IC
50 fold-changes for both 4T1 and E0771-LMB cell lines were observed for vinorelbine, which is a p-gp substrate. For 4T1 cells, the IC
50 for vinorelbine alone is ~ 223 nM and shifts to ~ 27 nM when treated in combination with AU1, which translates to an 8-fold difference. Similarly, for E0771-LMB cells, the IC
50 for vinorelbine shifts from 60 nM to 12 nM when treated with AU1, representing an approximately 5-fold difference. The addition of AU1 to 4T1 and E0771-LMB cell lines results in 2-5-fold increases in potency for vinblastine, vincristine, paclitaxel, and doxorubicin, which are all p-gp substrates. Conversely, AU1 does not appear to sensitize cells to either 5-FU or cisplatin, drugs which are generally not considered to be substrates for the p-gp efflux pump (
45). These data led to the hypothesis that AU1 sensitizes these cells preferentially to drugs that are p-gp substrates.
Consistent with this hypothesis, when 4T1 cells were treated with gemcitabine (Supplemental Figure 2), drug sensitivity was actually reduced instead of increased. This observation is similar to findings generated by Bergman et al. (46), which showed increased sensitivity to gemcitabine in P-gp overexpressing cell lines.
Dose-response curves for vinorelbine, vinblastine, and doxorubicin with and without AU1 administration were also performed with human MDA-MB-231 TNBC cells, as shown in
Figure 3. Fold changes in IC
50 values are presented in
Table 3. The IC
50 shifts are quite modest, suggesting that AU1 does not sensitize the MDA-MB-231 cells to the chemotherapeutic agents, in contrast to the findings with the 4T1 and E0771-LMB cell lines.
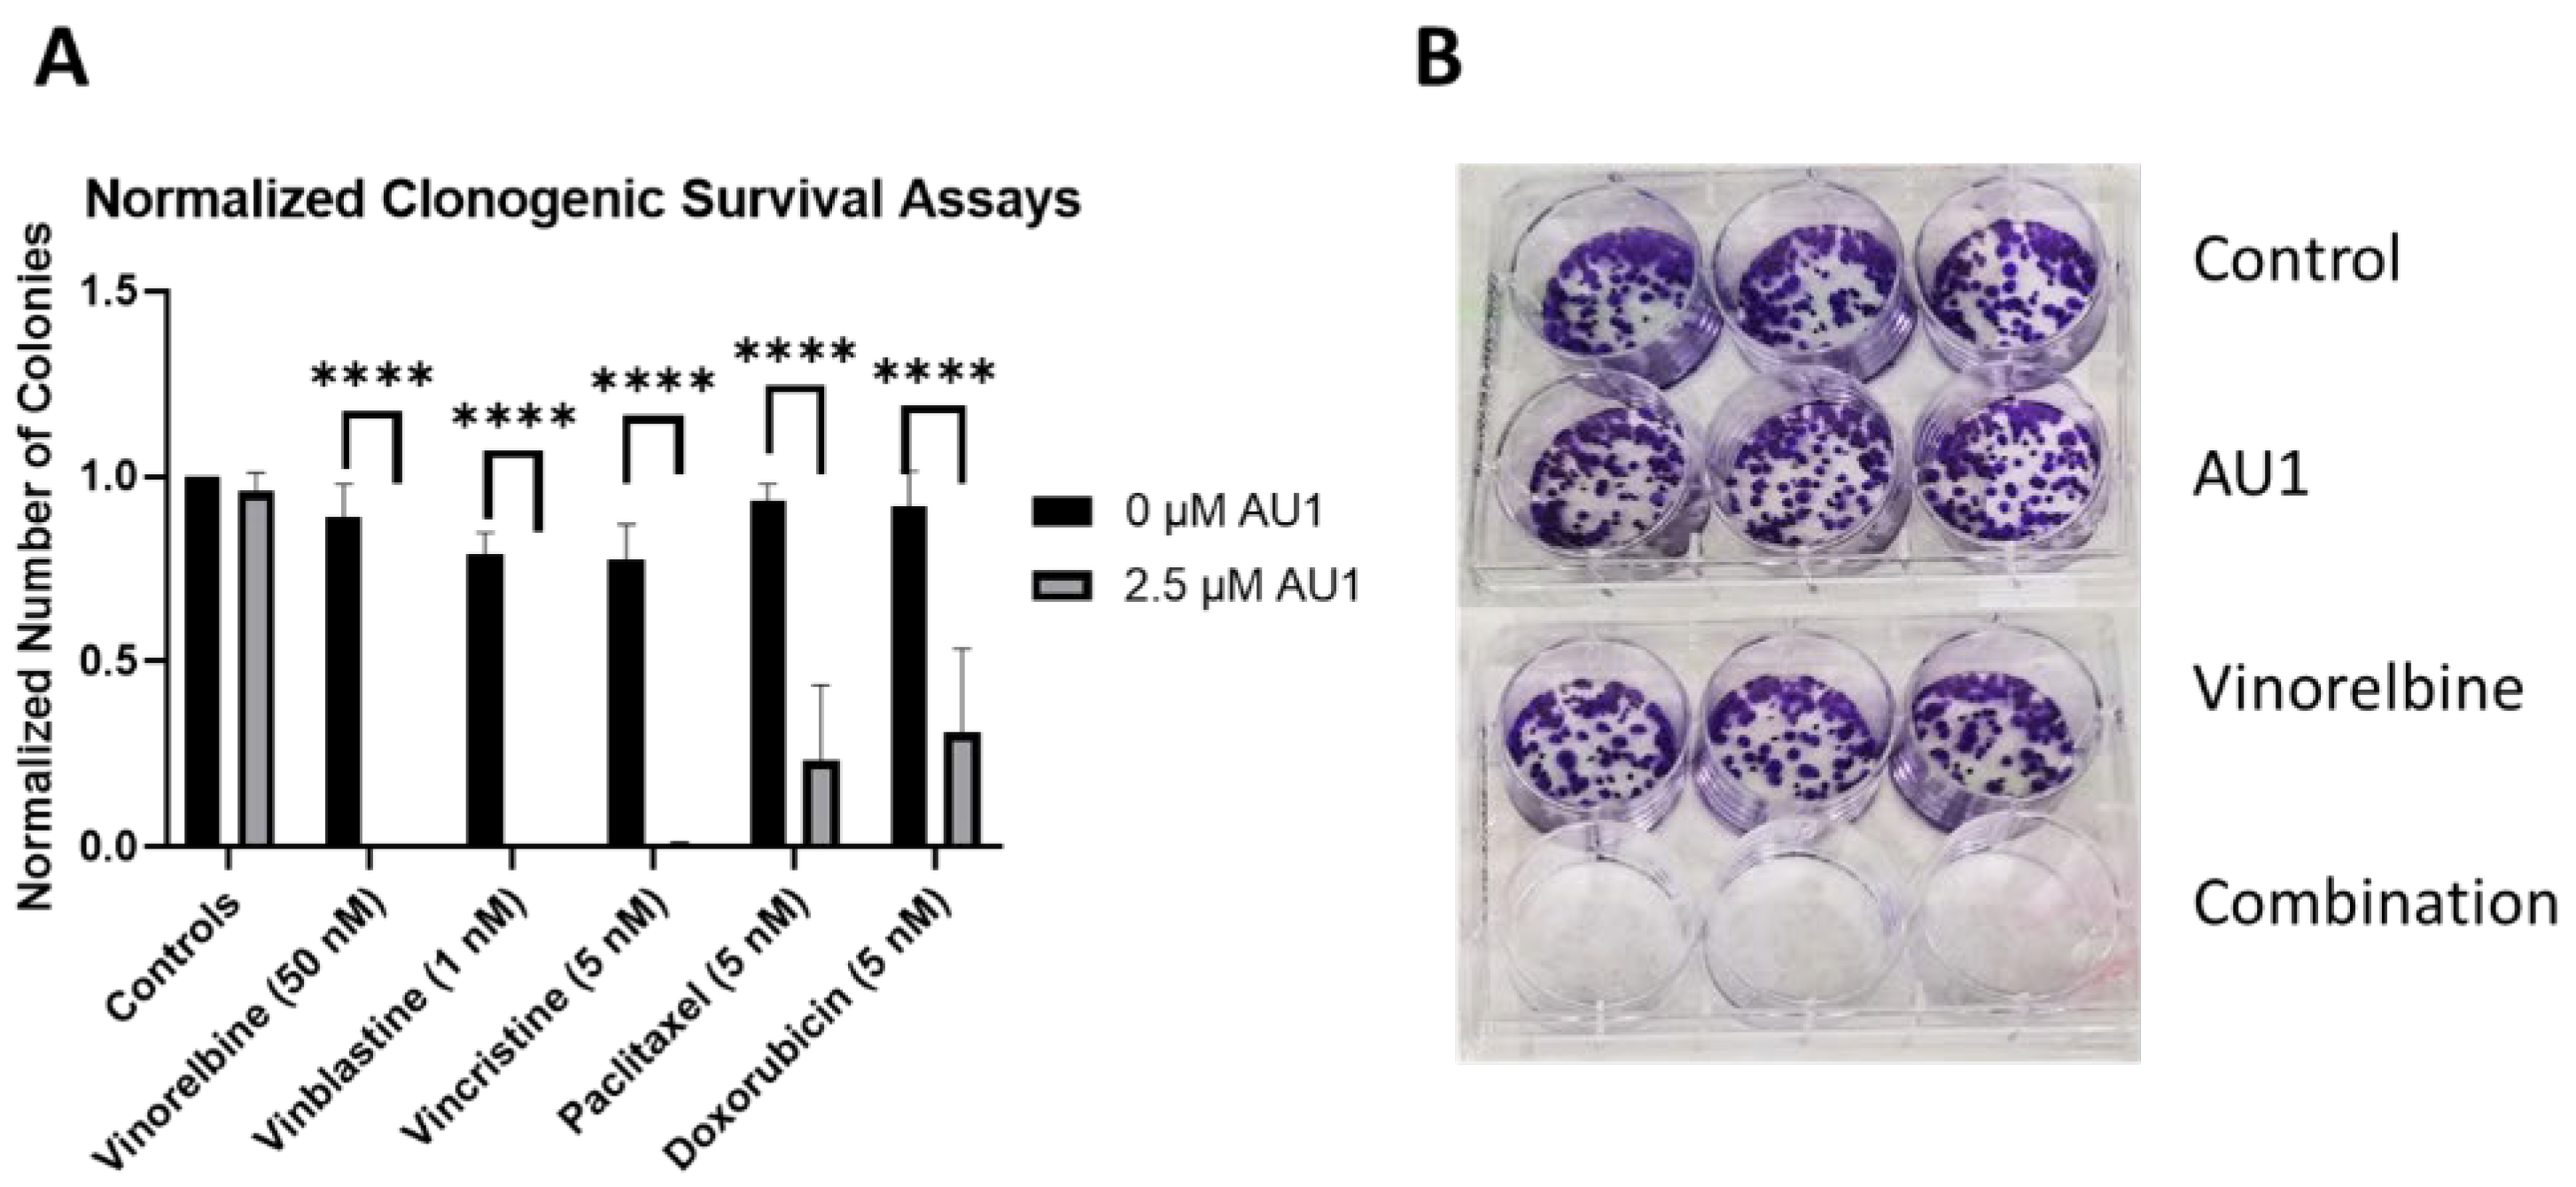
Clonogenic survival assays were performed to further confirm the sensitization conferred by AU1 in combination treatments.
Figure 4 shows the results from clonogenic survival assays performed with the select chemotherapies explored in
Figure 1 in 4T1 cells. Utilizing drug concentrations that alone did not significantly suppress colony formation, colony formation is virtually eliminated in combination with AU1 for vinorelbine, vinblastine, vincristine, and significantly suppressed for paclitaxel, and doxorubicin.
3.2. Growth Arrest and Cell Death for the Combination of Chemotherapy with the BPTF Inhibitor, AU1
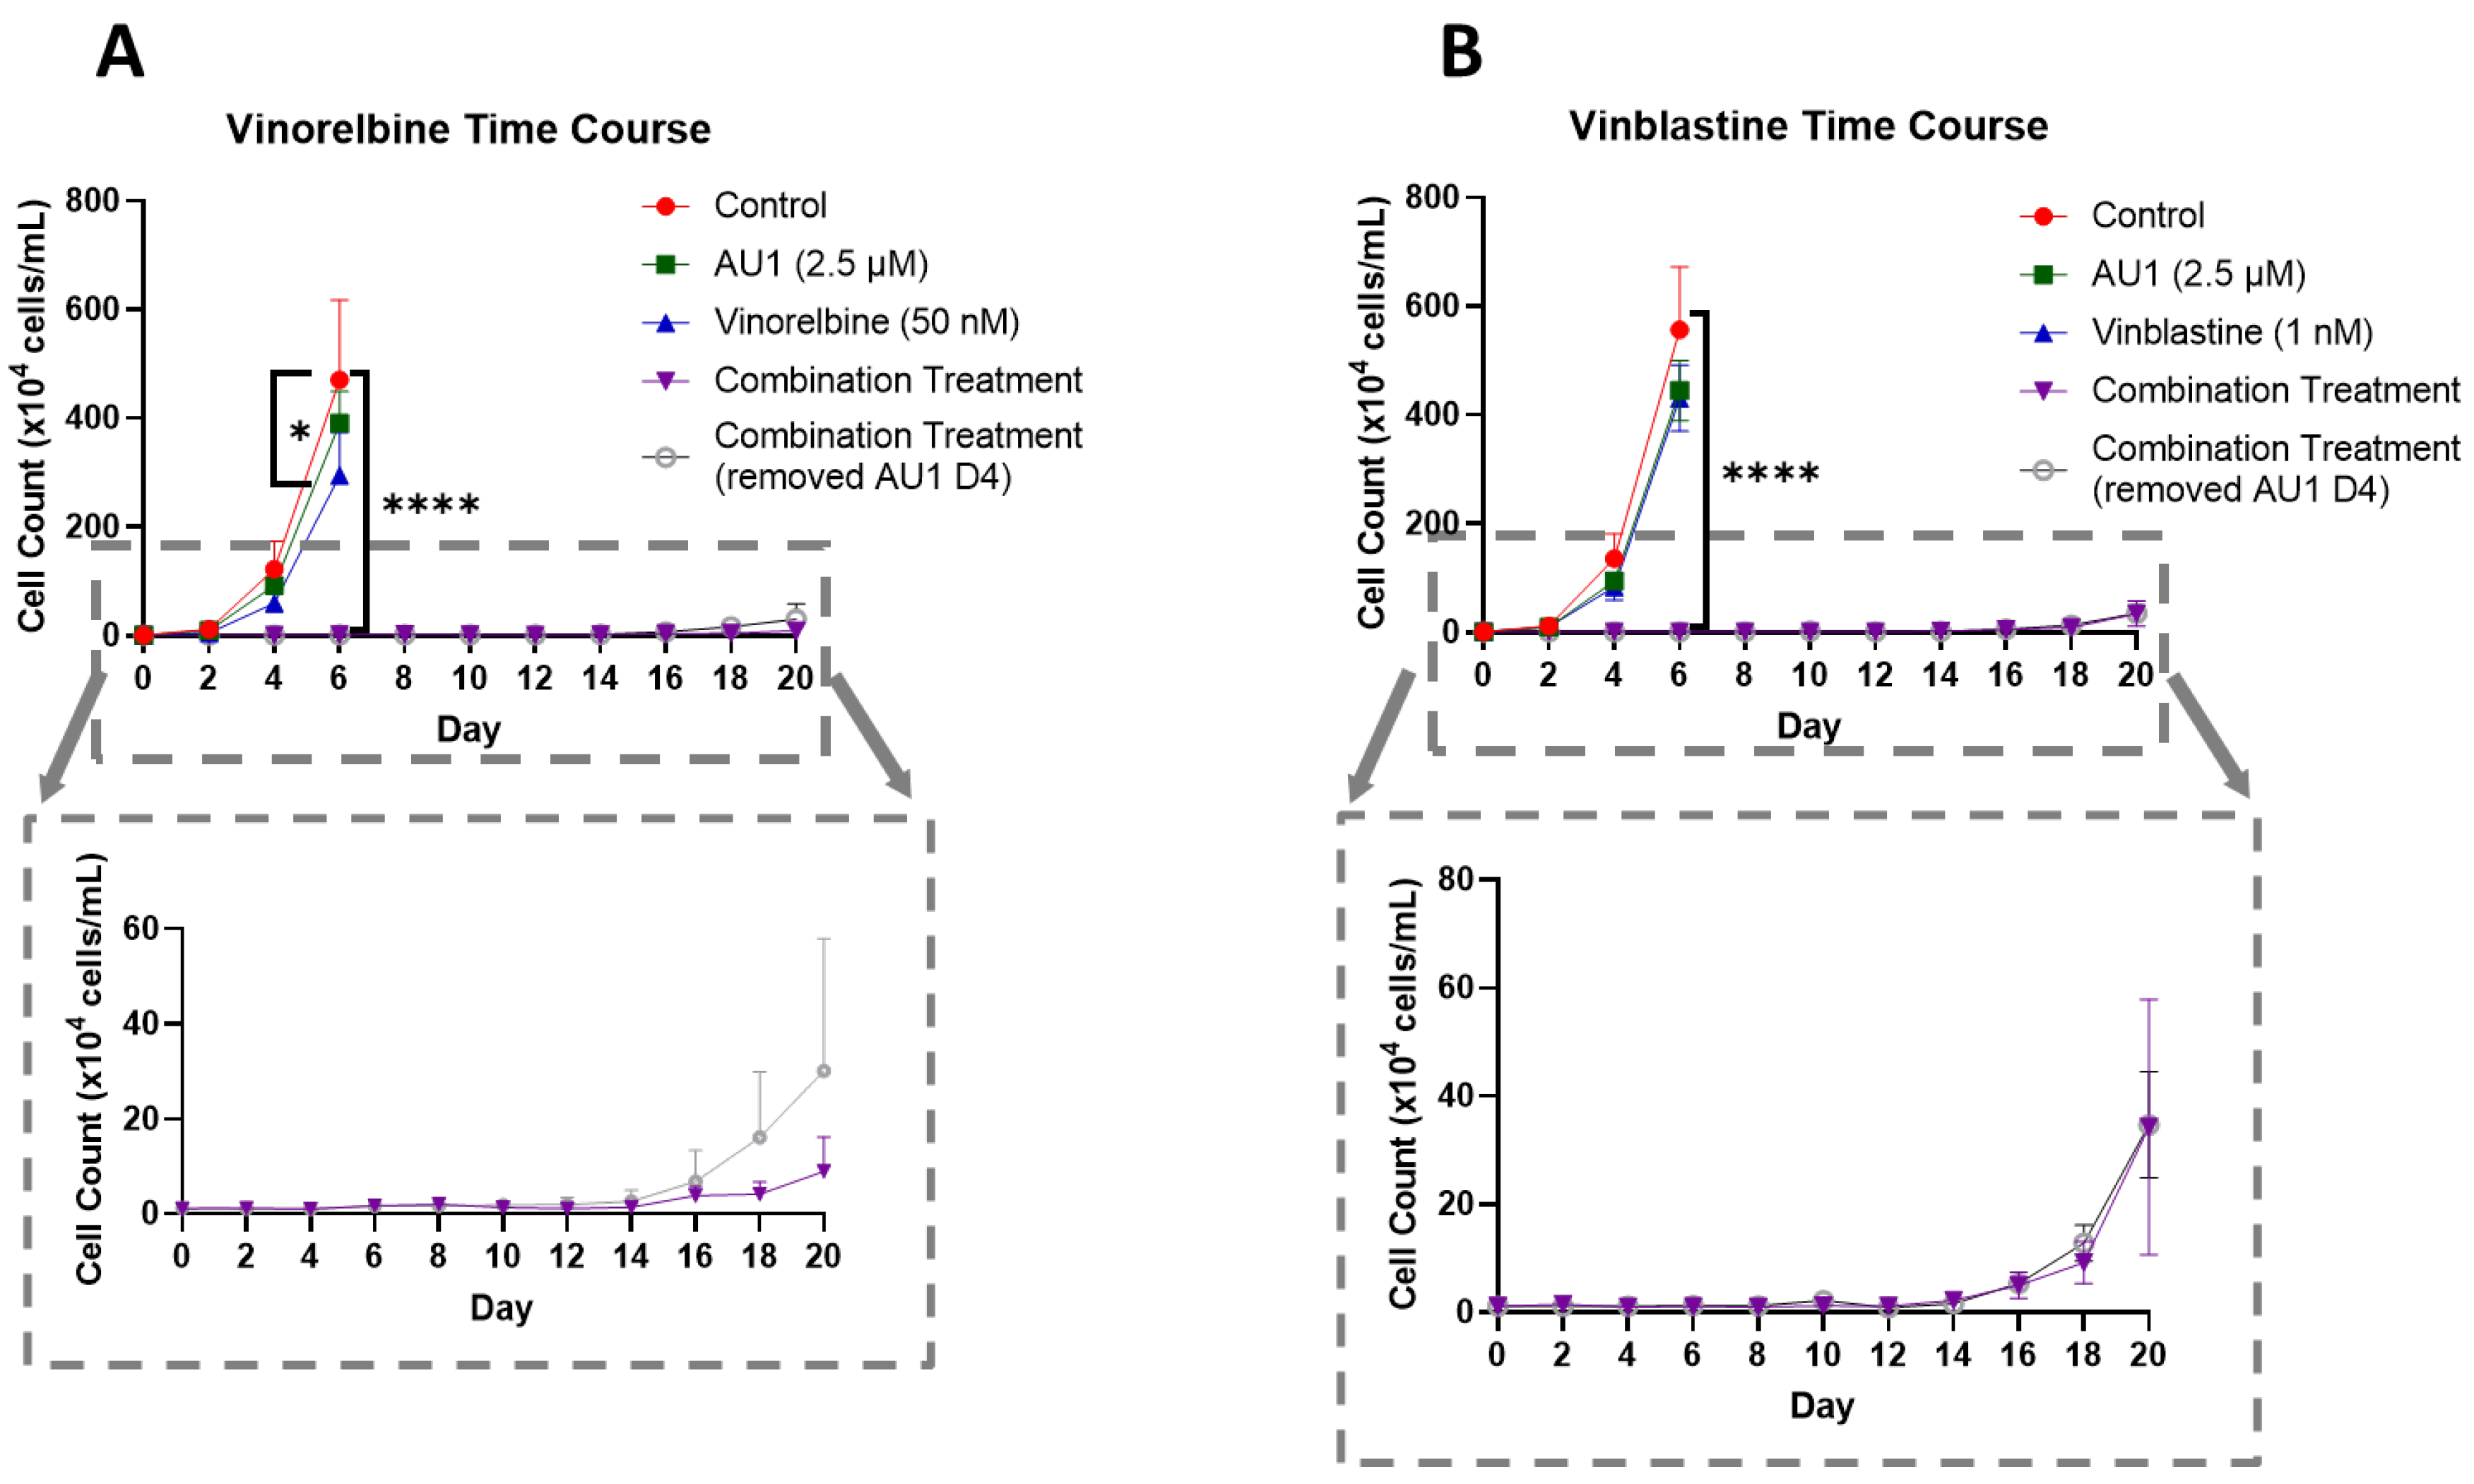
In order to further establish the durability of the growth suppression induced by the combination of AU1 with select chemotherapeutic agents, temporal response studies were performed for the combination of either vinorelbine or vinblastine with AU1 in 4T1 cells, as is shown in
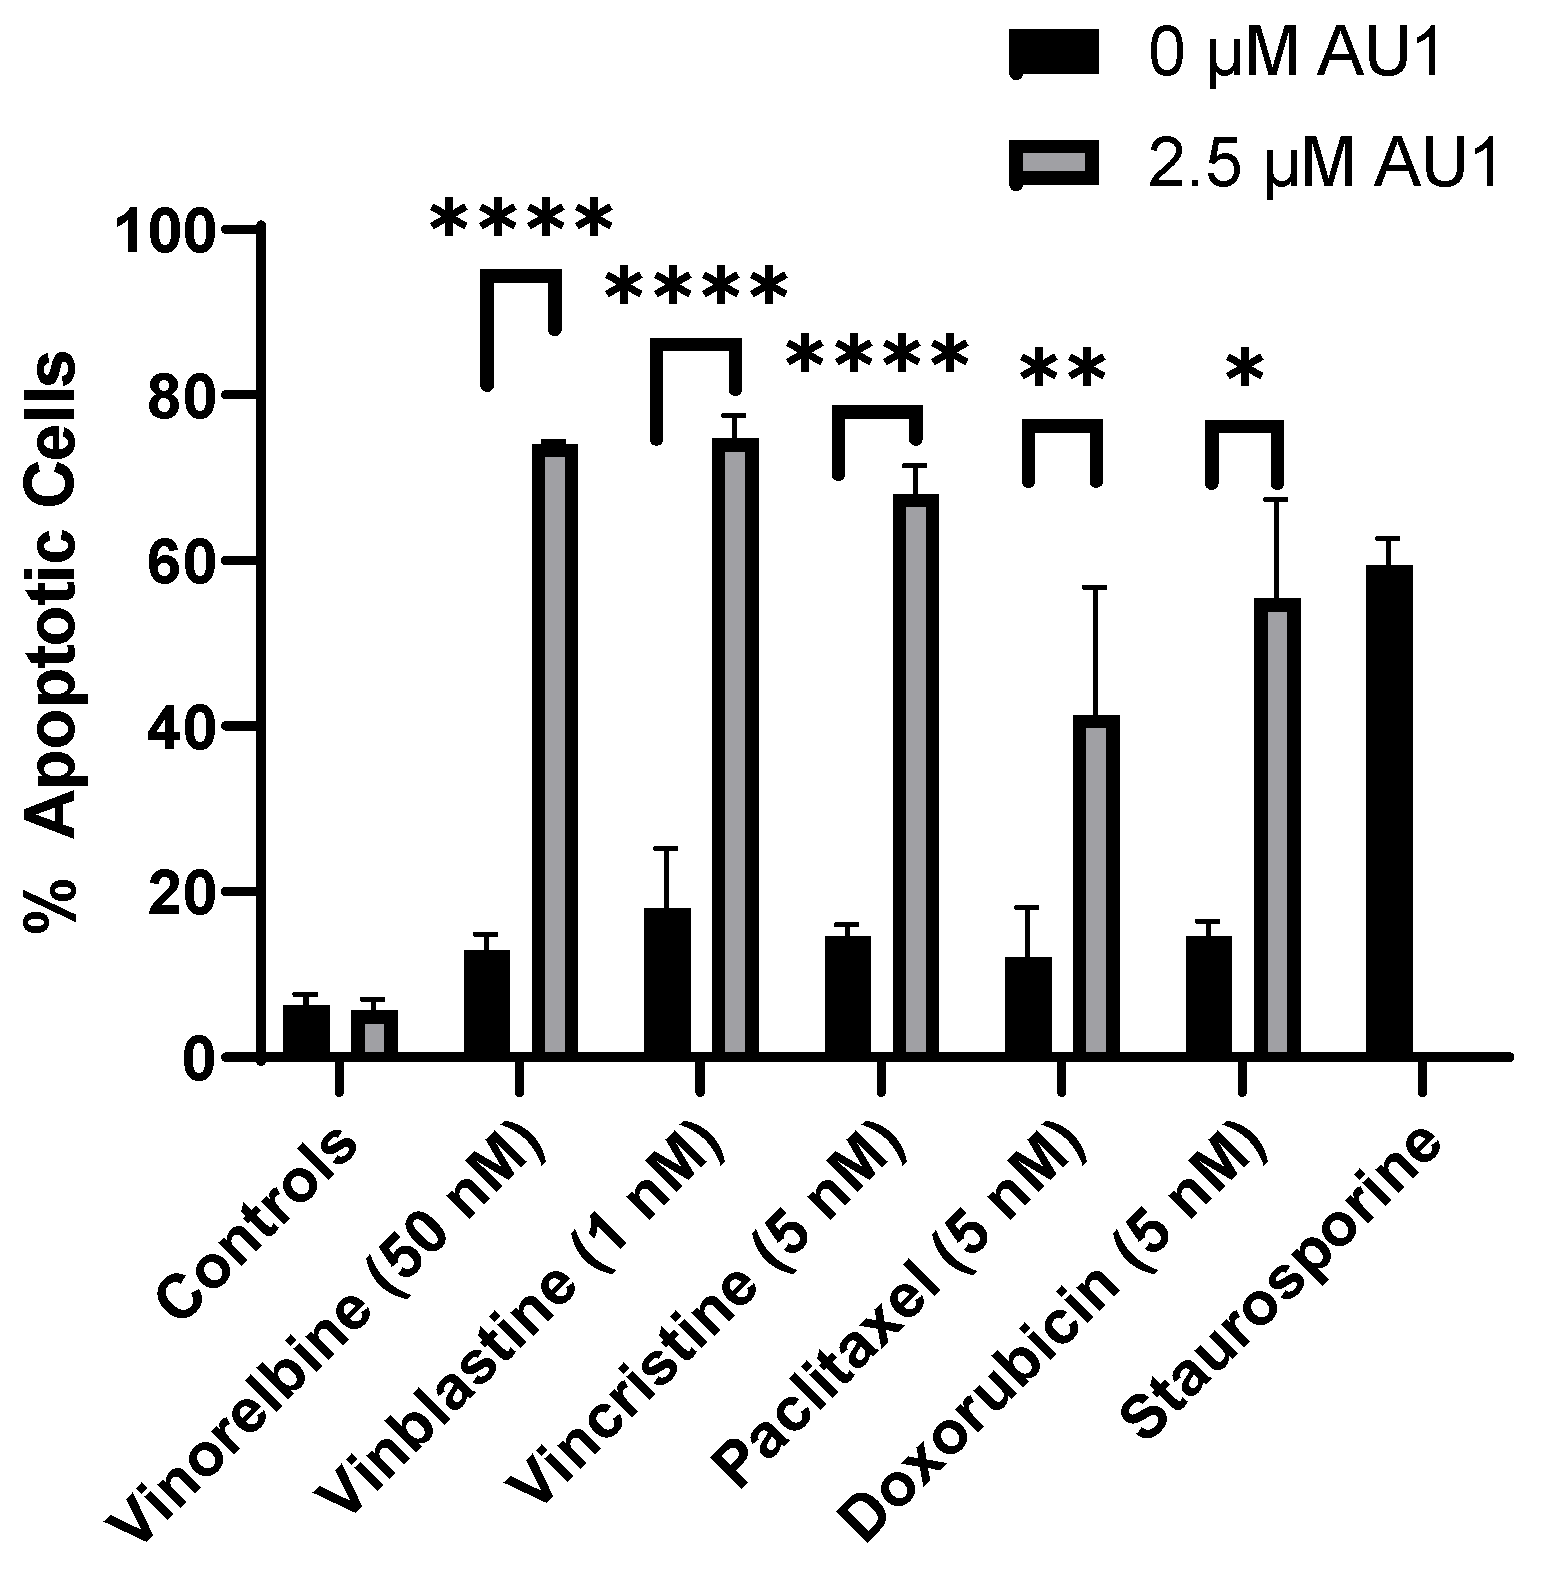
Figure 5A and 5B, respectively. Cell growth was largely unaffected with either chemotherapy or AU1- alone, whereas the combination treatments resulted in complete suppression of proliferative capacity for 16-18 days, as shown in the expanded dotted regions. This held true for both combination treatment protocols, specifically where AU1 treatment was continued throughout the duration of the study as well as the regimen where AU1 was removed after the fourth day, when the chemotherapy was also removed. Analyses by flow cytometry on day 4 of treatment indicated that combination treatment of AU1 with vinorelbine, vincristine, vinblastine, paclitaxel, or doxorubicin increased apoptosis of 4T1 cells as compared to each of the chemotherapeutics alone (
Figure 6).
3.3. Evidence that AU1 Is Acting to Inhibit the Multidrug Resistance Pump
While AU1 was developed as a BPTF/NURF inhibitor, it became evident that the drugs to which both 4T1 and E0771-LMB cells were sensitized when treated in combination with AU1 (
Table 1 and
Table 2) were known substrates of efflux pumps such as P-gp and MRP1 (
44). Classes of drugs that did not exhibit sensitization when treated in combination with AU1 were from platinum-based and antimetabolite classes, both of which are not substrates of efflux proteins MRP and P-gp (
44). Additionally, this sensitization was not observed in the MDA-MB-231 cell line. This indicated that AU1 could be acting to modulate efflux pump(s).
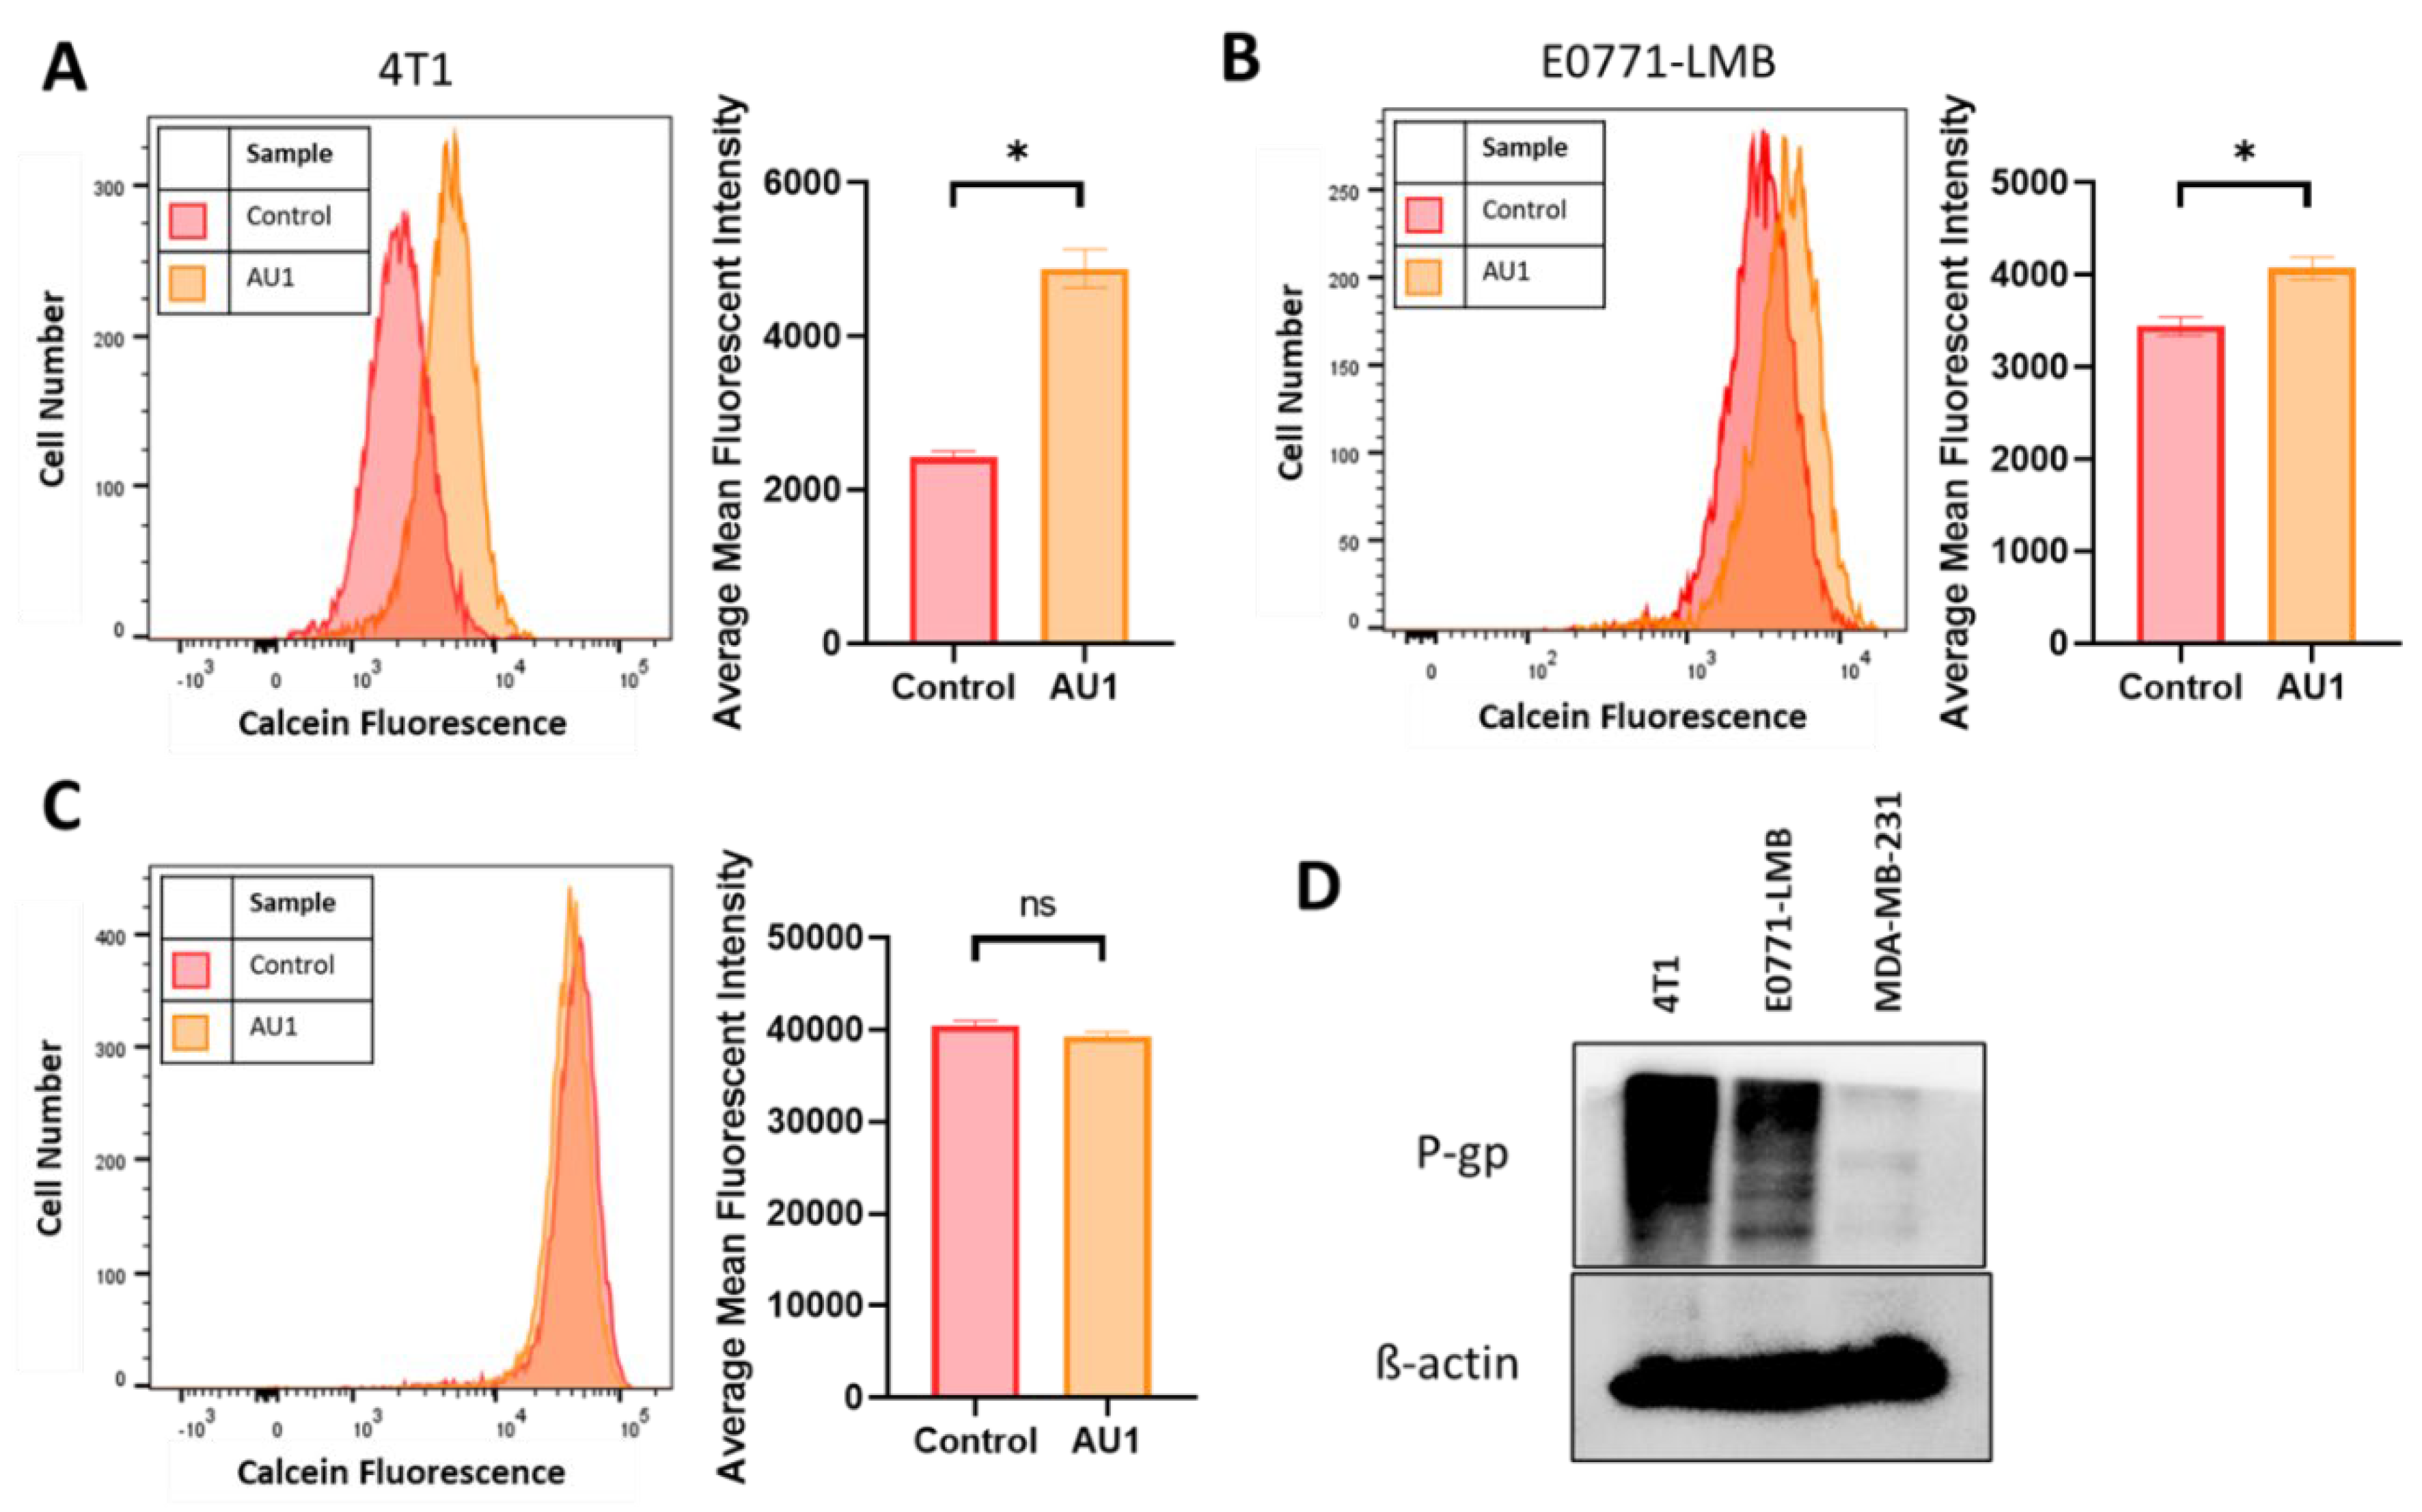
Figure 7D indicates that the P-gp multidrug resistance pump is expressed in both the 4T1 and the E0771-LMB cells, which confers resistance to the microtubule targeting and anthracycline drug classes (
44), consistent with our findings that AU1 sensitized P-gp-expressing lines to these agents; however, this protein is not detectable in the MDA-MB231 cells. We found that administration of AU1 did not appear to affect P-gp protein expression in either the 4T1 or E0771 cells, suggesting that any modulation of P-gp activity was likely to be post-translational (
Supplemental Figure 3).
The ability of AU1 to act as an efflux pump inhibitor (for MRP1 and/or P-gp) was further investigated using a calcein-AM-based kit multidrug resistance efflux kit. Briefly, the assay employs calcein-AM, which is a nonfluorescent dye that passively enters cells and is cleaved by intracellular esterases to form the fluorescent product, calcein. Calcein is a substrate of pg-p and MRP efflux pumps and its presence in cells can be quantified via flow cytometry. Cells with high expression of and/or uninhibited efflux pump proteins will efflux more calcein and emit lower fluorescence, while cells that have inhibited efflux pumps and/or lowered expression will retain calcein and emit higher fluorescence.
Representative histograms as well as mean fluorescent intensity values averaged across multiple biological replicates for DMSO control and AU1-treated cells are shown in
Figure 7. 4T1 and E0771-LMB cell lines, in
Figure 7A and 7B respectively, demonstrate that AU1 significantly inhibits the efflux of calcein-AM from both 4T1 and E0771-LMB cells, whereas administration of AU1 to MDA-MB-231 cells had no statistical effect on calcein-AM retention (
Figure 7C). The more modest inhibition in the E0771-LMB line as compared to 4T1 cells is consistent with the lower levels of P-gp in the E0771-LMB cells as shown in
Figure 7D.
We next compared the sensitizing effects of AU1 with a classical inhibitor of drug efflux, verapamil, which is clinically employed as a calcium channel blocker used to treat cardiac arrhythmias, hypertension, and angina, and is a known inhibitor of P-gp (
49,34). 4T1 cells subjected to ranges of verapamil concentrations up to 5 µM appeared to grow similarly to controls, indicating that even high concentrations of verapamil had no apparent cytotoxic effect (
Supplemental Figure 4). Concentrations of 0.5–5 µM verapamil promoted similar sensitization to vinorelbine as that observed for AU1 (
Figure 8A).
Temporal response studies of these drug combination also show similar growth suppression for AU1 and either 2.5 or 5 µM of verapamil; in both cases, recovery of proliferative capacity was observed around day 16 (
Figure 8B). Extended time-based viability profiles exploring different treatment regimens of AU1 or verapamil with vinorelbine, shown in
Figure 8C, demonstrated that when removing AU1/verapamil on day 4, a similar growth suppression and return of proliferative capacity resulted as compared to the continued treatment. Taken together, these data in
Figure 8B and 8C suggest that combination treatments of vinorelbine with AU1 or verapamil may be acting through similar mechanisms.
In a clonogenic survival assay, shown in
Figure 8D, verapamil alone had no effect on colony growth, consistent with the data presented in
Supplementary Figure 4, whereas administration of 50 nM vinorelbine yielded a modest reduction in the number of colonies. However, the combination treatments of either AU1 or verapamil with vinorelbine resulted in complete suppression of colony growth. Annexin V/PI flow cytometry revealed that apoptosis was a primary mechanism of cell death (
Figure 8E) for the combination of vinorelbine and verapamil.
To further support the premise that the AU1 was acting similarly to verapamil, 4T1 cells were treated with nontoxic concentrations of both verapamil and AU1 (
Figure 9A) along with vinorelbine (
Figure 9B). The AU1 and verapamil combination treatments with vinorelbine were no more effective in suppressing cell growth than either AU1 or verapamil with vinorelbine. These data are consistent with verapamil and AU1 acting thorough a similar mechanism to sensitize cells p-gp expressing cells to vinorelbine.
3.4. Molecular Docking of AU1 Binding to MDRP
Finally, to further establish interaction of AU1 with the multidrug resistance pump, we performed a computational study of AU1 with the multi drug resistance pump (MDRP) target protein. The GOLD (42) molecular docking suite was used to perform the interaction study; the results indicate that the computational affinity and specificity of AU1 for MDRP is high and a number of key amino acid interactions can be identified.
The top ranked structure of AU1 bound to the CryoEM structure of MDRP, with a GOLD score of 83.57, was subjected to an interaction analysis. Figure 10 shows the summary of all interactions: AU1 identified 10 amino acid residues within the protein’s binding pocket having contributions to bonded and non-bonded interactions. AU1 makes strong direct hydrogen bond interactions with the amino acid residues GLN990 and TRP232 (shown in magenta sticks in Figure 10B and green color in Figure 10D), and also interacts with many hydrophobic residues through non-bonded interactions in the binding pocket taking a semi-L to semi-U shape compared to the more globular bound vincristine (Supplemental Figure 5) (45). Interestingly, AU1 identified four similar residues to those seen with vincristine in the CryoEM structure, namely PHE343, GLN347, MET949 and GLN990. In both, GLN990 makes a direct hydrogen bond, while the other residues contribute through non-bonded interactions (Figure 10D). AU1 identified an additional amino acid residue, TRP232, with a stabilizing hydrogen bond that could potentially increase the affinity of AU1 to MDRP, increasing inhibition. In comparing the AU1 RMSDs of the top three ranked poses, the deviation values ranged between 0.10 Å and 0.22 Å, which further confirms that the interaction is more specific.
This proposed high affinity and specificity binding of AU1 in the active region of MDRP could potentially lead to observable inhibition activity and our results are in agreement with the earlier published structural studies (43,50).
4. Discussion
Due to its aggressive, metastatic nature and the lack of targetable receptors, TNBC remains the most lethal breast cancer subtype and poses a particular challenge for treatment options. Cytotoxic chemotherapy remains the standard of care for TNBC, with immunotherapy and antibody-drug conjugates taking on more prominent roles in recent years (7,9). However, drug resistance remains one of the primary reasons for chemotherapy treatment failure (31). Of all the subtypes of breast cancer, TNBC is associated with the highest expression of efflux pumps with 40% of TNBC tumors demonstrating overexpression of P-gp (36).
In the current work, we initially sought to employ AU1 as a pharmacological inhibitor of BPTF in a continued effort to determine how NURF impacts the sensitivity of breast cancer to several different chemotherapeutic agents. We showed that AU1 administration conferred sensitization of both 4T1 and E0771-LMB murine TNBC cells to chemotherapies that are employed to treat TNBC, including agents from the taxane, vinca alkaloid, and anthracycline drug classes. These findings are consistent with previous work from our laboratory where 4T1 cells were sensitized to doxorubicin (as well as other topoisomerase II poisons) through both genetic inhibition of BPTF or treatment with AU1 (51). In the current work, we further demonstrate that AU1 also functions as an efflux pump inhibitor.
The combination treatment with AU1 was highly efficacious in both 4T1 and E0771-LMB triple negative breast cancer cells. Our studies demonstrated that colony formation could be dramatically suppressed. Furthermore, in the studies with both vinorelbine and vinblastine, the growth suppression by the combination treatment with AU1 was shown to be durable, lasting until proliferative recovery began to occur around day 16. Importantly, this sustained suspension of growth occurred both with continuous AU1 treatment as well as when AU1 and chemotherapy treatment were terminated on day 4. The primary response to the combination treatment was clearly the promotion of apoptosis.
Our studies strongly support the conclusion that AU1 is sensitizing the triple negative breast cancer cells to chemotherapy via inhibition of the P-gp efflux pump. In this context, we demonstrated expression of the pump protein in the 4T1 cells and in the E0771-LMB cells, and its absence in the MDA-MB-231 cells. These findings were further supported by the calcein-AM-based multidrug resistance kit experiments, where we showed that both triple negative murine cell lines appeared to efflux calcein, a substrate of P-gp, and where administration of AU1 inhibited this efflux mechanism. In the MDA-MB-231 cells, calcein efflux remained minimal and similar between all samples, consistent with low efflux pump expression.
The sensitization of 4T1 and E0771-LMB cells to vinorelbine, vincristine, vinblastine, paclitaxel and doxorubicin was notable as these are all well-established efflux pump substrates (37). The different degrees of sensitization may be associated with the differential affinity of these agents for the pump. In contrast we observed a lack of sensitization to 5-FU and cisplatin, drugs that lack the large and lipophilic properties associated with high affinity efflux substrates (52,53). The reduced sensitivity to gemcitabine upon treatment in combination with AU1 was initially confusing; however, a previous publication also showed similar results, with five different cell lines showing reduced rather than enhanced sensitivity to gemcitabine upon treatment with verapamil, a known efflux pump inhibitor. The proposed basis for this finding suggested interplay between efflux pump activity and transient regulation in the activity of deoxycytidine kinase, which is an enzyme that contributes to the activation of gemcitabine (46). Further support of these findings is derived from the observation that AU1 does not sensitize MDA-MB-231 cells lacking the efflux pump to these agents.
We further compared the outcomes of the chemotherapy combination treatments with either AU1 or verapamil, where we were able to identify similarities between the response of 4T1 cells to the treatments. The dose-response curves yielded similar IC50 shifts and clonogenic survival showed the same impressive growth suppression. Furthermore, the time-based viability assay showed identical growth suppression and the mechanism of growth suppression was also shown to be apoptosis. By combining AU1 and verapamil with chemotherapy treatment, we established that there was no significant increase in sensitization, indicating that the mechanisms of action of the AU1 compound and verapamil were likely similar. Finally, our molecular docking studies provided clear evidence of AU1 being associated with the pump protein with a high GOLD score and an additional hydrogen bond interacting residue in the binding pocket.
Supplementary Materials
The following supporting information can be downloaded at the website of this paper posted on Preprints.org.
Funding
This work was supported by a grant from the Department of Defense Congressionally Mandated Breast Cancer Research Program (W81XWH 19-1-0490 to DAG).Services and products in support of the research project were generated by the Virginia Commonwealth University Flow Cytometry Shared Resource, supported, in part, with funding from NIH-NCI Cancer Center Support Grant P30 CA016059
References
- Brenton, J. D.; Carey, L. A.; Ahmed, A. A.; Caldas, C. Molecular Classification and Molecular Forecasting of Breast Cancer: Ready for Clinical Application? J Clin Oncol 2005, 23 (29), 7350–7360. [CrossRef]
- da Silva, J. L.; Cardoso Nunes, N. C.; Izetti, P.; de Mesquita, G. G.; de Melo, A. C. Triple Negative Breast Cancer: A Thorough Review of Biomarkers. Critical Reviews in Oncology/Hematology 2020, 145, 102855. [CrossRef]
- Orrantia-Borunda, E.; Anchondo-Nuñez, P.; Acuña-Aguilar, L. E.; Gómez-Valles, F. O.; Ramírez-Valdespino, C. A. Subtypes of Breast Cancer. In Breast Cancer; Mayrovitz, H. N., Ed.; Exon Publications: Brisbane (AU), 2022.
- Onitilo, A. A.; Engel, J. M.; Greenlee, R. T.; Mukesh, B. N. Breast Cancer Subtypes Based on ER/PR and Her2 Expression: Comparison of Clinicopathologic Features and Survival. Clin Med Res 2009, 7 (1–2), 4–13. [CrossRef]
- Li, Y.; Yang, D.; Yin, X.; Zhang, X.; Huang, J.; Wu, Y.; Wang, M.; Yi, Z.; Li, H.; Li, H.; Ren, G. Clinicopathological Characteristics and Breast Cancer–Specific Survival of Patients With Single Hormone Receptor–Positive Breast Cancer. JAMA Netw Open 2020, 3 (1), e1918160. [CrossRef]
- Alluri, P.; Newman, L. Basal-like and Triple Negative Breast Cancers: Searching For Positives Among Many Negatives. Surg Oncol Clin N Am 2014, 23 (3), 567–577. [CrossRef]
- Mandapati, A.; Lukong, K. E. Triple Negative Breast Cancer: Approved Treatment Options and Their Mechanisms of Action. J Cancer Res Clin Oncol 2023, 149 (7), 3701–3719. [CrossRef]
- Lund, M. J.; Trivers, K. F.; Porter, P. L.; Coates, R. J.; Leyland-Jones, B.; Brawley, O. W.; Flagg, E. W.; O’Regan, R. M.; Gabram, S. G. A.; Eley, J. W. Race and Triple Negative Threats to Breast Cancer Survival: A Population-Based Study in Atlanta, GA. Breast Cancer Res Treat 2009, 113 (2), 357–370. [CrossRef]
- K Patel, K.; Hassan, D.; Nair, S.; Tejovath, S.; Kahlon, S. S.; Peddemul, A.; Sikandar, R.; Mostafa, J. A. Role of Immunotherapy in the Treatment of Triple-Negative Breast Cancer: A Literature Review. Cureus 14 (11), e31729. [CrossRef]
- Jones, P. A.; Baylin, S. B. The Fundamental Role of Epigenetic Events in Cancer. Nat Rev Genet 2002, 3 (6), 415–428. [CrossRef]
- Jones, P. A.; Baylin, S. B. The Epigenomics of Cancer. Cell 2007, 128 (4), 683–692. [CrossRef]
- Sharma, S.; Kelly, T. K.; Jones, P. A. Epigenetics in Cancer. Carcinogenesis 2010, 31 (1), 27–36. [CrossRef]
- Kim, K.; Punj, V.; Choi, J.; Heo, K.; Kim, J.-M.; Laird, P. W.; An, W. Gene Dysregulation by Histone Variant H2A.Z in Bladder Cancer. Epigenetics & Chromatin 2013, 6 (1), 34. [CrossRef]
- Jones, P. A.; Issa, J.-P. J.; Baylin, S. Targeting the Cancer Epigenome for Therapy. Nat Rev Genet 2016, 17 (10), 630–641. [CrossRef]
- Bianchini, G.; De Angelis, C.; Licata, L.; Gianni, L. Treatment Landscape of Triple-Negative Breast Cancer — Expanded Options, Evolving Needs. Nat Rev Clin Oncol 2022, 19 (2), 91–113. [CrossRef]
- Kadoch, C.; Crabtree, G. R. Mammalian SWI/SNF Chromatin Remodeling Complexes and Cancer: Mechanistic Insights Gained from Human Genomics. Science Advances 2015, 1 (5), e1500447. [CrossRef]
- Sadakierska-Chudy, A.; Filip, M. A Comprehensive View of the Epigenetic Landscape. Part II: Histone Post-Translational Modification, Nucleosome Level, and Chromatin Regulation by ncRNAs. Neurotox Res 2015, 27 (2), 172–197. [CrossRef]
- Cheng, Y.; He, C.; Wang, M.; Ma, X.; Mo, F.; Yang, S.; Han, J.; Wei, X. Targeting Epigenetic Regulators for Cancer Therapy: Mechanisms and Advances in Clinical Trials. Sig Transduct Target Ther 2019, 4 (1), 1–39. [CrossRef]
- Kaur, J.; Daoud, A.; Eblen, S. T. Targeting Chromatin Remodeling for Cancer Therapy. Curr Mol Pharmacol 2019, 12 (3), 215–229. [CrossRef]
- Alkhatib, S. G.; Landry, J. W. The Nucleosome Remodeling Factor. FEBS Lett 2011, 585 (20), 3197–3207. [CrossRef]
- Zahid, H.; Olson, N. M.; Pomerantz, W. C. K. Opportunity Knocks for Uncovering New Function of an Understudied Nucleosome Remodeling Complex Member, the Bromodomain PHD Finger Transcription Factor, BPTF. Curr Opin Chem Biol 2021, 63, 57–67. [CrossRef]
- Bezrookove, V.; Khan, I. A.; Nosrati, M.; Miller, J. R.; McAllister, S.; Dar, A. A.; Kashani-Sabet, M. BPTF Promotes the Progression of Distinct Subtypes of Breast Cancer and Is a Therapeutic Target. Front. Oncol. 2022, 12. [CrossRef]
- Dai, M.; Lu, J.-J.; Guo, W.; Yu, W.; Wang, Q.; Tang, R.; Tang, Z.; Xiao, Y.; Li, Z.; Sun, W.; Sun, X.; Qin, Y.; Huang, W.; Deng, W.; Wu, T. BPTF Promotes Tumor Growth and Predicts Poor Prognosis in Lung Adenocarcinomas. Oncotarget 2015, 6 (32), 33878–33892.
- Zhao, X.; Zheng, F.; Li, Y.; Hao, J.; Tang, Z.; Tian, C.; Yang, Q.; Zhu, T.; Diao, C.; Zhang, C.; Chen, M.; Hu, S.; Guo, P.; Zhang, L.; Liao, Y.; Yu, W.; Chen, M.; Zou, L.; Guo, W.; Deng, W. BPTF Promotes Hepatocellular Carcinoma Growth by Modulating hTERT Signaling and Cancer Stem Cell Traits. Redox Biology 2019, 20, 427–441. [CrossRef]
- Xiao, S.; Liu, L.; Lu, X.; Long, J.; Zhou, X.; Fang, M. The Prognostic Significance of Bromodomain PHD-Finger Transcription Factor in Colorectal Carcinoma and Association with Vimentin and E-Cadherin. J Cancer Res Clin Oncol 2015, 141 (8), 1465–1474. [CrossRef]
- Green, A. L.; DeSisto, J.; Flannery, P.; Lemma, R.; Knox, A.; Lemieux, M.; Sanford, B.; O’Rourke, R.; Ramkissoon, S.; Jones, K.; Perry, J.; Hui, X.; Moroze, E.; Balakrishnan, I.; O’Neill, A. F.; Dunn, K.; DeRyckere, D.; Danis, E.; Safadi, A.; Gilani, A.; Hubbell-Engler, B.; Nuss, Z.; Levy, J. M. M.; Serkova, N.; Venkataraman, S.; Graham, D. K.; Foreman, N.; Ligon, K.; Jones, K.; Kung, A. L.; Vibhakar, R. BPTF Regulates Growth of Adult and Pediatric High-Grade Glioma through the MYC Pathway. Oncogene 2020, 39 (11), 2305–2327. [CrossRef]
- Dar, A. A.; Nosrati, M.; Bezrookove, V.; de Semir, D.; Majid, S.; Thummala, S.; Sun, V.; Tong, S.; Leong, S. P. L.; Minor, D.; Billings, P. R.; Soroceanu, L.; Debs, R.; Miller, J. R., III; Sagebiel, R. W.; Kashani-Sabet, M. The Role of BPTF in Melanoma Progression and in Response to BRAF-Targeted Therapy. JNCI: Journal of the National Cancer Institute 2015, 107 (5), djv034. [CrossRef]
- Kirberger, S. E.; Ycas, P. D.; Johnson, J. A.; Chen, C.; Ciccone, M.; Lu, R. W. W.; Urick, A. K.; Zahid, H.; Shi, K.; Aihara, H.; McAllister, S. D.; Kashani-Sabet, M.; Shi, J.; Dickson, A.; dos Santos, C. O.; Pomerantz, W. C. K. Selectivity, Ligand Deconstruction, and Cellular Activity Analysis of a BPTF Bromodomain Inhibitor. Org Biomol Chem 2019, 17 (7), 2020–2027. [CrossRef]
- Emran, T. B.; Shahriar, A.; Mahmud, A. R.; Rahman, T.; Abir, M. H.; Siddiquee, Mohd. F.-R.; Ahmed, H.; Rahman, N.; Nainu, F.; Wahyudin, E.; Mitra, S.; Dhama, K.; Habiballah, M. M.; Haque, S.; Islam, A.; Hassan, M. M. Multidrug Resistance in Cancer: Understanding Molecular Mechanisms, Immunoprevention and Therapeutic Approaches. Front Oncol 2022, 12, 891652. [CrossRef]
- Moscow, J.; Morrow, C. S.; Cowan, K. H. General Mechanisms of Drug Resistance. In Holland-Frei Cancer Medicine. 6th edition; BC Decker, 2003.
- Nedeljković, M.; Damjanović, A. Mechanisms of Chemotherapy Resistance in Triple-Negative Breast Cancer-How We Can Rise to the Challenge. Cells 2019, 8 (9), 957. [CrossRef]
- Housman, G.; Byler, S.; Heerboth, S.; Lapinska, K.; Longacre, M.; Snyder, N.; Sarkar, S. Drug Resistance in Cancer: An Overview. Cancers 2014, 6 (3), 1769–1792. [CrossRef]
- Kinnel, B.; Singh, S. K.; Oprea-Ilies, G.; Singh, R. Targeted Therapy and Mechanisms of Drug Resistance in Breast Cancer. Cancers (Basel) 2023, 15 (4), 1320. [CrossRef]
- Mondal, U. K.; Ilies, M. A. Chapter 7 - Efflux Pumps, NHE1, Monocarboxylate Transporters, and ABC Transporter Subfamily Inhibitors. In pH-Interfering Agents as Chemosensitizers in Cancer Therapy; Supuran, C. T., Carradori, S., Eds.; Cancer Sensitizing Agents for Chemotherapy; Academic Press, 2021; Vol. 10, pp 95–120. [CrossRef]
- Abd El-Aziz, Y. S.; Spillane, A. J.; Jansson, P. J.; Sahni, S. Role of ABCB1 in Mediating Chemoresistance of Triple-Negative Breast Cancers. Biosci Rep 2021, 41 (2), BSR20204092. [CrossRef]
- Famta, P.; Shah, S.; Chatterjee, E.; Singh, H.; Dey, B.; Guru, S. K.; Singh, S. B.; Srivastava, S. Exploring New Horizons in Overcoming P-Glycoprotein-Mediated Multidrug-Resistant Breast Cancer via Nanoscale Drug Delivery Platforms. Curr Res Pharmacol Drug Discov 2021, 2, 100054. [CrossRef]
- Karthika, C.; Sureshkumar, R.; Zehravi, M.; Akter, R.; Ali, F.; Ramproshad, S.; Mondal, B.; Tagde, P.; Ahmed, Z.; Khan, F. S.; Rahman, M. H.; Cavalu, S. Multidrug Resistance of Cancer Cells and the Vital Role of P-Glycoprotein. Life 2022, 12 (6), 897. [CrossRef]
- Lai, J.-I.; Tseng, Y.-J.; Chen, M.-H.; Huang, C.-Y. F.; Chang, P. M.-H. Clinical Perspective of FDA Approved Drugs With P-Glycoprotein Inhibition Activities for Potential Cancer Therapeutics. Front Oncol 2020, 10, 561936. [CrossRef]
- Dewanjee, S.; K. Dua, T.; Bhattacharjee, N.; Das, A.; Gangopadhyay, M.; Khanra, R.; Joardar, S.; Riaz, M.; De Feo, V.; Zia-Ul-Haq, M. Natural Products as Alternative Choices for P-Glycoprotein (P-gp) Inhibition. Molecules 2017, 22 (6), 871. [CrossRef]
- Schäfer, J.; Klösgen, V. J.; Omer, E. A.; Kadioglu, O.; Mbaveng, A. T.; Kuete, V.; Hildebrandt, A.; Efferth, T. In Silico and In Vitro Identification of P-Glycoprotein Inhibitors from a Library of 375 Phytochemicals. Int J Mol Sci 2023, 24 (12), 10240. [CrossRef]
- Callaghan, R.; Luk, F.; Bebawy, M. Inhibition of the Multidrug Resistance P-Glycoprotein: Time for a Change of Strategy? Drug Metab Dispos 2014, 42 (4), 623–631. [CrossRef]
- Jones, G.; Willett, P.; Glen, R. C.; Leach, A. R.; Taylor, R. Development and Validation of a Genetic Algorithm for Flexible Docking1. Journal of Molecular Biology 1997, 267 (3), 727–748. [CrossRef]
- Nosol, K.; Romane, K.; Irobalieva, R. N.; Alam, A.; Kowal, J.; Fujita, N.; Locher, K. P. Cryo-EM Structures Reveal Distinct Mechanisms of Inhibition of the Human Multidrug Transporter ABCB1. Proceedings of the National Academy of Sciences 2020, 117 (42), 26245–26253. [CrossRef]
- Mealey, K. L.; Fidel, J. P-Glycoprotein Mediated Drug Interactions in Animals and Humans with Cancer. J Vet Intern Med 2015, 29 (1), 1–6. [CrossRef]
- Liu, F.-S. Mechanisms of Chemotherapeutic Drug Resistance in Cancer Therapy—A Quick Review. Taiwanese Journal of Obstetrics and Gynecology 2009, 48 (3), 239–244. [CrossRef]
- Bergman, A. M.; Pinedo, H. M.; Talianidis, I.; Veerman, G.; Loves, W. J. P.; van der Wilt, C. L.; Peters, G. J. Increased Sensitivity to Gemcitabine of P-Glycoprotein and Multidrug Resistance-Associated Protein-Overexpressing Human Cancer Cell Lines. Br J Cancer 2003, 88 (12), 1963–1970. [CrossRef]
- Saleh, T.; Bloukh, S.; Carpenter, V. J.; Alwohoush, E.; Bakeer, J.; Darwish, S.; Azab, B.; Gewirtz, D. A. Therapy-Induced Senescence: An “Old” Friend Becomes the Enemy. Cancers (Basel) 2020, 12 (4), 822. [CrossRef]
- Carpenter, V.; Saleh, T.; Min Lee, S.; Murray, G.; Reed, J.; Souers, A.; Faber, A. C.; Harada, H.; Gewirtz, D. A. Androgen-Deprivation Induced Senescence in Prostate Cancer Cells Is Permissive for the Development of Castration-Resistance but Susceptible to Senolytic Therapy. Biochem Pharmacol 2021, 193, 114765. [CrossRef]
- Fahie, S.; Cassagnol, M. Verapamil. In StatPearls; StatPearls Publishing: Treasure Island (FL), 2024.
- Alam, A.; Kowal, J.; Broude, E.; Roninson, I.; Locher, K. P. Structural Insight into Substrate and Inhibitor Discrimination by Human P-Glycoprotein. Science 2019, 363 (6428), 753–756. [CrossRef]
- Tyutyunyk-Massey, L.; Sun, Y.; Dao, N.; Ngo, H.; Dammalapati, M.; Vaidyanathan, A.; Singh, M.; Haqqani, S.; Haueis, J.; Finnegan, R.; Xiaoyan, D.; Kirberger, S.; Bos, P.; Bandyopadhyay, D.; Pomerantz, W.; Pommier, Y.; Gewirtz, D.; Landry, J. W. Autophagy Dependent Sensitization of Triple Negative Breast Cancer Models to Topoisomerase II Poisons by Inhibition of The Nucleosome Remodeling Factor. Mol Cancer Res 2021, 19 (8), 1338–1349. [CrossRef]
- Sissung, T. M.; Baum, C. E.; Kirkland, C. T.; Gao, R.; Gardner, E. R.; Figg, W. D. Pharmacogenetics of Membrane Transporters: An Update on Current Approaches. Mol Biotechnol 2010, 44 (2), 152–167. [CrossRef]
- Sharom, F. J. ABC Multidrug Transporters: Structure, Function and Role in Chemoresistance. Pharmacogenomics 2008, 9 (1), 105–127. [CrossRef]
Figure 1.
Dose-response for 4T1 cells treated with select chemotherapeutic agents with and without AU1 in combination. Dose-response curves of serially diluted chemotherapeutic drugs (A) vinorelbine, (B) vinblastine, (C) vincristine, (D) paclitaxel, and (E) doxorubicin, (F) 5-FU, (G) and cisplatin performed with and without 2.5 µM AU1. Corresponding IC
50 values and calculated fold-change are listed in
Table 1. Plated 4T1 cells were allowed to adhere to 96-well plates, pretreated with AU1 overnight as appropriate, and treated the following day with serially diluted chemotherapies with and without AU1 for 96 h. Cells were evaluated via the MTS viability assay. Results are means ± SEM of at least three independent experiments.
Figure 2.
Dose-response in E0771-LMB cells treated with select chemotherapeutic agents without and with AU1 in combination. Dose-response curves of serially diluted chemotherapies (A) vinorelbine, (B) vinblastine, (C) vincristine, (D) paclitaxel, and (E) doxorubicin, (F) 5-FU, (G) and cisplatin performed with and without 2.5 µM AU1. Corresponding IC
50 values and calculated fold-change are listed in
Table 1. E0771-LMB cells were allowed to adhere to 96-well plates, pretreated with AU1 overnight as appropriate, and dosed the following day with serially diluted chemotherapies with and without AU1 for 96 h. Cells were evaluated via the MTS viability assay. Results are means ± SEM of at least three independent experiments.
Figure 3.
Dose-response assessments of MDA-MB-231 cells treated with select chemotherapies without and with AU1 in combination. Dose-response curves of serially diluted chemotherapies (A) vinorelbine, (B) vinblastine, and (C) doxorubicin performed without and with 2.5 µM AU1. Corresponding IC
50 values and calculated fold-change are listed in
Table 3. MDA-MB-231 cells were allowed to adhere to 96-well plates, pretreated with AU1 overnight as appropriate, and dosed the following day with serially diluted chemotherapies with and without AU1 for 96 h. Cells were evaluated via the MTS viability assay. Results are means ± SEM of at least three independent experiments.
Figure 4.
Sensitization of 4T1 cells to various chemotherapeutic drugs by AU1. (A) Clonogenic survival assays of select chemotherapies, where colony counts were normalized to their respective controls. **** p ≤ 0.0001 by one-way ANOVA with Dunnett post-hoc. (B) Representative image of clonogenic survival assay results with vinorelbine and AU1. Plated 4T1 cells were allowed to adhere overnight, treated with chemotherapy, AU1, or the combination for 96 h. Drug treatment was then terminated and AU1 administration continued, as appropriate, until ~144 h when colonies began to converge. Plates were fixed, stained with crystal violet, and manually counted. Results are means ± SEM of at least three independent experiments.
Figure 5.
Growth curves of 4T1 cells treated with vinca alkaloids alone or in combination with AU1 (A) Vinorelbine with AU1 and (B) vinblastine with AU1 growth curves performed with trypan blue exclusion. Expanded figure, as indicated by the dashed lines, show only the combination treatment. *p ≤0.05 and **** p ≤ 0.0001 compared to controls by one-way ANOVA with Dunnet’s post-hoc. Results are means ± SEM of at least three independent experiments.
Figure 6.
Quantification of apoptosis in 4T1 cells treated with various chemotherapeutic agents alone or in combination with 2.5 µM AU1. Apoptosis was measured with FITC Annexin/PI for both vinorelbine, vinblastine, vincristine, or paclitaxel alone or in combination with 2.5 µM AU1 after 96 h of treatment. Cells treated with 50 nM staurosporine for 24 h are included as a positive control for apoptosis. *p ≤ 0.05, **p ≤ 0.01, and **** p ≤ 0.0001 compared to controls by one-way ANOVA with Tukey post-hoc. Results are means ± SEM of at least three independent experiments.
Figure 7.
Efflux pump inhibition of AU1 and P-gp expression in 4T1 and E0771-LMB cells. Histograms generated from multidrug-resistance assay kit that evaluate for efflux pump inhibition activity of AU1 based on calcein-AM retention in (A) 4T1 cells, (B) E0771-LMB cells, and (C) MDA-MB-231 cells. (D) Western blotting for P-gp efflux pump for each cell line. *p ≤ 0.05 and ns (not significant) compared to controls by unpaired student t-tests. All histograms and blots are taken as representative results from 3 biological replicates. Averaged results are means ± SEM of at least three independent experiments.
Figure 8.
Sensitization of 4T1 cells to vinorelbine by verapamil. (A) Dose-response curves of serially diluted vinorelbine with 0.5, 1, and 5 µM verapamil and 2.5 µM AU1, with corresponding IC50 values, shifts, and fold-changes. (B) Growth curves of vinorelbine with 2.5 µM AU1, or 2.5 or 5 µM verapamil. Expanded figure, as indicated by the dashed lines, shows only the combination treatments with continued AU1/verapamil administration. **** p ≤ 0.0001 compared to control by one-way ANOVA with Dunnet post-hoc. (C) Combination treatment growth curves with discontinuation of verapamil on day 4, on day 10, or continuous administration of AU1/verapamil. (D) Clonogenic survival assay of cells treated with vinorelbine and 0.5 µM or 5 µM verapamil. **p ≤ 0.01 and **** p ≤ 0.0001 compared to controls by one-way ANOVA with Dunnet post-hoc (E) Apoptosis measured with FITC Annexin/PI for vinorelbine alone or in combination with 2.5 µM or 5 µM verapamil after 96 h of treatment. and **** p ≤ 0.0001 compared to controls by one-way ANOVA with Dunnet post-hoc All results are means ± SEM of at least three independent experiments.
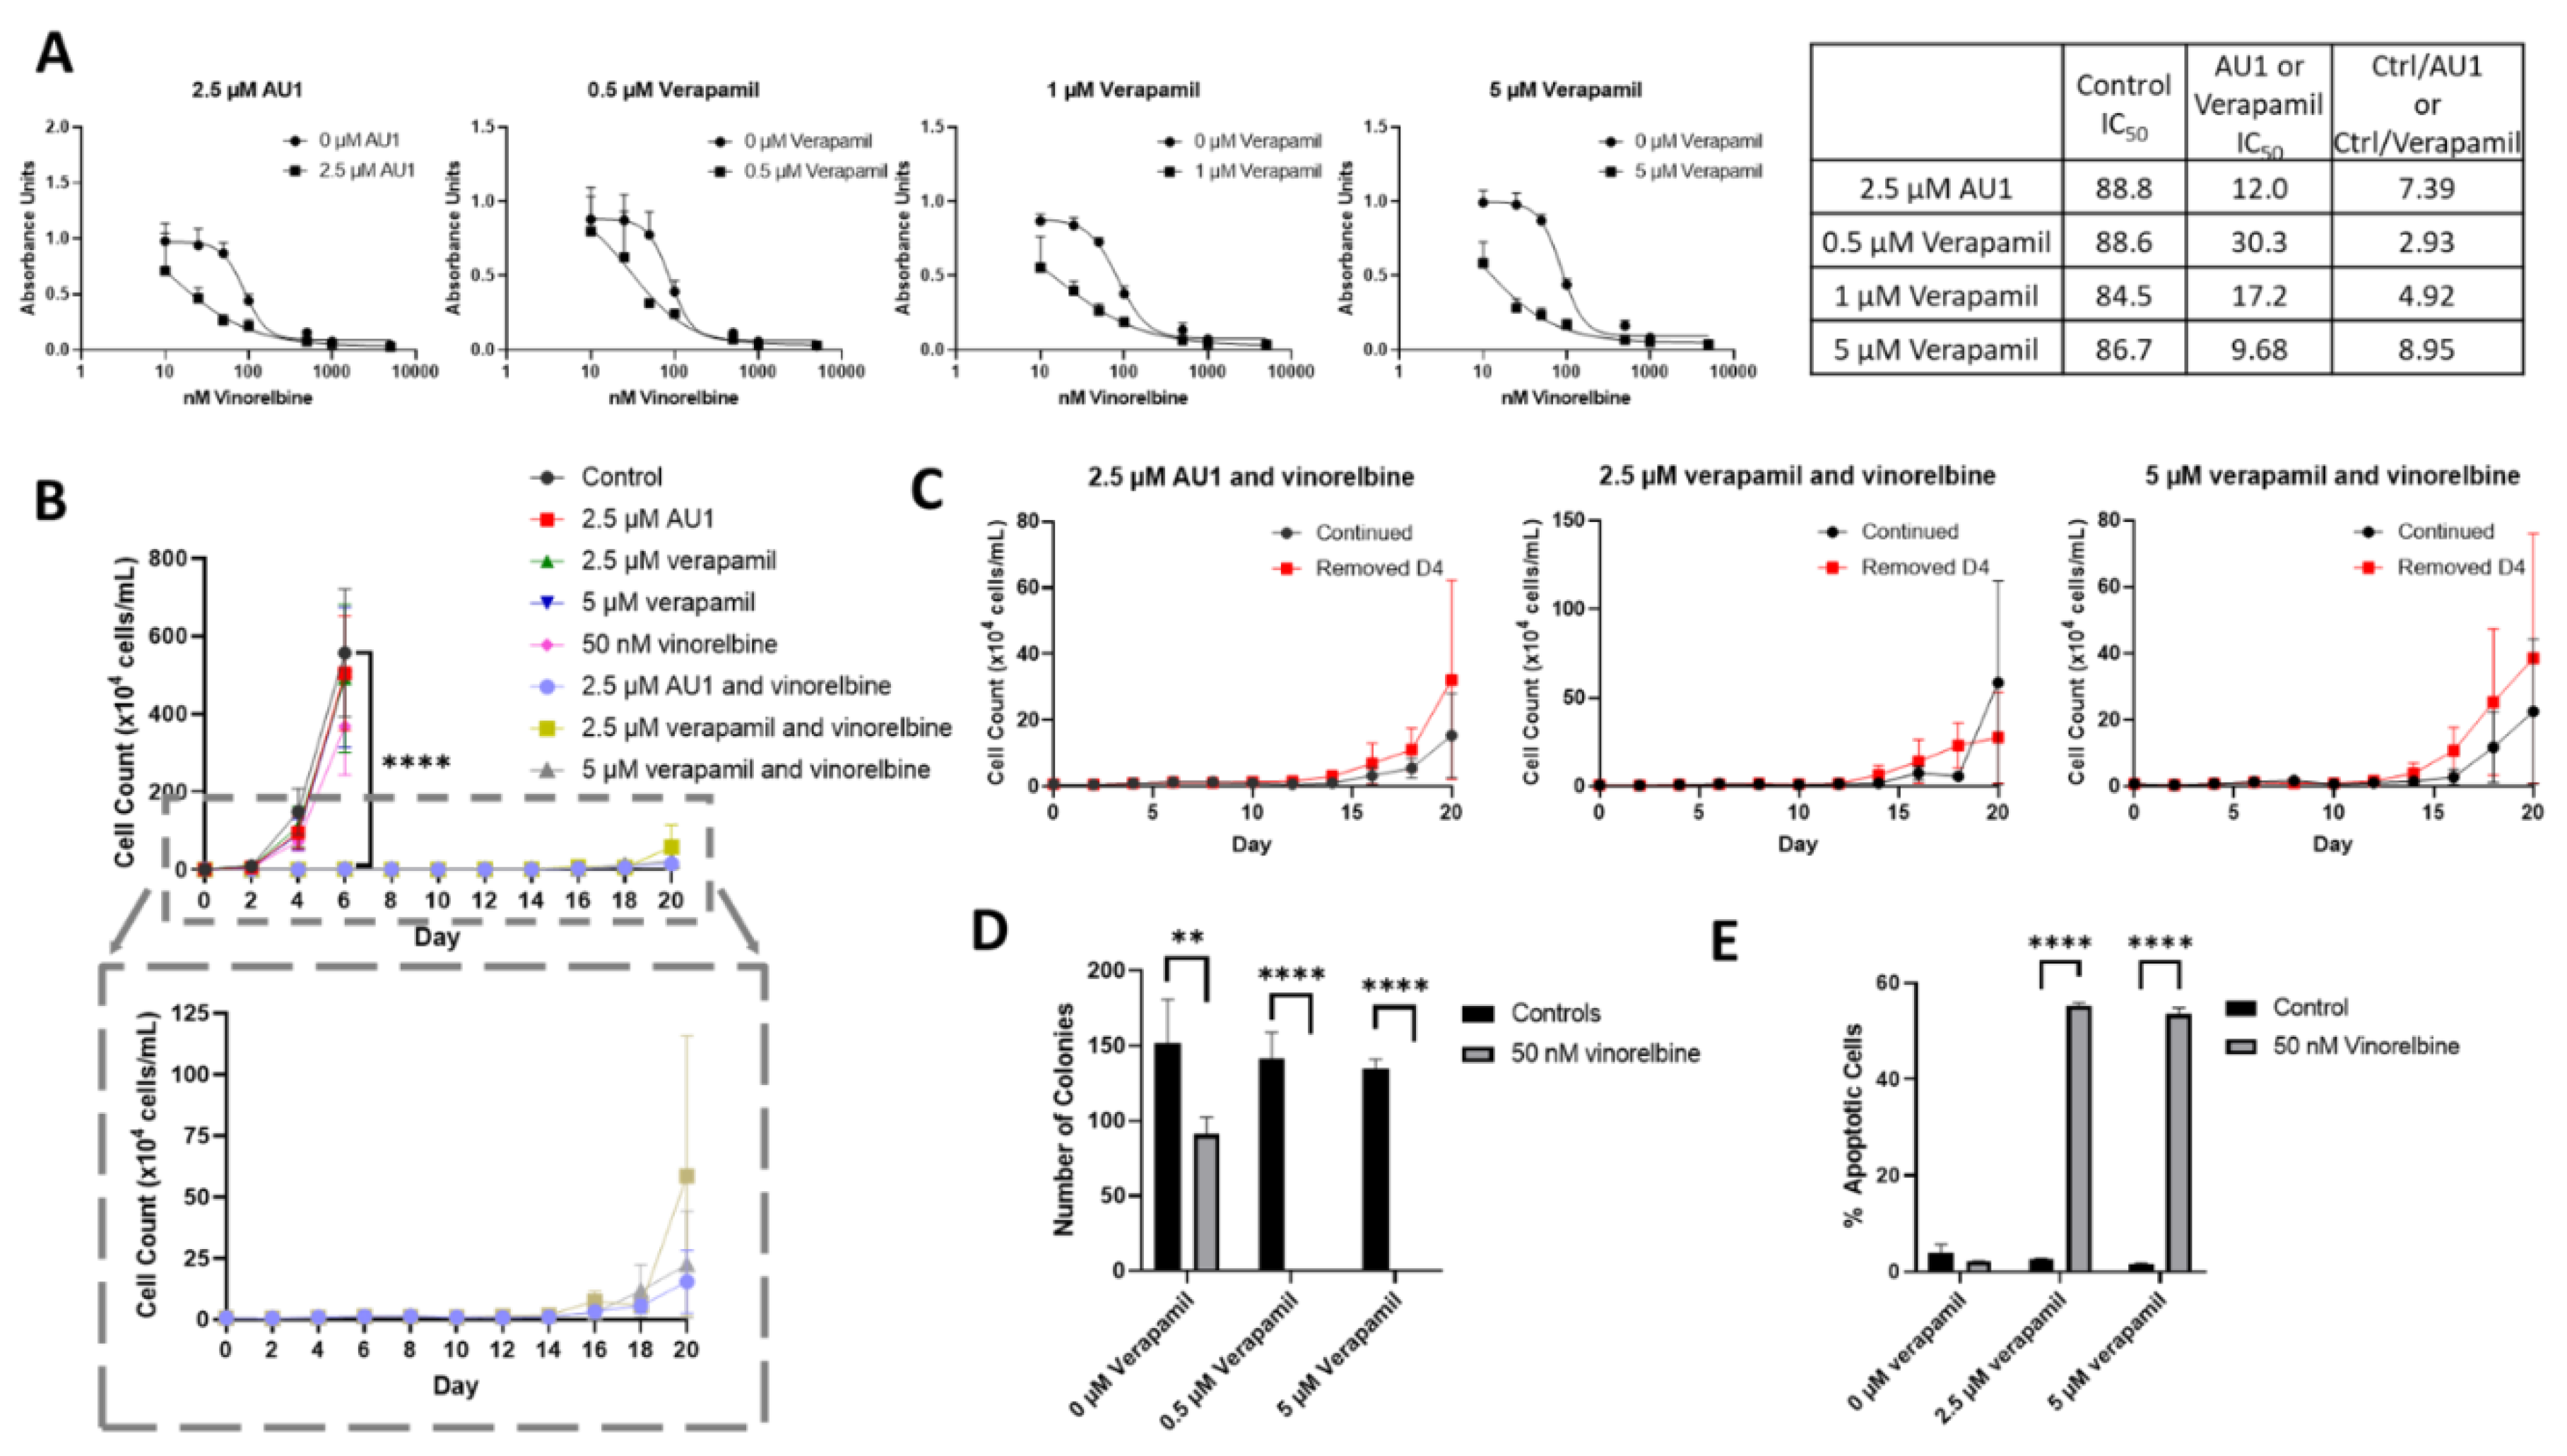
Figure 9.
Influence of the combination of AU1 and verapamil on sensitivity to vinorelbine in 4T1 cells. 4T1 cells treated with AU1, 1 or 2.5 µM verapamil, or the combinations of AU1 and verapamil simultaneously either (A) alone or (B) in combination with 50 nM vinorelbine. Cells were pretreated with AU1 and/or verapamil, or AU1 and verapamil in combinations overnight, and the following day with vinorelbine conditions for 96 h. Cell viability was evaluated via the MTS viability assay and normalized to (A) DMSO and (B) vinorelbine controls. **** p ≤ 0.0001 and ns (not significant) compared to controls by one-way ANOVA with Tukey post-hoc. Results are means ± SEM of at least three independent experiments.
Table 1.
IC
50 values from dose-response curves of 4T1 cells in
Figure 1.
Table 1.
IC
50 values from dose-response curves of 4T1 cells in
Figure 1.
Table 2.
IC
50 values from dose-response curves of E0771-LMB cells in
Figure 2.
Table 2.
IC
50 values from dose-response curves of E0771-LMB cells in
Figure 2.
Table 3.
IC
50 values from dose-response curves of MDA-MB-231 cells in
Figure 3.
Table 3.
IC
50 values from dose-response curves of MDA-MB-231 cells in
Figure 3.
|
Disclaimer/Publisher’s Note: The statements, opinions and data contained in all publications are solely those of the individual author(s) and contributor(s) and not of MDPI and/or the editor(s). MDPI and/or the editor(s) disclaim responsibility for any injury to people or property resulting from any ideas, methods, instructions or products referred to in the content. |
© 2024 by the authors. Licensee MDPI, Basel, Switzerland. This article is an open access article distributed under the terms and conditions of the Creative Commons Attribution (CC BY) license (http://creativecommons.org/licenses/by/4.0/).
