1. Introduction
The lifetimes of solar active regions (ARs) and their dependencies have been studied in several investigations. The first results were formulated in the well-known Gnevyshev-Waldmeier rule. Gnevyshev [
1] analyzed about 3000 sunspot groups from the Greenwich Photoheliographic Results (GPR) for the years 1912-1934 which emerged and disappeared on the visible solar disc between -73 and +73 degrees from the central meridian. Waldmeier [
2] formulated Gnevyshev’s results for the lifetime (LT) as
≈ W ·LT where
is given in Millionths of solar Hemisphere (MSH), the LT in days and the constant is about 10 MSH
. He also found the lifetime depends on the heliographic latitude. Petrovay and van Driel-Gesztelyi [
3] also found linear relationship between the lifetimes and the peak areas of sunspot groups by using data of the Debrecen Photoheliographic Results. They used 128 individual sunspots that emerged and died on the visible disk, and obtained the W is equal to 10.89 MSH
. Henwood et al. [
4] analyzed the long-lived sunspot groups extracted from the GPR. They found that the lifetime of sunspot groups increased by a 1.4 factor within 1940 and 1950. Javaraiah [
5] also pointed out that larger sunspot groups live longer, but reported an exponential relationship between
and LT. Namekata et al. [
6] studied starspots and sunspots and concluded that the starspots have shorter lifetime than they obtained from the empirical Gnevyshev-Waldmeier rule, however they found more or less 100 days for starspots lifetime. They also noticed that complex sunspot groups have high flare occurrences rate and short lifetime. Nagovitsyn et al. [
7] analyzed 578 recurrent sunspot groups and confirmed the Gnevyshev-Waldmeier rule in the form
=13.1·LT on an interval of 140 years. However the overwhelming majority of the studied ARs live for some days while there are several sunspot groups whose lifetime cover several solar rotations. This paper aims to study the lifetimes of these long-lived, recurrent sunspot groups and their possible relations to some circumstances.
2. Materials and Methods
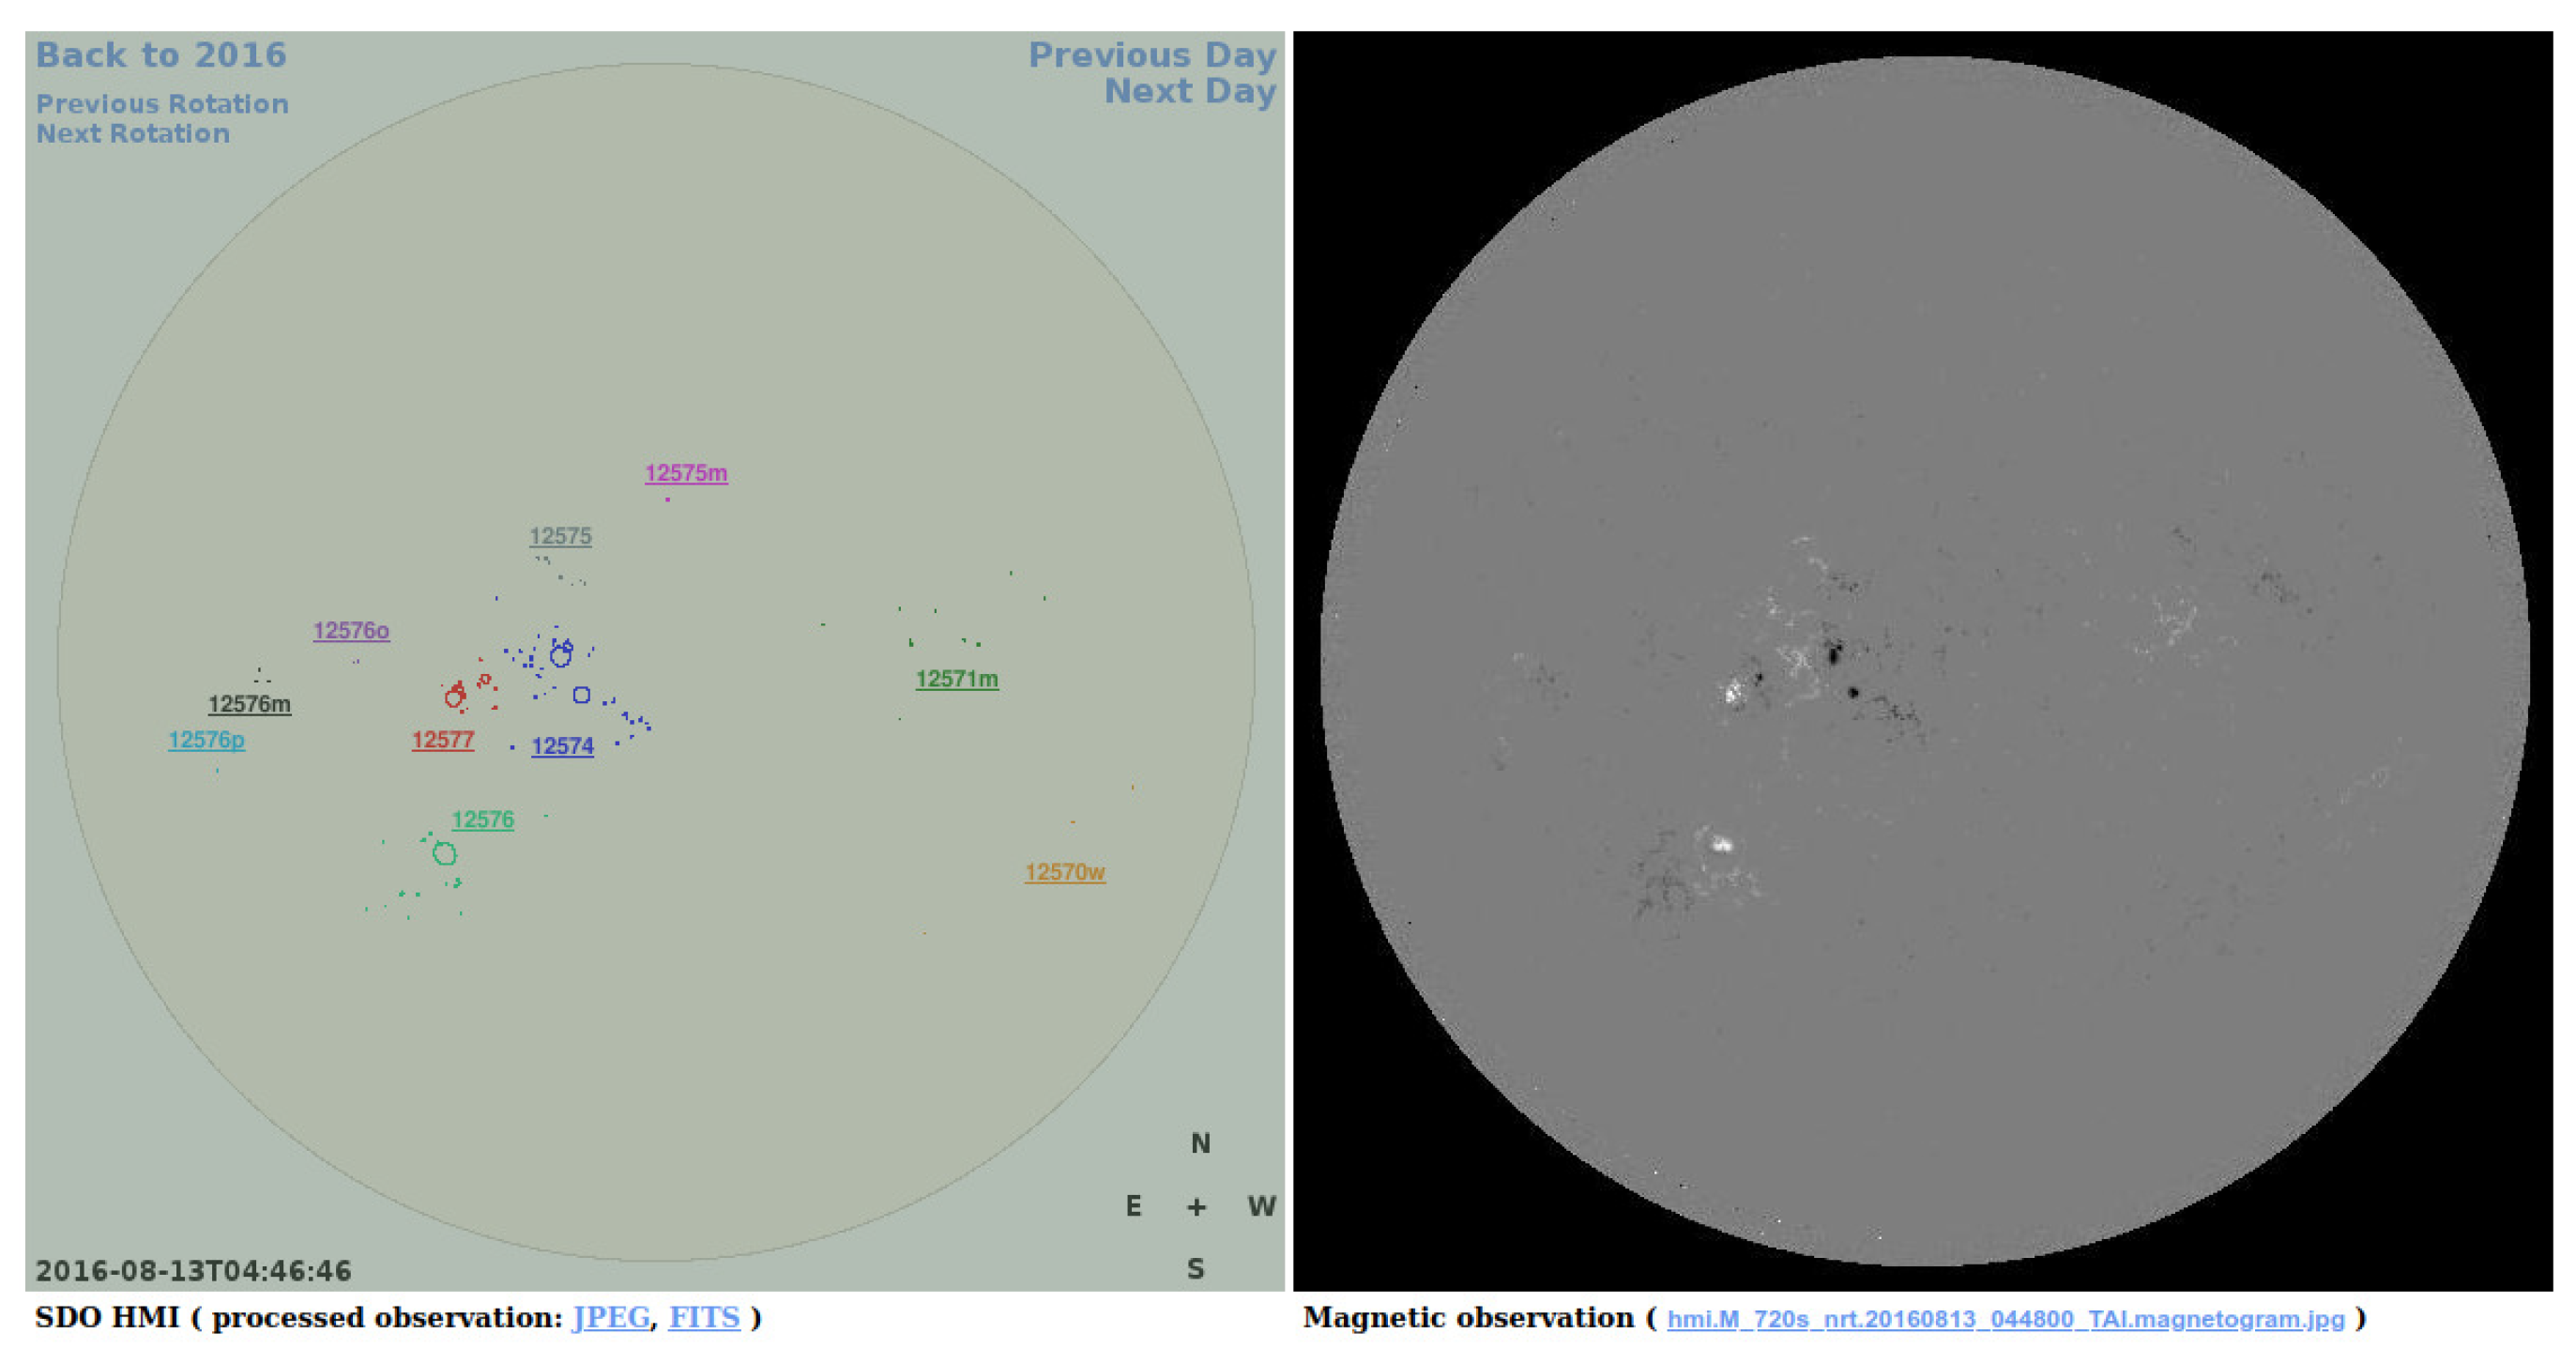
This research uses the Debrecen Photoheliographic Data (hereafter DPD), the ground based part of the set of the Debrecen sunspot databases (Baranyi et al. [
8]) covering the longest time interval among them. It contains area and position data for each observed sunspot group. Its helpful property is the user friendly HTML-presentation which facilitates the identification of the recurrent sunspot groups (see
Figure 1).
The cartoon shows all ARs observed at that time, their numbers are taken from the NOAA. The most important feature of this presentation is that it is easy to flip between the consecutive rotations with the ’previous rotation’ and ’next rotation’ buttons. In contrast to previous studies (e.g., Nagovitsyn et al. [
7], Tlatov [
9,
10]), this article does not use a huge dataset of recurrent sunspot groups identified by a computer program. This was our first step as well, however during the visual check of the algorithmically suggested candidates of recurrent groups it turned out that most of them are not the same group. Especially during maximum years of solar cycles (SCs), several areas can be observed on the Sun in which ARs can emerge at a more frequent rate than elsewhere, sometimes with overlapping lifetimes. These are the so-called active nests. I have selected recurrent sunspot groups based on the output of my computer program, then I checked them by visual inspection by using the HTML-presentation of the DPD. Altogether 29 recurrent sunspot groups have been selected. Some articles use the term of sunspot as an alternative of sunspot group, therefore it may be useful to declare that the present study focuses on sunspot groups, i.e., the cluster of sunspots, while a single spot represents an active region only as its first or last observable member in the lifetime of the active region. The development and decay of sunspot groups is described by tracking the variation of their total umbral areas since the umbrae comprise the emerged magnetic flux. The areas are corrected for foreshortening. It should be admitted, that the study of recurrent ARs may have some ambiguity because some sunspot groups may achieve their maximum phases on the far side uf the Sun. This difficulty may be overcome by using a fitted asymmetric Gaussian function used in our previous articles for active regions (Muraközy et al. [
11], Muraközy [
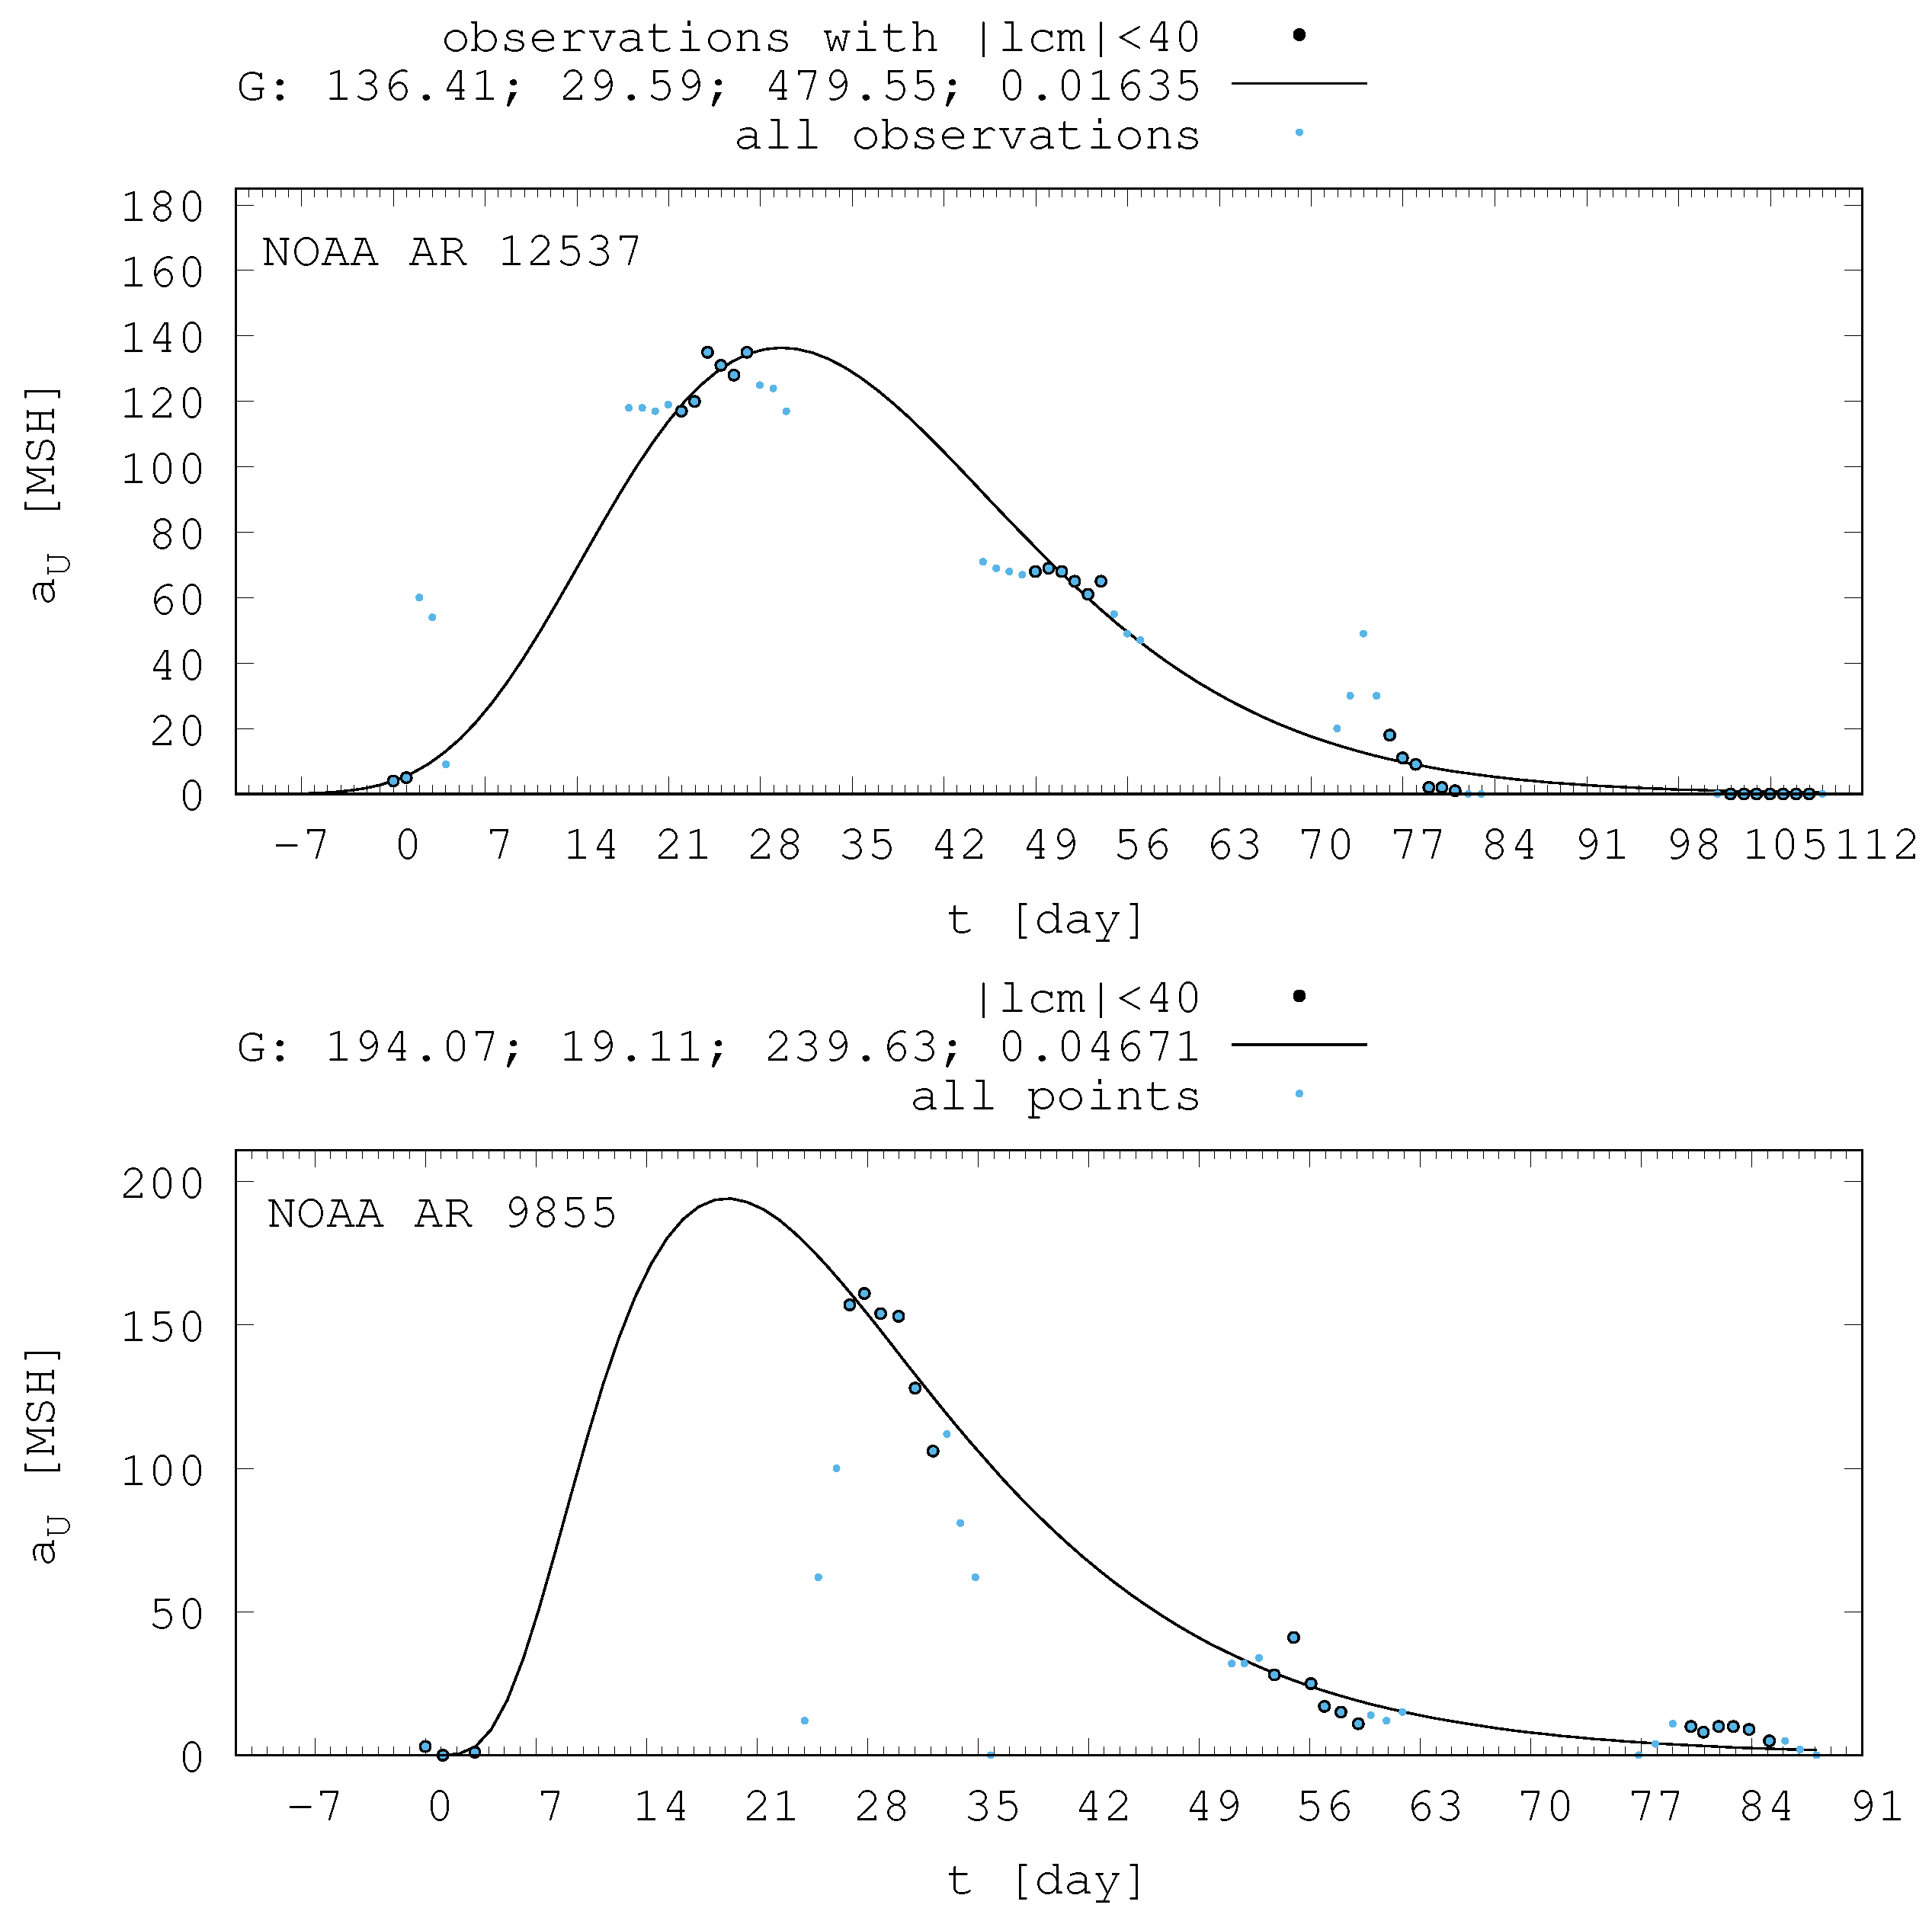
12]) whose entire lifetimes were observable on the solar disc. The total area of the sunspot group is approached
with the following function:
where
marks the maximum height of the Gaussian curve,
means the time of this maximum,
a describes the asymmetry, while
w characterized of the width parameter of the fitted curve. This function has been fitted to the considered sets of area data by least square technique. To get rid of the center-limb variation of the area remaining after the foreshortening correction the considered data were restricted to the ±40 degrees environment of the solar disc centrum. The procedure is illustrated in
Figure 2 for the NOAA AR 12537 between April 26, 2016 and August 13, 2016, and NOAA AR 9855 between March 03, 2002 and May 30, 2002. The AR was identifiable during five appearances on the solar disc. This shows that the technique applied for short-lived ARs is fairly advantageous for multiply recurrent ARs because besides the same position it also corroborates the identity of the returning AR by demonstrating that consecutive phases of its development are observed like snapshots of its life. In this case the maximum phase has been reached on the far side.
3. Results
Equation (2) has been fitted to the datasets of each selected and checked AR. In this section the obtained parameters will be used to study further properties of ARs.
3.1. Recurrent Sunspot Groups
To determine the lifetime, it is necessary to determine the times of emergence and disappearance. In the most simple case the AR emerges on the earthward side of the Sun and the observation time of its first spot is the start. If the AR emerges on the far side than the start is the time belonging to the area of 0.5 MSH according to the curve. This is why the time may be negative on the horizontal axis of
Figure 2. The method of determination of end time is the same.
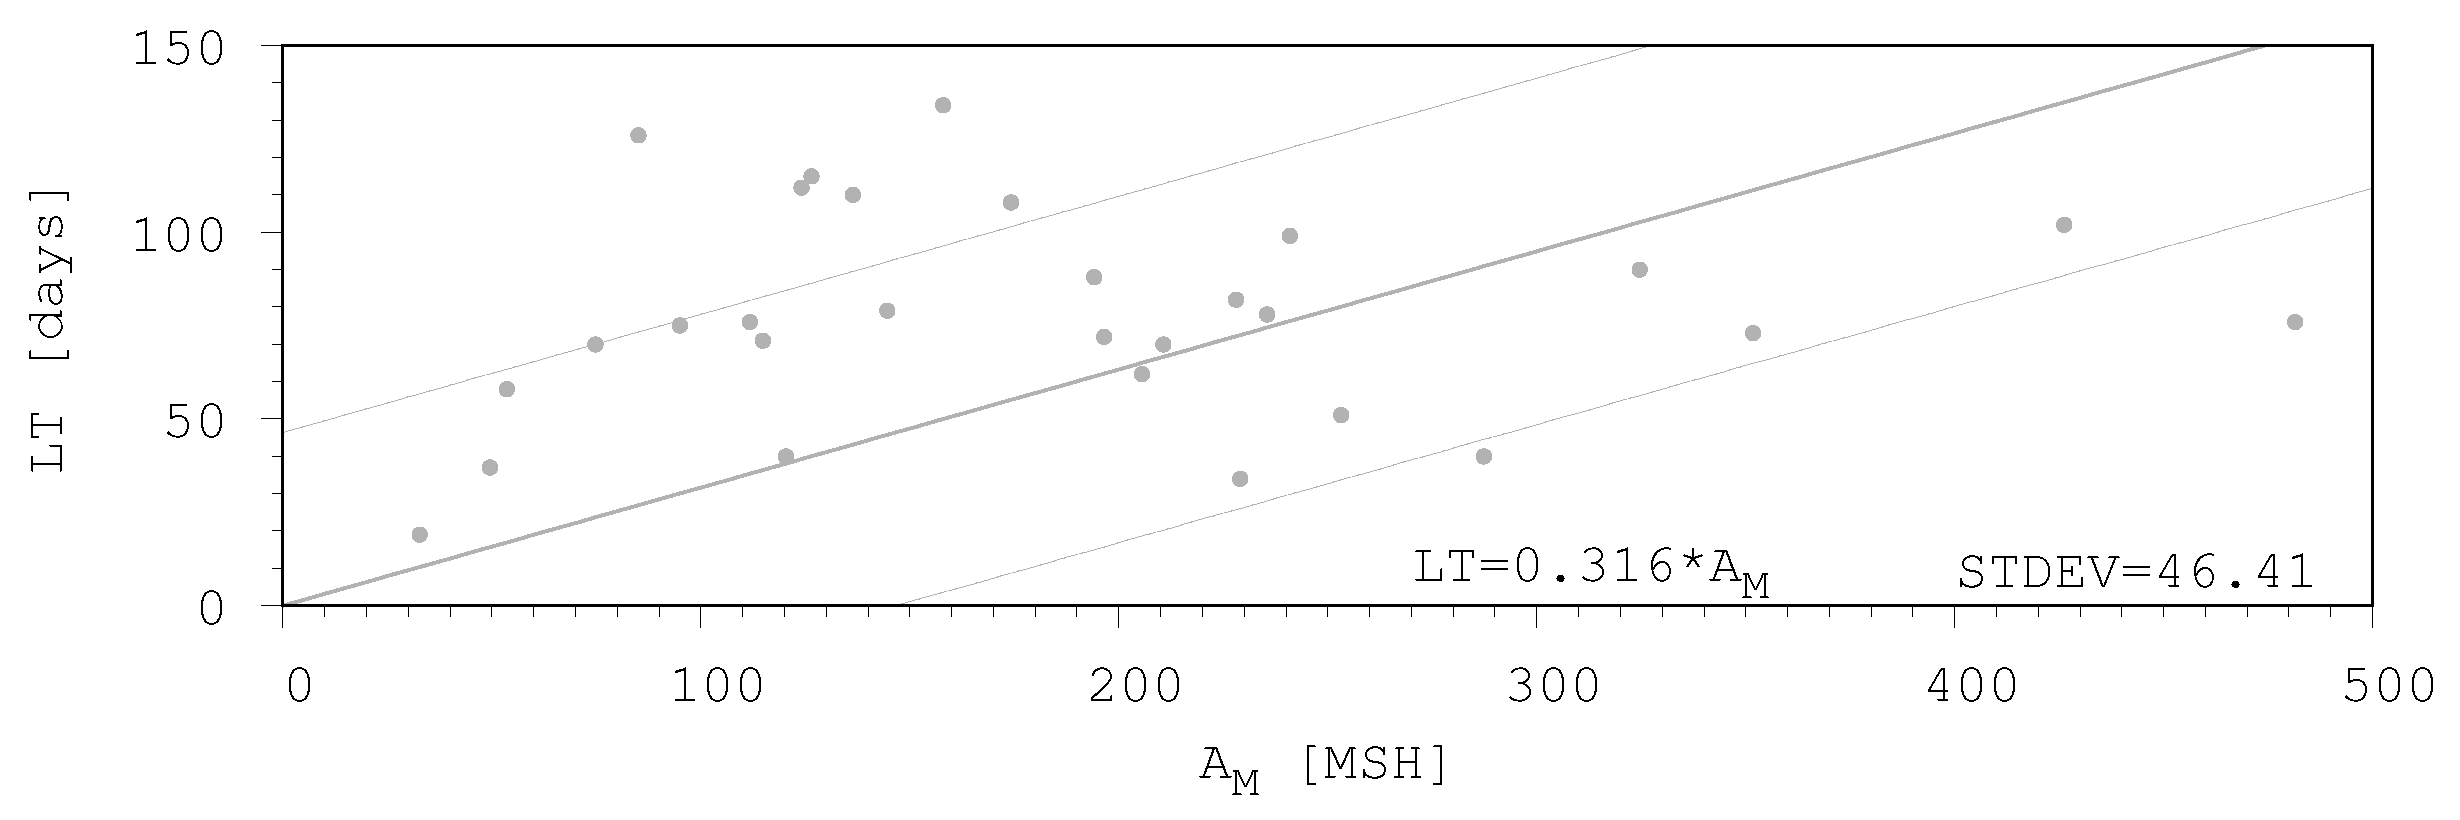
Figure 3 shows the relationship between the peak of fitted curves and the calculated lifetime of sunspot groups, where each point represents a specific sunspot group. Although this linear relationship is not obvious at first sight, but it is a reasonable condition that zero area should belong to zero lifetime, therefore zero-originated linear regression should be used. It is plotted with thick line while the thin lines mark the standard deviations. Their data are written in the bottom corner of this panel. It is conspicuous that the points can be divided into two groups. Below the peak area of around 200 MSH, all data points are above the fitted linear regression line, while those of the larger sunspot groups are below that. By considering these two groups of data separately two linear relationship can be plotted, both of them are zero originated.
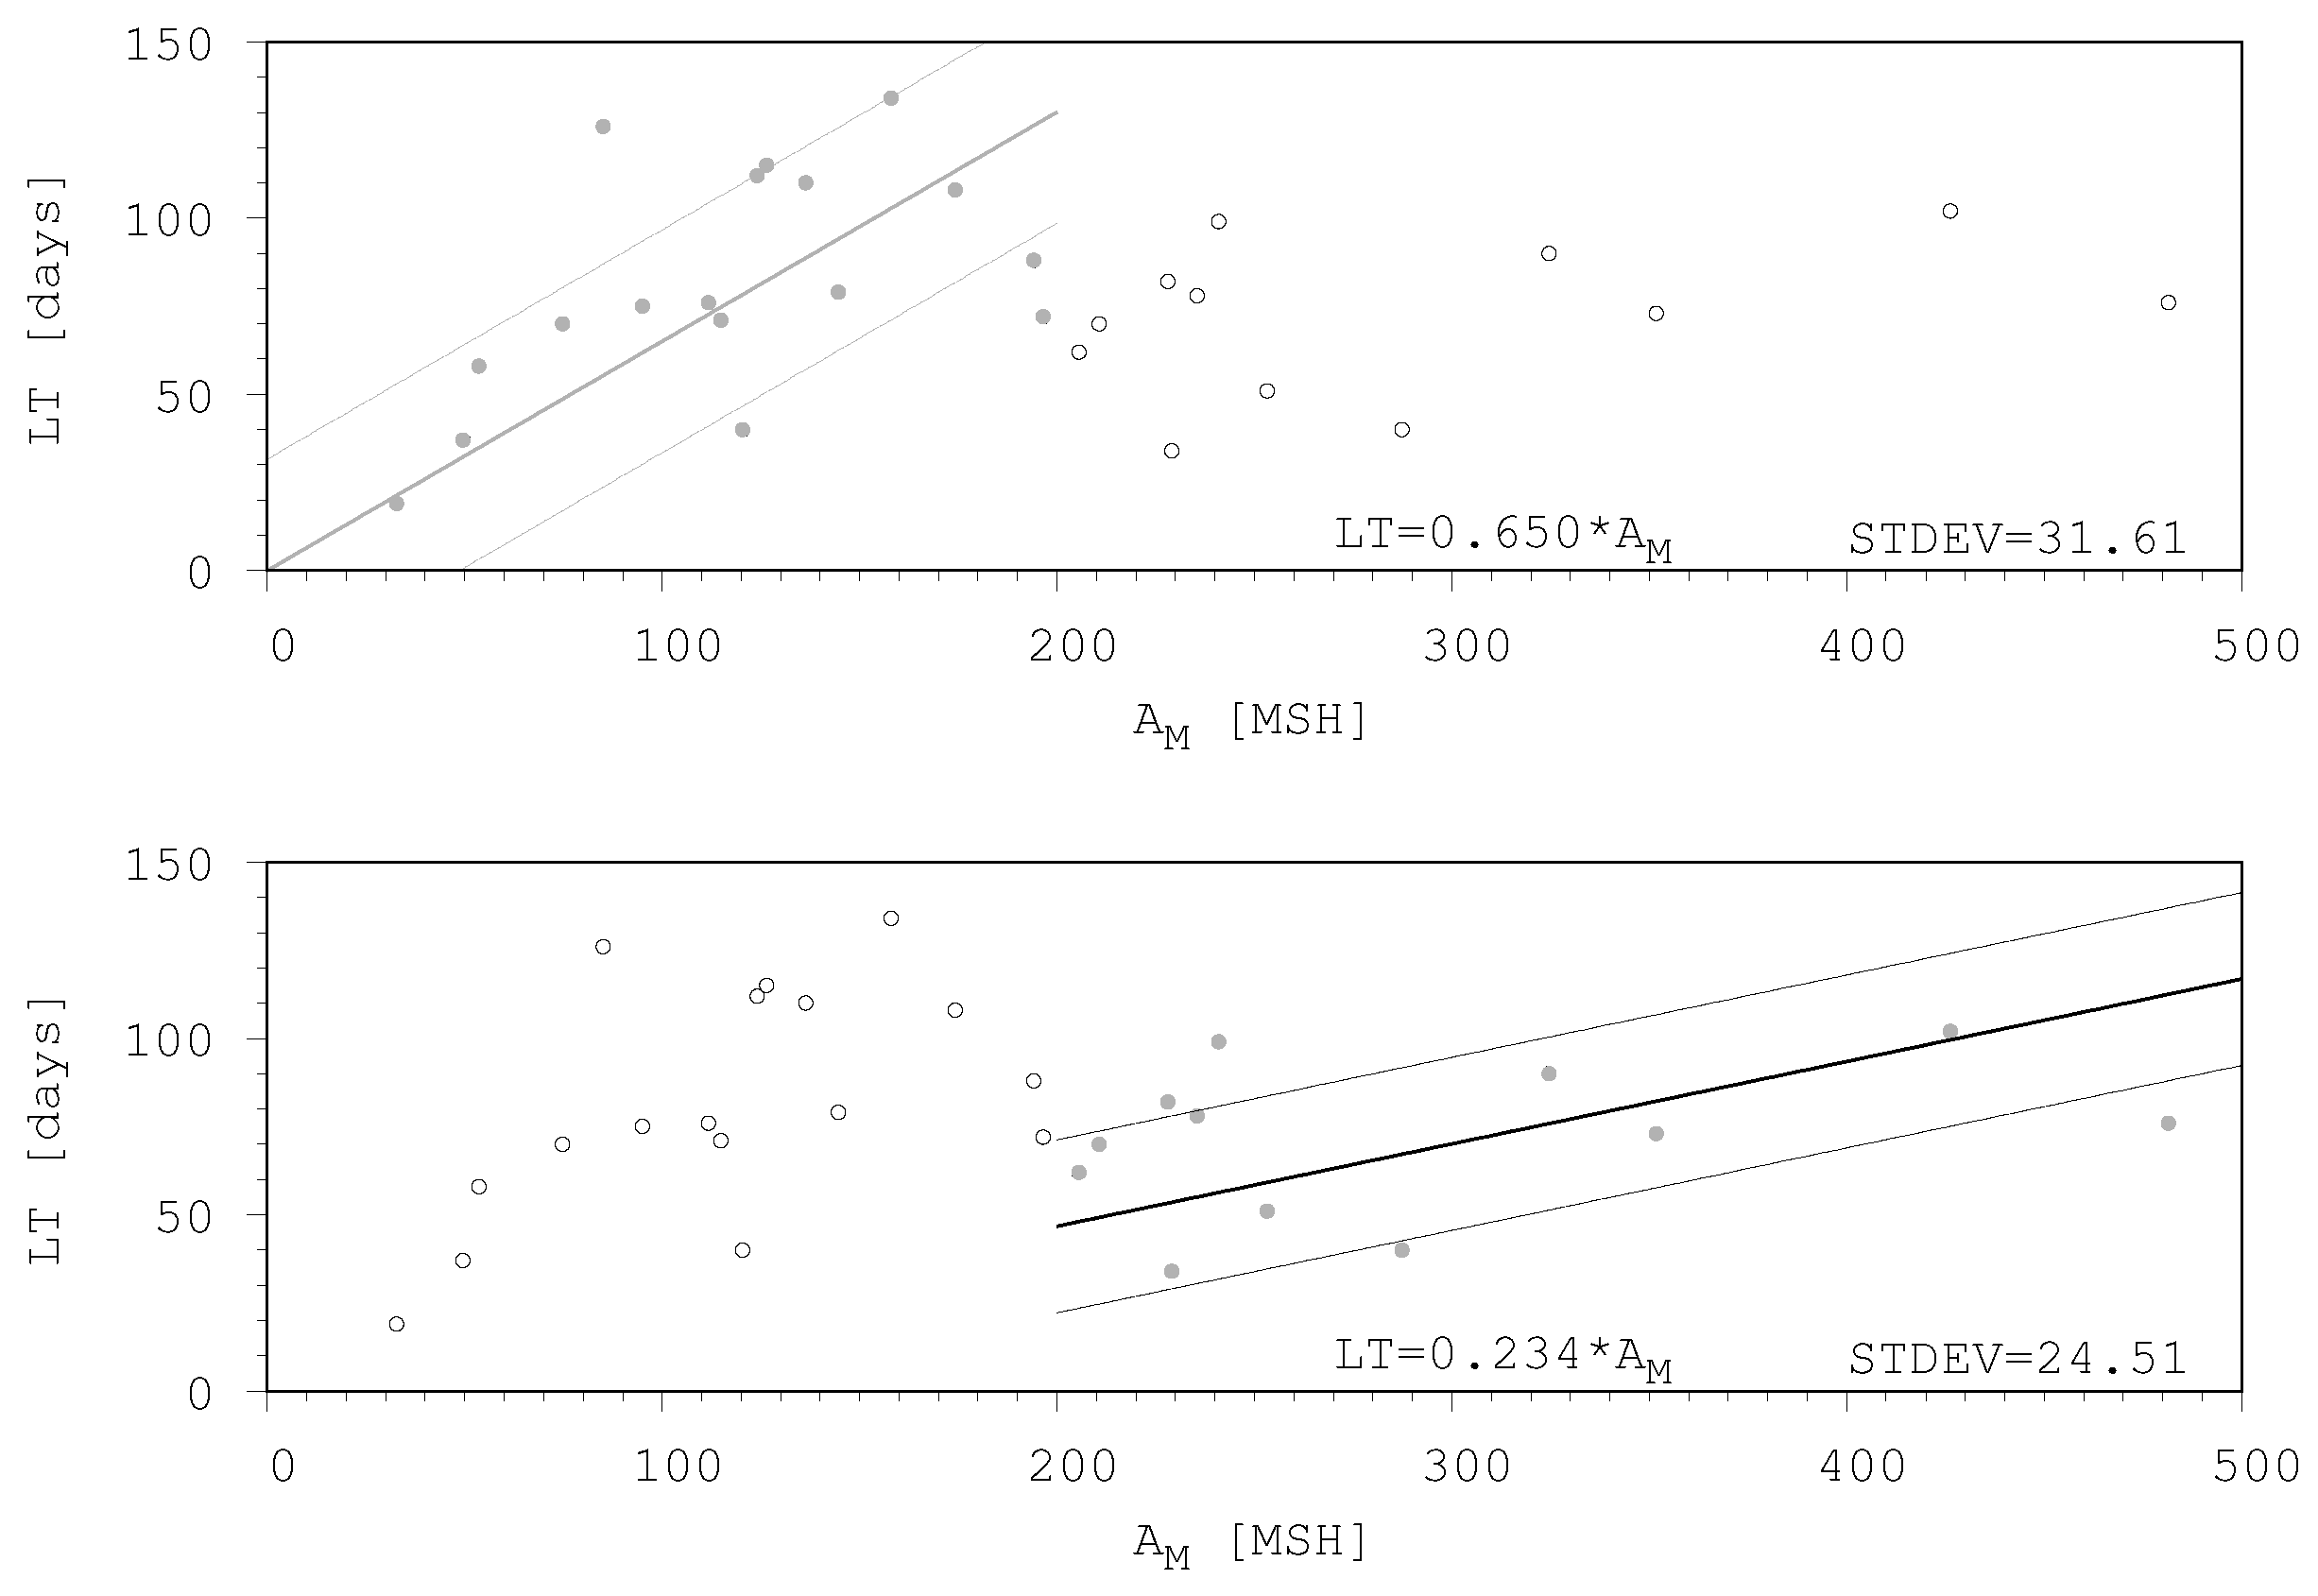
Figure 4 depicts these two linear regressions (top panel - smaller groups, bottom panel - larger groups). Although all data points are plotted in both panels, the fit is carried out only for those that are in between ±40 lcm, plotted with filled circles.
According to the diagrams the relationship between maximum area and lifetime is not as simple as the Gnevyshev-Waldmeier rule mentioned in the introduction. This and later similar results were based on short lifetimes entirely observable on the solar disc, furthermore the considered area may have been the total umbra+penumbra area, this is not always specified. However, by extending the domains of the lifetime and maximum area and by focusing on the umbral areas a more complex relationship can be obtained.
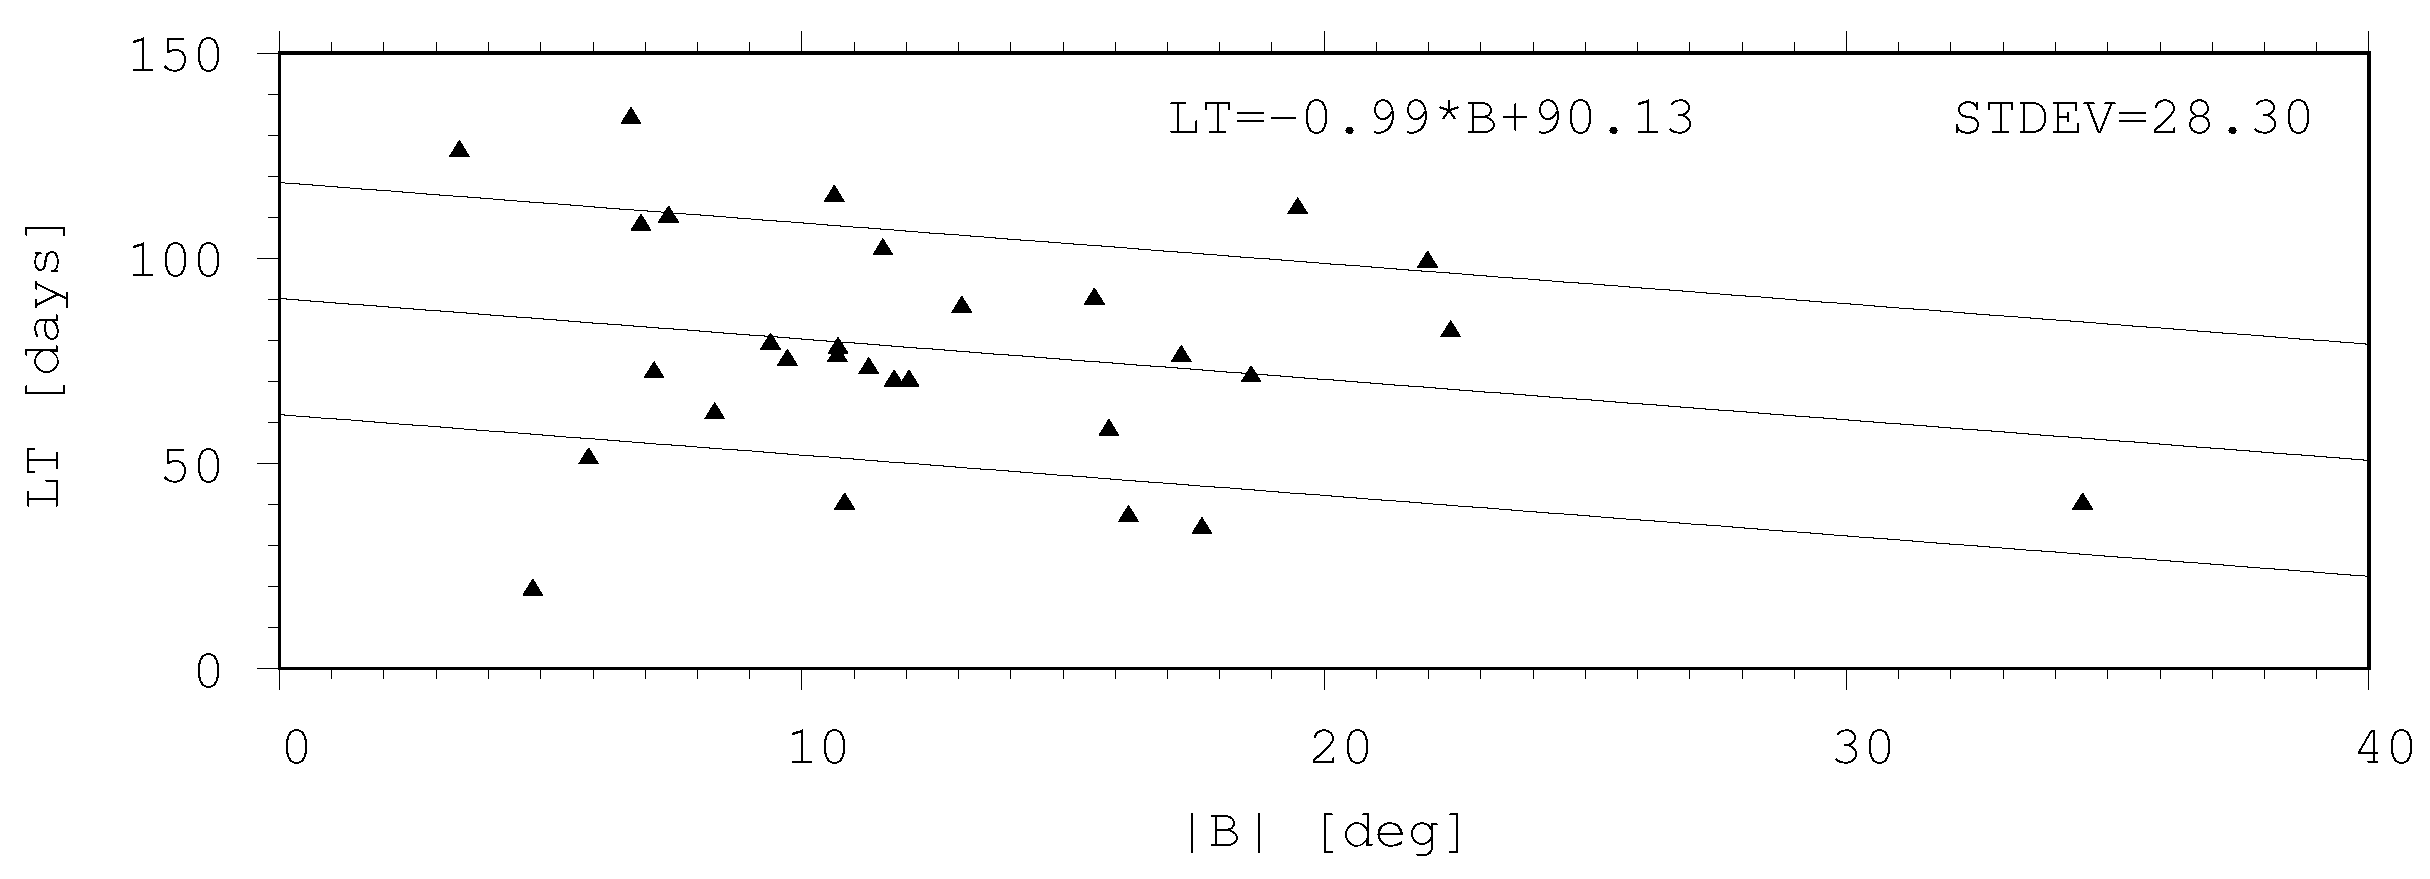
Figure 5 shows the relationship between the lifetimes of sunspot groups and heliographic latitude. A slight inverse relationship is between them, the lower the latitude the longer the lifetime.
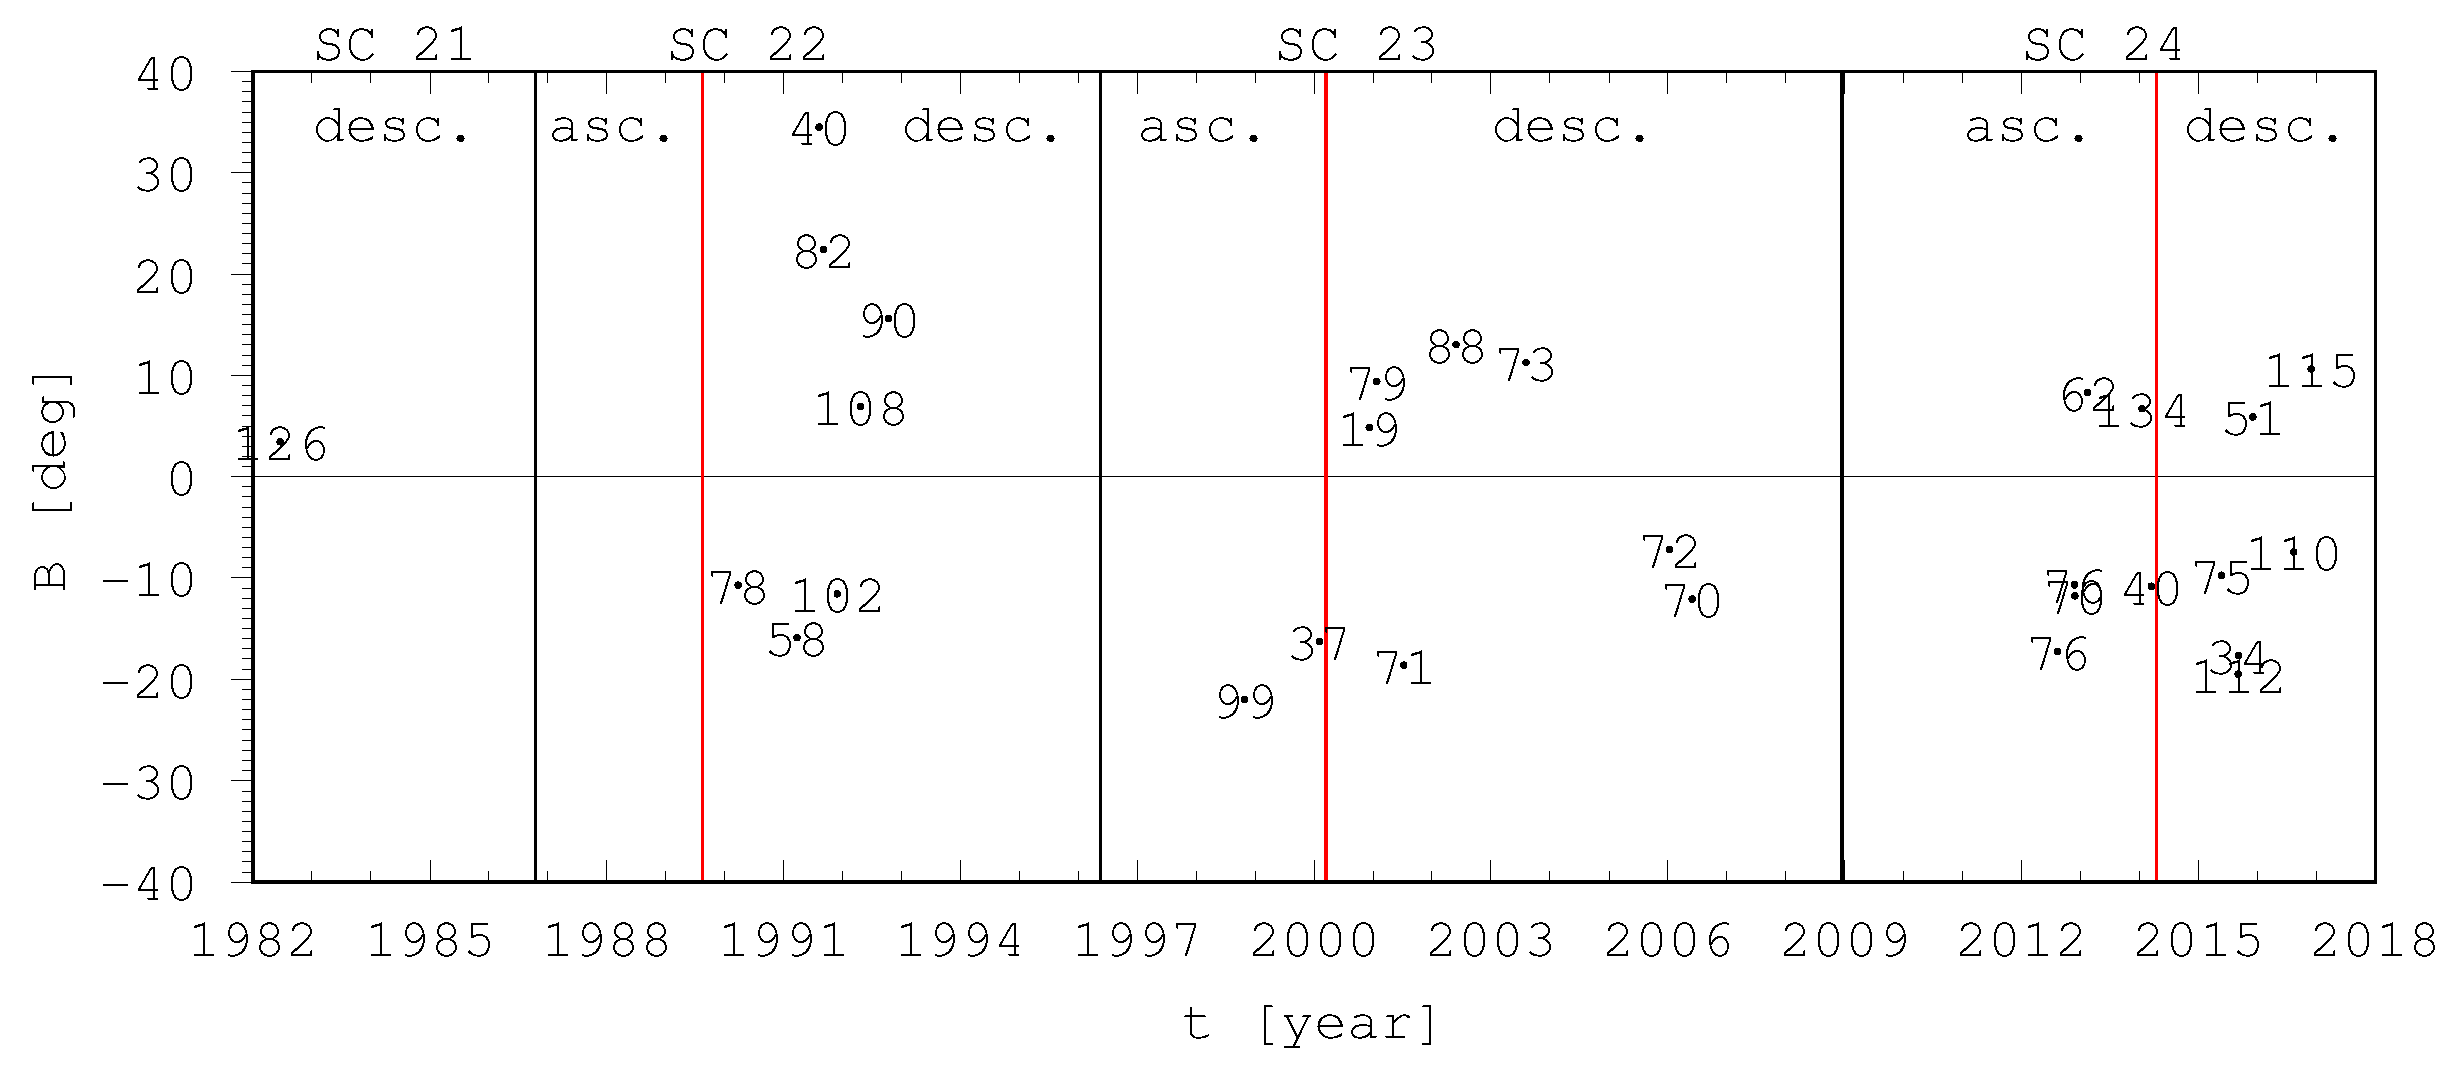
Figure 6 shows the positions of the studied recurrent groups in the time - latitude diagram of SCs 21-24. The majority of the longest living groups can be found near the solar equator in the descending phases of SCs. This figure also shows the higher the mean heliographic latitude the shorter the lifetime of the groups.
3.2. Active Nests
The longest lifetime in
Figure 3 and
Figure 4 is about 140 days corresponding to about 5 solar rotations. This can be considered to be the maximum lifetime of a specific emerged magnetic flux rope observed as an active region. The identification of the recurrent sunspot groups is difficult because one has to decide whether the AR turned in at the examined position belongs to the same magnetic flux rope ensemble turned out two weeks earlier or a new flux rope has emerged on the same position. If the latter is the case then an active nest is at the given position. The distinction between recurrent ARs and new ARs in an active nest is facilitated by the fitted asymmetric curve because the data of the new regions typically do not match to the curve in the way illustrated in
Figure 2.
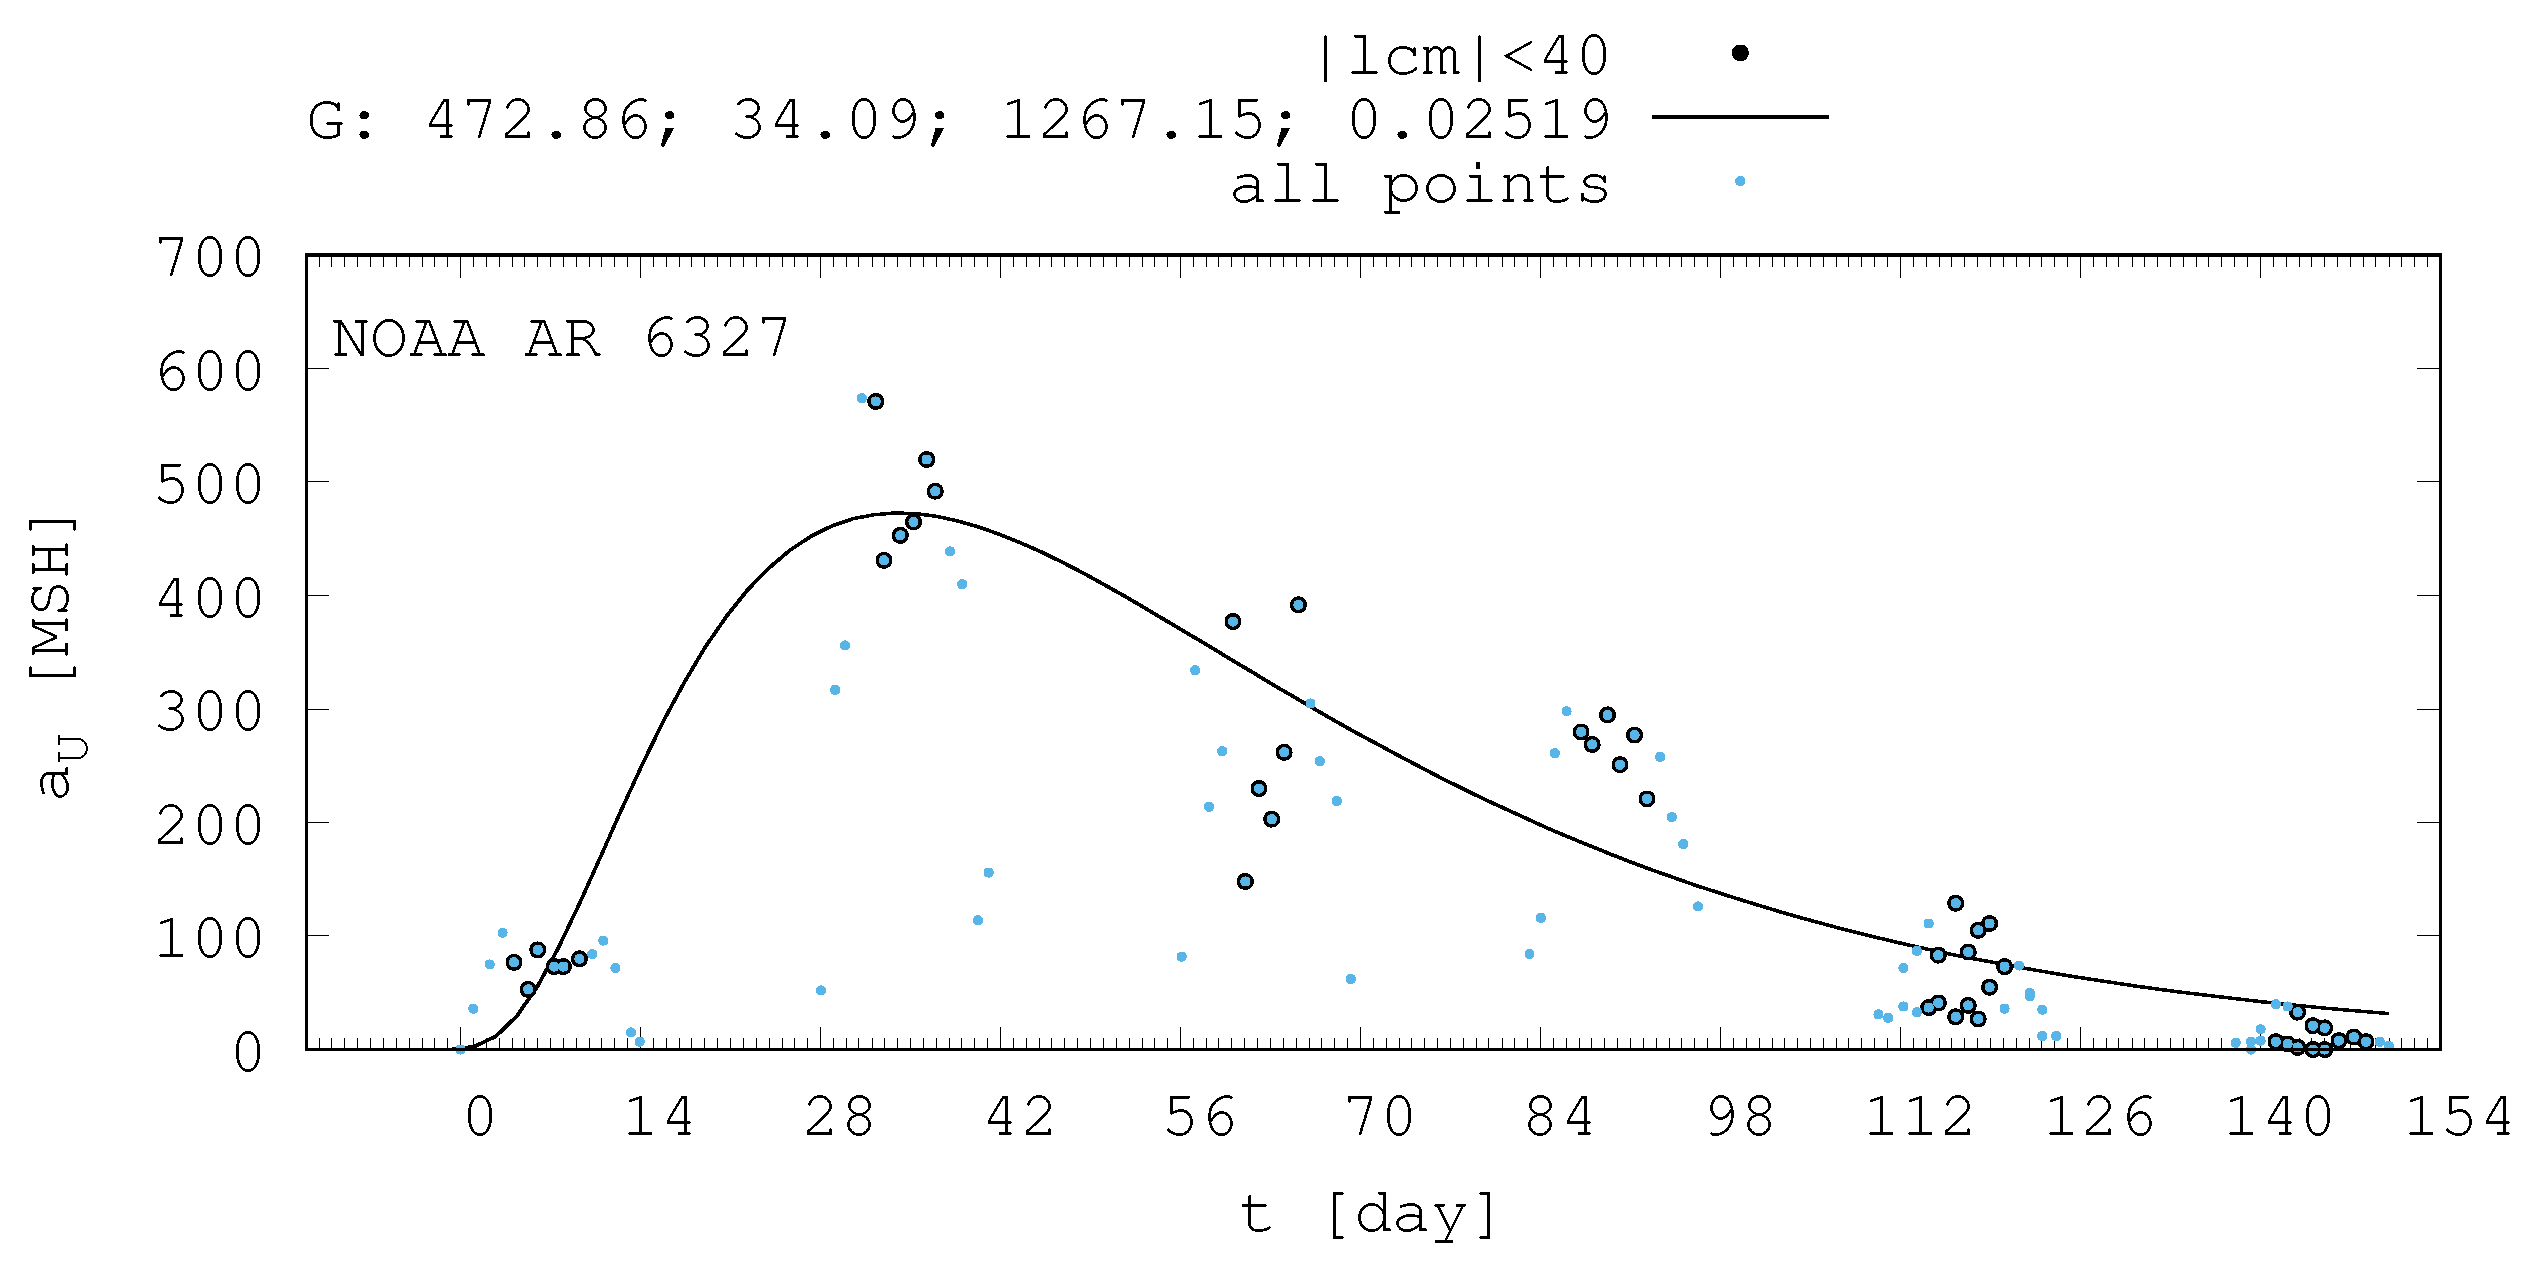
Figure 7 depicts this kind of active nest. The NOAA identified its first active region with 6327 which emerged on October 16, 1990. This active nest lasted for 6 rotations, during the last two rotations it was splitted into two groups. Another interesting active nest is plotted in
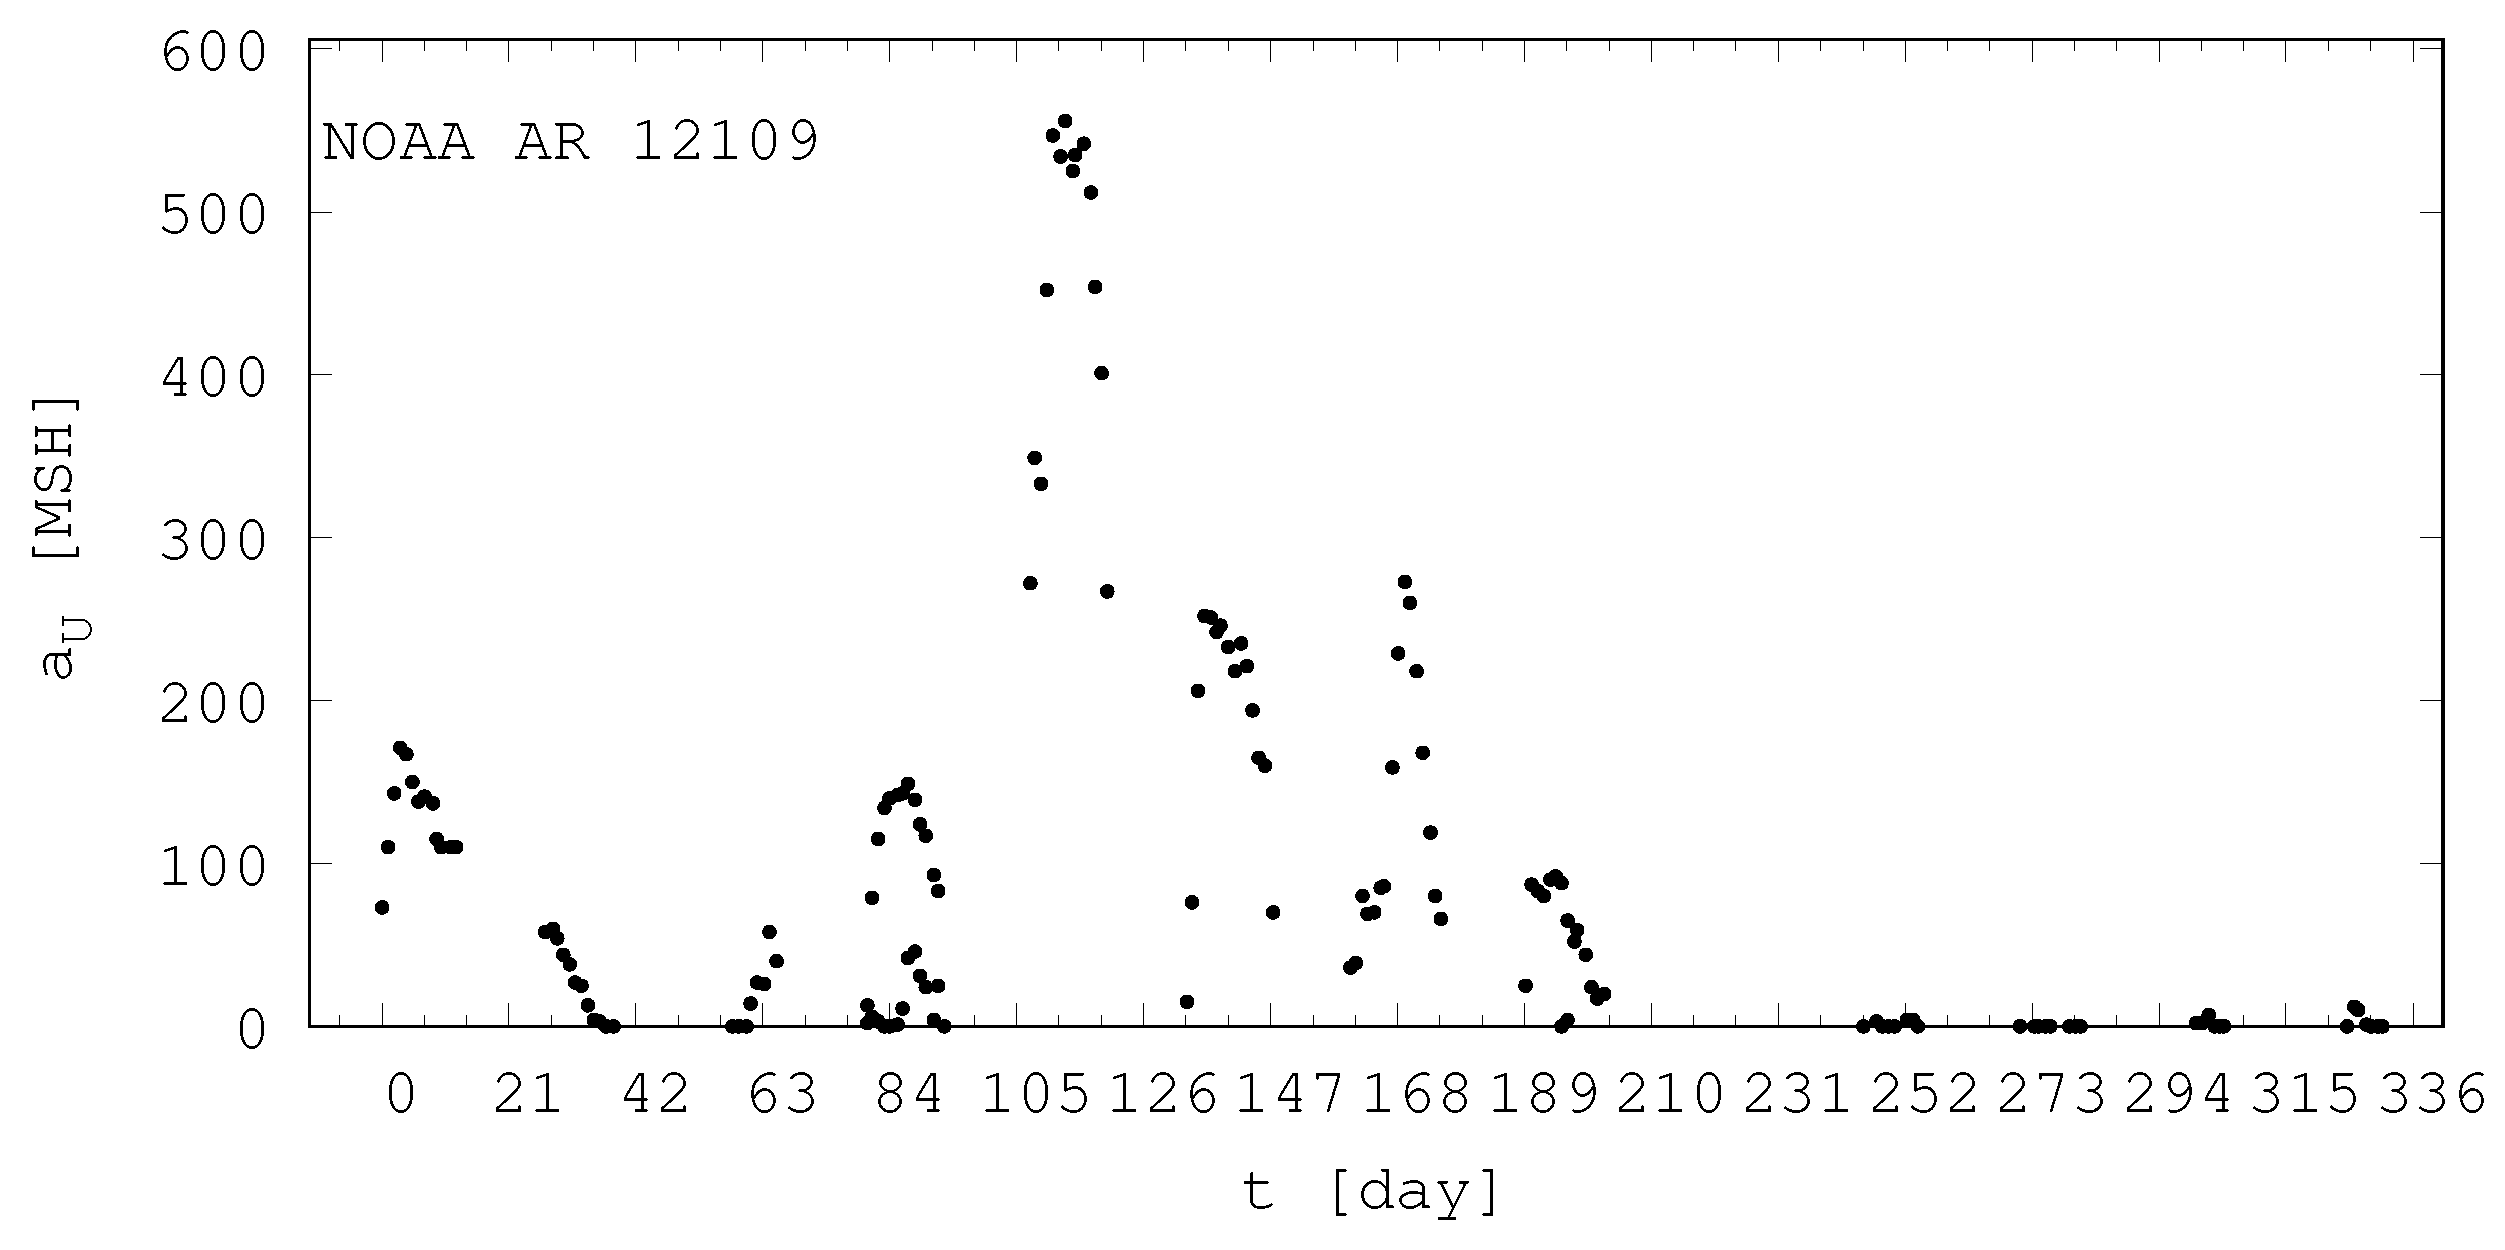
Figure 8. This started with NOAA AR 12109 and returned 12 times. Near its peak area the sunspot group, the 4th largest sunspot group in the DPD (NOAA AR 12192 with its peak umbral area of 556 MSH) produced by this active nest was extremely complex. It was unreasonable to fit the asymmetric Gaussian because the multiple emergence was obvious.
This nest became active on the far side and during the last few rotations it produced only small groups, however their magnetic fields can be tracked clearly on the magnetograms.
4. Discussion
The summary of the results is as follows.
The shape of the evolution of a long-lived recurrent sunspot group can be described by the same asymmetric Gaussian function that was suitable for the cases of short-lived active regions whose entire lifetime was observed on the visible disc (Muraközy et al. [
11], Muraközy [
12]). If the returning active region is identical with that observed in the previous rotation then its data fit surprisingly well to this curve (
Figure 2).
The lifetimes of sunspot groups depend on their peak area, the larger the sunspot group the longer its lifetime. Two groups of active region sizes can be distinguished, they are separated by the size
≈ 200 MSH than above it (
Figure 4).
The lifetimes of sunspot groups show weak dependencies on the latitude and cycle phase. The lower the latitude (near the end of the solar cycle) the longer the lifetime (
Figure 5 and
Figure 6).
While recurrent sunspot groups live for about 4 - 5 solar rotations, active nests can be tracked for a longer time, even through 12 - 13 rotations. Their distinction from a single recurrent sunspot group is facilitated by the asymmetric Gaussian because the data of the active domain in the consecutive rotations do not fit to this curve.
As was mentioned in the introduction, the earlier found relationship between the peak area and lifetime was described by the Gnevyshev-Waldmeier rule:
≈ W· LT where
W is 10 MSH/day. This result cited and corroborated by Petrovay and van Driel-Gesztelyi [
3], Nagovitsyn et al. [
7] refers to short-lived sunspot groups whose entire lifetime was observed on the visible solar disc. The present results show that its validity can not be simply extended to recurrent active regions because in the domains of very long lifetimes and very large areas the relationship is more complex as is illustrated by
Figure 4. Iglesias et al. [
13] followed a recurrent sunspot group in 1990. In my data its maximum umbral area was 78, it is a relatively small group. They reported that during its 5 rotations 162 solar flares were associated with this AR. This is an interesting example for the statement that on long time-scale the Gnevyshev-Waldmeier rule is not applicable. Javaraiah [
5]’s finding about the exponential relationship between peak area and lifetime of short-lived sunspot groups has not been corroborated on larger time interval either. However, Javaraiah [
5]’s conjecture about the deep-rooted active nests seems to be reasonable. He raised the idea that larger groups might be generated near the bottom of the convection zone and fragmented or branched into smaller groups, while rising toward the surface.
Funding
This research was funded by NKFIH (FK141895).
Institutional Review Board Statement
Not applicable.
Informed Consent Statement
Not applicable.
Data Availability Statement
Conflicts of Interest
The author declare no conflicts of interest. The funder had no role in the design of the study; in the collection, analyses, or interpretation of data; in the writing of the manuscript; or in the decision to publish the results.
Abbreviations
The following abbreviations are used in this manuscript:
| DPD |
Debrecen Photoheliographic Data |
| SC |
Solar Cycle |
| AR |
active region |
| MSH |
Millionths of Solar Hemisphere |
References
- Gnevyshev, M.N. On the nature of solar activity. Izvestiya Glavnoj Astronomicheskoj Observatorii v Pulkove 1938, 16, 36–45. [Google Scholar]
- Waldmeier, M. Ergebnisse und Probleme der Sonnenforschung.; 1955.
- Petrovay, K.; van Driel-Gesztelyi, L. Making Sense of Sunspot Decay. I. Parabolic Decay Law and Gnevyshev-Waldmeier Relation. Solar Physics 1997, 176, 249–266, [arXiv:astro-ph/astro-ph/9706029]. [Google Scholar] [CrossRef]
- Henwood, R.; Chapman, S.C.; Willis, D.M. Increasing Lifetime of Recurrent Sunspot Groups Within the Greenwich Photoheliographic Results. Solar Physics 2010, arXiv:astro-ph.SR/0907.4274262, 299–313. [Google Scholar] [CrossRef]
- Javaraiah, J. Relationship Between Magnetic Structures of Small and Large Sunspot Groups. Current Theoretical Models and Future High Resolution Solar Observations: Preparing for ATST; Pevtsov, A.A.; Uitenbroek, H., Eds., 2003, Vol. 286, Astronomical Society of the Pacific Conference Series, p. 325.
- Namekata, K.; Maehara, H.; Notsu, Y.; Toriumi, S.; Hayakawa, H.; Ikuta, K.; Notsu, S.; Honda, S.; Nogami, D.; Shibata, K. Lifetimes and Emergence/Decay Rates of Star Spots on Solar-type Stars Estimated by Kepler Data in Comparison with Those of Sunspots. The Astrophysical Journal 2019, arXiv:astro-ph.SR/1811.10782]871, 187. [Google Scholar] [CrossRef]
- Nagovitsyn, Y.A.; Ivanov, V.G.; Skorbezh, N.N. Refinement of the Gnevyshev-Waldmeier Rule Based on a 140-Year Series of Observations. Astronomy Letters 2019, 45, 396–401. [Google Scholar] [CrossRef]
- Baranyi, T.; Gyori, L.; Ludmány, A. On-line Tools for Solar Data Compiled at the Debrecen Observatory and Their Extensions with the Greenwich Sunspot Data. Solar Physics 2016, arXiv:astro-ph.SR/1606.00669]291, 3081–3102. [Google Scholar] [CrossRef]
- Tlatov, A.G. Lifetime of Sunspots and Pores. Solar Physics 2023, 298, 93. [Google Scholar] [CrossRef]
- Tlatov, A.G. The Lifetime of Sunspot. Geomagnetism and Aeronomy 2024, 63, 1116–1119. [Google Scholar] [CrossRef]
- Muraközy, J.; Baranyi, T.; Ludmány, A. Sunspot Group Development in High Temporal Resolution. Solar Physics 2014, arXiv:astro-ph.SR/1309.1604]289, 563–577. [Google Scholar] [CrossRef]
- Muraközy, J. Study of the Decay Rates of the Umbral Area of Sunspot Groups Using a High-resolution Database. The Astrophysical Journal 2020, arXiv:astro-ph.SR/2002.08997]892, 107. [Google Scholar] [CrossRef]
- Iglesias, F.A.; Cremades, H.; Merenda, L.A.; Mandrini, C.H.; López, F.M.; López Fuentes, M.C.; Ugarte-Urra, I. Analysis of a long-duration AR throughout five solar rotations: Magnetic properties and ejective events. Advances in Space Research 2020, arXiv:astro-ph.SR/1911.01265]65, 1641–1653. [Google Scholar] [CrossRef]
|
Disclaimer/Publisher’s Note: The statements, opinions and data contained in all publications are solely those of the individual author(s) and contributor(s) and not of MDPI and/or the editor(s). MDPI and/or the editor(s) disclaim responsibility for any injury to people or property resulting from any ideas, methods, instructions or products referred to in the content. |
© 2024 by the authors. Licensee MDPI, Basel, Switzerland. This article is an open access article distributed under the terms and conditions of the Creative Commons Attribution (CC BY) license (http://creativecommons.org/licenses/by/4.0/).
