1. Introduction
In jet composite electrodeposition, the performance and surface morphology of the composite coating can be affected by process parameters such as current density, particle concentration, power supply, addition of particle dispersants, electrolyte flow rate, nozzle structure, and electrolyte temperature. Among them, the factors with a significant impact on coating performance are current density, power supply, nozzle flow rate, and nozzle structure. Zhao et al. [
1] prepared Ni/Al
2O
3 composite coatings using jet composite electrodeposition and compared the effects of DC and pulse power supply on the mechanical properties and corrosion resistance of the composite coatings. The results showed that the composite coatings prepared by pulse power supply had better corrosion and wear resistance.
Wang et al. [
2] prepared Ni/CeO
2 composite coatings using jet electrodeposition technology. A new method of intermittent cathode rotation and staggered deposition was developed based on the original DC power supply. They studied the effects of nanoparticle concentration on the surface quality, nanoparticles content, microstructure, wear resistance, and corrosion resistance of the composite coatings. Xia et al. [
3] prepared Ni/TiN composite coatings using jet pulse electrodeposition with an electrolyte solution containing 25 nm TiN particles at a concentration of 7 g/L. The microhardness curves of composite coatings prepared at different flow rates was discussed, reflecting the performance of composite coatings prepared with different nozzle flow rates. The research results indicated that flow rate was a key factor influencing the nanoparticle content in composite coatings. High flow rates generate a large impact force that can dislodge loosely adsorbed particles from the surface, decreasing the nanoparticle content of the composite coating. Cui et al. [
4] studied the performance of composite coatings prepared with different nozzle sizes and Ni-doped SiC nanocomposite coatings. The nanocomposite coating deposited by an 8 mm diameter nozzle had a finer and more uniform microstructure.
Using finite element analysis to simulate composite electrodeposition can facilitate parameter optimization, reduce the number of experiments, and save material and financial resources. Tognia et al. [
5] developed a finite element method (FEM) model with error control and adaptive meshing using the UMFPACK solver in COMSOL Multi-physics software. Through simulations, this model facilitated the fast and accurate determination of optimal parameters for uniform electrodeposition of various metals onto tubular coal-based carbon membranes. Pandey [
6] performed a numerical study using COMSOL Multi-physics software to study the effect of applied voltage and interelectrode gap on the deposition rate of nickel from an electrolyte. Cui et al. [
4] simulated jet fluid process by using FLUENT software, and dynamic simulations of the jet rate of the plating solution were performed when fabricating Ni–doped SiC nano-coatings during the JED process. Pérez [
7] designed a laboratory filter-press flow cell with parallel plate electrodes for nickel electrodeposition onto mild steel from a dilute solution. Transport equations were solved in 3D by the finite element method using the commercial code COMSOL Multiphysics.
This work investigates the influence of process parameters on jet electrodeposition of Ni-matrix diamond composite coatings. The size of diamond particles has a significant impact on the deposition effect. If the particle size is too large or too small, it will affect the uniform distribution of diamond particles in the coating, and different particles have a particle size range suitable for their deposition. Sharp et al. [
8] studied the effects of different diamond particle sizes (2-4 µm, 4-8 µm, 6-12 µm, 10-15 µm) and found that diamond particles larger than 15 µm increased surface roughness and damaged the contact surface. If the diamond particle size is less than 1 µm, it suppresses the frictional properties of the material, easily causes agglomeration, and affects the quality of the coating. Therefore, 2-4 mm diamond particles were used in this study to improve adhesion to the substrate and enhance wear resistance.
2. Simulation
2.1. Simulation Model
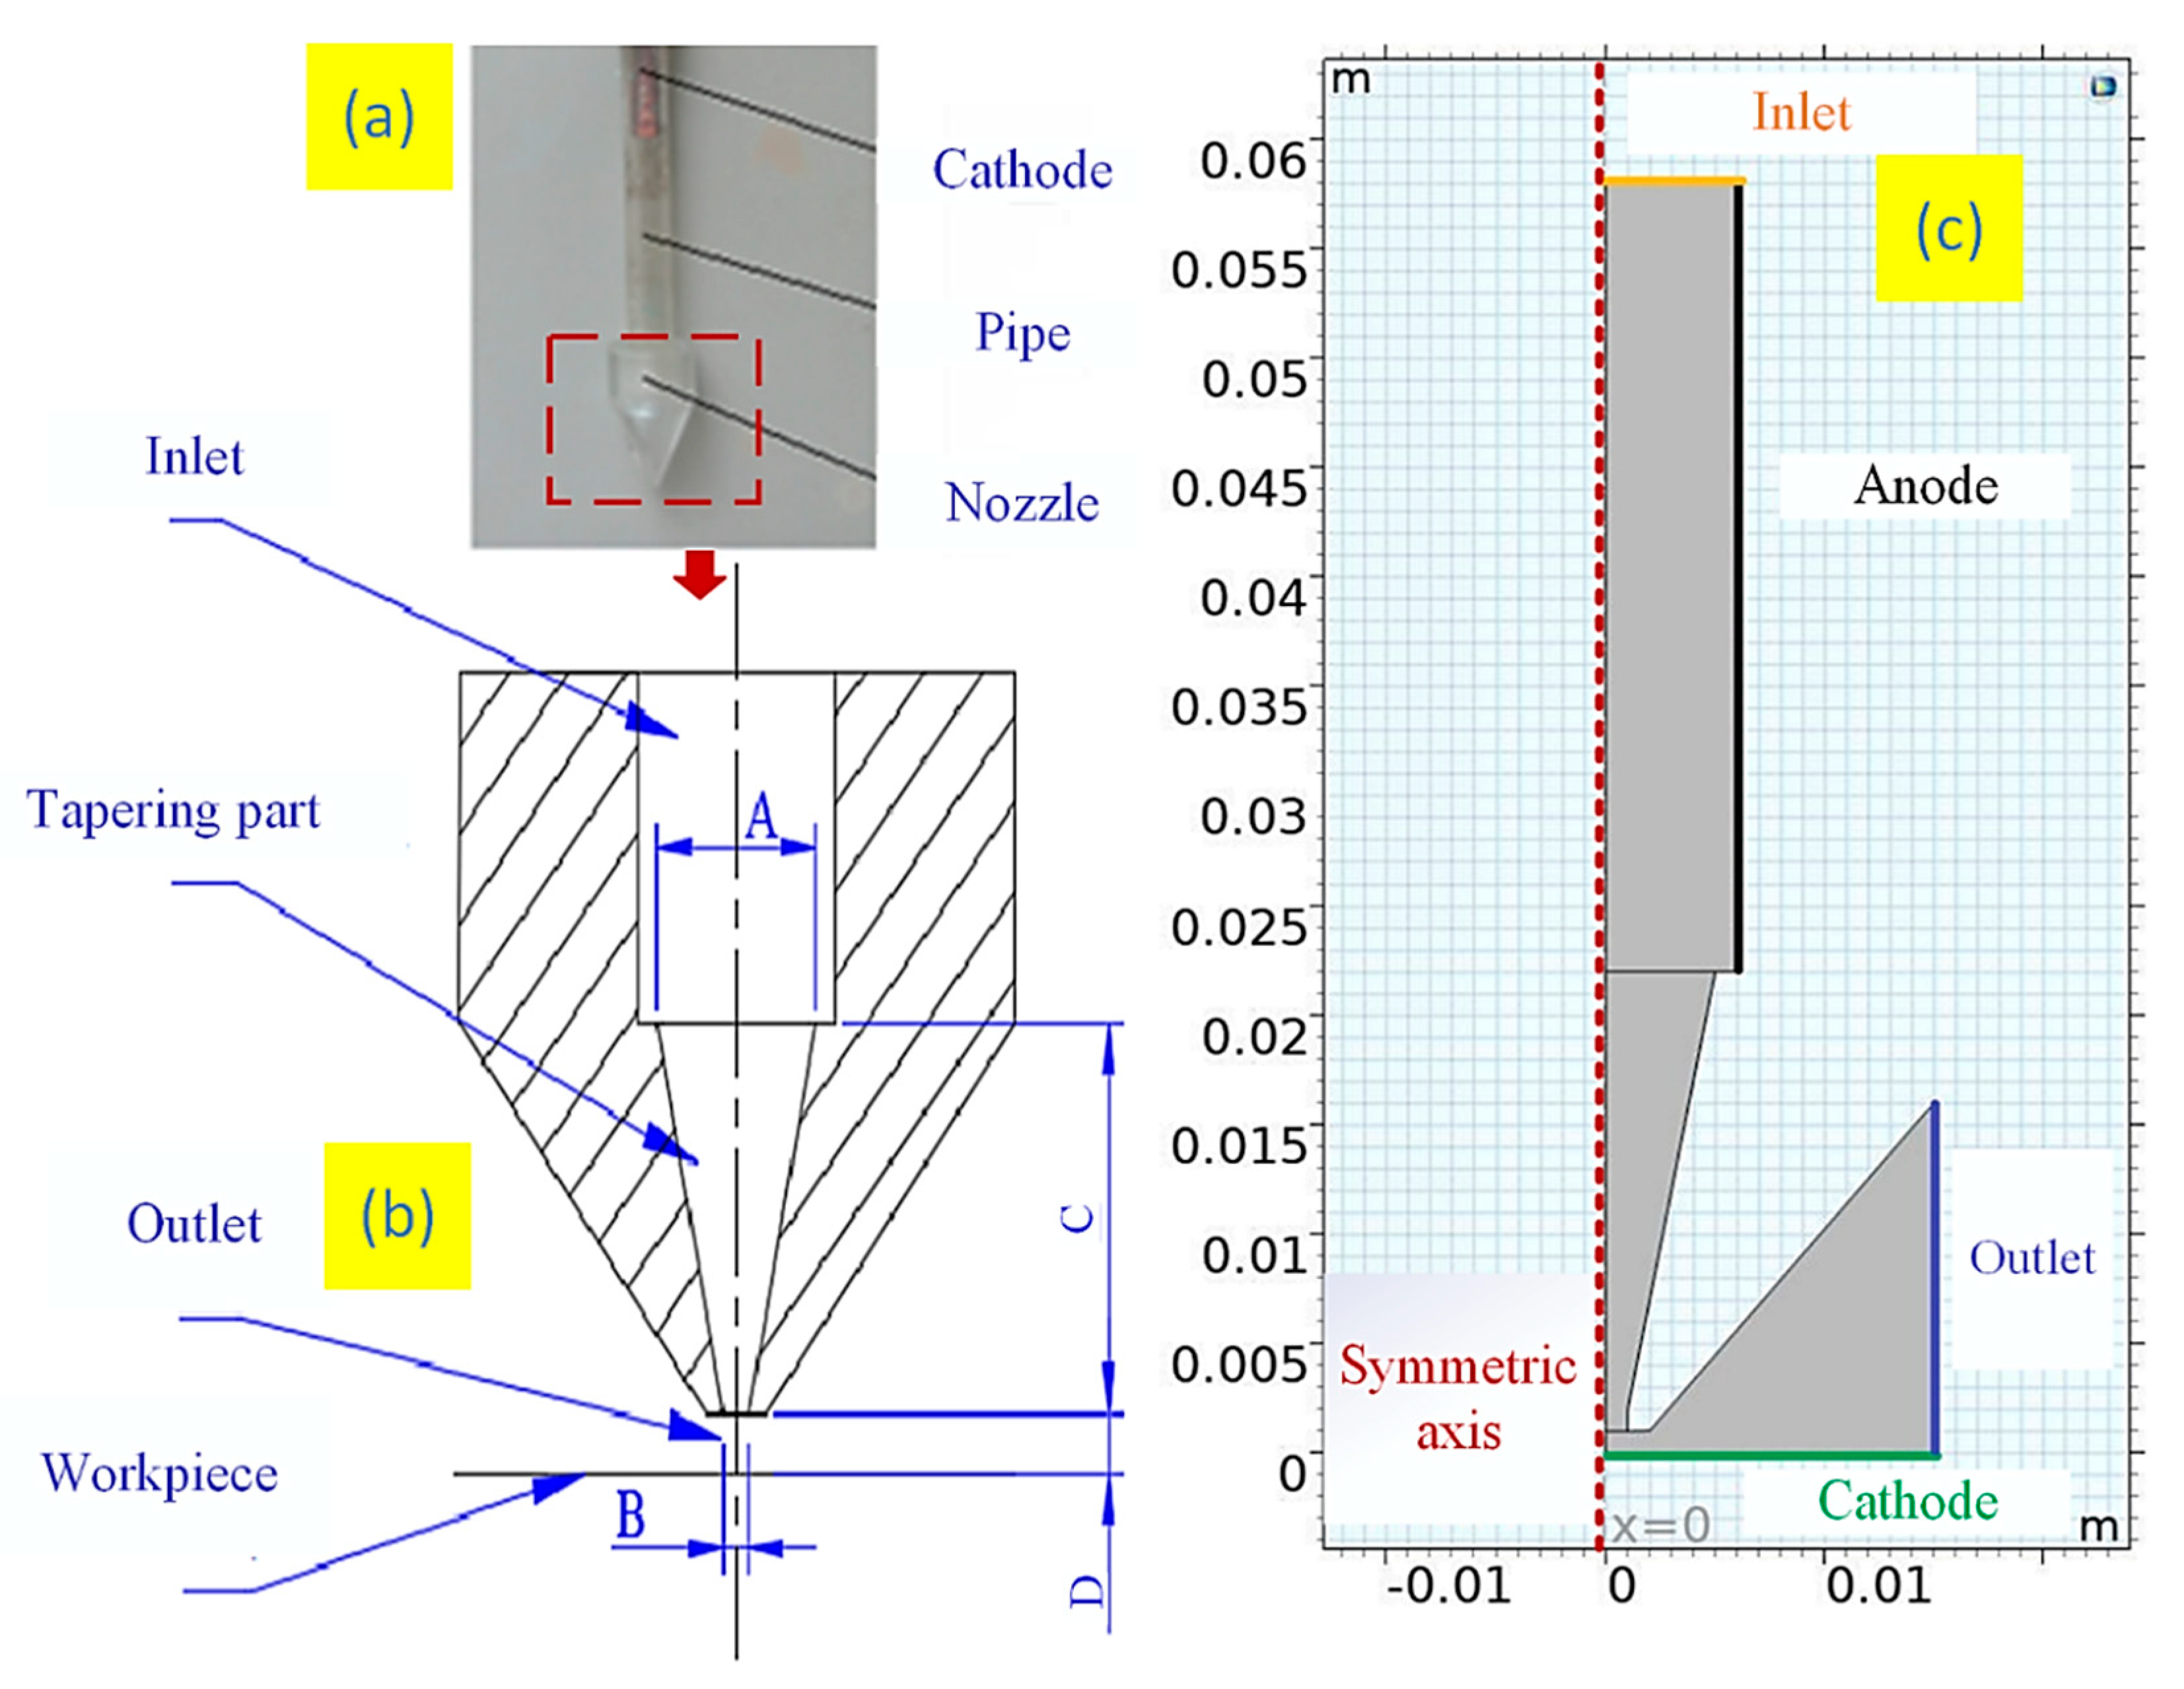
A 2 mm×10 mm slot nozzle was used for composite electrodeposition. The geometry model is shown in
Figure 1. The physical model and geometry of the nozzle were shown in
Figure 1a,b. A and B are the inlet and outlet diameters of the tapering part, respectively. C is the length of tapering part, and D is the distance between the nozzle outlet and the workpiece. The nozzle model was established using COMSOL Multiphysics software, and
Figure 1c shows the model of nozzle for simulation. Due to the symmetric structure of the nozzle, a 2D axisymmetric model was employed. The anode and cathode are defined, and the inlet and outlet of the flow field are shown in
Figure 1c.
For the simulation, three factor variables and three levels parameters were set, namely current density (40, 50, and 60 A/dm2), the inlet velocity of electrolyte (5, 8, and 11 L/min), and the distance between nozzle outlet and cathode (D=1, 2, and 3 mm). The inlet diameter is 12 mm and the cavity height is 20 mm. The nickel density is 8.902 g/cm3, the nickel electrochemical equivalent is 1.095 g/Ah, the electrolyte conductivity is 0.5 S/cm, the electrolyte viscosity is 0.001 Pa, and the electrolyte density is 1100 kg/m3. The density of diamond powder particles is 3510 kg/m3, and the number of charges carried is 0.
2.2. Theoretical Basis of Multi-Physics Simulation
After creating the geometric model, mesh partitioning is performed. Multi-physics field coupling is used for simulation, including cubic current distribution, the Nernst Planck equation, turbulent flow field, k - ε equation, fluid flow particle tracking, and other basic theories.
2.2.1. Electric Field Theory
In the electric field model, the preparation of metal-based diamond composite coatings used the "cubic current distribution, Nernst Planck (TCD) physical field" to study the transient electric field. The flux of each ion in the electrolyte can be calculated using the N-S equation [
9]. The N-S equation can be used to describe the motion of the electric field and fluid, and it can be seen as an extension of Newton's second law F=ma, which can be obtained:
In the formula,
represents the total flux of i species (SI unit: mol/ (m
2 · s)). The flux in the electrolyte is described by the Nernst Planck equation, which involves multiple calculations of charged ion flux through diffusion, integration, and convection, as shown in formula (2). Here,
(SI unit: mol/m3) is the concentration of ion i.
is the number of charges carried by the ion.
(SI unit: m2/s) is the diffusion coefficient.
(SI unit: (s ∙ mol)/kg) is the migration rate.
(SI unit: As/mole) is the Faraday constant.
(SI unit: V) is the electrolyte potential.
(SI unit: m/s) is the velocity vector.
represents the molar flux relative to convective transport.
Net current density describes the total flux of all types:
where
(SI unit: A/m
2) is the current density vector.
The model simulates the electrodeposition process in a weakly acidic environment, with lower concentrations of Ni2+and SO42- in the electrolyte solution. In terms of material balance, there is no need to consider the influence of proton factors. Assuming that the current is completely converted during the redox reaction process, it indicates that there will be no other reactions occurring during the model simulation process. During the electrodeposition process, the difference in cation density of the electrolyte solution gradually becomes clear because the density in the anode area is higher than that in the cathode area, forming a natural convection phenomenon. However, in this experiment, the nickel ion concentration was consumed at the negative extreme, while the positive extreme was continuously replenished. The electrolyte ion concentration changed very little, and the effect of natural convection can be neglected in the simulation model.
The simulation is for the transient change process. During the electrodeposition process, as the thickness of the deposition layer increases, the cathode boundary continuously moves, which indicates the evolution of the electrodeposition process. This model is defined by the material balance and electrical neutrality conditions of the relevant ions (Ni2+and sulfate SO42-). This will generate three unknowns and three model equations, with the dependent variables being nickel ion concentration, sulfate ion concentration, and ion potential. Additional variables are used to track the deformation of the mesh.
2.2.2. Flow Field Theory
In the flow field model, the preparation of metal-based diamond composite coatings requires the use of "turbulent, k - ε (SPF) physical field", which studies the transient flow field and adopts the Navier Stokes equation [
10]. The k - ε model is a commonly used turbulence model in industrial applications. The model references the transport equation and two dependent variables, which are turbulent flow energy k and turbulent dissipation rate ε, respectively. The turbulent viscosity model is represented by the following equation:
here,
is model constant. The transport equation for K:
here, k is turbulent kinetic energy. ε is the turbulent energy dissipation rate.
Pk is the energy generation term.
(SI unit: m/s) is the average velocity vector. P (SI unit: Pa) is the pressure.
µ (SI unit: N · s/m
2) is the dynamic viscosity.
ρ (SI unit: kg/m
3) is the fluid density.
F (SI unit: N) is the volumetric force.
Cµ=0.09,
Cε1=1.44,
Cε2=1.92,
σk=1.0,
σε=1.3.
The k - ε equation is derived assuming that the flow has a sufficiently high Reynolds number. If this condition is not satisfied, then the values of k and ε are both small and exhibit chaotic behavior, as small perturbations in the flow field can lead to significant changes in the relative values of k and ε.
2.2.3. Particle Tracking Theory
In the fluid flow particle tracking model, the preparation of metal-based diamond composite coatings requires the "fluid flow particle tracking (FPT) physical field", which studies particle tracking in transient states. The combination of Brownian motion force and drag force causes particles to diffuse from areas with higher numerical density to areas with lower numerical density. The particles follow Newton's second law, which means that the combined force acting on the object is equal to the time derivative of the linear momentum of the object in the inertial reference frame.
here,
(SI unit: kg) is the particle mass.
(SI unit: m/s) is the particle velocity.
(SI unit: m) is the particle position.
,
, and
(SI unit: N) are the resistance, gravity, and other forces of particles, respectively.
In the COMSOL implementation, when the particle mass is solved as an additional degree of freedom, accretion or evaporation can occur, and the mass is moved beyond the time derivative to prevent non-physical acceleration of the particles:
The flow field is calculated through the "turbulence" interface. In this model, the force exerted by particles on the fluid is ignored, so it is possible to solve the flow field in only one study and then use a separate study to calculate the particle trajectory based on the results of that flow field. There are significant transient phenomena in the model, which means that if the model is to be solved sequentially, a large number of time steps must be stored. Therefore, solving particle trajectories and flow fields in a single transient research step is a more attractive method.
2.3. Electric Field Simulation
With multi-physics software, the thickness change of the coating on the brass substrate after 5 s of electroplating at different distances between the nozzle outlet and cathode was simulated.
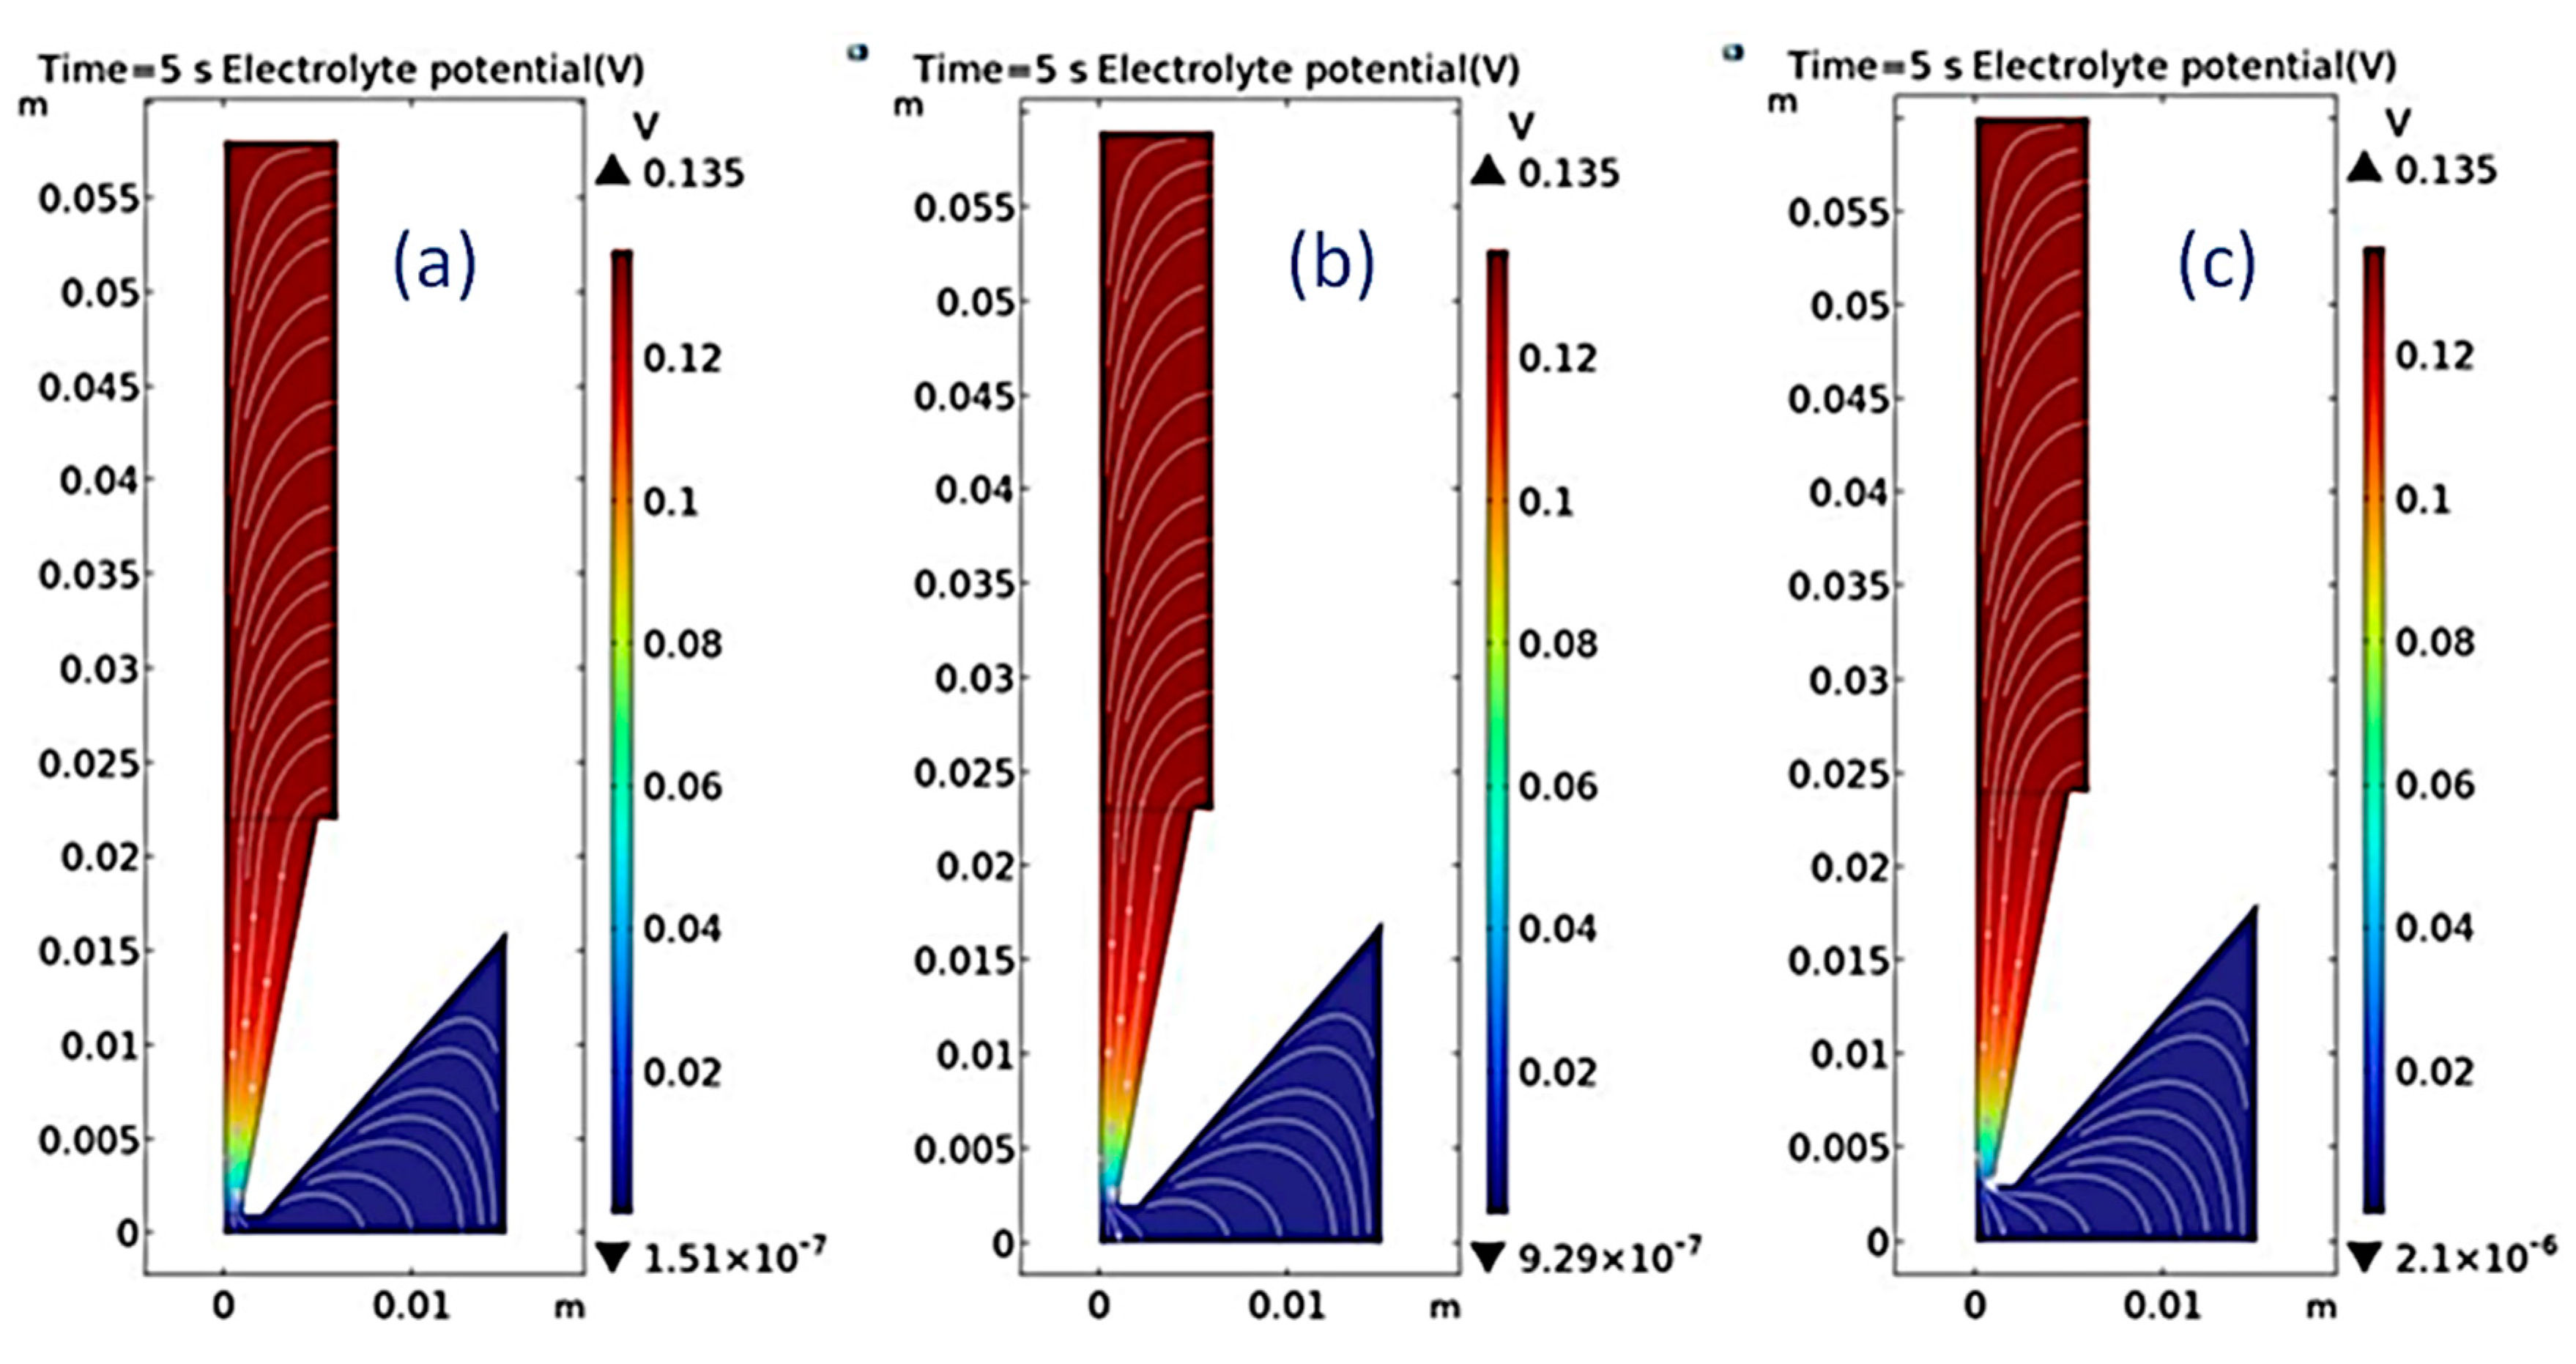
Figure 2 showed the distribution of electric field lines during the process of electrodeposition. The electric field lines are densest at the nozzle mouth, which was conducive to obtain more thicker coating.
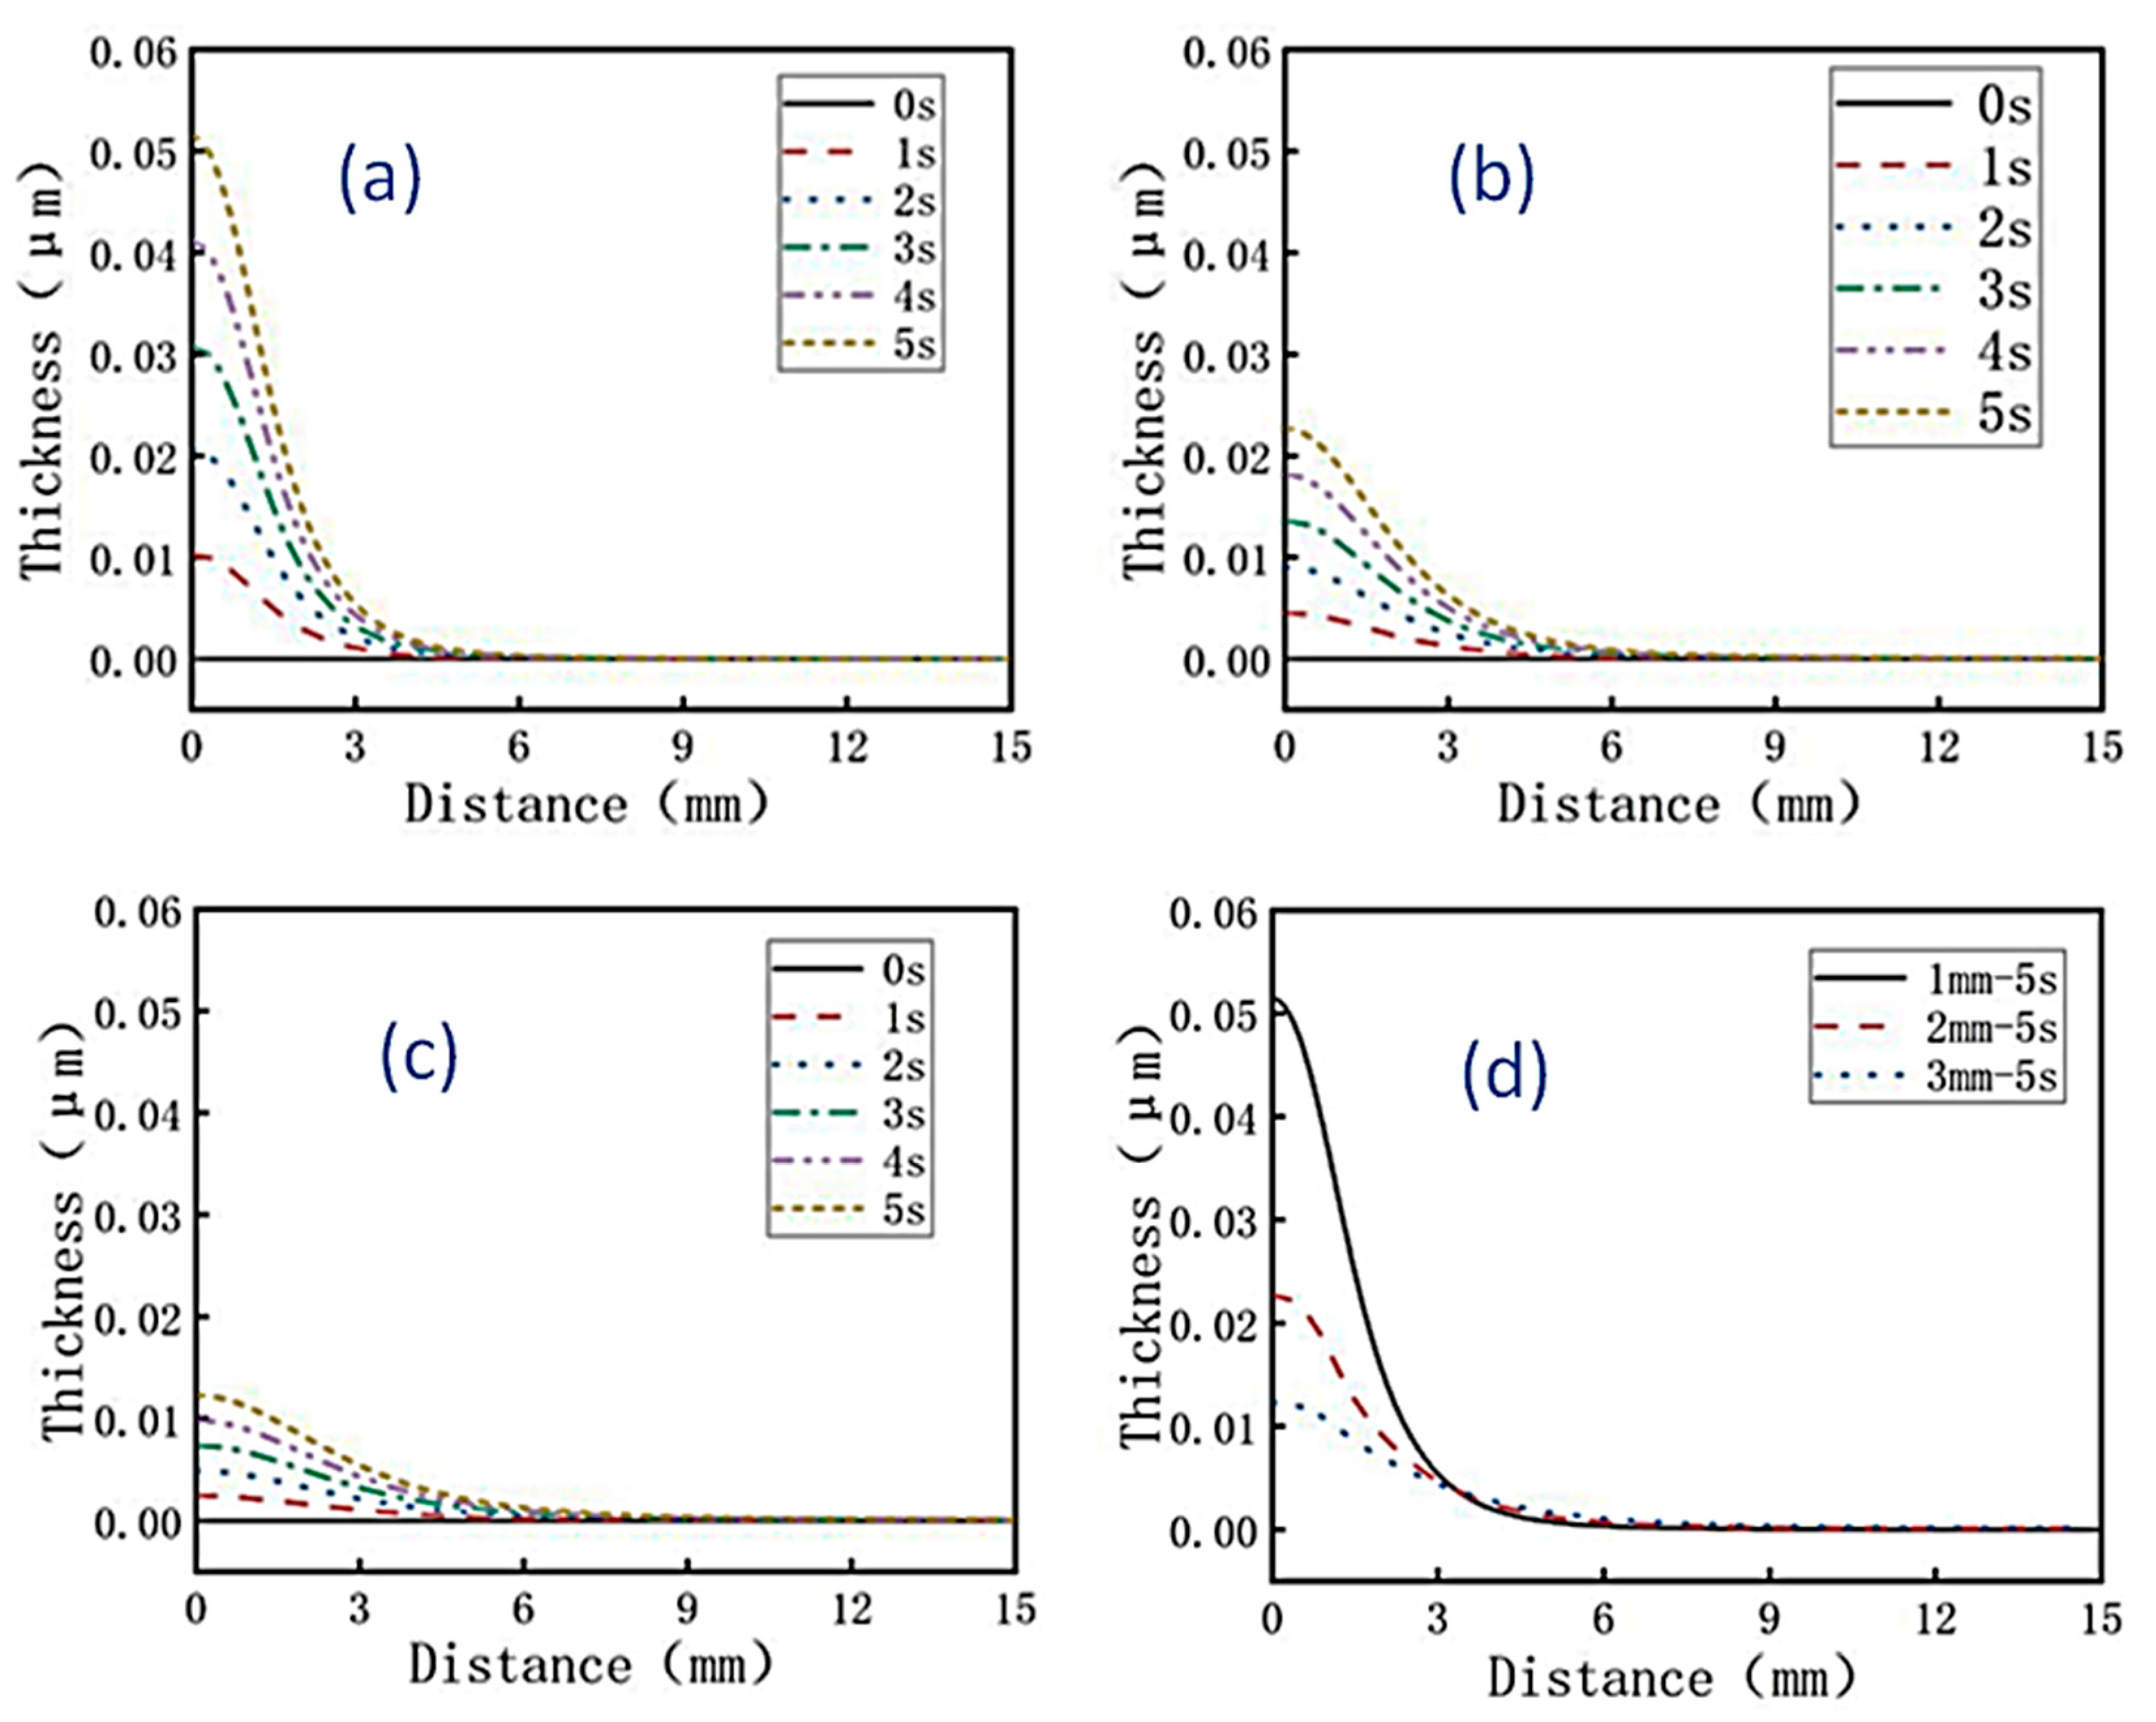
When the distance between the nozzle outlet and the cathode is 1 mm, 2 mm, and 3 mm respectively, the distributions of the surface coating thickness of the brass sheet under the conditions of jet electrodeposition for 0 s, 1 s, 2 s, 3 s, 4 s, and 5 s were simulated, as shown in
Figure 3a–c. As a result, it was found that with the increase of jet electrodeposition time, the thickness of coating also increased. When jet electrodeposition is applied for 5 s, the difference of coating thickness with the distance between the nozzle outlet and the cathode was shown in
Figure 3d. It was found that the shorter the distance between the nozzle outlet and the cathode, the thicker the coating thickness. When the distance between the nozzle outlet and the cathode was 1 mm, the thickness of the coating reaches the maximum 0.052 μm. This is because the shorter the distance between the nozzle outlet and the cathode, the shorter the distance for metal ions to be reduced to the cathode, which accelerated the reduction reaction, resulting in an increase in electrodeposition rate and a faster increase in coating thickness. For the case where inert diamond particles were added to the solution, with the reduction reaction accelerating, the more diamond particles may be trapped and embedded on the surface of the coating.
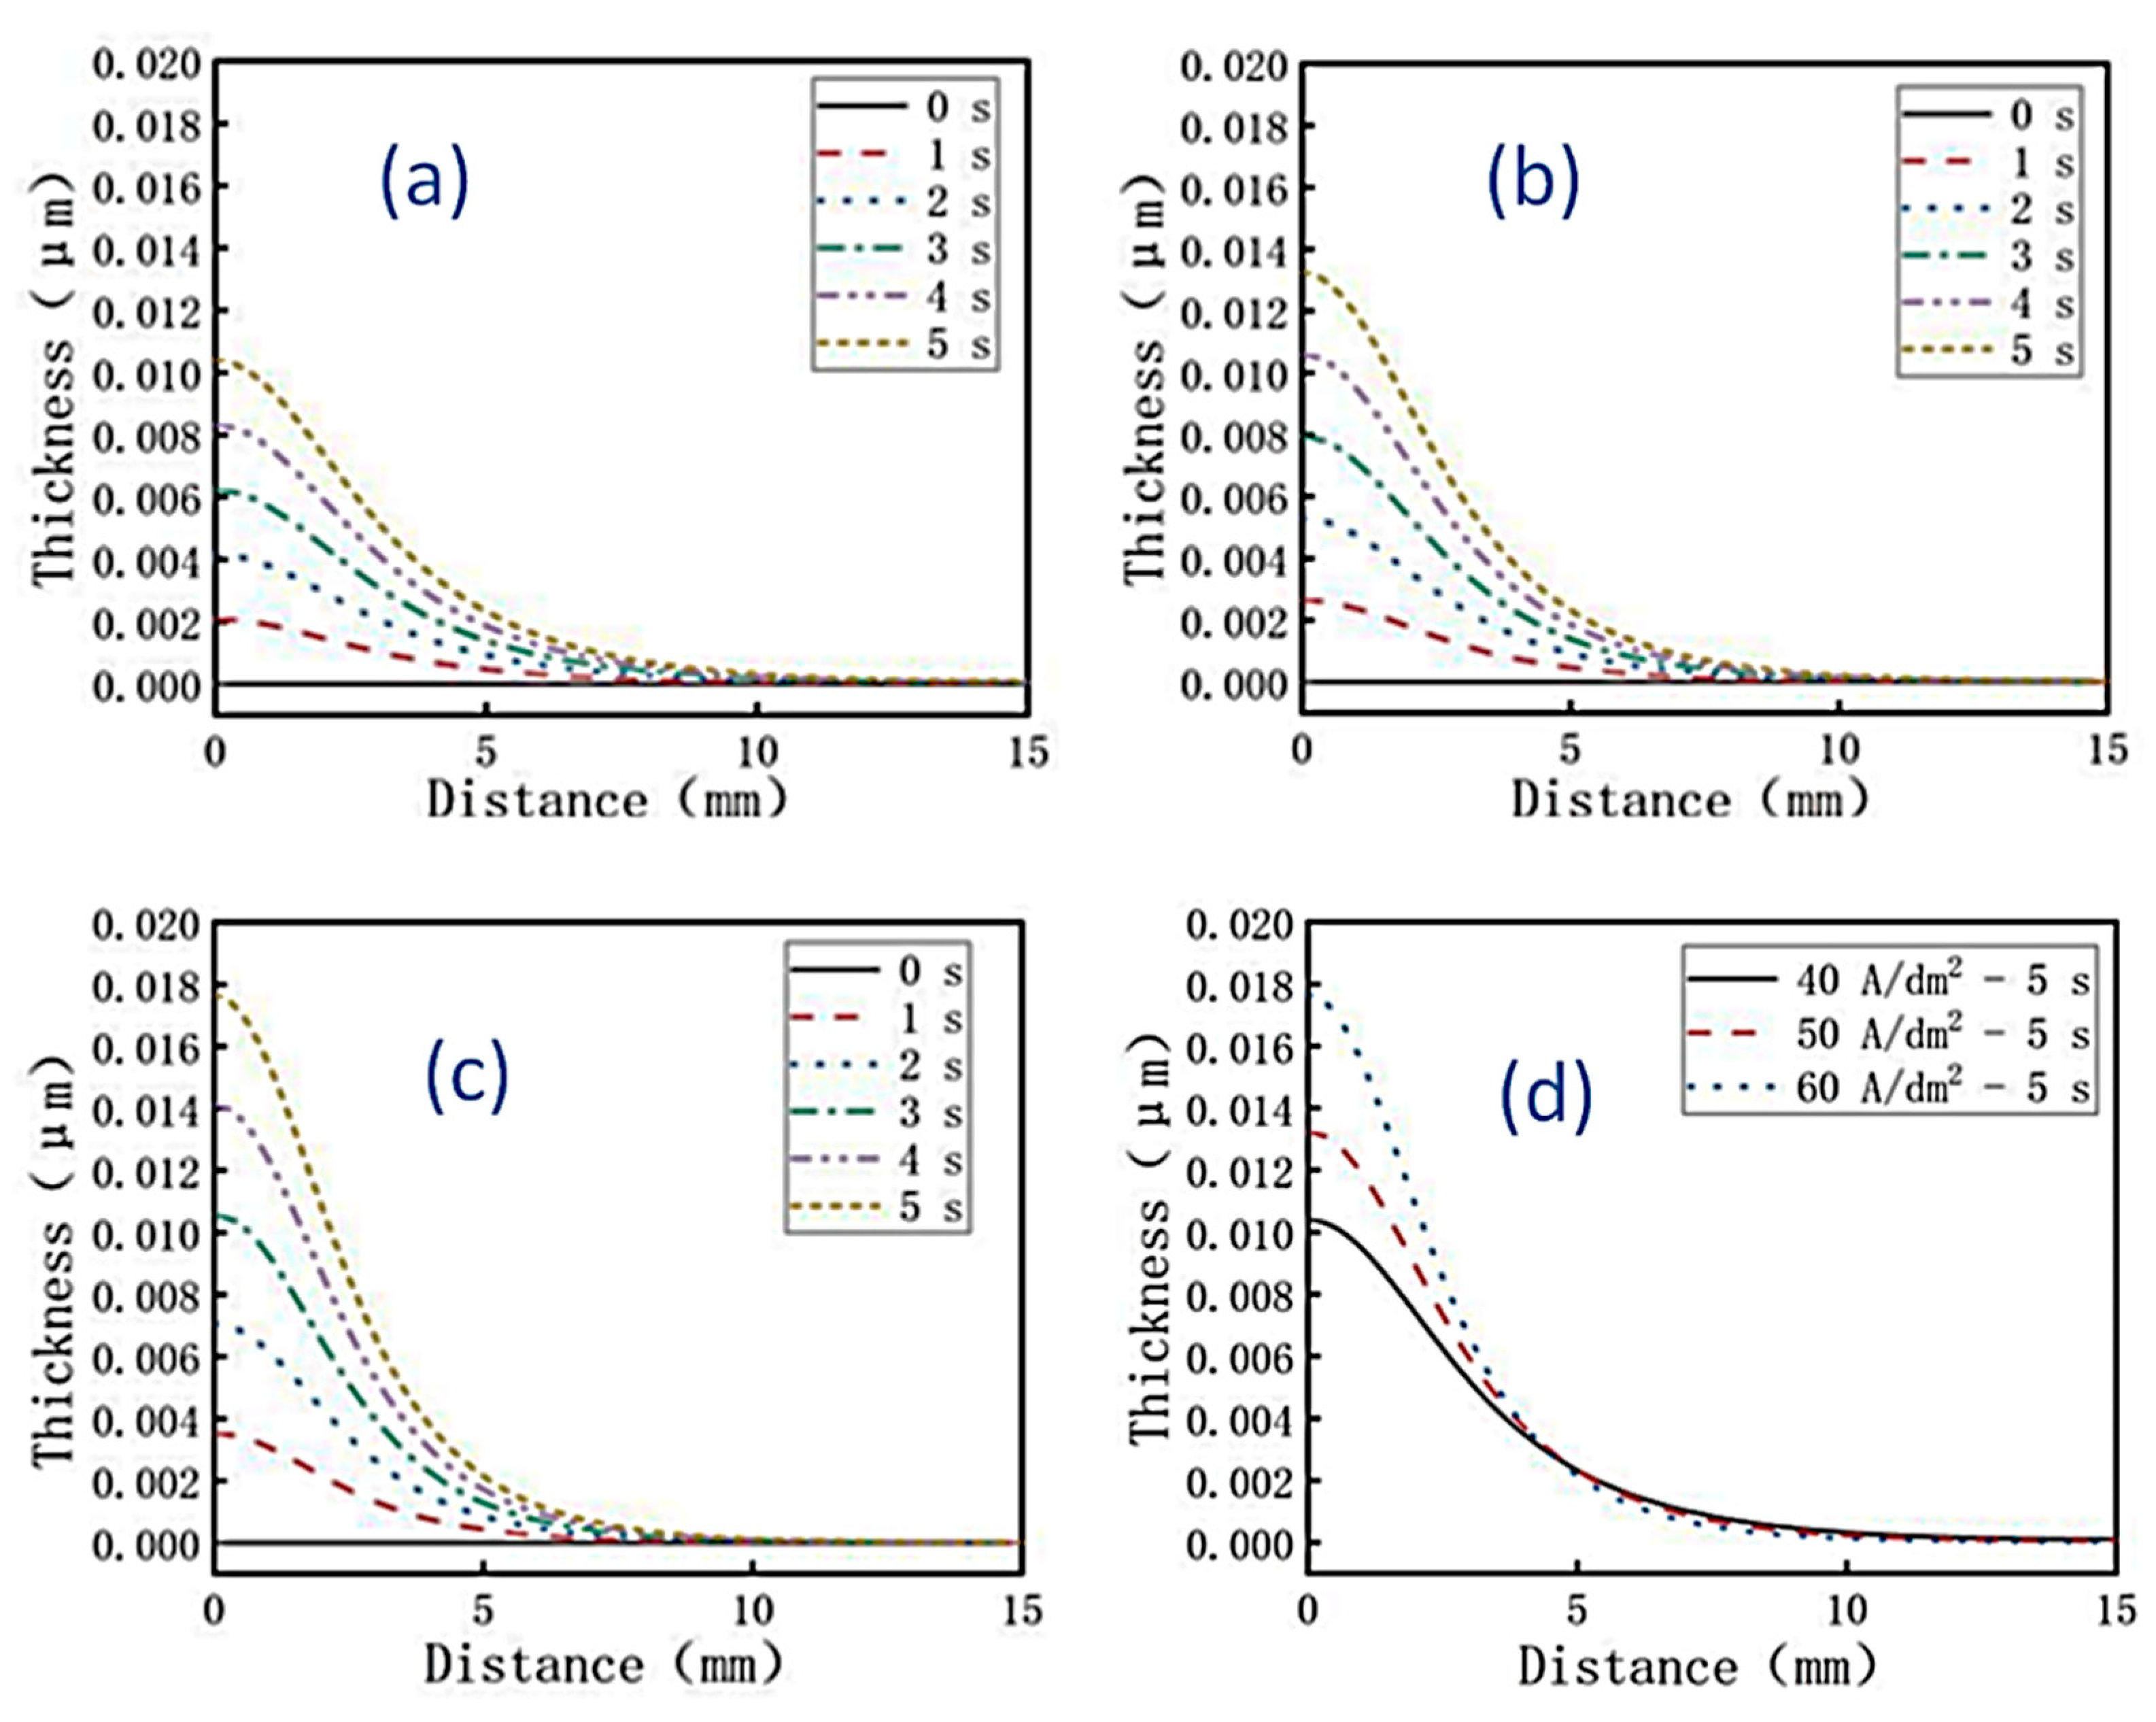
Using multi-physics software, the thickness changes of the coating on brass sheets after 0 s, 1 s, 2 s, 3 s, 4 sand 5 s of jet electrodeposition were simulated under current densities of 40, 50, and 60 A/dm
2, respectively. The simulation results were shown in
Figure 4a–c. It can be seen that as the current density gradually increased, the thickness of the coating on the surface of the cathode brass sheet also increased. When the current density reached its maximum value of 60 A/dm
2, the thickest coating thickness was 0.018 μm. This was a result of an increase in current density. When jet electrodeposition is applied for 5 s, the difference of coating thickness with current density was shown in
Figure 4d. It was found that the larger the current density, the thicker the coating thickness. According to Faraday's law, the coating thickness is directly proportional to the current density.
2.4. Flow Field Simulation
2.4.1. Velocity Simulation of Flow Field
Using multi-physics software simulation, the flow field of electrodeposition was analyzed and solved, and the velocity change results of electrolyte solution on the cathode surface at different distances between the nozzle and cathode were obtained.
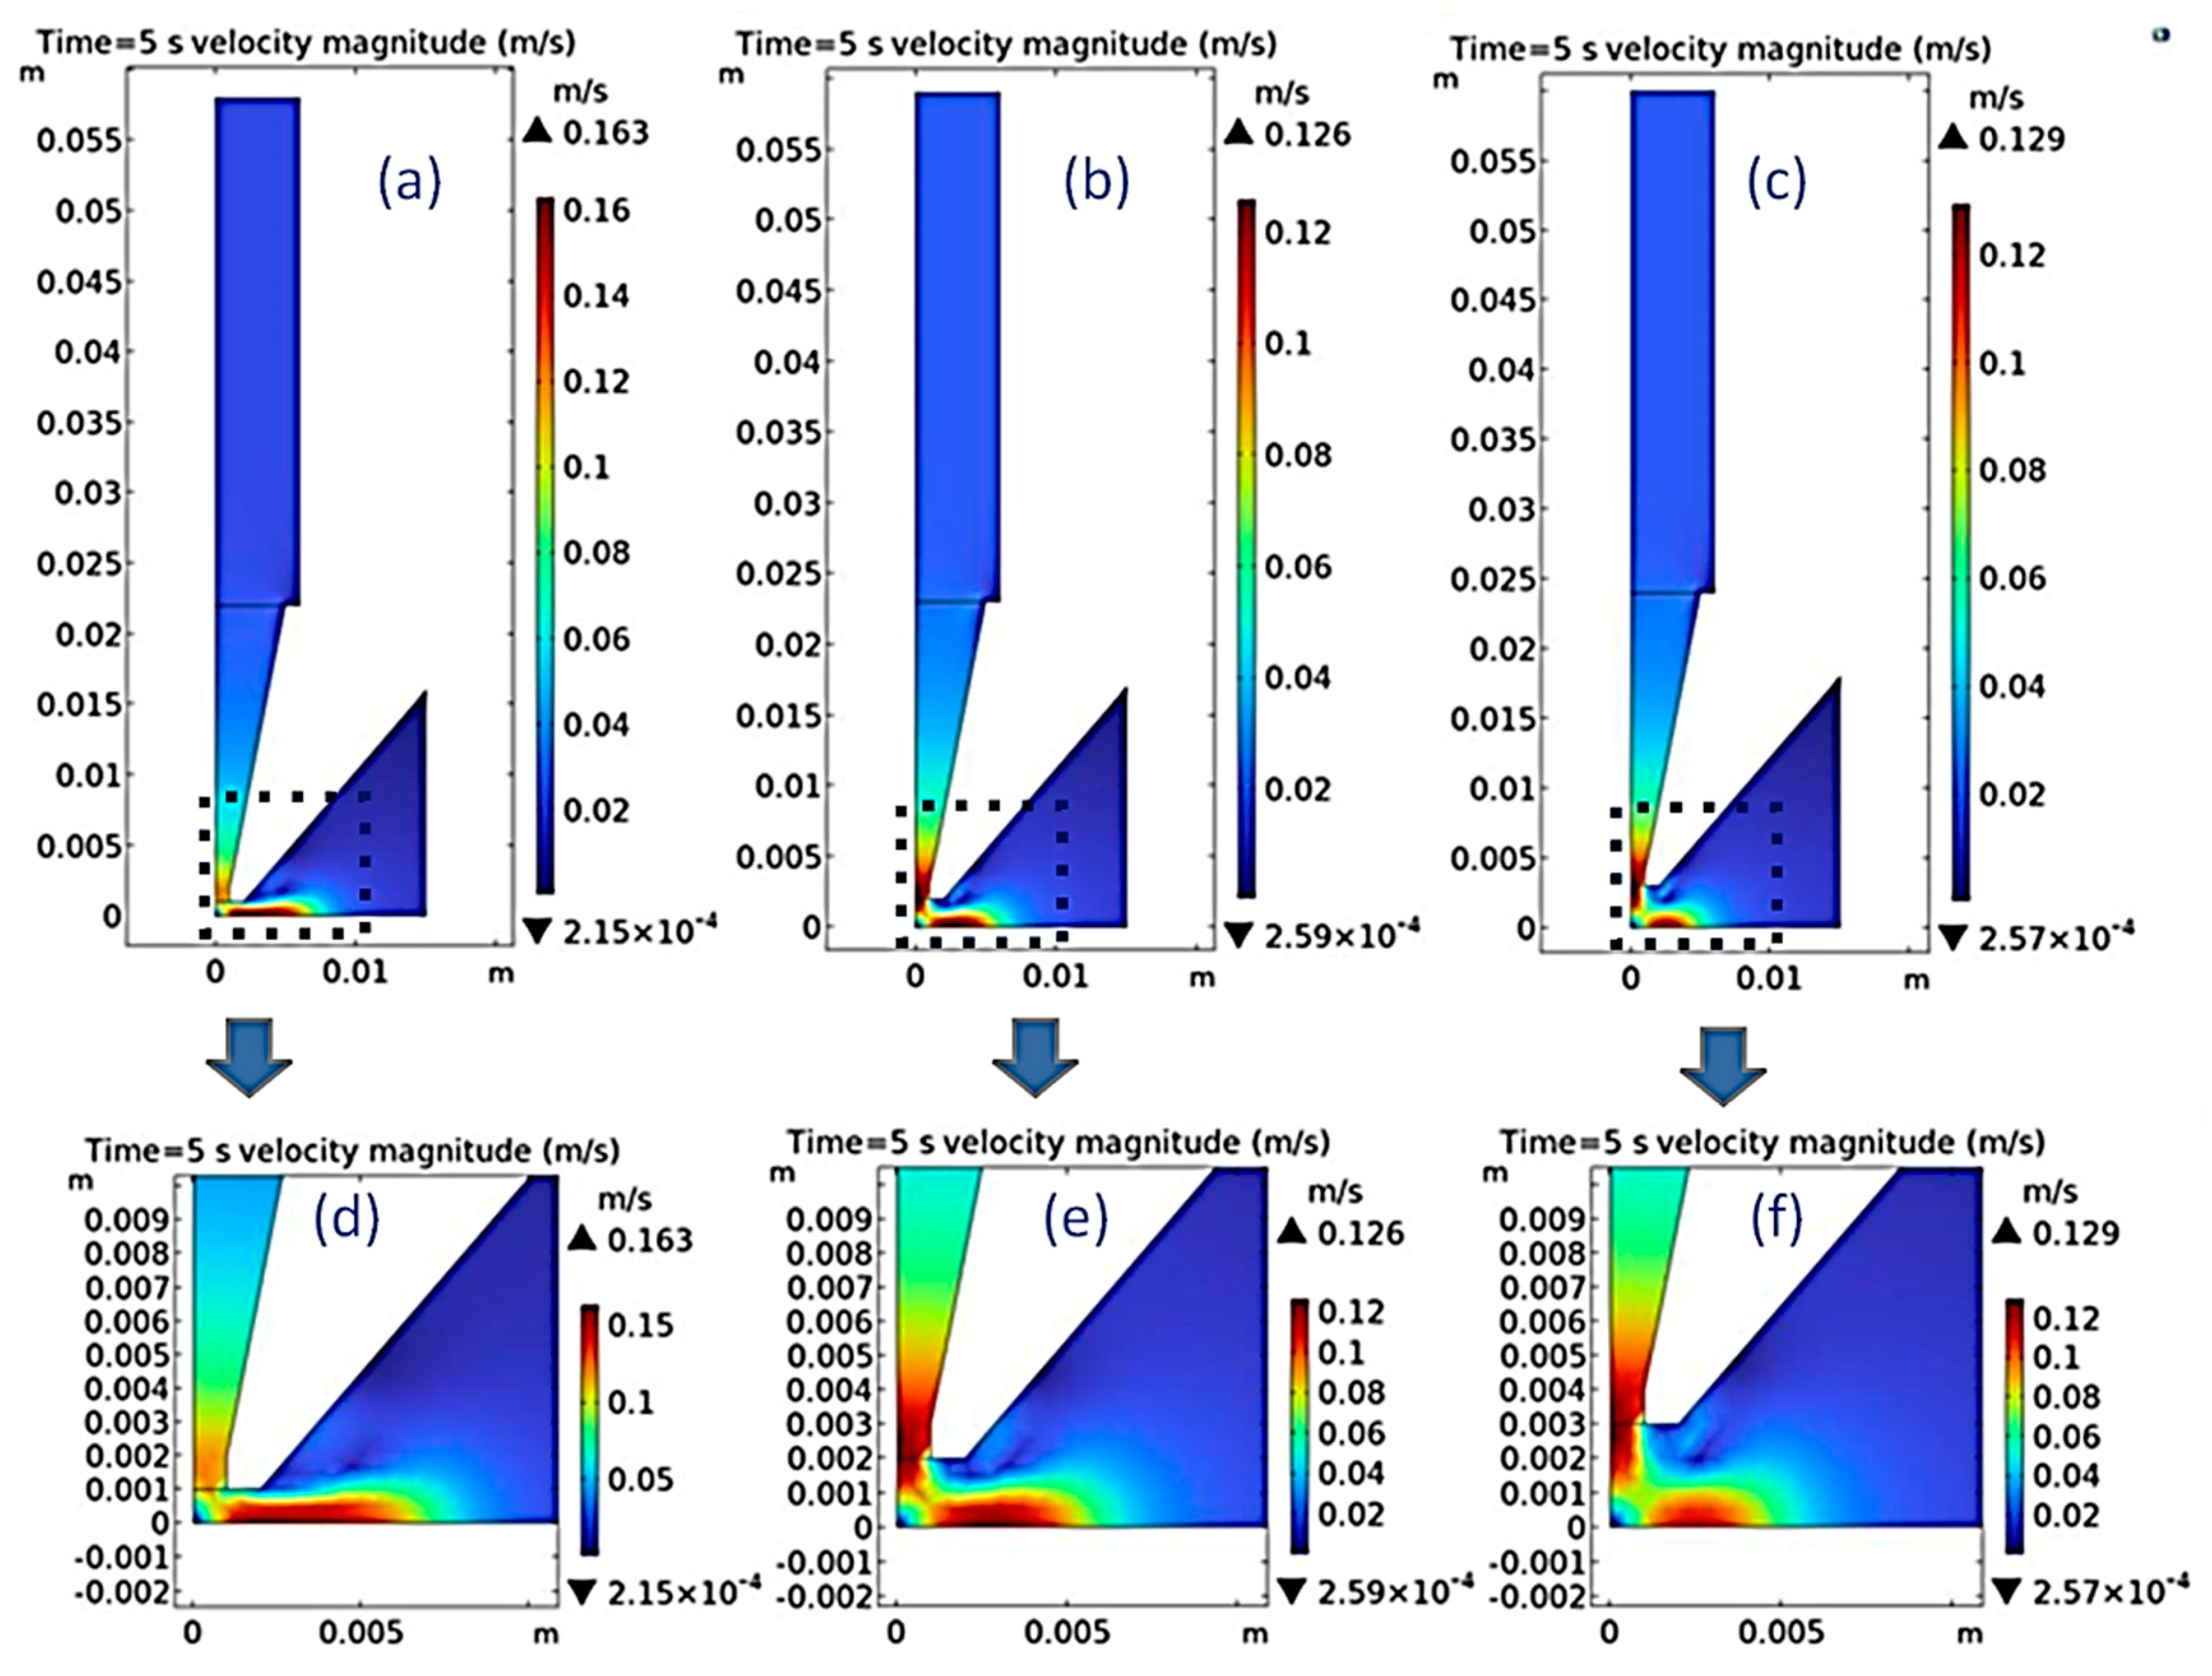
Figure 5a–c showed the velocity distribution of the nozzle outlet at a distance of 1 mm, 2 mm, and 3 mm to the cathode when the time was 5s.
Figure 5d–f showed the enlarged velocity distribution in the nozzle outlet area of
Figure 5a–5c, respectively. It can be observed that the velocity fluctuation on the cathode surface during the jet electrodeposition is relatively small, which helps to improve the uniformity and consistency of the coating. In order to more intuitively represent velocity fluctuation, the speed value at a distance of 0.2 mm from the surface of the cathode plate is collected to reflect the speed change of the electrolyte solution flowing through the coating surface during the electrodeposition process, as shown in
Figure 6a. It was found that as the distance between the cathode and nozzle decreased, the velocity value of the electrolyte solution flowing through the surface of the brass plate increased. When the distance between the cathode and nozzle was 3 mm, the velocity at the nozzle mouth was smoother at 4.15 m/s, which was conducive to particle deposition on the surface of the coating.
At different nozzle inlet flow rates, after 5 s of electrodeposition, the velocity change of the electrolyte solution on the cathode surface was simulated. When the nozzle inlet flow rates were 5, 8, and 11 L/min respectively, the velocity at a position 0.2 mm above the cathode was shown in
Figure 6b. It was found that as the nozzle inlet flow rate increased, the velocity value of the electrolyte solution flowing through the surface of the brass plate increased. When the nozzle inlet flow rate was 5 L/min, the velocity fluctuation at a position 0.2 mm above the cathode is the minimum, which is conducive to particle deposition on the surface of the coating.
2.4.2. Velocity Simulation of Flow Field
Using multi-physics software simulation, the pressure distribution of electrolyte solution in the nozzle outlet area was obtained under different distances between the cathode and nozzle and different nozzle inlet flow rates.
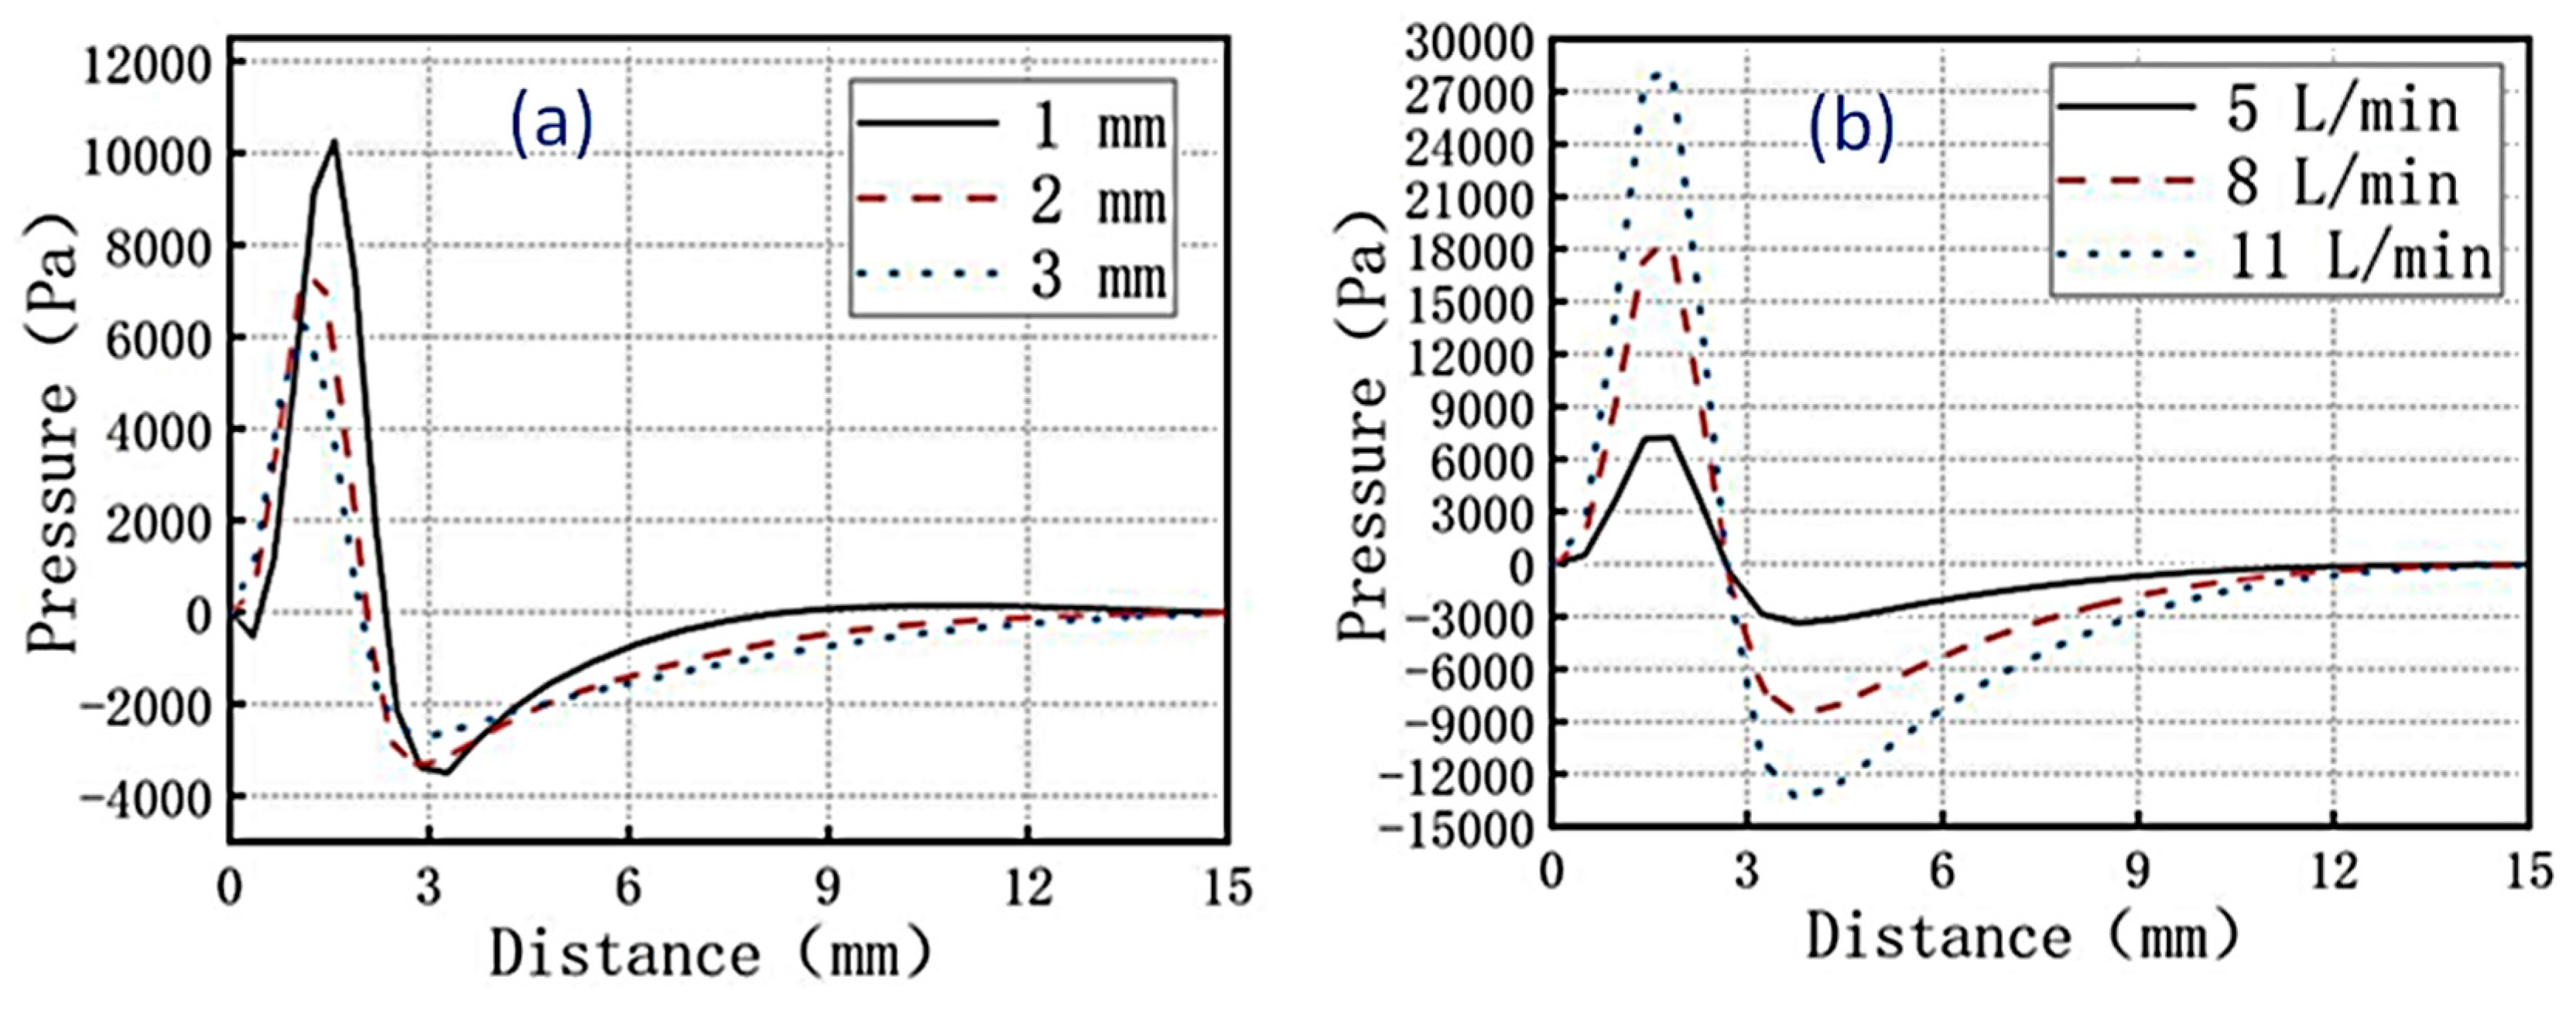
Figure 7a–c showed the pressure distribution of the nozzle outlet and cathode at distances of 1 mm, 2 mm, and 3 mm at the time was 5 s. It can be seen from this that the greater the distance between the nozzle outlet and the cathode, the smaller the pressure fluctuation on the cathode surface. The pressure fluctuation at a distance of 0.2 mm from the cathode was shown in
Figure 8. It can be seen from the figure that the pressure at the nozzle was the highest, and the pressure at the outlet of the cathode plate was weakening.
From
Figure 8a, it can be observed that as the distance between the cathode and nozzle decreased, the pressure value of the electrolyte solution flowing through the surface of the brass plate increased. When the distance between the cathode and nozzle was 3 mm, the pressure at the nozzle outlet was 6150 Pa, which was smoother and conducive to particle deposition on the surface of the coating. When the nozzle inlet flow rates were 5, 8, and 11 L/min respectively, after 5 s of electroplating, the pressure at a position 0.2 mm above the cathode was shown in
Figure 8b. It was found that as the nozzle inlet flow rate increased, the pressure value of the electrolyte solution flowing through the surface of the brass plate increased. When the nozzle inlet flow rate was 5 L/min, the pressure fluctuation at a position 0.2 mm above the cathode was the minimum, which was conducive to particle deposition on the surface of the coating.
2.5. Multi-Physics Coupling Simulation
Using multi-physics software for simulation, the tracking of diamond particles in the solution after 3 s of jet electrodeposition at different distances between the nozzle and cathode was shown in
Figure 9. When the distance between the nozzle outlet and the cathode was 1 mm, most of the particles in the solution adhere to the nozzle mouth, and the particle movement speed on the surface of the cathode plate reached the maximum value of 0.0913m/s. When the distance between the nozzle outlet and the cathode was 2 mm, the particles in the solution were evenly distributed within the cathode area, and the particle movement speed on the surface of the cathode plate reached the maximum value of 0.0863 m/s. When the distance between the nozzle outlet and the cathode was 3 mm, the particles in the solution were uniformly dispersed within the cathode area, and the particle movement speed on the surface of the cathode plate reached the maximum value of 0.0796 m/s. It can be concluded that increasing the distance between the nozzle and cathode can slow down the speed of electrolyte of the outlet to some extent, and reducing the flow rate can increase the residence time of diamond particles near the substrate, thereby enhancing their incorporation into the coating. The simulation results to some extent demonstrated the effect of composite electrodeposition and providing strong theoretical support for subsequent experiment.
3. Experimental
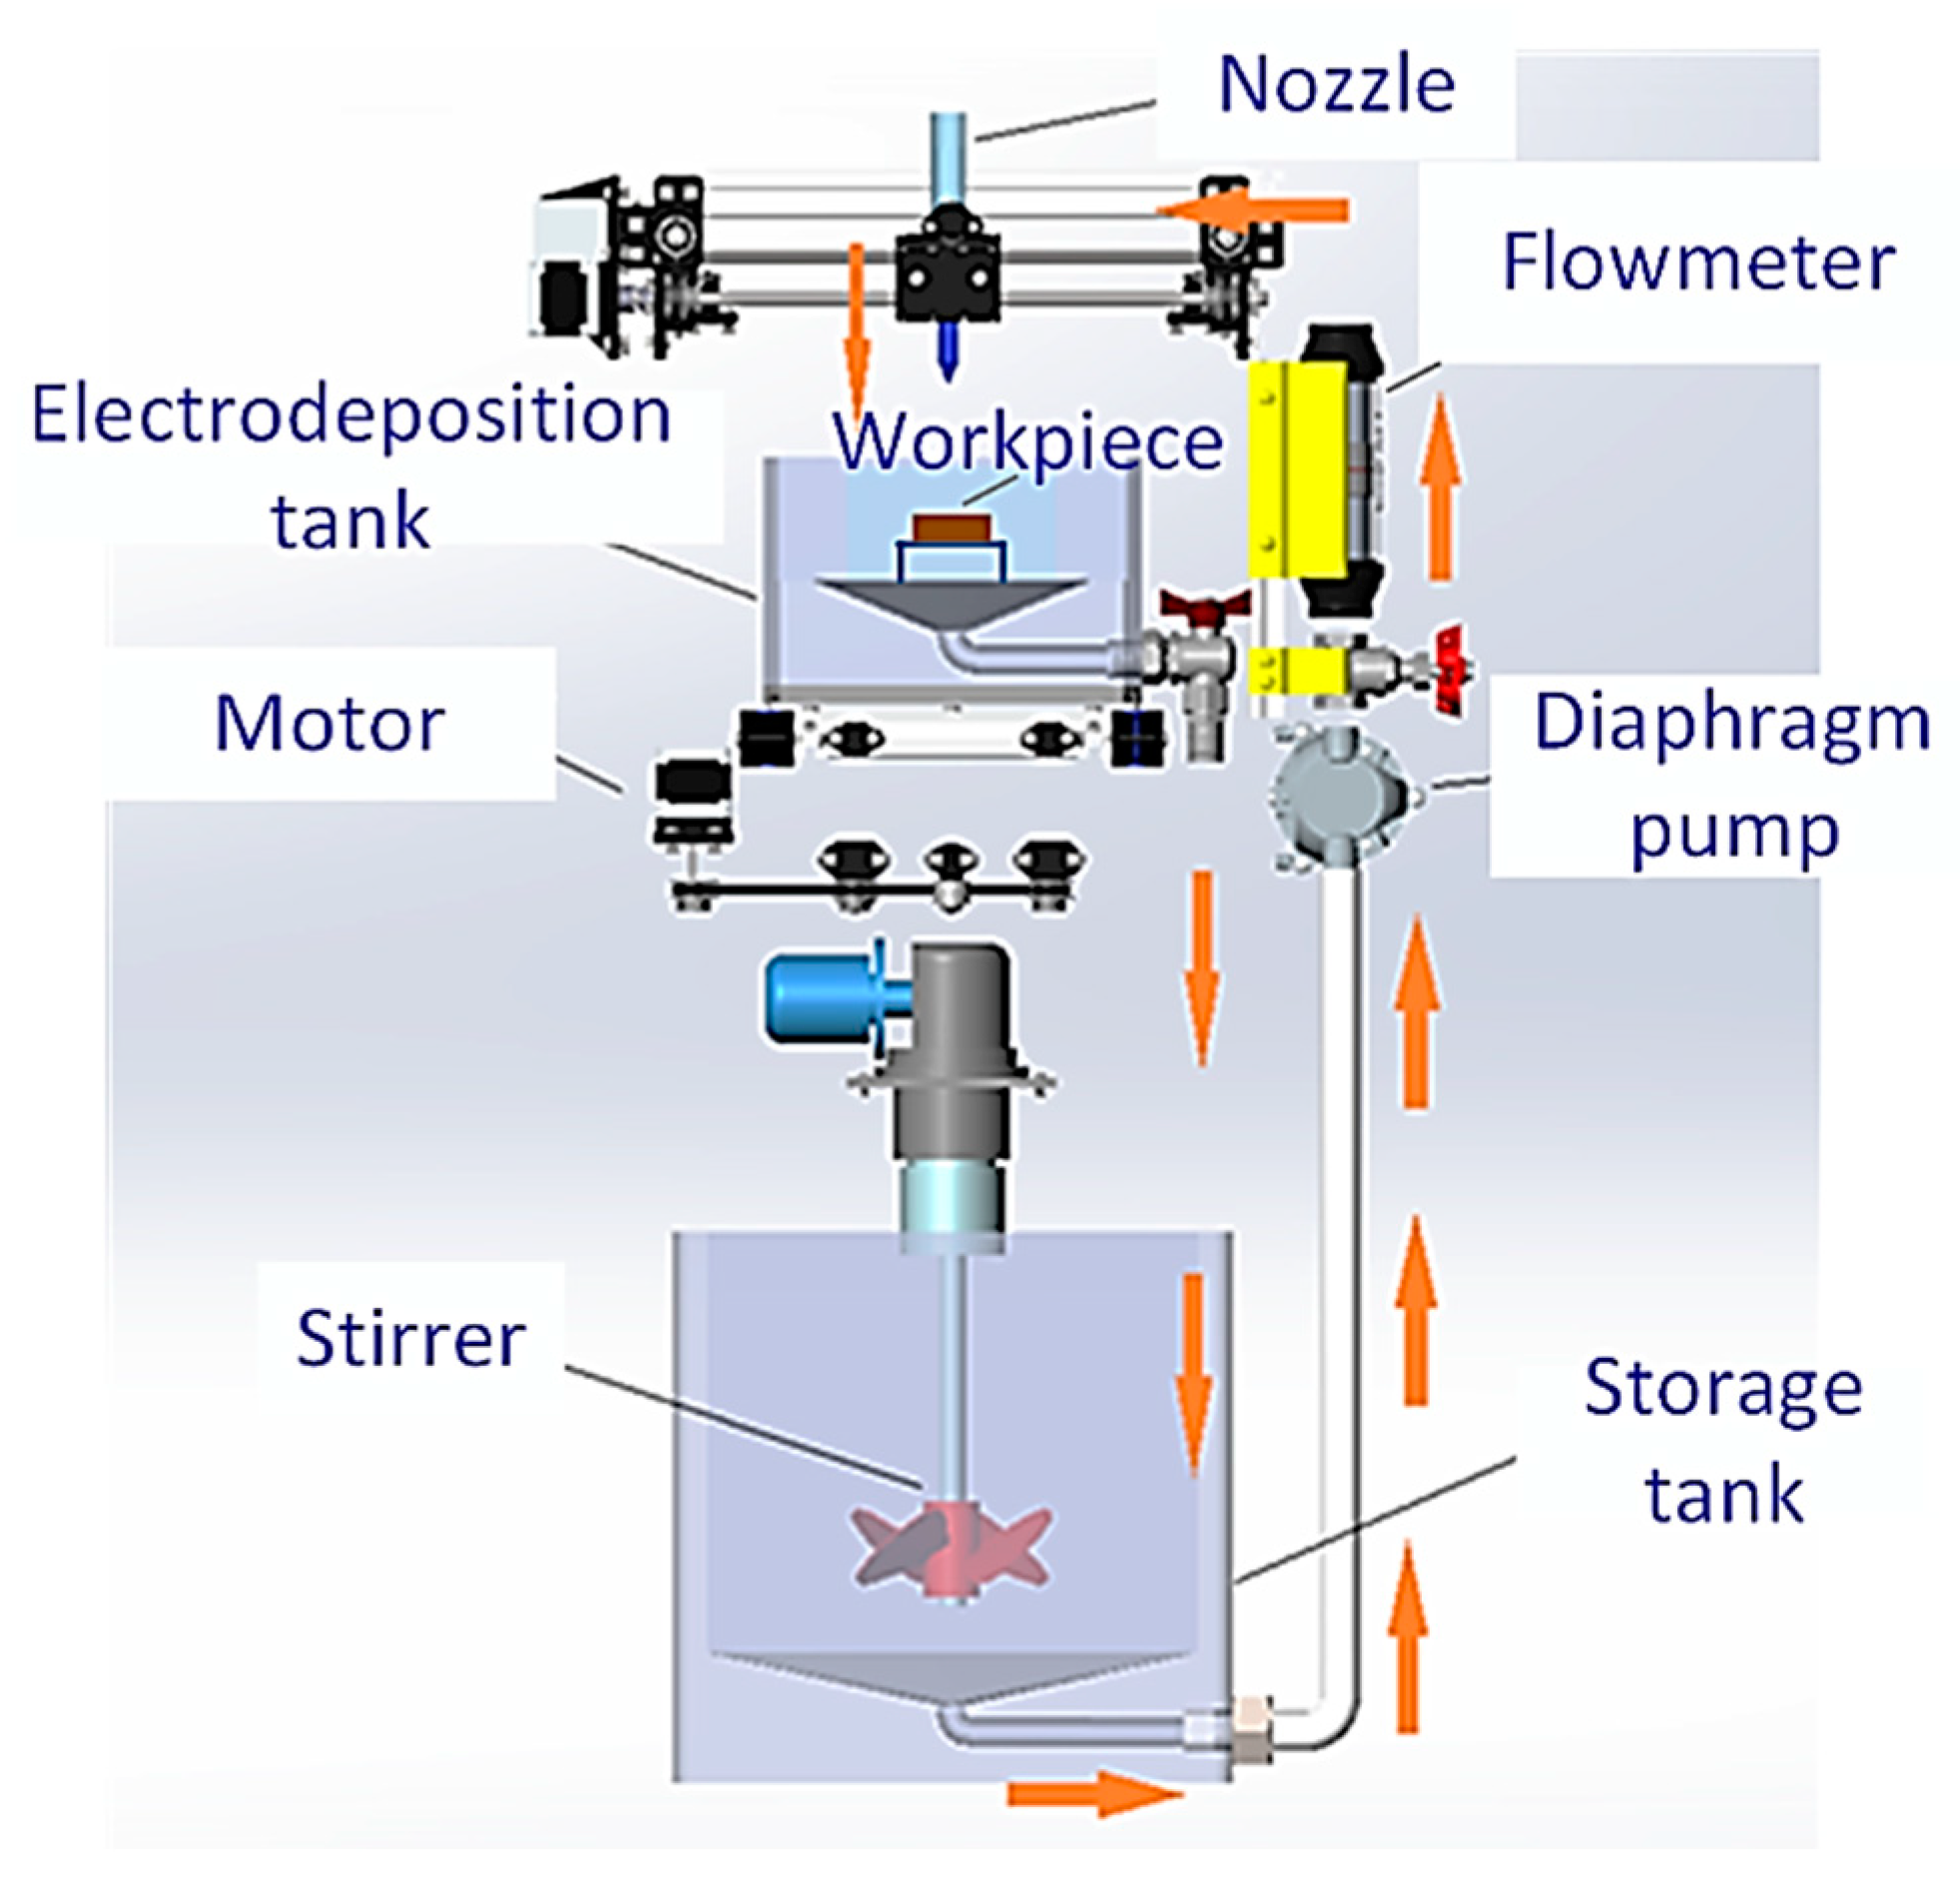
The nozzle worktable used a cross-axis structure for movement, similar to 3D printers, with three degrees of freedom to achieve movement in X, Y, and Z directions. The equipment schematic was shown in
Figure 10. A magnetic stirrer was used to provide insulation heating and stirring function for electrolyte solution. The storage tank and electrodeposition tank were connected by a self-suction diaphragm booster pump and a hose. With the diaphragm pump, the electrolyte flowed from the storage tank to the nozzle, was sprayed onto the workpiece cathode, and passed through the processing tank, then fell back into the storage tank.
The anode was made of nickel tube with a diameter of 12 mm, a wall thickness of 1 mm, a length of 36 mm, and a purity of 99.99 %. The cathode was made of brass sheet with a size of 25 mm x 15 mm x 1 mm. The outlet size of nozzle was 10 mm ×2 mm. Nickel and diamond were compositely electrodeposited on the brass in an electrolyte containing 280 g/l NiSO
4·6H
2O, 40 g/l NiCl
2·6H
2O, 40 g/l H
3BO
3, 5 g/l Saccharin and 8 g/l diamond with different current density of 40A/dm
2, 50A/dm
2, 60A/dm
2, respectively [
11,
12,
13,
14,
15,
16,
17]. The stirrer was rotated at 400 rpm and the temperature of solution was kept at 55±3 °C. the nozzle moved back and forth at a speed of 300 mm/min. The electrolyte speed of nozzle inlet was 5 L/min、8 L/min, and 11 L/min, respectively.
The surface morphology of the coating was observed with JSM-6390LA scanning electron microscope (JEOL from Japan), the surface friction coefficient of the coating was tested with SFT-2M pin disc friction and wear testing machine (Lanzhou Zhongke Kaihua Technology Development Co., Ltd.), and the corrosion resistance of the coating was tested with CHI1140C electrochemical workstation (Shanghai Chenhua Instrument Co., Ltd.).
4. Results and Discussion
4.1. Surface Morphology of the Coating for Composite Electrodeposition
The surface morphology of the composite electrodeposited coating at nozzle-cathode distances of 1 mm, 2 mm, and 3 mm is shown in
Figure 11. It was found that when the distance between the nozzle and cathode was 1 mm, the diamond particles on the coating surface were few and uneven, as shown in
Figure 11a. When the distance between the nozzle and cathode was 2 mm, the diamond particles on the coating surface increased and the uniformity was improved, as shown in
Figure 11b. When the distance between the nozzle and cathode was 3 mm, the surface of the coating has the most diamond particles and the best uniformity, as shown in
Figure 11c. This was because the velocity fluctuation at the nozzle mouth was smaller, which was conducive to particle deposition on the surface of the coating, which was consistent with simulation results.
4.2. Wear Resistance of Composite Coating
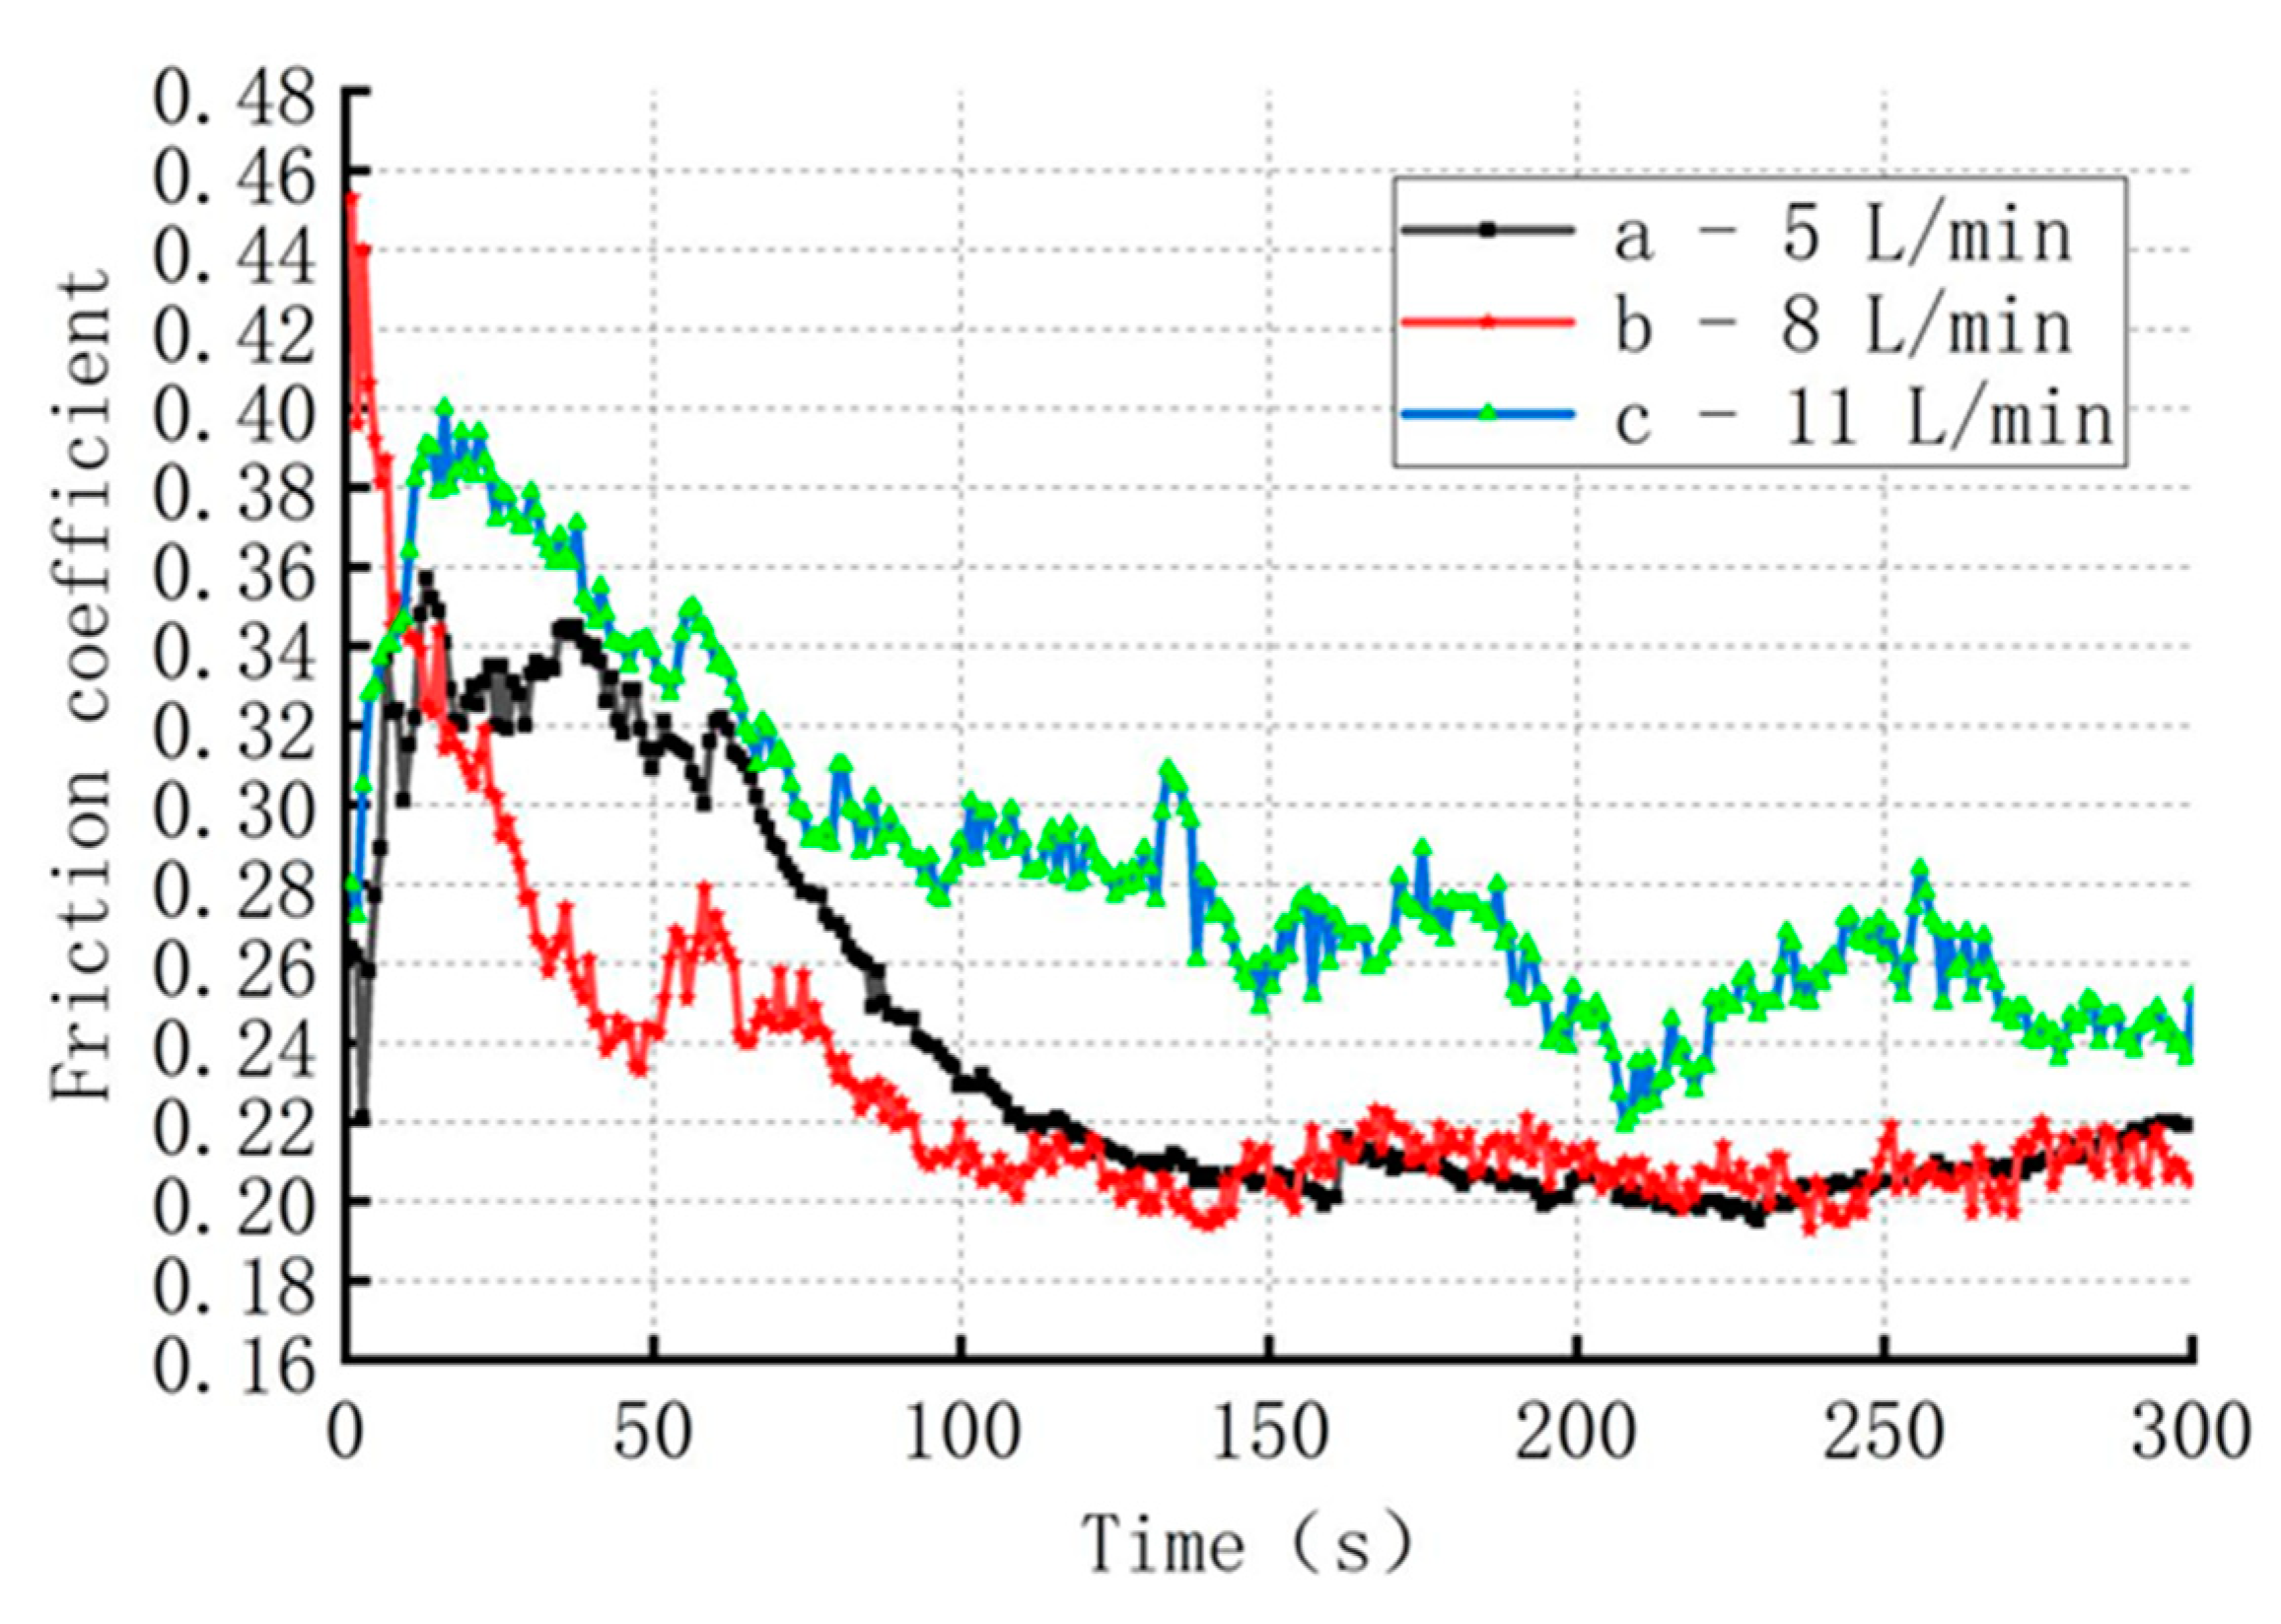
When the current density was 60 A/dm
2 and the distance between the cathode and anode was 3 mm, the effect of electrolyte flow rate on the surface friction coefficient of the coating was discussed. Sample a, b, and c corresponding to 5 L/min, 8 L/min, 11 L/min respectively. The results were shown in
Figure 12. It can be seen that the friction coefficient of sample a was 0.22 ± 0.01, and the fluctuation of the friction coefficient was smaller, indicating a uniform distribution of diamond particles on the surface of the coating. The friction coefficient of sample c was 0.24 ± 0.02, with significant fluctuations due to the flow rate of electrolyte reaching 11 L/min, which increased the velocity of the electrolyte at the nozzle outlet, reduced the stagnation time of particles and the opportunity to embed into the substrate, resulting in unstable friction coefficient of the coating. The friction coefficient of test piece b is 0.2 ± 0.005. The fluctuation of the friction coefficient was the smallest, indicating that the distribution of diamond particles on the surface of the coating was more uniform and the coating incorporated more diamond particles. When the nozzle inlet flow rate was 5 L/min, the pressure and velocity fluctuation at a position 0.2 mm above the cathode was the minimum, which was conducive to particle deposition on the surface of the coating.
5. Conclusions
Ni-diamond composite coatings were prepared using jet electrodeposition in this article. A two-dimensional axisymmetric model of the nozzle was established through multi-physics software to simulate the effect of nickel-based diamond composite coatings under different parameters. The influences of current density and distance between nozzle outlet and cathode on coating thickness were studied through electric field simulation analysis. At the same time, simulation was performed on the electrodeposition flow field, and the results showed that when the inlet flow rate of the electrolyte was lower and the distance between the nozzle outlet and the cathode was larger, the velocity and pressure fluctuations in the deposition area were less. By adding particle tracking to the multi-physics field coupling simulation, it was found that when the inlet flow rate of the electrolyte was 5 L/min, the distance between the nozzle outlet and the cathode was 3 mm, and the current density was 60 A/dm2, the composite electrodeposited coating had a higher particle content and better uniformity. The simulation results were verified through experiments.
Author Contributions
Conceptualization, Chau-Chang CHOU and Xiaoli WANG; methodology, Xiaoli WANG; software, Xin ZHOU; validation, Xin ZHOU, Lei HUANG, Xin BAO and Qian ZHANG; formal analysis, Xin ZHOU; investigation, Xin ZHOU and Xiaoli WANG; writing—original draft preparation, Xiaoli WANG; writing—review and editing, Chau-Chang CHOU and Xiaoli WANG; All authors have read and agreed to the published version of the manuscript.
Funding
This research received no external funding.
Conflicts of Interest
The authors declare no conflicts of interest.
References
- Zhao, K.; Shen, L.; Qiu, M.; Tian, Z.; Jiang, W. Preparation and Properties of Nanocomposite Coatings by Pulsed Current-Jet Electrodeposition. Int. J. Electrochem. Sci. 2017, 12, 8578–8590. [Google Scholar] [CrossRef]
- Wang, C., Shen; et al. Characterizations of Ni-CeO2 nanocomposite coating by interlaced jet electrodeposition. J. Alloys Compd. 2017, 727, pp. 269–277. [Google Scholar] [CrossRef]
- Xia, F.F. , Jia, W.C., et al., Microstructure and corrosion properties of Ni-TiN nanocoatings prepared by jet pulse electrodeposition. Ceram. Int. 2017, 43(17), pp. 14623-14628.
- Cui, W.; Wang, K.; Xia, F.; Wang, P. Simulation and characterization of Ni–doped SiC nanocoatings prepared by jet electrodeposition. Ceram. Int. 2018, 44, 5500–5505. [Google Scholar] [CrossRef]
- Tognia, M.; Feng, G.; Pan, Z.; Fan, X.; Song, C.; Wang, T. Multi-physics modelling and simulation approach with experimental validation for electrocatalytic filtration process: Part A. Optimization of electrodeposition of metal oxides on carbon membranes. J. Electroanal. Chem. 2022, 920. [Google Scholar] [CrossRef]
- Pandey, A.M.; Kapil, S.; Das, M. Numerical and experimental analysis of the localized electrodeposition (LED) based micro additive manufacturing process. Mater. Today: Proc. 2024, 98, 174–179. [Google Scholar] [CrossRef]
- Pérez, T.; Arenas, L.F.; Villalobos-Lara, D.; Zhou, N.; Wang, S.; Walsh, F.C.; Nava, J.L.; de León, C.P. Simulations of fluid flow, mass transport and current distribution in a parallel plate flow cell during nickel electrodeposition. J. Electroanal. Chem. 2020, 873, 114359. [Google Scholar] [CrossRef]
- Sharp, W. Properties and applications of composite diamond coatings. Wear 1975, 32, 315–325. [Google Scholar] [CrossRef]
- Kumar, P.; Swaminathan, N.; Natarajan, S. An extended finite element method for the Nernst-Planck-Poisson equations. Solid State Ionics 2024, 410. [Google Scholar] [CrossRef]
- Liu, Y.; Li, X. Absence of anomalous dissipation of enstrophy for 3D incompressible Navier-Stokes equations. J. Math. Anal. Appl. 2024, 536. [Google Scholar] [CrossRef]
- Wang, Z.; Shen, L.; Jiang, W.; Fan, M.; Liu, D.; Zhao, J. Superhydrophobic nickel coatings fabricated by scanning electrodeposition on stainless steel formed by selective laser melting. Surf. Coatings Technol. 2019, 377, 124886. [Google Scholar] [CrossRef]
- Shen, L.; Xu, M.; Jiang, W.; Qiu, M.; Fan, M.; Ji, G.; Tian, Z. A novel superhydrophobic Ni/Nip coating fabricated by magnetic field induced selective scanning electrodeposition. Appl. Surf. Sci. 2019, 489, 25–33. [Google Scholar] [CrossRef]
- Jiang, W. , Shen, L, et al., Mechanical properties and corrosion resistance of Ni-Co-SiC composite coatings by magnetic field-induced jet electrodeposition. J. Alloys Compd. 2019, 791, pp. 847–855. [Google Scholar] [CrossRef]
- Zhuo, W.; Shen, L.; Qiu, M.; Tian, Z.; Jiang, W. Effects of flexible friction on the properties of nanocrystalline nickel prepared by jet electrodeposition. Surf. Coatings Technol. 2018, 333, 87–95. [Google Scholar] [CrossRef]
- Mishra, R.; Balasubramaniam, R. Effect of nanocrystalline grain size on the electrochemical and corrosion behavior of nickel. Corros. Sci. 2004, 46, 3019–3029. [Google Scholar] [CrossRef]
- Hsue, W. and Chang, Y, Toward synchronous hybrid micro-EDM grinding of micro-holes using helical taper tools formed by Ni-Co/diamond Co-deposition. J. Mater. Process. Technol. 2016, 234, pp. 368–382. [Google Scholar] [CrossRef]
- Wang, X.; Chou, C.-C.; Yang, Y.-C.; Wu, R.; Lee, J.-W.; Chang, H.-Y. Tribological and mechanical properties of Cu/Ni-microdiamond bilayers on brass substrates coated by composite electrodeposition technology. Surf. Topogr. Metrol. Prop. 2020, 8, 024005. [Google Scholar] [CrossRef]
|
Disclaimer/Publisher’s Note: The statements, opinions and data contained in all publications are solely those of the individual author(s) and contributor(s) and not of MDPI and/or the editor(s). MDPI and/or the editor(s) disclaim responsibility for any injury to people or property resulting from any ideas, methods, instructions or products referred to in the content. |
© 2024 by the authors. Licensee MDPI, Basel, Switzerland. This article is an open access article distributed under the terms and conditions of the Creative Commons Attribution (CC BY) license (http://creativecommons.org/licenses/by/4.0/).
