1. Introduction
Sweat is a liquid secreted by sweat glands as a means of body cooling, commonly known as perspiration. In humans, perspiration, or sweating, primarily serves as a method for thermal regulation [
1]. Various factors can influence sweating, including high body temperature, intense physical exercise, nervous system disorders, fever caused by viral infections or serious health conditions. Its composition is predominantly water with small amounts of minerals [
2]. The major chemical components found in human sweat are sodium and chloride, with molar concentrations of approximately 10-100 mM/L and 10-78 mM/L, respectively [
3]. The key characteristic of sodium and chloride is that they are electrically charged ions, with a positive charge and a negative charge, respectively. This quality allows for their detection in aqueous solutions through electrochemical methods, with potentiometric measurement being the simplest approach. A potentiometric sensor is a type of electrochemical sensor that generates an electric potential resulting from a redox reaction involving electrically charged ions interacting with the surface of a metallic electrode. This potential is directly proportional to the molar concentration of these ions [
4].
Among the most common applications for quantifying electrolytes in sweat is the monitoring of hydration levels, including dehydration, euhydration, and hyperhydration [
5]. Dehydration, occurring within the range of 2-39 mM/L [
6,
7,
8,
9,
10], can lead to adverse effects such as headaches, weakness, dizziness, fever, impaired thermoregulation, mental function decline, and, in severe cases, seizures and death [
6,
7,
8,
9,
10]. Euhydration, which occurs within the range of 40-79 mM/L [
6,
7,
8,
9,
10], signifies normal hydration levels and proper bodily function. In the case of hyperhydration, occurring within the range of 80-180 mM/L [
5,
6,
7,
8,
9], it can also result in bodily issues, leading to nausea, vomiting, heart failure, seizures, and, in severe cases, a state of coma and death [
6,
7,
8,
9,
10]. Another potential use for monitoring salt levels in sweat is the early screening of cystic fibrosis (CF), a genetic condition that affects mucous, sweat, and gastric juice-producing cells when salt concentrations exceed 60mM/L in sweat [
11,
12,
13,
14,
15,
16,
17].
Monitoring electrolytes in sweat through the potentiometric method still presents several areas of opportunity aimed at improving: the range of operation, the duration of the electrodes and increasing the output potential. In 2023, an electrochemical sensor for chlorine detection with a flexible substrate was published, which can only operate in a range of molar concentrations of sodium in sweat at normal levels (10-100 mM/L), a maximum potential output of 200 mV and a manufacturing with a complex chemical process [
18], in 2021 a textile biosensor in the form of a sports headband, and Zinc oxide nanowires, were able to sense sodium levels up to a molar concentration of 100 mM/L and provide a maximum potential output of 150 mV [
19], during the year 2020, the publication of two sensors was reported, for the detection of sodium in human sweat during exercise tests, they were built to offer a potential output below 400 mV, which makes them limited in terms of electrical sensitivity, and their carbon electrodes and sensitive membranes require a complex chemical manufacturing process [
20,
21]. In 2019, a measurement of chlorine in sweat, via a disposable self-powered patch with a maximum output potential of 1.3 volts and an operation of just a few seconds to detect cystic fibrosis, was reported, resulting in only one positive or negative diagnosis [
22], during the same year, a sensor with flexible substrate was released, for the detection of sodium in ranges of up to 100 mM/L, and with a potential output of up to 300 mV, which allows you to monitor these levels in a normal hydration range [
23]. In 2017, a sodium sensor was released that requires the use of sweat-stimulating medications, in addition to its manufacturing requiring an elaborate chemical process [
24]. During 2016, a fully integrated sensor for the detection of sodium in sweat offered an output potential below 330 mV [
25]. And in 2015, an RFID adhesive sensor for potentiometric sodium detection was built with a complex chemical process, obtaining a maximum potential of 250 mV [
26]. Our sensor for electrolyte detection differs from the previous ones, due to the ability to obtain long-lasting electrochemical potential with higher values of output potential in a sensor of simple construction. It is worth mentioning that the method of operation of many sensors offers a concentration reading in the range of 0.01 to 0.1 M/L, and since the duration of the sensor is limited to a few minutes of operation, it is not possible to provide continuous monitoring of the electrolyte levels in human sweat. The choice of materials for electrodes, through analytical and electrochemical calculations, could increase both the output potential of the sensor and its operating range, which is why in this work the use of the Nernst model is proposed [
27,
28,
29,
30], from the standard potentials reported in the literature [
28], and from an exhaustive review in the literature on the behavior of the materials proposed for electrodes [
31,
32,
33,
34,
35,
36,
37,
38,
39], which allow the design of a sensor that increases by 66% (100 mM/L to 160 mM/L) the currently reported molar detection range of electrolytes, and an output potential above 1 volt to the currently reported range, to achieve a measurement range of electrolyte in sweat at levels up to have not been reached now and that said sensor can be part of a continuous monitoring system for electrolytes in sweat.
In this work, a potentiometric monitoring system in the form of a patch was designed and built, which allows the detection of molar amounts of electrolytes in sweat in real time, in a portable and non-invasive way through the generation of a long-term electrochemical potential duration.
2. Materials and Methods
2.1. Electrolyte Sensor
2.1.1. Materials Selection
A preliminary analysis was conducted, taking into account the standard reduction potentials reported in the literature to guide the material selection process. Two cell configurations were considered: one constructed with Zinc/Copper electrodes and another with Magnesium/Copper electrodes. In both cases, Zinc and Magnesium were chosen as anodes, while copper served as the cathode. This selection was based on the high electrical potential achieved, the availability of these materials, and their negligible toxicity, ensuring safe contact with human skin.
Validation using expression 3 confirmed that, under standard conditions, a Zn/Cu cell can yield an approximate potential of 1.28 volts. Furthermore, with a Mg/Cu cell, as per expression 6, a potential of around 2.88 volts is achievable. Based on this analysis, magnesium and copper were selected as the anode and cathode, respectively, in the construction of the sensor.
2.1.2. Chemicals and Samples
NaCl solutions (Meyer 99%) were prepared with deionized water of 18 MΩ·cm at molar concentrations from 0.02 M/L to 1 M/L, at room temperature (25°C). For in situ tests, natural eccrine sweat of 3 patients (between 20 and 40 years of age). Magnesium and copper sheets with a thickness of 0.3 mm to obtain the electrodes (Fisher’s Labs S.A. de C.V.). White flexible F39 (Resione) 3D printer resin, for printing the patch design, which complies with RoHS (restriction of hazardous substances) and REACH (registration, evaluation, authorization and restriction of chemical substances) regulations. Transparent glue (DUO), waterproof and hypoallergenic, in a 7 grams presentation.
2.1.3. Electrical Measurements
At the laboratory, initial potential and current measurements were carried out using a Keithley 2401 digital multimeter, subsequently, during in situ tests, potential readings were performed utilizing an Attiny85 microcontroller (Atmel), Nanoconduct® Model 1030 certified medical equipment for electrolyte analysis (Polanco medical laboratory, S.A. de C.V.).
2.2. Sensor Sensing Principle
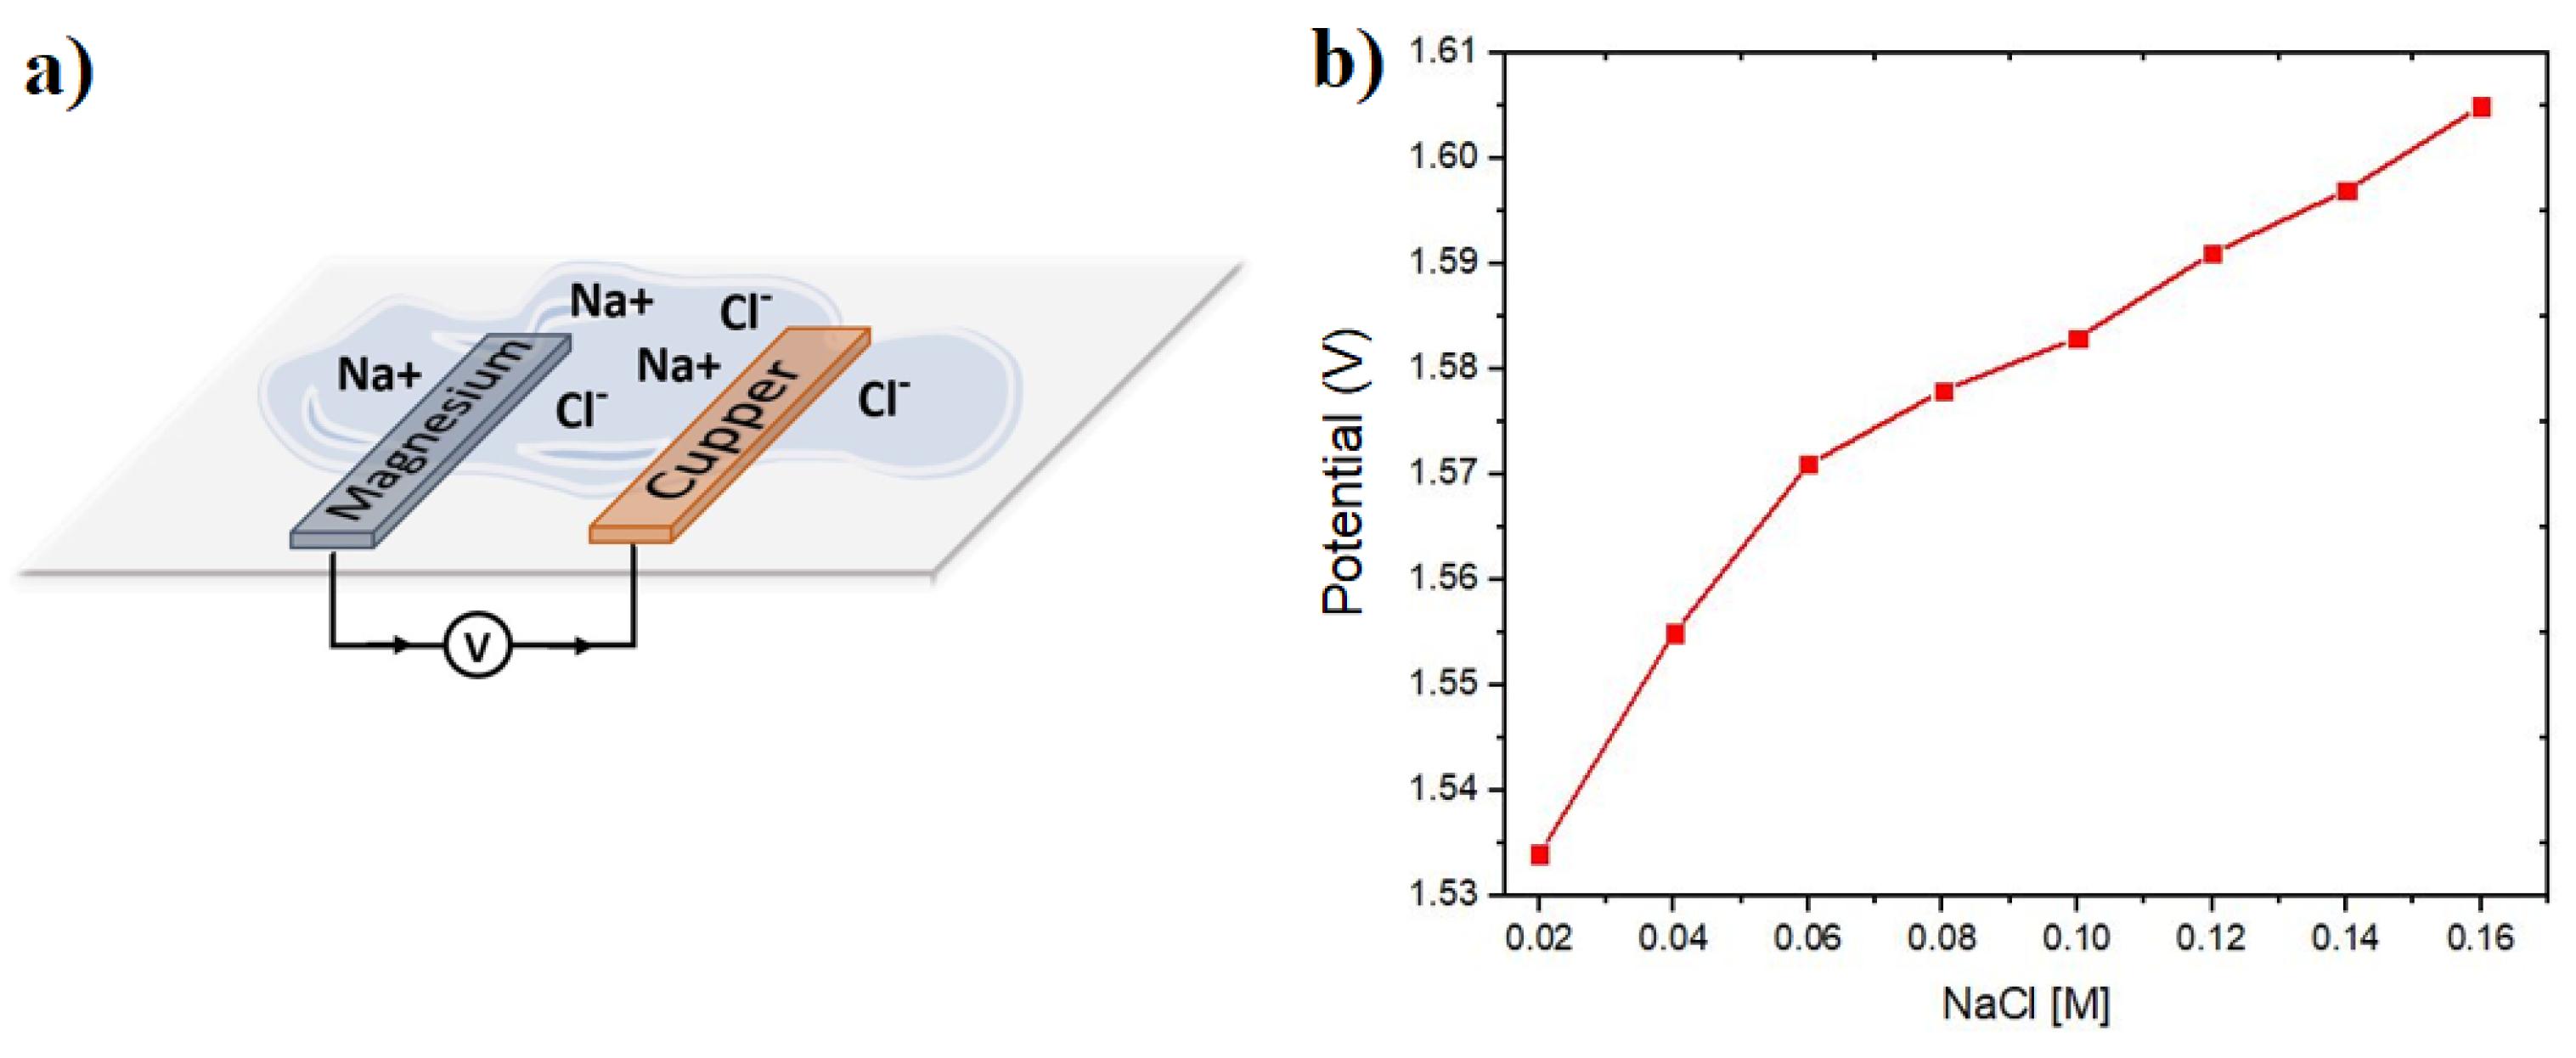
The electrolyte sensor consists of two electrodes, the magnesium anode and the copper cathode, fixed on the side of the substrate that will be in contact with the skin, as illustrated in
Figure 1a. These electrodes are positioned with a separation distance of 3 mm. Upon contact with NaCl electrolyte or eccrine sweat, the electrodes initiate an electric current flow, traveling from the anode to the cathode through an oxidation-reduction reaction. The potential in volts generated by the electrochemical reaction is directly proportional to the molar concentration of NaCl in the electrolyte.
Figure 1b shows the open circuit potential output without load (V
OCP) of the sensor built with the Mg/Cu materials, previously selected in the experimental section, where a Nernstian behavior is observed, which according to the increase in concentration of ions in the electrolyte, an increase in the sensor potential output is observed. According to existing literature, it is established that the primary sensor design variable influencing the achieved potential is the electrode area. A larger contact surface area directly correlates with increased ionic exchange within the electrolyte, leading to a greater potential output.
The open circuit potential is influenced by ohmic contributions from the interfaces formed between the electrodes and the contacts, as well as between the contacts and the connecting wires. To enhance the consistency of the electrolyte sensor, a systematic investigation of the output potential was conducted.
2.2.1. Electrochemistry
The curve shown in
Figure 1b demonstrates a Nernstian behavior of the potential output of the sensor. The Nernst model determines the output potential of a galvanic cell by incorporating the standard reduction potentials of each metal electrode, along with the ideal gas and Faraday constants. Additionally, it accounts for the molar concentrations of ions present in the electrolyte, providing a comprehensive framework for understanding the sensor’s potential output.
The open circuit voltage of the galvanic cell results from an oxidation-reduction reaction occurring at the magnesium anode and the copper cathode. When these electrodes come into contact with an electrolyte containing NaCl, they are connected through a conductor. The magnesium (Mg) at the anode is initially in a neutral state but releases two electrons, which are then attracted to the copper cathode due to its higher electronegativity. As a consequence of gaining electrons, the copper becomes negatively charged and must counterbalance this negativity by interacting with the Na+ cations present in the electrolyte. The Mg2+ cations released by magnesium in the electrolyte also seek to neutralize themselves by interacting with the Cl– anions. This interplay allows the redox reaction to persist, ensuring the continuity of the open circuit voltage.
The reactions that occur separately at each metal electrode are described in Equations (7) and (8).
2.3. Hydration Level Meter Patch
2.3.1. Patch
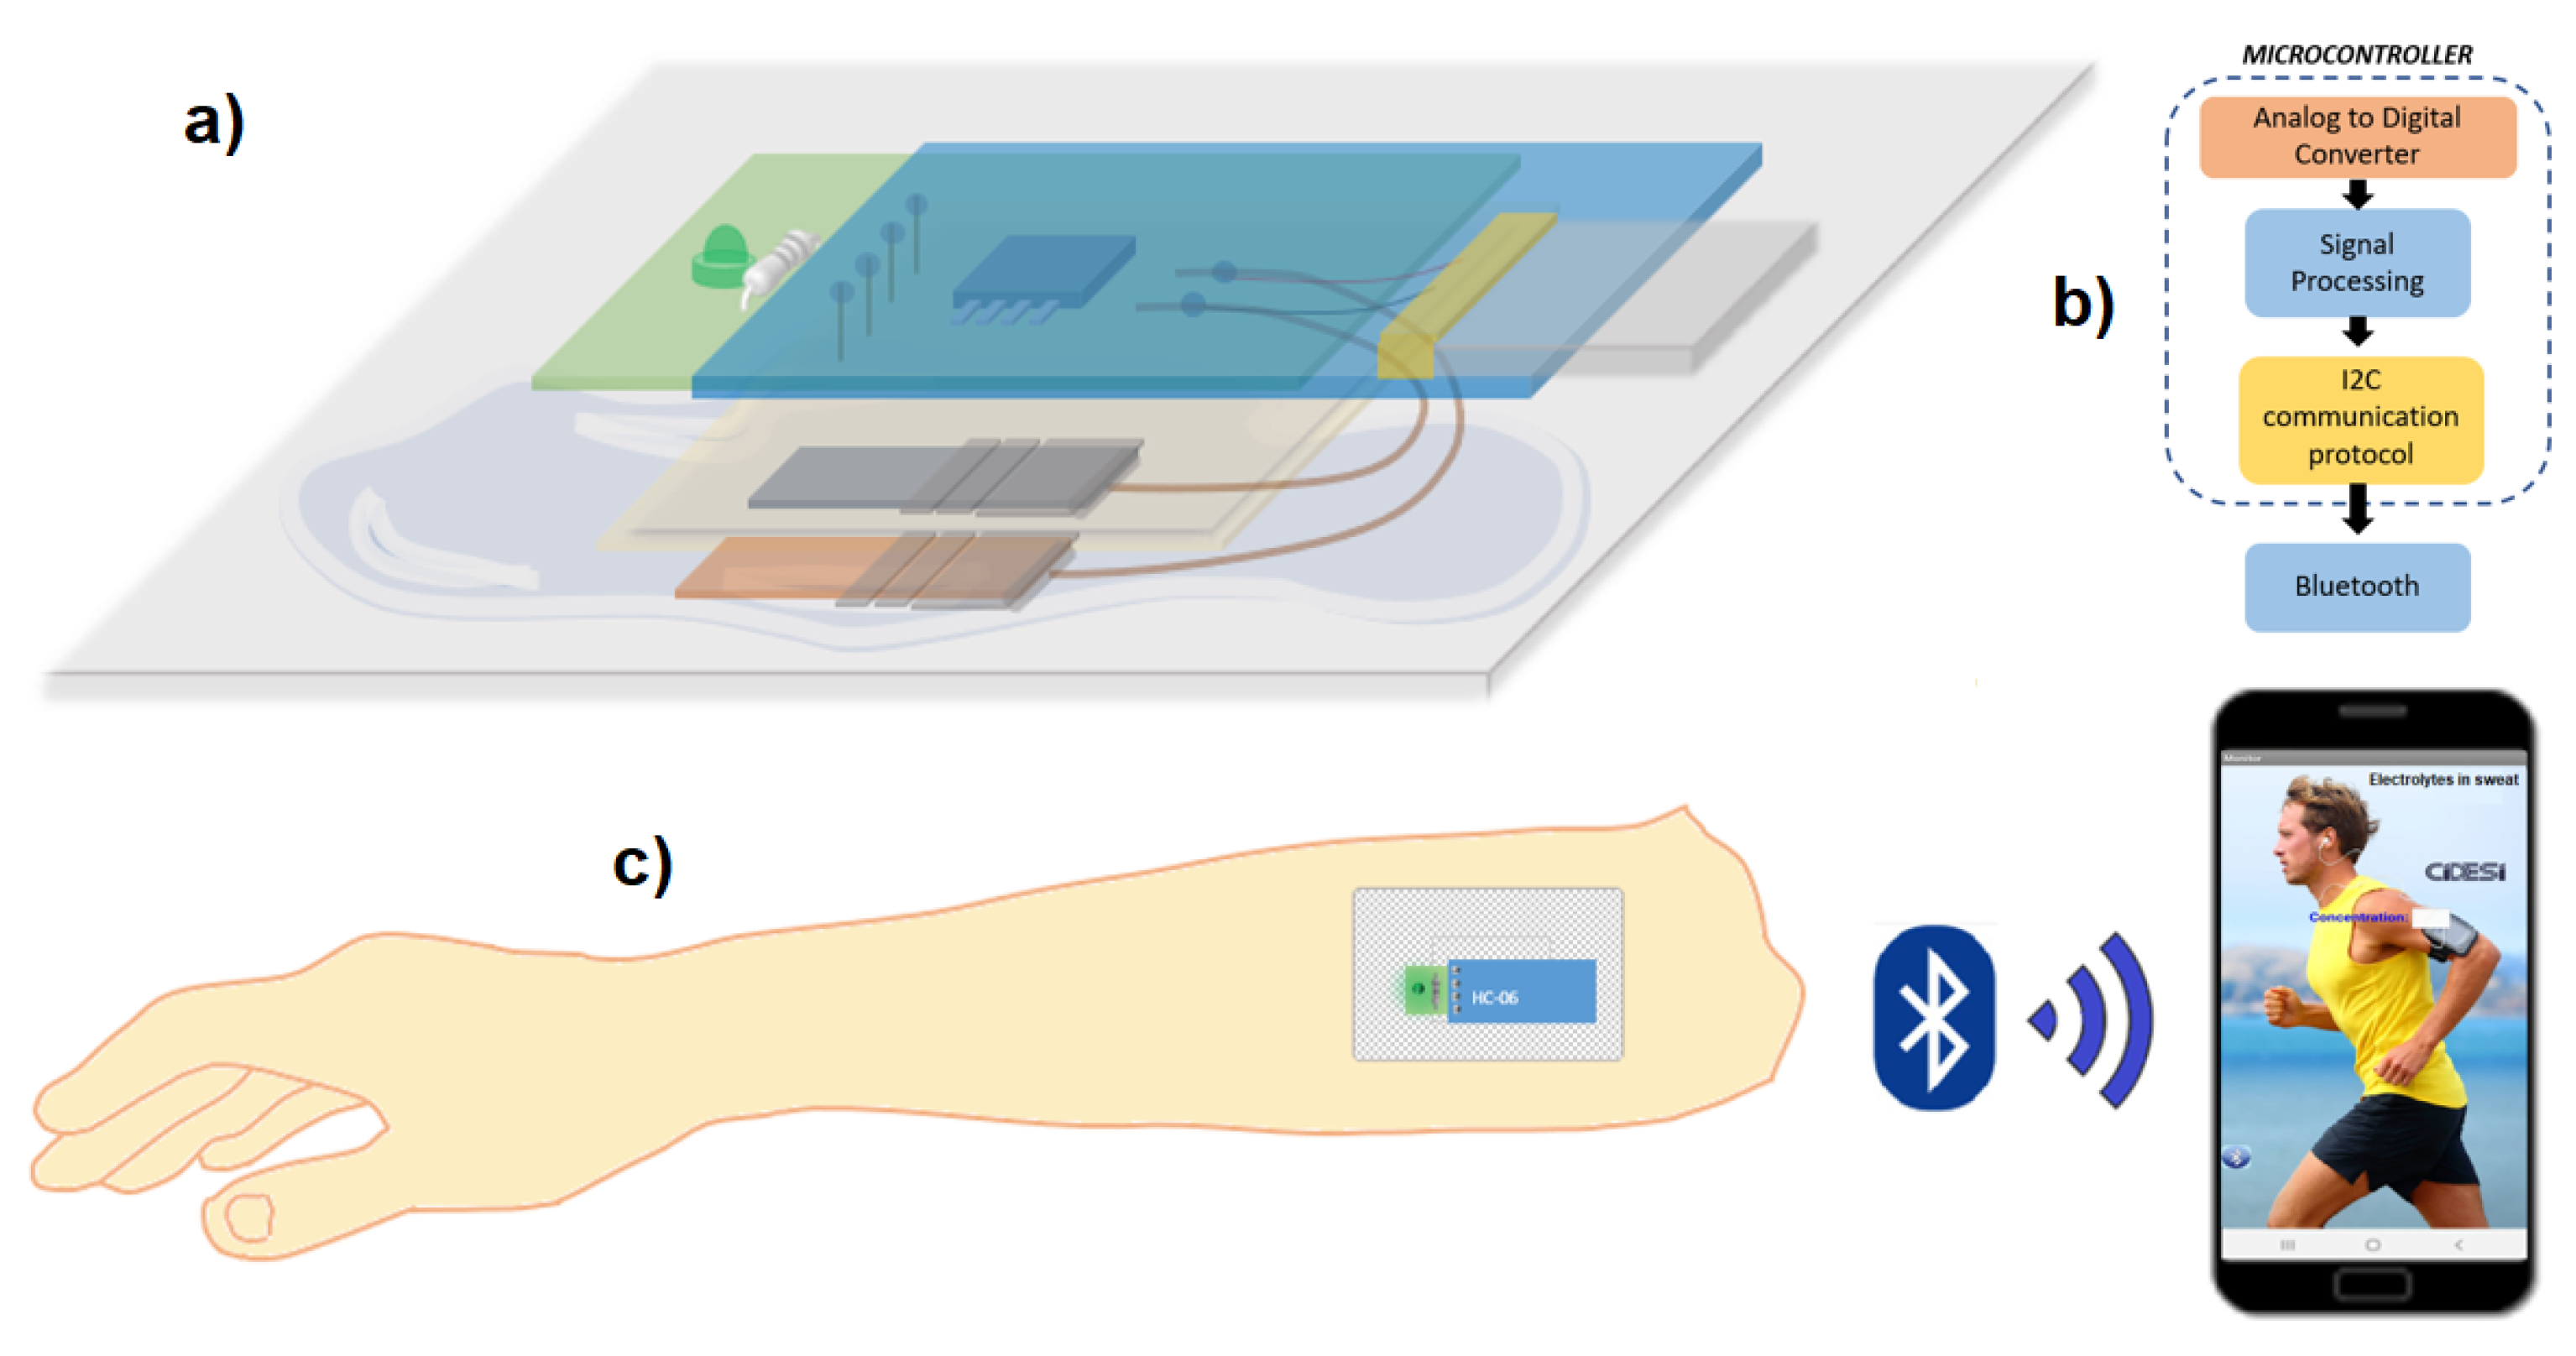
Following validation of the sensor’s operating principle, a patch was designed to be attached to the skin to monitor electrolyte levels in a subject’s sweat. The flexible patch was designed on the SolidWorks platform as shown in
Figure 2, with dimensions of 6 x 4 cm, with a thickness of 1 mm, and printed on a resin 3D printer (Uniformation GK Two), which can be adhered to the skin with transparent glue (DUO). The design of the patch is capable of circulating sweat flow, to update potential measurements due to electrolytes, thanks to its 400 micrometer channels.
The process of obtaining the electrodes involved cutting Mg and Cu sheets, each with a thickness of 0.3 mm, using a rotating fiberglass disc to define the electrode area (0.48 cm2). Subsequently, the electrodes were fixed in the custom designed cavities at the bottom of the patch, the cavities are capable of retaining a volume of 15 microliters of sweat, sufficient to initiate the surface reaction on the electrodes, separated by 3 mm. A layer of transparent adhesive tape (3M) was placed between the patch and the instrumentation to prevent sweat from flowing between the circuit connections. The electronics were then secured with transparent silicone (SISTA F109), to secure all sensor components and mitigate the risk of detachment due to user movement.
2.3.2. Circuit and Communication
To record the sensor measurements, instrumentation was designed capable of recording the potential values in volts of the output of the electrolyte sensor. A PCB card of 3.5 x 1.3 cm area was designed with an indicator LED with bias resistor and an on/off switch, said card is connected and powered by a lithium polymer battery (3.7 V, 40 mAh). One channel of the analog to digital converter of the Attiny85 microcontroller was used to read the analog signal from the sensor and convert it into a digital signal, the digitized value was compared with four different ranges of potentials, determined by the electrical characterizations of section 3, the result in the form of a message is sent through the serial channel to a Bluetooth model HC-06. Connections for Bluetooth were added to the PCB design so that the result is transmitted with a speed of 9600 baud.
2.3.3. Mobile App
The sensor potential values are analyzed in the attiny85 microcontroller, and it sends a result dependent on said value, sending the possible messages: “High”, “Normal”, “Low” and “Critical” via Bluetooth to a mobile application to Android system developed in App Inventor (Massachusetts Institute of Technology), which has a text box that displays the message received by Bluetooth, as shown in
Figure 3c.
3. Results
3.1. Testing and Characterization
3.1.1. Experiment Design
To test the proposed Mg/Cu materials and know which sensor design parameters have the most impact on the output potential a 2^4 design of experiments was employed, as outlined in
Table 1, encompassing four critical sensor design variables: material, area, position, and separation of the electrodes. This approach aimed to identify the optimal combination that yields the most favorable electrochemical potential results for the cell design. The experiment utilizes a 0.1 M/L concentration of NaCl, resulting in the execution of 16 treatments and 64 experimental tests. The focal point of measurement was the open circuit potential of the sensor, recorded in volts.
Following a comparison of means using the Tukey method with a 95% confidence level, it was established that sensors exhibiting the most substantial potential shared specific design variables. Notably, the optimal configuration involves Mg/Cu electrodes, an electrode area of 0.48 cm², a vertical electrode position, and a 3 mm separation between them. These discerned outcomes from the design of experiments guided the production of the definitive version of the sensor.
3.1.2. Sensor Precision
In the initial phase of sensor validation, a comprehensive statistical analysis was carried out to assess its precision. This involved calculating both the standard deviation and sampling error. A total of 51 experimental tests were executed across three distinct molar concentrations of NaCl: a low concentration of 0.02 M/L, an intermediate concentration of 0.1 M/L, and a high concentration of 0.8 M/L.
The obtained experimental open circuit potential data were utilized to calculate sample means, standard deviations, and ultimately, the sampling error (as detailed in
Table 2). Remarkably, the calculated error was zero, leading to the conclusion that the sensor exhibits suitable precision for consistently generating repeatable potential values during constant measurements.
3.1.3. Electrical Characterization
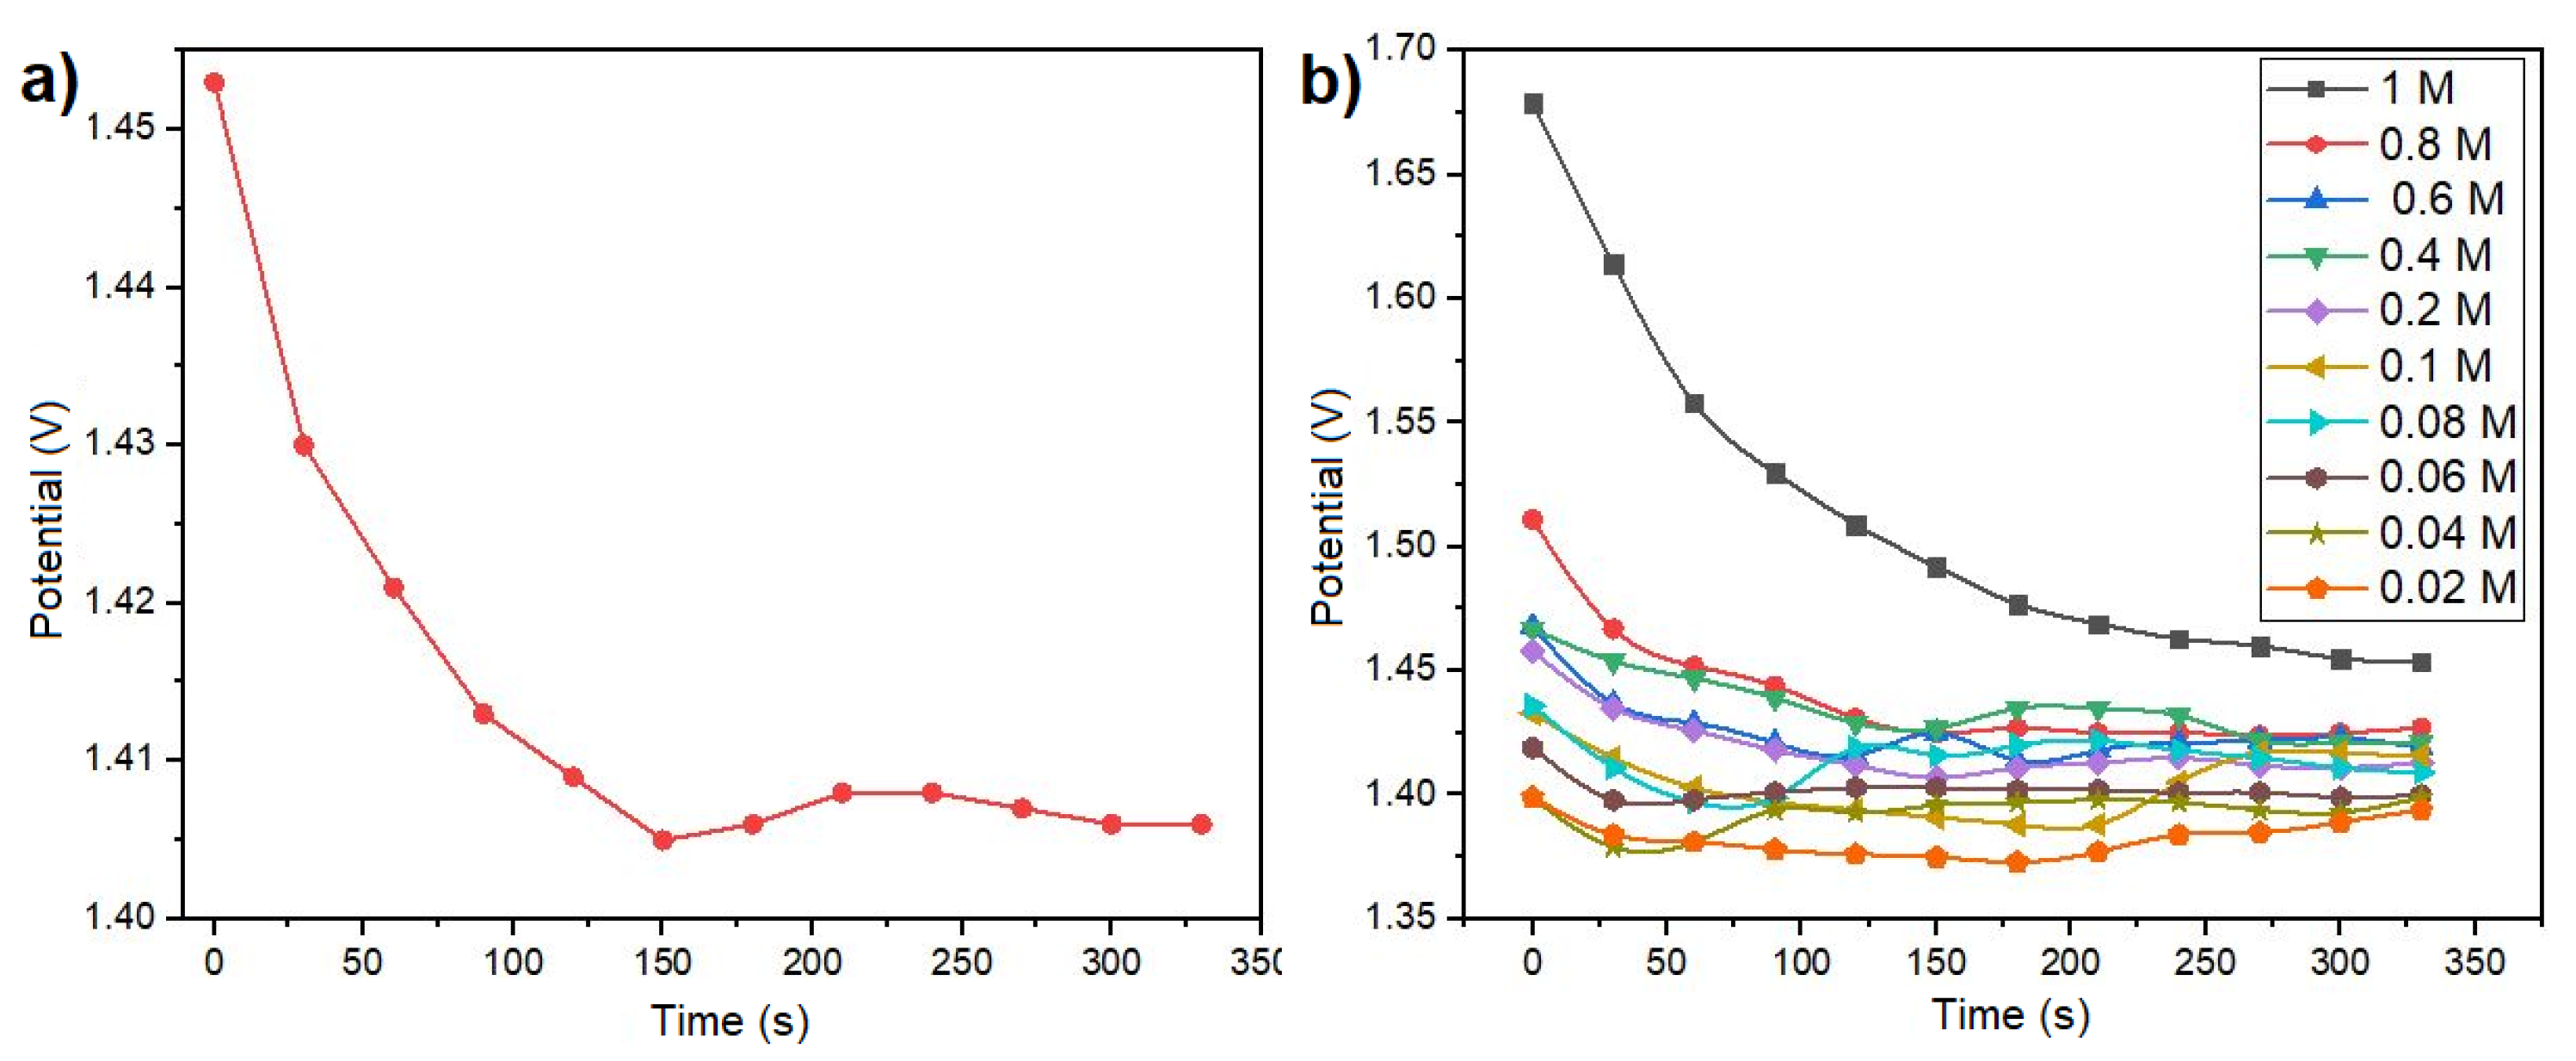
The spontaneous reaction within the galvanic cell manifests as the polarization curve depicted in
Figure 4a. This curve illustrates the ionic exchange between the metal and the electrolyte, resulting in an initial peak potential within the first seconds. Subsequently, the potential decreases and stabilizes at a specific value. The point of stabilization corresponds to a particular molar concentration, as illustrated in
Figure 4a. Utilizing diverse molar concentrations ranging from 0.02 to 1 M/L of NaCl in solution, the open circuit potential results depicted in
Figure 1b facilitated the calculation of sensor sensitivity at 0.335
V/
M, using linear regression on the most linear section. This was achieved by applying linear regression to the potential curve within its most linear region.
Figure 4b presents the open circuit potential results obtained for various molar concentrations of NaCl, encompassing the range pertinent to the presence of electrolytes in human sweat. The potential results illustrated in
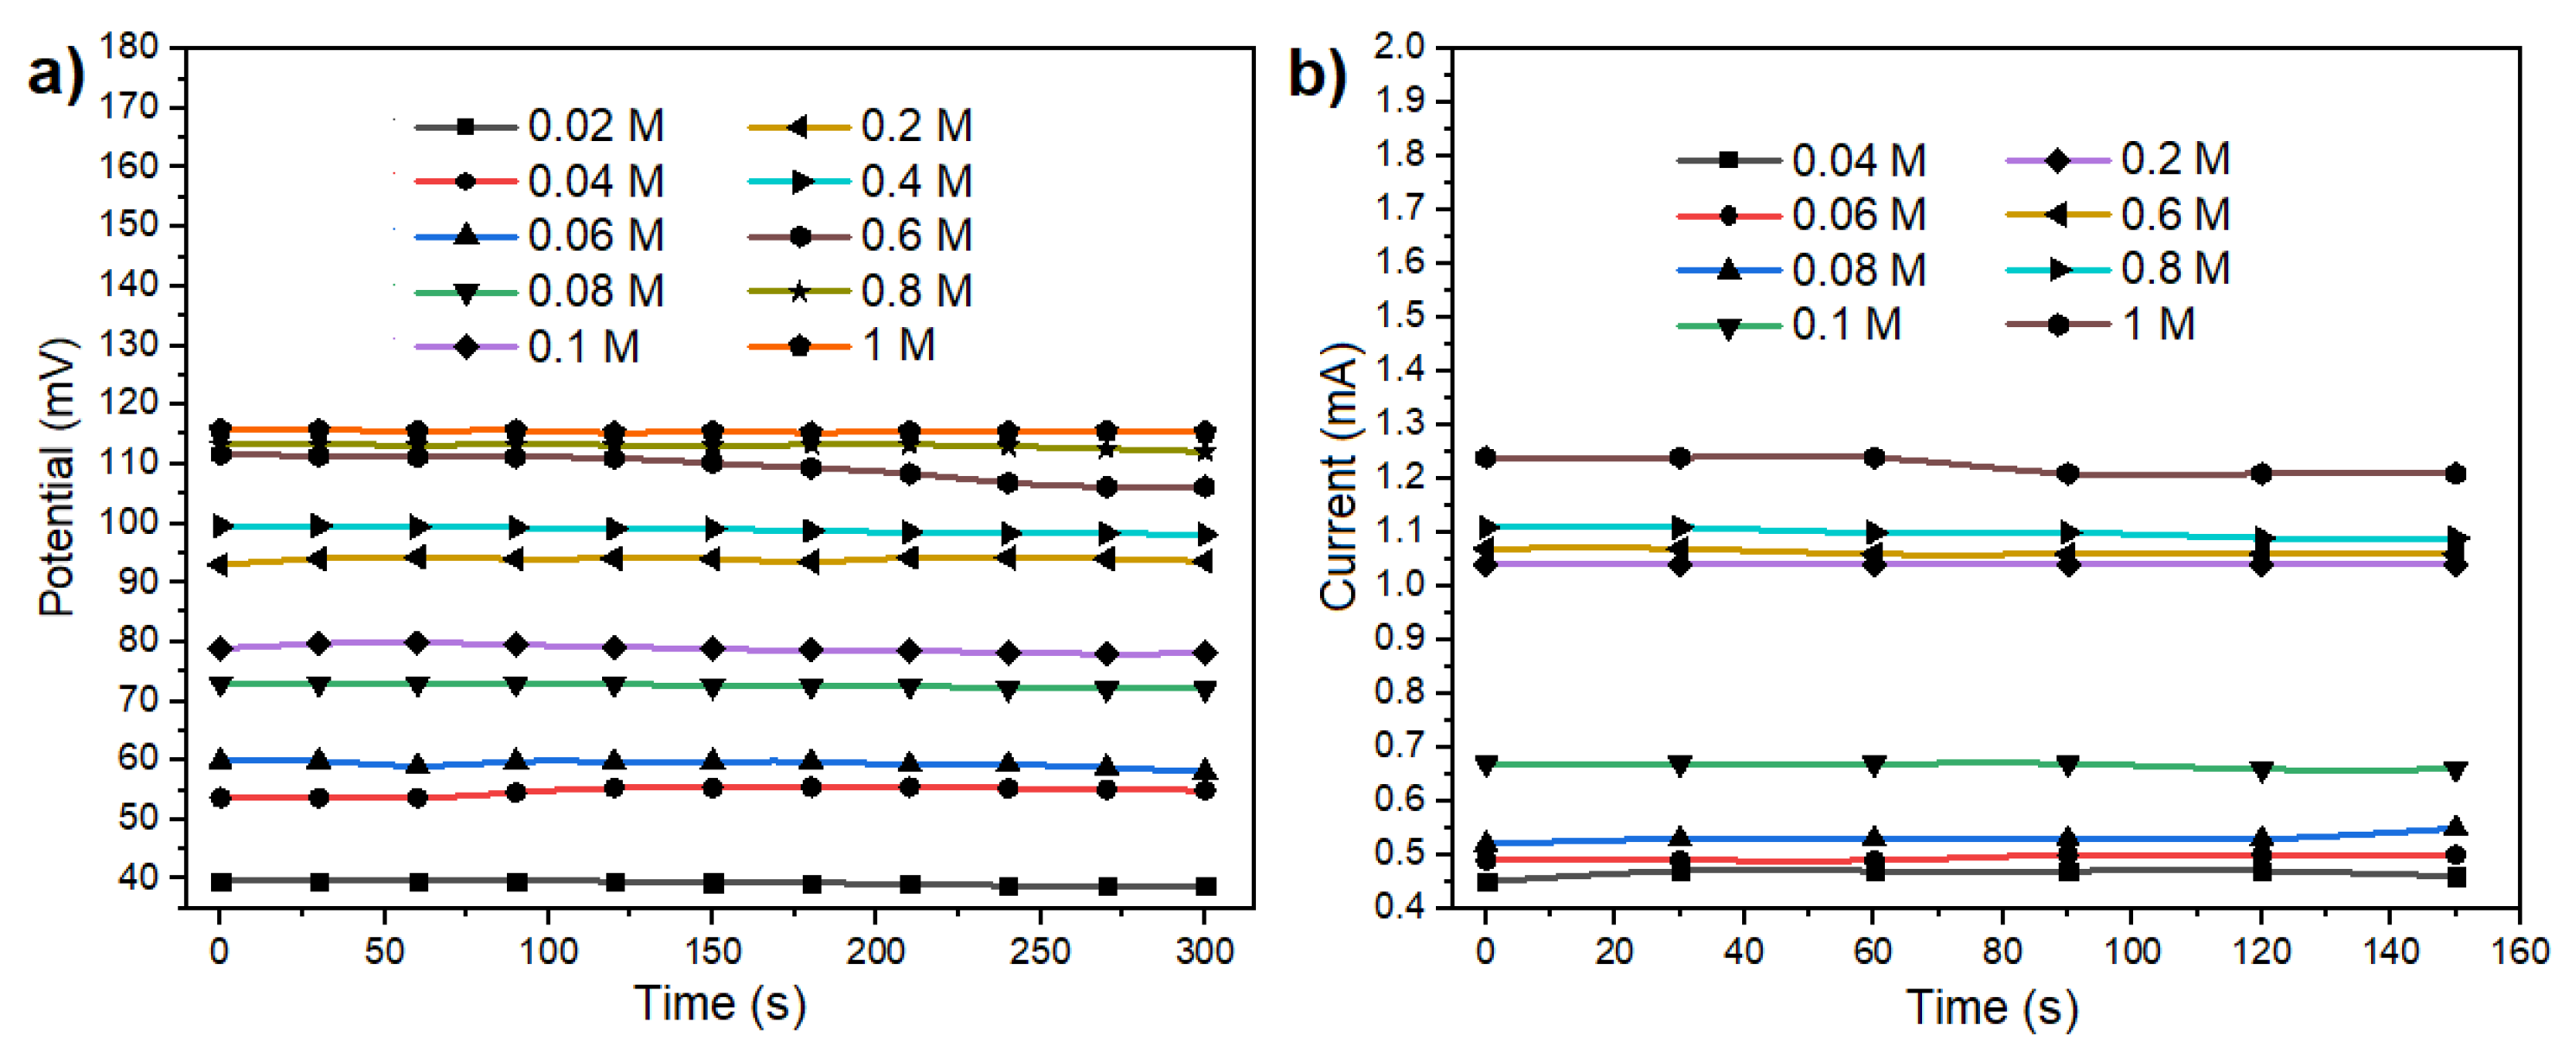
Figure 4b exhibit distinct characteristics for each concentration. The voltage output range spans from 1.37 to 1.68 V. The unique voltage value associated with each concentration signifies that the sensor is useful for monitoring electrolytes levels in body sweat, making it particularly relevant for applications involving skin-secreted sweat analysis. As the sensor operates in a galvanic cell configuration, allowing the extraction of electrical current from a chemical reaction, experiments were conducted to evaluate its performance as a battery. To achieve this, a load resistor (R
Load = 68 Ohms) was connected to the system. This resistor simulates the current consumption of a microcontroller and a Bluetooth Low Energy device (20 mA). The application of Ohm’s law, as expressed in equation 9, facilitated the analysis of current and voltage results under these simulated conditions.
Figure 5a,b show the fluctuation of both current and potential across the various concentrations tested. Despite the potential being diminished to the millivolt range, discernible values persist for each concentration under examination.
3.1.4. Human Sweat Tests
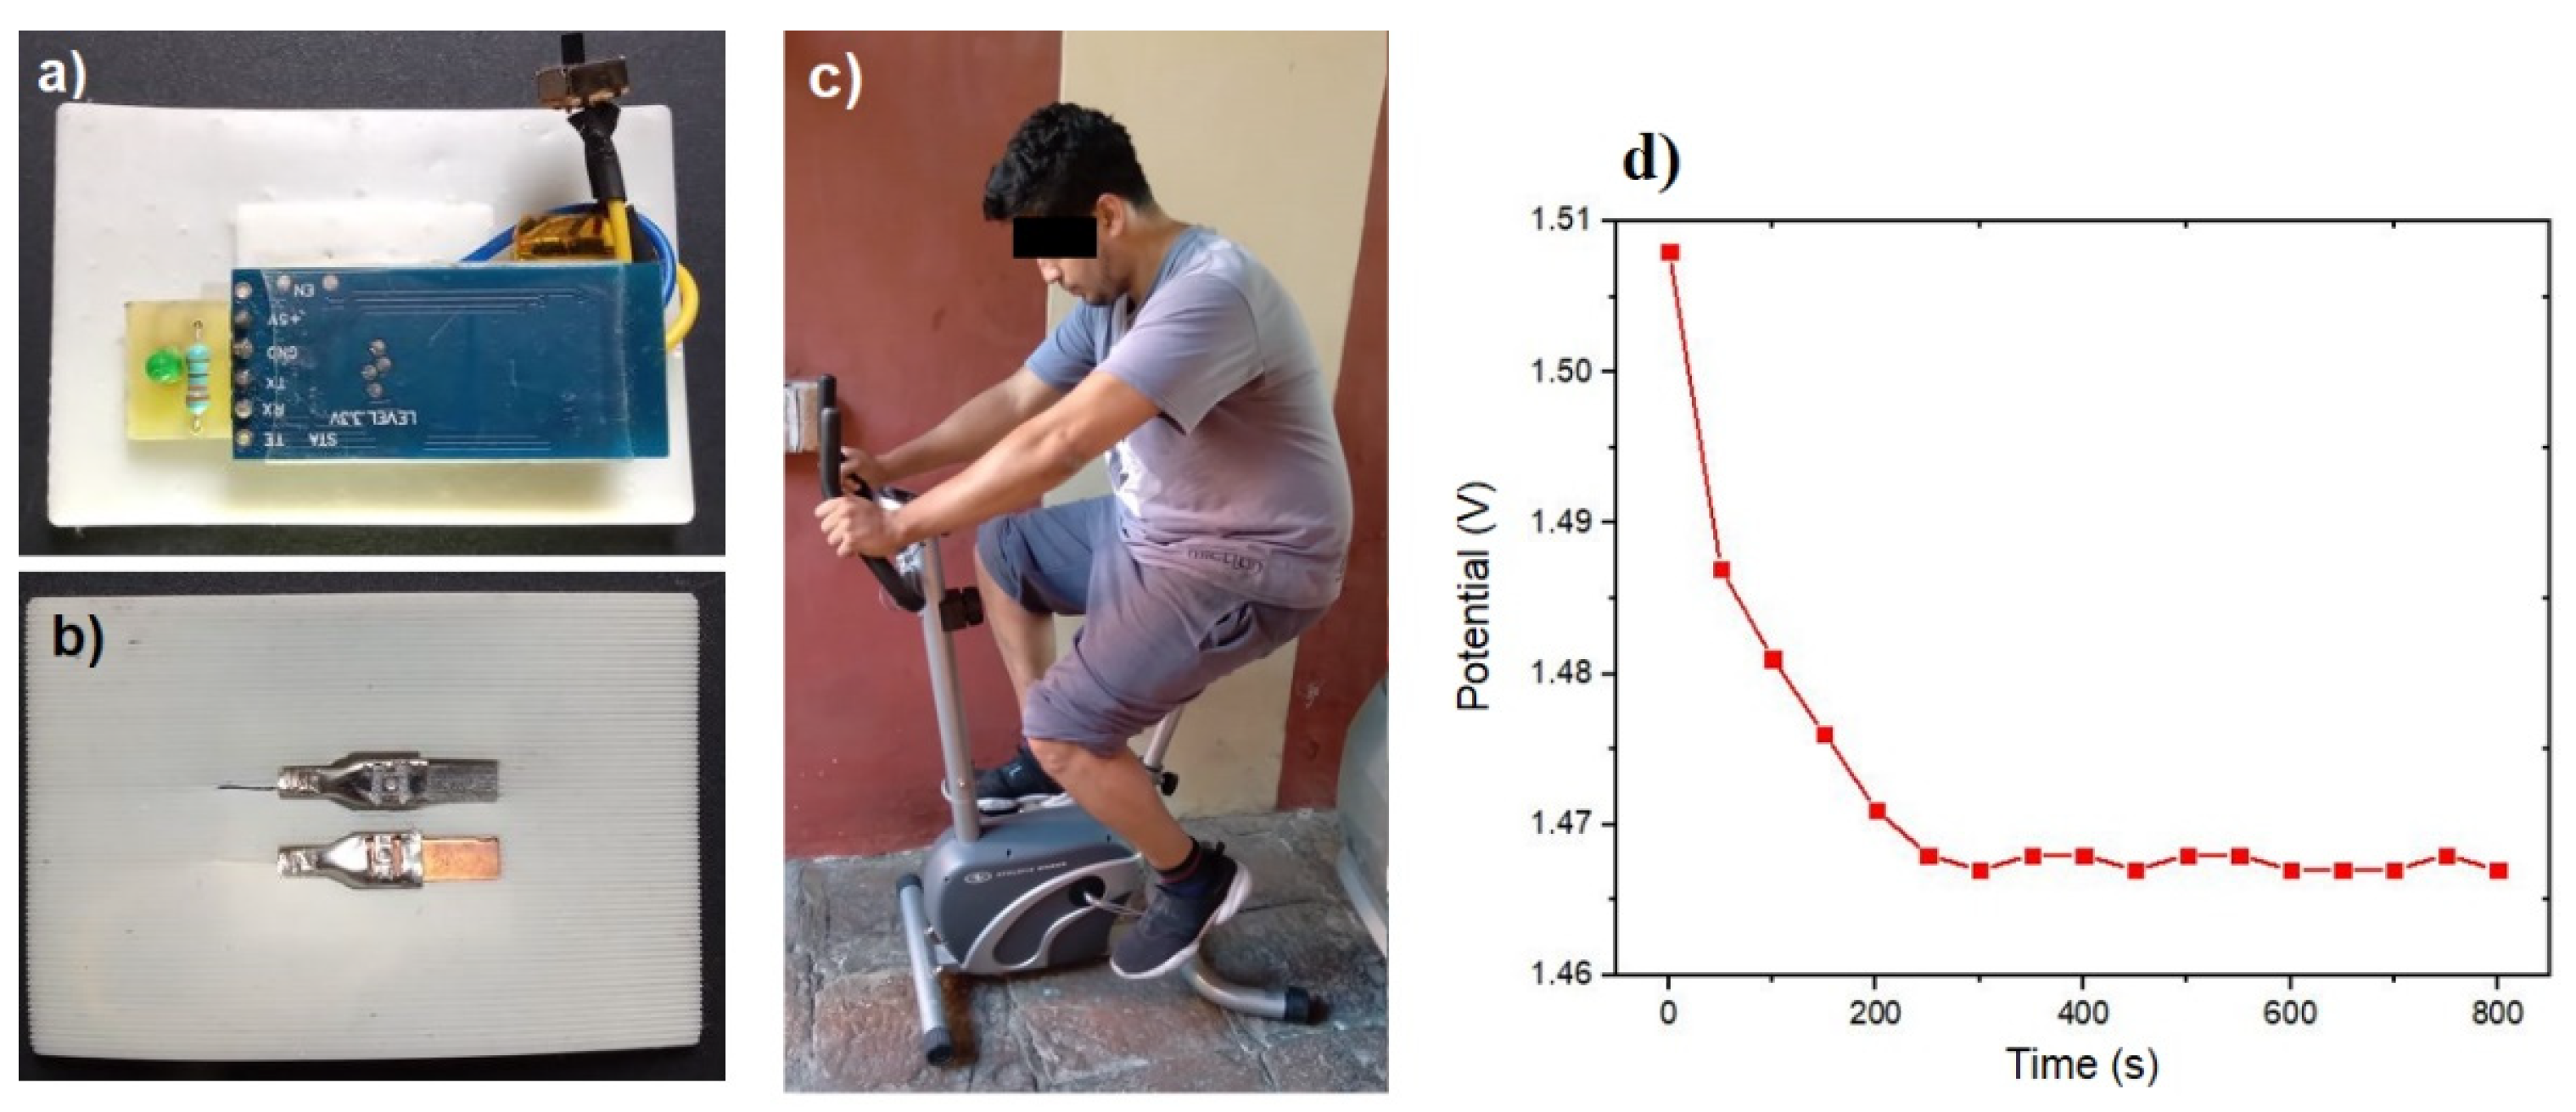
Controlled in situ tests were conducted in order to validate the sensor efficacy in detecting electrolyte concentration in sweat. The initial test involved a subject on a stationary bicycle, as depicted in
Figure 6c. This test confirmed that the sensor potential, illustrated in
Figure 6d, exhibited a consistent behavior and potential value comparable to that shown in
Figure 4a. The observed pattern included an instantaneous reaction and a specific value for the electrolyte concentration present in the sweat after the initial 200 seconds. This validation allowed us to verify the analytical calculations and their usefulness in the detection of electrolyte levels in human sweat.
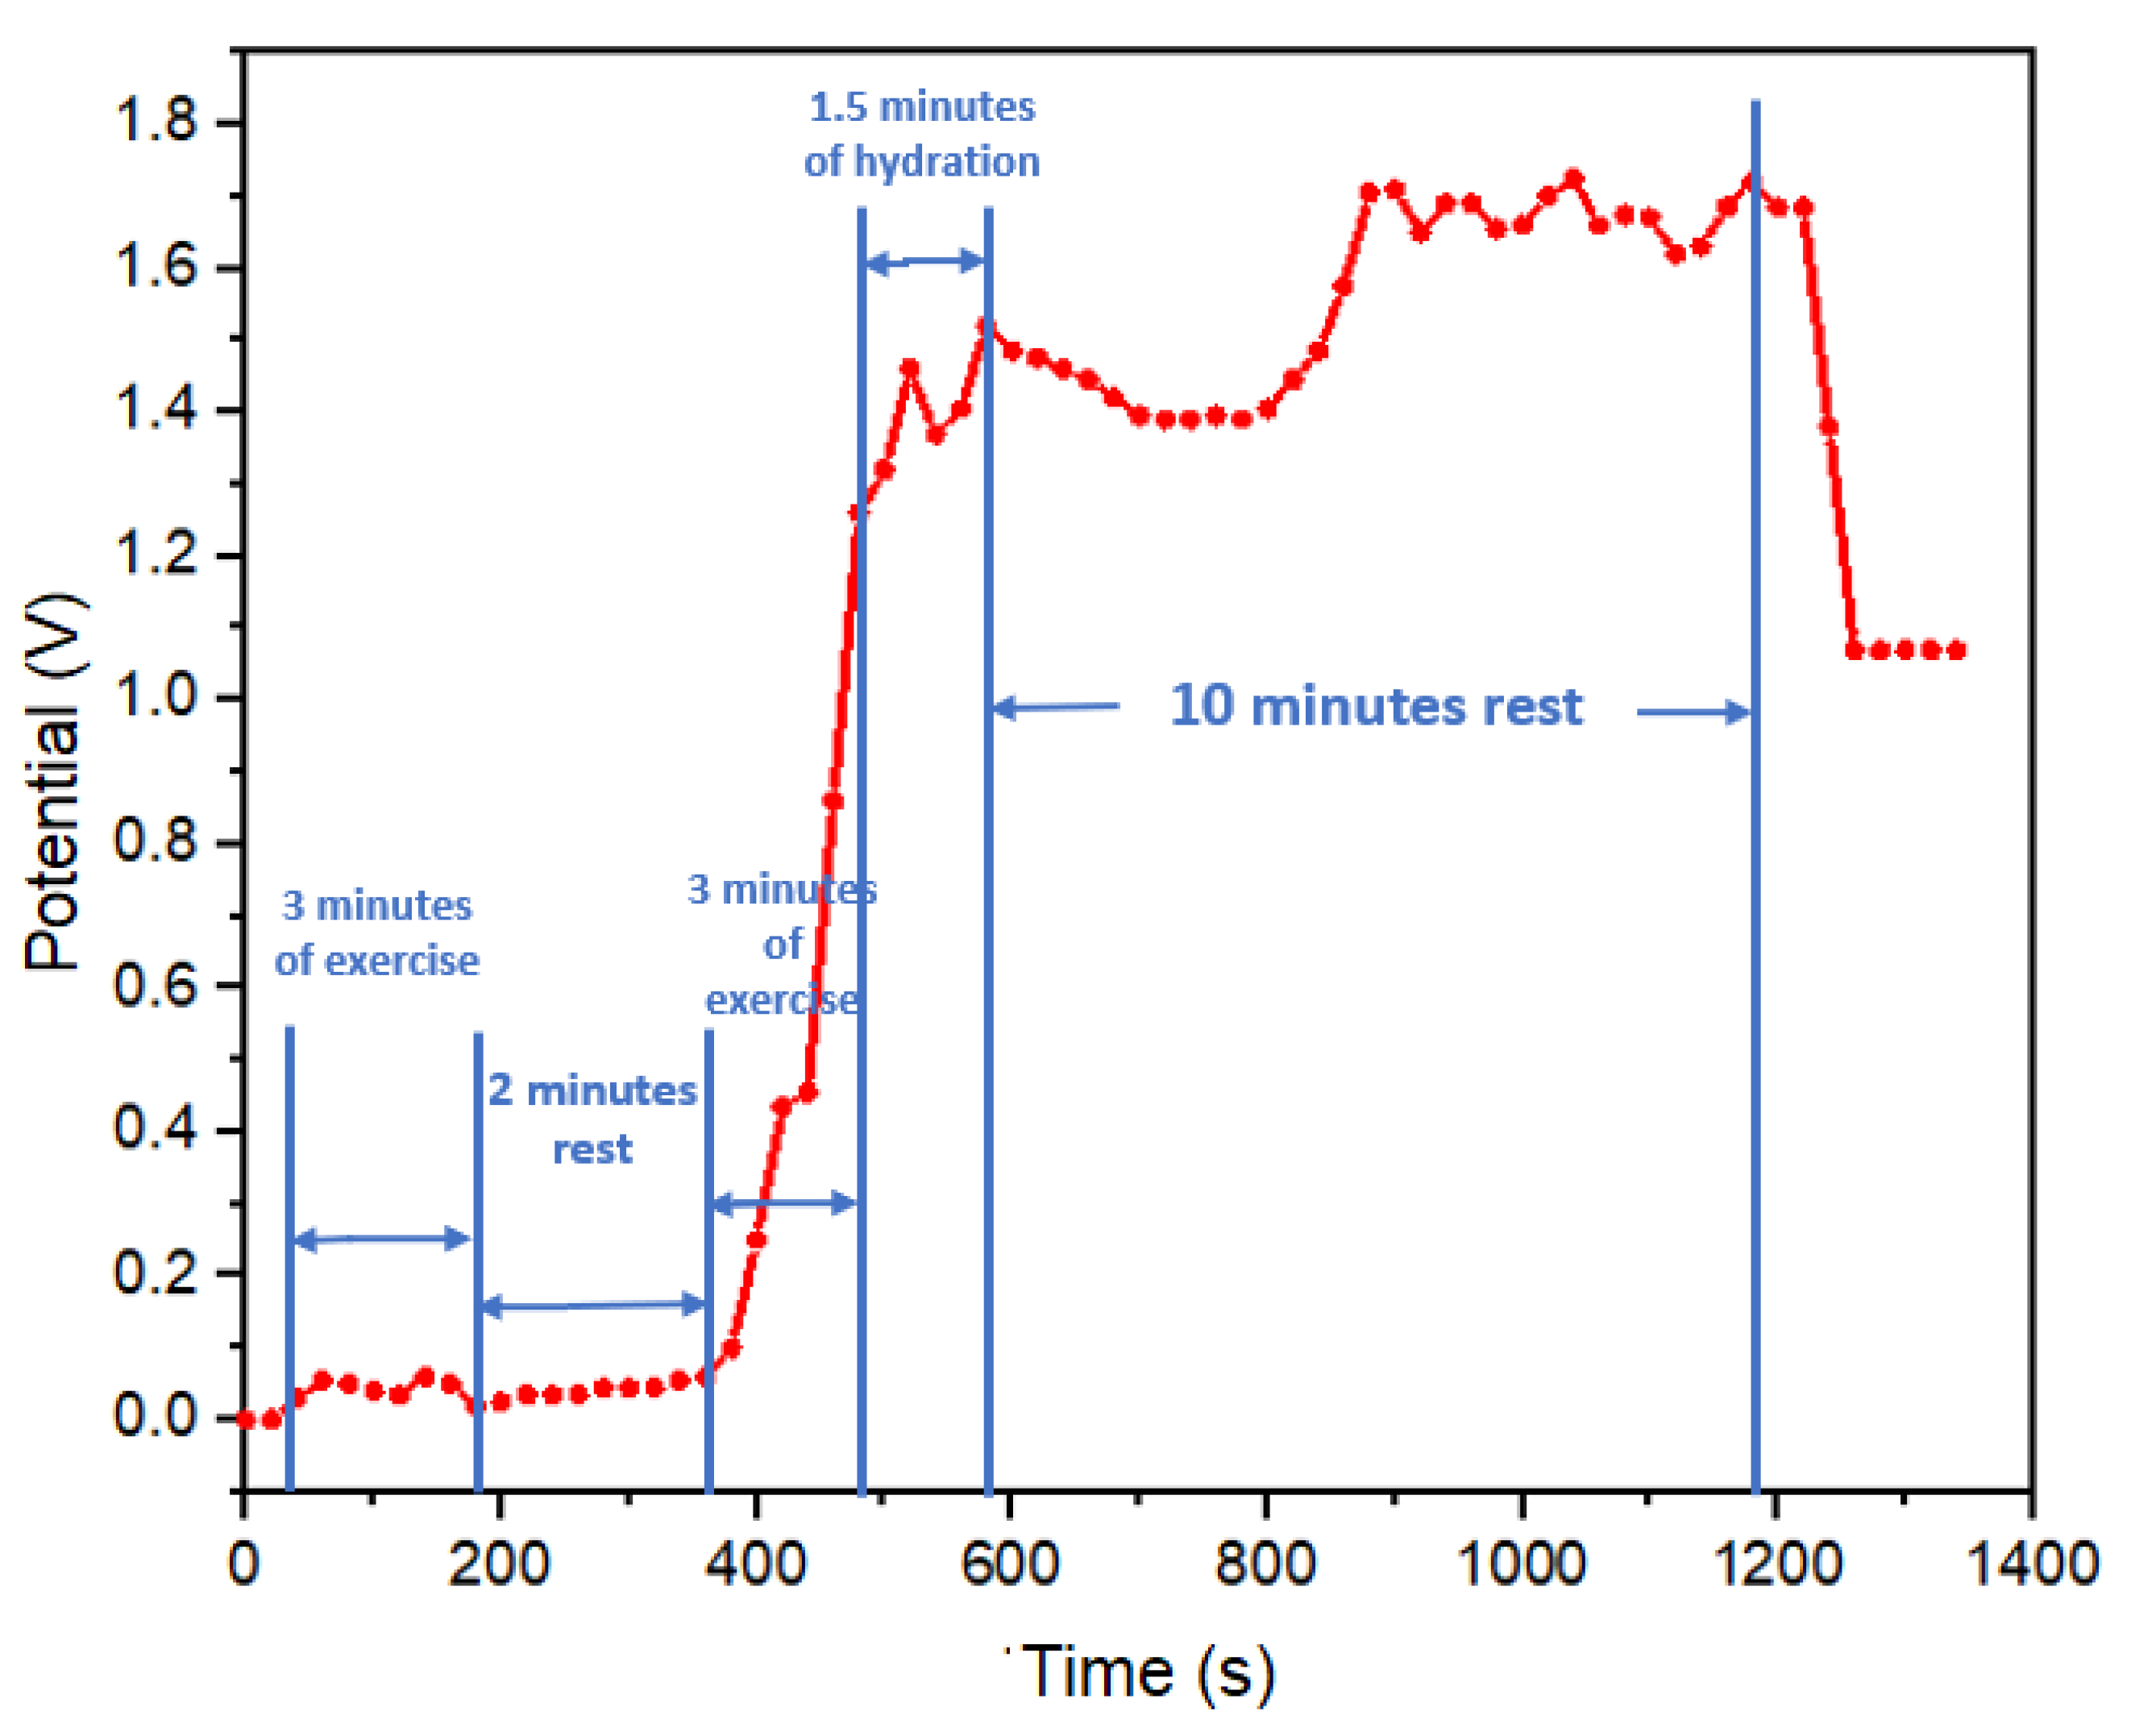
The second sweat test was performed in a jump rope exercise test, with exercise load and rest periods following the following sequence: complete rest, 3 minutes of exercise load, 2 minutes of rest, 3 minutes of exercise load, 1.5 minutes of hydration with electrolytes (600 ml of solution with 134 mg of sodium) concluding with a 10-minute rest, as illustrated in
Figure 7. In the initial minutes of this test (first 380 seconds), no discernible potential output was recorded, attributed to the absence of sweat segregation on the skin surface. However, it was during the subsequent exercise phase that the concentration of electrolytes in sweat of the subject led to a peak potential reading of 1.25 volts. This potential continued to rise, reaching 1.5 volts during the hydration period, indicative of a sustained electrolyte loss. Following the hydration phase, the potential gradually decreased to 1.4 volts due to the onset of dehydration and the reduced presence of electrolytes resulting from salt loss. Notably, after 800 seconds, the potential exhibited an increase to 1.7 volts, even in the absence of physical activity, which can be attributed to hydration with an electrolyte solution. Commencing at 900 seconds, an oscillation in potential values suggested a balance in the subject’s electrolyte levels. Towards the end of this period, the potential decreased to levels akin to those observed prior to hydration, indicating a possible return to normal electrolyte levels in the test subject, this aspect reinforcing the responsiveness of our real-time monitoring approach.
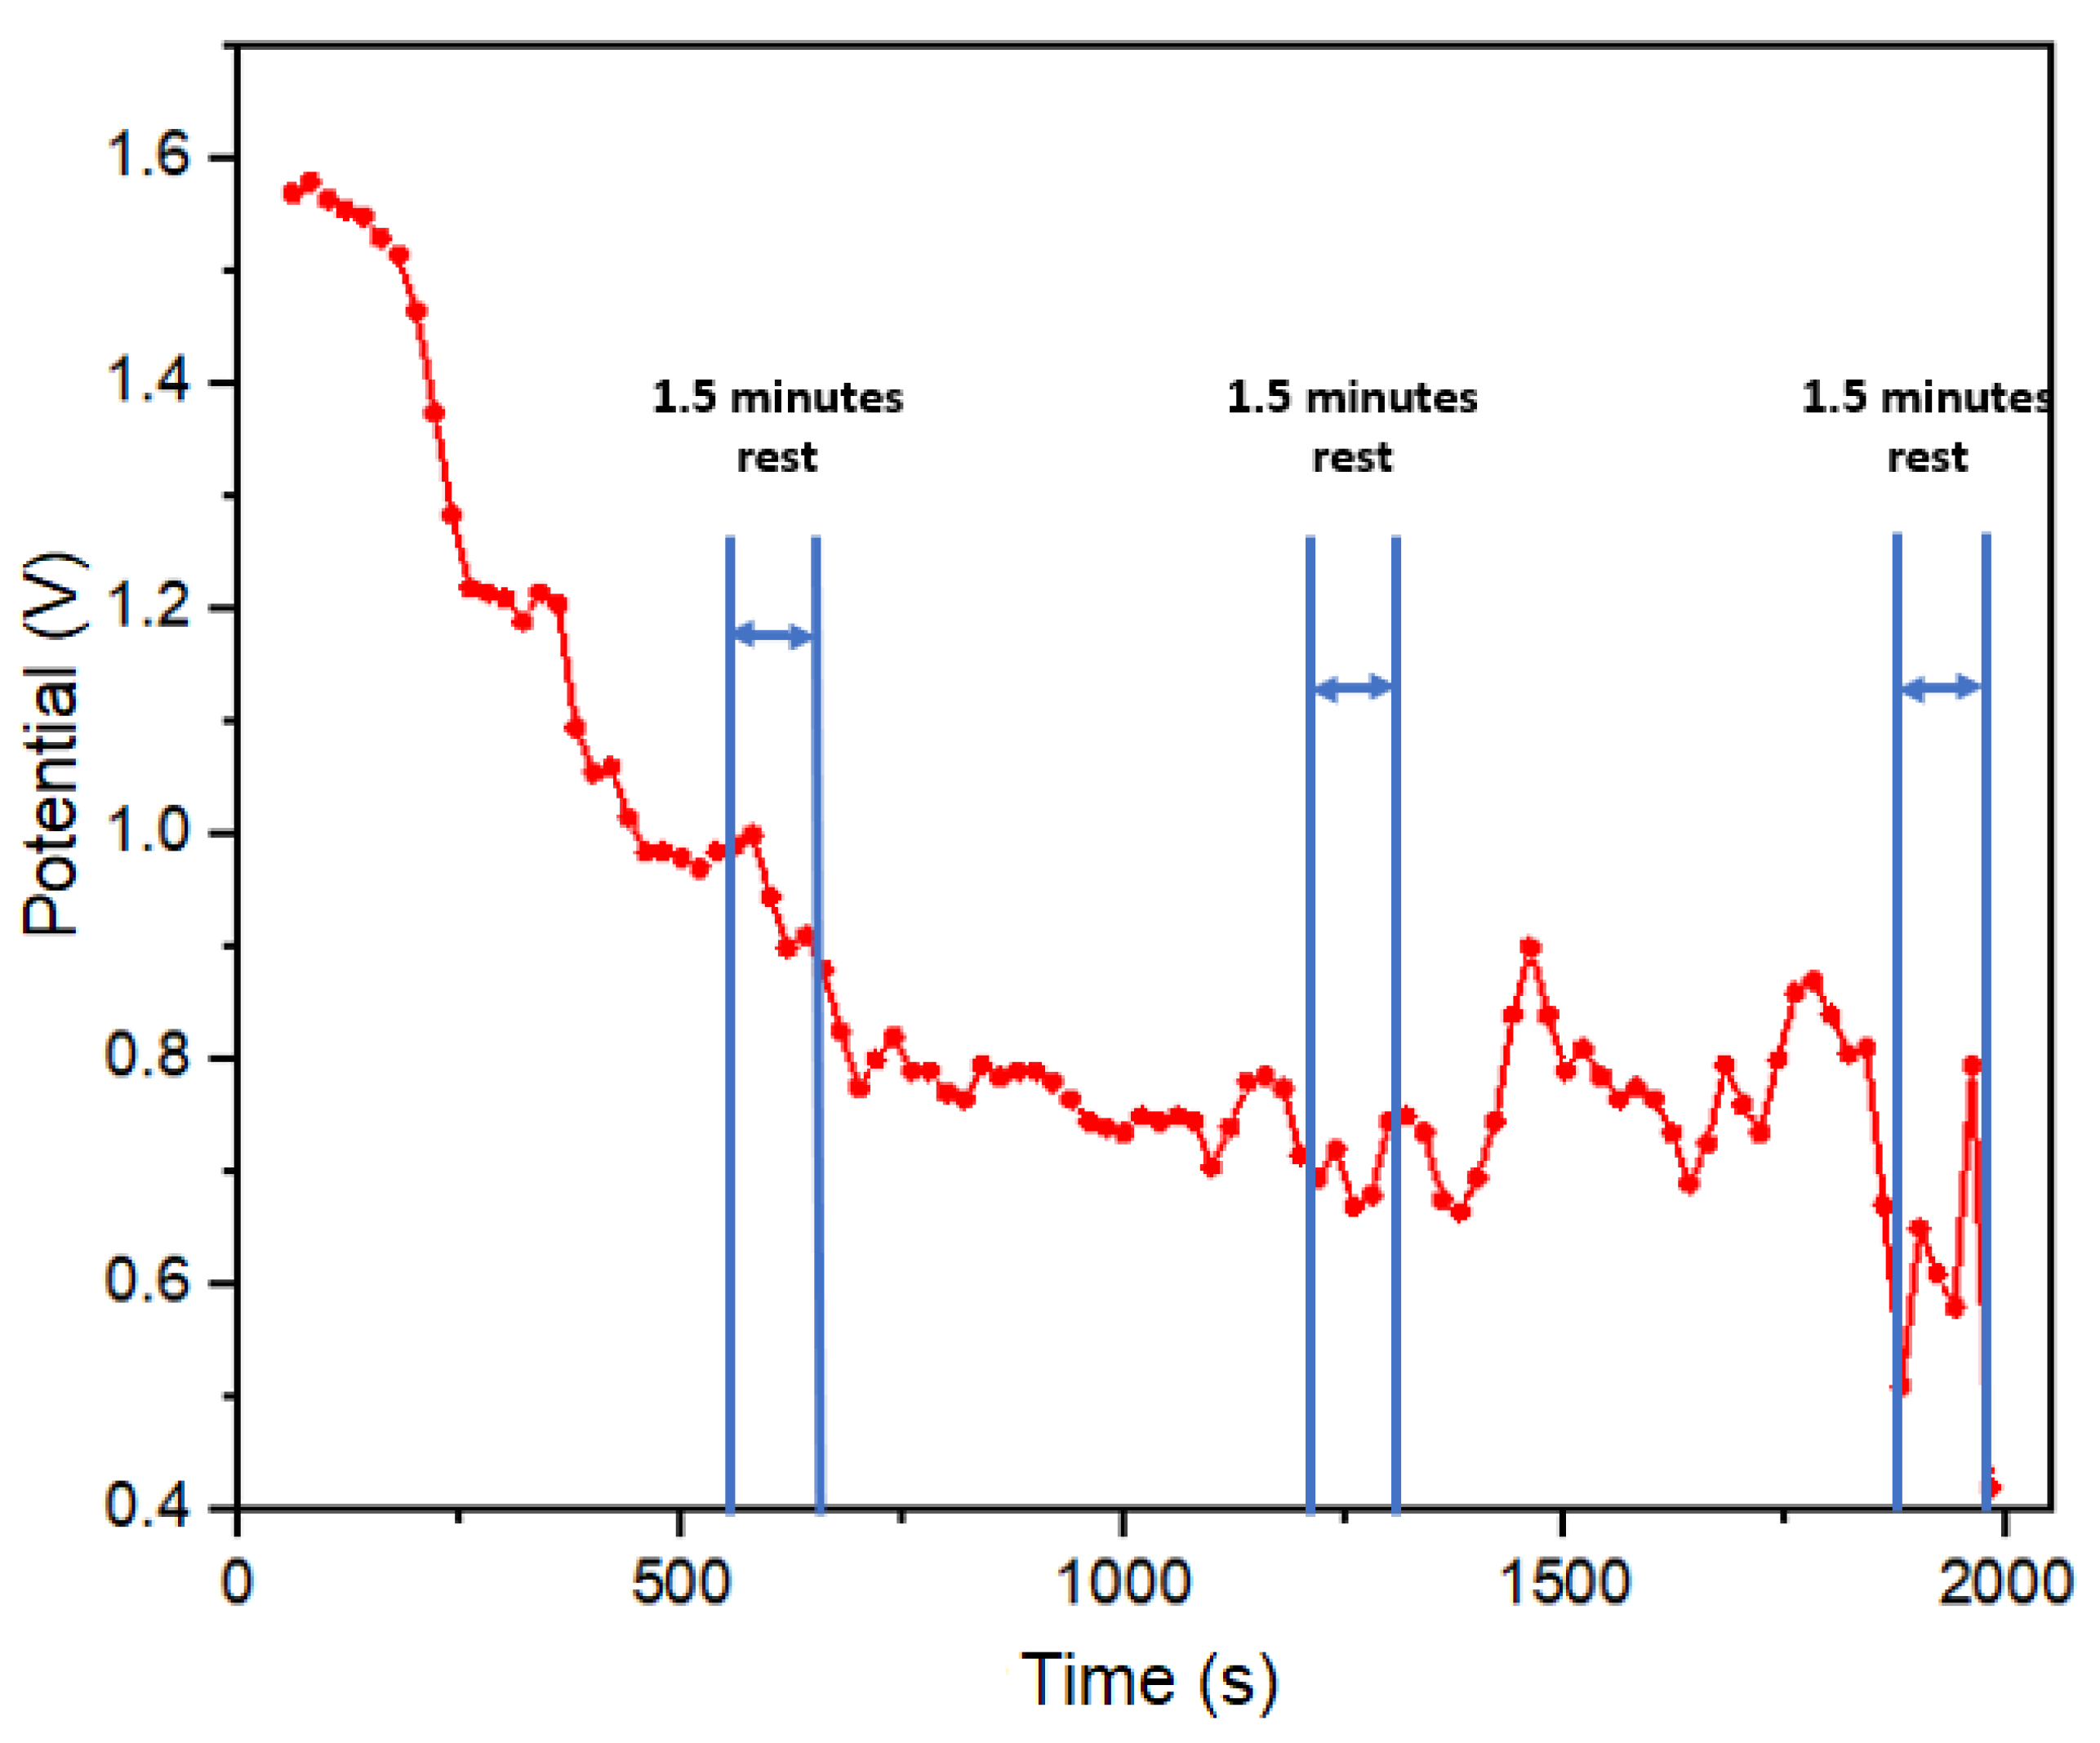
A third sweat test was conducted as part of a five-kilometers athletic assessment, maintaining a constant speed of 10 km/h without hydration. This test involved three activity periods and three rest periods, as illustrated in
Figure 8. It’s important to highlight that potential readings were recorded five minutes after the start of the test. The observed decline in potential readings is indicative of a reduction in the concentration of electrolytes in sweat. This outcome is attributed to the absence of hydration during the prolonged 33- minute duration, in contrast to the first two tests (
Figure 6d and
Figure 7). The extended timeframe of this test allowed for a more distinct examination of the impact of dehydration on the test subject, isolating and emphasizing its effects.
3.1.5. Reference medical equipment
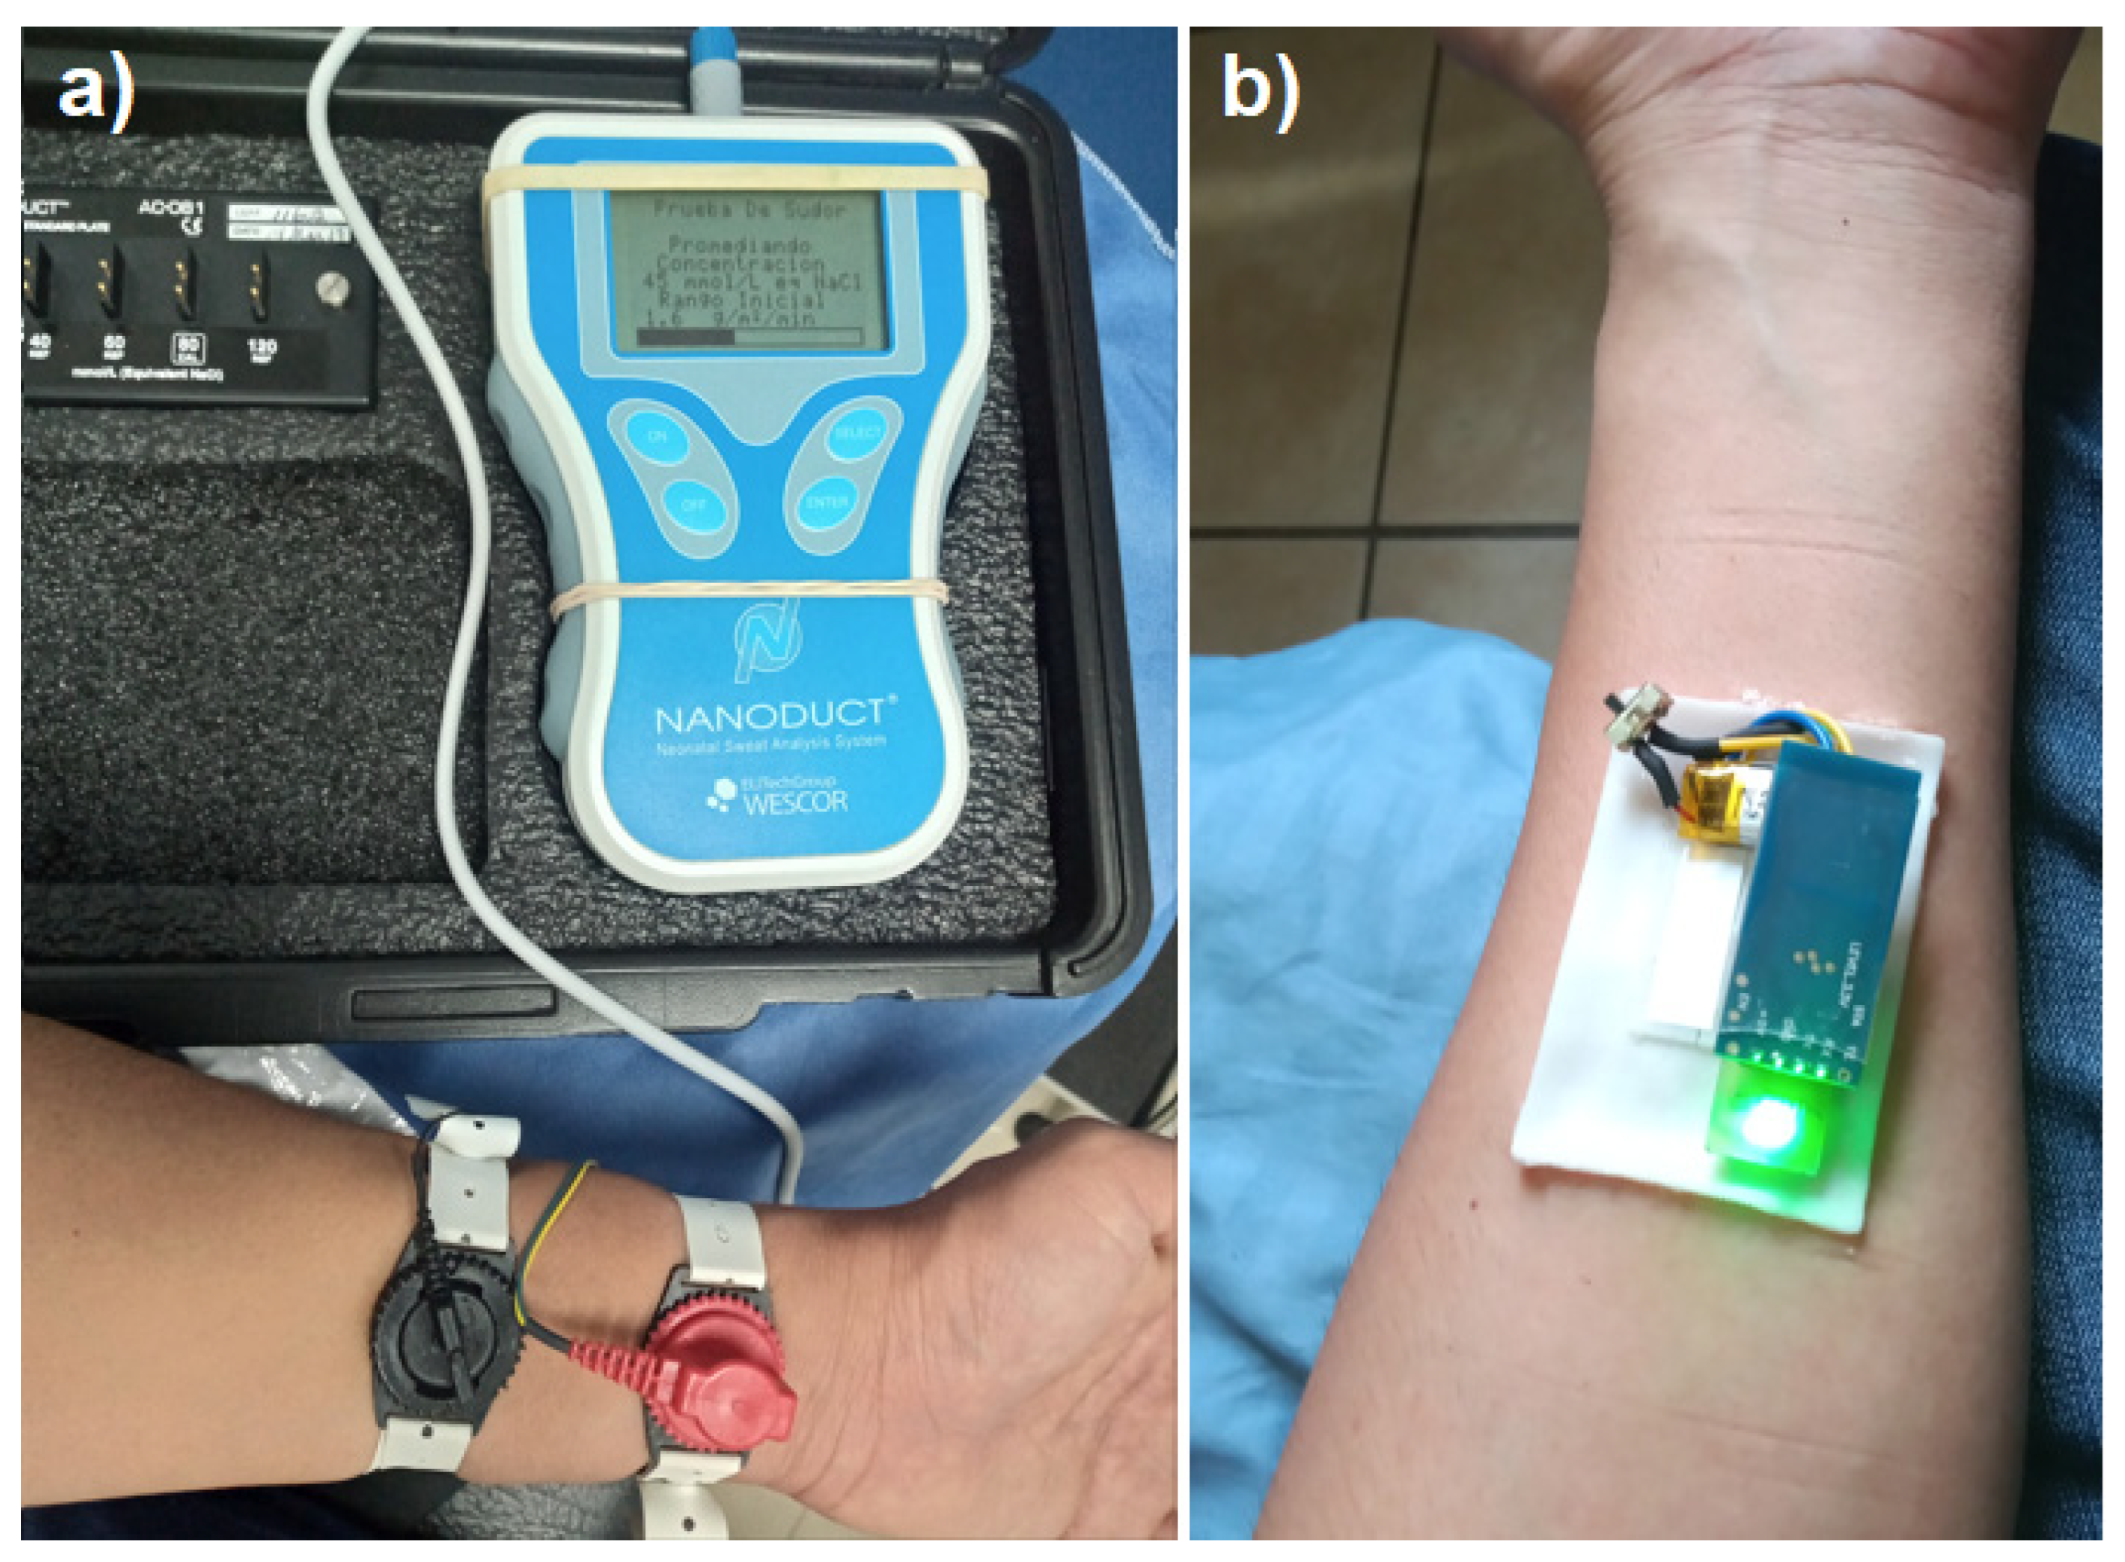
To relate the output potential of the sensor with a real concentration value we implemented the electrolyte test by iontophoresis in a certified laboratory that uses a Nanoconduct
® model 1030 medical equipment shown in
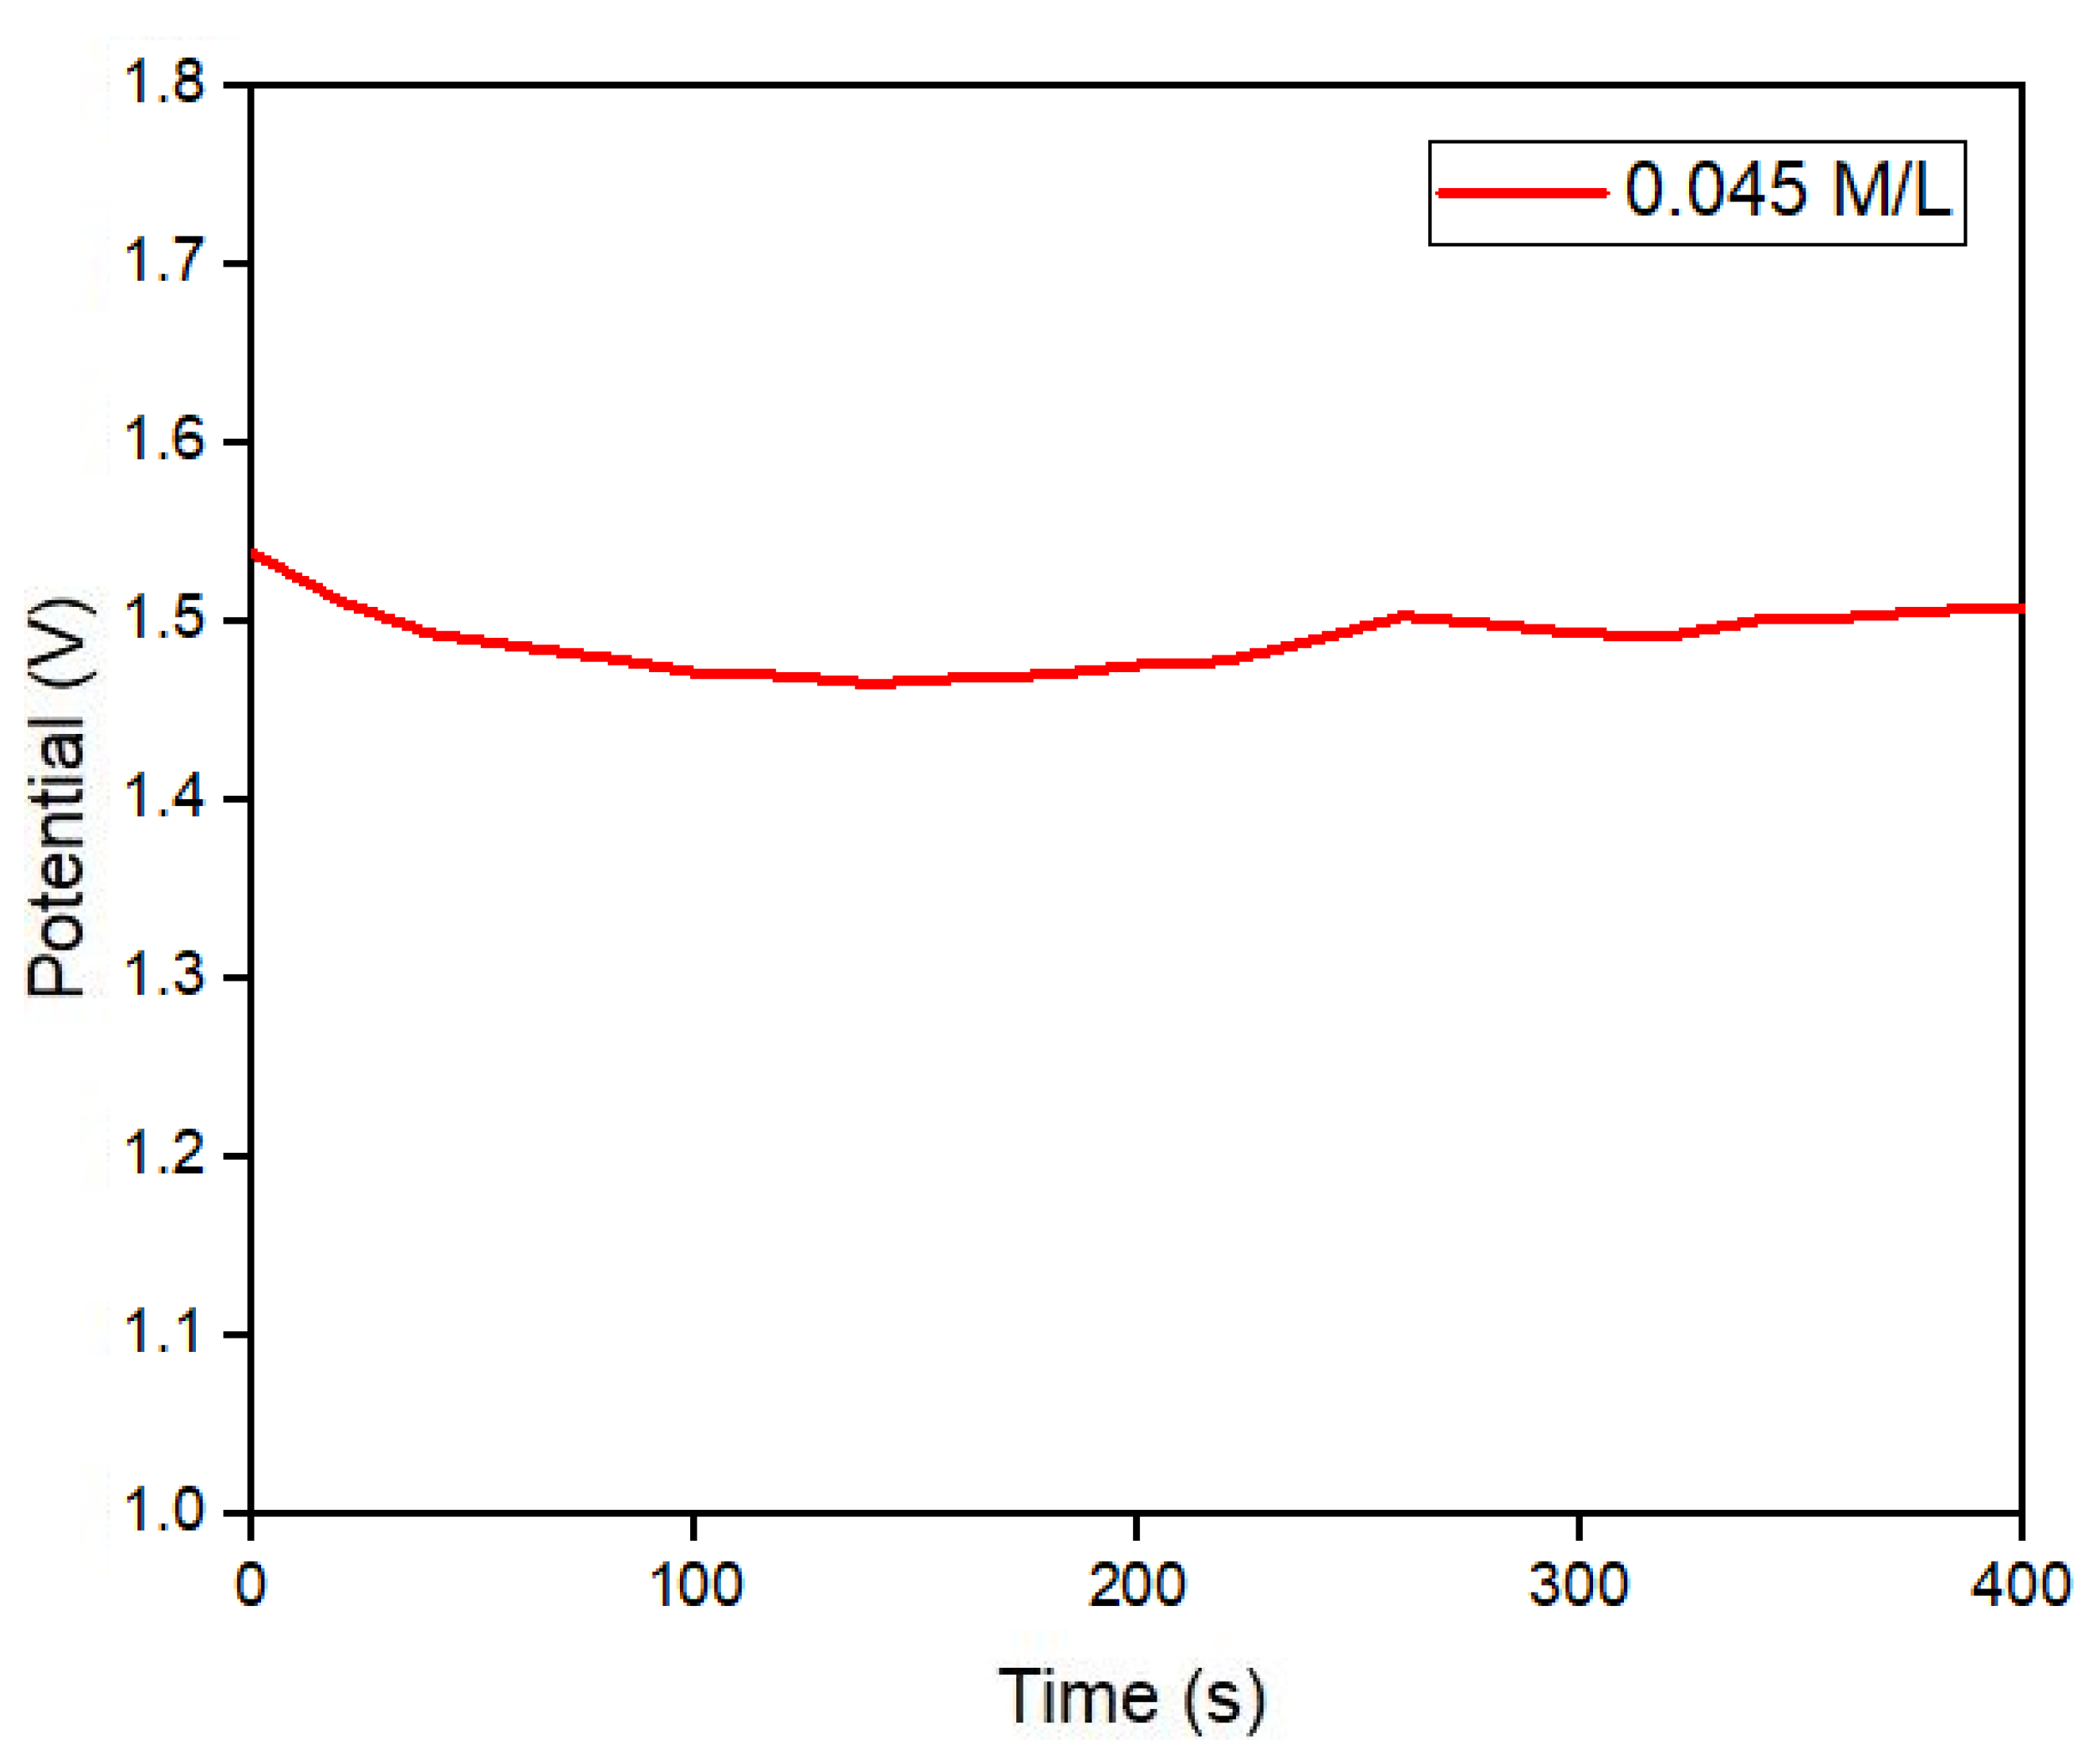
Figure 9a, which operates in two stages, during the first stage Pilocarpine nitrate gel and electric current are used with two metal electrodes on the surface of the skin to stimulate the patient’s sweating for five minutes, in the second stage, the medical equipment measures the conductivity of the sweat obtained for five minutes and provides a result final electrolyte concentration in mMol/L. With the sweat sample obtained by the iontophoresis test from a 35-year-old patient the electrodes were removed and the electrolyte patch was placed in the same stimulated area, to take potential readings for 6.5 minutes, obtaining a constant potential of ~ 1.5 volts as shown in
Figure 10, corresponding to an equivalent concentration of 0.045 M/L with the medical equipment shown in
Figure 9a. With the previous test was verified that a potential of 1.5 volts corresponds to a specific molar concentration of electrolytes in sweat considered normal in a patient, without suffering alterations in the measurement due to mechanical movement, temperature or physical activity.
3.1.6. Sensor Duration
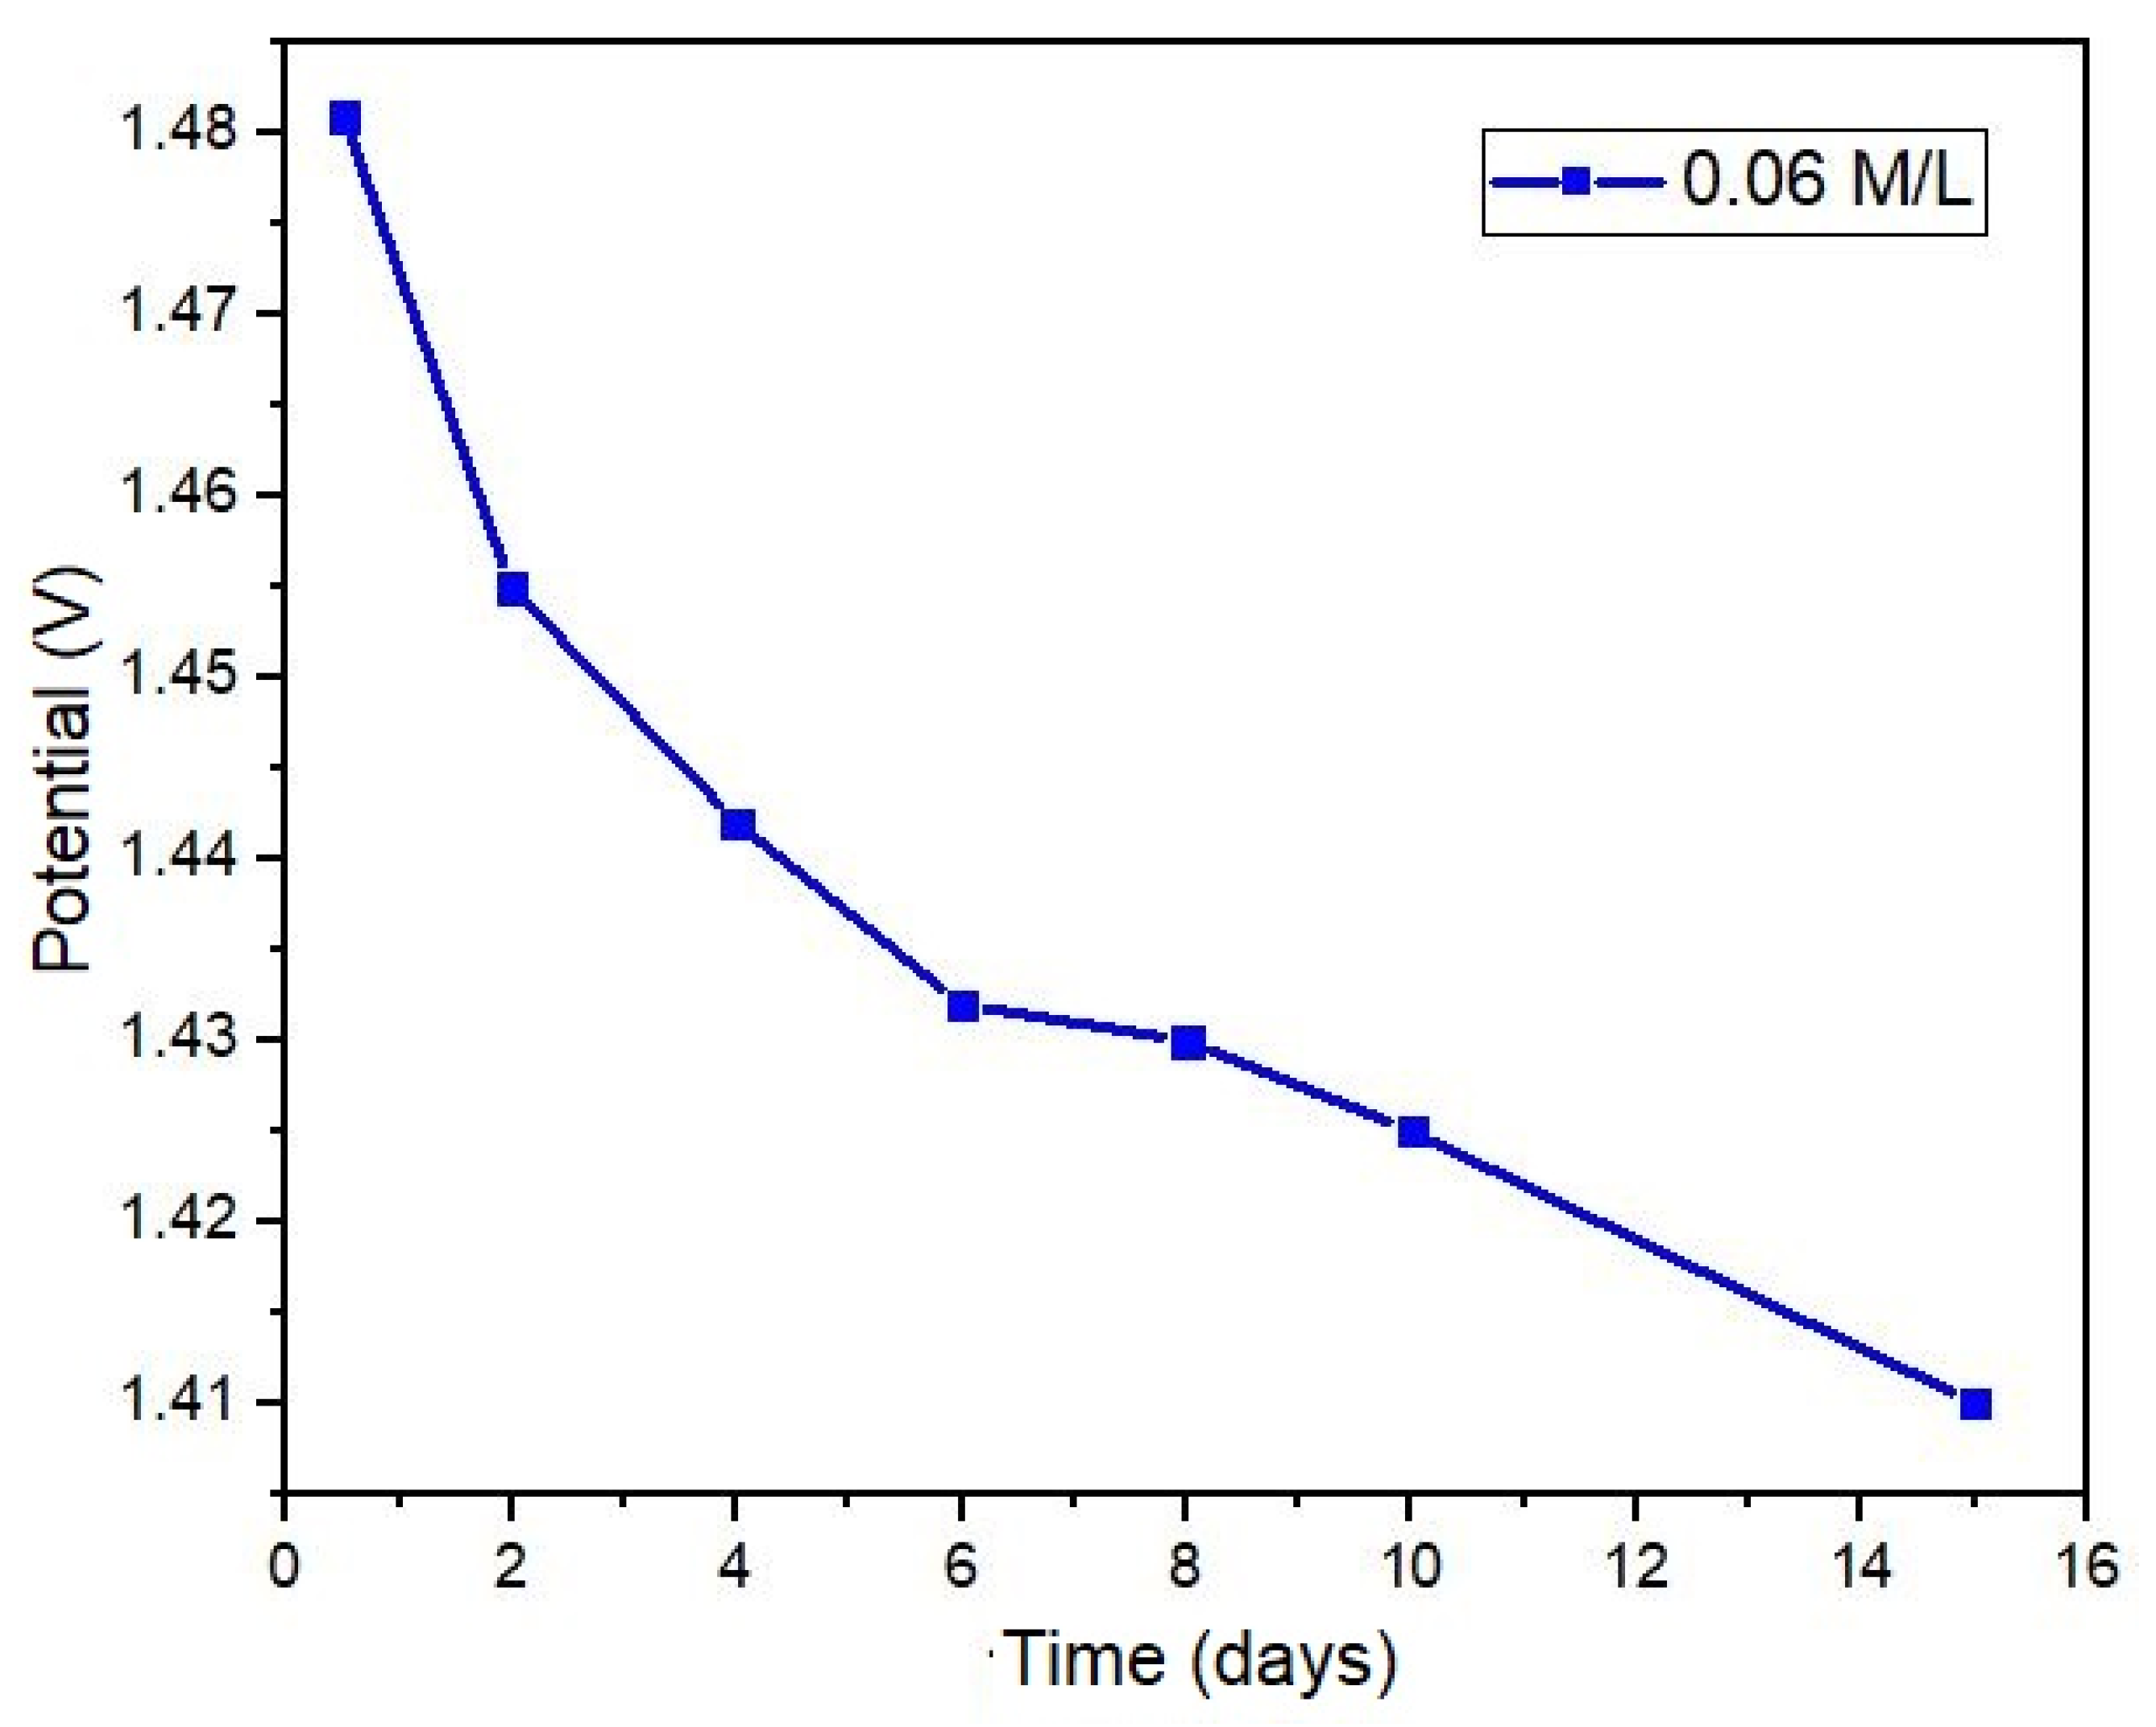
Figure 11 presents the results of a test conducted using a NaCl solution (0.06 M/L) over a period of fifteen days, revealing a decline in the sensor output potential by 0.07 volts at the conclusion of the test. Despite this reduction, this represents an opportunity to develop algorithms and signal processing techniques aimed at calibrating potential values based on the concentration of electrolytes present in sweat. The decrease in potential is attributed to the corrosion of the metal electrode surfaces within the sensor. Given the nature of the oxidation-reduction reaction and the inherent ionic exchange, the deterioration of the surface area in contact with the sample is an inevitable outcome.
4. Discussion
In this work, we demonstrate that an appropriate selection of materials as solid electrodes, both working and reference, allowed us to increase the output potential of a galvanic cell, this cell was used as a sensor that uses human sweat as an electrolyte, the sensor has a molar detection range of electrolytes that is 88% greater than the prototype sensors currently published and a potential output greater than 1 volt, above what has been reported, this provides the advantage of not requiring complex instrumentation to read the potential values. Reading molar concentrations of salts allows the sensor with Mg/Cu electrodes to be able to detect hydration levels in a person who performs physical activity, or with constant sweating, both low values (dehydration) and high values (hyperhydration), to that the user is able to attend to their hydration in a timely manner, and avoid negative effects on their health.
The implementation of a design of experiments with the sensor, demonstrated both the effectiveness and precision of the sensor, since its electrodes can perform the same measurement more than 50 times without suffering alterations in the potential output and that the error in these measurements remains close to zero, due to the little corrosion of the surface of the electrodes, thanks to the purity of the materials and the thickness of the Mg/Cu electrodes, these characteristics provide a useful life of the electrodes for several days.
The sensor showed the ability to detect electrolyte concentrations on a millimolar scale, through a different potential output for each concentration analyzed, this coincides with the Nernst model, where the potential has a logarithmic behavior of the concentrations that participate in the electrochemical reaction, and that the best results are obtained by connecting a load resistance between the Mg/Cu electrodes to stabilize the flow of current between both, the flow will remain while the reaction on the surface of the electrodes interacts with the ions dissolved in the sweat.
On the other hand, the controlled exercise which were carried out by measuring only the open circuit potential, showed the ability of the patch-shaped sensor to detect electrolyte levels above the normal range and that it is sensitive to concentration variations in a person with physical activity in real time even when there is electrolyte intake, due to the update of the sweat sample that flows and is updated in the channels of the patch, and demonstrates the ability of the system to operate as a hydration monitoring tool.
The comparison that was carried out with a medical device (iontophoresis) to detect electrolyte levels in a patient confirmed the ability of the sensor to read normal electrolyte values in a healthy 35-year-old patient, without external stimuli or physical activity, and that the potential behaved continuous during the reading period due to a constant concentration of electrolytes in the analyzed sweat sample. As future work is proposed to carry out tests with the medical equipment by iontophoresis with different patients who have different concentrations of electrolytes, to continue validating the sensor in patch form.
All the results obtained offered the possibility of using the sensor as part of a sweat electrolyte monitoring system, with range, potential output and duration characteristics, superior to the prototypes currently reported, in addition to offering the possibility of electrically feeding instrumentation with the same potential obtained, which will be thoroughly studied in future research.
5. Conclusions
In this study, we developed a potentiometric monitoring system designed in the form of a patch. Using simple and cost-effective instrumentation, the system enables real-time detection of hydration levels linked to the molar concentration of electrolytes in sweat. Capitalizing on the principle of operation where the sensor generates a direct current (DC) voltage signal, we successfully created a portable and non-invasive system with an electrode lifespan exceeding two weeks.
Our sensor demonstrated proficiency in detecting electrolyte concentrations, both in sodium chloride electrolyte samples and human sweat. Notably, the potential consistently registered above 1.5 volts within a range of 20 mM/L to 160 mM/L. This is noteworthy, as values exceeding 100 mM/L have not been previously reported. This capability allows for monitoring electrolyte concentrations during hyperhydration, dehydration, and euhydration periods in individuals employing the patch.
The acquired data over several days can be used to maintain a comprehensive record of an athlete’s physical activity or identify conditions related to electrolytes in sweat for individuals with excessive perspiration. Moreover, the sensor holds potential in the detection of genetic diseases like cystic fibrosis, as it permits on-site testing with patients who produce sweat volumes of less than 20 microliters. The system portability and operational range make it versatile for various applications.
Author Contributions
J.A.R.: Conceptualization, Formal analysis, Investigation, Methodology, Visualization and Writing original draft. D.D.A: Formal analysis, Investigation, Methodology, Validation, Project administration, Resource, Supervision, Visualization, Writing-review and editing.
Funding
This research received no external funding.
Institutional Review Board Statement
Not applicable.
Informed Consent Statement
Informed consent was obtained from all subjects involved in the study.
Acknowledgments
The authors are grateful to the National Council of Humanities, Sciences and Technologies (CONAHCYT) in Mexico and the Center for Engineering and Industrial Development, for providing the Ph.D scholarship 765481, of the National Scholarships (Traditional) call 2020—1, during the development of this project.
Conflicts of Interest
The authors declare no conflicts of interest.
References
- Gualandi, I.; Tessarolo, M.; Mariani, F.; Possanzini, L.; Scavetta, E.; Fraboni, B. Textile Chemical Sensors Based on Conductive Polymers for the Analysis of Sweat. Polymers 2021, 13, 894. [Google Scholar] [CrossRef]
- Seshadri, D.R.; Li, R.T.; Voos, J.E.; Rowbottom, J.R.; Alfes, C.M.; Zorman, C.A.; Drummond, C.K. Wearable sensors for monitoring the physiological and biochemical profile of the athlete. npj Digit. Med. 2019, 2, 1–16. [Google Scholar] [CrossRef]
- Xu, J.; Fang, Y.; Chen, J. Wearable Biosensors for Non-Invasive Sweat Diagnostics. Biosensors 2021, 11, 245. [Google Scholar] [CrossRef]
- Sholz, F. (2010), Electroanalytical Methods-Guide to Experiments and Applications, Germany, Springer. DOI 10.1007/978-3-642-02915-8.
- Bariya, M.; Nyein, H.Y.Y.; Javey, A. Wearable sweat sensors. Nat. Electron. 2018, 1, 160–171. [Google Scholar] [CrossRef]
- Turner, M.J.; Avolio, A.P. Does Replacing Sodium Excreted in Sweat Attenuate the Health Benefits of Physical Activity? Int. J. Sport Nutr. Exerc. Metab. 2016, 26, 377–389. [Google Scholar] [CrossRef]
- Surapongchai, J.; Saengsirisuwan, V.; Rollo, I.; Randell, R.K.; Nithitsuttibuta, K.; Sainiyom, P.; Leow, C.H.W.; Lee, J.K.W. Hydration Status, Fluid Intake, Sweat Rate, and Sweat Sodium Concentration in Recreational Tropical Native Runners. Nutrients 2021, 13, 1374. [Google Scholar] [CrossRef]
- Baker, L.B. Physiology of sweat gland function: The roles of sweating and sweat composition in human health. Temperature 2019, 6, 211–259. [Google Scholar] [CrossRef]
- Buono, M.J.; Ball, K.D.; Kolkhorst, F.W. Sodium ion concentration vs. sweat rate relationship in humans. J. Appl. Physiol. 2007, 103, 990–994. [Google Scholar] [CrossRef]
- Palmer, M.S.; Spriet, L.L. Sweat rate, salt loss, and fluid intake during an intense on-ice practice in elite Canadian male junior hockey players. Appl. Physiol. Nutr. Metab. 2008, 33, 263–271. [Google Scholar] [CrossRef]
- Mu, X.; Xin, X.; Fan, C.; Li, X.; Tian, X.; Xu, K.-F.; Zheng, Z. A paper-based skin patch for the diagnostic screening of cystic fibrosis. Chem. Commun. 2015, 51, 6365–6368. [Google Scholar] [CrossRef]
- E Heeley, M.; A Woolf, D.; Heeley, A.F. Indirect measurements of sweat electrolyte concentration in the laboratory diagnosis of cystic fibrosis. Arch. Dis. Child. 2000, 82, 420–424. [Google Scholar] [CrossRef]
- Emaminejad, S.; Gao, W.; Wu, E.; Davies, Z.A.; Nyein, H.Y.Y.; Challa, S.; Ryan, S.P.; Fahad, H.M.; Chen, K.; Shahpar, Z.; et al. Autonomous sweat extraction and analysis applied to cystic fibrosis and glucose monitoring using a fully integrated wearable platform. Proc. Natl. Acad. Sci. USA 2017, 114, 4625–4630. [Google Scholar] [CrossRef]
- Choi, D.-H.; Kim, J.S.; Cutting, G.R.; Searson, P.C. Wearable Potentiometric Chloride Sweat Sensor: The Critical Role of the Salt Bridge. Anal. Chem. 2016, 88, 12241–12247. [Google Scholar] [CrossRef]
- Bandodkar, A.J.; Lee, S.P.; Huang, I.; Li, W.; Wang, S.; Su, C.-J.; Jeang, W.J.; Hang, T.; Mehta, S.; Nyberg, N.; et al. Sweat-activated biocompatible batteries for epidermal electronic and microfluidic systems. Nat. Electron. 2020, 3, 554–562. [Google Scholar] [CrossRef]
- Lv, J.; Thangavel, G.; Li, Y.; Xiong, J.; Gao, D.; Ciou, J.; Tan, M.W.M.; Aziz, I.; Chen, S.; Chen, J.; et al. Printable elastomeric electrodes with sweat-enhanced conductivity for wearables. Sci. Adv. 2021, 7, eabg8433. [Google Scholar] [CrossRef]
- Heikenfeld, J. Non-invasive Analyte Access and Sensing through Eccrine Sweat: Challenges and Outlook circa 2016. Electroanalysis 2016, 28, 1242–1249. [Google Scholar] [CrossRef]
- Shitanda, I.; Muramatsu, N.; Kimura, R.; Takahashi, N.; Watanabe, K.; Matsui, H.; Loew, N.; Motosuke, M.; Mukaimoto, T.; Kobayashi, M.; et al. Wearable Ion Sensors for the Detection of Sweat Ions Fabricated by Heat-Transfer Printing. ACS Sensors 2023, 8, 2889–2895. [Google Scholar] [CrossRef]
- Zhao, C.; Li, X.; Wu, Q.; Liu, X. A thread-based wearable sweat nanobiosensor. Biosens. Bioelectron. 2021, 188, 113270. [Google Scholar] [CrossRef]
- Pirovano, P.; Dorrian, M.; Shinde, A.; Donohoe, A.; Brady, A.J.; Moyna, N.M.; Wallace, G.; Diamond, D.; McCaul, M. A wearable sensor for the detection of sodium and potassium in human sweat during exercise. Talanta 2020, 219, 121145. [Google Scholar] [CrossRef]
- Terse-Thakoor, T.; Punjiya, M.; Matharu, Z.; Lyu, B.; Ahmad, M.; Giles, G.E.; Owyeung, R.; Alaimo, F.; Baghini, M.S.; Brunyé, T.T.; et al. Thread-based multiplexed sensor patch for real-time sweat monitoring. npj Flex. Electron. 2020, 4, 1–10. [Google Scholar] [CrossRef]
- Ortega, L.; Llorella, A.; Esquivel, J.P.; Sabaté, N. Self-powered smart patch for sweat conductivity monitoring. Microsystems Nanoeng. 2019, 5, 1–10. [Google Scholar] [CrossRef]
- He, W.; Wang, C.; Wang, H.; Jian, M.; Lu, W.; Liang, X.; Zhang, X.; Yang, F.; Zhang, Y. Integrated textile sensor patch for real-time and multiplex sweat analysis. Sci. Adv. 2019, 5, eaax0649. [Google Scholar] [CrossRef]
- Sonner, Z.; Wilder, E.; Gaillard, T.; Kasting, G.; Heikenfeld, J. Integrated sudomotor axon reflex sweat stimulation for continuous sweat analyte analysis with individuals at rest. Lab a Chip 2017, 17, 2550–2560. [Google Scholar] [CrossRef]
- Gao, W.; Emaminejad, S.; Nyein, H.Y.Y.; Challa, S.; Chen, K.; Peck, A.; Fahad, H.M.; Ota, H.; Shiraki, H.; Kiriya, D.; et al. Fully integrated wearable sensor arrays for multiplexed in situ perspiration analysis. Nature 2016, 529, 509–514. [Google Scholar] [CrossRef]
- Rose, D.P.; Ratterman, M.E.; Griffin, D.K.; Hou, L.; Kelley-Loughnane, N.; Naik, R.R.; Hagen, J.A.; Papautsky, I.; Heikenfeld, J.C. Adhesive RFID Sensor Patch for Monitoring of Sweat Electrolytes. IEEE Trans. Biomed. Eng. 2015, 62, 1457–1465. [Google Scholar] [CrossRef]
- Boettcher, S.W.; Oener, S.Z.; Lonergan, M.C.; Surendranath, Y.; Ardo, S.; Brozek, C.; Kempler, P.A. Potentially Confusing: Potentials in Electrochemistry. ACS Energy Lett. 2020, 6, 261–266. [Google Scholar] [CrossRef]
- Bagotsky, V.S. Fundamentals of Electrochemistry, 2nd ed.; John Wiley & Sons: Hoboken, NJ, USA, 2005. [Google Scholar]
- Salazar, P.F.; Kumar, S.; Cola, B.A. Design and optimization of thermo-electrochemical cells. J. Appl. Electrochem. 2013, 44, 325–336. [Google Scholar] [CrossRef]
- Ciavatta, L.; Elia, V.; Napoli, E.; Niccoli, M. New Physico-Chemical Properties of Extremely Diluted Solutions. Electromotive Force Measurements of Galvanic Cells Sensible to the Activity of NaCl at 25 °C. J. Solut. Chem. 2008, 37, 1037–1049. [Google Scholar] [CrossRef]
- Koo, Y.; Sankar, J.; Yun, Y. High performance magnesium anode in paper-based microfluidic battery, powering on-chip fluorescence assay. Biomicrofluidics 2014, 8, 054104–054104. [Google Scholar] [CrossRef]
- Kong, Y.; Wang, C.; Yang, Y.; Too, C.O.; Wallace, G.G. A battery composed of a polypyrrole cathode and a magnesium alloy anode—Toward a bioelectric battery. Synth. Met. 2012, 162, 584–589. [Google Scholar] [CrossRef]
- Williams, G.; McMurray, H.N. Localized Corrosion of Magnesium in Chloride-Containing Electrolyte Studied by a Scanning Vibrating Electrode Technique. J. Electrochem. Soc. 2008, 155, C340–C349. [Google Scholar] [CrossRef]
- Deivanayagam, R.; Cheng, M.; Wang, M.; Vasudevan, V.; Foroozan, T.; Medhekar, N.V.; Shahbazian-Yassar, R. Composite Polymer Electrolyte for Highly Cyclable Room-Temperature Solid-State Magnesium Batteries. ACS Appl. Energy Mater. 2019, 2, 7980–7990. [Google Scholar] [CrossRef]
- Lodovico, L.; Torresi, R.M.; Martins, V.L.; Benedetti, T.M. Electrochemical Behavior of Iron and Magnesium in Ionic Liquids. J. Braz. Chem. Soc. 2014, 25, 460–U236. [Google Scholar] [CrossRef]
- Supriyono, S. EVALUATION OF THE DYNAMIC MODELING AND DISCHARGE PERFORMANCE OF A MAGNESIUM BATTERY ACTIVATED BY SEAWATER. Int. J. Technol. 2018, 9, 663–674. [Google Scholar] [CrossRef]
- Zhang, R.; Tutusaus, O.; Mohtadi, R.; Ling, C. Magnesium-Sodium Hybrid Battery With High Voltage, Capacity and Cyclability. Front. Chem. 2018, 6, 611. [Google Scholar] [CrossRef]
- Lu, Z.; Schechter, A.; Moshkovich, M.; Aurbach, D. On the electrochemical behavior of magnesium electrodes in polar aprotic electrolyte solutions. J. Electroanal. Chem. 1999, 466, 203–217. [Google Scholar] [CrossRef]
- Höche, D.; Lamaka, S.V.; Vaghefinazari, B.; Braun, T.; Petrauskas, R.P.; Fichtner, M.; Zheludkevich, M.L. Performance boost for primary magnesium cells using iron complexing agents as electrolyte additives. Sci. Rep. 2018, 8, 7578. [Google Scholar] [CrossRef]
Figure 1.
(a) Schematic representation of the principle of operation of the electrolyte sensor with the anode and cathode electrodes and (b) results obtained with a cell with Mg/Cu electrodes and NaCl solutions at different concentrations.
Figure 1.
(a) Schematic representation of the principle of operation of the electrolyte sensor with the anode and cathode electrodes and (b) results obtained with a cell with Mg/Cu electrodes and NaCl solutions at different concentrations.
Figure 2.
(a) Top view of the 3D design with base for instrumentation and (b) bottom view of the cavities for electrodes and microchannels.
Figure 2.
(a) Top view of the 3D design with base for instrumentation and (b) bottom view of the cavities for electrodes and microchannels.
Figure 3.
Electrolyte sensor in the form of an adhesive patch (a) in layers, (b) instrumentation stages, and (c) its use and application.
Figure 3.
Electrolyte sensor in the form of an adhesive patch (a) in layers, (b) instrumentation stages, and (c) its use and application.
Figure 4.
Open circuit potential output of the electrolyte sensor with respect to time (a) with a single molar concentration of 0.1 M, and (b) using different concentrations of NaCl.
Figure 4.
Open circuit potential output of the electrolyte sensor with respect to time (a) with a single molar concentration of 0.1 M, and (b) using different concentrations of NaCl.
Figure 5.
Output of the electrolyte sensor (a) potential and (b) current with respect to time, connecting a load resistor Rload to the output of the sensor, testing different concentrations in the electrolyte.
Figure 5.
Output of the electrolyte sensor (a) potential and (b) current with respect to time, connecting a load resistor Rload to the output of the sensor, testing different concentrations in the electrolyte.
Figure 6.
(a) Uncovered top and (b) bottom view of the adhesive patch, (c) first exercise test with a stationary bicycle and (d) Open circuit potential behavior during the start of the test.
Figure 6.
(a) Uncovered top and (b) bottom view of the adhesive patch, (c) first exercise test with a stationary bicycle and (d) Open circuit potential behavior during the start of the test.
Figure 7.
Second exercise test of 23 minutes, open circuit potential with rest, hydration and exercise load stages.
Figure 7.
Second exercise test of 23 minutes, open circuit potential with rest, hydration and exercise load stages.
Figure 8.
Third exercise test of 33 minutes, open circuit potential with rest and exercise load stages.
Figure 8.
Third exercise test of 33 minutes, open circuit potential with rest and exercise load stages.
Figure 9.
Sweat electrolyte test (a) by the iontophoresis method with Nanoconduct® equipment and (b) with the sweat electrolyte detection patch.
Figure 9.
Sweat electrolyte test (a) by the iontophoresis method with Nanoconduct® equipment and (b) with the sweat electrolyte detection patch.
Figure 10.
Potential reading of the electrolyte detection patch during a sweat test, stimulated by iontophoresis, for 5 minutes.
Figure 10.
Potential reading of the electrolyte detection patch during a sweat test, stimulated by iontophoresis, for 5 minutes.
Figure 11.
Sensor life for an extended period.
Figure 11.
Sensor life for an extended period.
Table 1.
Sensor design variables used during the design of experiments.
Table 1.
Sensor design variables used during the design of experiments.
| |
|
Levels |
| Variable |
Label |
Low |
High |
| Material |
A |
Zn/Cu |
Mg/Cu |
| Area |
B |
0.28 cm2
|
0.48 cm2
|
| Electrode Position |
C |
Horizontal |
Vertical |
| Electrode separation |
D |
3 mm |
6 mm |
Table 2.
Statistical analysis of electrolyte sensor precision.
Table 2.
Statistical analysis of electrolyte sensor precision.
|
|
|
|
0.00058 |
0.000276 |
|
0.0025 |
0.00119 |
|
0.00241 |
0.00114 |
|
Disclaimer/Publisher’s Note: The statements, opinions and data contained in all publications are solely those of the individual author(s) and contributor(s) and not of MDPI and/or the editor(s). MDPI and/or the editor(s) disclaim responsibility for any injury to people or property resulting from any ideas, methods, instructions or products referred to in the content. |
© 2024 by the authors. Licensee MDPI, Basel, Switzerland. This article is an open access article distributed under the terms and conditions of the Creative Commons Attribution (CC BY) license (http://creativecommons.org/licenses/by/4.0/).

