1. Introduction
CCA is a very deadly form of adenocarcinoma that develops in the epithelial cells of the bile ducts within the hepatobiliary system [
1,
2,
3]. Worldwide, approximately 106,000 people are diagnosed with CCA each year, accounting for 0.3% of all cancers, and the incidence is higher in Asian populations compared to European and North American populations [
4]. As early symptoms of bile duct cancer are not obvious, most of the patients have already progressed to advanced stages by the time of diagnosis, losing the opportunity for surgical treatment and ultimately affecting the prognosis [
5]. Globally, about 99,000 people die from bile duct cancer every year, accounting for about 0.4% of all cancer mortality. Hence, there is an immediate requirement to develop prognostic models using novel biomarkers in order to enhance the unfavorable prognosis of patients with CCA.
Telomeres, consisting of repetitive DNA sequences found at the tips of chromosomes, are essential for preserving chromosome stability and integrity [
6,
7]. Telomere shortening and damage are closely related to the development of many diseases such as aging and cancer. Studies have shown that telomere length in malignant cells is usually longer than in normal cells, which is associated with the unlimited proliferative capacity and resistance to apoptosis of tumor cells. Regulating this process is a group of highly conserved regulatory factors, telomere-related genes. telomere-related genes are genes related to telomere structure, function, and regulation of telomerase [
6]. Abnormal expression or mutation of these genes will lead to abnormal shortening or damage of telomeres, which will trigger chromosomal instability and abnormal cellular function. In tumor development, the abnormal expression of telomere-related genes is closely related to the shortening of telomeres and chromosomal rearrangements. These abnormalities lead to genomic instability, which promotes the proliferation, metastasis, and drug resistance of tumor cells. Therefore, telomere-associated genes play an important role in regulating tumor development by modulating the stability and function of telomeres [
8]. In CCA, several telomere-associated genes are differentially expressed and play a wide range of biological roles, and these genes may be closely related to the treatment and prognosis of CCA. However, the complex role and prognostic significance of telomere-associated genes in CCA are still largely unknown [
9,
10,
11].
The contribution of single-cell sequencing technology to tumor research has been immense. It has enabled researchers to gain insight into the cellular heterogeneity and evolutionary processes of tumors [
12]. Single-cell sequencing data are important in identifying cellular heterogeneity, constructing cellular trajectories, and analyzing intracell communication and ligand receptor expression. By analyzing the genomes, transcriptomes, and epigenomes of individual cells, we can reveal the differences between different tumor cells, identify potential therapeutic targets, and provide a basis for personalized therapy. The rapid development of single-cell genomics in recent years has revealed the unknown biological processes and disease causes of CCA [
13].
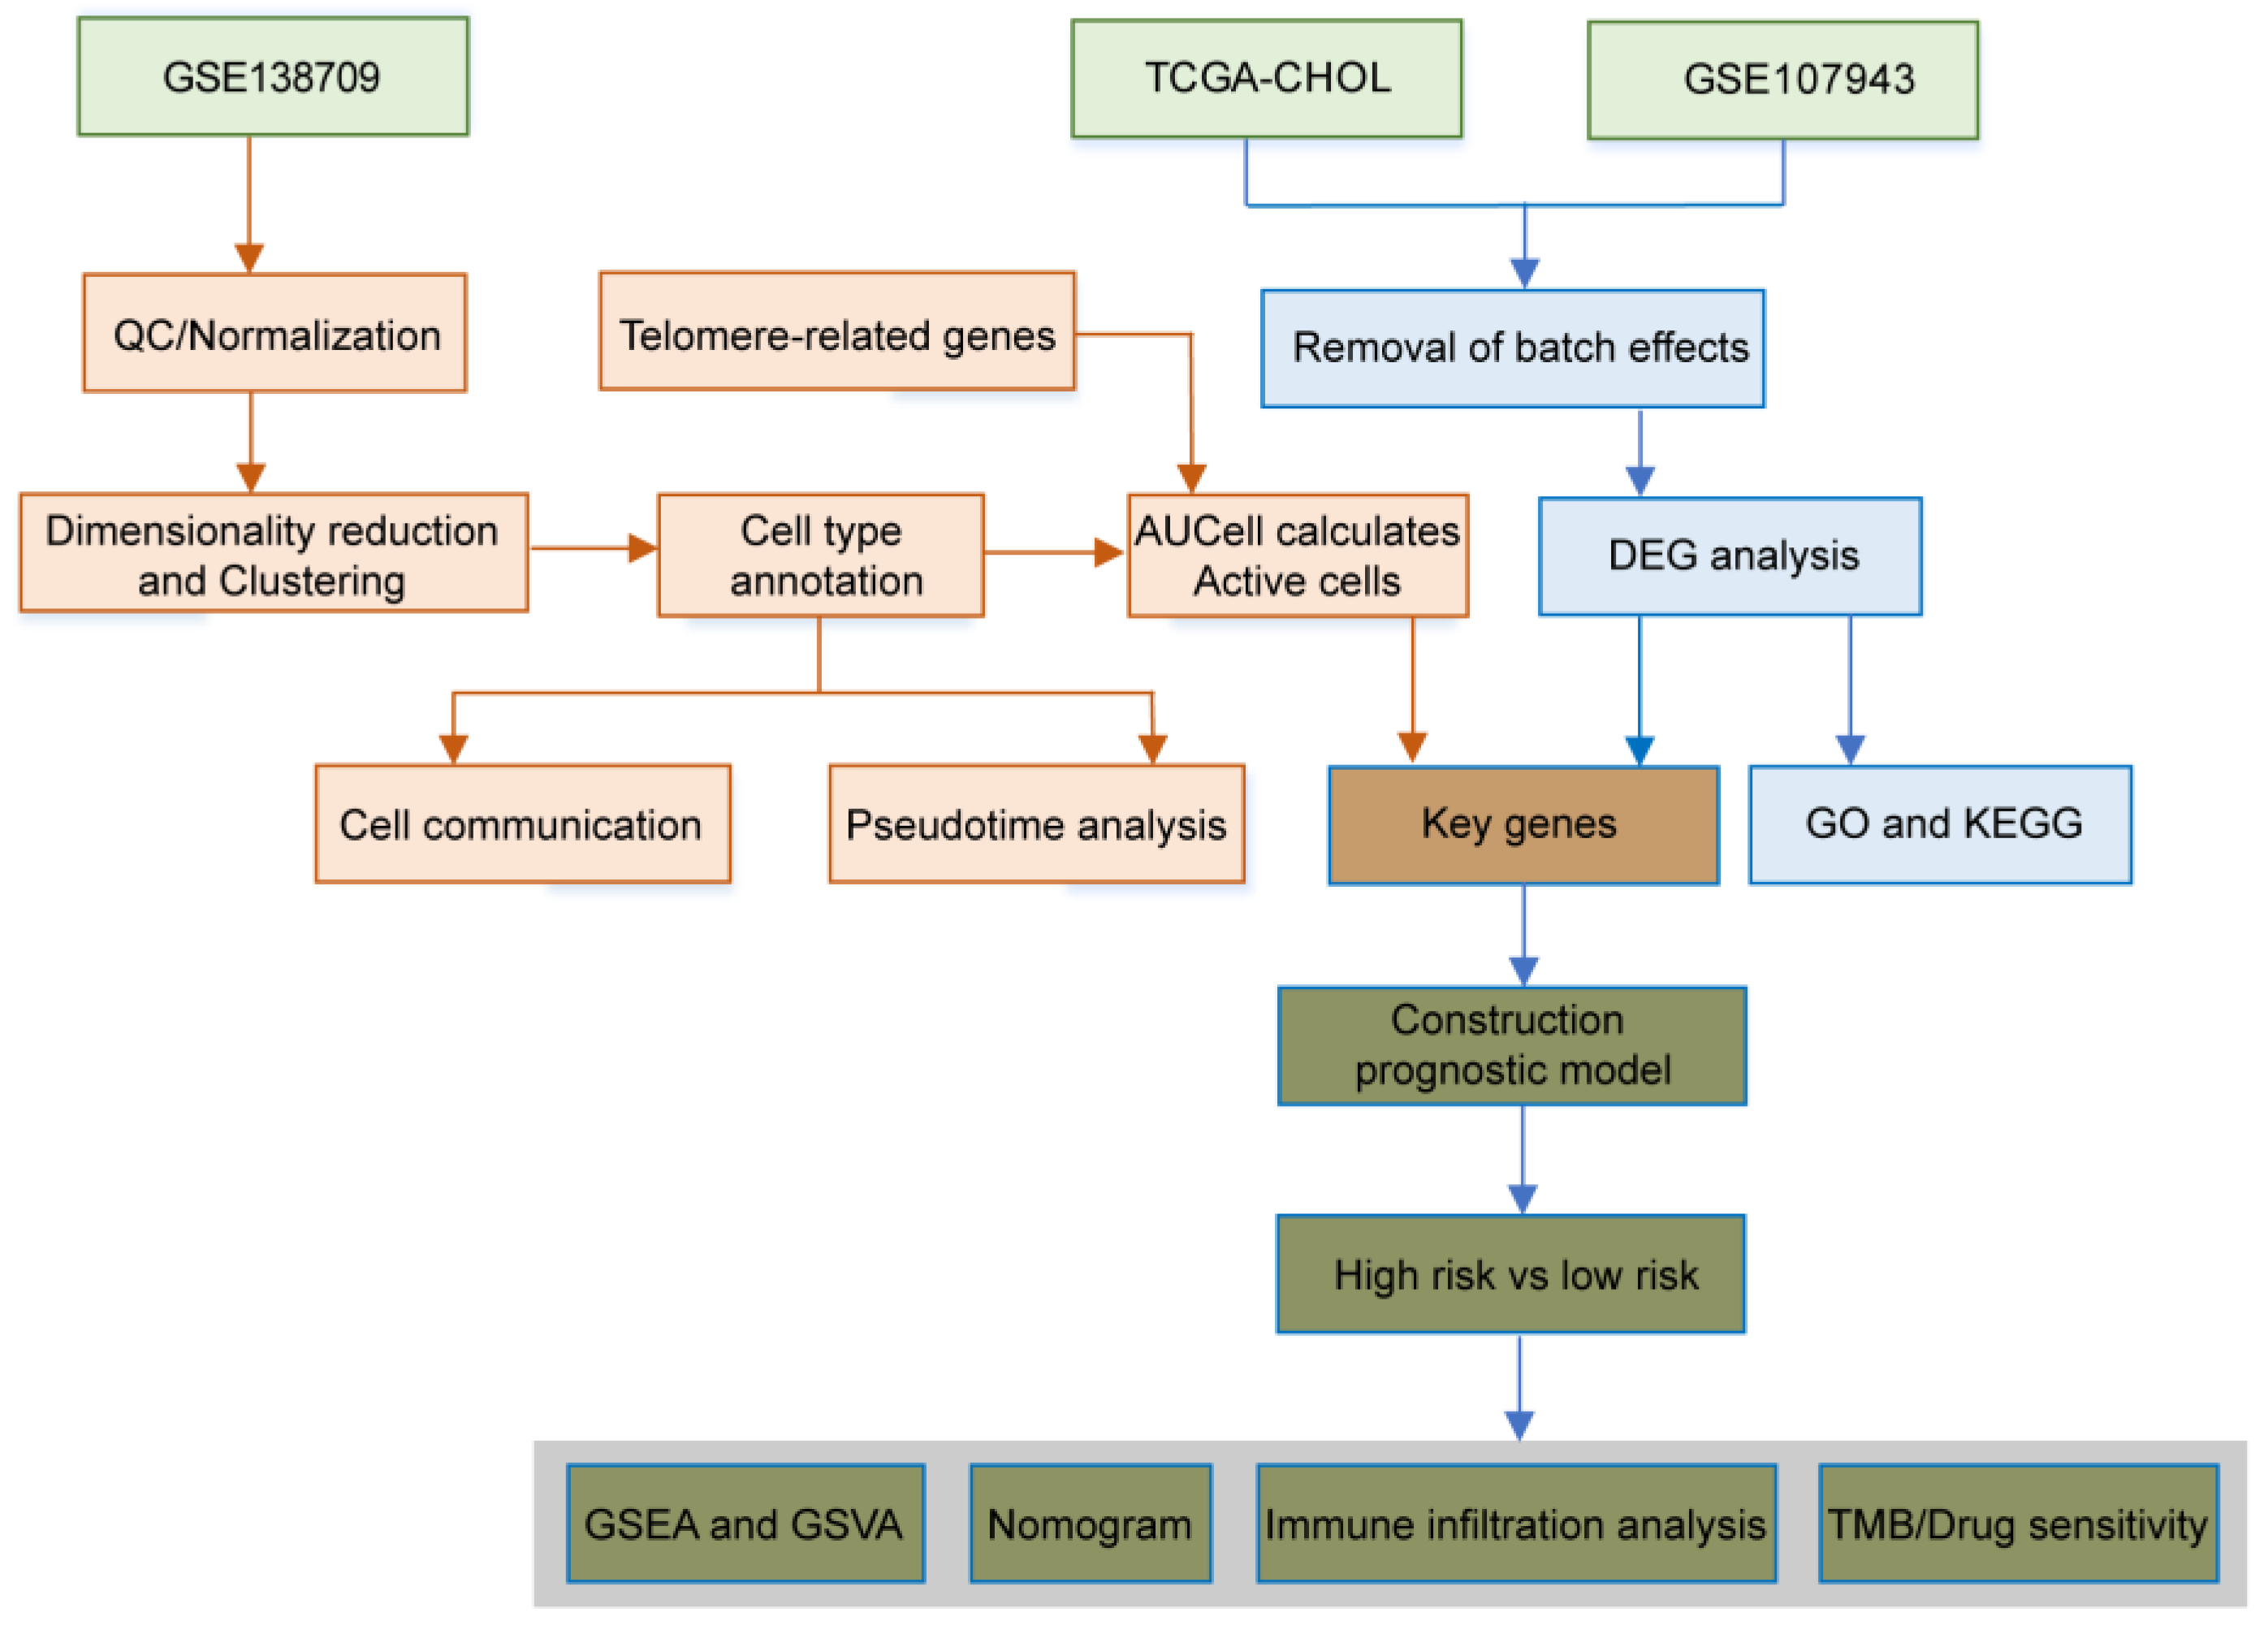
In this study, transcriptomic data, clinical data, and mutation data of CCA were downloaded through TCGA and GEO databases. Single-cell analysis was performed based on single-cell sequencing datasets to identify different cell types and telomere-associated active cells in CCA. The pseudotime analysis to construct cell trajectories and identify branching events, and cell communication analysis to reveal the interactions and signaling pathways between CCA cells. Next, we performed an enrichment analysis of telomere activity-related differential genes and explored the functions of these genes in biological processes and pathways. We constructed prognostic models and column line plots based on the acquired prognostic-related genes, predicted the overall survival of patients, and evaluated the efficacy of the models. Furthermore, we conducted gene set enrichment analysis, gene set variant analysis, immune infiltration analysis, and drug sensitivity analysis to uncover the molecular characteristics and biological pathways underlying CCA. This comprehensive approach offers valuable insights for diagnosing and treating CCA, with the ultimate goal of discovering novel biomarkers and enhancing prognostic prediction for patients with this disease.
Discussion
In order to prevent incomplete replication and instability that can occur at the ends of linear DNA, eukaryotic chromosomes end with characteristic repetitive DNA sequences within special structures called telomeres. Regarding the functions and roles of telomeres, which have attracted the attention of researchers for a long time. Earlier studies have shown a strong relationship between telomeres and human aging. As early as 1990, researchers found that the during aging in vitro and in vivo, the number and length of telomeric DNA in human fibroblasts actually does decrease with successive generations [
34]. In 2002, it was demonstrated that aging at the clonal level occurs through telomere shortening (a region of DNA near the end of a chromosome) shortening. Telomere shortening leads to chromosome instability, breakage and mutation, which in turn leads to an increased rate of cancer in people of advanced age [
35]. Then, with continuous research, telomeres have been found to play an very important role in tumorigenesis and development. About 85% of tumor cells maintain telomere length by activating telomerase, and about 15% of tumor cells use homologous recombination or other mechanisms to maintain telomere length when telomerase is inactivated or insufficient, which are collectively known as alternative lengthening of telomere (ALT). The presence of ALT enables tumor cells to maintain long telomere length and thus achieve unlimited proliferation [
36]. This result was confirmed in different cancers, but it seems that the relationship between telomere length and cancer is not a simple one-dimensional relationship, and different directions of influence were shown between different cancers. For example. For instance, one study analyzed leukocyte telomere length (LTL) in relation to prostate cancer (PCa) using Mendelian randomization and found that longer LTL was associated with a higher risk of PCa [
37]. But in another study it was mentioned that sustained cell proliferation or rapid cell renewal through hepatocellular injury leads to a multi-step hepatocellular carcinogenesis process. Therefore, progressive shortening of telomeres and activation of telomerase may be useful markers for early detection of malignant progression of liver disease [
38,
39]. And a recent study mentioned more frequent telomerase reverse transcriptase (TERT) promoter mutations in HCC with significantly higher TERT expression and longer telomere length. TERT promoter mutations were associated with higher TERT levels and longer telomere length and were also independent predictors of poorer overall survival after hepatectomy [
40].
What is puzzling is that cancer cells generally possess long telomeres, which seems to go against conventional knowledge? The plausible answer is that cancer develops through a succession of mutations that bypass cell cycle checkpoints when cell replication is out of control. Thus, shorter telomeres may constitute a fail-safe mechanism against potentially cancerous cells. Most cancers show telomerase activity or employ other mechanisms (ALT pathway) to bypass the telomere barrier [
41,
42,
43]. It follows that the relatively short telomeres in humans are likely to be an evolutionary trade-off, with telomeres becoming shorter as we age, sacrificing the opportunity to further extend our lifespan in exchange for a strong resistance to cancer.
In cholangiocarcinoma, a search of the literature revealed a recent study that investigated telomere length and the risk of developing cholangiocarcinoma, showing an inverse linear relationship. People with the shortest telomeres had a 1.86 times higher risk of developing bile duct cancer compared to those with the longest telomeres [
44]. However, until now, no studies have been conducted to investigate the relationship between telomere-related genes and the pathogenesis of cholangiocarcinoma. In this study, we investigated the biological functions of telomere-associated genes in cholangiocarcinoma for the first time.
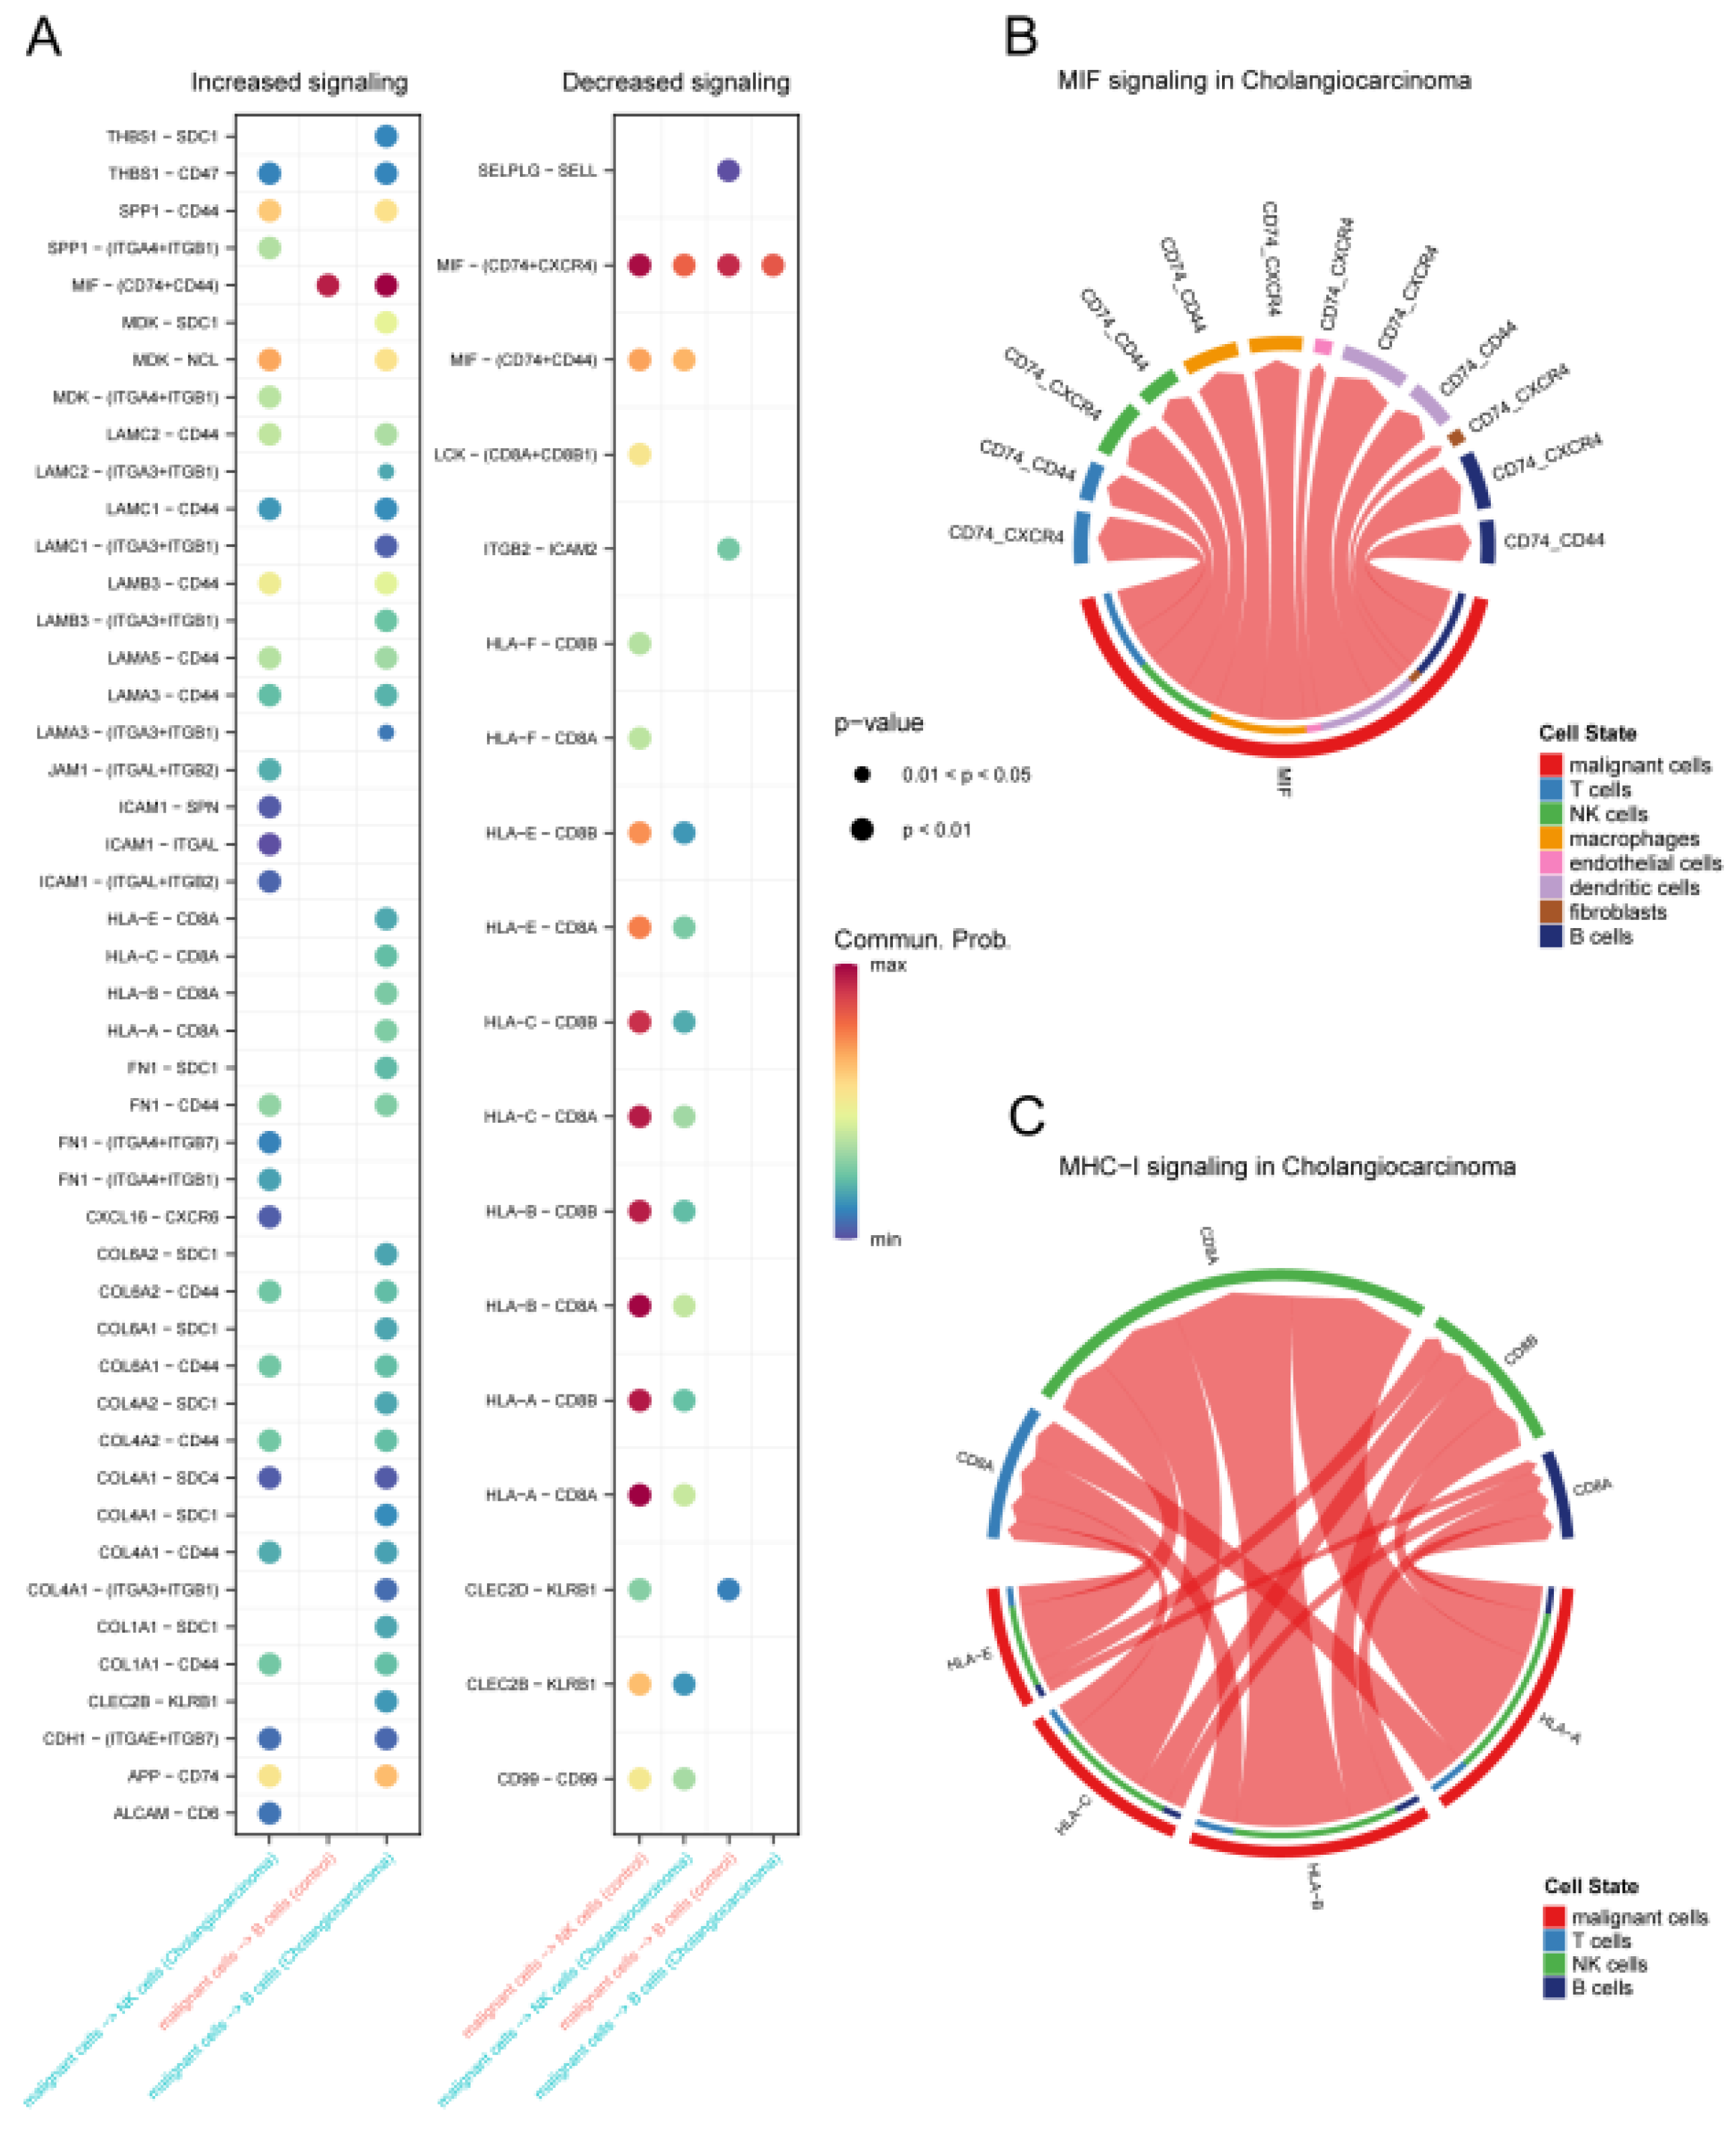
In our study, we identified different cell types in CCA samples and annotated them by cell communication analysis based on public database gene sequencing as well as single-cell sequencing data. Then, by assessing the activity of telomere-associated genes, telomere-active cells were identified mainly as malignant cells, and 452 telomere-associated active cells were found. Pseudotime analysis was performed to reveal the transcriptional status and differentiation process of CCA cells. In addition, the important gene expression programs in CCA were further explored, and malignant cells were found to have an important role in the proliferation of CCA cells via MIF-(CD74+CXCR4), HLA-A-CD8A, and the ligand HLA-A was highly expressed in NK cells. The next studies targeting the two up-regulated pathways may bring new inspirations and ideas for further mechanistic elaboration and diagnosis of CCA cells.
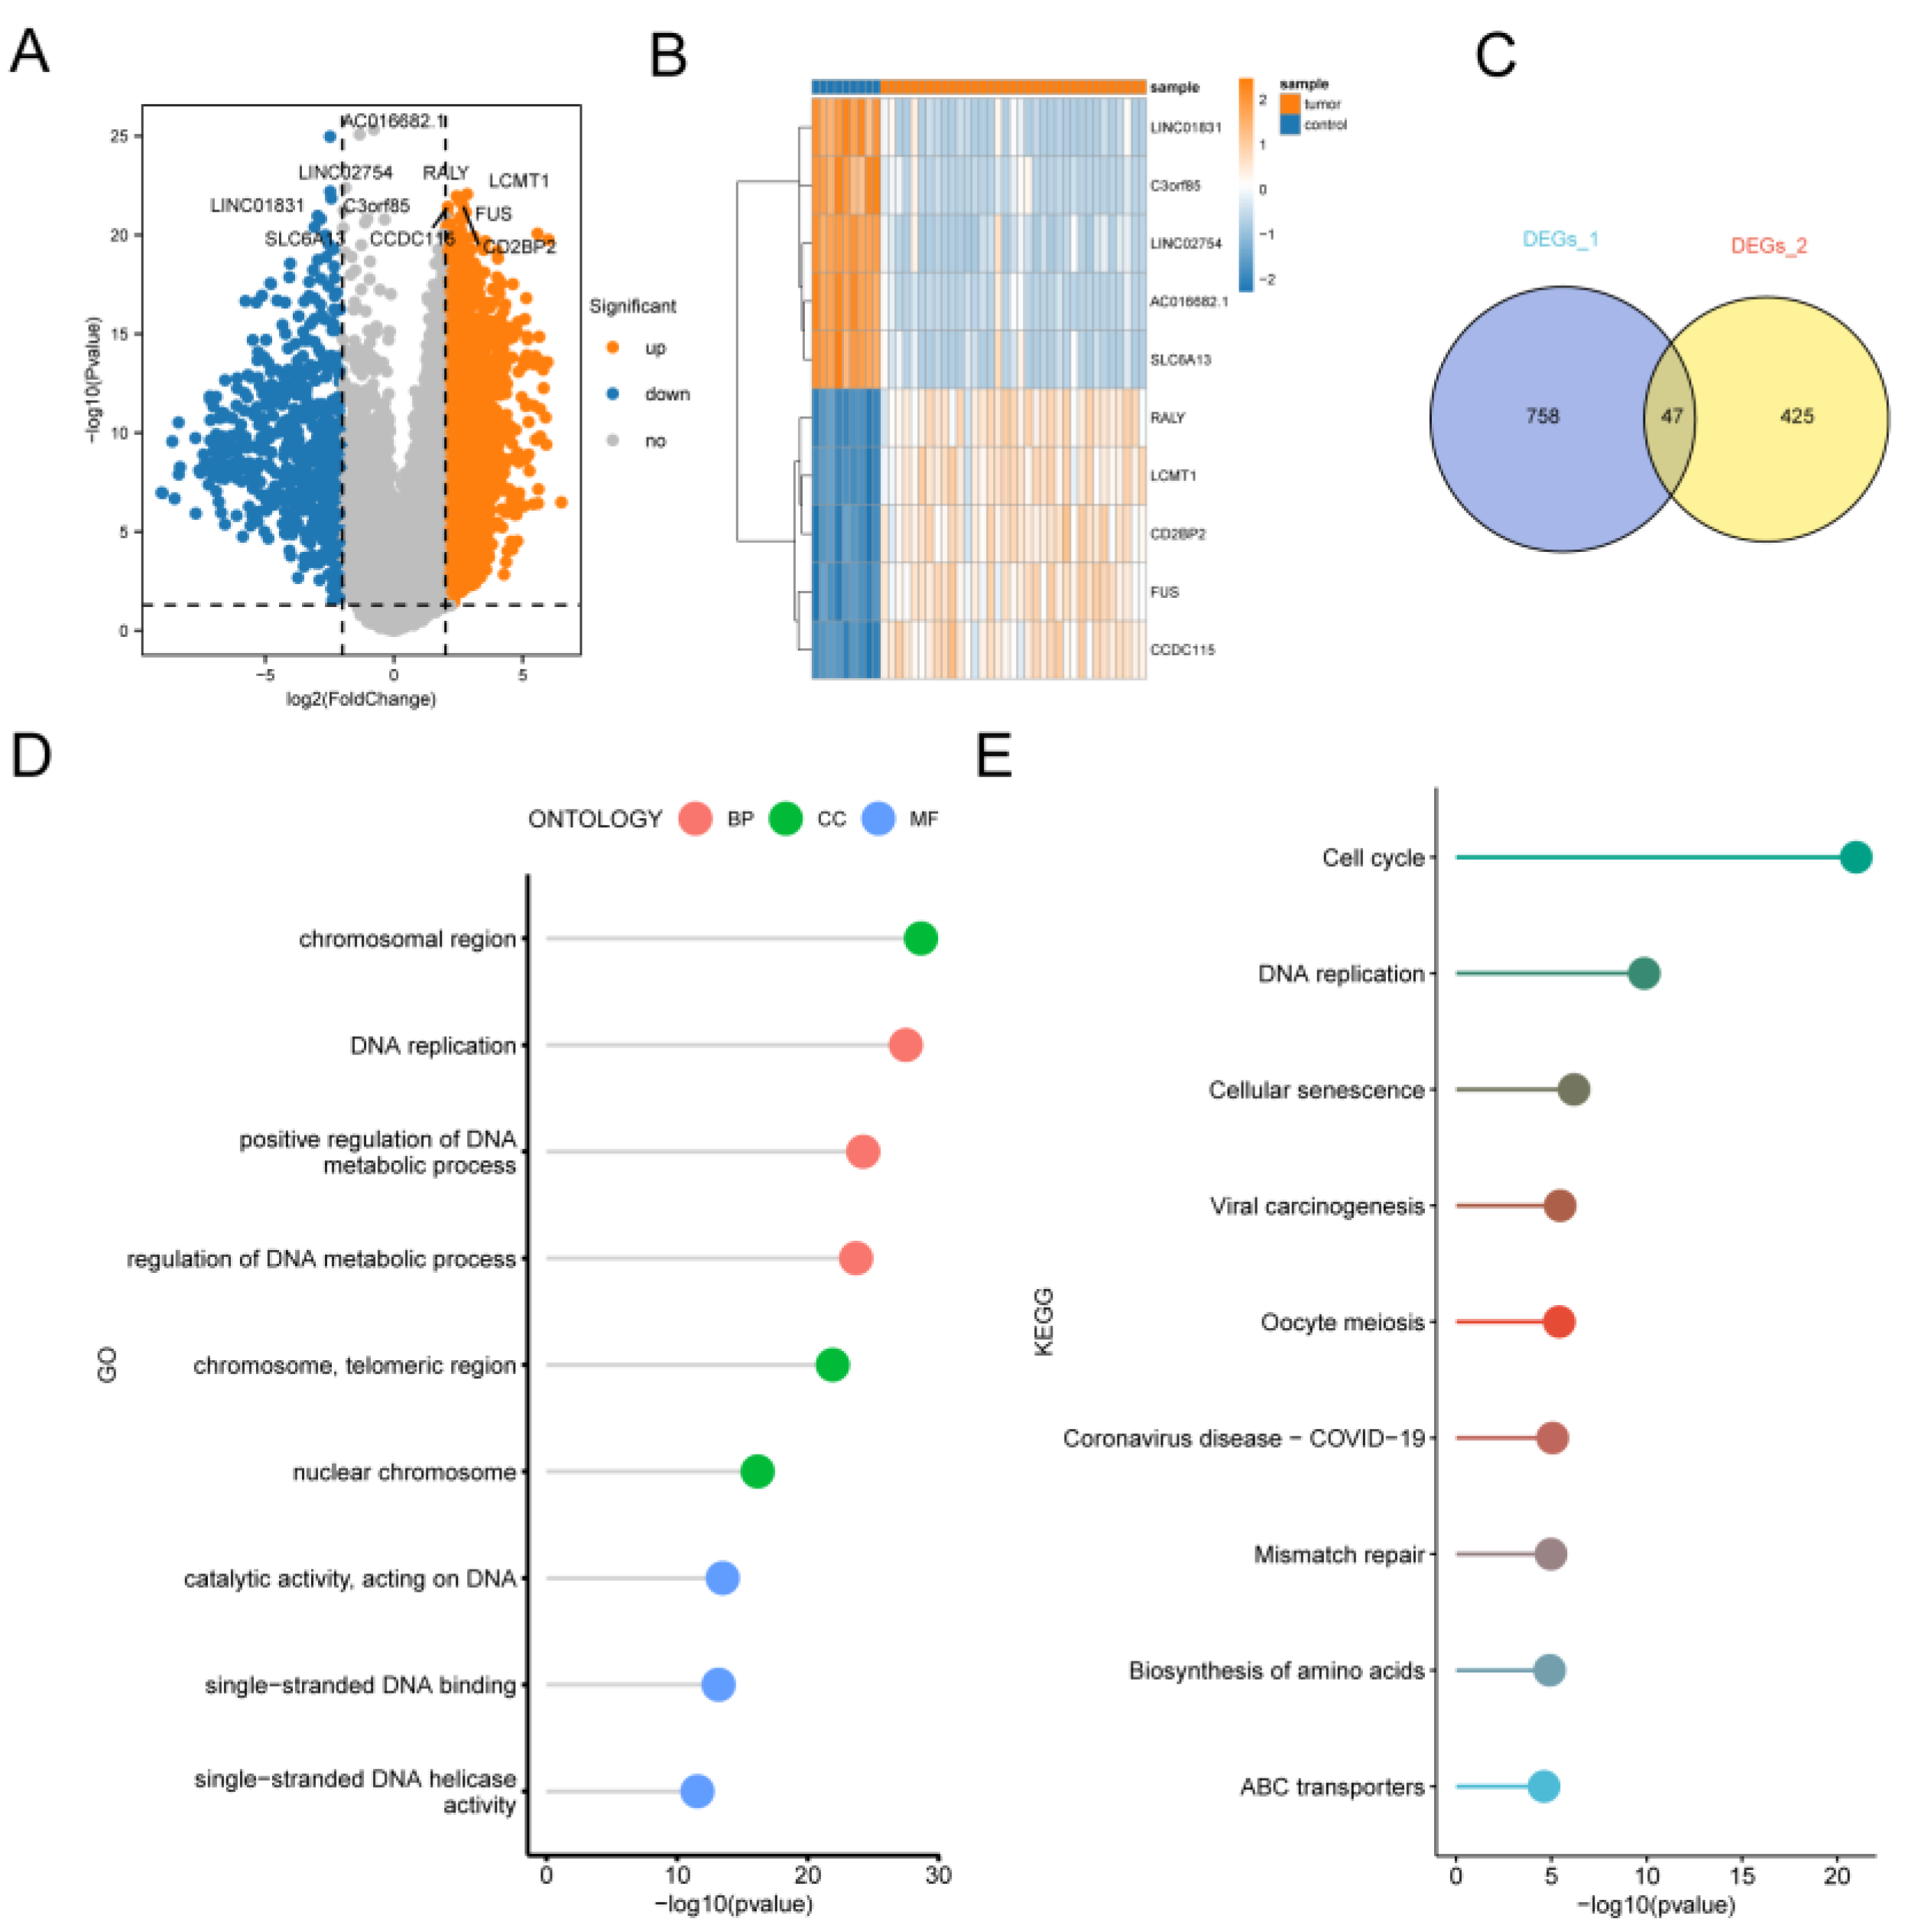
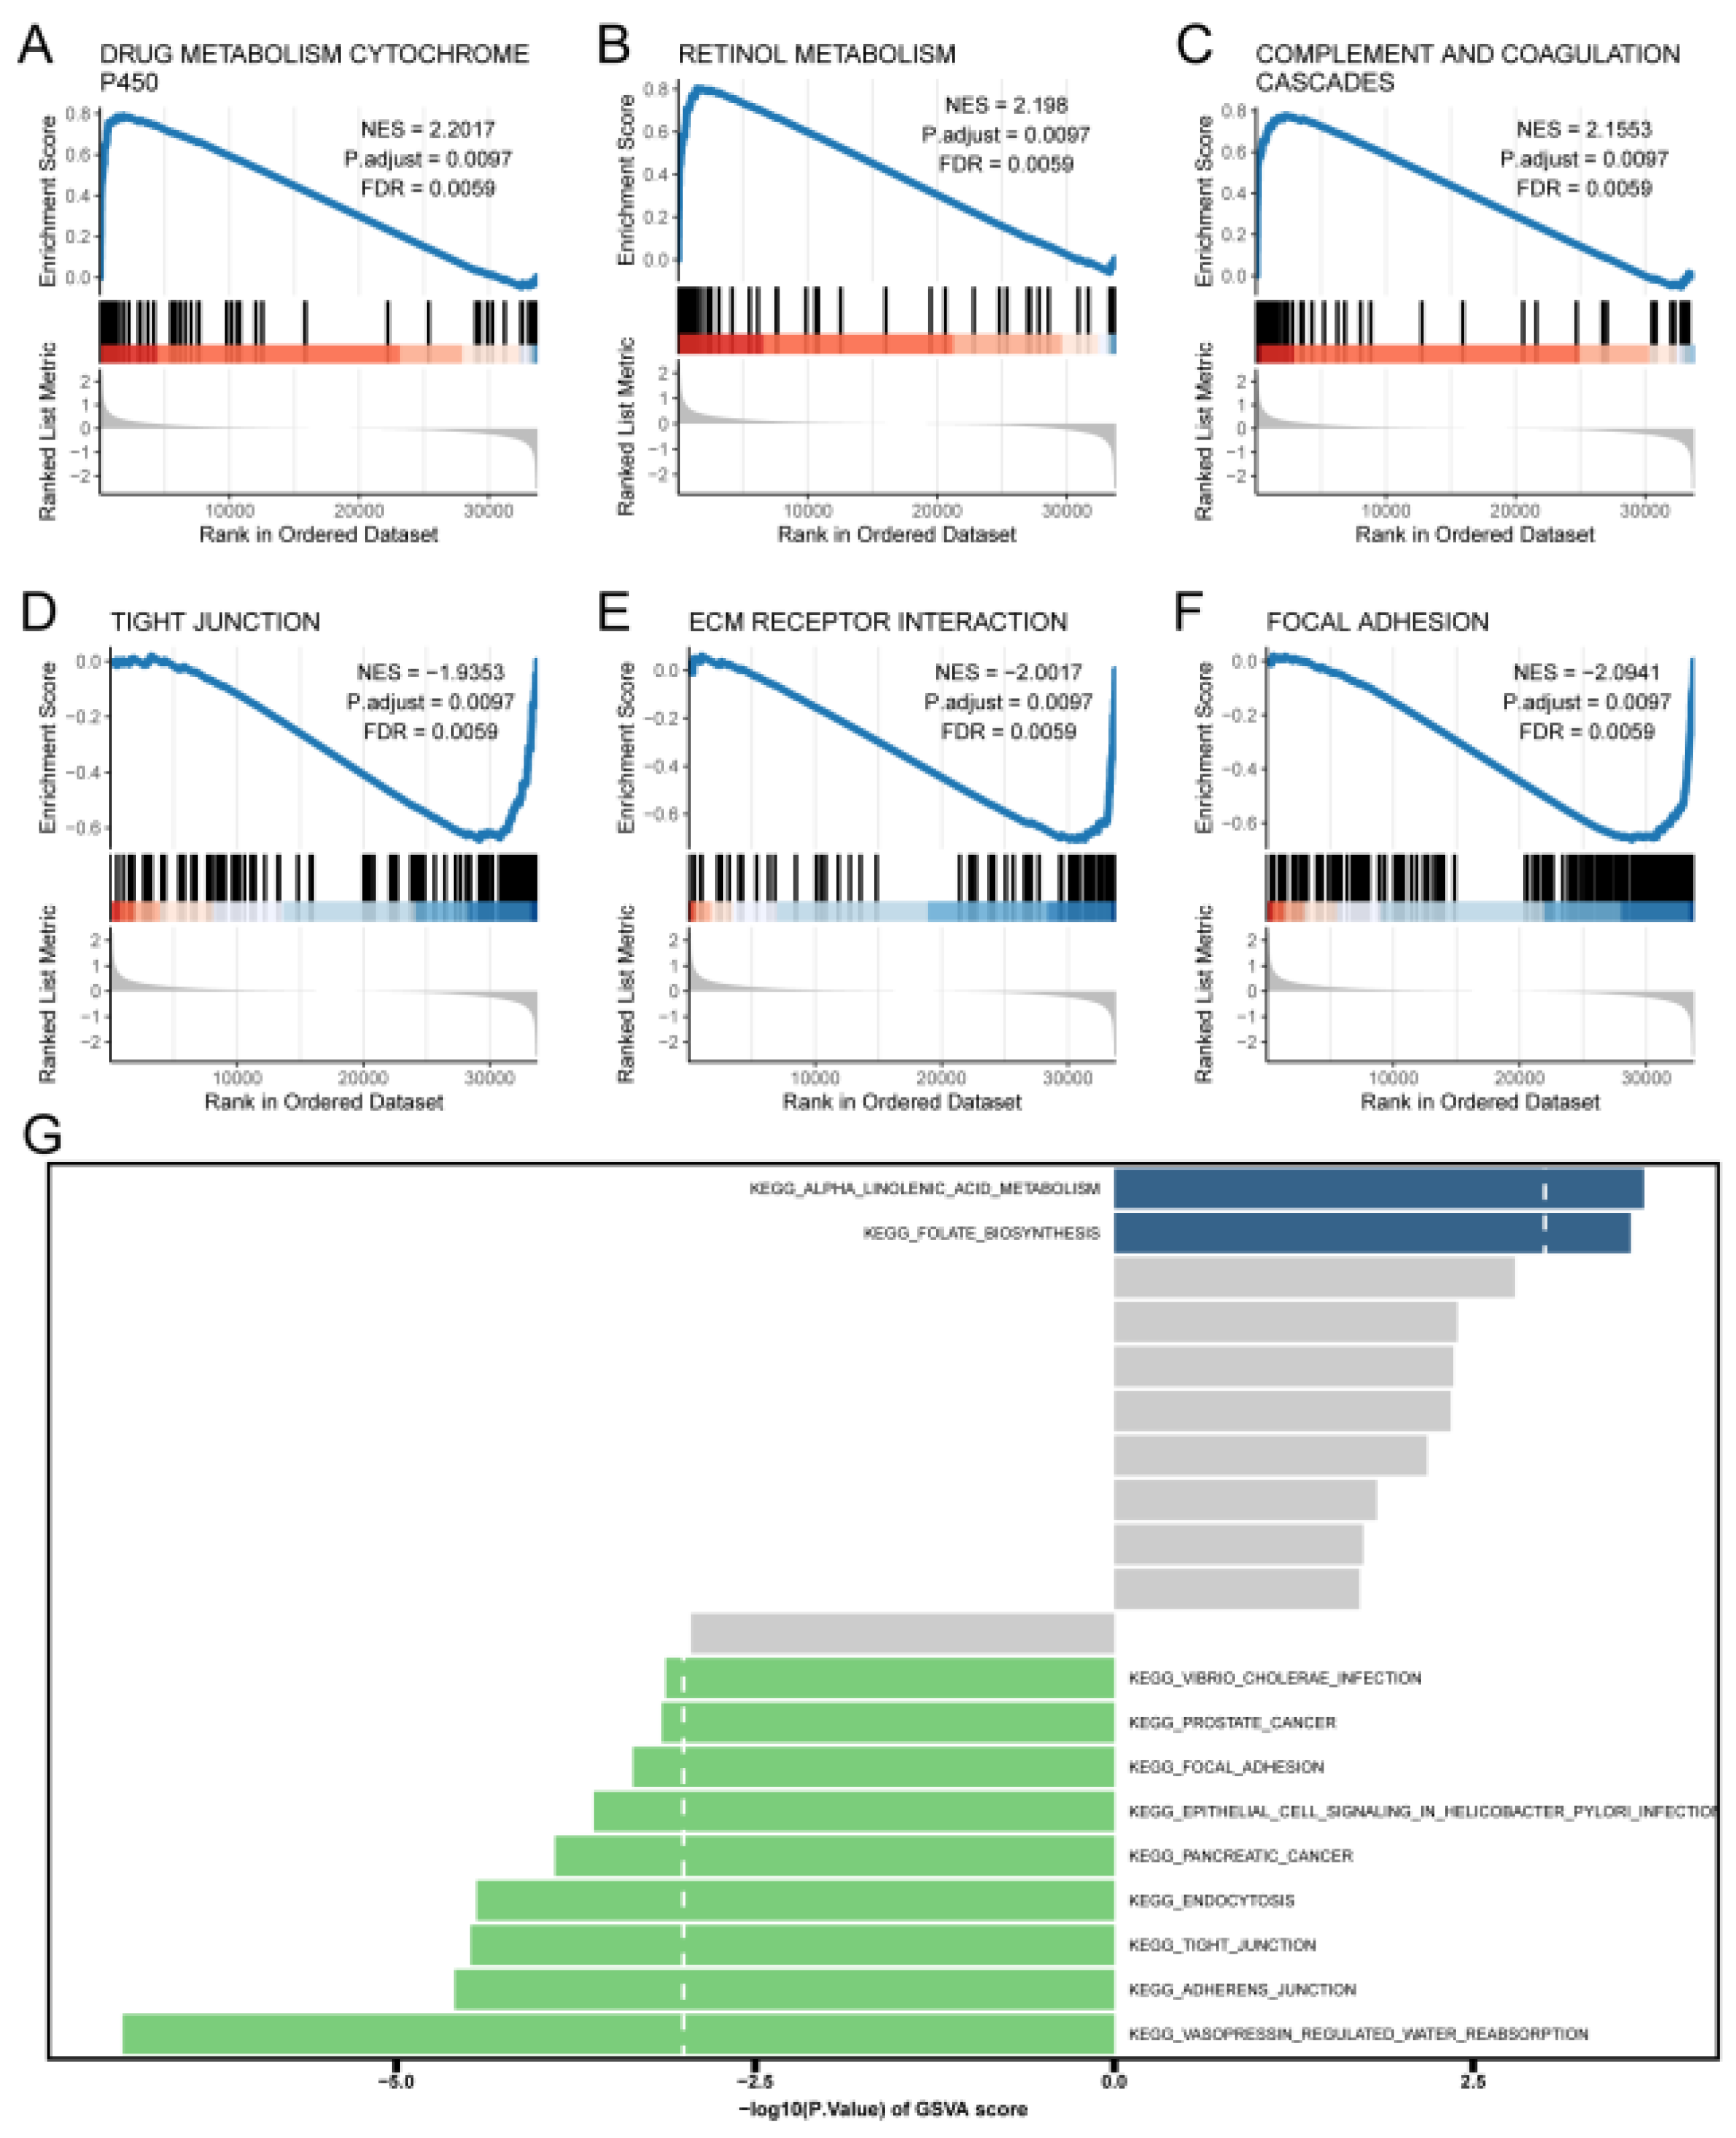
By taking the intersection of differentially expressed genes with telomere activity genes, 47 key genes related to telomere activity were identified. The enrichment analysis of GO and KEGG pathways for telomere-related differential genes revealed that they were mainly involved in DNA replication, positive regulation of DNA metabolic process, and other biological functions. They are also involved in important cellular metabolic pathways such as “Cell cycle”, “DNA replication” and “Cellular senescence”, suggesting that telomere-associated differential genes are closely related to the cell cycle, cell proliferation, and cellular metabolism. genes are closely related to cell cycle and cell proliferation. The GSEA analysis showed that drug metabolism cytochrome P450, retinol metabolism, complement and coagulation cascades, tight tunction, ECM receptor interaction, focal adhesion and other important cellular metabolic pathways are also relatively active in CCA. Studies targeting these pathways may shed more light on the mechanism of telomere activity genes in CCA.
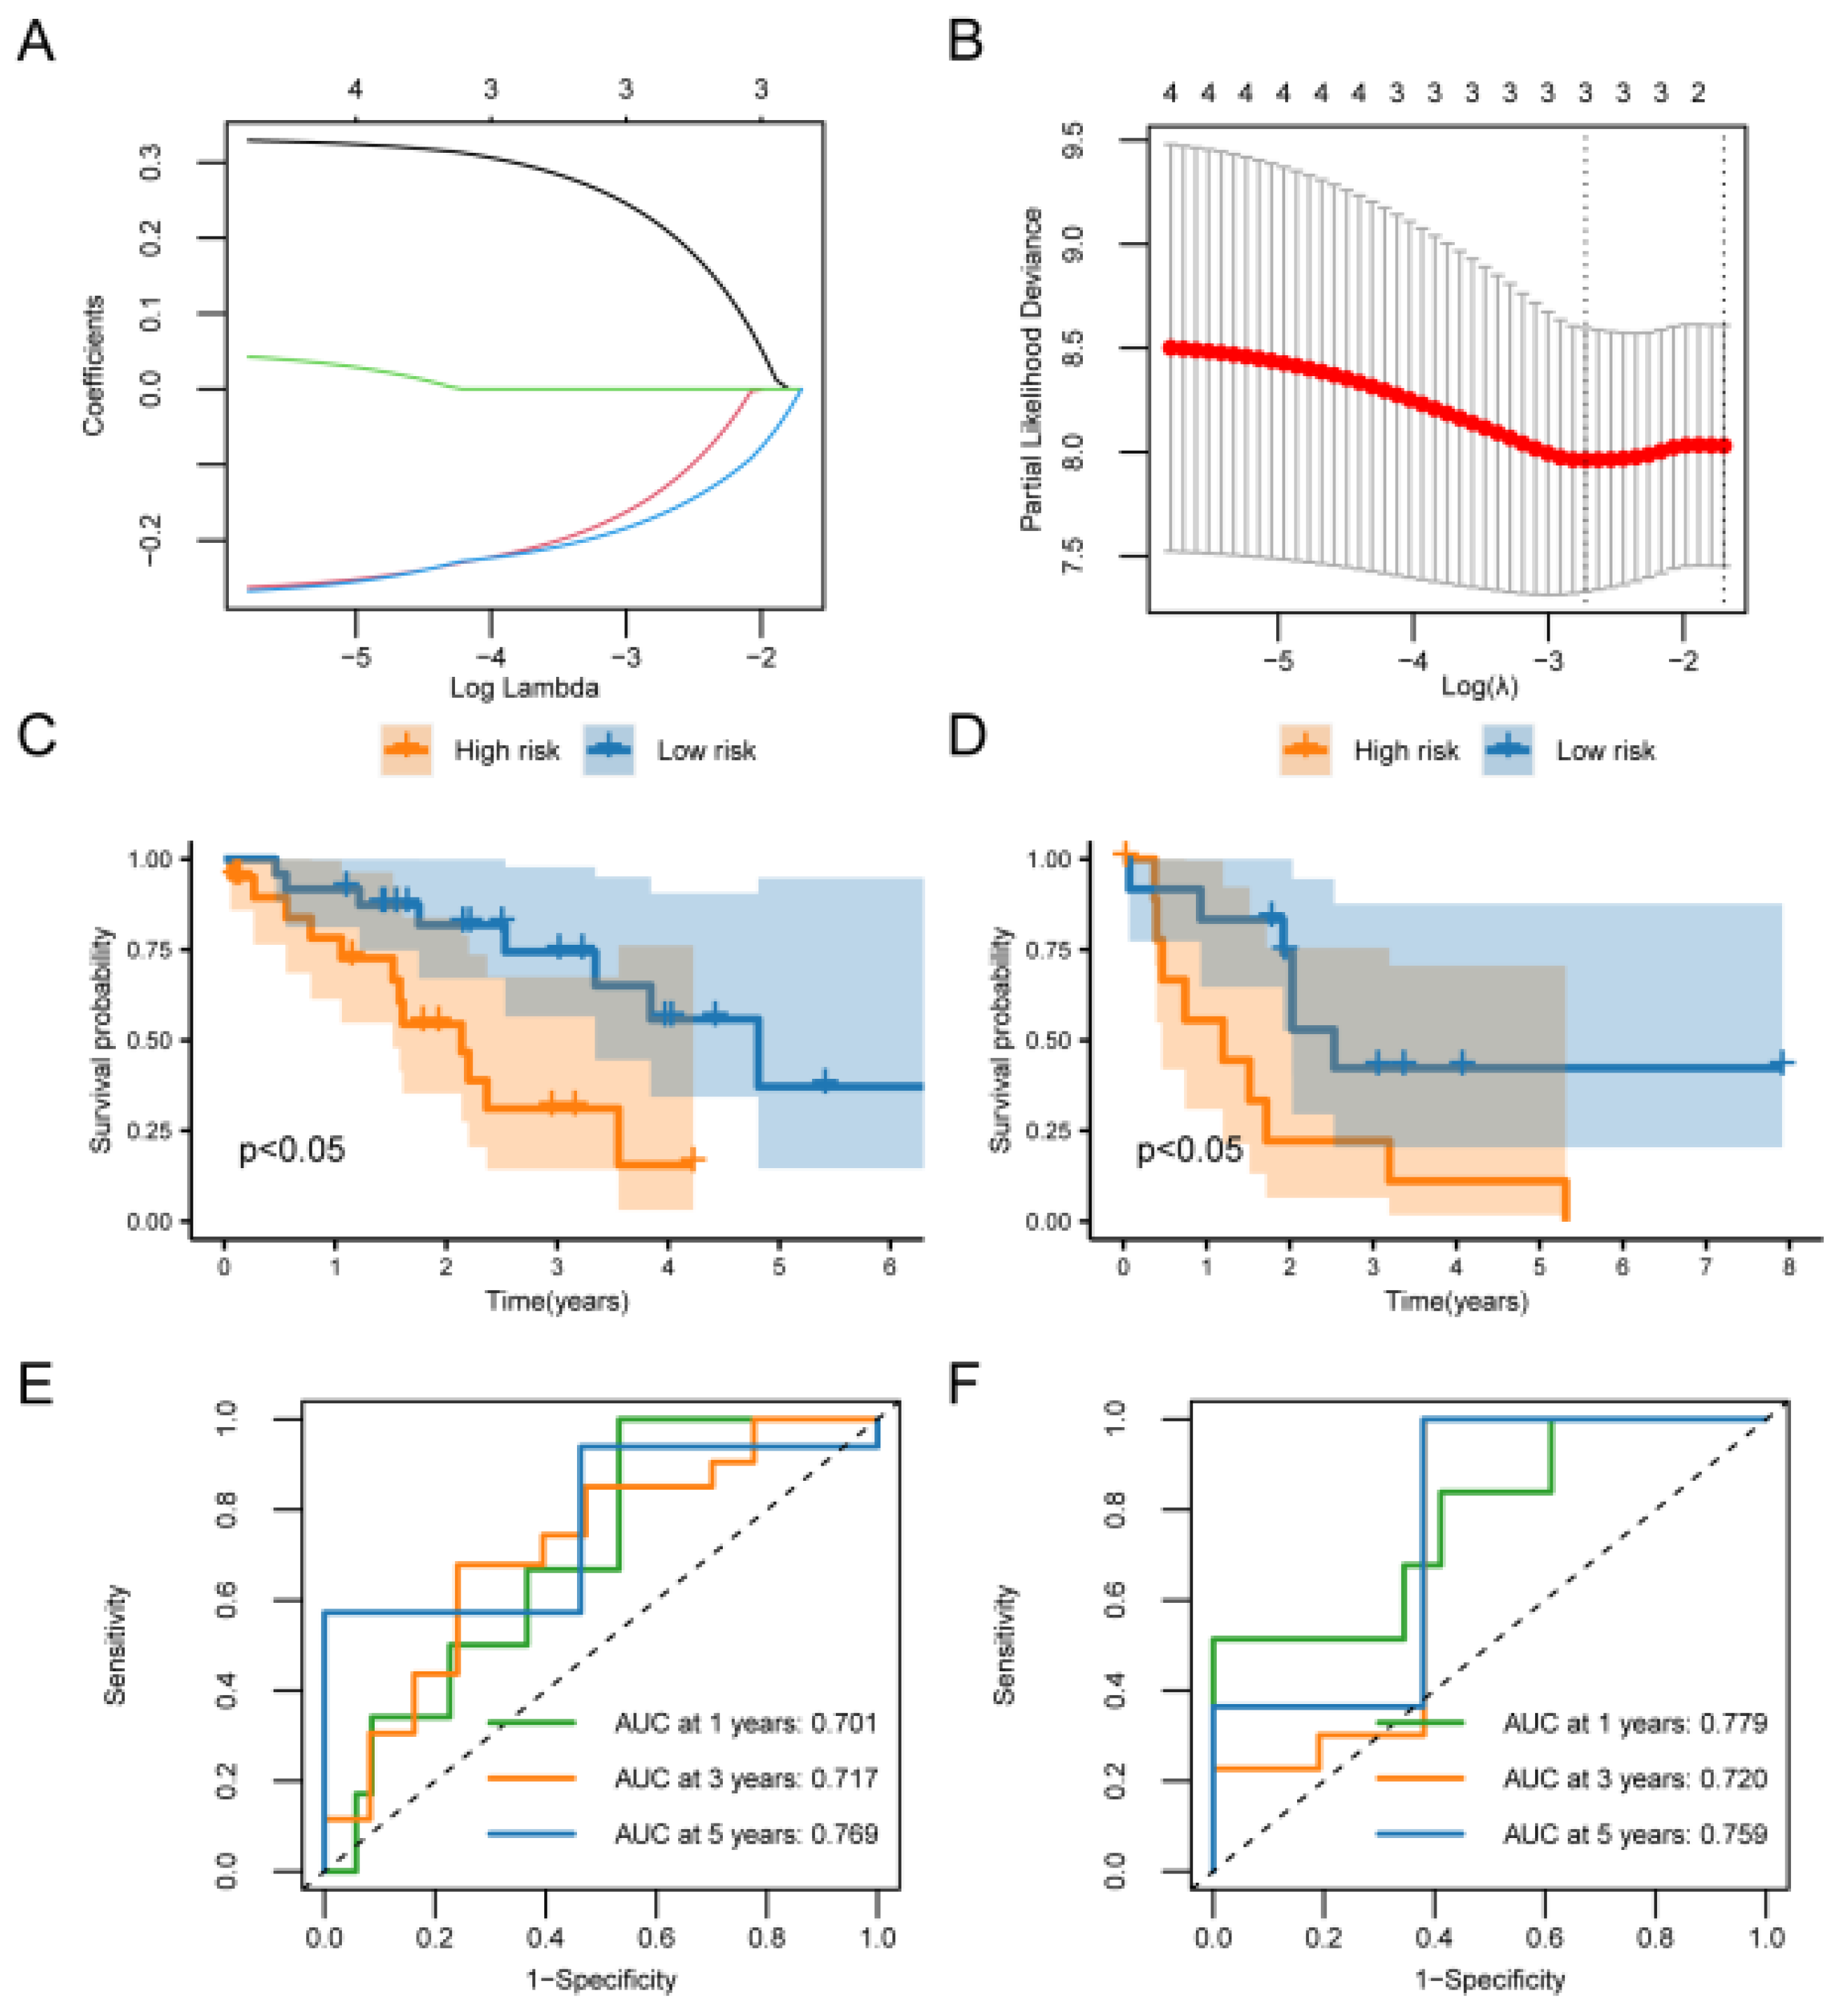
Next, three genes associated with the prognosis of CCA patients were identified using one-way Cox analysis and LASSO regression analysis. A prognostic model was constructed based on the expression levels of these three genes related to the prognosis of CCA patients and the predictive efficacy of the model was verified. The results showed that the prognostic model showed good predictive efficacy and had the potential for further clinical research. However, further clinical studies are needed to demonstrate this.
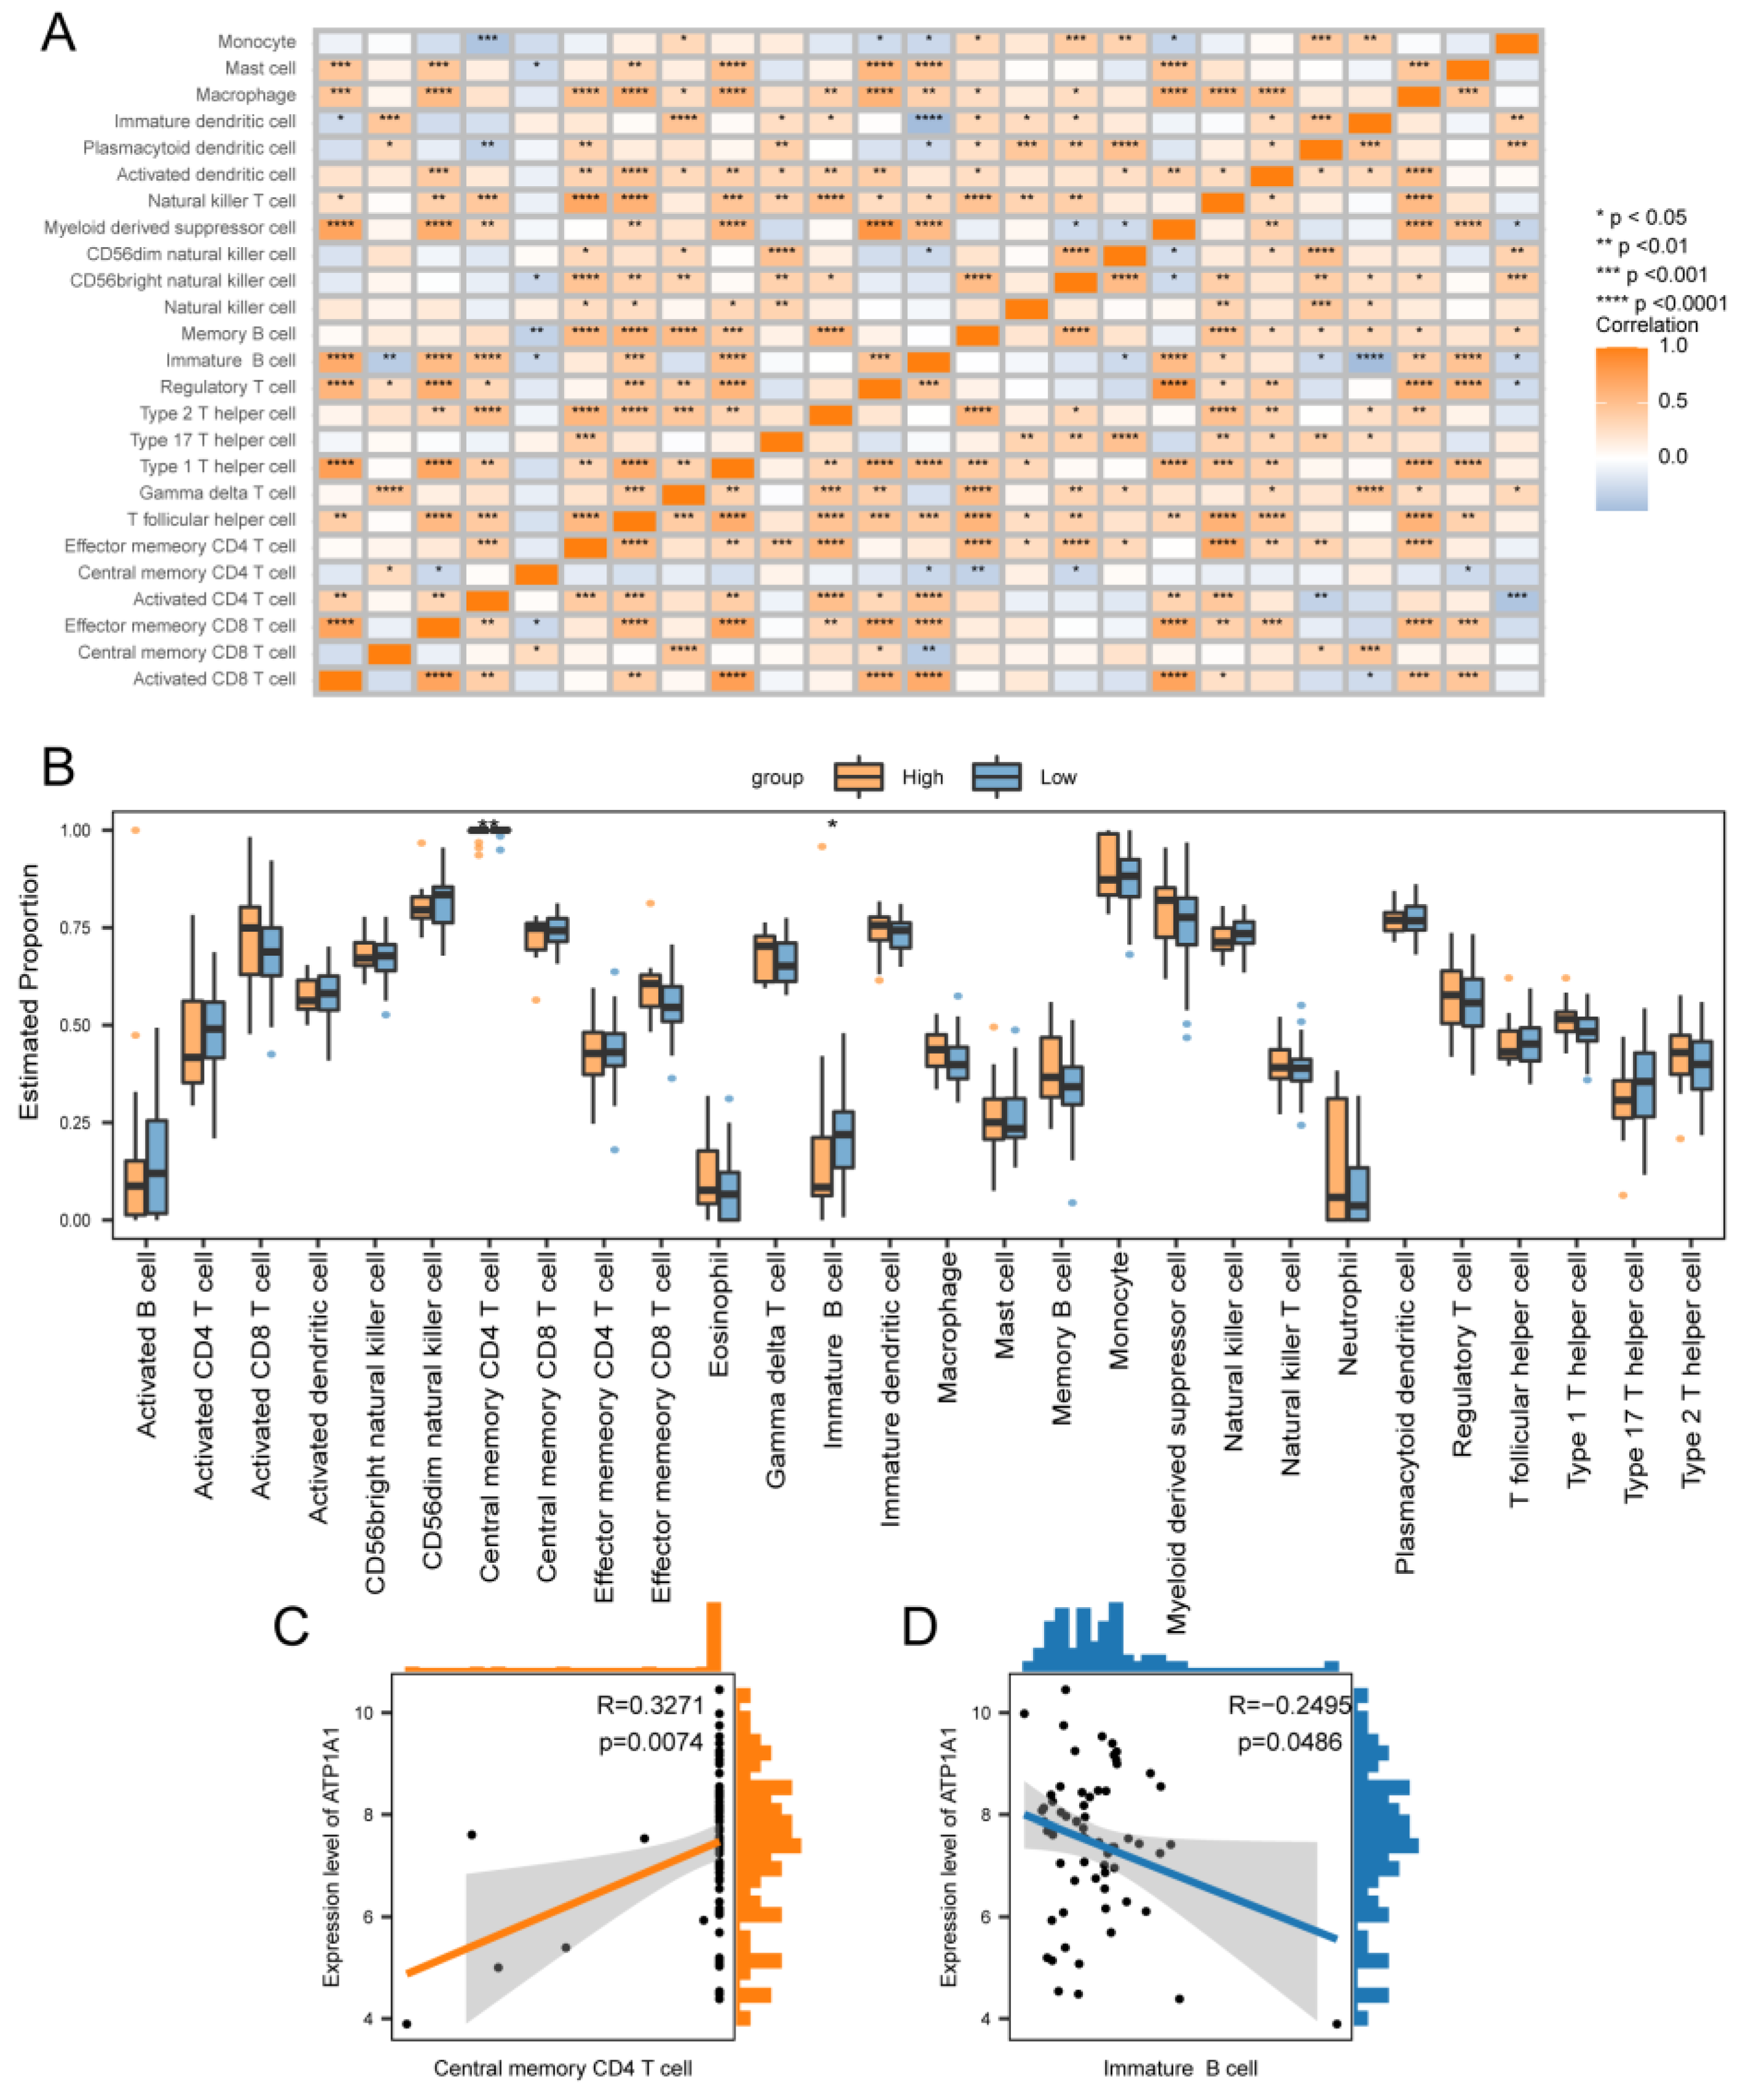
Tumor immunity is always an essential topic in oncology research, and this study also addresses tumor immunity in CCA. In the process of exploring tumor immunity, most of the immune cells analyzed among immune cells were positively correlated with each other, suggesting that different immune cells are in a mutually reinforcing relationship. We also observed that the immune cells Central memory CD4 T cell and Immature B cell showed significant differences between high and low-risk groups. The prognostic gene ATP1A1 was positively correlated with Central memory CD4 T cell and Immature B cell, suggesting that the prognostic gene ATP1A1 may be closely related to tumor immunity in CCA.
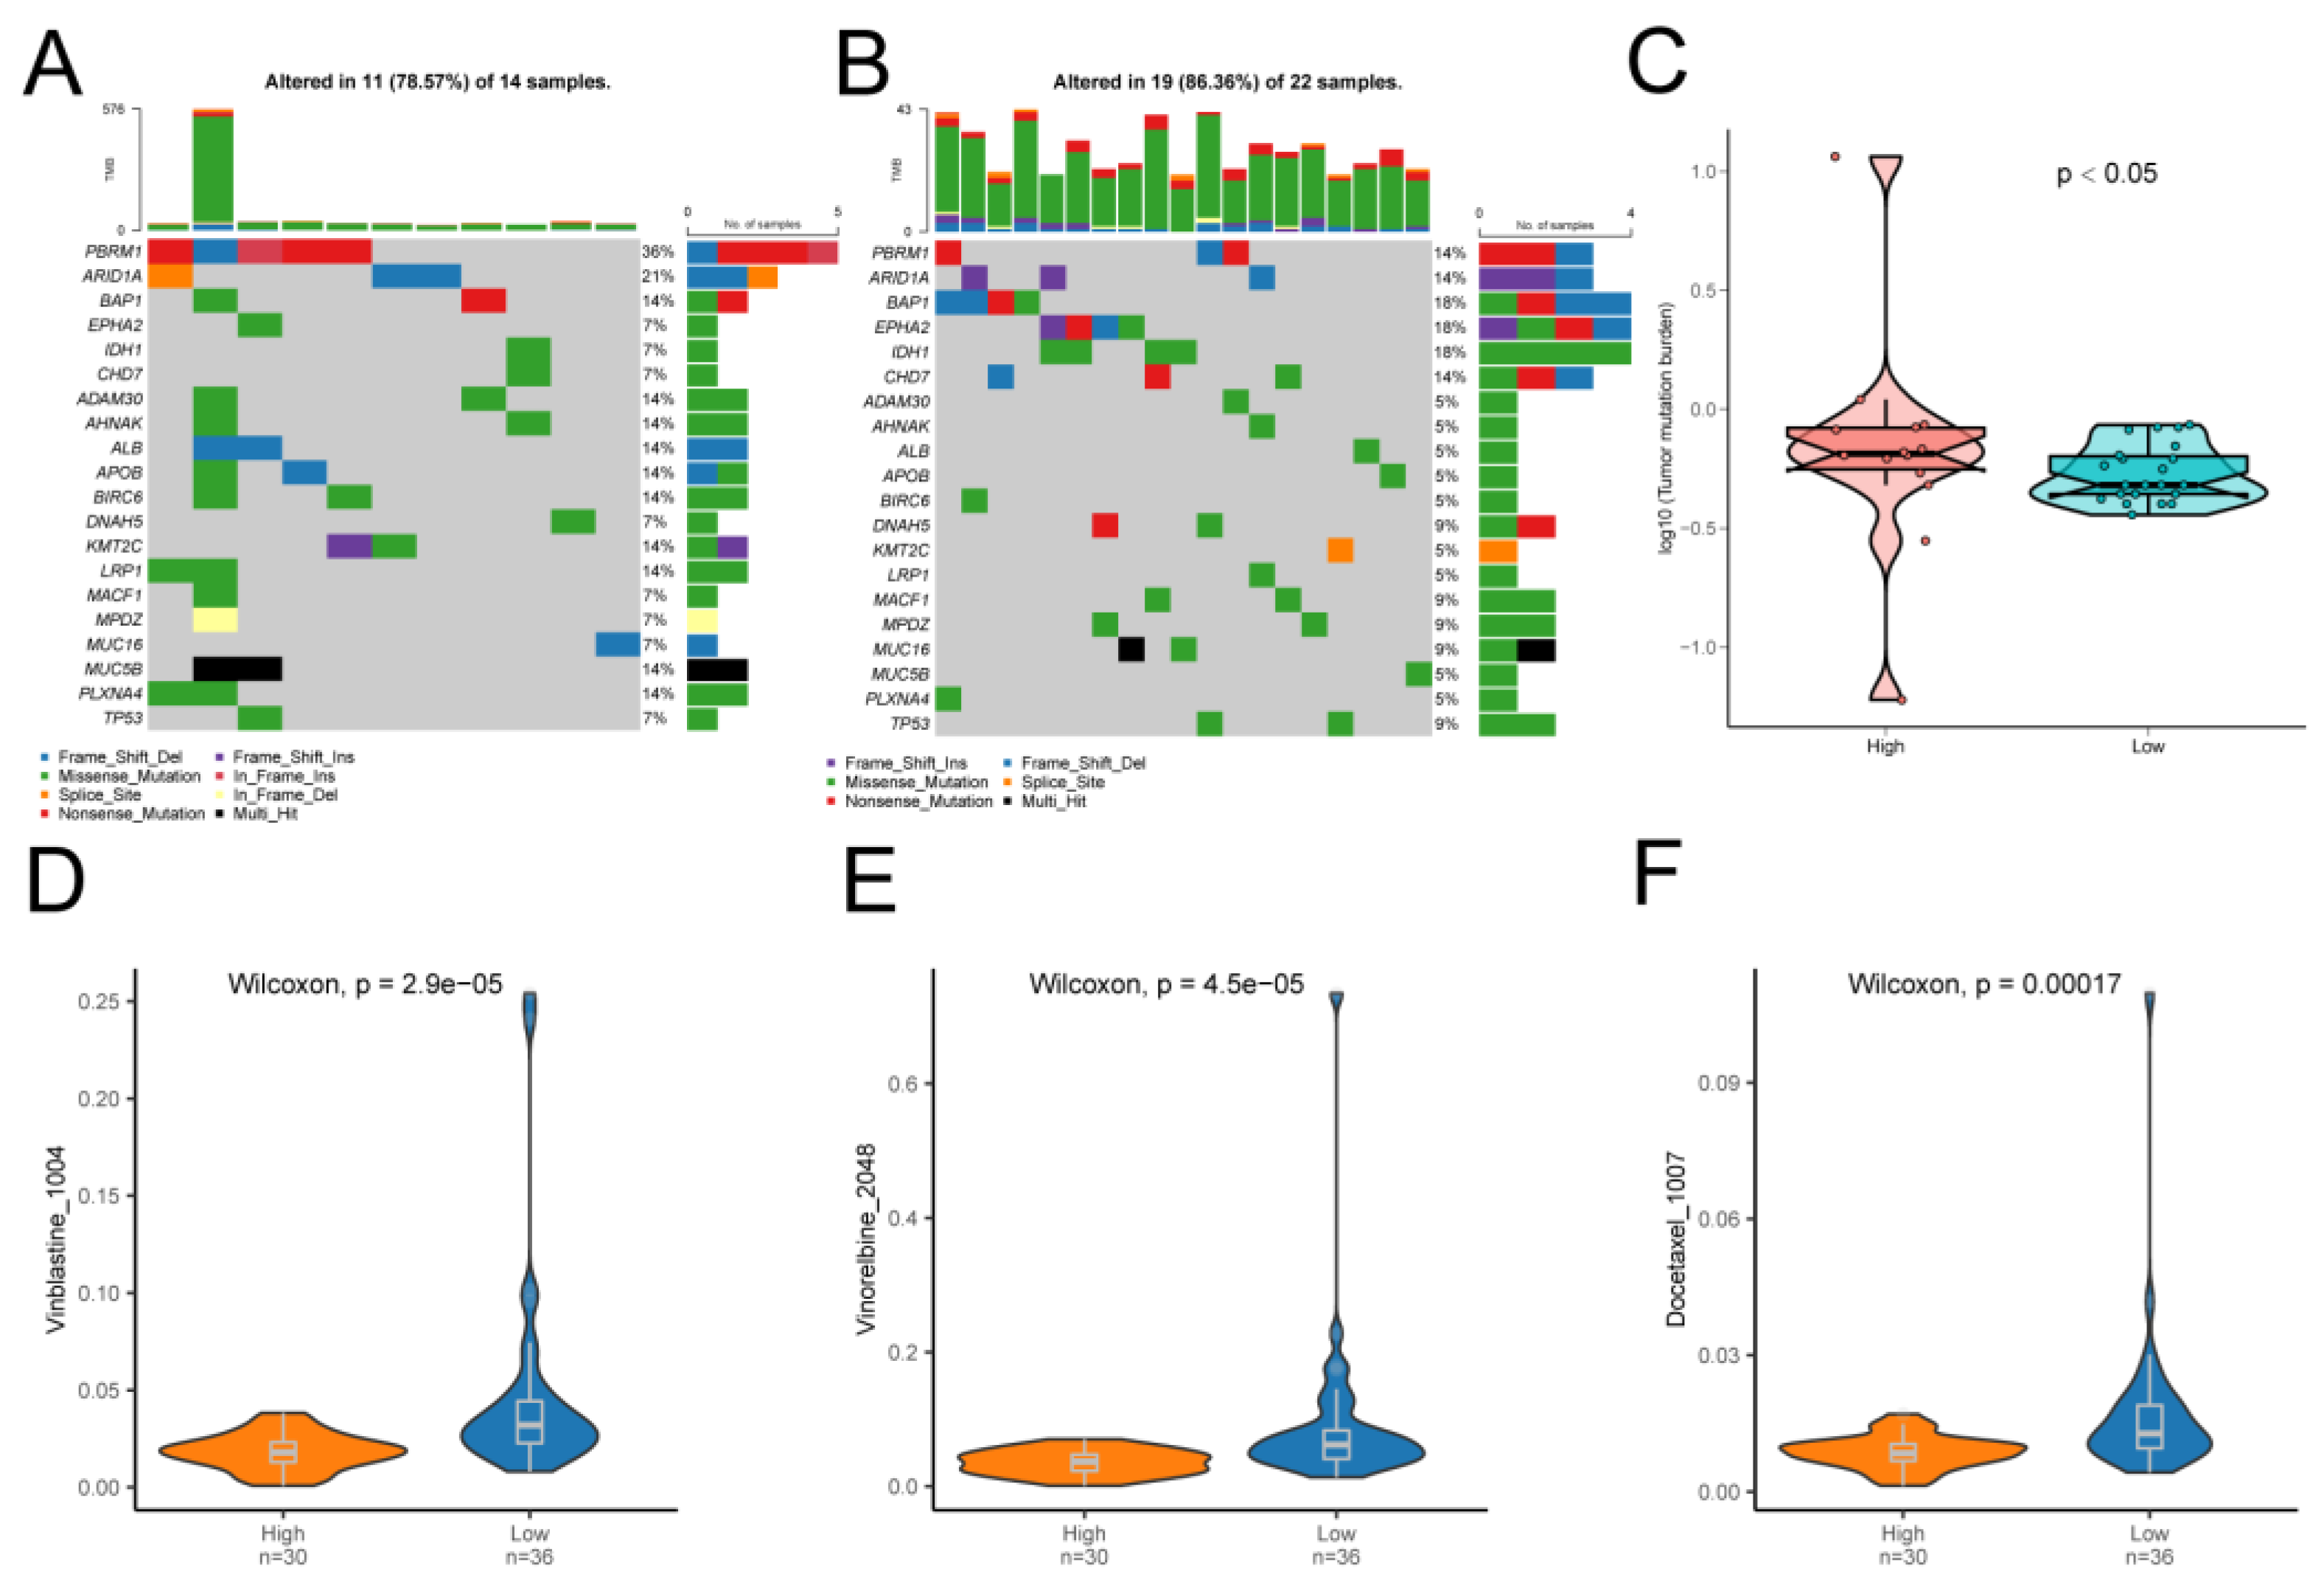
Finally, we found a very high mutation rate and high TMB of PBRM1 in patients with CCA, which may be the next therapeutic target for CCA to be further explored. The drug sensitivity analysis also revealed that patients in the high-risk group were more sensitive to Vinblastine_1004, Vinorelbine_2048, Docetaxel_1007, etc., this provides new inspiration and reference for the fine-tuned treatment of CCA, which is meaningful and necessary for further investigation.
This study is comprehensive in exploring the telomere-related active genes in CCA, there are limitations in this study as well. Although this study was conducted as scientifically and objectively as possible, there are still some irresistible interfering factors, such as this study is based on data from public databases, and the results are affected by the original data. Secondly, the data of the study came from different organizations, and there are inaccuracies that have an impact on the results.
Figure 1.
Flowchart of this study.
Figure 1.
Flowchart of this study.
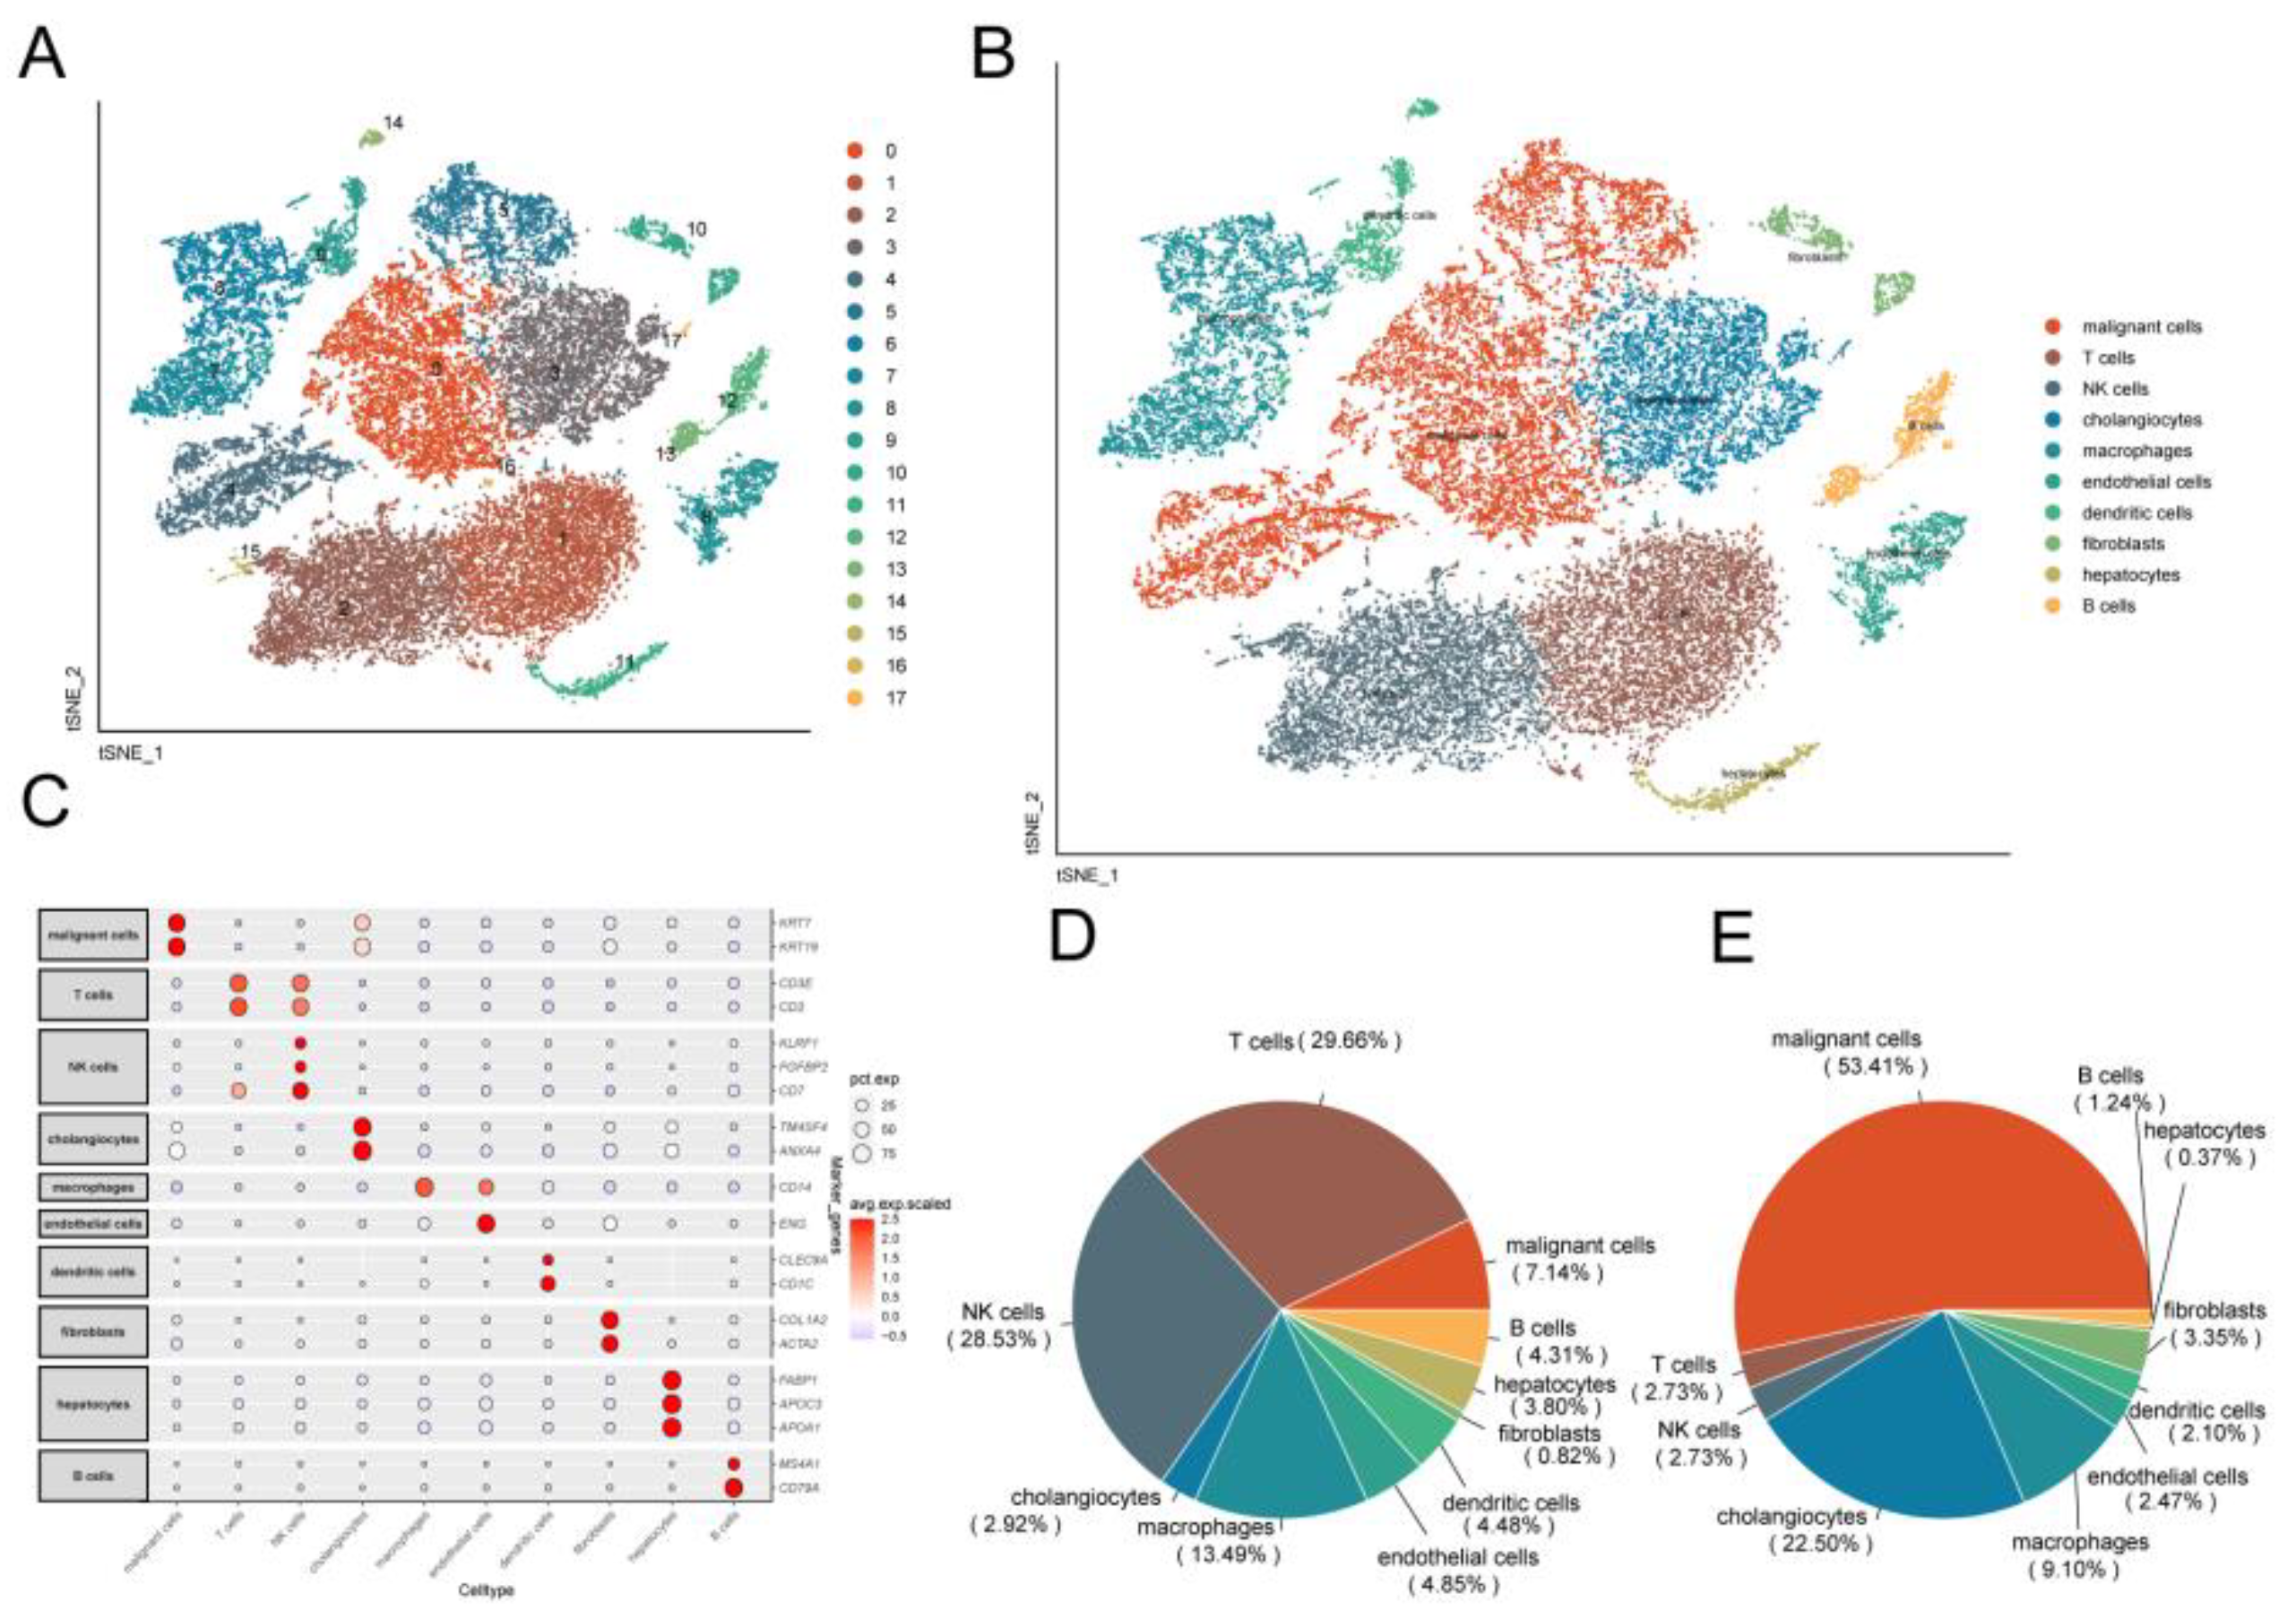
Figure 2.
Identification of cellular subpopulations from single-cell sequencing data. (A) TSNE plot showing the distribution of single-cell subpopulations. (B) TSNE plot showing the annotation results of single-cell cell subpopulations. (C) Expression of marker genes in each cell type. (D) Fan plot showing the distribution of different cell types in control samples. (E) Fan plot showing the distribution of different cell types in CCA samples.
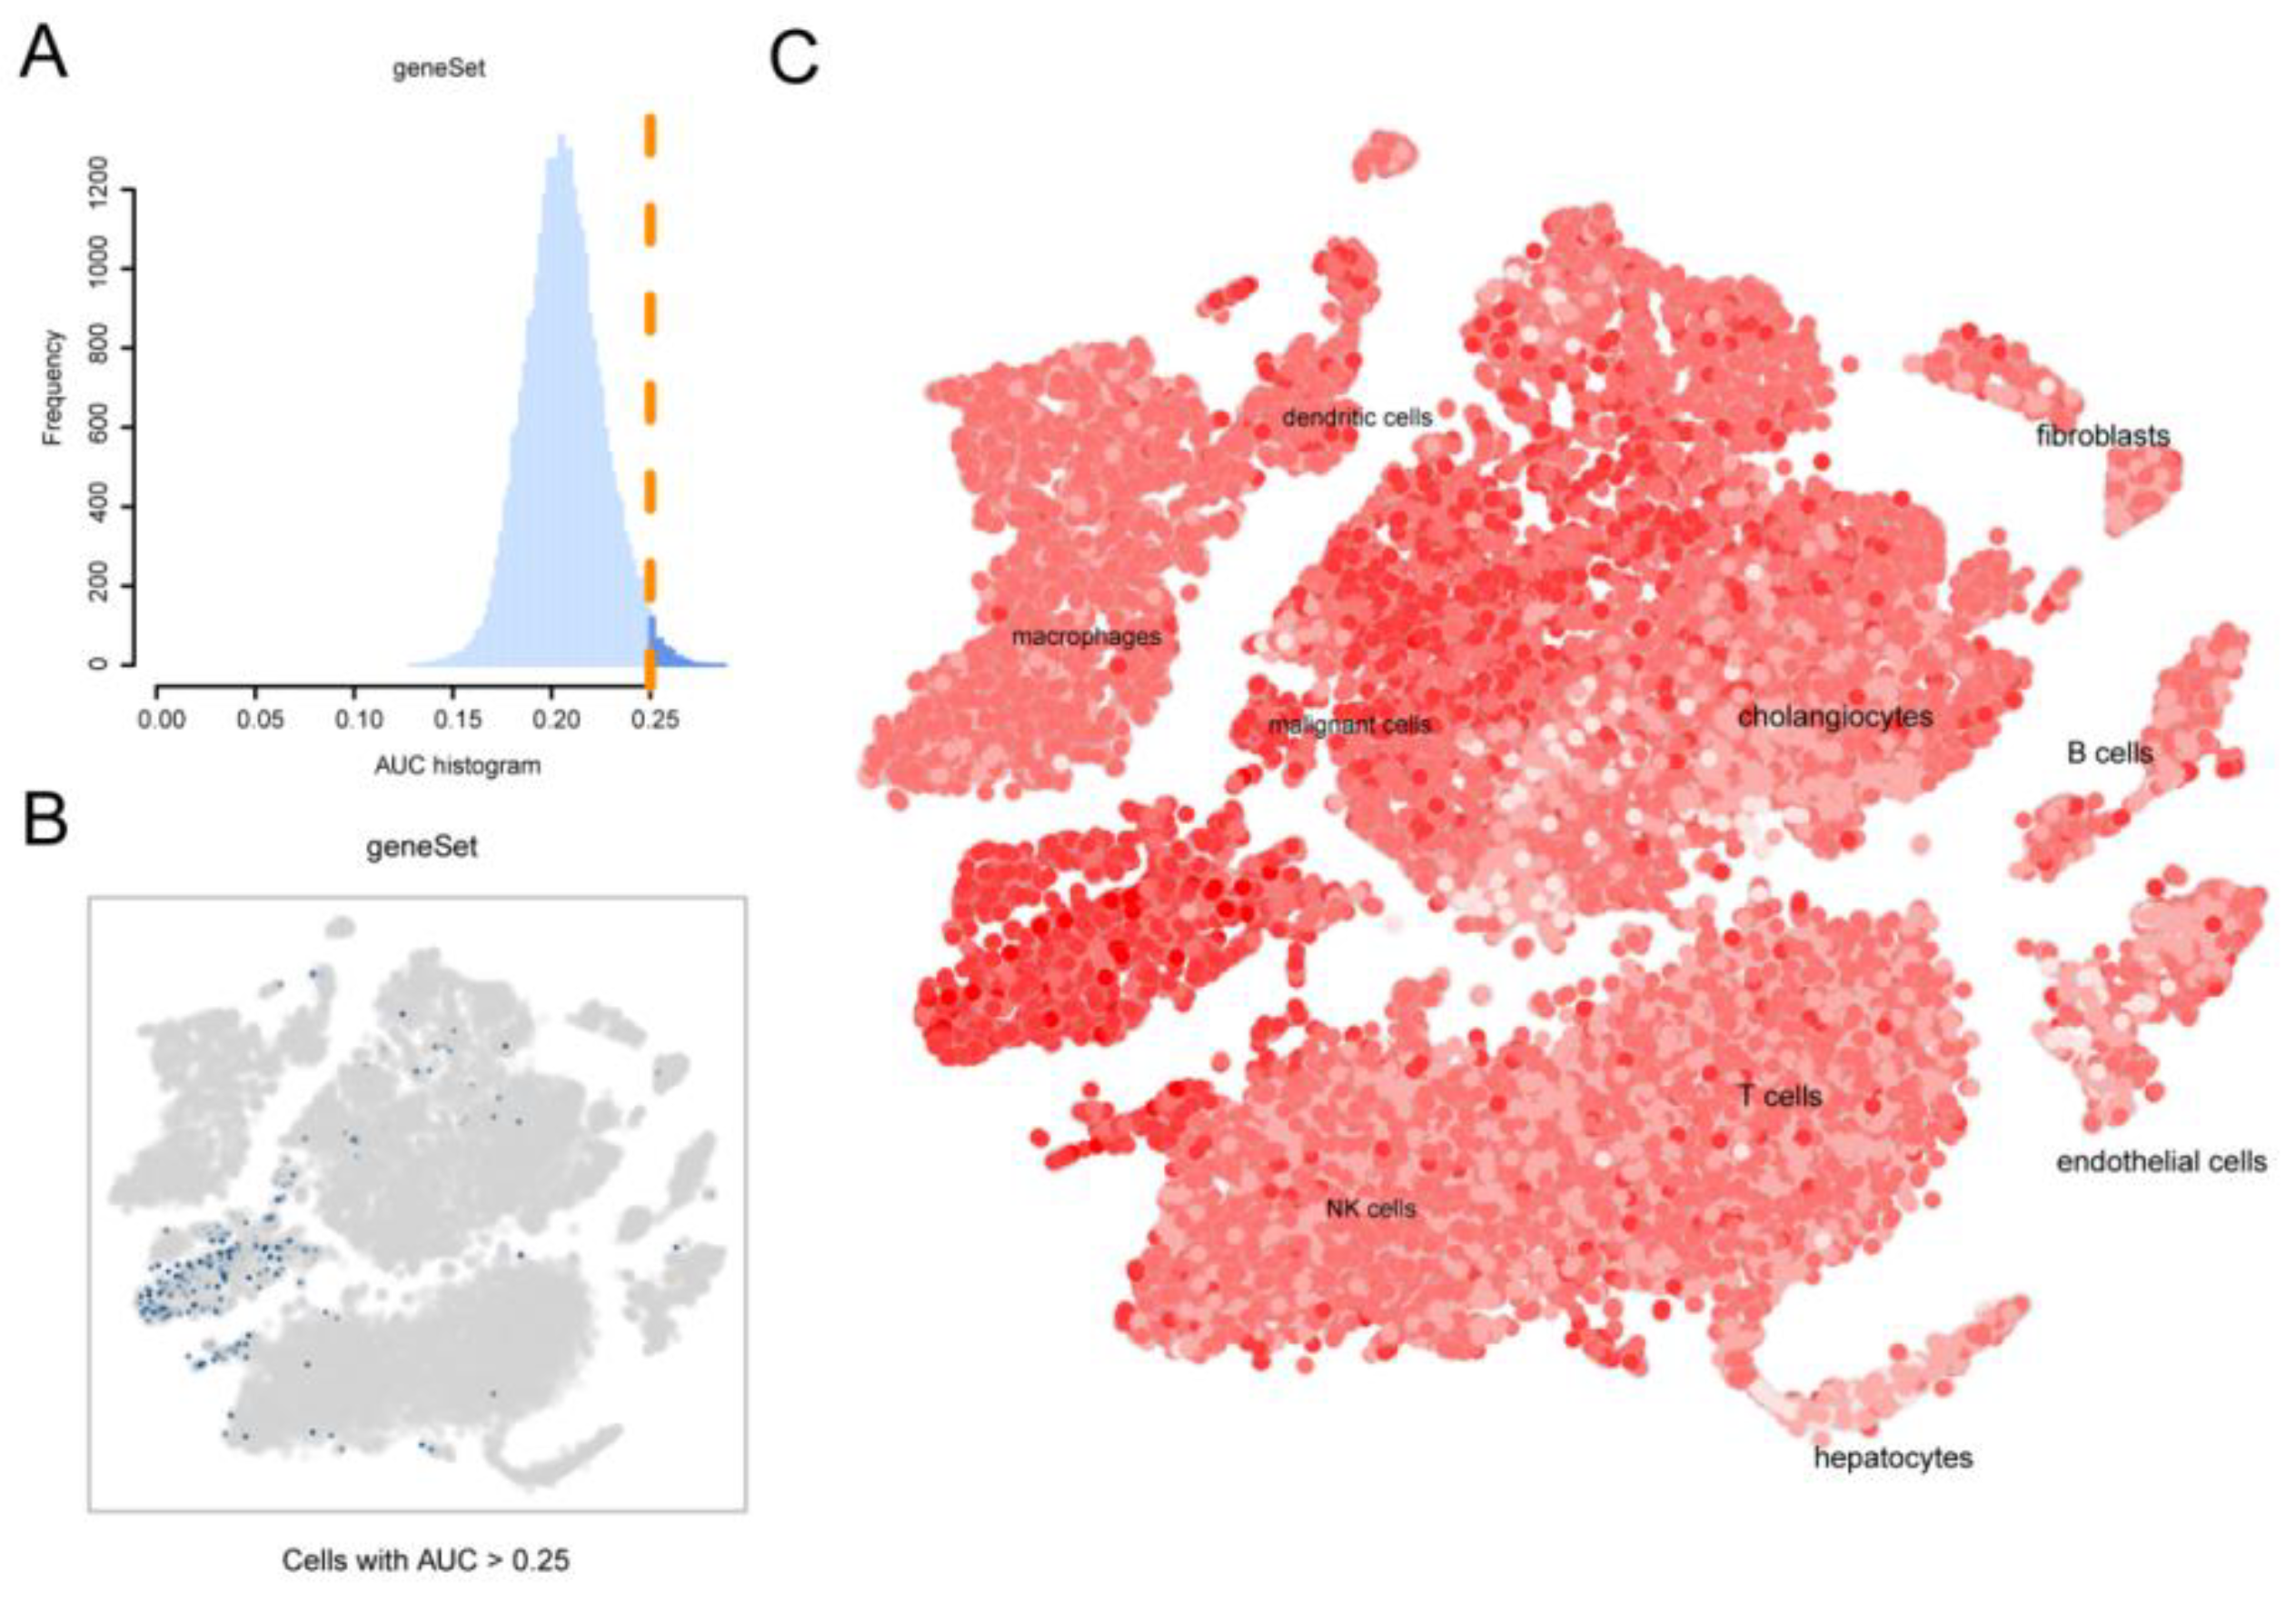
Figure 3.
Identification of telomere-associated activity. (A) AUC score of telomere-associated genes with a threshold value of 0.25. (B) TSNE plot of the distribution of cells with AUC values greater than the threshold, with screened cells in blue. (C) TSNE chromaticity plot showing the scoring of cell activity, the brighter the color, the higher the activity.
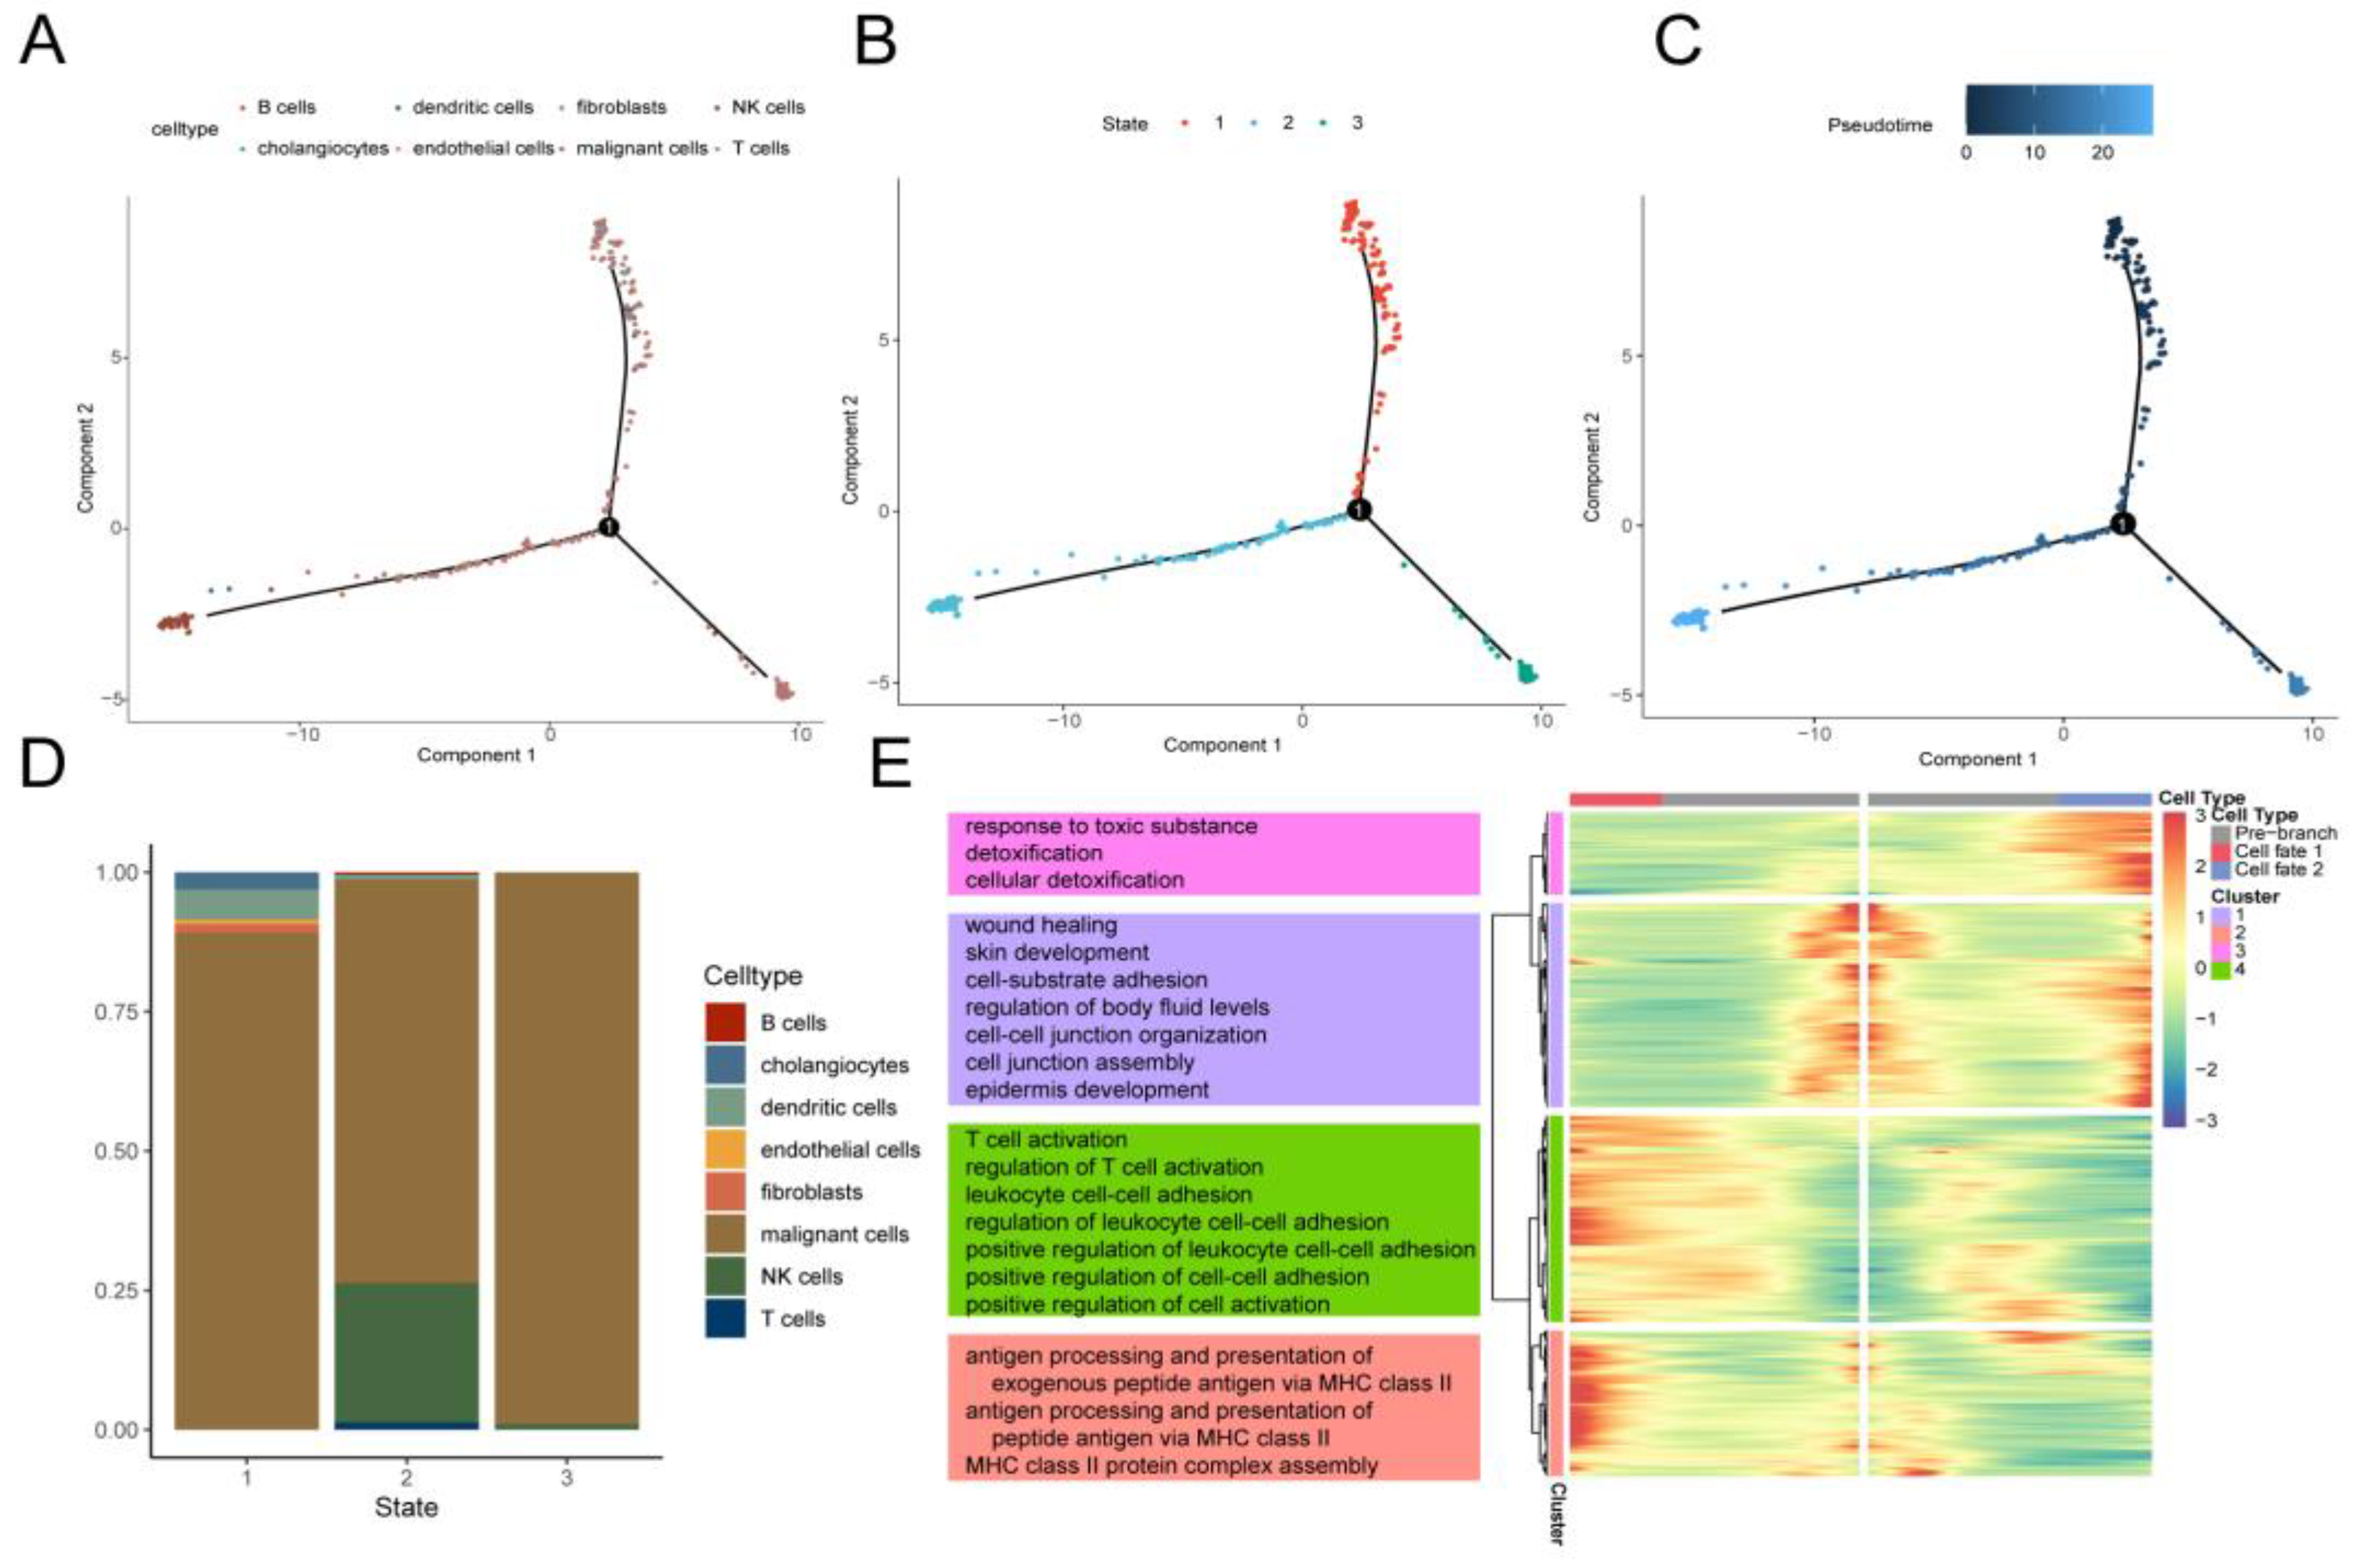
Figure 4.
pseudotime analysis reveals cellular transcription patterns. (A) Pseudotime trajectories showing cell distribution based on cell type. (B) Pseudo-time traces were categorized by Monocle2 into three different states. (C) Pseudotime color gradient transitions from dark blue to light blue. (D) Stacked histogram showing the distribution of cell types in different states. (E) Heatmap showing different branches. (cell fate) of differentially expressed genes (DEGs). GO pathways significantly enriched in different gene clusters in the heatmap are shown to the left.
Figure 5.
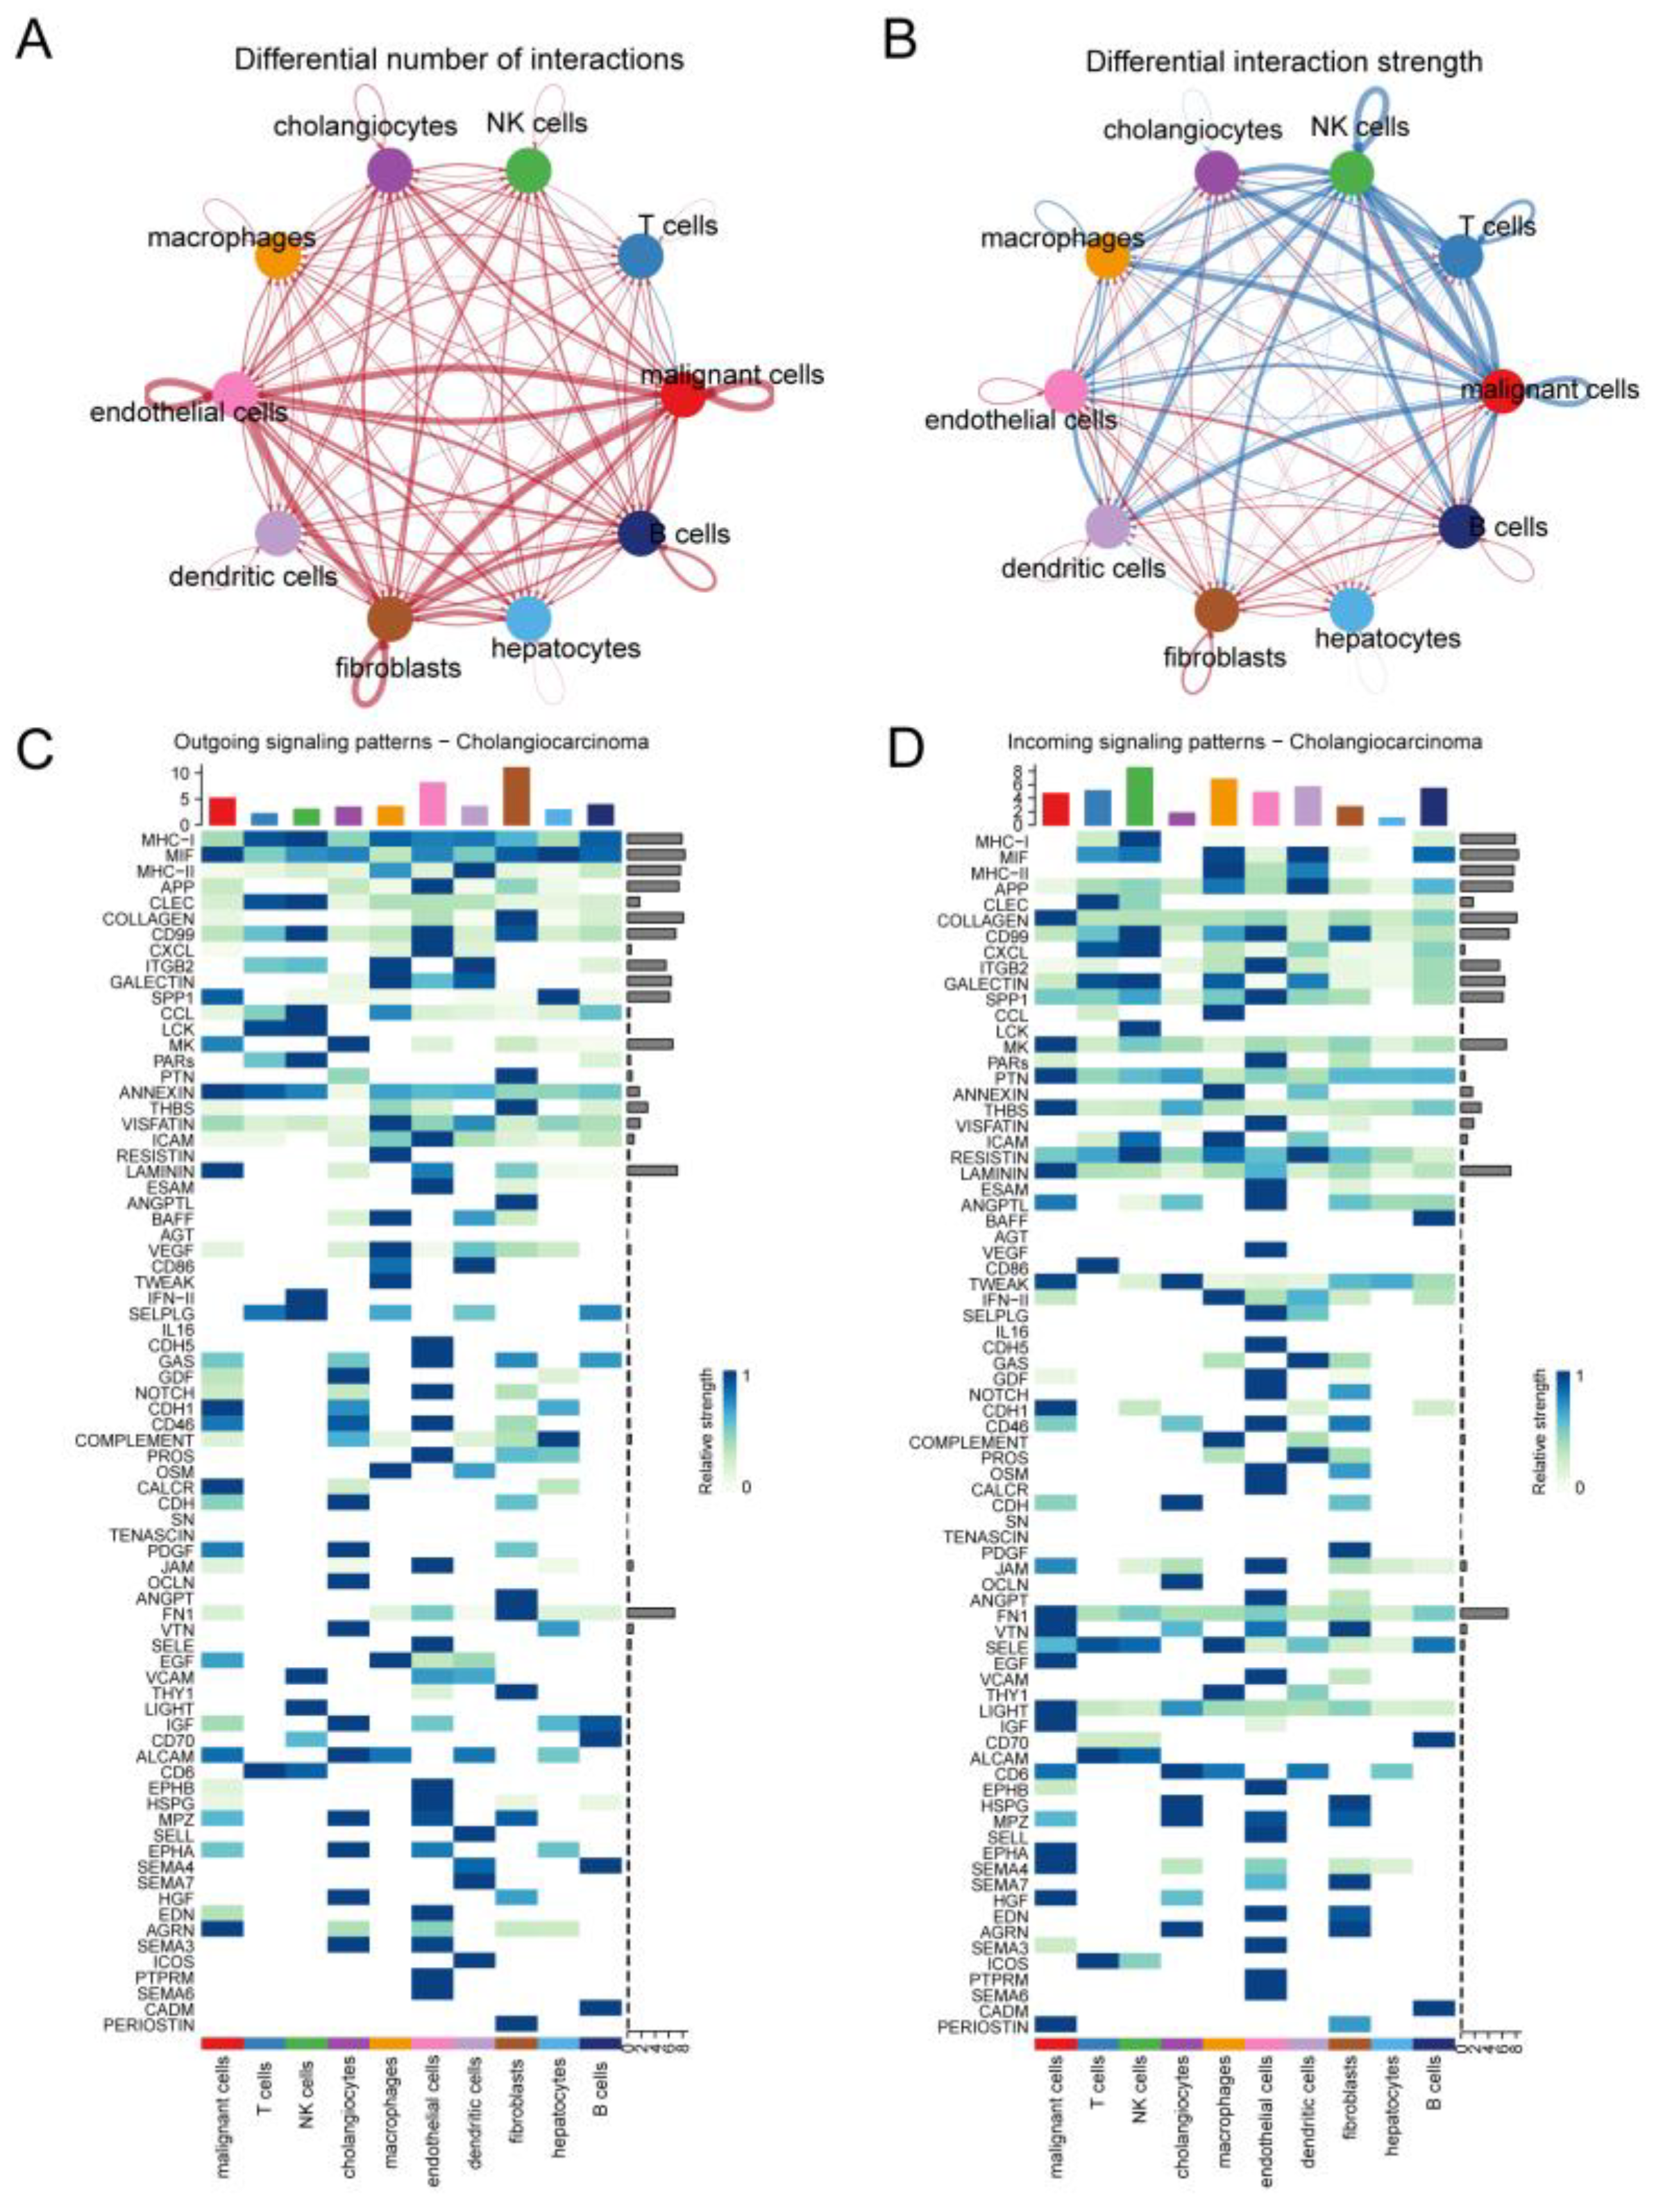
Results of intercell communication analysis. (A) Network diagram demonstrating the number of interactions between cells. (B) Network diagram showing the strength of interactions between cells. Heatmap visualizing the signals sent (C) and received (D) by cells in the CCA group.
Figure 5.
Results of intercell communication analysis. (A) Network diagram demonstrating the number of interactions between cells. (B) Network diagram showing the strength of interactions between cells. Heatmap visualizing the signals sent (C) and received (D) by cells in the CCA group.
Figure 6.
Changes in intercell communication in CCA. (A) Dot plots showing signaling pathways in which malignant cells communicate with NK cells and B cells with increased and decreased strength. String diagrams show malignant cells interacting with other cell types through specific signaling pathways MIF (B), and MHC-I (C).
Figure 7.
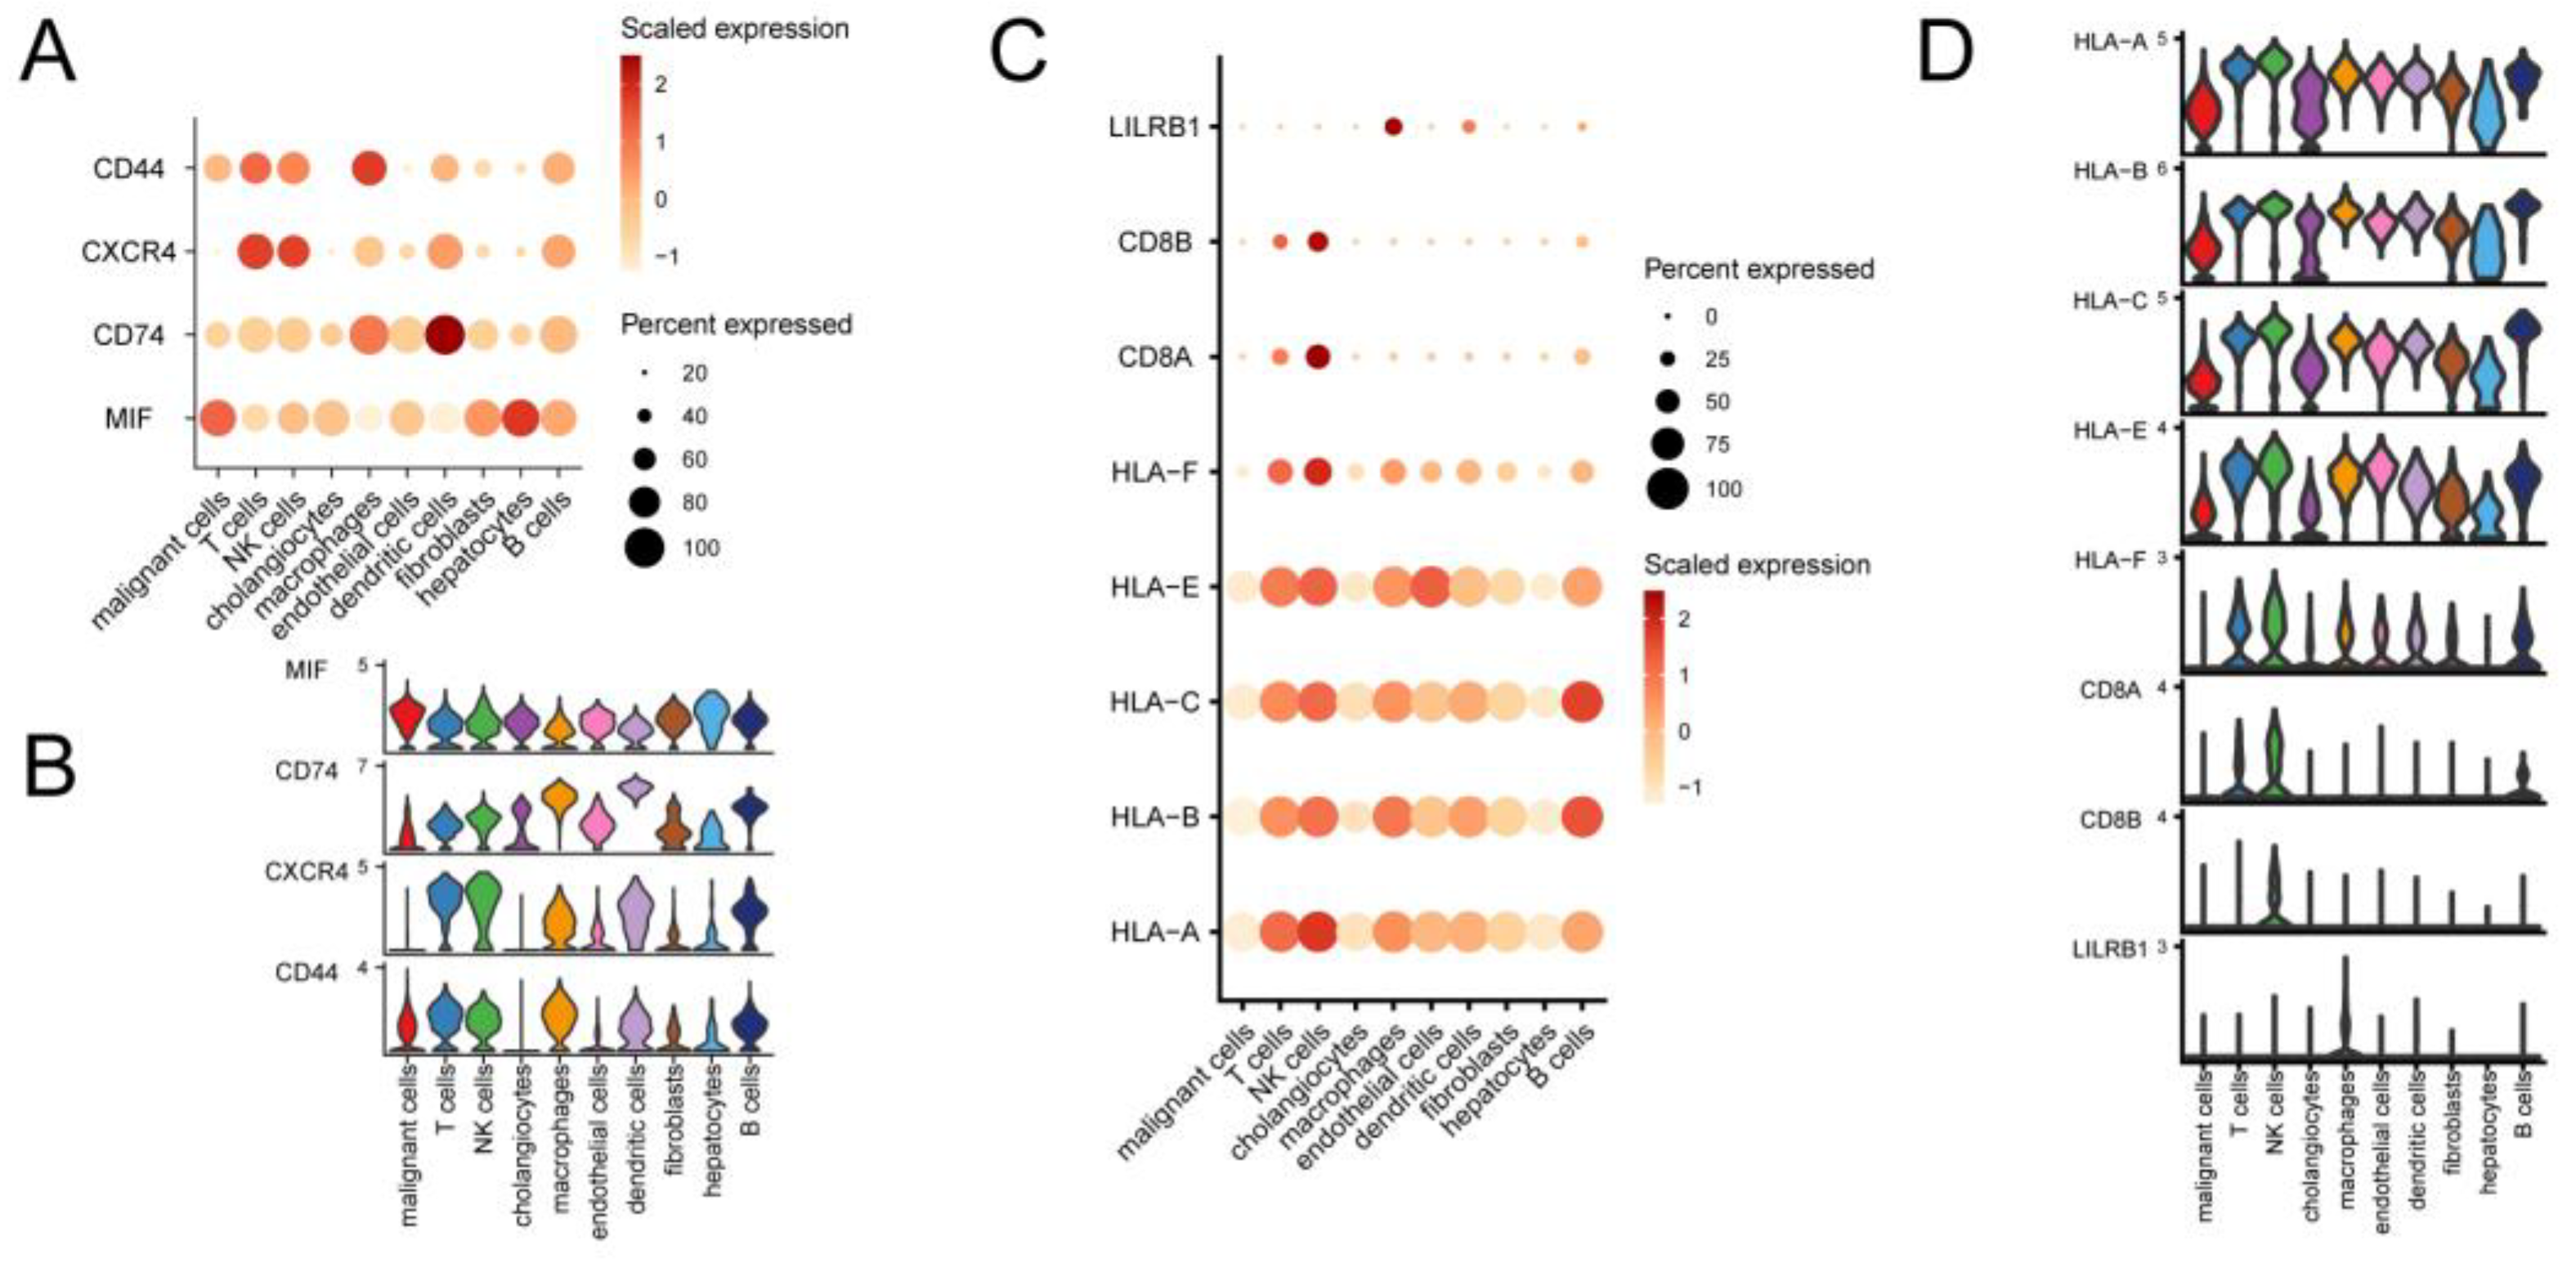
Expression of specific pathway ligand receptors in different cells of CCA. Dot plots (A) and violin plots (B) of ligand receptors of the MIF pathway in CCA expressed in different cells. Dot plots (C) and violin plots (D) of ligand receptors of the MHC-I pathway in CCA expressed in different cells.
Figure 8.
Enrichment analysis of telomere activity-related differentially expressed genes in CCA. (A) Volcano plot depicting genes significantly differentially expressed between CCA and normal control. (B) Heatmap of the top 5 significantly differentially expressed genes in up- and down-regulation. (C) Wayne plots of the intersection of differential genes with transcriptional differential genes and telomere-associated differential genes between different subgroups of cells and different telomere-active cells in single cells. (D) GO-enriched lollipop plot showing the top three pathways with the highest significance for Biological process (BP), Cellular component (CC), and Molecular function (MF). (E) KEGG enrichment analysis.
Figure 9.
Cox and LASSO regression analysis of the bile duct cancer dataset. (A) LASSO regression trajectory of the independent variables, with the horizontal coordinate indicating the logarithm of the lambda of the independent variables and the vertical coordinate indicating the independently accessible coefficients. (B) Confirmation intervals under each lambda in the LASSO regression. (C) Survival curves for patients in the high- and low-risk groups from the training cohort, respectively. (D) Survival curves for patients in the high- and low-risk groups from the validation cohort, respectively. The yellow color represents the high-risk group and the blue color represents the low-risk group. (E) Time-dependent ROC curves for 1, 3, and 5 year survival for the model used for the training cohort. (F) Time-dependent ROC curves for 1, 3, and 5 year survival for the validation cohort model.
Figure 10.
Pathways enriched for GSEA and GSVA. (A) DRUG METABOLISM CYTOCHROME P450.(B) RETINOL METABOLISM.(C) COMPLEMENT AND COAGULATION CASCADES.(D) TIGHT JUNCTION. (E) ECM RECEPTOR INTERACTION. (F) FOCAL ADHESION.(G) GSVA ENRICHMENT ANALYSIS of pathway maps differentially enriched between high and low-risk groups.
Figure 11.
Levels of immune infiltration between high and low-risk groups. (A) Heatmap of correlation between immune cells. (B) Box line plot of the estimated proportion of immune cells between high and low-risk groups. Correlation between ATP1A1 and Central memory CD4 T cell (C), and Immature B cell (D) immune cells. Asterisks indicate P values : ****p < 0.0001, ***p < 0.001, **p < 0.01, *p < 0.05.
Figure 12.
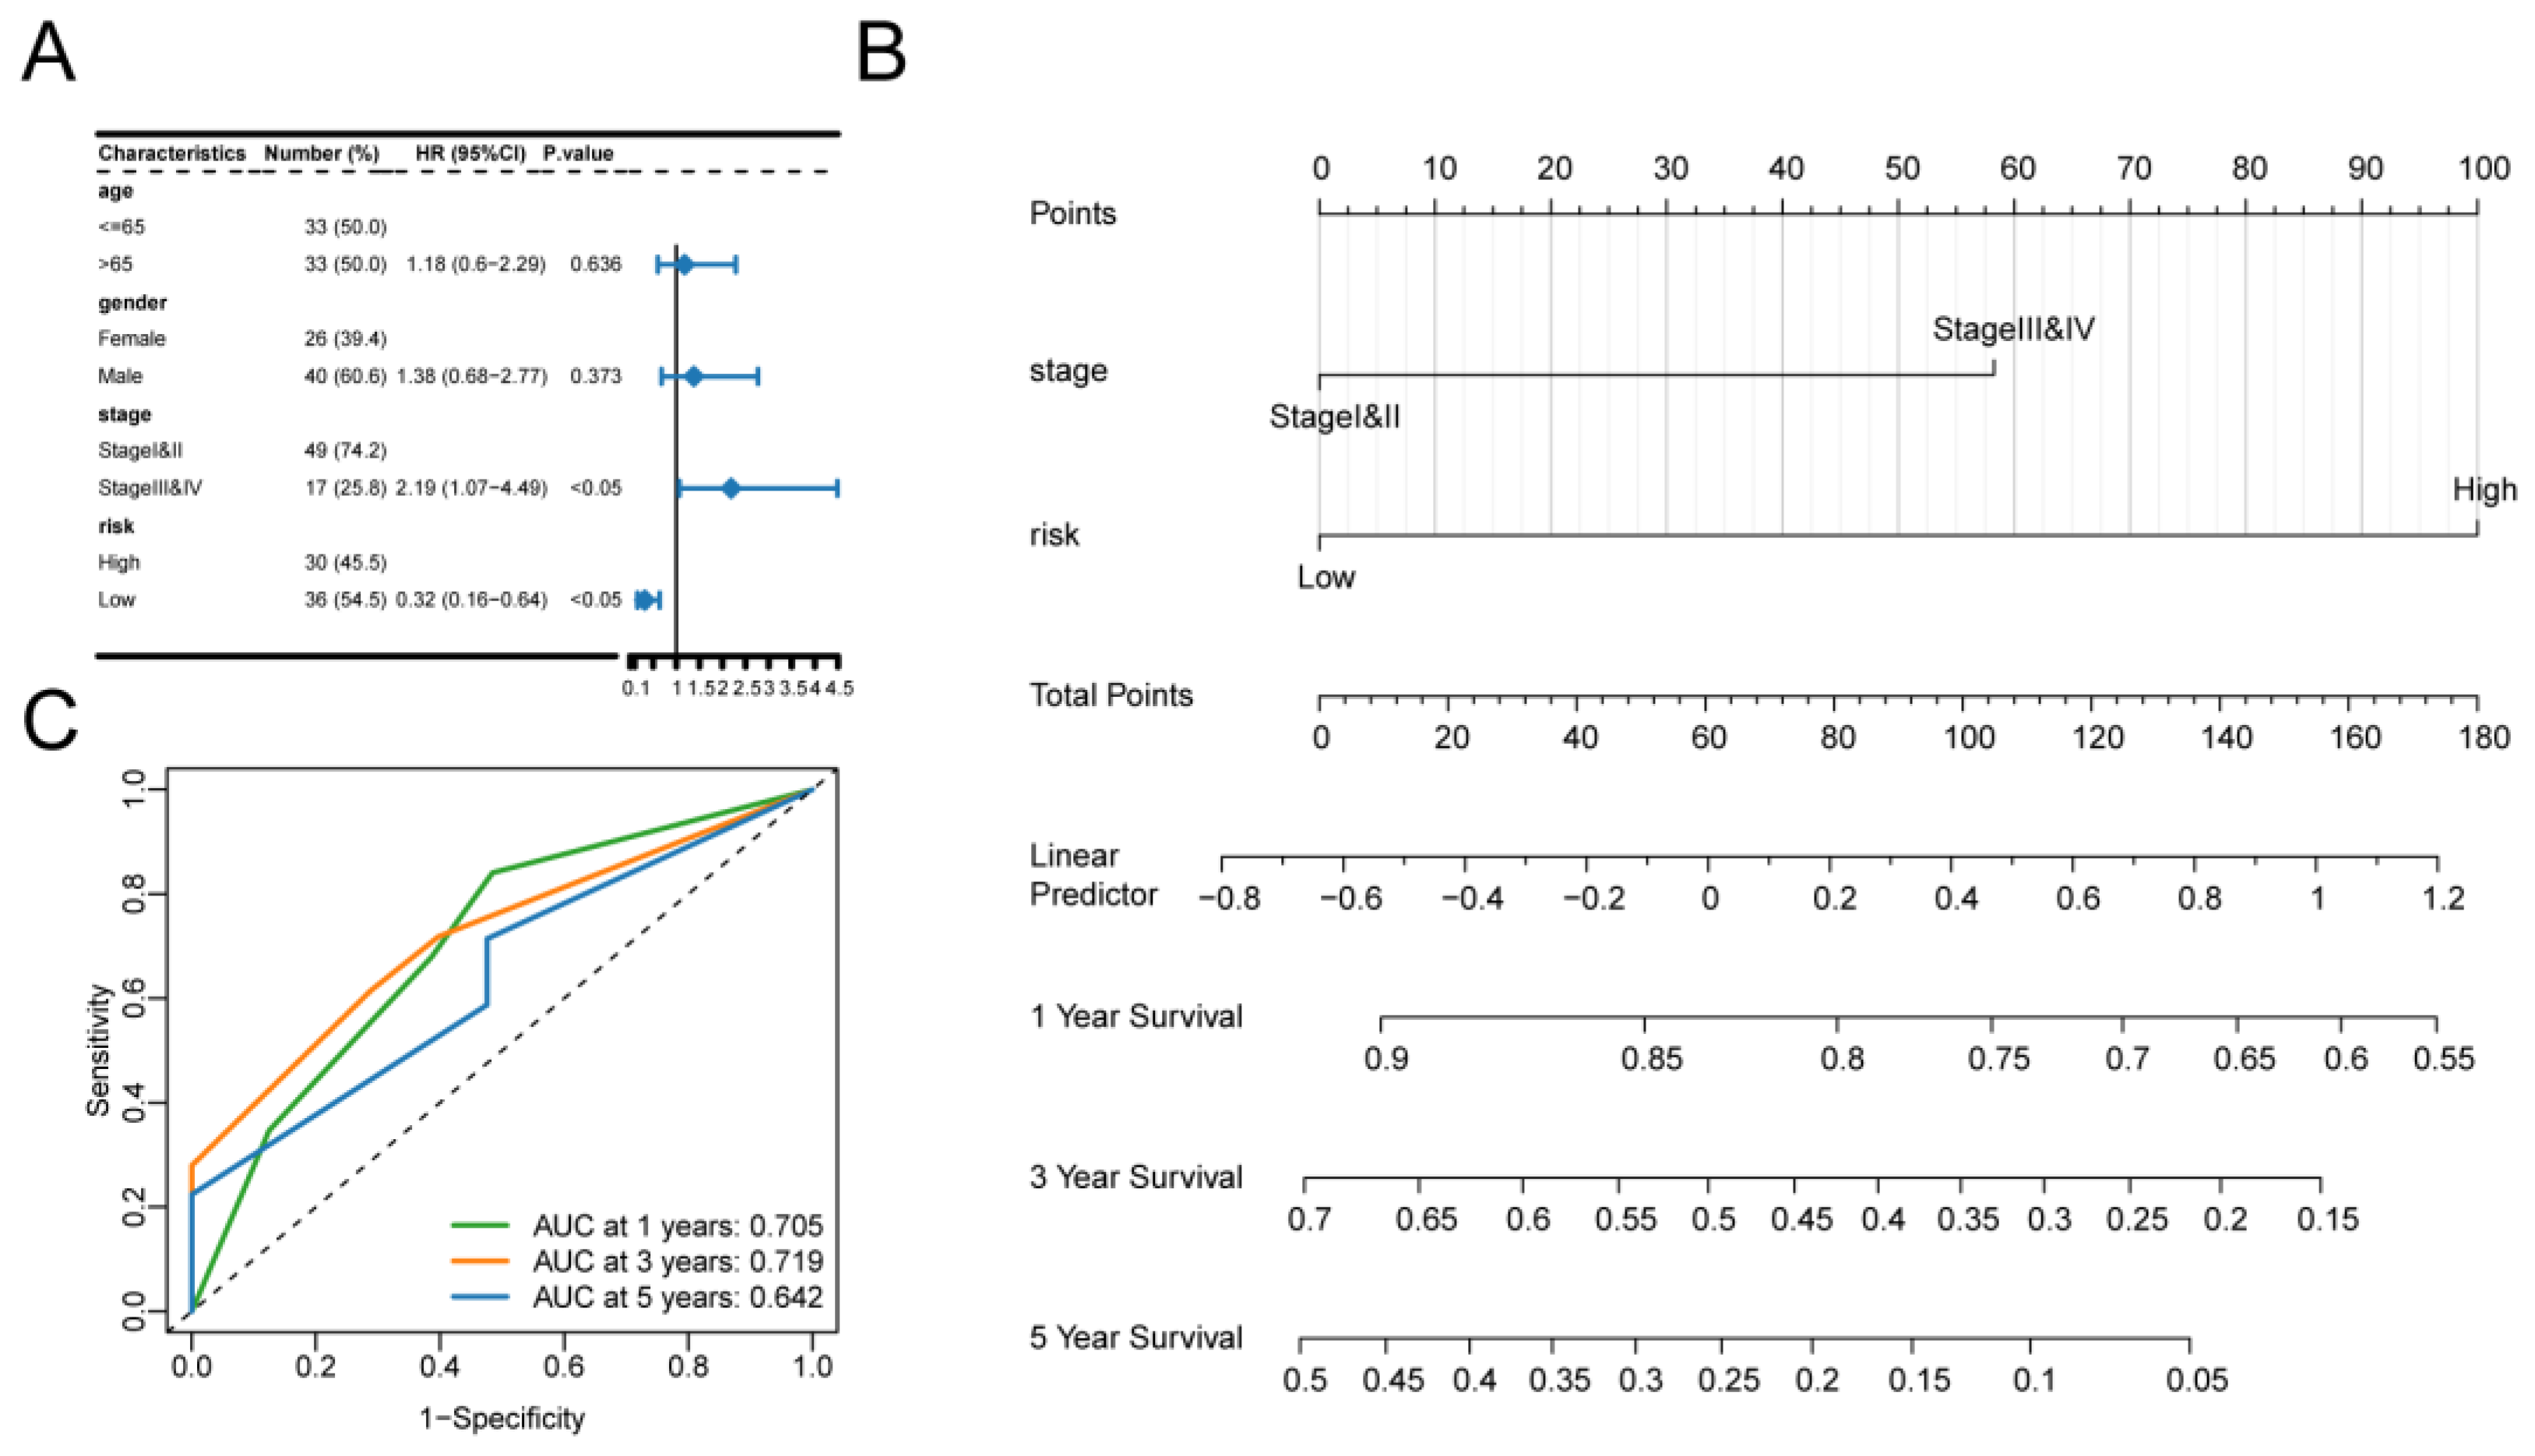
Risk score as an independent prognostic factor. (A) Results of univariate Cox regression analysis of clinical characteristics. (B) Predictive model of the nomogram. line segments indicate the contribution of clinical factors to outcome events, the total score indicates the sum of the corresponding individual scores for all variable values, and the bottom three lines indicate the prognosis for 1, 3, and 5-year survival corresponding to each value point. (C) Nomogram model ROC curves for 1, 3, and 5 years.
Figure 13.
Differences in TMB and drug sensitivity between high- and low-risk groups. (A) Top 20 genes with the highest mutation frequency in the high-risk and (B) low-risk groups. (C) TMB violin maps for the high and low-risk groups. (D) Differences in drug sensitivity of Vinblastine_1004 between high and low-risk groups. (E) Drug sensitivity difference of Vinorelbine_2048 between high and low-risk groups. (F) The difference in drug sensitivity of Docetaxel_1007 between high and low-risk groups.
