Preprint
Article

Professional-Oriented Education Approach In Mechanics Physics Course for Future Career Track

Altmetrics

Downloads

91

Views

28

Comments

0

Submitted:

10 June 2024

Posted:

13 June 2024

You are already at the latest version

Alerts
Abstract
The objective of this study was to compare the effectiveness of a professional-oriented education approach to traditional teaching methods among high school secondary students in Kazakhstan in aligning students to their suitable career education track. The study utilised a mechanics physics course to assess both approaches and involved two groups of students over 26 months - a control group (n=58) and an experimental group (n=57). Quantitative data was collected through a Mechanics Physics Test administered before and after the teaching and learning class. In Kazakhstan, students will be aligned directly with either secondary vocational education, the initial vocational education track, or the general education track, which relies on the final performance of their secondary school. The findings indicated that both teaching methods improved the student's performance, but the experimental group exhibited a significantly higher level of improvement than the control group. This study shows that a professional-oriented education approach can clearly align students with their interests and strengths and help them pursue their desired careers confidently. This approach enables students to make informed decisions about their future studies and career paths, reducing costs and saving time for schools and governments—implications and, to a further extent, the study is also discussed.
Keywords: 
Subject: Social Sciences  -   Education

1. Introduction

Goats are one of the earliest domesticated livestock species and have a wide variety of breeds, which can be classified according to the type of products they supply. These include velvet goats [1], dairy goats [2], meat goats [3], and fur goats [4]. According to the FAOSTAT database, in conjunction with the increasing consumer demand for goat meat in the international market, the world's major countries are continuously modifying their production structures, placing greater and greater emphasis on meat goat production [5]. However, according to the FAOSTAT database, China's meat goat carcass weight level still lags behind that of some developed countries in the global meat goat industry. Therefore, it is imperative to select and breed Chinese superior meat goat breeds to enhance the growth traits of Chinese meat goat. Nanjiang Yellow goat is the first meat goat breed independently bred in China, which has been carefully cultivated for 40 years, and has various characteristics of genetic stability, suitable germplasm, strong adaptability, and fast growth and development [6,7,8]. In comparison to the majority of local Chinese goat breeds, the Nanjiang yellow goat exhibits a distinctive feature in its rapid growth and development. However, the underlying mechanisms driving this phenomenon remain elusive, and need further in-depth investigation.
Insulin-like Growth Factor 2 mRNA binding Protein 1 (IGF2BP1) is a member of the Insulin-like Growth Factor 2 mRNA binding Proteins (IGF2BPs) gene family, which plays a crucial role in cell proliferation and growth in normal tissues, tumor cell adhesion, apoptosis, migration, and invasion. IGF2BP1 plays a pivotal role in the regulation of cancerous diseases, embryonic and organ growth and development, both through its own action and through interactions with other genes. Additionally, it serves as a crucial reference point for studies related to livestock and poultry growth and development [9,10,11,12]. As a vital candidate gene affecting animal growth and development, its polymorphisms have been analyzed in association with growth traits in several livestock and poultry species. In chicken's whole genome sequencing studies, strong selection was found near IGF2BP1, associated with breast muscle yield and carcass traits in chickens. Therefore, it was hypothesized that IGF2BP1 was proposed to be the primary effector gene regulating carcass traits [13]. The IGF2BP1 gene is also the primary effector gene for body size enlargement in Peking ducks, with a mutation at the upstream 148kb locus. This resulted in the continued high expression of the IGF2BP1 gene after emergence from the carcass, which led to an increase in the feed utilization efficiency of Pekin ducks and, ultimately, their body size [14].
Among these, the second intron of this gene is a particularly relevant area for further investigation, which contains the potential for single nucleotide polymorphism associated with growth traits. Studies on Chaohu ducks and Shaanbei white down goats have shown an association between this polymorphism and animal growth and development [15,16]. Our previous studies have shown that IGF2BP1 expression is highest in goats during the pre-rapid muscle fiber growth phase (45 days of the embryonic stage) [17]. This suggests that IGF2BP1 may be an essential gene affecting the increase in muscle fibers. After overexpressing the IGF2BP1 gene in Skeletal Muscle Satellite Cells (MuSCs), the number of myoblasts increased significantly, confirming that IGF2BP1 promotes the proliferation of goat myoblasts [18]. In the pre-laboratory resequencing study of six goat breeds, we discovered that the IGF2BP1 gene region 37,175,001-37,275,000 on chromosome 19 of the Meigu goat was strongly selected [19]. Upon comparison of the goat IGF2BP1 gene with its human counterpart region through the Ensembl online database, we identified the presence of promoter or enhancer cis-regulatory elements in several regions.
Thus, based on the resequencing results, this study verified and analyzed the seven SNPs in the conserved region on the second intron of the IGF2BP1 gene of Nanjiang yellow goat. Subsequently, cellular-level validation was conducted to resolve the functions of the SNPs preliminarily. Through this study, we aimed to establish a theoretical basis for selecting subsequent molecular genetic markers and breeding Nanjiang Yellow goats by identifying functional regions containing regulatory elements and investigating the association between these SNPs in the second intron of IGF2BP1 and growth traits at different stages of development.

2. Materials and Methods

2.1. Animals and Samples Collection

The Nanjiang Yellow goat population (n = 348) used in the experiment originated exclusively from the Nanjiang Yellow goat stock farm. Throughout this study, all goats were subjected to identical management practices and environmental conditions. Grazing and appropriate supplementary feeding were employed to raise the goats, ensuring their dietary nutrient levels met their growth requirements. 1.5 mL of whole blood was collected from each test goat via jugular vein puncture, anticoagulated with heparin sodium, and stored at −20 C for subsequent genomic DNA extraction. Pregnant ewes were randomly selected (n = 3) (unrelated) and humanely sacrificed. Different tissues (longissimus dorsi muscle (LD), lung, heart, spleen, liver, and kidney) were obtained.

2.2. MuSCs Isolation and Identification

According to previous methods [20], the LD muscle of the 1-day-old goat (male) was successfully used to isolate the MuSCs for this study [21]. Then, we used the antibody against myogenic marker genes Pax7 (Santa Cruz, CA, USA) and MyHC (Santa Cruz, CA, USA) for immunoluciferase. We stored MuSCs in liquid nitrogen tanks.

2.3. Cell Culture and Transfection

MuSCs were cultured at 5% CO2 and 37 ◦C in growth medium containing 89% Dulbecco’s modified eagle medium (DMEM), 10% fetal bovine serum (FBS; Gibco, NY, USA), and 1% penicillin-streptomycin (Invitrogen, NY, USA) [22]. Plasmids were transfected into MuSCs using Lipofectamine 3000 (Life Technologies, Carlsbad, CA, USA).

2.4. Dual-Luciferase Reporter Assays

The fragments containing three SNPs(rs638185407(T>A)、rs640683953(A>C)、rs654358008(G>C)) were separately inserted into the PGL4.23 empty vector (Knp I and Hind Ⅲ were restriction sites; Supplementary Figure S1). Wild-type (WT) and mutation-type (MUT) plasmids were transfected into H293T and MuSCs, respectively. The dual-luciferase reporter kit (Solarbio, Beijing, China) was used to detect luciferase activity. Primers used for restricting enzyme digestion are shown in Supplementary Table S1.

2.5. Extraction of Genomic DNA and Detection of DNA Quality

Goat genomic DNA was extracted with a routine blood genome extraction kit (Tiangen, Beijing, China) and then subjected to 1.5% agarose gel electrophoresis and ultraviolet imaging in gel image analyzer BIO-RAD ChemDOC XRS. The images were analyzed using Quality One 4.6.2 software to determine DNA integrity. The purity and concentration of DNA were determined using a nucleic acid protein detector (BIO-RAD, Hercules, CA, USA). The samples that met the requirements were stored at −20 ◦C for later use. Gel electrophoresis is shown in Supplementary Figure S2.

2.6. PCR Amplification and Sequencing

Based on the SNP position, each SNP and its flanking sequences were retrieved from the Ensembl database, and primers were designed using the sequence as a template using Primer Premier 6.0 software and were synthesized by Sangon (Shanghai, China). The birth record table of each goat in the Nanjiang Yellow goat breeding farm was consulted, and 20 DNA samples were selected and diluted to a concentration of 20 ng/µL. From each sample, 2 µL of DNA was extracted and thoroughly mixed. The resulting mixed pool of DNA served as the template for PCR amplification. The PCR products were sent to Shanghai Sangon (Shanghai, China) for bidirectional Sanger sequencing. SnapGene 6.0.2 software was used to verify the SNPS in the samples by comparing the sequencing results with the reference genome sequence and SNPs. Primers are shown in Supplementary Table S2.

2.7. MassARRAY Genotyping

In total, 348 Nanjiang Yellow goats were genotyped using the Sequenom MassARRAY genotyping technique (Supplementary Table S3). According to the information of 7 SNPs in the DNA samples of 348 Nanjiang Yellow goats, SNPs and the information of 100 bp upstream and downstream sequences were obtained through the Ensembl database. Subsequently, we amplified the fragments containing SNPs with the single-base primer extension method, combined with MALDI-TOF, and distinguished genotypes according to their molecular weight. The blood genomic DNA of all samples was submitted to Fuyu Biotechnology (Beijing, China) for genotyping.

2.8. Growth Trait Determination

The birth weight, body weight (BW), body length (BL), body height (BH), and chest circumference (CC) of Nanjiang Yellow goats (n = 348) were measured using standard methods at the ages of 4 months, 6 months, 12 months, and 18 months. Birth weight: weight taken within 12 hours of birth; BW: body weight measured three times using the steelyard to take the average; BL: straight line distance from the leading edge of the scapula to the hip; BH: the vertical distance from the highest point of the girth to the ground; CC: the length around the chest from the back end of the shoulder blade.

2.9. Bioinformatics Analysis and Data Analysis

Jaspar 2022 (http://jaspar.genereg.net/) was used to predict changes in transcription factor binding at mutant sites in non-coding regions (Supplementary Table S4). Haploview4.2 was used to calculate Hardy–Weinberg equilibrium and analyze linkage disequilibrium among SNPs. SAS 9.4 software was used to analyze the association between genotypes of each locus and the growth traits of Nanjiang Yellow goats, and the GLM model in SAS 9.4 was used to establish the model.
(1)
Single genotype effect analysis:
Yijkl = µ + Gi + Sj +Pk + Dl + eijkl, where Yijkl represented the phenotypic observations; µ was the averaged values; Gi was the fixed effect of genotype; Sj was the fixed effect of sex; Pk was the fixed effect of place; Dl was the fixed effect of date of birth (year and month); and eijkl was the random effect. All values were expressed as mean ± standard deviation. The results with p < 0.05 were considered statistically significant.
(2)
Combination genotype effect analysis:
Based on the model we constructed above, genotype effects were added.

3. Results

3.1. Polymorphism of the Second Intron Gene of IGF2BP1 in Nanjiang Yellow Goat

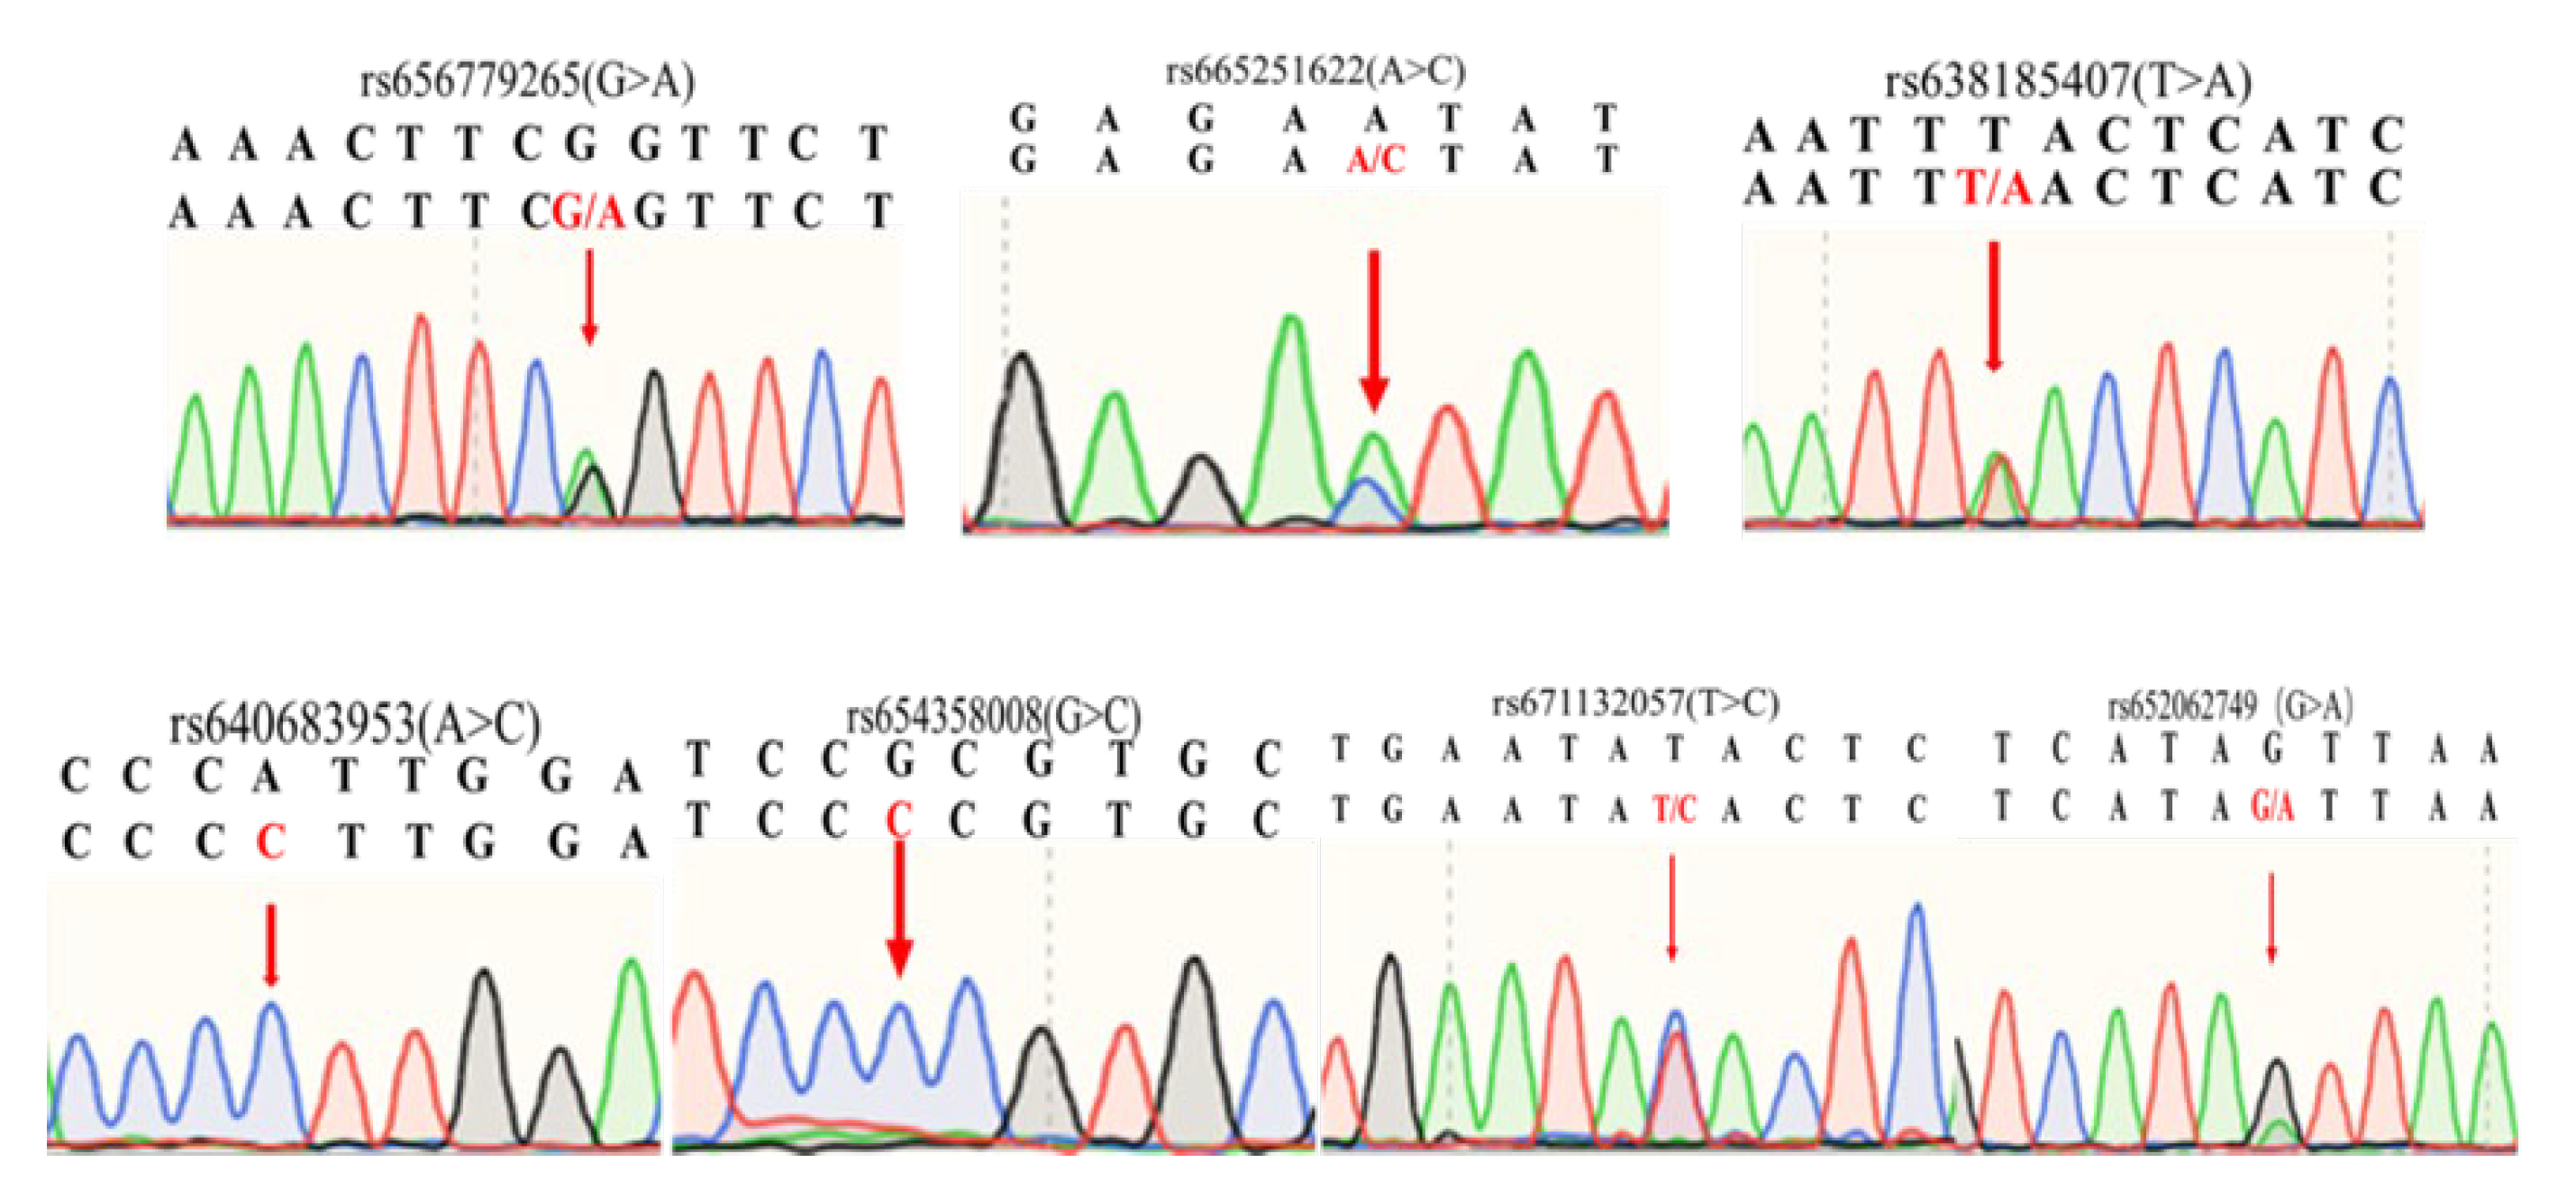
A total of seven SNPs were identified in the second intron of IGF2BP1 in the experimental population by mixed-pool sequencing. Among them, rs656779265 (G>A), rs638185407 (T>A), rs665251622 (A>C), rs671132057 (T>C) and rs652062749 (G>A) were detected with polymorphisms, while rs640683953 (A>C) and rs654358008 (G>C) were only found the mutant type (Figure 1).

3.2. Mass Spectrometric Typing of Seven SNPs in the Second Intron of IGF2BP1 in Nanjiang Yellow Goat

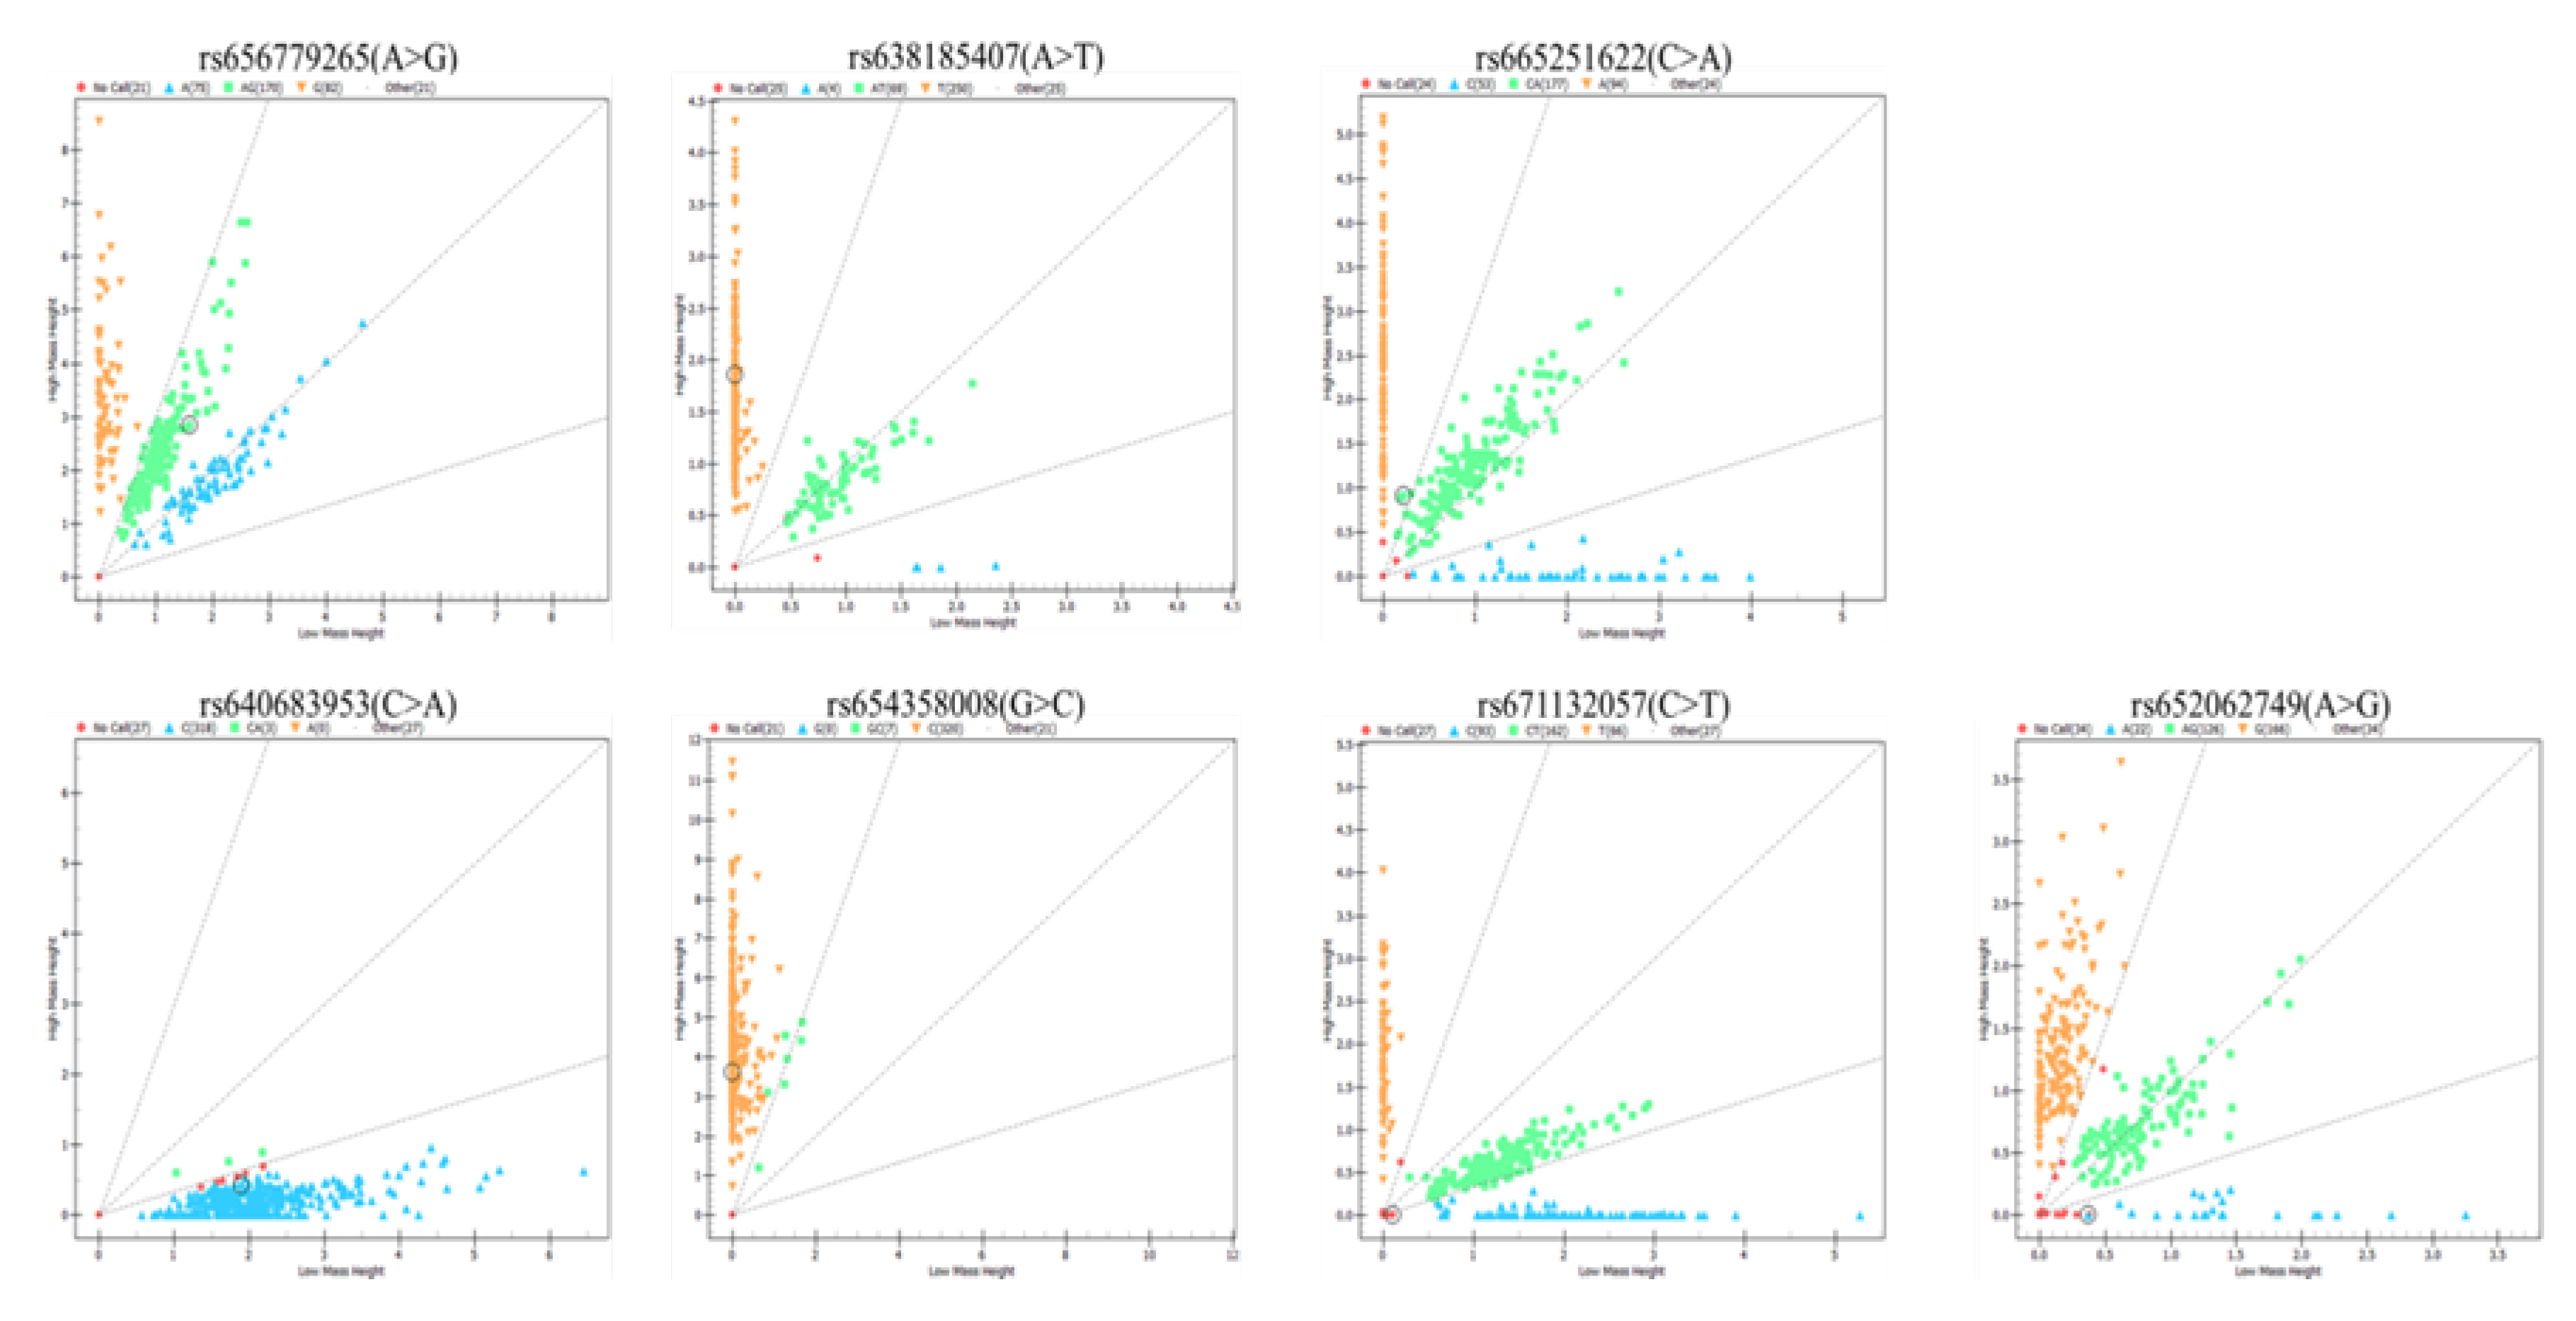
The mass spectrometry method was applied to analyze the genetic distribution of these SNPs in 348 Nanjiang Yellow goats; the results showed that seven SNPs existed in the goat population (Figure 2). According to the results of population genetic parameter analysis of seven SNPs in the second intron of IGF2BP1 in Nanjiang yellow goat, the genotype frequencies and allele frequencies of the seven SNPs are shown in Table 1 through statistics analysis.
In the test population, rs640683953 (A>C) had the highest degree of purity at 0.99, followed by rs654358008 (G>C) at 0.98. rs656779265 (G>A) and rs671132057 (T>C) had the lowest degree of purity at 0.50. Four of the SNPs, rs656779265 (G>A), rs665251622 (A>C), rs671132057 (T>C), and rs652062749 (G>A), showed moderate polymorphism (0.25<PIC<0. 5), and three SNPs, rs638185407 (T>A), rs640683953 (A>C), and rs654358008 (G>C), had a low degree of polymorphism (PIC<0.25). The Hardy-Weinberg equilibrium test indicated that all SNPs conform to the equilibrium (p>0.05). The overall number of effective alleles was close to 2, except for rs638185407 (T>A), rs640683953 (A>C), and rs654358008 (G>C), which had relatively low effective alleles, resulting in a more even distribution in the population (Table 1).

3.3. Analysis of Linkage Disequilibrium and Construction of Haplotypes

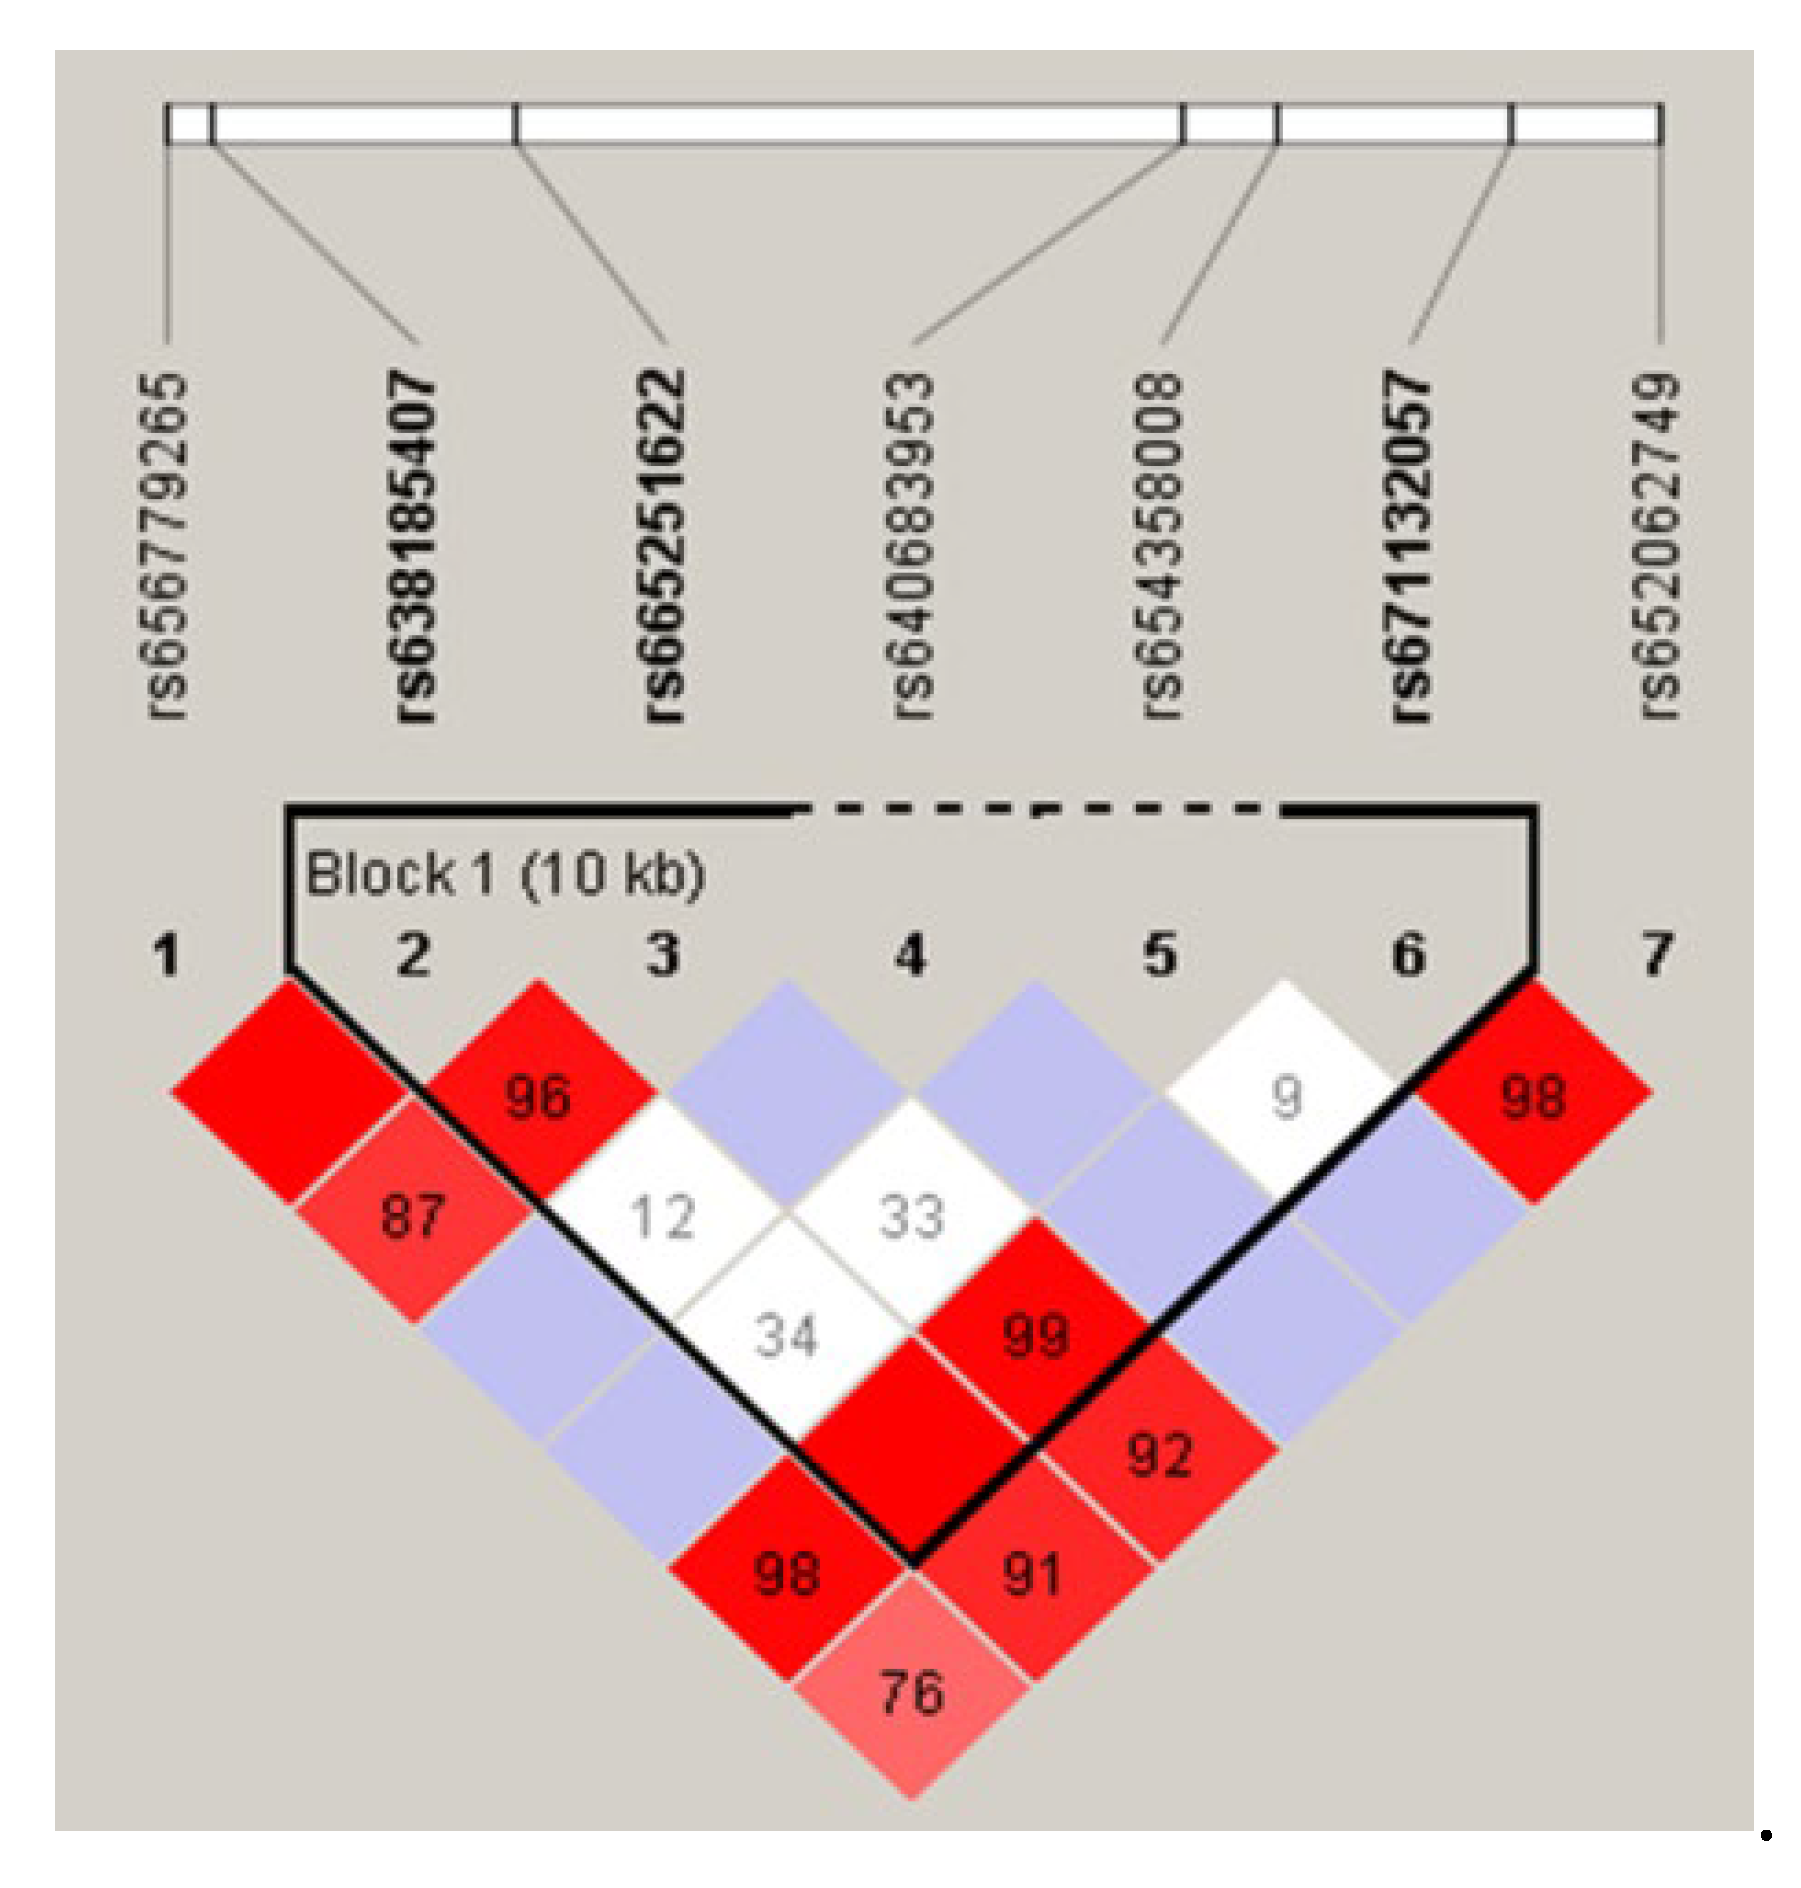
Linkage disequilibrium analysis and haplotype construction were performed using Haploview 4.2 software based on the location of the SNPs and the typing information (Figure 3). The results show a strong linkage between the rs638185407 (T>A), rs665251622 (A>C) and rs671132057 (T>C) (D'(rs638185407, rs665251622) = 0.962, D'(rs665251622, rs671132057) = 0.991 and D'(rs638185407, rs671132057) = 1.000). In addition, four haplotypes were constructed between the populations. The frequency of the TAT haplotype was the highest at 0.458, followed by the TCC and ACC haplotypes at 0.319 and 0.117 respectively, and the TAC haplotype had the lowest frequency of 0.103.

3.4. Association of SNPs and Combination Genotypes with Growth Traits

To investigate whether these SNPs related to the growth traits of Nanjiang Yellow Goat, we analysed the association of SNPs and combination genotypes with growth traits. The genotypes of SNPs in linkage disequilibrium were combined to form combination genotypes. In order to improve the accuracy of the association analysis, only samples with a sample size of more than 3 were selected for the association analysis of SNPs and combination genotypes with growth traits in Nanjiang yellow goat.

3.5. Association Analysis of Seven SNPs with Growth Traits

According to the results of the correlation analysis of growth traits of Nanjiang yellow goat at each month of age (Table 3, Table 4, and Table 5), it is shown that individuals with AG genotypes at rs656779265 (G>A) locus, BW-2, BL-18 and CC-18 were highly significantly higher than those with AA genotypes (P<0.01), and individuals with BL-2, BH-2, BL-6 and BW-18 were significantly higher than those with AA genotypes (P<0.05). In addition, CC-18 was highly significantly higher in individuals with the AG genotype than with the GG genotype (P<0.01), and BW-2, BW-18 and BL-18 were significantly higher than with the GG genotype (P<0.05). However, CC-4 was significantly higher (P<0.05) in individuals with the GG genotype than in those with the AG genotype only at the rs656779265 (G>A) locus.
Individuals with TT and AT genotypes at rs638185407 (T>A) locus had highly significantly higher BW-0, CC-2 than AA genotypes (P<0.01), and individuals with AT genotypes had significantly higher BH-2 than AA genotypes (P<0.05). In addition, individuals with the TT genotype at the rs638185407 (T>A) locus had BH-4, CW-4 highly significantly higher than the AT genotype (P<0.01), and BW-4, BL-4 and CH-4 significantly higher than the AT genotype (P<0.05). As the sample size of AA genotypes was less than three, post hoc tests were not performed. Unlike before, individuals with the AT genotype at the rs638185407 (T>A) locus had a highly significantly higher CC-18 (P<0.01) and a significantly higher BL-18 (P<0.05) than the AA genotype.
Individuals with the CA genotype at the rs665251622 (A>C) locus had significantly higher BW-18 and CC-18 than the CC genotype (P<0.05). As the sample size of the CA genotype at the rs640683953 (A>C) locus was less than three individuals, post hoc tests were not performed.
The BW-0 of the GC genotype at the rs654358008 (G>C) locus was significantly higher than that of the CC genotype (P<0.05). More interestingly, individuals with the GC genotype at rs654358008 (G>C) showed a significant advantage in terms of birth weight. Compared with the CC genotype, the GC genotype had significantly higher BH-2, BW-6, BL-6, BH-6, CC-6, BW-12, BL-12, BH-12, CC-12, BW-18, BL-18 and CC-18 than the CC genotype (P<0.01), and the BW-2, BL-2, CC-2 and BH-18 were significantly higher than the CC genotype (P<0.05). 0.05). More importantly, the goats with the GC genotype of rs654358008 had significantly larger growth traits or heavier body mass compared to the goats with other genotypes at all periods. And more importantly, goats with the GC genotype of rs654358008 had significantly larger growth traits or heavier body mass compared to goats with other genotypes at all periods.
Individuals with CT genotype at the rs671132057 (T>C) locus had BL-18 and CC-18 highly significantly higher than TT genotype (P<0.01), and individuals with CT genotype had BW-2, BL-2, BH-2, CC-2 significantly higher (P<0.05) than TT genotype. In addition, BL-2 and BH-2 were significantly higher (P<0.05) than TT genotype in individuals with CC genotype and CC-4 was significantly higher (P<0.05) than CT genotype in individuals with CC genotype. In addition, CC-18 was significantly higher (P<0.05) than CC genotype in individuals with CT genotype.
Individuals with AA genotype at the rs652062749 (G>A) locus had BL-4 highly significantly higher (P<0.01) than GG genotype and significantly higher (P<0.05) than AG genotype, but showed a disadvantage in the subsequent period. rs652062749 (G>A) individuals with GG genotype at the rs652062749 (G>A) locus had BL-6, CC-6, BL-12 and BH-12 highly significantly higher than AA genotypes (P<0. 01), BW-6, BH-6, BW-12 and CC-12 were significantly higher than AA genotypes (P<0.05), and BL-6, CC-6 and BL-12 were significantly higher than AG genotypes (P<0.05). The rs652062749 (G>A) locus of the GG genotypes individuals of BL-12 and BH-12 were extremely significantly higher than AA genotypes (P<0.01), BW-12 and CC-12 were significantly higher than AA genotypes (P<0.05) and their BL-12 was significantly higher than AG genotypes (P<0.05).
Combination genotypes are formed by combining genotypes of SNPs in linkage disequilibrium. To ensure accurate association analysis, only combination genotypes with a sample size of more than three individuals were selected for association analysis with the growth traits of Nanjiang yellow goats.
The association analysis of combination genotypes and birth weight of Nanjiang Yellow goat revealed that the average birth weight of the ATCACT combination genotype was the largest. The birth weights of individuals with the ATCACT combination genotype were significantly better (P<0.01) than those with the AACCCC and ATCACC combination genotypes, as well as the TTAATT and TTCCCC combination genotypes. In contrast, the AACCCC combination genotype was significantly inferior (P<0.01) compared to other genotypes.
The analysis of the association between combination genotypes and growth traits at two months of age revealed that the Nanjiang yellow goat group with the TTAACT combination genotype exhibited the greatest mean values for all parameters. However, the difference in body weight and chest circumference with the other combination genotypes was not statistically significant. Moreover, the body length and height of individuals with the TTAACT combination genotype were significantly better than those of the TTAATT genotype group (P < 0.05).
Table 7. Association analysis of combination genotypes and growth traits of Nanjiang Yellow goat at two months of age.
Combination Genotypes Two Months of Age
Body Weight(kg) Body Length(cm) Body Height(cm) Chest Circumference(cm)
ATCACC(5) 11.20±1.10 47.20±2.39 45.40±1.34 51.40±1.67
ATCACT(31) 11.52±1.08 47.48±1.61 45.65±1.40 51.40±1.72
TTAACT(8) 11.88±1.25 48.88±2.70a 46.88±2.42a 52.25±1.28
TTAATT(45) 11.03±0.90 46.78±1.29b 45.02±1.16b 50.91±1.36
TTCACC(10) 11.10±0.52 47.50±1.51 45.60±1.07 51.25±1.03
TTCACT(53) 11.40±0.84 47.28±1.61 45.23±1.19 51.02±1.39
TTCCCC(23) 11.13±0.96 47.00±1.62 45.17±1.34 51.35±1.47
Different lowercase letters in the same column indicate significant differences (P<0.05), different capital letters indicate extremely significant difference (P<0.01), no letter indicates no significant difference (P>0.05).
The association analysis of genotypes with weight and growth traits at four months of age showed that TTCCCC genotypes were extremely significantly better than ATCACT genotypes (P<0.01) and significantly better than TTCACC genotypes (P<0.05). In addition, TTCCCC genotypes were extremely significantly better than ATCACT genotypes concerning body length (P <0.01) and significantly better than TTCACC, TTAATT, and TTAACT combination genotypes (P<0.05). The height of the TTCCCC combination genotypes was extremely significantly better than the ATCACT combination genotypes (P<0.01) and significantly better than the TTCACC and ATCACC combination genotypes (P<0.05). In addition, the chest circumference of the TTCCCC combination genotypes was significantly better than that of the ATCACT combination genotypes (P<0.05).
Table 8. Association analysis of combination genotypes and growth traits of Nanjiang Yellow goat at four months of age.
Combination Genotypes Four Months of Age
Body Weight(kg) Body Length(cm) Body Height(cm) Chest Circumference(cm)
ATCACC(5) 14.24±1.71 52.76±1.97abc 49.52±1.94bd 55.96±2.63a
ATCACT(13) 13.05±2.24B 49.83±2.86Babd 48.37±3.21Babd 52.82±3.13b
TTAACT(13) 14.24±2.68 51.27±2.55bcd 50.32±2.61 54.63±4.04
TTAATT(21) 14.30±2.15 51.46±2.49bcd 50.65±3.08abc 54.40±3.15
TTCACC(17) 13.81±1.91b 51.28±2.83bcd 49.90±2.06bd 54.74±2.12
TTCACT(40) 14.37±1.83 52.13±2.74 50.43±2.80 54.43±2.63
TTCCCC(10) 15.70±2.34Aa 54.03±1.92Aacd 52.15±2.09Aacd 55.96±3.34a
Different lowercase letters in the same column indicate significant differences (P<0.05), different capital letters indicate extremely significant difference (P<0.01), no letter indicates no significant difference (P>0.05).
The association of combined genotypes with growth traits at the age of six months revealed that the TTAACT combined genotypes individuals were significantly superior (P<0.05) to the TTCCCC combined genotypes in terms of body weight and body length. Furthermore, the body height of TTAACT combination genotypes individuals was extremely significantly better than that of TTCCCC and TTCACT combination genotypes (P<0.01) and significantly better than those of TTAATT combination genotypes (P<0.05). TTAACT combination genotypes' chest circumference was significantly better than TTCACT and TTCCCC combination genotypes (P<0.01).
Table 9. Association analysis of combination genotypes and growth traits of Nanjiang Yellow goat at six months of age.
Combination Genotypes Six Months of Age
Body Weight(kg) Body Length(cm) Body Height(cm) Chest Circumference(cm)
ATCACC(5) 26.40±5.81abc 59.20±7.36 57.20±7.05ACD 65.40±5.13
ATCACT(31) 27.29±4.31Aacd 60.71±5.75Aacd 57.19±5.03ACDabc 66.82±4.75ACDacd
TTAACT(8) 28.19±5.74abc 60.75±5.65abc 58.5±5.63ACacd 67.00±5.01ABCabc
TTAATT(45) 25.50±4.02 58.80±5.37 55.71±4.66bcd 64.82±4.28bcd
TTCACC(10) 26.70±3.43 59.90±4.98 56.90±4.41 66.00±4.22bcd
TTCACT(53) 25.47±4.06bcd 58.68±5.08bcd 55.75±4.45ABDabd 64.56±4.32BDbd
TTCCCC(23) 24.78±4.39Babd 57.78±5.08Babd 55.09±4.06BCDabd 64.04±3.78BDbd
Different lowercase letters in the same column indicate significant differences (P<0.05), different capital letters indicate extremely significant difference (P<0.01), no letter indicates no significant difference (P>0.05).
Correlating the combination genotypes with growth traits at one year of age exhibited that the samples with TTAACT combination genotypes exhibited the highest data for all growth traits. Among them, the TTAACT combination genotypes were significantly better than the TTCCCC combination genotypes regarding body weight (P<0.01) and significantly better than the TTCACT combination genotypes.
The body length of TTAACT combination genotypes was found to be extremely significantly better than TTCACT and TTCCCC combination genotypes (P<0.01) and significantly better than TTAATT and TTCACC combination genotypes (P<0.05).
Individuals of the TTAACT combination genotype exhibited extremely significantly better body height than those of the TTCACT and TTCCCC combination genotypes (P<0.01) and significantly better than the TTAATT combination genotypes (P<0.05). Furthermore, Individuals of the TTAACT combination genotype were significantly better (P<0.05) than those of the TTCACT and TTCCCC combination genotypes regarding chest circumference.
The association of combined genotypes with growth traits at 1.5 years of age revealed (Table 11) that individuals of TTAACT combination genotype were significantly superior to TTAATT and TTCACT combined genotypes in body weight (P<0.05). In addition, the body length of individuals with TTAACT combination genotypes exhibited extremely significantly better than TTCCCC combination genotypes (P<0.01) and significantly better than TTAATT and TTCACT combination genotypes (P<0.05). Moreover, the body height of individuals with TTAACT combination genotypes was extremely significantly better than TTCCCC combination genotypes (P<0.01). Moreover, the chest circumference of TTAACT combination genotype individuals was found to be extremely significantly better than TTAATT, TTCACT, and TTCCCC combination genotypes (P<0.01) and significantly better than TTCACC combination genotypes (P<0.05).
Table 10. Association analysis of combination genotypes and growth traits of Nanjiang Yellow goat at one year of age.
Combination Genotypes One Year of Age
Body Weight(kg) Body Length(cm) Body Height(cm) Chest Circumference(cm)
ATCACC(5) 35.30±4.02 66.80±5.76abc 64.00±5.43acd 76.40±6.58acd
ATCACT(31) 35.53±5.29Aacd 67.06±5.82Aabc 63.87±4.99acd 74.83±4.79acd
TTAACT(8) 37.31±6.85Aabc 69.13±6.51Aacd 65.63±5.4Aacd 78.13±5.33acd
TTAATT(45) 33.77±4.71 65.76±4.95bcd 62.71±4.23bcd 74.58±5.01
TTCACC(10) 34.40±5.81abc 66.70±5.01bcd 64.20±4.26abc 76.90±4.98abc
TTCACT(53) 33.67±4.48bd 65.51±4.8Bbd 62.68±4.11Bbcd 76.44±5.77bcd
TTCCCC(23) 32.89±4.85Bbd 65.09±4.44Bbd 62.17±3.95Bbd 74.24±4.72bd
Different lowercase letters in the same column indicate significant differences (P<0.05), different capital letters indicate extremely significant difference (P<0.01), no letter indicates no significant difference (P>0.05).

3.7. The Detection and Functional Verification of Non-Coding SNPs in IGF2BP1

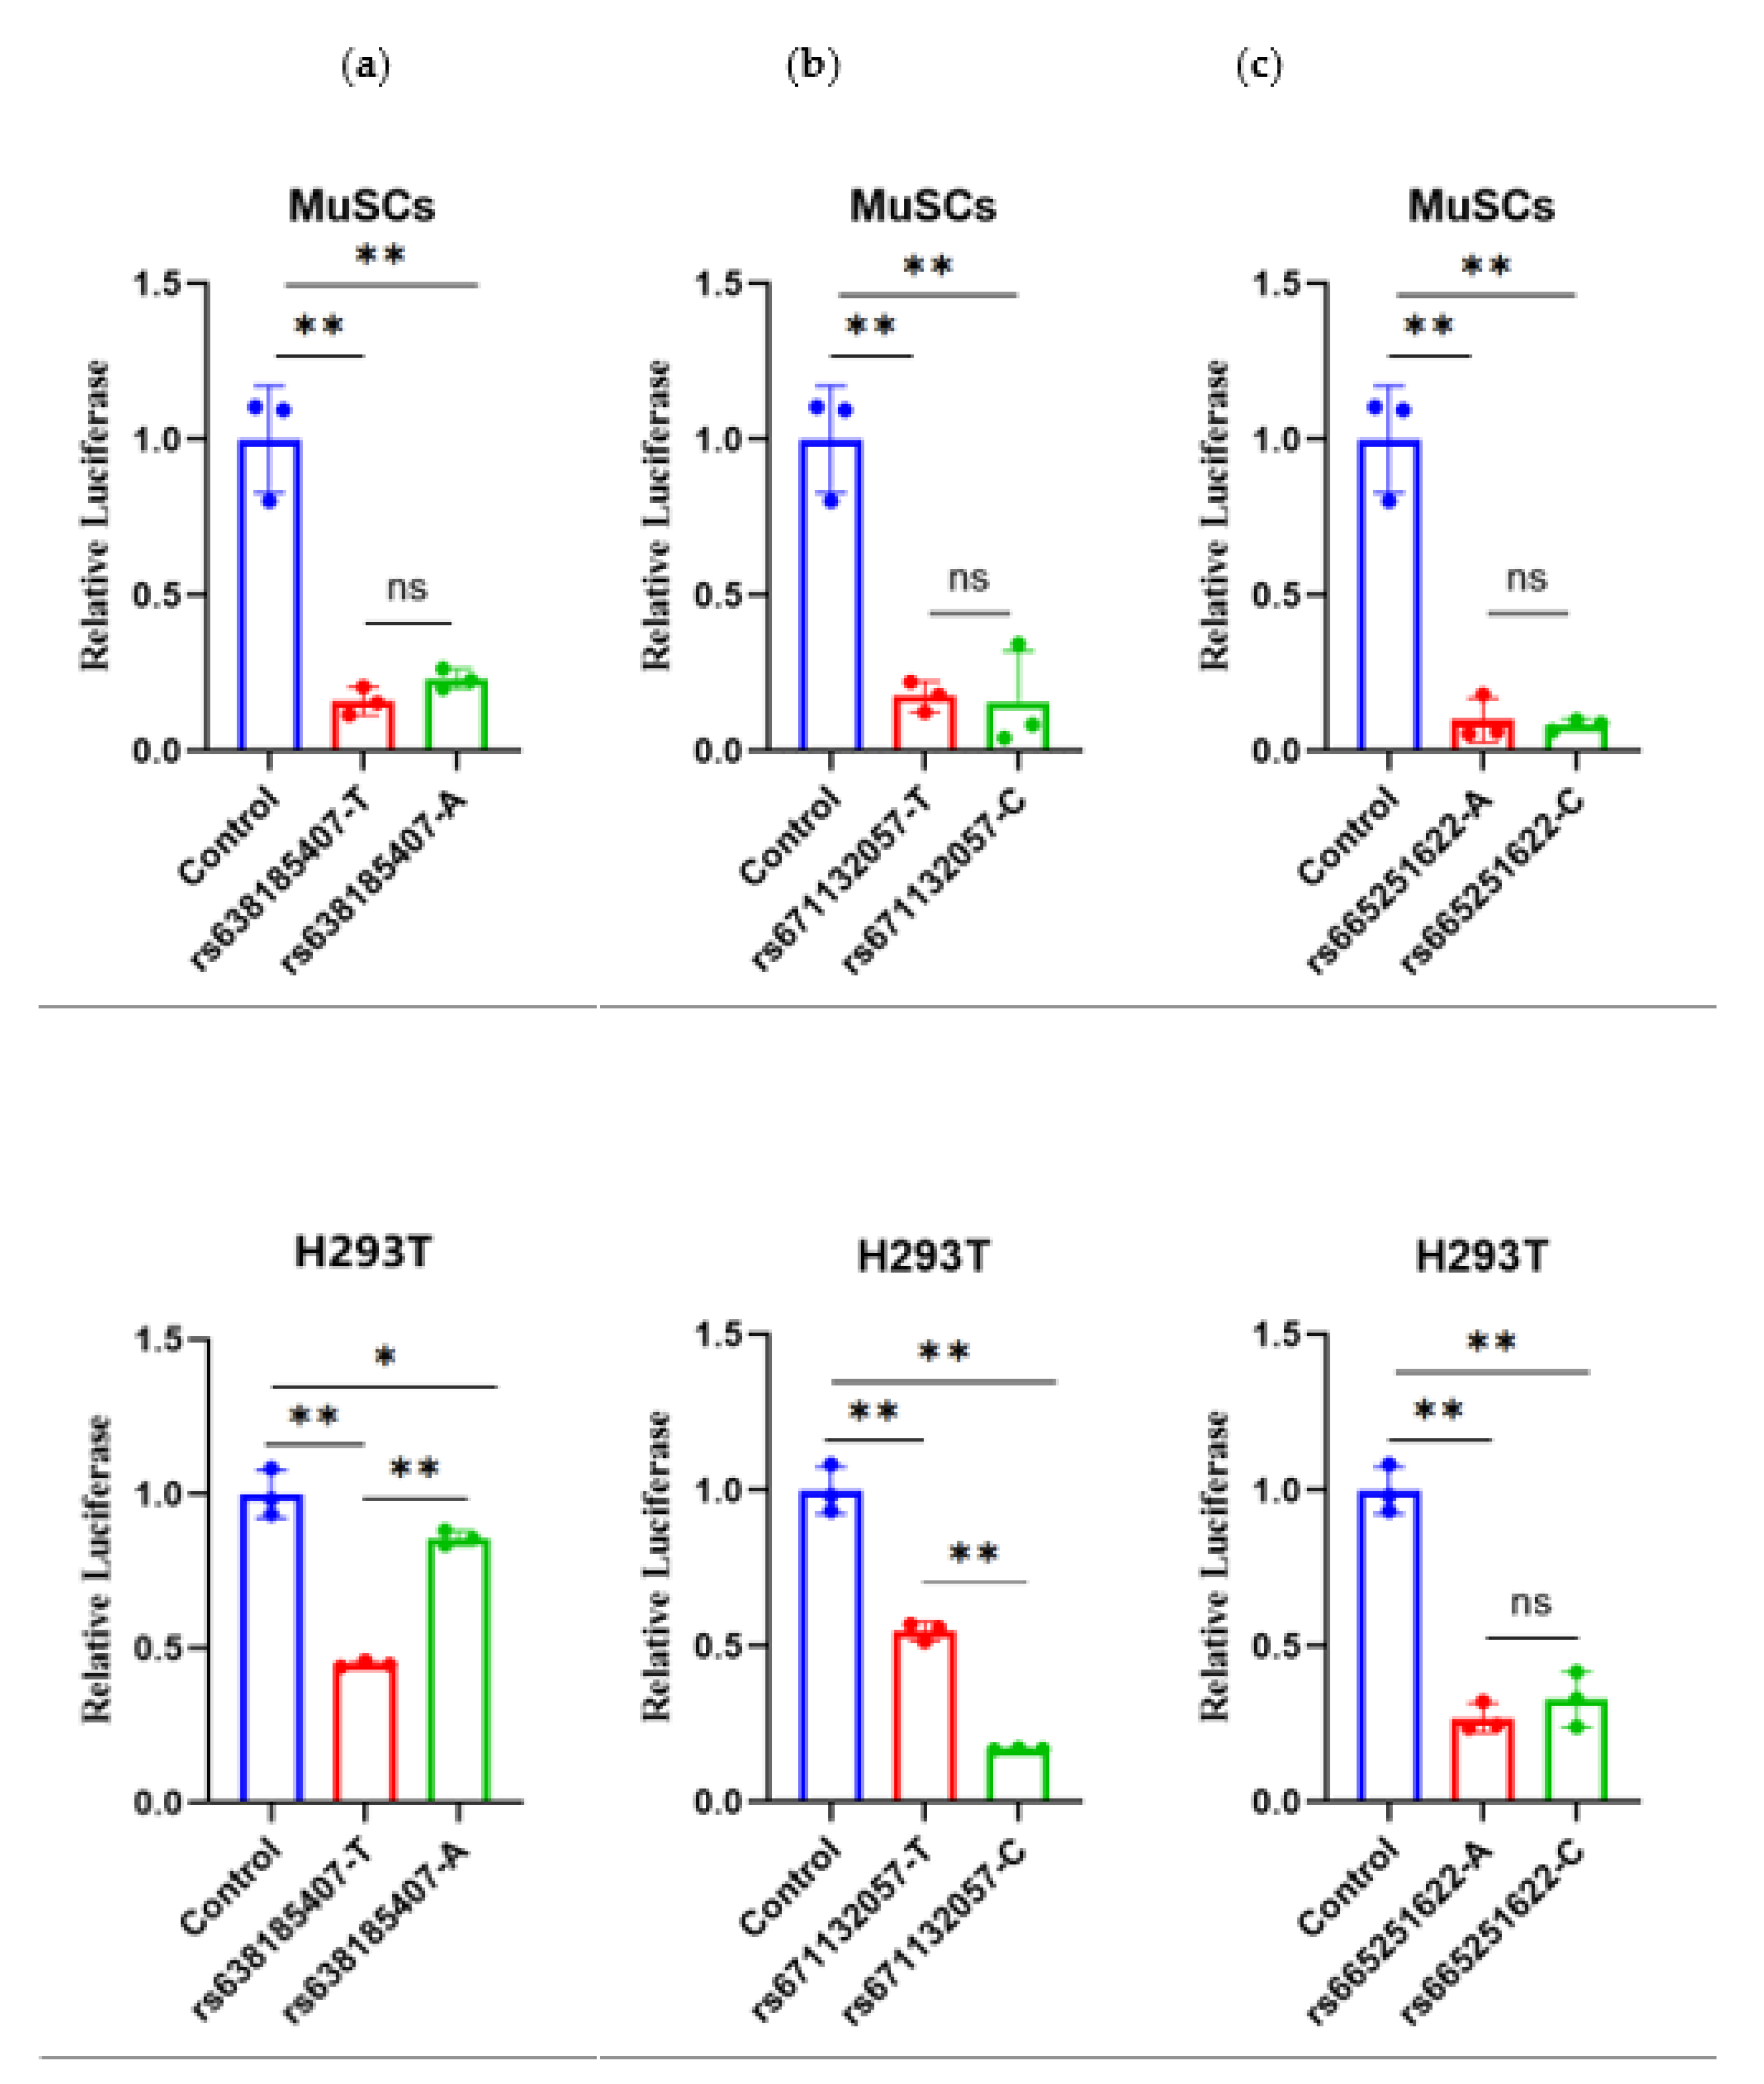
SNPs in non-coding regions can indirectly regulate the gene expression process, thereby affecting animal phenotype or reproductive performance [23,24]. The dual luciferase reporter vector assay is an accurate and reliable method to validate non-coding SNPs in research [25,26]. In this study, we performed dual luciferase assays for three strong linkage SNPs in two cells, H293T and MuSCs (Figure 4). For RS638185407(T>A), the dual luciferase activity of both genotypes in MuSCs cells was extremely significantly lower than that of the control (P<0.01), which demonstrated an inhibitory effect. However, the comparison of the two types was not statistically significant. There was a tendency for the mutant type (A) to be elevated, with the dual-luciferase activity of the wild type being extremely significantly lower than that of the control (P<0.01) and the mutant type being significantly lower than the H293T cells (P<0.05). Both the wild and mutant types demonstrated an inhibitory effect, with the wild type's activity also found to be extremely significantly lower than that of the mutant type (P<0.01).
In terms of RS671132057(T>C), in MuSCs cells, the dual-luciferase activities of both types were extremely significantly lower than that of the control (P<0.01), indicating an inhibitory effect. However, the comparison between the two types was not significant, while the mutant type(C) tended to decrease. In H293T cells, both types' dual-luciferase activities were also extremely significantly lower than the control (P<0.01), indicating an inhibitory effect. Furthermore, the mutant activity was extremely significantly lower than the wild type (P<0.01).
For RS665251622(A>C), both genotypes exhibited extremely significantly lower (P<0.01) dual-luciferase activity in MuSCs cells than in controls (P<0.01), which was inhibitory. However, the comparison between the two types was not significant, while the wild type's dual-luciferase activity was extremely significantly lower (P<0.01) in H293T cells than in controls (P<0.01), both of which were inhibitory. The comparison between the two types was not significant, with a tendency for the mutant type (C) to be elevated.
4. Discussion

IGF2BP1 is a crucial candidate gene affecting animal growth and development. Consequently, association analysis studies of its polymorphisms with growth traits have also been conducted in numerous livestock and poultry species. Several studies have demonstrated a direct correlation between the degree of genetic heterozygosity and population genetic diversity. This implies that the higher the degree of heterozygosity, the richer the genetic diversity and the greater the selection pressure [27,28,29]. In this experiment, a total of three SNPs, rs638185407 (T>A), rs640683953 (A>C), and rs654358008 (G>C), exhibited a low degree of polymorphism (0.25 ≥ PIC), which indicated that the enrichment of genetic diversity was low at these three SNPs [30,31]. Except for the three SNPs mentioned above, the effective allele numbers of the remaining SNPs were close to 2, indicating that these SNPs exhibited a high degree of variation and richness of genetic diversity [32]. The Hardy-Weinberg equilibrium test revealed that all SNPs were in equilibrium, indicating that these SNPs had not been subjected to high-intensity artificial selection [33]. This was because the experimental samples were all harvested from the same region, with a concentrated growth environment and a long period of closed breeding.
Many researches have demonstrated that the majority of SNPs do not directly influence protein sequences. Instead, they primarily impact individual organisms through mutations, resulting in the elimination of various transcription factor binding sites and the emergence of new binding sites. These alterations enable transcription factors to function, thereby influencing the regulation of gene expression [34,35,36]. In this study, six SNPs (rs638185407 (T>A), rs665251622 (A>C), rs640683953 (A>C), rs654358008 (G>C), rs671132057 (T>C), and rs652062749 (G>A)) were found to have altered transcription factor binding site before and after mutation number was changed, presumably affecting the expression of IGF2BP1 gene in Nanjiang yellow goat. The correlation between the pre-mutation and post-mutation changes of transcription factors at the three strongly interlinked SNP sites and the results of the dual luciferase assay were investigated, as well as their correlation with the results of the growth trait association analysis.
MEF2 plays various roles in muscle cells [37,38,39]. It has been found to act not only in studies of Drosophila muscle by collaborating with PAR structural domain protein 1 [40], but also to affect Ashtan yak growth and development through MEF2A gene copy number variation [41]. In this study, three new Myocyte enhancer factor-2(MEF2) family transcription factors, MEF2C, MEF2B, and MEF2D, were identified after mutation at the rs665251622 (A>C) locus. Preliminary validation using MuSCs and H293T cells revealed that the difference in dual-luciferase activities between the mutant type and wild type at the rs665251622 (A>C) site was not significant, which is consistent with the previous association analysis results performed in agreement. This indicates that this locus is not a potential locus to affect the growth traits of Nanjiang yellow goats.
The transcription factor JUNB, as a member of the dimeric transcription factor AP-1 (Activator Protein-1) family, inhibits cell proliferation, induces cellular senescence, and suppresses tumor development [42,43,44,45]. The prediction of transcription factor binding sites revealed that the wild type of the rs638185407 (T>A) locus has a JUNB binding site, whereas the mutant type has lost the JUNB binding site. Losing the JUNB binding site may lead to the elevation of the dual-luciferase of the rs638185407 (T>A) locus in the mutant type compared to the wild type. However, the data obtained from the association analysis indicated heterozygous dominance, which was inconsistent with the results of the dual-luciferase activity assay. This indicates that this locus may affect the growth traits of Nanjiang yellow goats through other pathways, and the specific reasons need to be further investigated.
Furthermore, the POU family of structural domain factors is an essential class of regulators with specific structural domains and POU-HDs, which were necessary for high-affinity DNA sequence recognition [46]. Their main functions are to inhibit or promote cell proliferation, migration, and differentiation [47,48,49]. The POU family genes, including POU1F1, POU2F1, and POU3F1, were identified prior to the rs671132057 (T>C) mutation. However, the POU family of genes disappeared from this SNP after the mutation, which may be responsible for the significant decrease in dual luciferase activity compared to before the mutation. As for the association analysis results, individuals with this locus showed heterozygous dominance in all growth traits. The results of cellular-level validation and individual-level analysis were inconsistent, indicating that the effect of the mutation locus on the phenotype of an individual is a complex process. Therefore, the specific mechanism by which this locus affects the growth traits of the Nanjiang yellow goats remains to be further investigated.

5. Conclusions

In this study, seven SNPs in the second intron of the IGF2BP1 gene were identified in 348 Nanjiang yellow goats. These SNPs were located in the conserved non-coding region of the gene and six of them were significantly associated with the growth traits of the Nanjiang yellow goat. The findings contribute to a better understanding of the genetic mechanisms underlying growth traits in Nanjiang Yellow goats and emphasize the importance of the IGF2BP1 gene in breeding strategies aimed at enhancing productivity and performance in this economically valuable breed.

Supplementary Materials

TThe following supporting information can be downloaded at the website of this paper posted on Preprints.org. Figure S1: Schematic diagram of PGL 4.23 vector recombinant plasmid: (a): PGL 4.23 vector plasmid containing rs671132057 (T>C) (b): PGL 4.23 vector plasmid containing the rs638185407 (T>A) (c): PGL 4.23 vector plasmid containing the rs665251622 (A>C); Figure S2: Gel electrophoresis of genomic DNA samples; Table S1: Enzyme-cut primer information; Table S2: Primer information for amplification of 7 SNP on the second intron of IGF2BP1; Table S3: Primers used for Mass-array genotyping; Table S4: Prediction of binding sites for transcription factors.

Author Contributions

Conceptualization, J.C. and M.L.; methodology, S.C, L.X. J.L. and Z.C.; software, L.X. and J.L; validation, J.C., S.C. and L.X.; formal analysis, S.C.; investigation, L.X. and H.Z.; resources, Y.C.; data curation, L.L.; writing—original draft preparation, S.C.; writing—review and editing, S.C. and L.X.; visualization, L.X.; supervision, J.C.; project administration, J.C. and M.L.; funding acquisition, J.C. M.L. and H.Z. All authors have read and agreed to the published version of the manuscript.

Funding

This research was funded by The National Key R&D Program of China (2022YFF1000100), the National Natural Science Foundation of China (31802048 and 32225046); the Sichuan Science and Technology Program (2023YFN0082 and 2021YFYZ0009).

Institutional Review Board Statement

The animal study protocol was approved by the Ethics Committee of Sichuan Agricultural University (protocol code 20230037 and March 5, 2023).

Informed Consent Statement

Not applicable.

Data Availability Statement

The data from this study are exhibited in this manuscript and Supplementary Materials.

Acknowledgments

The data related to the production of Nanjiang Yellow goats were obtained from the breeding farm of Nanjiang Yellow goats in Sichuan Province. We would like to thank researcher Yu Chen for his support.

Conflicts of Interest

Author Yu Chen was employed by the company Sichuan Nanjiang Yellow Goat Breeding Farm. The remaining authors declare that the research was conducted in the absence of any commercial or financial relationships that could be construed as a potential conflict of interest.

References

  1. Wang, Y. Development history, status quo and outlook of China's cashmere goat industry. Modern Journal of Animal Husbandry and Veterinary Medicine 2019, 47–50. [Google Scholar]
  2. Tian, W.; Lin, Q.; Li, L.; Zan, L.; Xin, Y. Development status and trend of China's dairy goat industry. Journal of Domestic Animal Ecology 2014, 35, 80–84. [Google Scholar]
  3. Wang, Z.; Han, L.; Tang, H.; Hu, Y.; Xiao, G.; Huang, X. Analysis of the current situation of China's meat sheep industry and development countermeasures. Heilongjiang J. Anim. Sci. Vet. Med. 2011, 24–25. [Google Scholar] [CrossRef]
  4. Sun, W.; Na, R.; Zhao, B.; Zhao, Y. Current situation and countermeasures for the conservation of goat genetic resources in China. Heilongjiang Animal Science and Veterinary Medicine 2014, 82–85. [Google Scholar] [CrossRef]
  5. Wang, X. Study on the economic efficiency of meat goat production in China. Doctor, 2018.
  6. Wang, W.; Xiong, Z.; Jia, S.; Zhang, G.; Chen, Y.; Tan, Y. Progress of Nanjiang yellow goat line breeding in "ninth Five-Year Plan". Journal of Grassland and Forage Science 2001, 52–54. [Google Scholar]
  7. Zhang, H.; Chen, S. Study on the meat production performance and muscle quality of the crossbreeding generation between Boer goats and Nanjiang yellow goat. Journal of Sichuan Agricultural University 2000, 53–56. [Google Scholar] [CrossRef]
  8. Zhang, H.; Wang, W.; Xiong, C.; Zhang, G.; Chen, Y. Germplasm Characteristics of Nanjiang Yellow Goat. China Herbivore Science 2004, 113–114. [Google Scholar]
  9. Ansseau, E.; Sciot, M.; Goudji, C.; Castella, S.; Larcher, J.; Belayew, A.; Coppée, F. Deregulation of IGF2BP1-mRNP components during the differentiation of FSHD muscle cells. Neuromuscular Disorders 2017, 27, S202–S202. [Google Scholar] [CrossRef]
  10. Chen, J.; Ren, X.; Li, L.; Lu, S.; Chen, T.; Tan, L.; Liu, M.; Luo, Q.; Liang, S.; Nie, Q.; et al. Integrative Analyses of mRNA Expression Profile Reveal the Involvement of IGF2BP1 in Chicken Adipogenesis. International Journal of Molecular Sciences 2019, 20, 2923–2923. [Google Scholar] [CrossRef]
  11. Lu, C. Functional studies of Dmrt2a and igf2bp1 in zebrafish embryonic development. Doctor, Huazhong Agricultural University, 2017.
  12. Vikash, S.; P, G.C.; Vishal, S.; S, G.A.; M, K.D.; A, E.M.; S, Y.G.; Prashant, N.; S, S.V. The mRNA-binding protein IGF2BP1 maintains intestinal barrier function by up-regulating Occludin expression. The Journal of biological chemistry 2020, 295, 8602–8612. [Google Scholar]
  13. Ma, M.; Shen, M.; Qu, L.; Dou, T.; Guo, J.; Hu, Y.; Lu, J.; Li, Y.; Wang, X.; Wang, K. Genome-wide association study for carcase traits in spent hens at 72 weeks old. Italian Journal of Animal Science 2019, 18, 261–266. [Google Scholar] [CrossRef]
  14. Zhou, Z.; Li, M.; Cheng, H.; Fan, W.; Yuan, Z.; Gao, Q.; Xu, Y.; Guo, Z.; Zhang, Y.; Hu, J.; et al. An intercross population study reveals genes associated with body size and plumage color in ducks. Nature Communications 2018, 9. [Google Scholar] [CrossRef]
  15. Kuang, J. Determination of meat performance and analysis of polymorphism and association of IGF2BP1 gene in M line of Chaohu ducks. Master, Anhui Agricultural University, 2019.
  16. Wang, Z.; Zhang, X.; Jiang, E.; Yan, H.; Zhu, H.; Chen, H.; Liu, J.; Qu, L.; Pan, C.; Lan, X. InDels within caprine IGF2BP1 intron 2 and the 3′-untranslated regions are associated with goat growth traits. Animal Genetics 2020, 51, 117–121. [Google Scholar] [CrossRef]
  17. Zhan, S.; Zhao, W.; Song, T.; Dong, Y.; Guo, J.; Cao, J.; Zhong, T.; Wang, L.; Li, L.; Zhang, H. Dynamic transcriptomic analysis in hircine <i>longissimus dorsi</i> muscle from fetal to neonatal development stages. Functional & Integrative Genomics 2018, 18, 43–54. [Google Scholar] [CrossRef]
  18. Xu, X.; Leng, J.; Zhang, X.; Capellini, T.D.; Chen, Y.; Yang, L.; Chen, Z.; Zheng, S.; Zhang, X.; Zhan, S.; et al. Identification of IGF2BP1-related lncRNA-miRNA-mRNA network in goat skeletal muscle satellite cells. Animal science journal = Nihon chikusan Gakkaiho 2021, 92, e13631. [Google Scholar] [CrossRef]
  19. Guo, J.; Tao, H.; Li, P.; Li, L.; Zhong, T.; Wang, L.; Ma, J.; Chen, X.; Song, T.; Zhang, H. Whole-genome sequencing reveals selection signatures associated with important traits in six goat breeds. Scientific reports 2018, 8, 10405. [Google Scholar] [CrossRef]
  20. Xu, L.; Chen, Z.; Chen, S.; Chen, Y.; Guo, J.; Zhong, T.; Wang, L.; Zhan, S.; Li, L.; Zhang, H.; et al. An Identification of Functional Genetic Variants in B4GALNT2 Gene and Their Association with Growth Traits in Goats. Genes 2024, 15. [Google Scholar] [CrossRef]
  21. Wei, Z.; Li, C.; Tao, Z.; Linjie, W.; Jiazhong, G.; Yao, D.; Jing, F.; Tianzeng, S.; Li, L.; Hongping, Z. The differential proliferation and differentiation ability of skeletal muscle satellite cell in Boer and Nanjiang brown goats. Small Ruminant Research 2018, 169, 99–107. [Google Scholar] [CrossRef]
  22. Zhao, S.; Cao, J.; Sun, Y.; Zhou, H.; Zhu, Q.; Dai, D.; Zhan, S.; Guo, J.; Zhong, T.; Wang, L.; et al. METTL3 Promotes the Differentiation of Goat Skeletal Muscle Satellite Cells by Regulating MEF2C mRNA Stability in a m(6)A-Dependent Manner. International journal of molecular sciences 2023, 24. [Google Scholar] [CrossRef]
  23. Hoogendoorn, B.; Coleman, S.L.; Guy, C.A.; Smith, S.K.; O'Donovan, M.C.; Buckland, P.R. Functional analysis of polymorphisms in the promoter regions of genes on 22q11. Human mutation 2004, 24, 35–42. [Google Scholar] [CrossRef]
  24. Jolma, A.; Yan, J.; Whitington, T.; Toivonen, J.; Nitta, K.R.; Rastas, P.; Morgunova, E.; Enge, M.; Taipale, M.; Wei, G.; et al. DNA-Binding Specificities of Human Transcription Factors. Cell 2013, 152, 327–339. [Google Scholar] [CrossRef]
  25. Chen, W.; Xu, H.; Chen, X.; Liu, Z.; Zhang, W.; Xia, D. Functional and Activity Analysis of Cattle <i>UCP3</i> Promoter with MRFs-Related Factors. International Journal of Molecular Sciences 2016, 17. [Google Scholar] [CrossRef]
  26. Zhang, Z.; Liu, C.; Hao, W.; Yin, W.; Ai, S.; Zhao, Y.; Duan, Z. Novel Single Nucleotide Polymorphisms and Haplotype of MYF5 Gene Are Associated with Body Measurements and Ultrasound Traits in Grassland Short-Tailed Sheep. Genes 2022, 13. [Google Scholar] [CrossRef]
  27. Barrandeguy, M.; García, M. The Sensitiveness of Expected Heterozygosity and Allelic Richness Estimates for Analyzing Population Genetic Diversity. 2021.
  28. Boca, S.M.; Huang, L.; Rosenberg, N.A. On the heterozygosity of an admixed population. Journal of Mathematical Biology 2020, 81, 1217–1250. [Google Scholar] [CrossRef]
  29. Boyce, W.M.; Weisenberger, M.E.; Penedo, M.C.T.; Johnson, C.K. Wildlife translocation: the conservation implications of pathogen exposure and genetic heterozygosity. BMC ecology 2011, 11, 5–5. [Google Scholar] [CrossRef]
  30. Guo, P. Polymorphism and association analysis of genes related to growth traits in Angus cattle. Master, 2019.
  31. Zhang, Y.; Gao, Y.; Zhang, Q.; Liu, Q.; Zhang, Q.; Zhang, J.; ZHang, S. Analysis of intron 6 polymorphism in NR5A2 gene of Songliao black pig and its association with reproductive traits. Chinese Journal of Animal Science 2021, 57, 119–122. [Google Scholar] [CrossRef]
  32. Jiang, Y.; Wang, S.; Zhu, L.; Yang, H.; Hong, Q. Analysis of the polymorphism of muscle growth inhibitor gene in black sheep on Yunshang Mountain. China Herbivore Science 2020, 40, 4. [Google Scholar]
  33. Wang, F. Analysis of polymorphisms of GDF9 and BMP15 genes and their association with lambing number in meat sheep from Luzhong, China. Master, Chinese Academy of Agricultural Sciences, 2021.
  34. Jiao, R.; Yang, Y.; Gong, Y.; Hui, Y.; Liu, R. Polymorphism in the promoter region of the bovine STAT1 gene. Journal of Domestic Animal Ecology 2013, 34, 15–20. [Google Scholar]
  35. Liu, Y. SNP analysis of the promoter region of the A20 gene and its association with LPS responsiveness in patients with sepsis. Master, Third Military Medical University, 2013.
  36. Pan, J.; Min, F.; Wang, X. Analysis of promoter polymorphism of PPARγ2 gene in Wuzhishan minipigs. Chinese Journal of Comparative Medicine 2018, 28, 21–26. [Google Scholar]
  37. Caine, C.; Kasherov, P.; Silber, J.; Lalouette, A. Mef2 interacts with the Notch pathway during adult muscle development in Drosophila melanogaster. PLoS ONE 2017, 9, e108149. [Google Scholar] [CrossRef]
  38. Department of Laboratory Medicine, C.P., Karolinska Institutet; Karolinska University Hospital , S., Sweden.; Department of Cardiology, K.U.H., Stockholm , Sweden.; Department of Laboratory Medicine, C.P., Karolinska Institutet; Karolinska University Hospital , S., Sweden.; Department of Automation, B.; Robotics, J.S.I., Ljubljana , Slovenia.; Department of Laboratory Medicine, C.P., Karolinska Institutet; Karolinska University Hospital , S., Sweden.; Department of Environmental Physiology, S.A.P.C., KTH Royal Institute of Technology , Stockholm , Sweden. MEF2 as upstream regulator of the transcriptome signature in human skeletal muscle during unloading. American journal of physiology. Regulatory, integrative and comparative physiology 2018, 315, R799-R809.
  39. Wei, J.; Min, L.; Jian, P.; Siwen, J. Function analysis of Mef2c promoter in muscle differentiation. Biotechnology and applied biochemistry 2017, 64, 647–656. [Google Scholar]
  40. Lin, S.C.; Lin, M.H.; Horvath, P.; Reddy, K.L.; Storti, R.V. PDP1, a novel Drosophila PAR domain bZIP transcription factor expressed in developing mesoderm, endoderm and ectoderm, is a transcriptional regulator of somatic muscle genes. Development (Cambridge, England) 1997, 124, 4685–4696. [Google Scholar] [CrossRef]
  41. Li, D.; Ren, W.; La, Y.; Ma, X.; Qin, Y.; Zha, X.; Liang, C. Analysis of the association between copy number variation of MEF2A gene and growth traits in Ashtan yak China Herbivore Science 2024, 1-6.
  42. Li, B.; Tournier, C.; Davis, R.J.; Flavell, R.A. Regulation of IL-4 expression by the transcription factor JunB during T helper cell differentiation. The EMBO journal 1999, 18, 420–432. [Google Scholar] [CrossRef]
  43. Makoto, N.; Hitoshi, Y.; Eri, T.; Marcin, W.; Kimiko, T.; E, H.M.; Atsushi, S. The AP-1 transcription factor JunB functions in Xenopus tail regeneration by positively regulating cell proliferation. Biochemical and biophysical research communications 2019, 522, 990–995. [Google Scholar]
  44. Roumeliotou, A.; Strati, A.; Chamchougia, F.; Xagara, A.; Tserpeli, V.; Smilkou, S.; Lagopodi, E.; Christopoulou, A.; Kontopodis, E.; Drositis, I.; et al. Comprehensive Analysis of CXCR4, JUNB, and PD-L1 Expression in Circulating Tumor Cells (CTCs) from Prostate Cancer Patients. Cells 2024, 13, 782. [Google Scholar] [CrossRef]
  45. Yuan, L.; Zeng, L.; Ye, F.; Chen, K.; Chen, Z.; Li, L. IMPDH2 Positively Impacts the Proliferation Potential of Hepatoblastoma Cells by Activating JunB Signaling Pathway. Current molecular pharmacology 2024. [Google Scholar]
  46. K, P.; B, L. The virtuoso of versatility: POU proteins that flex to fit. Journal of molecular biology 2000, 302, 1023–1039. [Google Scholar]
  47. Yang, Q. Homologous heterodimeric domain structure and recognition of DNA. Progress in Biochemistry and Biophysics 1996, 23, 29–33. [Google Scholar]
  48. Jingwen, Y.; Jingling, Z.; Liulin, Z.; Hao, L.; Zhao-Qun, D.; Bi, M. The Octamer-Binding Transcription Factor 4 (OCT4) Pseudogene, POU Domain Class 5 Transcription Factor 1B (POU5F1B), is Upregulated in Cervical Cancer and Down-Regulation Inhibits Cell Proliferation and Migration and Induces Apoptosis in Cervical Cancer Cell Lines. Medical science monitor : international medical journal of experimental and clinical research 2019, 25, 1204–1213. [Google Scholar]
  49. Tang, X.; Zhao, Y.; Buchon, N.; Engström, Y. The POU/Oct Transcription Factor Nubbin Controls the Balance of Intestinal Stem Cell Maintenance and Differentiation by Isoform-Specific Regulation. Stem Cell Reports 2018, 10, 1565–1578. [Google Scholar] [CrossRef]
Figure 1. Seven SNPs sequencing results: Seven SNPs sequencing results of mixed pool samples, which were located at the second intron of IGF2BP1 gene. The base indicated by the arrow in the figure represents the genomic locus of the corresponding SNP. A double peak indicates the presence of this SNP within the Nanjiang Yellow goat population.
Preprints 108894 g001
Figure 2. Mass spectrometry result.
Preprints 108894 g002
Figure 3. Linkage disequilibrium analysis of IGF2BP1 gene polymorphic loci.
Preprints 108894 g003
Figure 4. The results of the dual-luciferase assays for three SNPs in two cells.
Preprints 108894 g004
Table 1. Genetic parameters and Hardy–Weinberg equilibrium test of 7 SNPs populations in the second intron of IGF2BP1 gene.
Locus Genotype Genotype Frequency Allele Frequency Ho1 He2 Ne3 H-W4 PIC5
rs656779265(G>A) AA 0.23 0.49(A) 0.5 0.5 2 0.52 0.37
AG 0.52 0.51(G)
GG 0.25
rs638185407(T>A) AA 0.01 0.12(A) 0.79 0.21 1.27 1 0.19
AT 0.21 0.88(T)
TT 0.77
rs665251622(A>C) AA 0.29 0.56(A) 0.51 0.49 1.97 0.06 0.37
CA 0.55 0.44(C)
CC 0.16
rs671132057(T>C) CC 0.29 0.54(C) 0.5 0.5 1.99 0.88 0.37
CT 0.5 0.46(T)
TT 0.21
rs652062749(G>A) AA 0.07 0.27(A) 0.61 0.39 1.65 0.39 0.32
AG 0.4 0.73(G)
GG 0.53
rs640683953(A>C) CC 0.99 0.99(C) 0.99 0.01 1.01 1 0.01
CA 0.01 0.01(A)
rs654358008(G>C) CC 0.98 0.99(C) 0.98 0.02 1.02 1 0.02
GC 0.02 0.01(G)
1, 2, 3, 4 and 5 represent homozygosity, heterozygosity, effective number of alleles, the p-value of Hardy-Weinberg equilibrium, and polymorphism information content, respectively; p > 0.05 indicates the locus was under Hardy–Weinberg equilibrium.
Table 3. Association analysis of three SNPs with various growth traits for different amounts of months in the Nanjiang Yellow goat population.
Locus rs656779265(G>A) rs638185407(T>A) rs665251622(A>C)
Genotype AA GA GG AA AT TT AA CA CC
Number 51 97 50 3 48 145 56 101 39
BW-0(kg) 2.26±0.271 2.26±0.30 2.21±0.32 1.98±0.68A 2.30±0.33B 2.24±0.28B 2.26±0.30 2.24±0.30 2.26±0.30
BW-2(kg) 11.11±0.96B 11.51±0.94Aa 11.15±0.84b 11.00±0.00 11.49±1.03 11.27±0.91 11.21±1.00 11.40±0.90 11.28±0.94
BL-2(cm) 46.94±1.43b 47.52±1.68a 47.14±1.68 47.00±1.73 47.50±1.65 47.21±1.64 47.14±1.73 47.37±1.60 47.26±1.60
BH-2(cm) 45.08±1.13b 45.58±1.42a 45.32±1.35 44.67±1.53b 45.65±1.34a 45.31±1.34 45.36±1.52 45.43±1.25 45.36±1.35
CC-2(cm) 50.94±1.38 51.34±1.53 51.32±1.59 49.33±1.15B 51.61±1.71A 51.15±1.41A 51.16±1.45 51.18±1.49 51.50±1.64
BW-6(kg) 25.75±4.12 26.30±4.21 25.50±4.68 26.67±4.93 26.76±4.58 25.71±4.20 26.01±4.40b 26.25±4.16a 25.35±4.57
BL-6(cm) 59.02±5.45b 59.44±5.20a 58.66±5.68 58.67±8.14 60.15±5.88 58.58±5.16 59.13±5.40b 59.48±5.34a 58.46±5.53
BH-6(cm) 56.02±4.78 56.32±4.64 55.94±4.75 56.00±6.24 56.85±5.16 55.96±4.52 56.21±4.84 56.38±4.71 55.59±4.53
CC-6(cm) 65.08±4.45 68.38±4.40 65.12±4.68 66.33±6.51 66.36±4.77 64.88±4.30 65.25±4.53 65.46±4.49 64.87±4.39
BW-12(kg) 34.07±4.86 34.54±4.85 33.72±5.26 34.33±5.69 35.08±5.35 33.96±4.81 34.36±5.20 34.48±4.73 33.62±5.15
BL-12(cm) 65.90±5.20 66.27±5.07 66.08±5.38 66.67±5.03 66.96±5.76 56.89±4.97 66.32±5.30 66.16±5.13 66.00±5.18
BH-12(cm) 62.78±4.38 63.27±4.33 63.22±4.79 63.33±4.04 63.71±4.96 62.97±4.29 63.25±4.54 63.28±4.41 62.82±4.47
CC-12(cm) 74.76±5.17 75.60±5.07 75.05±53.8 75.33±7.57 76.14±5.72 75.01±4.91 75.23±5.17 75.64±5.16 74.63±5.06
BW-18(kg) 47.21±7.07b 48.59±7.09a 47.48±7.63b 47.17±9.00 48.96±7.55 47.70±7.12 47.92±7.80 48.47±6.98a 46.99±7.06b
BL-18(cm) 73.08±5.63B 73.79±5.28Aa 72.53±4.92b 72.67±5.03b 74.50±5.79a 72.97±5.10 72.98±5.22 73.70±5.37 72.79±5.29
BH-18(cm) 68.75±3.69 69.60±4.26 69.14±4.59 69.00±6.08 70.10±4.63 69.03±4.02 69.18±4.05 69.45±4.18 69.13±4.56
CC-18(cm) 85.03±4.88B 86.30±4.63A 85.11±5.40B 83.33±7.57B 87.01±5.10A 85.32±4.74 85.43±5.06b 86.17±4.69a 84.97±5.22
BW-NUMBER = body weight for different months; BL-NUMBER = body length for different months; BH-NUMBER = body height for different months; CC-NUMBER = chest circumference for different months. 1 explains values are shown as means ± standard deviation. a,b Values within a row with different superscripts differ significantly at P < 0.05, and A,B Values within a row with different superscripts differ significantly at P < 0.01.
Table 4. Association analysis of four SNPs with various growth traits for different amounts of months in the Nanjiang Yellow goat population.
Locus rs640683953 (A>C) rs654358008 (G>C) rs671132057 (T>C) rs652062749 (G>A)
Genotype CA CC GC CC CT CC TT AG GG AA
Number 2 193 3 195 94 56 45 77 99 15
BW-0(kg) 2.57±0.061 2.24±0.30 2.44±0.15a 2.25±0.30b 2.27±0.30 2.22±0.31 2.24±0.29 2.23±0.28 2.27±0.32 2.26±0.23
BW-2(kg) 11.50±0.71 11.29±0.92 12.33±1.15a 11.30±0.92b 11.46±0.96a 11.26±0.88 11.03±0.90b 11.34±0.86 11.31±1.01 11.20±0.98
BL-2(cm) 47.50±0.71 47.26±1.64 48.67±2.52a 47.25±1.61b 47.50±1.75a 47.30±1.64a 46.78±1.29b 47.30±1.48 47.28±1.73 47.00±1.89
BH-2(cm) 45.00±1.41 45.38±1.35 47.00±1.00A 45.36±1.33B 45.50±1.45a 45.43±1.26a 45.02±1.16b 45.34±1.21 45.40±1.46 45.40±1.35
CC-2(cm) 53.00±1.41 51.19±1.51 53.00±1.00a 51.20±1.50b 51.21±1.55a 51.46±1.55 50.91±1.36b 51.26±1.40 51.18±1.57 51.53±1.51
BW-6(kg) 27.75±6.72 25.91±4.27 31.17±3.62A 25.88±4.27B 26.30±4.33 25.70±4.45 25.50±4.02 25.62±3.92 26.38±4.51a 24.90±4.50b
BL-6(cm) 62.00±9.90 59.05±5.28 64.67±6.81A 59.05±5.32B 59.51±5.34 58.71±5.48 58.80±5.37 58.74±5.04b 59.62±5.68Aa 57.80±5.35B
BH-6(cm) 59.00±8.49 56.08±4.60 61.67±4.93A 56.06±4.64B 56.46±4.74 55.95±4.64 55.71±4.66 55.77±4.20b 56.59±5.07a 55.27±4.59b
CC-6(cm) 66.50±4.95 65.18±4.45 70.67±5.13A 65.15±4.42B 65.49±4.59 65.13±4.45 64.82±4.28 64.86±4.30b 65.65±4.66Aa 63.93±3.77B
BW-12(kg) 38.00±8.49 34.11±4.85 38.67±4.93A 34.14±4.93B 34.56±5.05 33.95±4.97 33.77±4.71 33.92±4.34 34.57±5.27a 32.90±5.11b
BL-12(cm) 71.00±9.90 66.03±5.07 72.00±8.00A 66.04±5.08B 66.30±5.33 66.09±5.01 65.76±4.95 65.71±4.67b 66.62±5.47Aa 64.87±5.28B
BH-12(cm) 66.50±7.78 63.06±4.40 67.00±5.00A 63.07±4.42B 63.31±4.54 63.13±4.40 62.71±4.23 62.83±3.91 63.51±4.78A 62.00±4.71B
CC-12(cm) 81.00±8.49 75.13±5.09 80.33±6.43A 75.17±5.12B 75.58±5.23 75.35±5.22 74.58±5.01 75.00±4.62 75.58±5.50a 73.77±5.28b
BW-18(kg) 51.50±9.19 47.89±7.22 54.00±9.64A 47.86±7.16B 48.55±7.30a 47.48±7.01 46.86±6.84b 47.56±6.64 48.54±7.76A 46.10±6.54B
BL-18(cm) 76.50±6.36 73.22±5.29 79.00±7.81A 73.20±5.22B 73.82±5.46A 73.20±5.38 72.27±4.64B 72.99±4.96 73.69±5.47A 71.80±4.99B
BH-18(cm) 72.00±4.24 69.21±4.19 71.33±7.32a 69.23±4.16b 69.63±4.36 69.16±4.43 68.53±3.40 69.01±3.79 69.51±4.35 68.67±4.88
CC-18(cm) 88.50±6.36 85.63±4.92 89.00±5.57A 85.62±4.90B 86.30±4.82Aa 85.24±4.88b 84.74±4.79B 85.51±4.59 85.94±5.13a 84.20±4.55b
BW-NUMBER = body weight for different months; BL-NUMBER = body length for different months; BH-NUMBER = body height for different months; CC-NUMBER = chest circumference for different months. 1 Footnote explaining values are shown as means ± standard deviation. a,b Values within a row with different superscripts differ significantly at P < 0.05, and A,B Values within a row with different superscripts differ significantly at P < 0.01.
Table 5. Association analysis of seven SNPs with various growth traits in the Nanjiang Yellow goat population at four months of age.
Locus Genotype Number BW-4(kg) BL-4(cm) BH-4(cm) CC-4(cm)
rs656779265(G>A) AA 73 14.33±2.111 51.63±2.53 50.36±2.85 54.51±3.02
AG 24 13.98±2.06 51.48±2.83 50.04±2.88 54.20±2.99b
GG 32 14.88±2.38 52.59±2.74 50.96±2.53 55.73±2.86a
rs638185407(T>A) AA 1 18.80±0.00 54.50±0.00 53.50±0.00 60.00±0.00
AT 21 13.43±2.01a 50.57±2.77a 48.92±2.86A 53.80±3.09
TT 105 14.41±2.15b 51.98±2.74b 50.59±2.73B 54.71±2.96
rs665251622(A>C) AA 76 14.42±2.42 51.62±2.7b 50.81±2.97 54.75±3.49
CA 14 13.99±1.93b 51.57±2.82b 49.86±2.73b 54.31±2.67b
CC 38 15.44±2.39a 53.21±2.47a 51.64±2.20a 55.84±3.19a
rs640683953(A>C) CA 1 16.20±0.00 54.50±0.00 55.00±0.00 59.80±0.00
CC 125 14.29±2.17 51.82±2.78 50.34±2.77 54.65±2.99
rs654358008(G>C) CC 4 14.25±2.17 51.78±2.81 50.32±2.82 54.58±2.97
GC 125 14.85±2.12 51.80±1.29 50.45±1.97 56.35±4.24
rs671132057(T>C) CC 68 14.63±2.38 52.52±2.92 50.68±2.50 55.59±2.82a
CT 37 14.09±2.10 51.5±2.79 50.05±2.90 54.19±3.04b
TT 21 14.30±2.15 51.46±2.49 50.65±3.08 54.40±3.15
rs652062749(G>A) AA 49 15.10±2.26 54.26±1.78Aa 51.00±1.93 54.46±2.89
AG 67 14.41±1.94 52.02±2.68b 50.53±2.76 54.88±2.78
GG 7 13.96±2.26 51.18±2.78Bb 49.99±2.92 54.38±3.16
BW-4 = body weight at four months of age; BL-4 = body length at four months of age; BH-4 = body height at four months of age; CC-4 = chest circumference at four months of age. 1 explaining values are shown as means ± standard deviation a,b Values within a row with different superscripts differ significantly at P < 0.05, and A,B Values within a row with different superscripts differ significantly at P < 0.01.3.6. Association analysis of combination genotypes with growth traits
Table 6. Association analysis of combination genotypes and birth weight of Nanjiang Yellow goat.
Combination Genotypes Birth Weight(kg)
AACCCC(4) 1.98±0.68ADa
ATCACC(10) 2.08±0.58ACD
ATCACT(44) 2.35±0.28BCD
TTAACC(4) 2.20±0.14b
TTAACT(21) 2.32±0.35b
TTAATT(66) 2.24±0.29ABCb
TTCACC(27) 2.23±0.20b
TTCACT(93) 2.22±0.29b
TTCCCC(33) 2.24±0.26ABCb
Different lowercase letters in the same column indicate significant differences (P<0.05), different capital letters indicate extremely significant difference (P<0.01), no letter indicates no significant difference (P>0.05).
Table 11. Association analysis of combination genotypes and growth traits of Nanjiang Yellow goat at 1.5 years of age.
Combination Genotypes 1.5 Years of Age
Body Weight(kg) Body Length(cm) Body Height(cm) Chest Circumference(cm)
ATCACC(5) 49.80±9.42ACDacd 75.00±7.31ACDEFacd 70.00±6.16abcde 86.20±6.61abc
ATCACT(31) 49.31±7.63ABCacd 74.58±5.67ABCEFacd 70.23±4.63abcef 87.58±4.80Aacd
TTAACT(8) 53.00±10.76ABCacd 76.50±7.11ABCDEacd 72.50±5.61Aacdef 88.50±5.71Aacd
TTAATT(45) 46.86±6.84BCDbcd 72.27±4.64BDEFbcd 68.53±3.40bcdef 84.74±4.79Bbcd
TTCACC(10) 49.15±7.2ABCabc 74.40±5.62ABCDEabc 69.40±3.84bcdef 86.20±3.74bcd
TTCACT(53) 47.58±6.41BCDbcd 73.08±5.06BCDEFbcd 68.98±3.87bcdef 85.25±4.57Bbcd
TTCCCC(23) 45.80±6.08BDbd 71.74±4.71BDFbd 68.43±4.40Bbdf 84.24±4.47Bbd
Different lowercase letters in the same column indicate significant differences (P<0.05), different capital letters indicate extremely significant difference (P<0.01), no letter indicates no significant difference (P>0.05).
Disclaimer/Publisher’s Note: The statements, opinions and data contained in all publications are solely those of the individual author(s) and contributor(s) and not of MDPI and/or the editor(s). MDPI and/or the editor(s) disclaim responsibility for any injury to people or property resulting from any ideas, methods, instructions or products referred to in the content.
Copyright: This open access article is published under a Creative Commons CC BY 4.0 license, which permit the free download, distribution, and reuse, provided that the author and preprint are cited in any reuse.
Prerpints.org logo

Preprints.org is a free preprint server supported by MDPI in Basel, Switzerland.

Subscribe

© 2024 MDPI (Basel, Switzerland) unless otherwise stated