Preprint
Article

Physical and chemical characterization of Ugandan honey and its comparison to Manuka honey

Altmetrics

Downloads

117

Views

65

Comments

0

Submitted:

13 June 2024

Posted:

14 June 2024

You are already at the latest version

Alerts
Abstract
Honey is a very cost-efficient food source and a valuable export for the country of Uganda, but is commonly adulterated, resulting in consumers not being aware of the contents of their honey. As a result, it is important to be able to authenticate the honey that consumers are purchasing. This study evaluated the physicochemical properties (pH, free acidity, metal determination, moisture content, and FTIR spectra) of Ugandan and Manuka honey. Honey pH values ranged from 3.3 to 4.8 (±0.6) while free acidity values ranged from 34.87 to 62.22 (±8.69). The moisture content values of all honey samples were below 22%. The metal concentrations and functional groups present in Ugandan and Manuka honey were determined. Metal analysis by atomic absorption spectrometry detected five elements (Na, Ca, K, Cu, and Pb) in all honey samples in varying concentrations. The elemental concentrations were found in descending order as follows: sodium (Na) (9.38 ppm), calcium (Ca) (4.99 ppm), potassium (K) (2.48 ppm), copper (Cu) (1.87 ppm), lead (Pb) (0.28 ppm). FTIR analysis revealed similar patterns of spectral curve (O-H stretching and C-H stretching) across all honey samples analyzed, which is consistent with previously analyzed honey samples from other studies. Ugandan honey sample 7 collected in the Masaka Region was found to be most similar to the Manuka honey standard based on its observed physiochemical properties. All properties analyzed suggested Ugandan honey is of good quality and safe for consumption.
Keywords: 
Subject: Chemistry and Materials Science  -   Analytical Chemistry

1. Introduction

Honey is a naturally sweet, golden, viscous, liquid produced by bees that has been widely accepted as a food product and medicinal agent for centuries. Honey as food is used as a natural sweetener and is found in numerous manufactured goods such as cereal and cookies [1]. It can also be used as a sweetener to beverages, marinade ingredient, and moisture absorbing ingredient in baked goods such as cakes. Honey in food is an excellent source of energy as it has simple sugars, organic acids, and macro and micro nutrients [2]. Aside from honey’s use as a prevalent nutrient, it also serves as a healing agent for many skin pathogens. Many ancient cultures have used honey for nutritional and medicinal purposes in treating various ailments [3]. Evidence of honey’s use in medicine dates back at least six thousand years ago. Early records discussed honey being used to treat sore eyes, wounds, coughs, ulcers, sunburn, and inflammation [4]. Still today, honey has high medicinal value as it has been found effective in treating many human pathologies, cutaneous wounds, and tissue damage due to its antimicrobial and antibacterial properties [5].
Globally, honey is very valuable as both a food and medicinal product. In 2022, the global honey market was valued at over 9 billion USD and is expected to grow annually [6]. It is a product that provides many health benefits, as it is rich in antioxidants, such as phenolic acids and flavonoids, and it better regulates blood sugar when consumed compared to regular sugar [7]. As a result, honey is wildly used in many different varieties of foods, in many different cultures worldwide. The honey industry is particularly important in underdeveloped countries. For example, Uganda, one of the least developed countries in the world, features a very promising beekeeping industry, as its product of honey is a very secure food source, and is also a cost efficient field, requiring low cost investments [8]. In Uganda, roughly 4,000 metric tons of honey are produced annually, and beekeeping produces about 1.2 million jobs in the country [9]. This industry is valuable in the country as both a source of food and an economic boost, as honey is in demand worldwide and easy to sell.
Honey is complex in that there are hundreds of varieties of the product that vary in color, flavor, smell, texture, and composition. The variability in composition comes from the botanical origin, plant species, geographical origin, climatic conditions, and any processing during the honey harvest and storage processes [10]. Despite this variability, some main constituents are seen across all honeys; namely, water, fructose, glucose, sucrose, proteins, free amino acids, minerals, enzymes, and vitamins [10]. The three main sugars, fructose, glucose, and sucrose are found in all honeys at an average concentration of 38.38%, 30.31%, and 1.31%, respectively. Sugars, such as fructose and glucose, are the main contributors to the nutritional value of honey [4,11]. In addition to these constituents, minor concentrations of metals are found in honey such as Ca, Mg, K, Na, Fe, Cu, Cr, and Pb. Sugars, such as fructose and glucose, are the main contributors to the nutritional value of honey [11]. The compounds, alcohols, aldehydes, ketones, esters, and acids, contribute to honey’s flavor, scent, and the variation within that [11].
Honey is produced and stored by honeybees in the honeycomb where it ripens and matures [12]. Honeybees collect nectar and transform it by combining it with their own substances, such as enzyme invertase that hydrolyzes disaccharide sucroses [4]. The honeybee then returns to the hive and passes the nectar to another bee through regurgitation [12]. The receiving working bee breaks down the honey into simpler compounds such as monosaccharides of glucose and fructose until the nectar is deposited and stored in the honeycomb for ripening and maturing. This honey can be stored in beeswax combs for months or even years and used as a source of food [3]. Over time, the flower nectar will combine with enzymes and beeswax, giving honey its flavor.
Once honey is extracted from the beehive, its uses extend far beyond that as a nutrient. For example, one of its most prominent and important uses is as a medicinal treatment [3]. More specifically, honey is clinically used to treat wounds, skin infections, burns, ulcers, and other medical conditions. It is safe for external and mucous layer cavity application [12]. When applied to burns and wounds, honey promotes faster healing as it can clear infection, provide sterility, promote tissue growth, tissue regeneration, and prevent dehydration [12]. However, not all honey is the same and therefore not all honey has these medicinal benefits. The attractive antibacterial property of honey is dependent on its type, its physical and chemical properties, as well as its harvesting process [13].
Manuka honey, a monofloral honey produced from Leptospermum scoparium, has received great attention in the pharmaceutical industry due to the antimicrobial and antioxidant activity it exhibits [14]. Manuka honey originated in New Zealand and is derived from Leptospermum scoparium, the Manuka tree [15]. Manuka’s antimicrobial activity is largely a result of the methylglyoxal (MGO) content, a compound found in high concentrations in Manuka honey compared to other honey types [16]. MGO is a 1,2 dicarbonyl compound formed from the dehydration of dihydroxyacetone, a natural chemical compound produced by the Leptosperum flower nectar [17]. MGO was found to be effective in promoting bacterial cell lysis and disrupting cell division, therefore, explaining its use as a topical agent for bacterial wounds [17]. While MGO is the largest contributor to Manuka honey’s antibacterial activity, it is not the only. Manuka honey’s antibacterial activity is also a result of phenolics compounds, flavonoids, and defensins present in lower concentrations [17]. Mavric et al. demonstrates MGO’s predominant role in antibacterial activity against Escherichia coli (E. coli) and Staphylococcus aureus (S. aureus) due to their minimum inhibitory concentration when plated on an agar diffusion assay [18]. Previous studies found Manuka honey to be more effective in antibacterial activity than commonly used antimicrobial agents as indicated by their inhibition zones. Abd-El Aal et al. found greater zones of inhibition, indicating antibacterial resistance, against organisms such as Pseudomonas aeruginosa from Manuka honey compared to antibiotics including ciprofloxacin, ceftriaxone, and vancomycin [19]. Additionally, the Leptospermum scoparium honey has exhibited an inhibitory effect on more than 50 species of bacteria, including aerobes and anaerobes, gram-positives and gram-negatives (Molan, 2015). Another study recorded methanol, ethanol, and ethyl acetate extracts of honey exhibiting antibacterial activity against bacteria including Staphylococcus aureus, Escherichia coli, and Micrococcus luteus as shown by the minimum inhibitory concentrations [12]. Manuka honey is not only studied for its use in wound healing as research showed that extracts of the Manuka tree can be used as a sedative as well [14]. While Manuka honey has been extensively studied as shown in recent publications, many other honeys have not been as well studied including honey samples extracted and collected in Uganda, Africa.
A previous study on Ugandan honey by Oromokoma et al. assessed M. bocandei honey from the Western Highlands and Lake Victoria Crescent areas. This study assessed moisture content, viscosity, water activity, electrical conductivity, and average pH of M. bocandei honey [10]. Results revealed average moisture content to be 26.45%, average viscosity to be 38.32 Pa.s, water activity to be 0.71%, and average pH to be 4.15.
A similar study was conducted by Fan and Roos involving Irish honey samples [20]. Here, physiochemical properties and relaxation time of the honey were analyzed, providing valuable information about the honey, as well as control structural transformation of the honey analyzed. However, different properties were analyzed than those in this study, such as water sorption, glass transition, and structure collapse, which do not provide any information on the quality of the honey for human consumption. As such, this is the first study to test the physiochemical properties of honey samples spanning an entire country.
The present study is aimed at determining the physical and chemical properties of various honeys produced in Uganda and comparing it to Manuka honey produced in New Zealand. In this study, various honey samples from different regions of Uganda were analyzed to determine the safety of honey throughout the countries. The parameters analyzed were pH, free acidity, metal determination, moisture content, and FTIR spectra. This is the first study to utilize this set of analytical techniques in order to determine the quality of honey.

2. Materials and Methods

2.1. Sample Collection

Seven honey samples were collected from beekeepers in southwestern Uganda, Africa during July 2022. One sample was collected from the Masaka District, three samples were collected from the Kanungu District, and three samples were collected from the Buhoma region of Uganda (Figure 1) [21]. One Manuka honey sample was purchased from New Zealand, Oceania to act as a standard for analysis. All samples were collected and stored in plastic bottles at room temperature in the laboratory until experimentation.
To compare the physio-chemical properties of Ugandan honey and Manuka honey, samples were analyzed for pH, free acidity, moisture, metals content, and functional groups present using Fourier transform infrared (FTIR) spectrometry. All analyses were performed in triplicates per honey sample.

2.2. pH Determination

The pH values of the honey samples were determined using a pH meter (Mettler Toledo S20 Seven Easy). The honey solution was prepared for pH analysis by dissolving 10 g of honey sample in 75 ml of distilled water according to the methods of the Association of Official Analytical Chemists [22].

2.3. Free Acidity Determination

The free acidity of the honey samples was determined by titration using the sample previously prepared for pH analysis (10 g diluted with 75 ml of distilled water). Briefly, sample was titrated with 0.1 M NaOH until the pH value reached 8.3. Titration volume was multiplied by 10 so free acidity was represented in units of millimoles acid per kg honey [23].

2.4. Metals Content Determination

To prepare the standards and reagents, honey samples were initially placed in a water bath at 60 ℃ to ensure homogeneity. Approximately 1 g of the honey samples were transferred to a volumetric flask which was then diluted to 100 g with 1% nitric acid. 1000 ppm metal standard stock solutions of copper, potassium, sodium, calcium, and lead were used to prepare 1.0, 2.0, and 10 ppm standards by pipetting 0.1, 0.2 and 1.0 ml of stock solutions into 100 ml volumetric flasks and filling it to the mark with 1% nitric acid [24]. The 10 ppm standard solution was used to prepare 0.3 and 0.5 ppm standards by pipetting 3.0 and 5.0 ml of the standard into the 100 ml volumetric flasks and filling the flask with deionized water to the 100 ml mark [24]. Additionally, a 1% nitric acid blank was prepared [24]. The metal analysis was done by flame atomic absorption spectroscopy. The metal standards ranging from 0 to 2.0 ppm were used to prepare calibration curves for the determination of metal concentration [25].

2.5. Fourier Transform Infrared Spectroscopy Analysis

Spectra for all honey samples were collected using an IR Affinity-1S FTIR spectrometer (Shimadzu, USA) equipped with an iD3 Attenuated Total Reflectance accessory component (Sahlan et al., 2019). OMNIC software version 9 (Thermo Fisher Scientific Inc) was used for spectral data acquisition. Samples were placed on a diamond crystal plate (Thermo Fisher Scientific Inc) and scanned at room temperature from 3400 to 4700 cm−1 for a 45 scans with a resolution of 4 cm−1 [26]. Measurements for each sample were performed in triplicate to ensure accuracy of the absorbance value. Ethanol was used to clean the diamond crystal plate between each sample measurement.

2.6. Moisture Content Determination

The moisture content of the honey samples was determined using a refractometer (Abbe-2WAJ) reading at 20 ℃. One gram of honey was placed on the prism and analyzed using refractive index which was used to calculate moisture content.

3. Results

The results of all measured physical and chemical parameters analyzed (pH, free acidity, moisture, and metal concentration) are given in Table 1.

3.1. pH

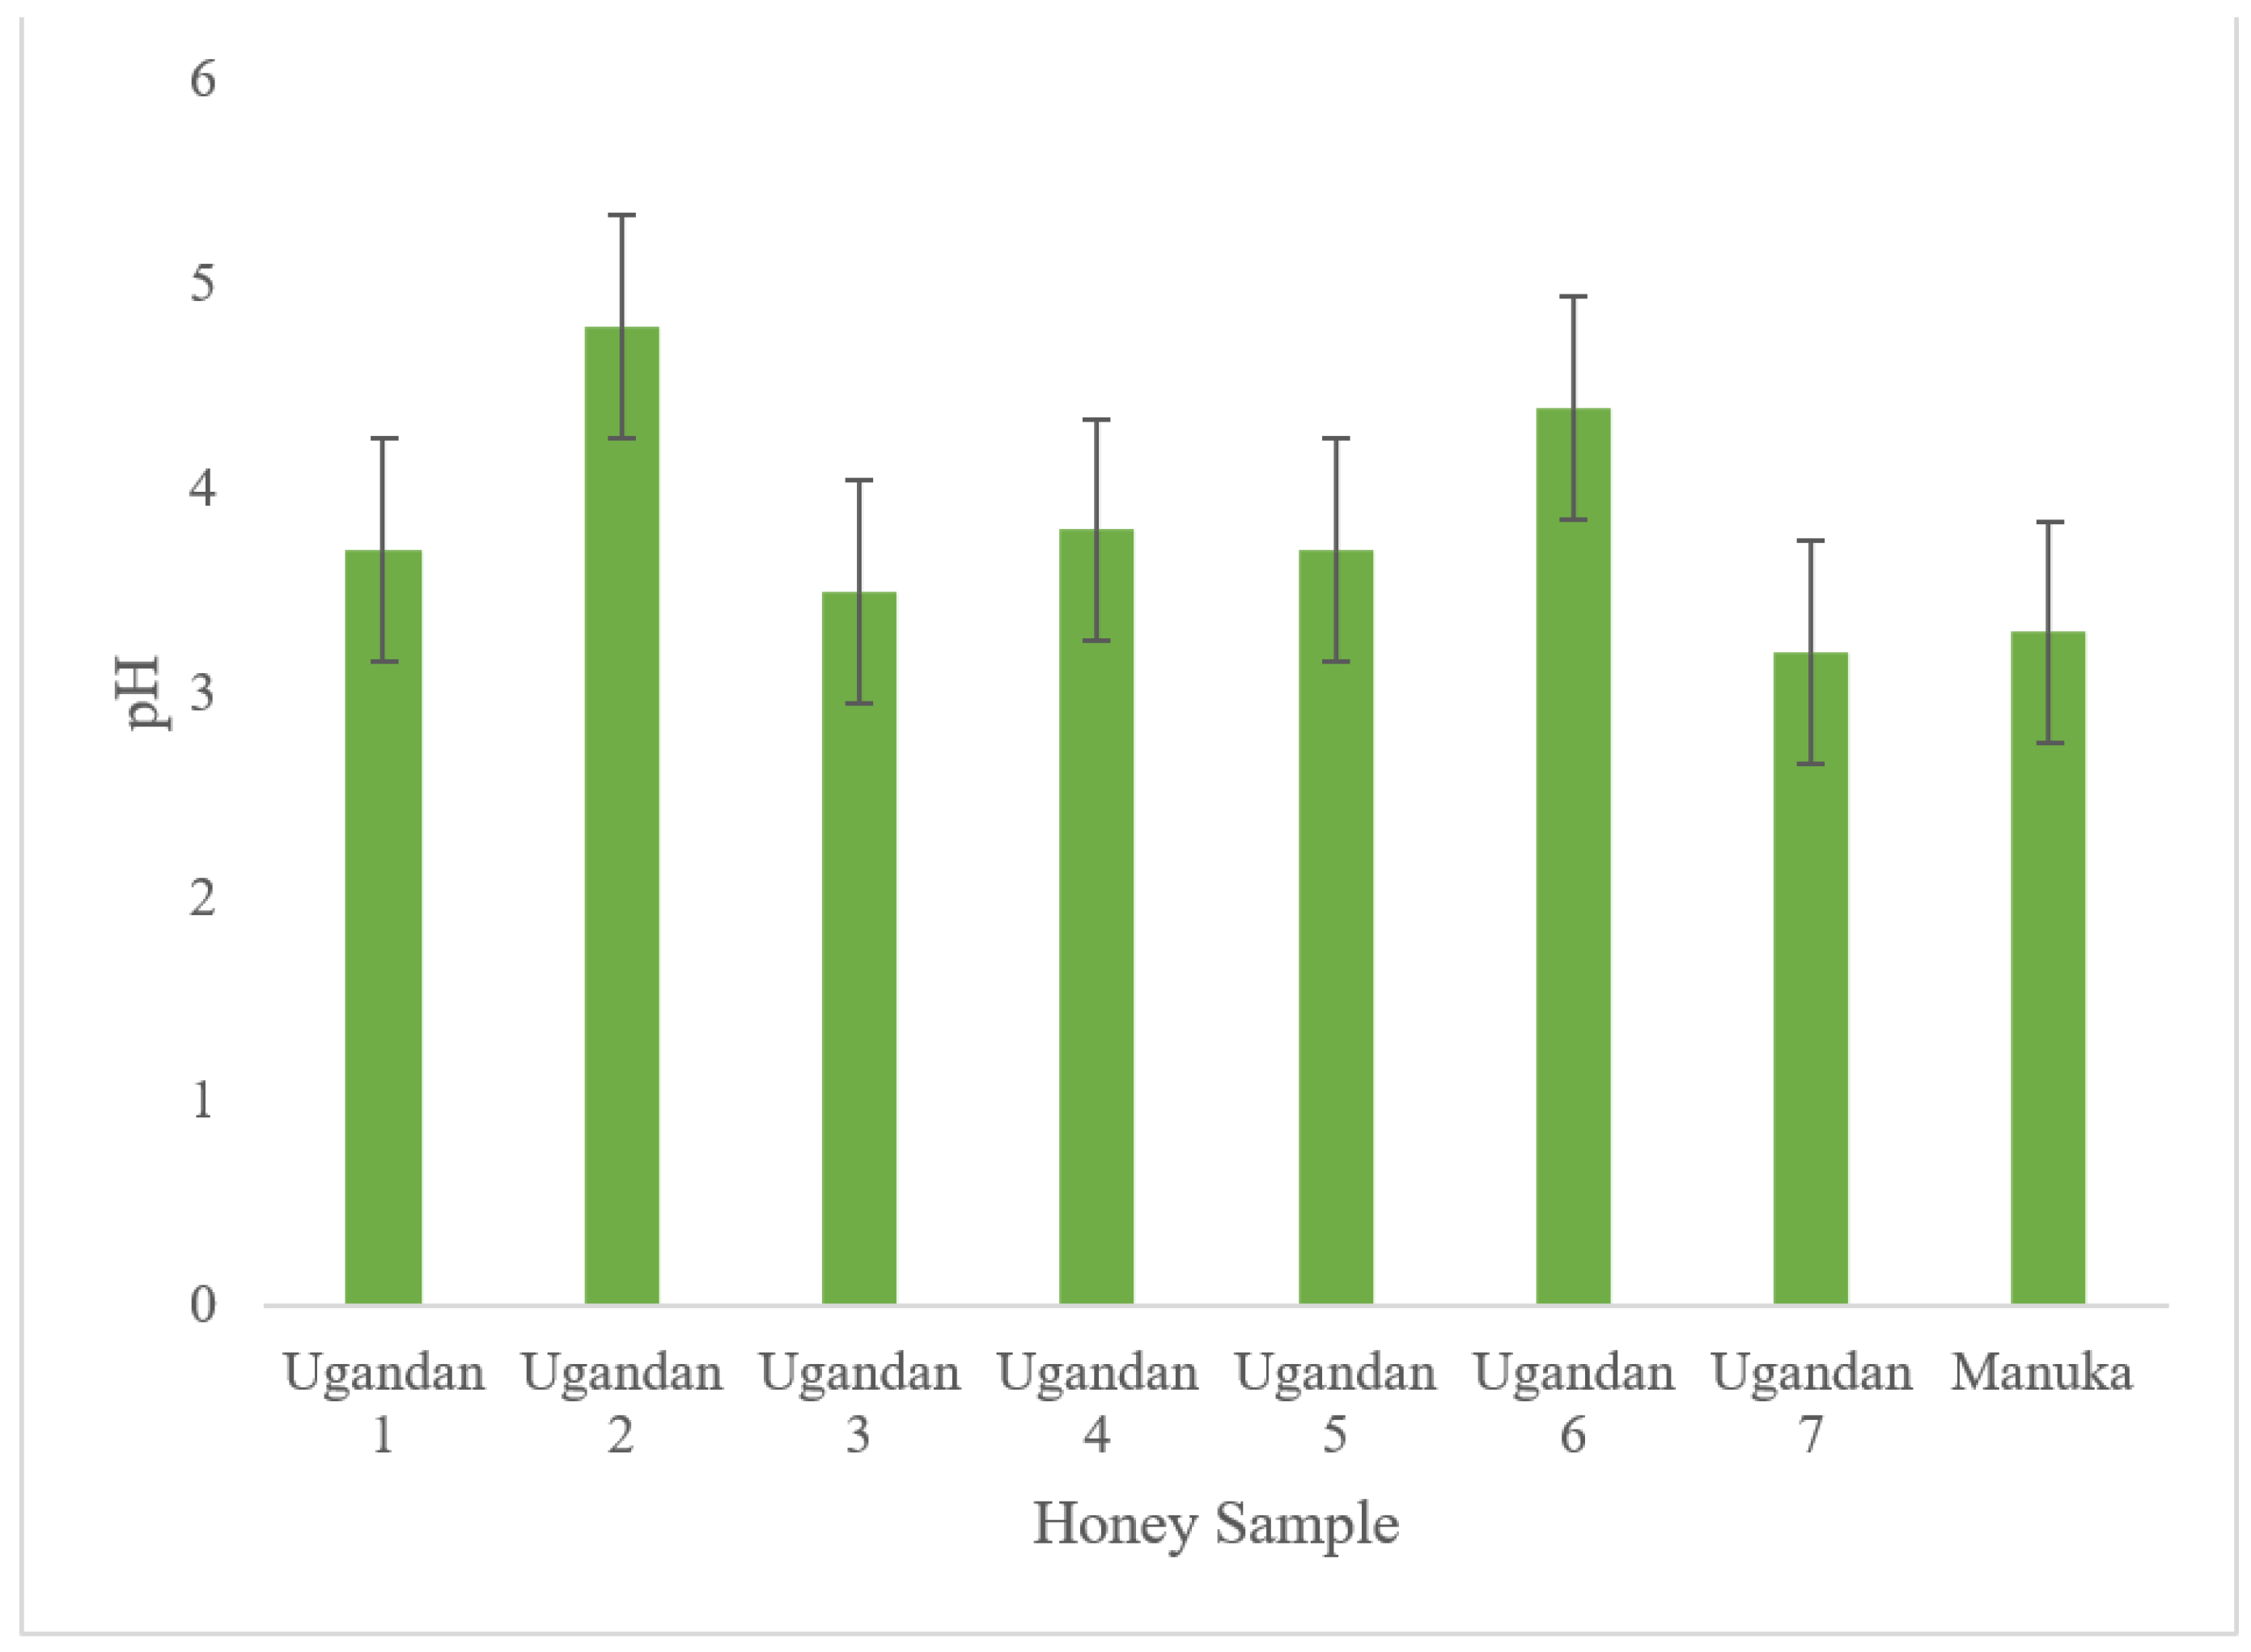
The pH of the honey samples ranged from 3.2 to 4.8 (±0.6) with the highest pH value from Ugandan sample 2. Ugandan honey 7 was found to be the most acidic with the lowest pH value of 3.2 (Figure 2).
The pH value and free acidity of honey are significant parameters to assess as these can be indicative of honey’s ability to inhibit the growth of microorganisms, contributing to its antimicrobial activity [27]. Furthermore, pH and free acidity of honey are large contributors of honey’s texture and stability [27]. The pH value of honey is variable dependent on the acids that constitute it namely, organic acids, inorganic ions, and minerals ionized [28]. The pH values may also be more basic or acidic based on botanical source of nectar, making geographic location an important factor. These contributing factors to pH explain the variability in pH values of this study ranging from 3.3 to 4.8 (Table 1). The pH of all eight honey samples analyzed including that of the Manuka honey were measured and exhibited acidic properties (pH 3.3-4.8) (Table 1). Among all honey samples analyzed, Ugandan honey sample 6 had the highest pH value of 4.4. Manuka honey, used as a standard in this study, had the lowest pH value of 3.3 and, thus, is the most acidic. The pH value of Ugandan honey sample 7 (3.2) collected in the Masaka District was the most similar to the Manuka standard pH value (3.3) (Table 1). All honey samples analyzed fell within the pH range recommended by the Codex Alimentarius Commission (3.4 to 6.1) with the exception of Ugandan honey sample 7 and the Manuka honey standard (3.2 and 3.3 respectively) which fell just below the lower limit of the recommended pH range. However, these samples do fall within the pH range considered of good quality by international regulatory honey standards (3.0 to 4.3) [29].
Despite the variation in pH values, honey is generally acidic with an average pH of 3.9, which lies in the range of standard pH limit is between a pH value of 3.40-6.10 [30]. This range ensures that honey samples in the range are fresh and safe for human consumption. The low pH value of honey is due to the presence of amino acids and organics found within honey. Gluconic acid is the main organic acid present in honey made by glucose oxidation, or the conversion of glucose into hydrogen peroxide and gluconic acid [31]. Found in lower concentrations, honey also commonly constitutes of acetic acid which is a byproduct of fermentation, formic acid, and citric acid [32]. Honey also consists essential and nonessential amino acids such as proline and glutamic acid [32]. Finally, low pH values in honey are an indicator of sugar fermentation of honey into organic acid. Organic acid is important in its role in honey flavor and resistance to microbial spoilage [33]. In some cases, the low pH values can indicate the honey samples have high content of minerals [33].
Honey’s antimicrobial activity is largely attributed to honey’s acidic environment and the glucose oxidation reaction [32]. Literature reviewed showed Manuka honey’s effectiveness in inhibiting the growth of Escherichia coli and Staphylococcus aureus [34]. The present study found almost identical pH values between the Ugandan honey sample 7 collected in Masaka and Manuka honey, suggesting there could be potential antimicrobial activity in both.

3.2. Free Acidity

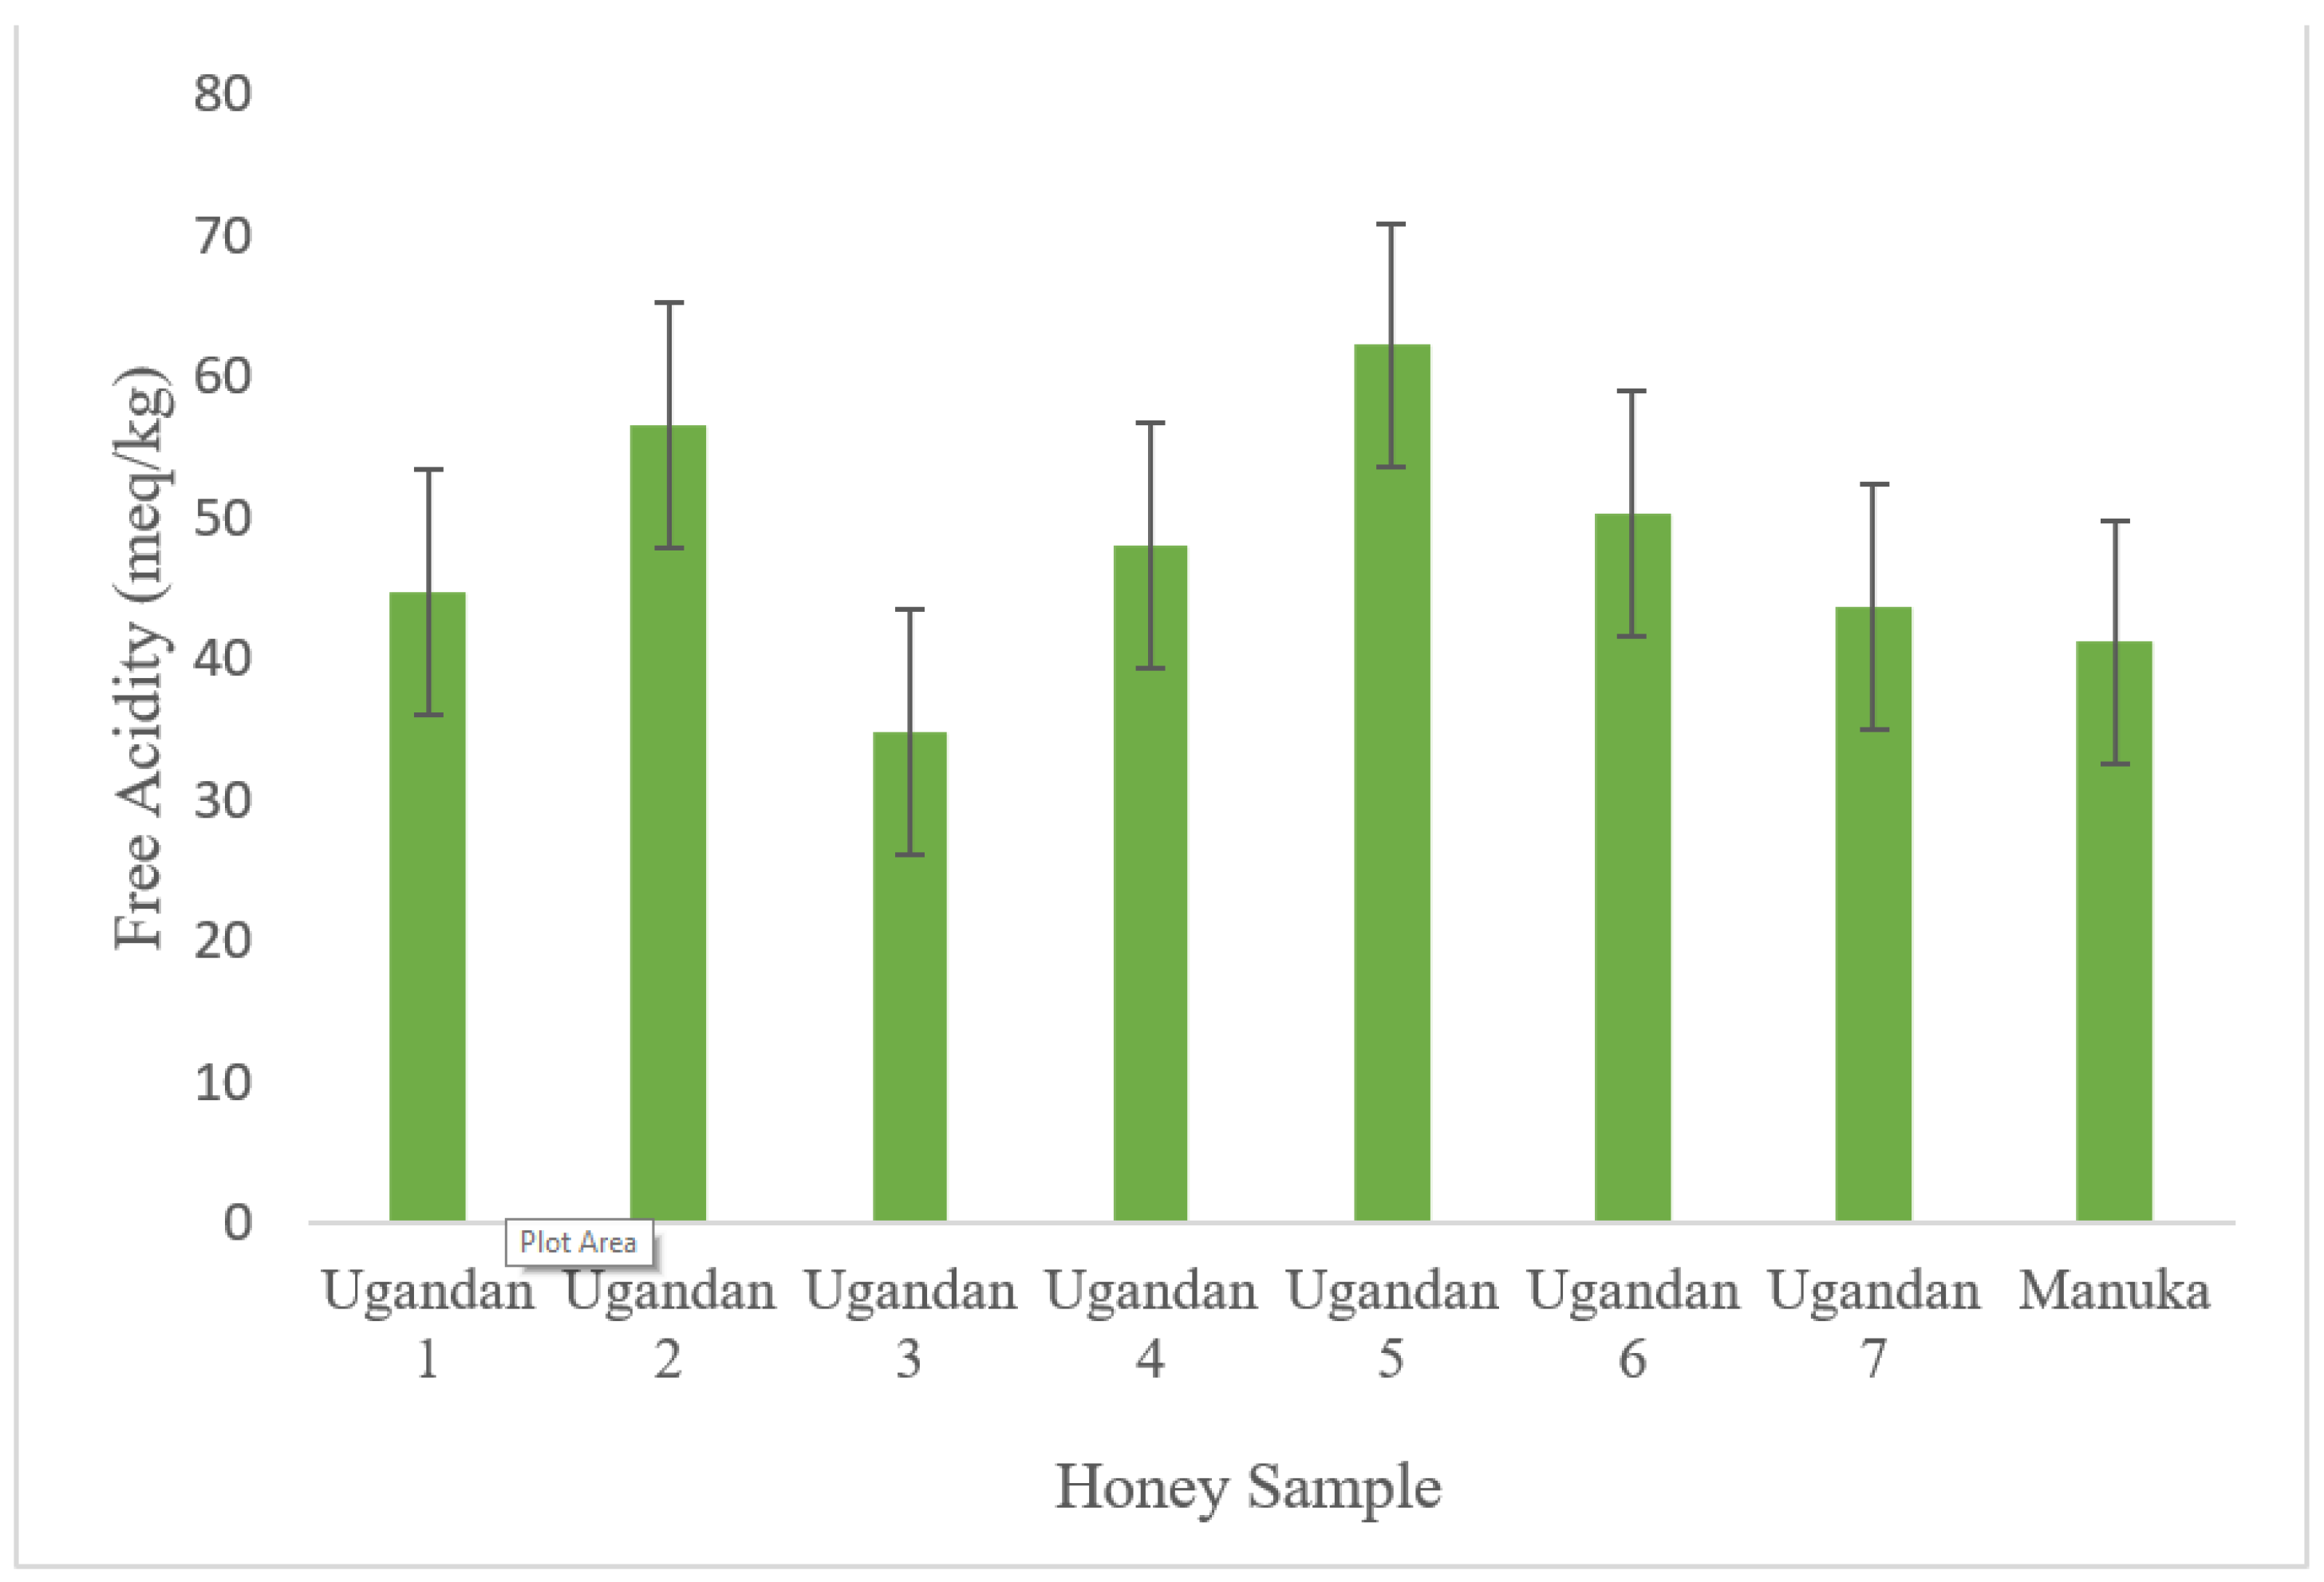
The free acidity of the honey samples ranged from 34.87 to 62.22 meq kg-1(±8.69). The highest free acidity was found in Ugandan honey sample 5 (62.22) while the lowest free acidity was attributed to Ugandan honey sample 3 (34.87) (Figure 3). The free acidity in the honey samples analyzed ranged from 34.87 to 62.22 meq kg-1. The highest free acidity value was reported by Ugandan honey sample 5 (62.22 meq kg-1) collected from the Buhoma region. The lowest free acidity value was reported by Ugandan honey sample 3 (34.87 meq kg-1) collected in the Kanungu District. The Manuka honey standard has a free acidity value of 41.16 meq kg-1 which was the most similar to Ugandan honey sample 7 (43.68 meq kg-1) collected in Masaka.
Free acidity is variable and influenced by the presence of esters, inorganic ions, organic acids botanical source, minerals present, and harvest time [28,35]. However, the Codex Alimentarius recommends a maximum free acidity value of 50 meq kg-1 with higher values typically indicating sugar fermentation into acids [35]. The results from this study revealed Ugandan honey sample 2 (56.52 meq kg-1) and Ugandan honey sample 5 (62.22 meq kg-1) exceeded Codex Alimentarius standards (>50 meq kg-1) [30]. Thus, these samples indicate sugar fermentation, resulting in a more acidic environment.

3.3. Determination of Metals

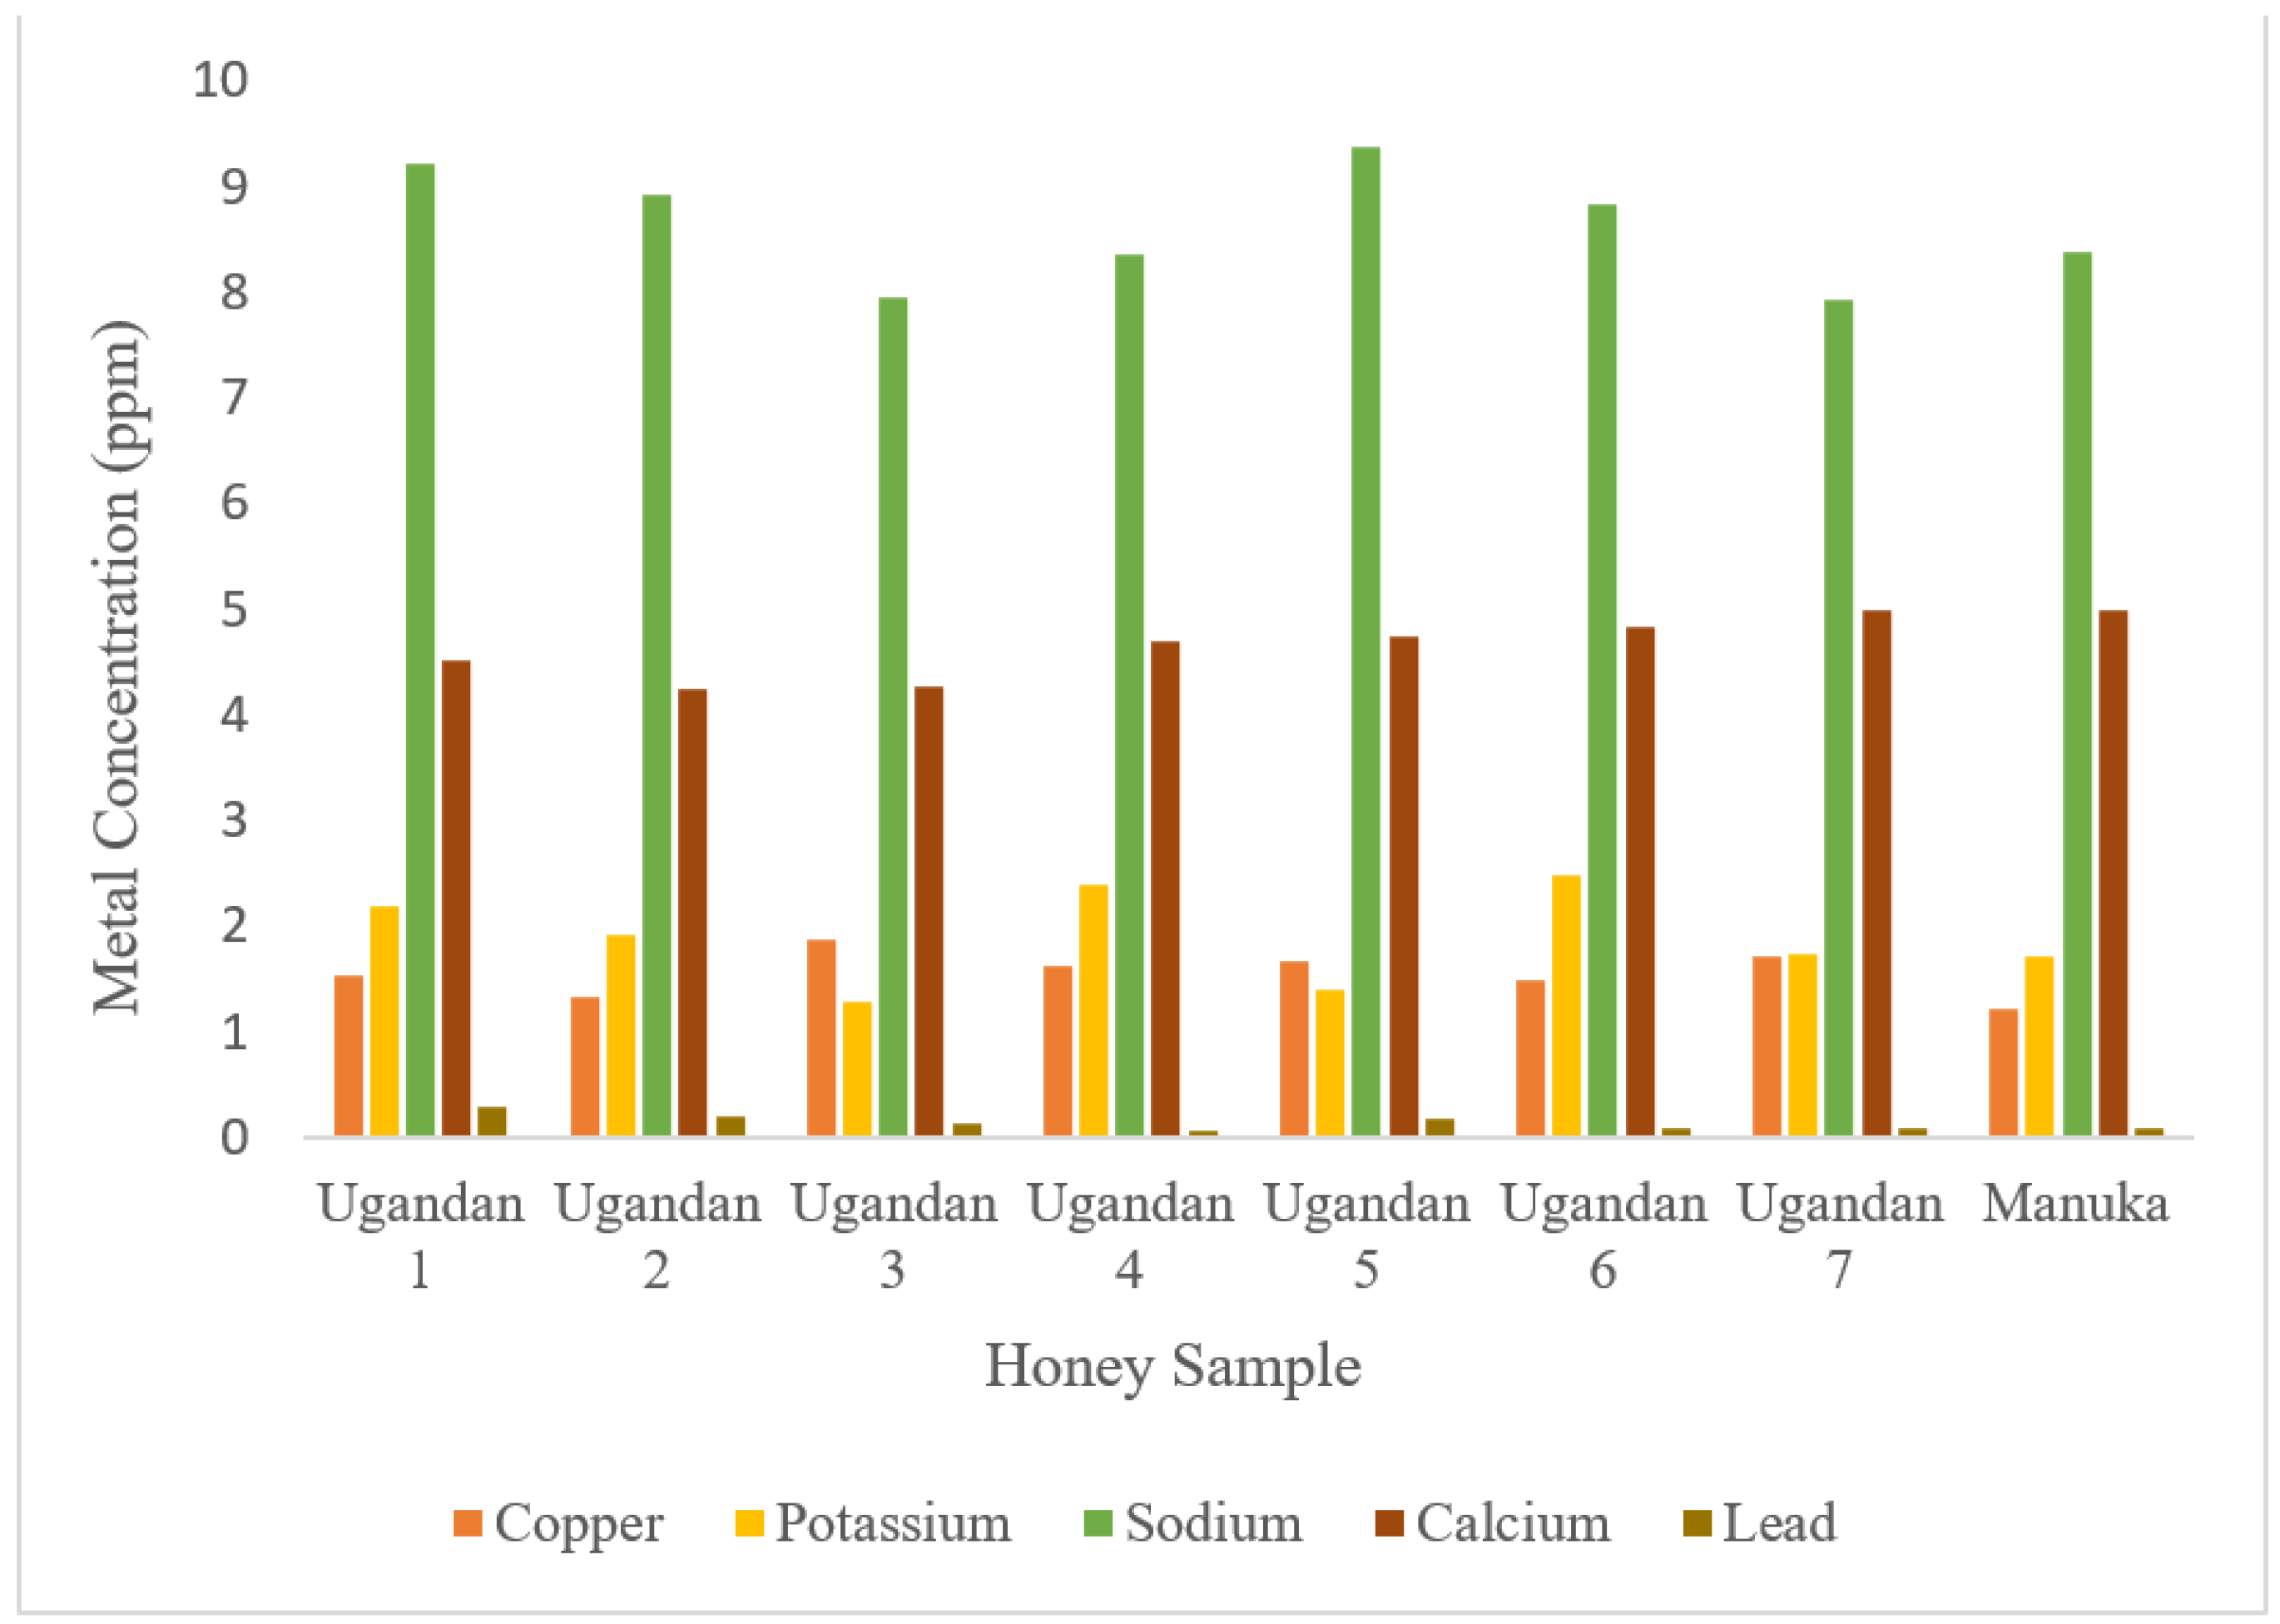
All honey samples were analyzed for their five elemental (Cu, K, Na, Ca, and Pb) concentrations. Sodium was present in the highest concentration across all samples, followed by calcium, potassium, copper, and lead respectively. The highest concentration of sodium was found in Ugandan honey sample 1 at 9.21 ppm. The lowest concentration of lead was found in Ugandan honey sample 4 at 0.07 ppm (Figure 4).
Metal concentration determination in honey is a significant parameter to assess as it is indicative of honey quality as certain elements may threaten health in excess concentrations [36]. Trace elements are useful when present in low concentrations but heavy metals in high concentrations reduces honey quality and poses health hazards when consumed [25,37]. Previous literature showed the danger of heavy metal pollution in areas such as Iran due to practices such as mining and smelting [36]. Heavy metal pollution is such a pertinent issue as it does not only affect honey quality but also water and atmosphere quality which poses a threat to humans and animals. The metals present in honey are largely related to its floral composition and its botanical origin explaining some of the variation seen in this study (Table 1). However, external sources such as industrial pollution, gas emissions, and honey processing procedures contribute to the metal concentration [36].
The results for the metal determination in this study were found in descending order as follows: sodium (Na), calcium (Ca), potassium (K), copper (Cu), lead (Pb). The present study found sodium in the highest concentration across all honey samples (Table 1). The lowest and highest concentration of sodium was found in Ugandan honey sample 7 (7.93 ppm), collected in Masaka, and Ugandan honey sample 5 (9.38), collected in the Buhoma Region. Sodium found in honey has important health functions such as blood pressure maintenance, kidney and muscle functions [37].
The lowest concentration of potassium was found in Ugandan honey sample 3 (1.29 ppm) while the highest potassium concentration was found in Ugandan honey sample 6 (2.48 ppm). Ugandan honey sample 7 (1.73 ppm) was the most similar to the Manuka standard (1.72) in terms of potassium concentration with a difference of 0.01 ppm (Table 1). Potassium found in honey has important health functions such as muscle contraction, along with sodium [37].
The lowest concentration of copper was found in the Manuka honey sample (1.22 ppm) while the highest copper concentration was found in Ugandan honey sample 3 (1.87 ppm). Ugandan honey sample 2 (1.32 ppm) was the most similar to the Manuka standard (1.22 ppm) in terms of copper concentration with a difference of 0.10 ppm (Table 1). Copper is found in honey samples as it is an essential element for human health in appropriate amounts. However, consumption in high concentrations can be a health hazard, making elemental analysis significant. Literature review revealed great variability among elemental studies some showing higher and lower concentrations of copper [38]. The present study found copper in low concentrations (1.22-1.87 ppm) indicating good honey quality.
The lowest concentration of calcium was found in Ugandan honey sample 2 (2.24 ppm) while the highest calcium concentration was found in Ugandan honey sample 7 (4.99 ppm). Ugandan honey sample 7 (4.99 ppm) was the most similar to the Manuka standard (4.98 ppm) in terms of calcium concentration with a difference of 0.01 ppm (Table 1). Calcium found in honey has important health functions such as nerve functions and heart action, along with potassium [37].
Lead was found in the lowest concentration across all honey samples analyzed. The lowest and highest concentration of lead was found in Ugandan honey sample 4 (0.07 ppm) and Ugandan honey sample 1 (0.28 ppm) respectively. Ugandan honey sample 4, 6, and 7 (0.07 ppm, 0.09 ppm, 0.09 ppm respectively) were the most similar to the Manuka standard (0.08 ppm) in terms of lead concentration with a difference of 0.01 ppm. Lead is highly toxic for plants, humans, and animals and can cause tissue damage or mortality in cases of serious contamination [37]. Lead’s presence in honey can be potentially explained by soil contamination in which lead gets into the air and mixes into the soil, reaching the plants [36]. However, lead was not found in the highest concentrations in this study indicating low levels of soil contamination.
The findings in the elemental analysis of this study found all honey samples to have varying metal concentrations ranging from sodium in the highest concentration and lead in the lowest concentration (Table 1). The differences across honey samples could be attributed to plant growth conditions such as fertilizers, environmental conditions, and geographic origin. Additional factors could be beekeeping equipment, beekeeping practices, metal content of plant nectar, agriculture application, industrial activities and traffic [37]. Despite variability, performance of physical and chemical analysis of honey is important as it properties are indicators of storage quality, granulation, texture, flavor and the nutritional and medicinal quality of the honey [39]. These constituents of honey are reflective of the quality of honey which is largely consumed and therefore, effects human health.

3.4. Moisture Content

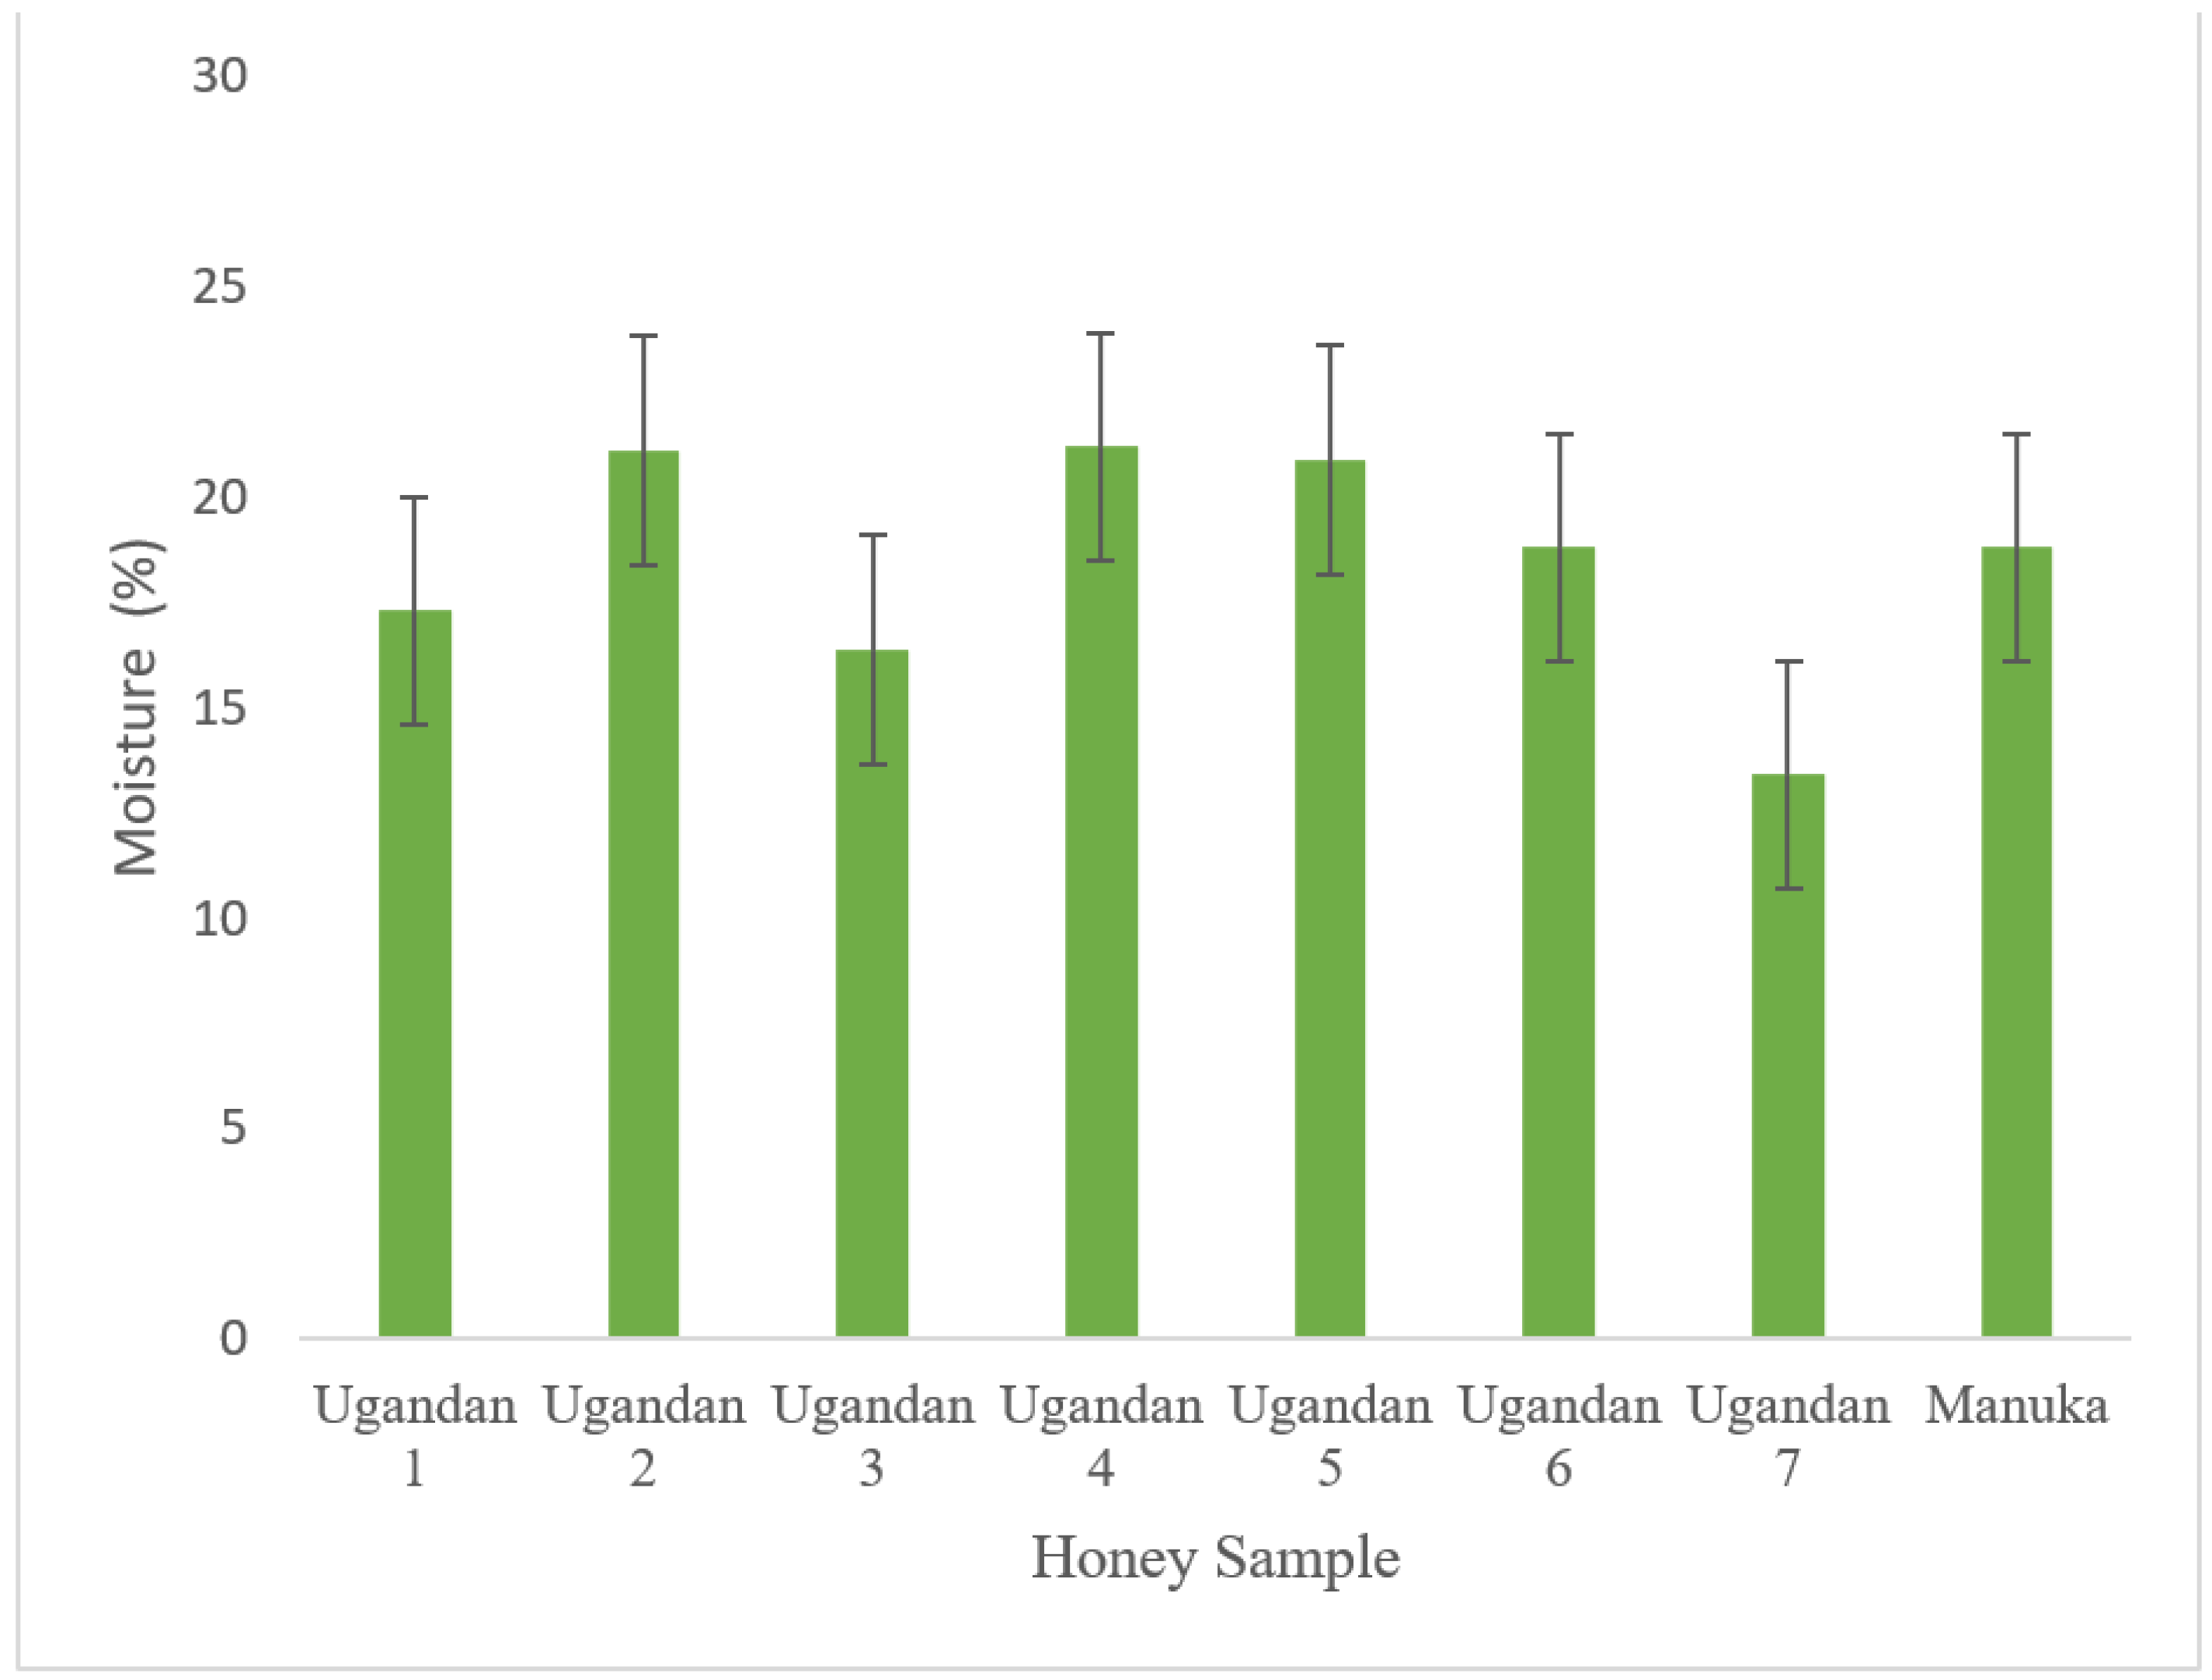
Moisture content varied between 13.4% and 21.2% across all eight honey samples. The highest moisture content was recorded in Ugandan honey sample 4 (21.2%). The lowest moisture content was found in Ugandan honey sample 7 (13.4%) (Figure 5).
Moisture content, or the water present in honey, is a significant parameter to assess in honey as it is an indicator of the quality of honey and its resistance to spoilage [33]. Moisture content varies based on a number of factors including harvesting season, temperature, and humidity during honey production. That variation is evident in the findings of this study as moisture content of all eight honey samples ranged from 13.4% and 21.2% (Table 1). According to Codex Alimentarius standards, honey moisture content should not be more than 20% [33]. Of the honey samples analyzed in this study, three samples (Ugandan honey sample 5, Ugandan honey sample 2, and Ugandan honey sample 4) were found to be slightly over 20% (20.90%, 21.10%, 21.2% respectively).
The moisture content of the Manuka standard was found to be 18.8% (Table 1). Ugandan honey sample 6, collected from the Buhoma region, was found to have the same moisture content as the Manuka honey (18.8%). Literature reviewed revealed honey with low moisture levels of were effective in microbial growth resistance [40]. Overall, the low moisture content levels found in the Ugandan honey samples and Manuka honey sample suggests good quality and potential antimicrobial activity.
Lower levels of moisture, typically that of under 20%, are favorable as they help preserve honey and elongate their shelf life [33]. This is because high levels of moisture in honey can cause yeast fermentation and granulation. Fermentation is the chemical process in which microorganisms, such as yeasts, break down carbohydrates and convert them into alcohols or acids [41]. High levels of moisture in honey allow naturally present yeasts to grow, ferment sugars such as fructose and glucose, and create carbon dioxide, ethyl alcohol and acetic acids [42]. Granulation is the precipitation of glucose from honey in which honey crystallizes [43]. While granulated honey is not unsafe for consumption, it is advisable to avoid as it affects textural properties of honey, making it undesirable for consumers [44].
The moisture content of honey comes from the floral nectar that undergoes honey processing. Nectar is collected by honeybees, mixed with enzymes, brought back to the beehive, and deposited into the honeycomb. Once in the beehive, bees fan their wings to evaporate the water in the honey. Thus, the moisture of honey is largely related to the original moisture of the nectar, explaining some of the variation present in this study [45]. In addition to the moisture of the nectar, harvesting time can attribute to variable levels of moisture as bees need adequate time to dry the honey in the honeycomb [46]. Harvesting time also relates to harvesting season, some of which have lower or higher humidity levels [45]. Moisture content variation could also be attributed to storage conditions as honey can absorb moisture from the environment it is stored in [45].

3.5. Fourier Transform Infrared Spectroscopy Analysis

FTIR analysis revealed very similar patterns of spectral curve across all honey samples analyzed. The spectral curves revealed the functional groups present in Ugandan and Manuka honey. The two functional group regions found across all honey samples were O-H stretching around 3400-3200 cm-1 and C-C stretching about 1100-990 cm-1 (Figures S1-S8).
FTIR spectrometry analysis of honey is a significant parameter to assess as it is an indicator of honey authenticity. This is because infrared spectrum of honey produces a unique, distinguishing spectra from other compounds [47]. Previous literature revealed typical FTIR spectrum of honey should display hydrogen-bonded hydroxyl groups of carbohydrates [47]. Therefore, honey samples producing spectra that deviates from that of the typical honey spectrum indicates the presence of pollutants and contamination [26]. The FTIR spectra of all honey samples in this study revealed a peak around 3300 cm-1 indicating the presence of an O-H group stretching. The spectra also revealed a lower peak around 3000 cm-1 across all honey samples indicating a C-H group stretching (Figures S1-S8). Ugandan honey samples and Manuka honey analyzed in this study show results consistent with previous research, indicting authentic and high quality honey [47].

4. Discussion

The aim of this study was to utilize various analytical techniques to determine physical and chemical properties of Ugandan honey and compare its properties with that of the Manuka honey. The physical and chemical parameters analyzed in this study suggest Ugandan honey is good in quality despite its variability across samples. In its comparison to Manuka honey, Ugandan honey sample 7, collected in the Masaka region, was the most similar in terms of pH, free acidity, and metal analysis (Table 1).
The Ugandan honey was determined to be safe for consumption. This determination can be attributed to various physiochemical properties measured, such as pHs in the range limit deemed safe, moisture contents near or below the limit proving resistance to spoilage, varying metal concentrations, as well as FTIR spectra certifying honey authenticity. This is important due to the utility of honey as a food product in the country. Honey provides a reliable food source for a country that struggles with high food insecurity [48]. It is a cost-efficient industry with a good output of food and creates many jobs in a country with a struggling economy.
This study is the first to attempt to authenticate honey samples from various regions of Uganda in order to determine their safety for consumption. As a result, the methodology used in this research can be followed and replicated to authenticate the quality of honey samples from other countries around the world. This is important as some of the top honey producing countries, such as China, Turkey, Iran, India, and Ukraine, are located in many different regions around the world, and it is important for consumers to know that the honey they are buying is safe for consumption [50]. The techniques utilized in this research can also be replicated to determine the physiochemical properties of other foods as well. This study is a thorough initial investigation into the properties of Ugandan honey. Ultimately, it provides a reliable set of testing methods to show that the honey is safe for consumption, which is very important as honey is a reliable food source and economic aid to the country of Uganda, as well as an important export to other countries.

Supplementary Materials

The following supporting information can be downloaded at the website of this paper posted on Preprints.org, Figure S1: Fourier transform infrared spectrum of Ugandan honey sample 1; Figure S2: Fourier transform infrared spectrum of Ugandan honey sample 2; Figure S3: Fourier transform infrared spectrum of Ugandan honey sample 3; Figure S4: Fourier transform infrared spectrum of Ugandan honey sample 4; Figure S5: Fourier transform infrared spectrum of Ugandan honey sample 5; Figure S6: Fourier transform infrared spectrum of Ugandan honey sample 6; Figure S7: Fourier transform infrared spectrum of Ugandan honey sample 7; Figure S1: Fourier transform infrared spectrum of Manuka honey.

Author Contributions

Conceptualization, G.G.D. and A.D.S; methodology, G.G.D. and A.D.S.; validation, G.G.D. and A.D.S.; formal analysis, G.G.D. and A.D.S.; investigation, G.G.D., A.D.S., A.M..; resources, G.G.D.; data curation, G.G.D., A.D.S., A.M.; writing—original draft preparation, G.G.D., A.D.S., A.M., A.A., A.L., R.M.; writing—review and editing, G.G.D., A.D.S., A.M., A.A., A.L., R.M.; visualization, G.G.D., A.D.S., A.M.; supervision, G.G.D., A.L., A.A., R.M.; project administration, G.G.D.; funding acquisition, G.G.D. All authors have read and agreed to the published version of the manuscript.

Funding

This research received no external funding.

Acknowledgments

We would like to acknowledge the Department of Chemistry at the University of Scranton, especially to Mr. Richard Trygar for the assistance and equipment in making this research possible. We would like to acknowledge the Department of Chemistry at the University of Scranton for the financial assistance to support this research.

Conflicts of Interest

The authors declare no conflicts of interest.

References

  1. Rodríguez García, J.C.; Barciela García, J.; Herrero Latorre, C.; García Martín, S.; Peña Crecente, R.M. Direct and Combined Methods for the Determination of Chromium, Copper, and Nickel in Honey by Electrothermal Atomic Absorption Spectroscopy. J. Agric. Food Chem. 2005, 53, 6616–6623. [Google Scholar] [CrossRef] [PubMed]
  2. Costa, P. Physical Properties of Honeys Produced in the Northeast of Brazil. Int. J. Food Stud. 2013, 2, 118–125. [Google Scholar] [CrossRef]
  3. Mandal, M.D.; Mandal, S. Honey: Its Medicinal Property and Antibacterial Activity. Asian Pac. J. Trop. Biomed. 2011, 1, 154–160. [Google Scholar] [CrossRef] [PubMed]
  4. Khan, S.U.; Anjum, S.I.; Rahman, K.; Ansari, M.J.; Khan, W.U.; Kamal, S.; Khattak, B.; Muhammad, A.; Khan, H.U. Honey: Single Food Stuff Comprises Many Drugs. Saudi J. Biol. Sci. 2018, 25, 320–325. [Google Scholar] [CrossRef] [PubMed]
  5. Afik, O.; Hallel, T.; Dag, A.; Shafir, S. The Components That Determine Honeybee (Apis Mellifera) Preference between Israeli Unifloral Honeys and the Implications for Nectar Attractiveness. Isr. J. Plant Sci. 2009, 57, 253–261. [Google Scholar] [CrossRef]
  6. Honey Market Size, Share & Trends Analysis Report, 2030. Available online: https://www.grandviewresearch.com/industry-analysis/honey-market (accessed on 20 October 2023).
  7. Shoemaker, S. 7 Unique Health Benefits of Honey. Available online: https://www.healthline.com/nutrition/benefits-of-honey (accessed on 20 October 2023).
  8. Ssali, M. Bees Will Give You More. Available online: https://www.monitor.co.ug/uganda/magazines/farming/bees-will-give-you-more-4016822 (accessed on 20 October 2023).
  9. Nakalya, E. Uganda Produces 4,000 Metric Tonnes of Honey per Annum - Report | Monitor. Available online: https://www.monitor.co.ug/uganda/news/national/uganda-produces-4-000-metric-tonnes-of-honey-per-annum-report-4349326 (accessed on 20 October 2023).
  10. Oromokoma, C.; Kasangaki, P.; Akite, P.; Mugume, R.; Kajobe, R.; Mangusho, G.; Matovu, M.; Chemurot, M. First Physicochemical Analysis of Stingless Bee Honey from Uganda. J. Apic. Res. 2023, 0, 1–10. [Google Scholar] [CrossRef]
  11. Gela, A.; Hora, Z.A.; Kebebe, D.; Gebresilassie, A. Physico-Chemical Characteristics of Honey Produced by Stingless Bees (Meliponula Beccarii) from West Showa Zone of Oromia Region, Ethiopia. Heliyon 2021, 7, e05875. [Google Scholar] [CrossRef] [PubMed]
  12. Abeshu, M.; Geleta, B. Medicinal Uses of Honey. Biol. Med. 2016, 8, 279. [Google Scholar] [CrossRef]
  13. Johnston, M.; McBride, M.; Dahiya, D.; Owusu-Apenten, R.; Nigam, P.S. Antibacterial Activity of Manuka Honey and Its Components: An Overview. AIMS Microbiol. 2018, 4, 655–664. [Google Scholar] [CrossRef] [PubMed]
  14. Almasaudi, S.B.; Al-Nahari, A.A.M.; Abd El-Ghany, E.S.M.; Barbour, E.; Al Muhayawi, S.M.; Al-Jaouni, S.; Azhar, E.; Qari, M.; Qari, Y.A.; Harakeh, S. Antimicrobial Effect of Different Types of Honey on Staphylococcus Aureus. Saudi J. Biol. Sci. 2017, 24, 1255–1261. [Google Scholar] [CrossRef] [PubMed]
  15. Alvarez-Suarez, J.M.; Gasparrini, M.; Forbes-Hernández, T.Y.; Mazzoni, L.; Giampieri, F. The Composition and Biological Activity of Honey: A Focus on Manuka Honey. Foods 2014, 3, 420–432. [Google Scholar] [CrossRef] [PubMed]
  16. Roberts, A.E.L.; Brown, H.L.; Jenkins, R.E. On the Antibacterial Effects of Manuka Honey: Mechanistic Insights. Res. Rep. Biol. 2015, 6, 215–224. [Google Scholar] [CrossRef]
  17. Girma, A.; Seo, W.; She, R.C. Antibacterial Activity of Varying UMF-Graded Manuka Honeys. PLOS ONE 2019, 14, e0224495. [Google Scholar] [CrossRef] [PubMed]
  18. Mavric, E.; Wittmann, S.; Barth, G.; Henle, T. Identification and Quantification of Methylglyoxal as the Dominant Antibacterial Constituent of Manuka (Leptospermum Scoparium) Honeys from New Zealand. Mol. Nutr. Food Res. 2008, 52, 483–489. [Google Scholar] [CrossRef] [PubMed]
  19. Abd-El Aal, A.M.; El-Hadidy, M.R.; El-Mashad, N.B.; El-Sebaie, A.H. Antimicrobial Effect of Bee Honey in Comparison to Antibiotics on Organisms Isolated From Infected Burns. Ann. Burns Fire Disasters 2007, 20, 83–88. [Google Scholar] [PubMed]
  20. Fan, F.; Roos, Y.H. Physicochemical Properties, Structural Transformation, and Relaxation Time in Strength Analysis for Honey Powder Models. Food Res. Int. 2019, 122, 137–148. [Google Scholar] [CrossRef] [PubMed]
  21. Google Maps. Available online: https://www.google.com/maps/place/Uganda/@0.8737302,31.0000435,8.19z/data=!4m6!3m5!1s0x1771a69f6499f945:0x874155ce43014549!8m2!3d1.373333!4d32.290275!16zL20vMDd0cDI?hl=en&entry=ttu (accessed on 1 January 2024).
  22. Honey. In Official Methods of Analysis of AOAC INTERNATIONAL; Godshall, M.A., Latimer, G.W., Jr., Eds.; Oxford University Press, 2023; p. 0 ISBN 978-0-19-761013-8.
  23. Afik, O.; Hallel, T.; Dag, A.; Shafir, S. The Components That Determine Honey Bee (Apis Mellifera) Preference between Israeli Unifloral Honeys and the Implications for Nectar Attractiveness. Isr. J. Plant Sci. 2009, 57, 253–261. [Google Scholar] [CrossRef]
  24. Price, R. The Analysis of Trace Elements in Honey by Flame and Graphite Furnace Atomic Absorption Spectrometry.
  25. Lanjwani, M.F.; Channa, F.A. Minerals Content in Different Types of Local and Branded Honey in Sindh, Pakistan. Heliyon 2019, 5, e02042. [Google Scholar] [CrossRef]
  26. Sahlan, M.; Karwita, S.; Gozan, M.; Hermansyah, H.; Yohda, M.; Yoo, Y.J.; Pratami, D.K. Identification and Classification of Honey’s Authenticity by Attenuated Total Reflectance Fourier-Transform Infrared Spectroscopy and Chemometric Method. Vet. World 2019, 12, 1304–1310. [Google Scholar] [CrossRef] [PubMed]
  27. Dobrinas, S.; Soceanu, A.; Birghila, S.; Birghila, C.; Matei, N.; Popescu, V.; Constanda, L.M. Chemical Analysis and Quality Assessment of Honey Obtained from Different Sources. Processes 2022, 10, 2554. [Google Scholar] [CrossRef]
  28. Seraglio, S.K.T.; Silva, B.; Bergamo, G.; Brugnerotto, P.; Gonzaga, L.V.; Fett, R.; Costa, A.C.O. An Overview of Physicochemical Characteristics and Health-Promoting Properties of Honeydew Honey. Food Res. Int. 2019, 119, 44–66. [Google Scholar] [CrossRef] [PubMed]
  29. (PDF) Honey Quality and International Regulatory Standards: Review by the International Honey Commission. Available online: https://www.researchgate.net/publication/277618846_Honey_quality_and_international_regulatory_standards_review_by_the_International_Honey_Commission (accessed on 1 January 2024).
  30. Value-Added Products from Beekeeping. Codex Standard for Honey. Available online: https://www.fao.org/3/w0076e/w0076e30.htm (accessed on 21 March 2024).
  31. Kwakman, P.H.S.; Zaat, S.A.J. Antibacterial Components of Honey. IUBMB Life 2012, 64, 48–55. [Google Scholar] [CrossRef] [PubMed]
  32. Samarghandian, S.; Farkhondeh, T.; Samini, F. Honey and Health: A Review of Recent Clinical Research. Pharmacogn. Res. 2017, 9, 121–127. [Google Scholar] [CrossRef] [PubMed]
  33. El Sohaimy, S.A.; Masry, S.H.D.; Shehata, M.G. Physicochemical Characteristics of Honey from Different Origins. Ann. Agric. Sci. 2015, 60, 279–287. [Google Scholar] [CrossRef]
  34. Molan, P.C. Potential of Honey in the Treatment of Wounds and Burns. Am. J. Clin. Dermatol. 2001, 2, 13–19. [Google Scholar] [CrossRef] [PubMed]
  35. Rysha, A.; Kastrati, G.; Biber, L.; Sadiku, V.; Rysha, A.; Zogaj, F.; Kabashi-Kastrati, E. Evaluating the Physicochemical Properties of Some Kosovo’s and Imported Honey Samples. Appl. Sci. 2022, 12, 629. [Google Scholar] [CrossRef]
  36. Aghamirlou, H.M.; Khadem, M.; Rahmani, A.; Sadeghian, M.; Mahvi, A.H.; Akbarzadeh, A.; Nazmara, S. Heavy Metals Determination in Honey Samples Using Inductively Coupled Plasma-Optical Emission Spectrometry. J. Environ. Health Sci. Eng. 2015, 13, 39. [Google Scholar] [CrossRef] [PubMed]
  37. Tutun, H.; Kahraman, H.A.; Aluc, Y.; Avci, T.; Ekici, H. Investigation of Some Metals in Honey Samples from West Mediterranean Region of Turkey. Vet. Res. Forum 2019, 10, 181–186. [Google Scholar] [CrossRef] [PubMed]
  38. Pisani, A.; Protano, G.; Riccobono, F. Minor and Trace Elements in Different Honey Types Produced in Siena County (Italy). Food Chem. 2008, 107, 1553–1560. [Google Scholar] [CrossRef]
  39. Singh, I.; Singh, S. Honey Moisture Reduction and Its Quality. J. Food Sci. Technol. 2018, 55, 3861–3871. [Google Scholar] [CrossRef] [PubMed]
  40. Moniruzzaman, M.; Khalil, M.I.; Sulaiman, S.A.; Gan, S.H. Physicochemical and Antioxidant Properties of Malaysian Honeys Produced by Apis Cerana, Apis Dorsata and Apis Mellifera. BMC Complement. Altern. Med. 2013, 13, 43. [Google Scholar] [CrossRef] [PubMed]
  41. Maicas, S. The Role of Yeasts in Fermentation Processes. Microorganisms 2020, 8, 1142. [Google Scholar] [CrossRef] [PubMed]
  42. Sanz, S.; Gradillas, G.; Jimeno, F.; Perez, C.; Juan, T. Fermentation Problem in Spanish North-Coast Honey. J. Food Prot. 1995, 58, 515–522. [Google Scholar] [CrossRef]
  43. Doner, L.W. The Sugars of Honey—A Review. J. Sci. Food Agric. 1977, 28, 443–456. [Google Scholar] [CrossRef] [PubMed]
  44. Cavia, M.M.; Fernández-Muiño, M.A.; Gömez-Alonso, E.; Montes-Pérez, M.J.; Huidobro, J.F.; Sancho, M.T. Evolution of Fructose and Glucose in Honey over One Year: Influence of Induced Granulation. Food Chem. 2002, 78, 157–161. [Google Scholar] [CrossRef]
  45. Chirife, J.; Zamora, M.C.; Motto, A. The Correlation between Water Activity and % Moisture in Honey: Fundamental Aspects and Application to Argentine Honeys. J. Food Eng. 2006, 72, 287–292. [Google Scholar] [CrossRef]
  46. Moniruzzaman, M.; Sulaiman, S.A.; Khalil, M.I.; Gan, S.H. Evaluation of Physicochemical and Antioxidant Properties of Sourwood and Other Malaysian Honeys: A Comparison with Manuka Honey. Chem. Cent. J. 2013, 7, 138. [Google Scholar] [CrossRef] [PubMed]
  47. Svečnjak, L.; Biliskov, N.; Bubalo, D.; Barišić, D. Application of Infrared Spectroscopy in Honey Analysis. Agric. Conspec. Sci. 2011, 76, 191–195. [Google Scholar]
  48. In Uganda: Low Access to Essential Goods, High Food Insecurity, with Slightly Improved Conditions among the Poorest. Available online: https://www.worldbank.org/en/programs/lsms/brief/in-uganda-low-access-to-essential-goods-high-food-insecurity-with-a-slight-improved-conditions-among-the-poorest (accessed on 22 October 2023).
  49. Uganda | Imports and Exports | World | Natural Honey | Value (US$) and Value Growth, YoY (%) | 2009 - 2020. Available online: https://trendeconomy.com/data/h2/Uganda/0409 (accessed on 26 November 2023).
  50. Bunce, B. Discover the 10 Countries That Produce the Most Honey. Available online: https://a-z-animals.com/blog/discover-the-countries-that-produce-the-most-honey/ (accessed on 7 December 2023).
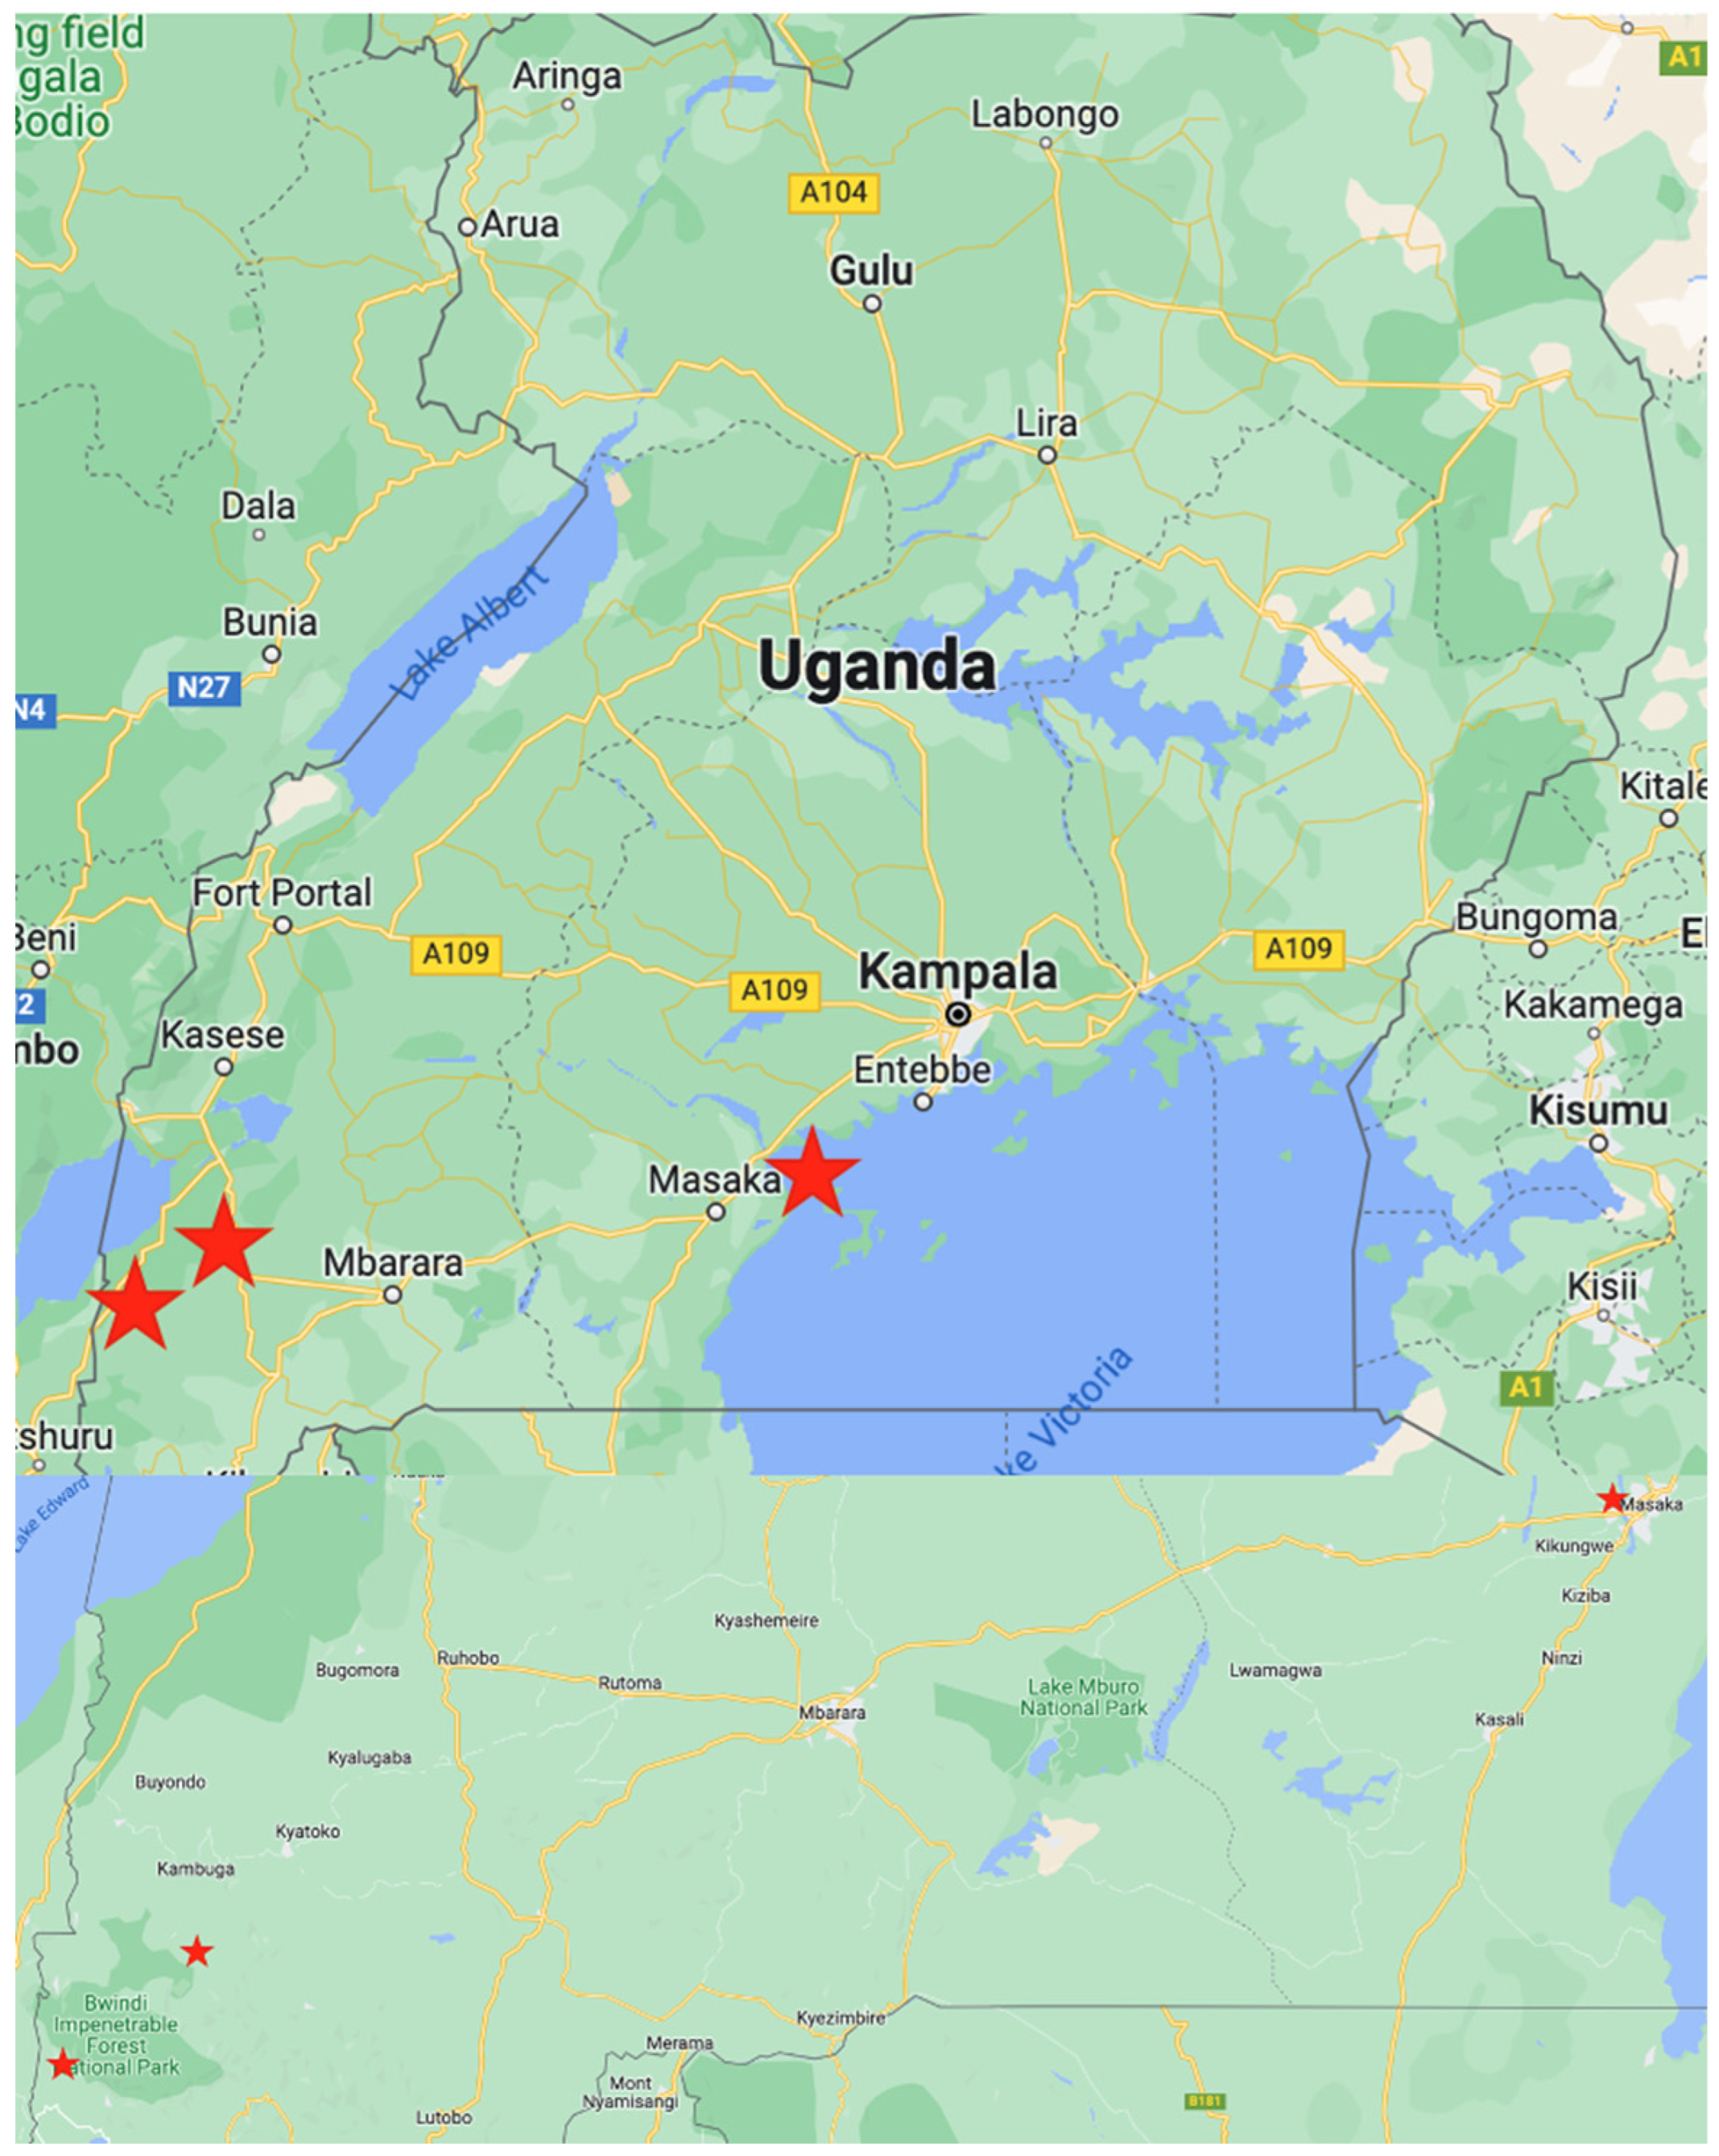
Figure 1. Map of Uganda showing Masaka District, Kanungu District, and Buhoma region where honey samples were collected. Stars indicate the site of sample collection.
Preprints 109166 g001
Figure 2. Mean pH (± SD) for all honey samples analyzed. Ugandan honey samples 1, 2, and 3 were collected from the Kanungu District. Ugandan honey samples 4, 5, 6 were collected from the Buhoma region. Ugandan honey sample 7 was collected from the Masaka District.
Preprints 109166 g002
Figure 3. Mean free acidity (± SD) for all honey samples analyzed. Ugandan honey samples 1, 2, and 3 were collected from the Kanungu District. Ugandan honey samples 4, 5, 6 were collected from the Buhoma region. Ugandan honey sample 7 was collected from the Masaka District.
Preprints 109166 g003
Figure 4. Mean metal concentration for all elements analyzed (Cu, K, Na, Ca, and Pb). Ugandan honey samples 1, 2, and 3 were collected from the Kanungu District. Ugandan honey samples 4, 5, 6 were collected from the Buhoma region. Ugandan honey sample 7 was collected from the Masaka District.
Preprints 109166 g004
Figure 5. Mean moisture (± SD) for all honey samples analyzed. Ugandan honey samples 1, 2, and 3 were collected from the Kanungu District. Ugandan honey samples 4, 5, 6 were collected from the Buhoma region. Ugandan honey sample 7 was collected from the Masaka District.
Preprints 109166 g005
Table 1. Mean physical and chemical properties analyzed in Ugandan and Manuka honey samples. Ugandan honey samples 1, 2, and 3 were collected from the Kanungu District. Ugandan honey samples 4, 5, 6 were collected from the Buhoma region.
Honey Sample pH Free Acidity (meq/kg) Moisture (%) Copper (ppm) Potassium (ppm) Sodium (ppm) Calcium (ppm) Lead (ppm)
1 3.7 44.72 17.3 % 1.54 2.18 9.21 4.52 0.28
2 4.8 56.52 21.1 % 1.32 1.92 8.92 4.24 0.19
3 3.5 34.87 16.4 % 1.87 1.29 7.94 4.27 0.13
4 3.8 48.06 21.2 % 1.62 2.38 8.36 4.69 0.07
5 3.7 62.22 20.9 % 1.67 1.39 9.38 4.75 0.18
6 4.4 50.34 18.8 % 1.49 2.48 8.84 4.82 0.09
7 3.2 43.68 13.4 % 1.71 1.73 7.93 4.99 0.09
Manuka 3.3 41.16 18.8 % 1.22 1.72 8.37 4.98 0.08
Disclaimer/Publisher’s Note: The statements, opinions and data contained in all publications are solely those of the individual author(s) and contributor(s) and not of MDPI and/or the editor(s). MDPI and/or the editor(s) disclaim responsibility for any injury to people or property resulting from any ideas, methods, instructions or products referred to in the content.
Copyright: This open access article is published under a Creative Commons CC BY 4.0 license, which permit the free download, distribution, and reuse, provided that the author and preprint are cited in any reuse.
Prerpints.org logo

Preprints.org is a free preprint server supported by MDPI in Basel, Switzerland.

Subscribe

© 2024 MDPI (Basel, Switzerland) unless otherwise stated