Preprint
Article

Nuʻupia Ponds' Water Circulation Characteristics: Exploring Water Exchange and Residence Time for Marine Ecosystem Management

This version is not peer-reviewed.

Submitted:

13 June 2024

Posted:

14 June 2024

You are already at the latest version

A peer-reviewed article of this preprint also exists.

Abstract
Nuʻupia Ponds, a traditional Hawaiian fishpond system, are located at Marine Corps Base Hawaii (MCBH) and part of the Nuʻupia Ponds Wildlife Management Area, a wetland refuge for native, endangered, and protected birds and Hawaiian green sea turtles, as well as many native fish species. Currently, there is uncertainty regarding the ecological status and condition of the fishponds following prior modification of wetland habitats in and around the ponds. This study examines circulation dynamics and characterizes water exchange, pond volume, and residence time across the full tidal spectrum at Nuʻupia fishponds. Our results indicate a general west to east gradient in current flow; with higher flushing rates and lower residence times of fishponds in the western ponds of the Nu’upia system compared to the eastern ponds. We further found low flushing rates at several sites causing limited water exchange with Kāne’ohe Bay, as well as within Nu’upia Pond system. Sufficient water circulation plays a fundamental role in maintaining a healthy balance of fishpond flora and fauna and preserve ecosystem health. The results from this study provide a baseline of current physical water circulation dynamics and implications for ecosystem health, as well as inform science-based conservation and management strategies moving forward.
Keywords: 
Subject: 
Environmental and Earth Sciences  -   Oceanography

1. Introduction

The dynamics of physical processes within coastal ecosystems influence temporal and spatial scales of chemical and biological interactions and together substantially impact the health of coastal ecosystems [1]. In shallow, enclosed systems such as traditional Hawaiian fishponds, water exchange and the coupled transport of dissolved and particulate materials, play a fundamental role in shaping water quality, nutrient availability, pollution levels, and a healthy balance of fishpond flora and fauna [1,2,3]. Hence, understanding the temporal and spatial scales of transport and residence time is crucial for assessing how physical circulation patterns impact coastal ecosystems and provides practical information for resource management [4].
This intricate interplay presents a well understood concept in traditional Hawaiian aquaculture: Walled fishponds, known as Loko i‘a kuapa, were commonly built within natural coastal embayments, where freshwater meets the ocean, across the islands centuries ago. This strategic placement leveraged the nutrient-rich freshwater influx- from streams or submarine groundwater discharge - enhancing primary production within confined brackish environments [5,6]. In the traditional Hawaiian fishpond system, photosynthetic microorganisms form the base of the food web, creating ideal conditions for herbivorous fish species and crustaceans to thrive, rendering efficient generation of protein for human consumption [5]. Kuapā (fishpond wall) with mākāhā (size-slotted sluice gates) were strategically placed and designed to harness the natural flow of ocean tides while simultaneously preventing the escape of fish and creating a low wave energy environment within the fishponds. Mākāhā were used to harvest fish as well as regulate exchange with freshwater and ocean water, retaining a minimum water volume inside the fishponds at all times [5,6,7]. Water volume flux (m3 s−1), which refers to the volume of water passing through each sluice gate per unit time, can flow into or out of the fishpond depending on sluice gate location, tidal phase and other environmental conditions such as winds and precipitation [4]. Loko i‘a stewards utilized their understanding of juvenile fish migration to enhanced fish stocks capturing desired species behind sluice gates until they matured, while also thwarting the entrance of larger predators. [5]. Reflecting the deep-rooted wisdom and environmental stewardship of the Hawaiian culture, loko iʻa alleviated pressure on wild fish populations, provided juvenile fish habitat, and played an important role in nutrient cycling and sediment capture, while fostering a harmonious balance between marine and freshwater ecosystems. Native Hawaiians communities depended on fishponds as a source of protein: It is estimated that during the peak of fishpond activity, loko iʻa produced approximately 2 million pounds of fish annually [5,8].
Prior to western contact, at least thirty loko iʻa were located along Kāneʻohe Bay providing a rich fish and seaweed harvest from the ponds to the inhabitants of the Koʻolaupoko district, one of the largest populations in the Hawaiian Islands [9,10]. Nuʻupia Ponds was among them and historically supported its people, providing them with sustenance, resources, and an essential connection to their land. Archeological coring and testing research revealed the probable alignments of the original fishpond walls and estimated the age of the constructed fishpond around A.D. 865-1230 [9,11]. Over time, a combination of land use changes (e.g., shift from subsistence to plantation economy and disuse), physical changes (e.g., sedimentation and storm damage) and biological invasions of invasive species (e.g., mangroves) have led to dramatic alterations and decline of most loko iʻa across the state of Hawaii [12,13].
Today, Nuʻupia Ponds located on the Marine Corps Base Hawaiʻi (MCBH), comprises a series of interconnected shallow water lagoons that serve as an essential habitat for a wide array of biodiversity, making it a vital breeding ground for bird species and native aquatic flora [9]. The ponds are home to a variety of migratory and endemic bird species, and provide crucial nesting and feeding grounds for waterfowl and shorebirds. Rare and endangered bird species, such as the Hawaiian stilt (ae‘o) and the Hawaiian coot (‘alae ke‘oke‘o), find sanctuary in this protected area, adding to its ecological significance [9,11]. Nuʻupia Ponds is not managed with the traditional goal of cultivating fish for food security at this time. Instead, Marine Corps Base Hawaii's management plans aim to prioritize the enhancement of biodiversity and the promotion of optimal ecosystem health as their primary goals. Past MCBH management plans have included the eradication of invasive vegetation such as pickleweed (Batis maritima) and mangroves (Rhizophora mangle) from the Nuʻupia Ponds Wildlife Management Area, restoration of the mudflat habitat used by Hawaiian Stilt for feeding and nesting, and clearing of sediments, coral materials, and vegetation blocking culverts facilitating water exchange among ponds to improve water circulation [11]. Currently, there is uncertainty regarding the ecological status and condition of the fishponds following prior modification of wetland habitats in and around the ponds. In this study, we examine circulation dynamics at Nuʻupia fishponds using current meters, pressure sensors and a bathymetric survey, and characterize water exchange, pond volume, and residence time across the full tidal spectrum at eight interconnected fishponds. Residence time and exchange patterns in shallow and coastal settings hold substantial practical significance, offering coastal managers important information of how physical processes might affect ecological and biogeochemical drivers within these environments. As such, sufficient water circulation in each of the ponds is central in order to maintain water quality, ensure oxygen saturation for fish and preserve biodiversity [4,12]. The results from this study provide a baseline of current physical water circulation dynamics and allow MCBH to evaluate the effects of future modifications and activities on the ponds as well as guide science-based conservation and management strategies moving forward. To our current understanding, this study is the first that provides a holistic picture of the physical processes with in Nuʻupia Ponds and its implications for ecosystem conservation and management.

2. Methods

2.1. Nuʻupia Ponds Study Site

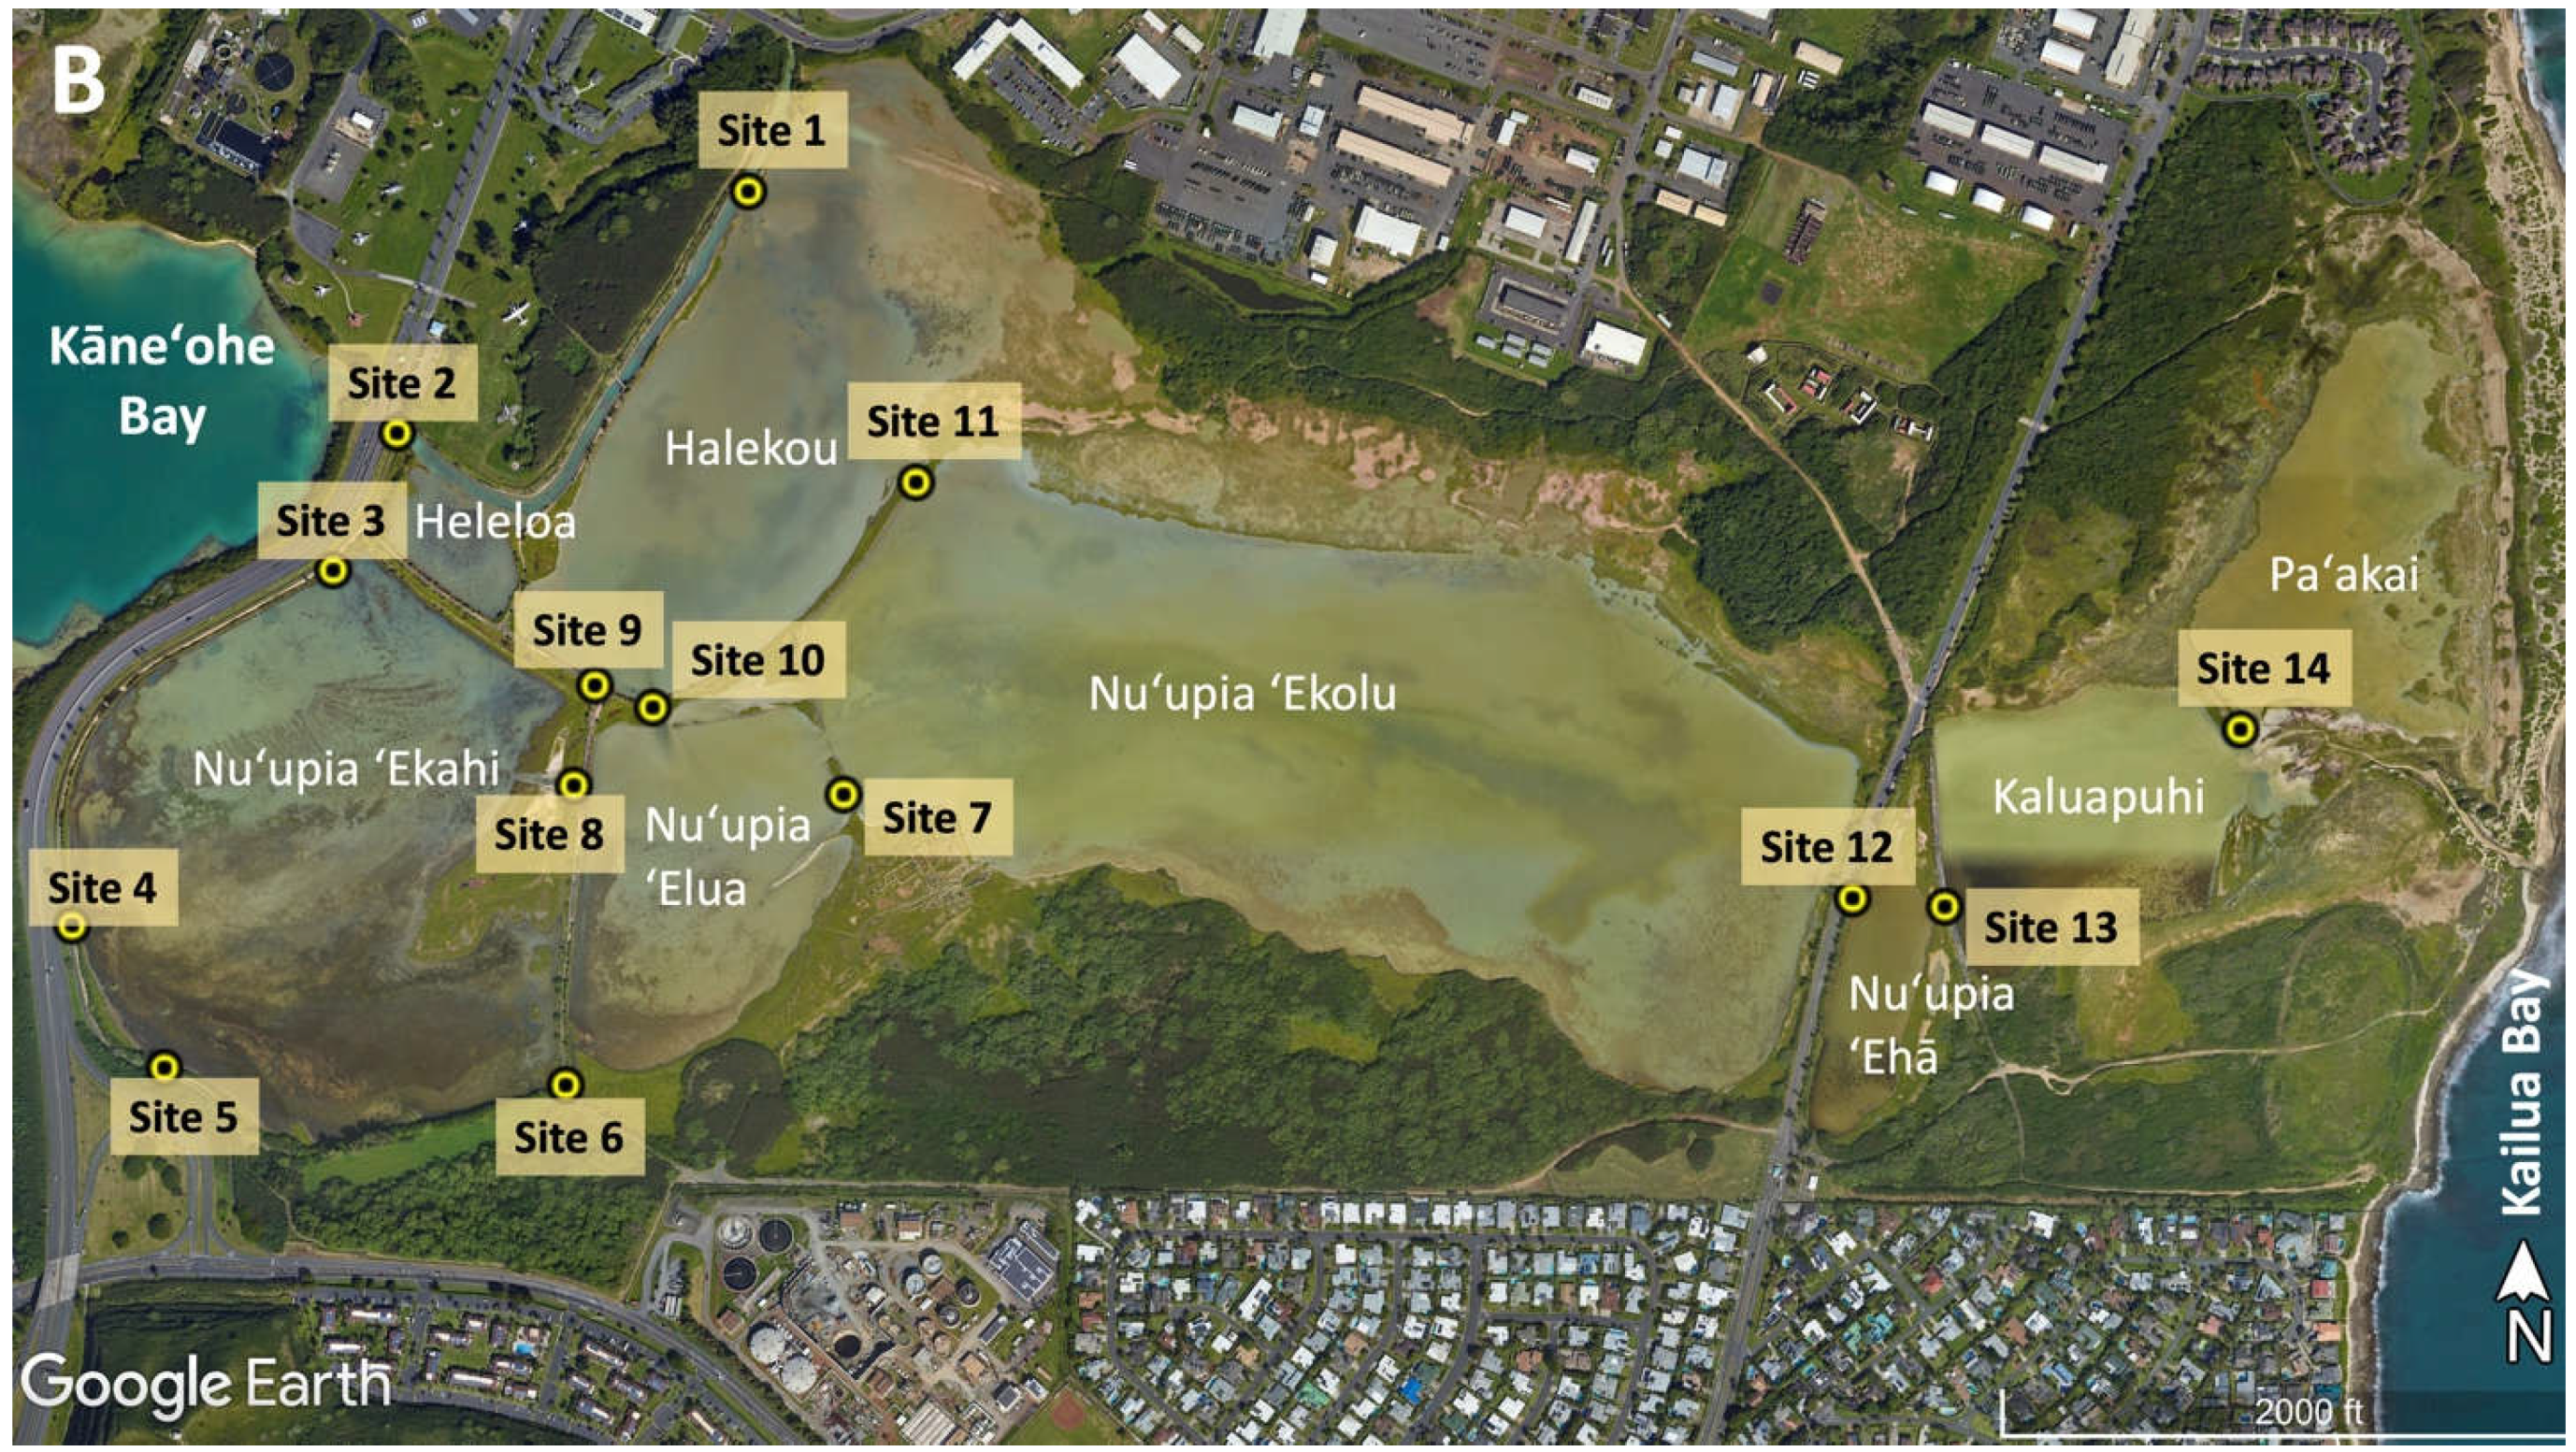
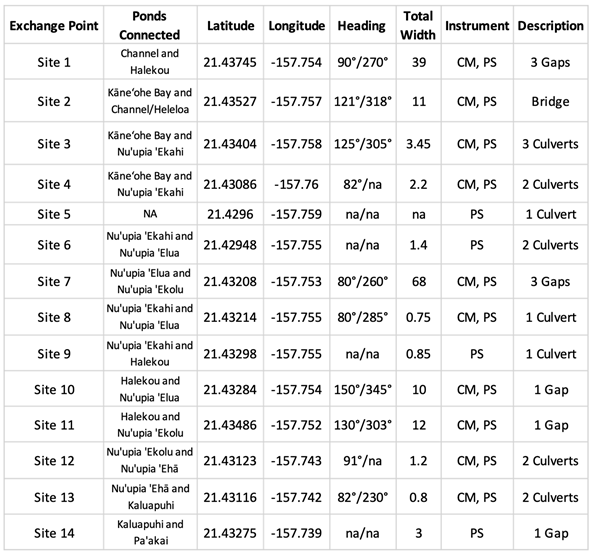
Nuʻupia Ponds (2126’00.01” N, 15745’01.52” W) are located within the Kāneʻohe Bay on the Marine Corps Base Hawaiʻi (MCBH) on the windward side of the island of Oʻahu in Hawaiʻi (Figure 1A). The pond system is part of the Nuʻupia Ponds Wildlife Management Area (Nuʻupia Ponds WMA), a wetland refuge for native, endangered, and protected birds and Hawaiian green sea turtles, as well as many native fish species. Nuʻupia Ponds WMA straddles the Mōkapu Peninsula from east to west along the southern boundary of the Base and encompasses approximately 483-acres. Nuʻupia Ponds is also one of the few remnants of a complex of ancient Hawaiian fishponds that formerly existed along the shorelines of Kaneʻohe Bay [5,9,10]. The eight historic Hawaiian walled fishponds (Loko i‘a kuapā) have a combined surface water area of 237 acres and associated wetlands areas of 377 acres that consist largely of mudflats, Batis maritima L. meadows and monospecific stands of L. Mangle [14]. Mōkapu Peninsula is part of two traditional Hawaiian land divisions called ahupuaʻa: Kāneʻohe and Heʻeia ahupuaʻa. From ridge to reef these ahupuʻa encompassing Nuʻupia Ponds provided its historical residents with everything needed to live in a self-sufficient way [9,10]. The ponds have been modified over the years, but some of the original pond walls and overall structure remains largely intact [11]. Nuʻupia Ponds consists of eight individual ponds: Nuʻupia ʻEkahi, Nuʻupia ʻElua, Nuʻupia ʻEkolu, Nuʻupia Ehā, Halekou, Heleloa, Paʻakai and Kaluapuhi (Figure 1B). The Pond System is interconnected through a set of fourteen exchange points1 – a combination of either concrete culverts or gaps – that facilitate water exchange to varying degrees (Figure 1B; Figure 3A; Table 1).
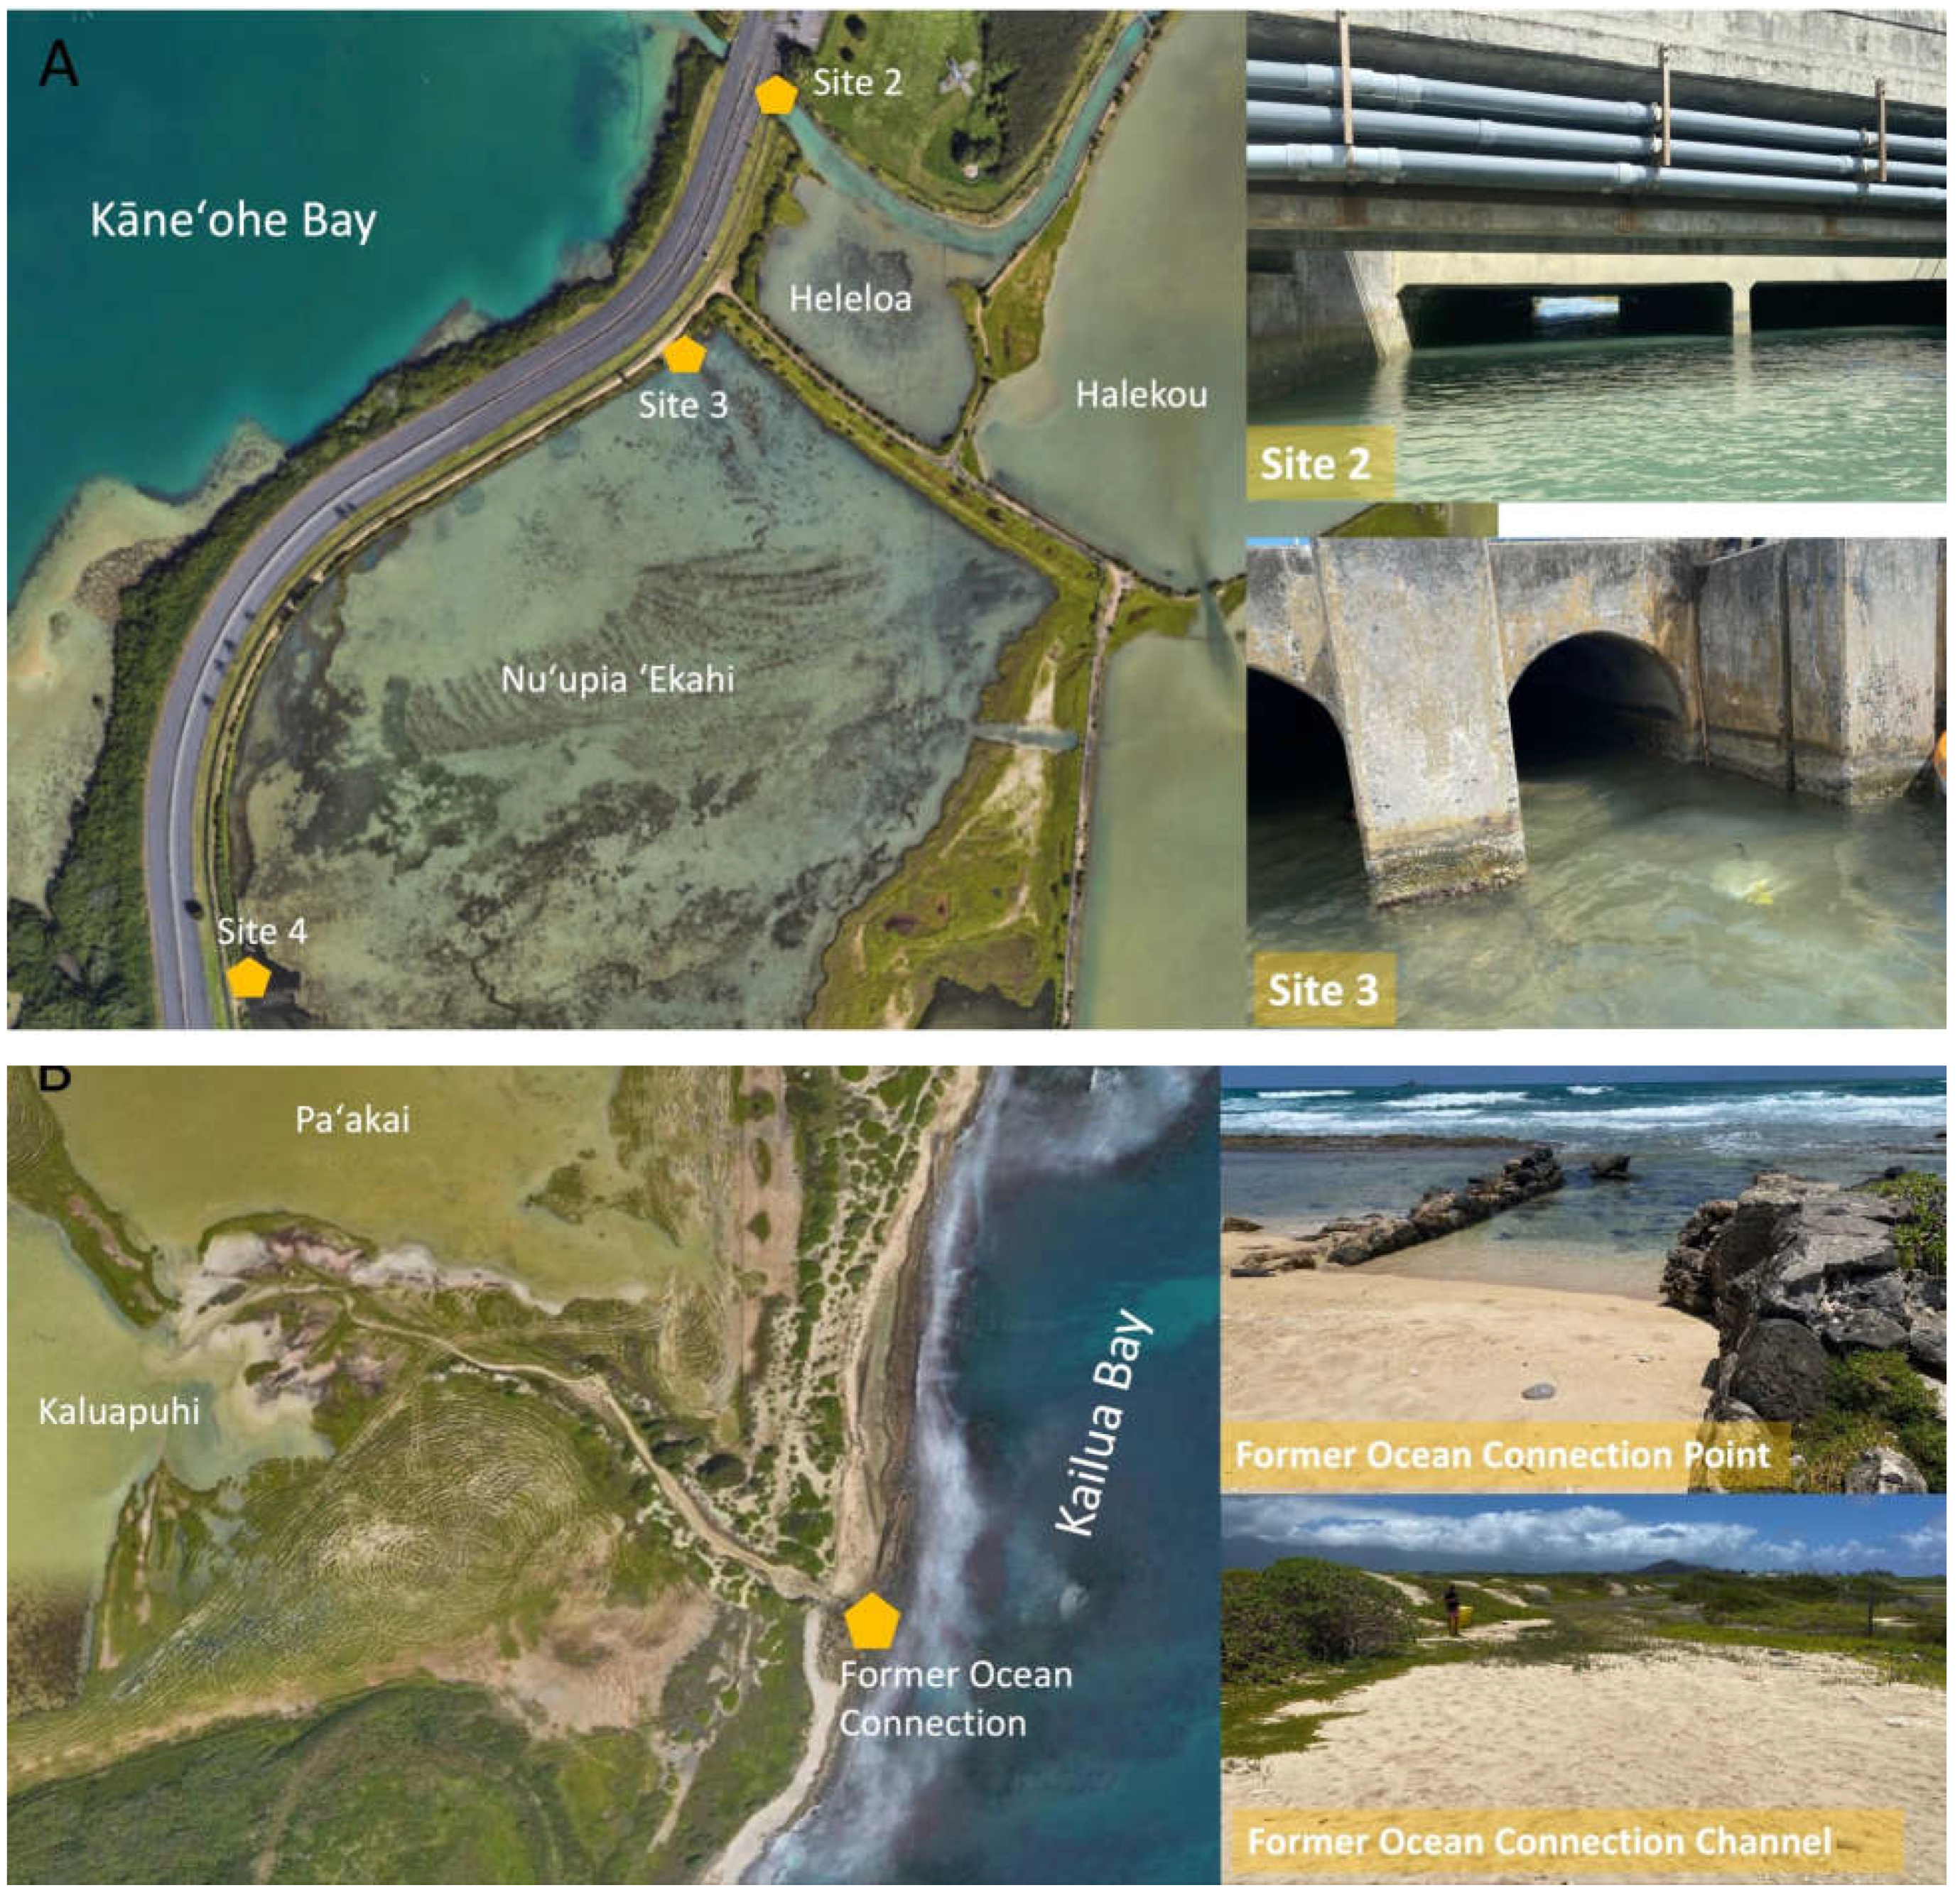
Nuʻupia Ponds are connected to Kāneʻohe Bay in the West through a channel flowing under the John A. Burns Freeway Bridge at Site 2 (Figure 2). The channel feeds directly into Heleloa and Halekou Ponds. Culverts at Site 3 and Site 4 facilitate water exchange between Kāneʻohe Bay and Nuʻupia ʻEkahi Pond (Figure 2A, 3A, Table 1). Historically, Paʻakai Pond was connected to Kailua Bay in the East. However, today the former channel is filled with sand and marshland and the connection is dry. Even at extreme high tides occurring 1–2 times a year (also called “King Tides”), the eastside ocean connection is not reestablished (Figure 2B).

2.2. Water Volume Flux and Volume Change Calculations

To assess current direction (), velocity (m s−1), and water level (m) into and out of Nuʻupia Ponds, TCM-4 Shallow Water (SW) Tilt Current Meters (Lowell Instruments LLC, East Falmouth, MA, USA) and HOBO® water level loggers (Onset, Bourne, MA, USA) were deployed in ten out of fourteen exchange points (Figure 1B; Figure 3; Table 1). Measuring current direction and velocities presented a challenge at this study site due to its shallow depth as many commonly used current meters do not work in such shallow water environments. As the TCM-4 Shallow Water (SW) Tilt Current Meters require a minimum water depth of 30 cm, Site 5, 6, 9 and 14 were solely equipped with a pressure sensor due to shallow water depth (Table 1, Figure 3B). Every instrument unit was mounted to a round concrete plate 16 inch in diameter and about 10 kg in weight and positioned at the center of each culvert channel or gap. All measurements were recorded at recommended meter configurations with a burst interval of 1 minute, a burst rate of 8 Hz and a burst duration of 20 seconds rendering 160 samples per minute [15]. Thus, each minute velocity measurement was an average of 160 samples taken over a 20 second period. Current meters and pressure sensors were deployed for a duration of 15 days with the rational of recording measurements throughout the entire tidal range and capturing one complete neap tide and one complete spring tide2. The deployment period in July 2022 coincided with extreme high tides (also called “King Tides”).
Water volume flux and water velocity measurements (m s−1) obtained from the TCM-4 Shallow Water (SW) Tilt Current Meters were utilized to create rating curves illustrating water volume flux and water level for each exchange point. To accommodate the bidirectional water flow in the channel caused by tidal forcing, water volume flux was calculated for a complete tidal cycle at the subsequent tidal stages: spring influx; spring outflux; neap influx; neap outflux. The cycle exhibiting the highest tidal amplitude was chosen to represent the spring tide, whereas the cycle with the lowest tidal amplitude was selected to represent the neap tide. The data was divided into influx and outflux segments based on flow direction as the switch in flow direction did not always occur at pressure maximum/minimum. Rating curves were then generated using the following equation for spring influx, spring outflux, neap influx, neap outflux:
φ = wdv
Water volume flux (φ) is a function of the respective channel width (w), the water level (d) and water velocity (m s−1) changing over time (v), [4,16,17]. Adapting methods used by Moehlenkamp at al. (2019), rating curves were fitted using a polyfit function with a best-fit line and 95% confidence intervals in Matlab3 (The MathWorks Inc., Natick, MA, USA). Mean and maximum and relative water volume flux percentage for each exchange point were calculated for four tidal cycles. To account for varying tidal cycle length resulting from mixed semidiurnal tides in Kane‘ohe Bay, flow rates for each exchange point were normalized by calculating the hourly water volume flux rate. For exchange points with more than one culvert or gap, the area of all culverts/gaps combined (Table 1) was summed up in order to calculate total water volume flux for respective site.
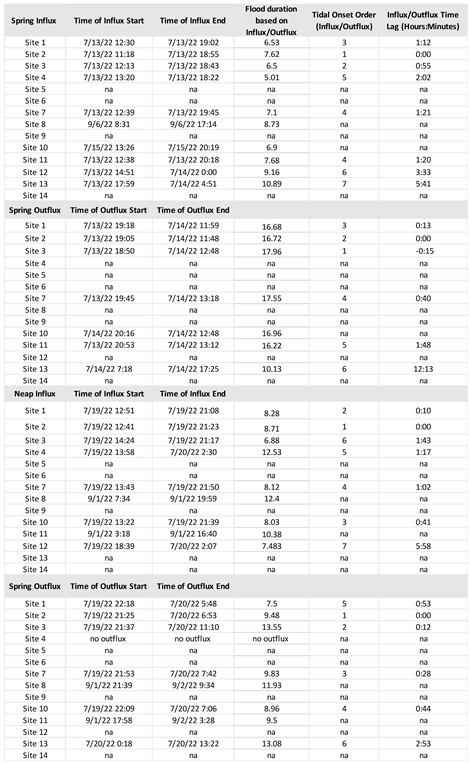
Current meters deployed at Site 8 and Site 11 were flooded4 during the first deployment in July, so Sites 8 and 11 were redeployed in September, 2022. Due to similarity in tidal pattern, we were able to adjust Site 11 at spring influx and outflux back to the original deployment period in July (see Table 3). At Site 8 and during neap tide for both sites, the tidal signal was too different to confidently adjust times back to the original deployment period. For that reason, these sites could not be directly compared in the time lag and tidal onset order comparison (Table 3). Differences in tidal signal – particularly for neap tide – may also cause slight alterations in the relative water volume flux quantifications for Sites 8 and 11.
To contextualize flow data with meteorological conditions, precipitation, wind direction, wind speed, water and air temperature were obtained from a weather station Moku o Lo‘e (21.4339 N, 157.7881 W), ~ 3 km from Nuʻupia Pond (Figure 1A). A sea level gauge equipped with a water temperature probe, positioned approximately 10 meters offshore from the weather station at a depth of around 1 meter, served as the source of tidal reference data.

2.3. Pond Bathymetries, Volumes, and Residence Times

Nuʻupia Ponds volumes were calculated using bathymetric depth measurements recorded by a Deeper Smart Sonar PRO+ 2 (Deeper, Vilnius, Lithuania) in August 2022. During the bathymetry mapping, HOBO® water level loggers (Onset, Bourne, MA, USA) were deployed for reference pressure to record and adjust tidal fluctuations. Further, a second HOBO logger deployed on land was used to correct reference pressure data for atmospheric pressure fluctuations. To account for differences in tidal amplitude across the full tidal spectrum, bathymetry data were adjusted to four tidal stages: Spring High (SH); Spring Low (SL), Neap High (NH), Neap Low (NL). Bathymetry maps and pond volumes were calculated using the DrDepthPC Version 5.1.8. (Per Pelin) program with an interpolation limit of 250 meter and an extrapolation limit of 25 meter to fill in gaps in between measured bathymetry points. The volumes and areas module calculated water volumes, area, as well as maximum, minimum and average depths.
To determine the minimum residence time in Nuʻupia Fishpond, we calculated the volume of water exchanged during the transition from ebb to flood tide for both neap and spring tides, employing methodologies similar to those utilized at Heʻeia fishpond [4,17]. This calculation was conducted using the following equations:
τNPS = Pond Volume Exchanged (spring high tide – spring low tide)
Pond Volume (spring high tide)
τNPN = Pond Volume Exchanged (neap high tide – neap low tide)
Pond Volume (neap high tide)
where τNPS is minimum residence time during spring tide and τNPN is minimum residence time during neap tide. In assessing residence time, we relied on the following assumptions: uniform mixing throughout the water column of Nuʻupia Ponds, consistent flushing cycles across all locations, and exclusive water exchange occurring at designated exchange points (Sites 1–14) based on the following equation:
ϕx = 0.01
Here, ϕx represents the percentage of water that remains after one flushing cycle and x denotes the residence time in flushing cycles required to mix the initial water to a 1% dilution [4,17].

3. Results

3.1. Characterization of Meteorological Conditions
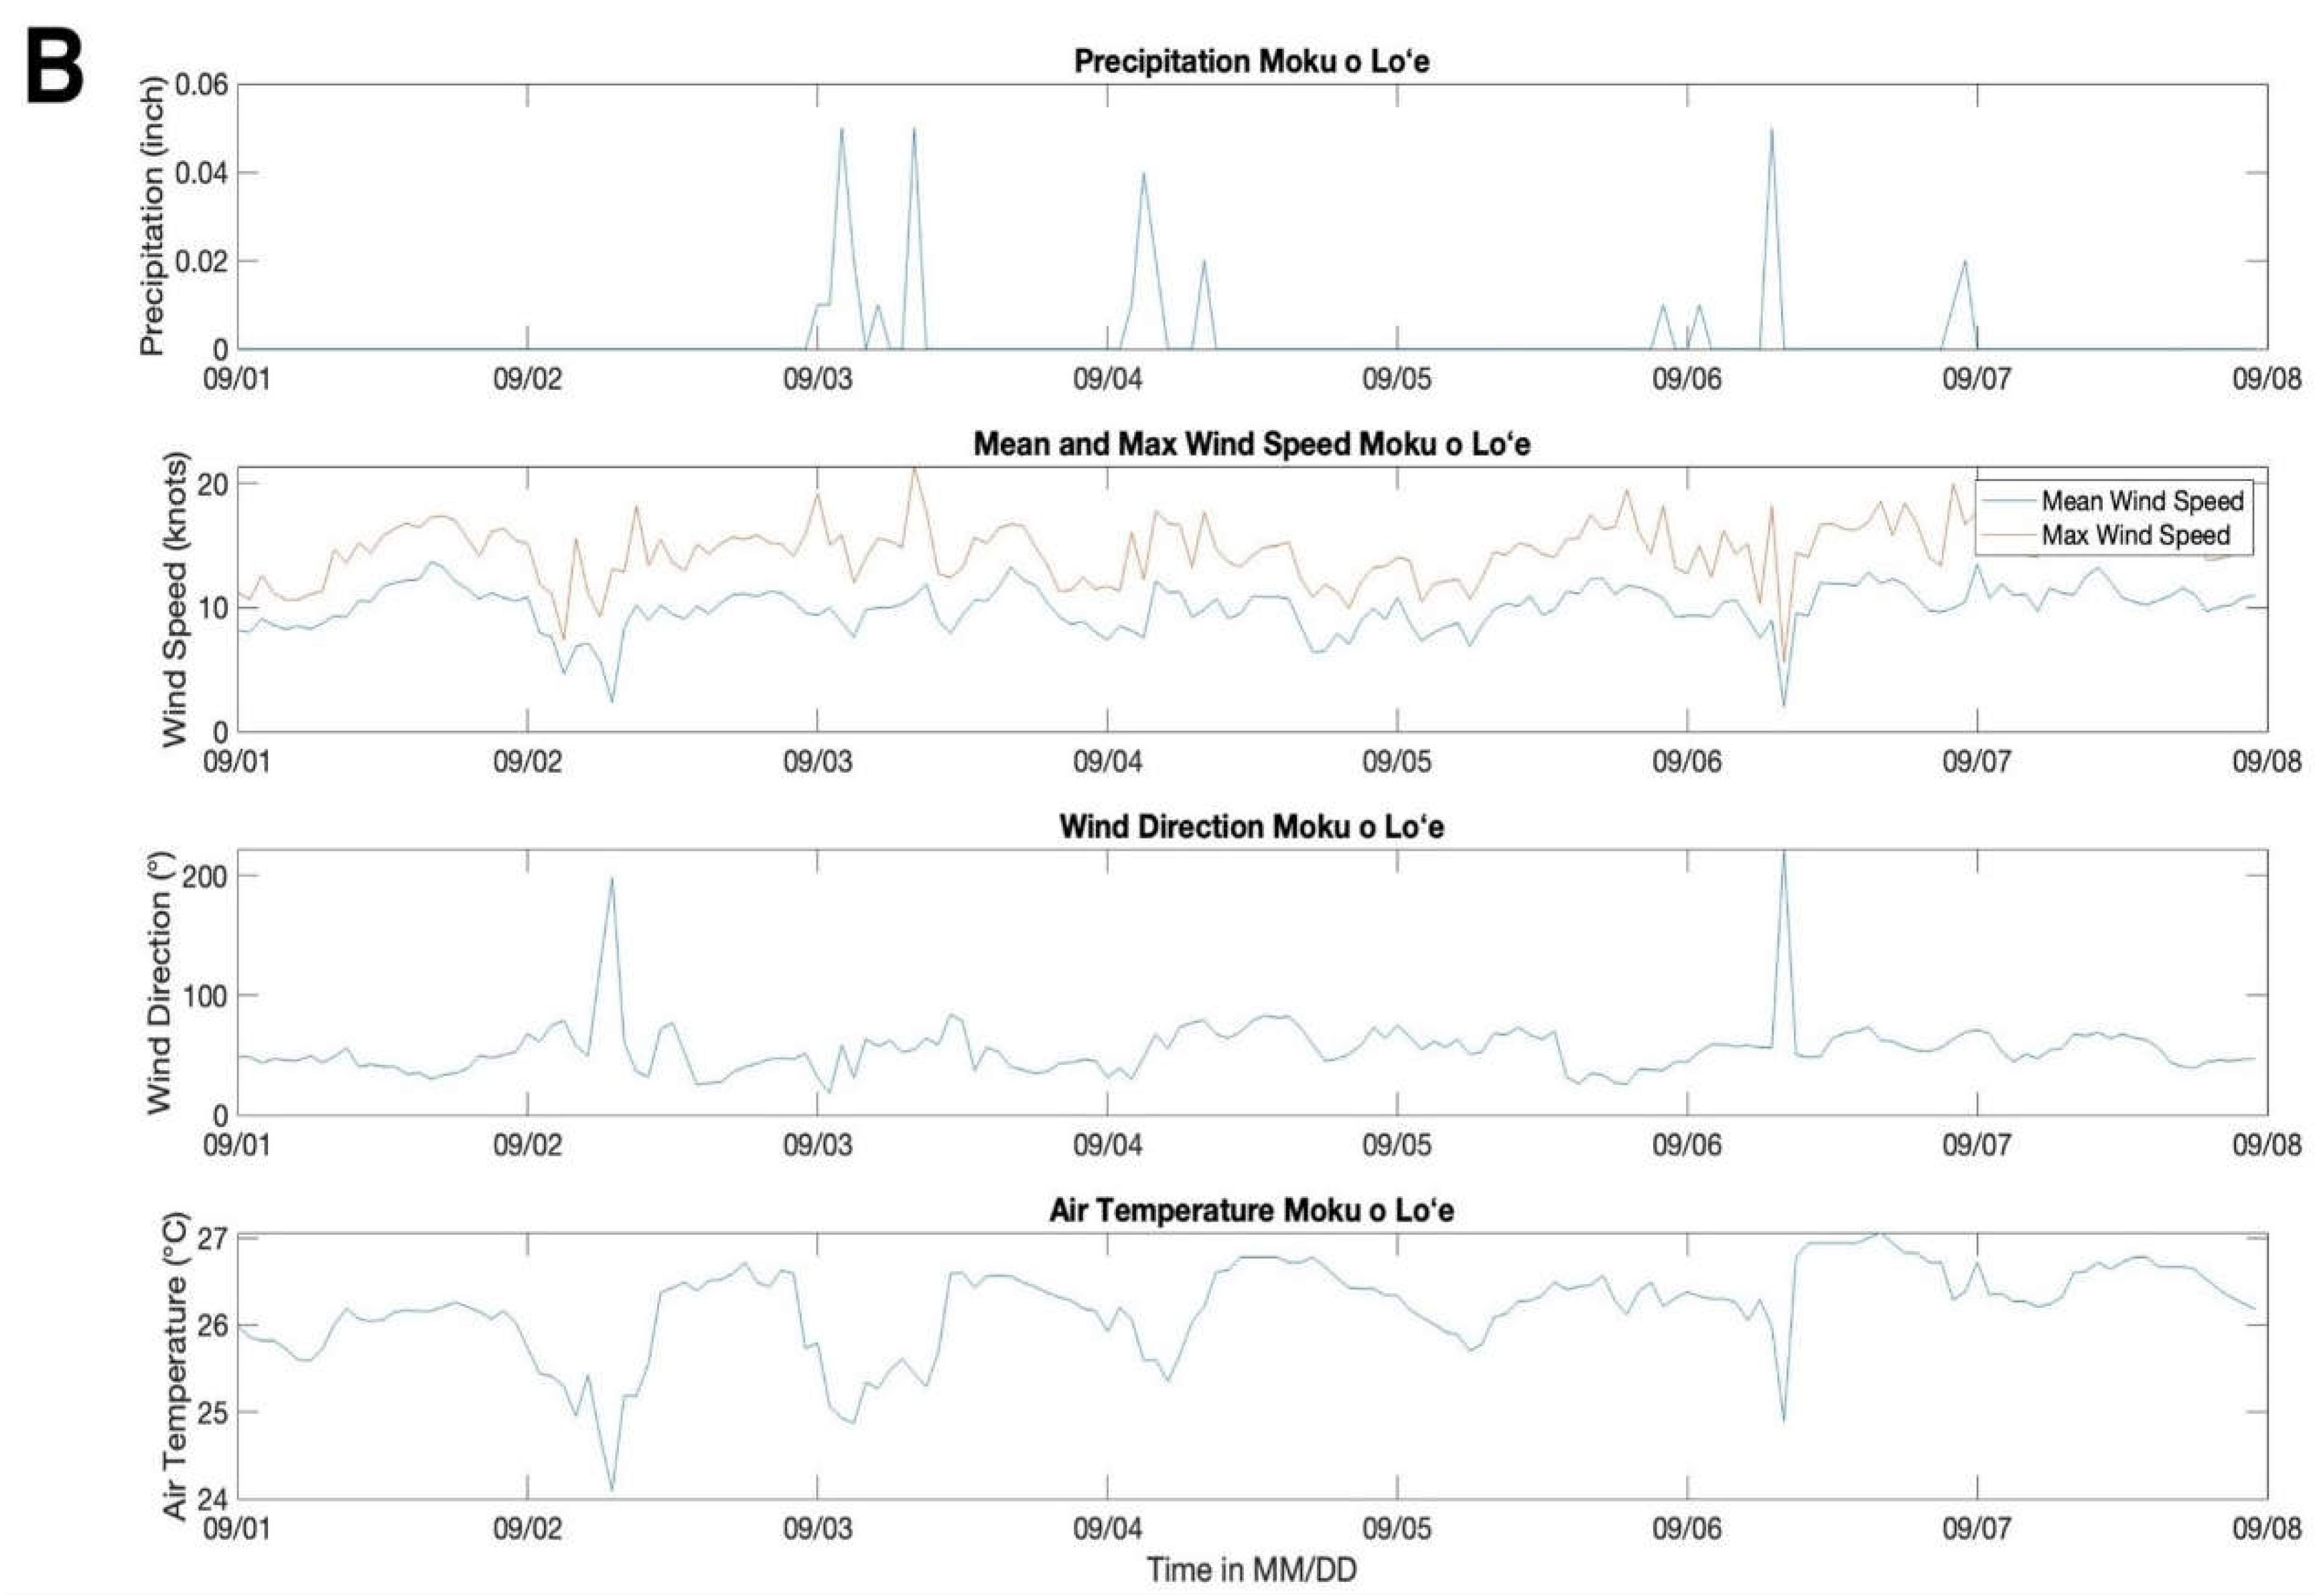
Meteorological conditions were typical for the Hawaiian dry season [16]. Rainfall was minimal during both deployment periods and ranged from 0.00 to 0.02 inch in July 2022 and 0.00 to 0.05 inch in September 2022 (Figure 3). Wind direction primarily ranged from NE to E in both the July and September deployment with a mean wind direction of ~48° ± 10 s.d. in July and a mean wind direction of ~55° ± 22 s.d. in September. Wind magnitudes ranged from 10 to 23 knots in July with mean winds of 10 knots ± 1 s.d. and from 2 to 21 knots in September with mean winds of 10 knots ± 1.8 s.d (Figure 3). Air temperature was very consistent during the deployment period with a mean temperature of 25°C ± 0.44 s.d. Ib July and 26°C ± 0.5 s.d. in September (Figure 3).
Figure 3. Meteorological data from the weather station at Moku o Loʻe. Precipitation (inch), max and average wind speed (knots), wind direction (°), and air temperature (°C) at the main deployment period in July and the redeployment for Site 8 and 11 in September.
Preprints 109193 g003

3.2. Characterizing Water Volume Flux

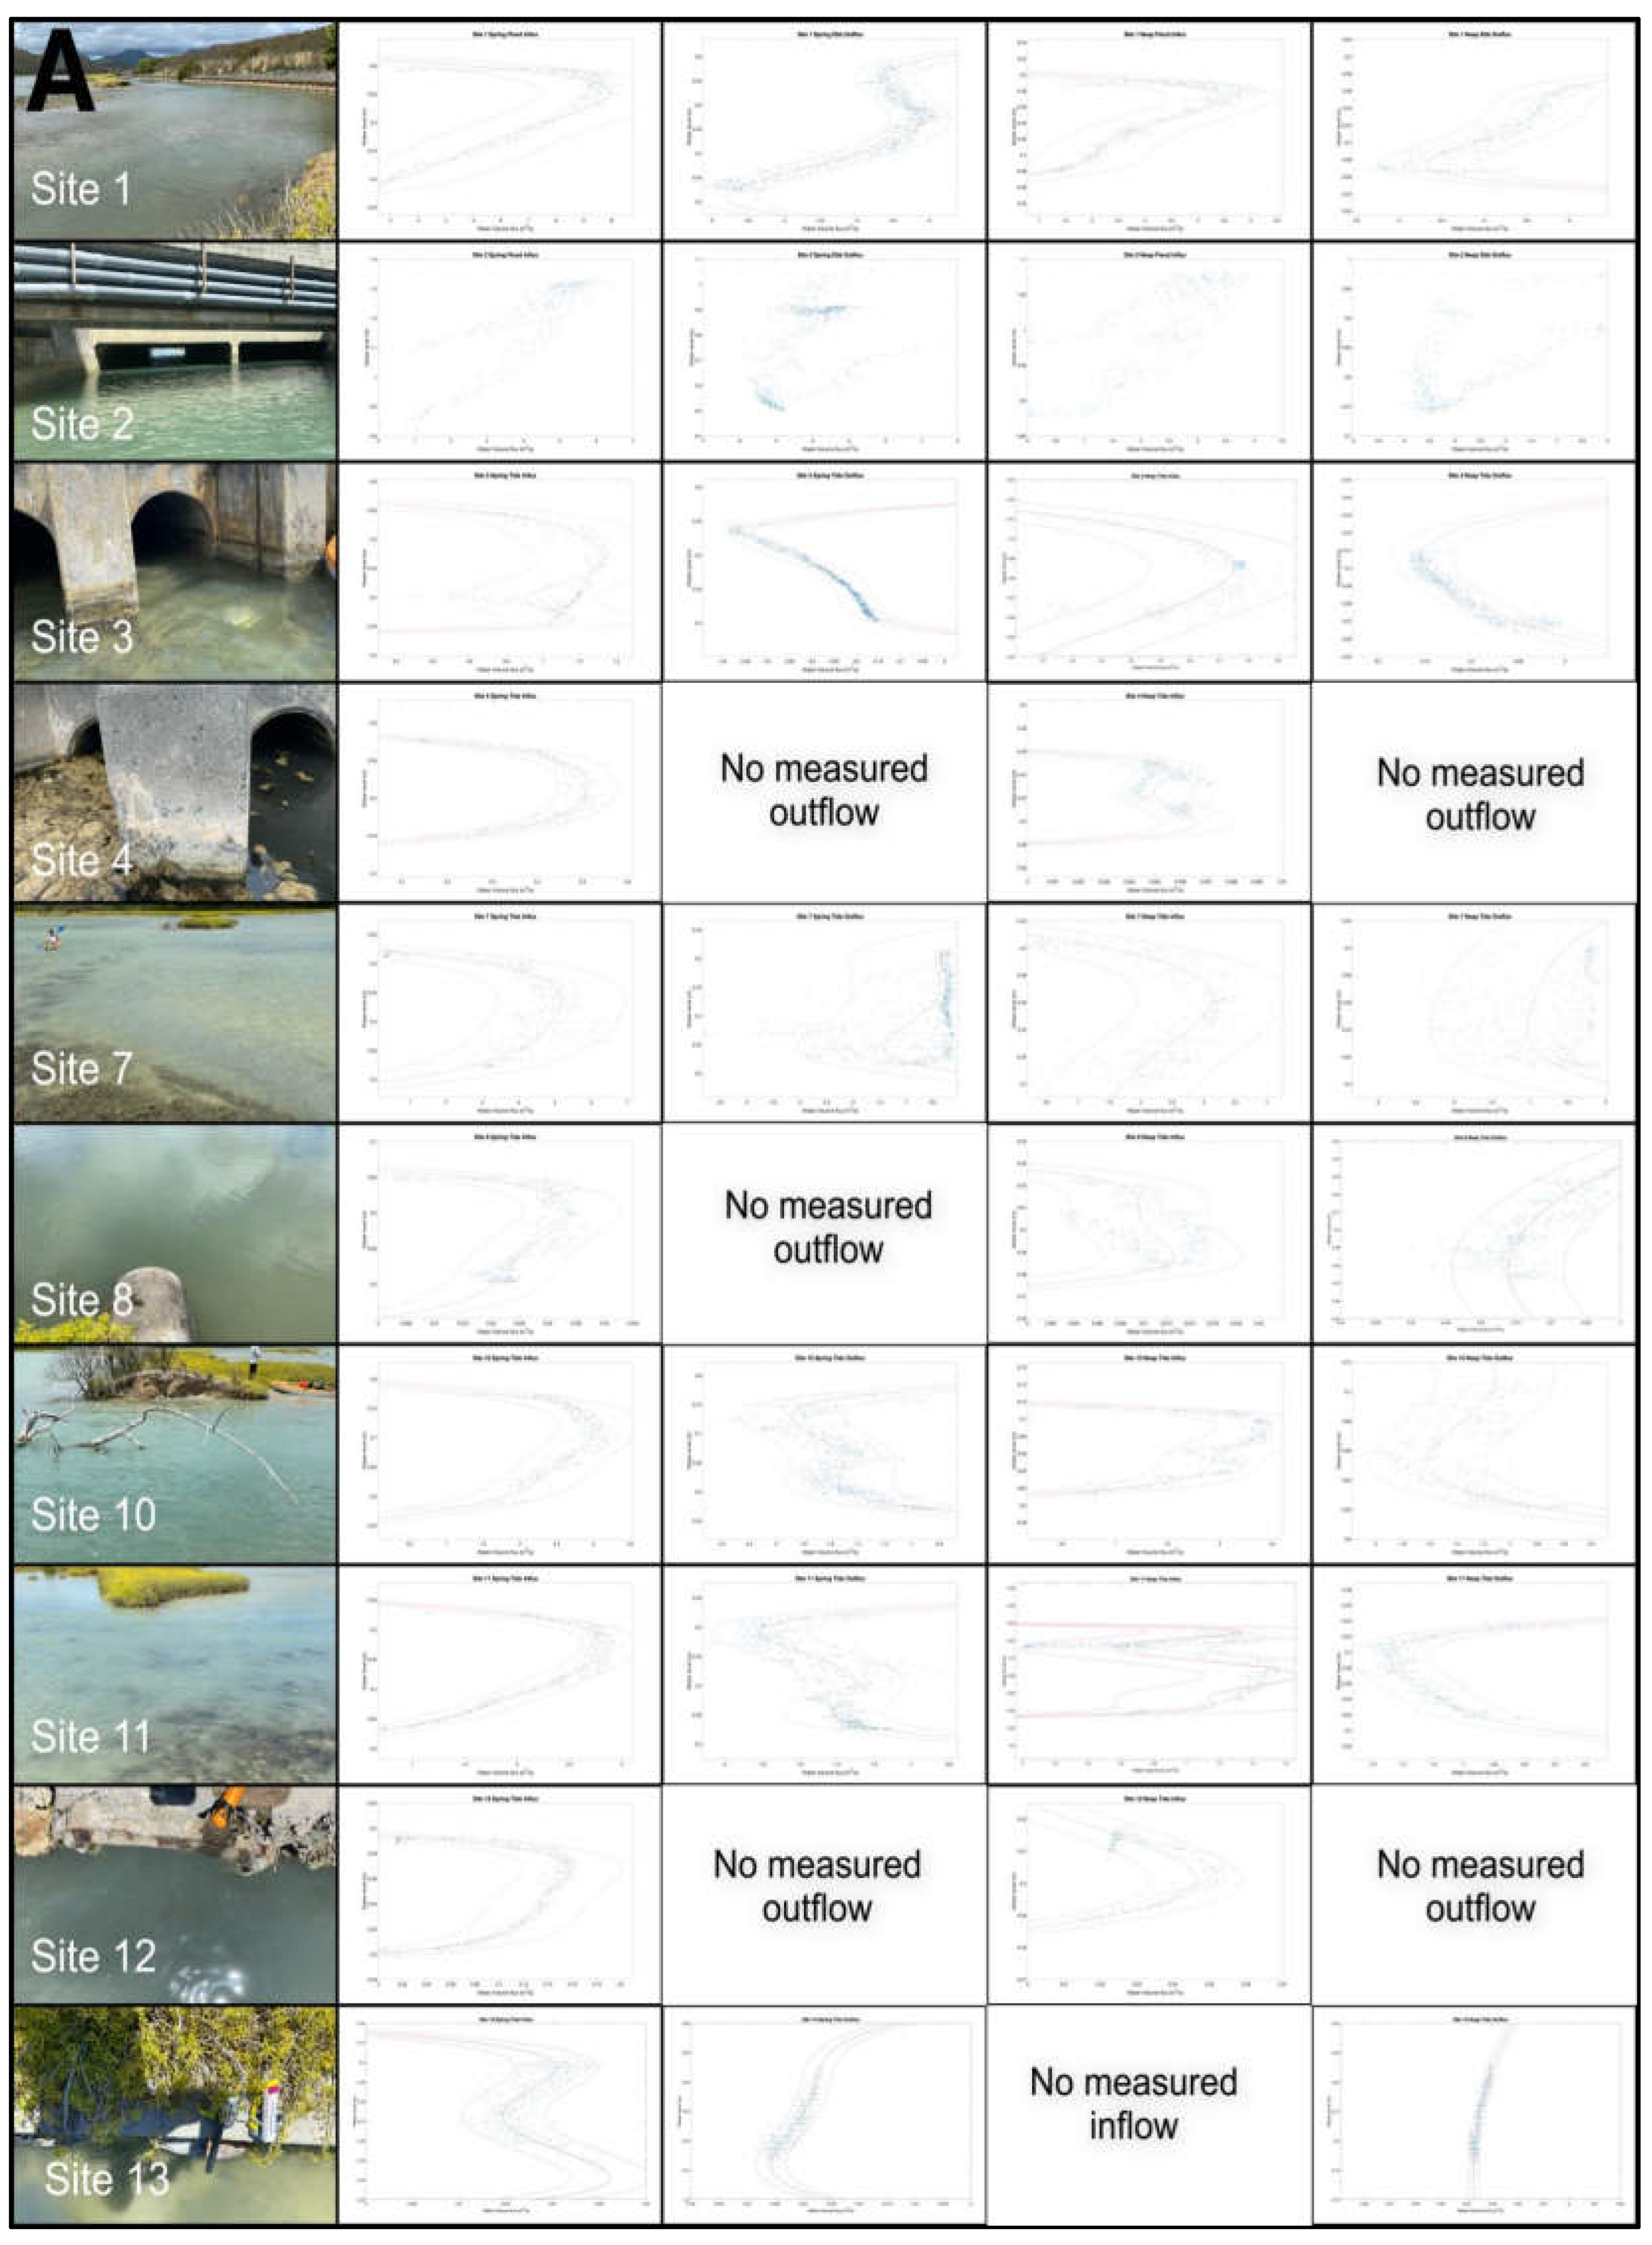
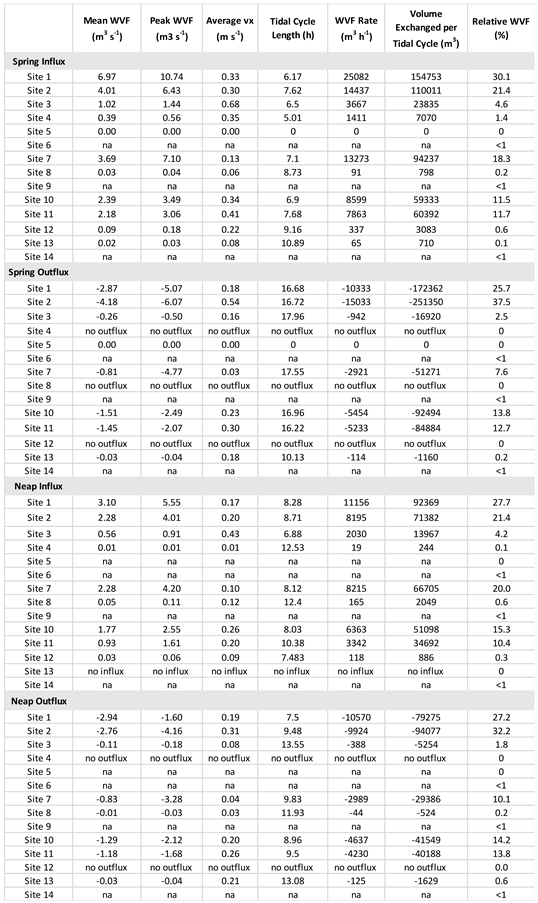
Bi-directional flow was recorded at eight out of the ten exchange points, mediated by the semi-diurnal tidal cycle in Kane‘ohe Bay (Table 2, Figure 4A). The change in water flow direction from influx to outflux and vice versa did not always correlate with the time of low and high slack water. For that reason, the onset of flood tide was defined as a switch in current direction to influx and, conversely, the ebb tide onset was defined as a switch in current direction to outflux. Thus, water volume flux is described here as spring influx, spring outflux, neap influx and neap outflux.
In the beginning of the tidal cycle, after the switch in current direction, water volume flux slowly increases. Water volume flux is typically at its maximum mid-way through the tidal cycle and decreases again towards the end of the tidal cycle (Figure 4A). Since peak water volume flux often happens midway through the tidal cycle, the correlation between water level and water volume flux, represented by the rating curve, typically exhibits a "C" curve or vertical sine function shape (Figure 4A); [4]. Flushing in Nuʻupia Ponds is dominated by the western exchange points connected to Kāneʻohe Bay for all tidal stages: At all measured exchange points mean and peak water volume flux were highest during spring tides (Table 2, Figure 4A). Site 1 and 2, respectively, recorded the fastest mean water volume flux (6.96 m3 s−1; 4.01 m3 s−1) and peak water volume flux (10.74 m3 s−1; 6.43 m3 s−1) during spring tide influx (Table 2). For spring tide outflux, the fastest mean water volume flux (4.18 m3 s−1; 2.87 m3 s−1) and peak water volume flux (6.07 m3 s−1; 5.07m3 s−1) were recorded at Site 2 and Site 1, respectively. Site 1 and Site 2 also have the fastest mean and peak water volume fluxes for neap tide (Table 2). Medium water volume fluxes were recorded at Site 7, 10 and 11 with mean water volume flux ranging from 0.80 m3 s−1 – 3.8 m3 s−1 and peak water volume flux ranging from 1.6 m3 s−1 – 7.1 m3 s−1 (Table 2). Water volume flux at the remaining sites is significantly lower with mean water volume flux ranging from 0.01 m3 s−1 – 0.4 m3 s−1 and peak water volume flux ranging from 0.04 m3 s−1 – 0.56 m3 s−1 across tidal stages (Table 2). At Site 4 and Site 9 no outflux was recorded during both spring and neap outflux (Figure 4A, Table 2). Further, at Site 8 no outflux was recorded during spring outflux and at Site 13 no influx was observed during neap influx. Some sites displayed unidirectional flow, regardless of the tidal state: Site 4 and 12 did not measure any outflow during both spring and neap outflux and Site 8 did not indicate any spring outflux (Figure 4A, Table 2). Further, Site 13 did not measure any neap influx (Figure 4A, Table 2). At Site 10, pressure recordings were unreliable during the peak of spring tide. For that reason, water volume flux calculations and rating curves were measured for spring tide two tidal cycles later (on July 15th, see Table 3), which does not represent the highest spring tidal spectrum. As a result, we were not able to include Site 10 into the time lag and tidal onset order comparison (Table 3, Figure 6). We can also assume that water volume flux may be slightly higher during actual spring tide.
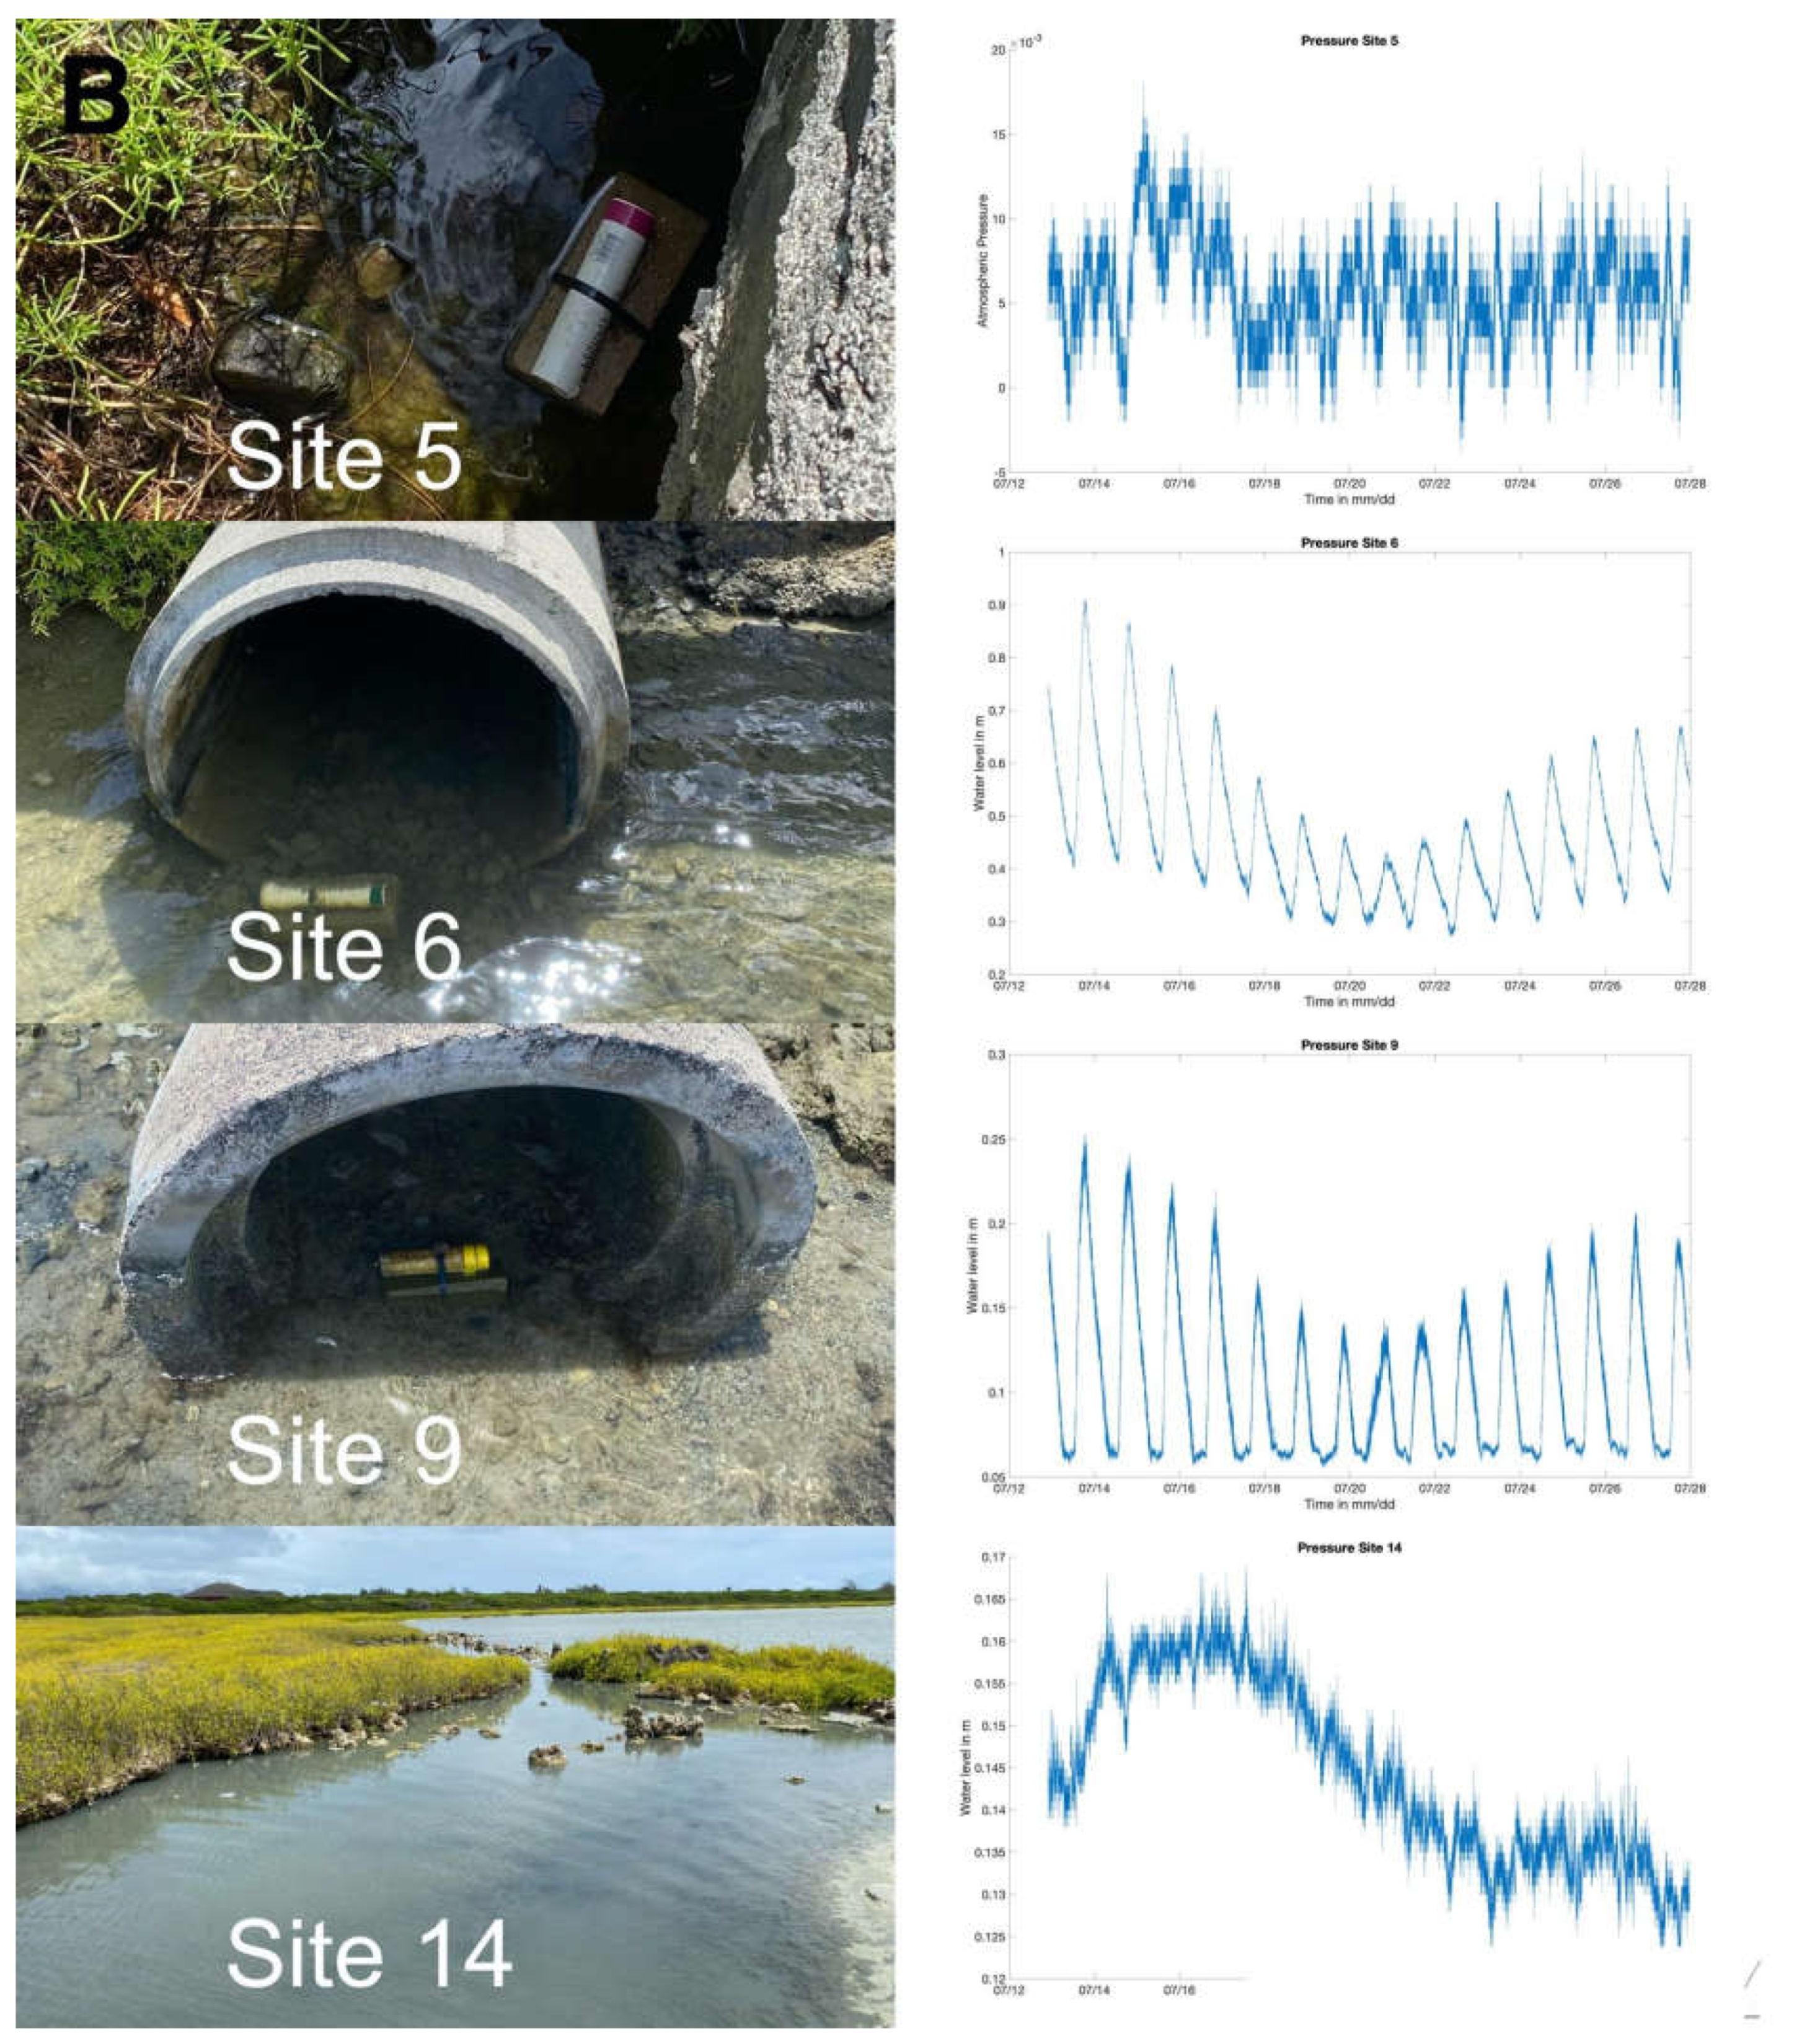
Site 5, 6, 9 and 14 were too shallow for current meter measurements, and only pressure sensor data were recorded (Figure 4B). Site 5 was not submerged and showed only atmospheric pressure measurements during the measurement period (Figure 4B). Site 6 and 9 show a normal tidal signal with water depth ranging from 3–25 cm across the tidal stages (Figure 4B). Pressure at Site 14 does not show a tidal signal but rather an increase in water level during spring tide and a drop in water level moving towards neap tide (Figure 4B).
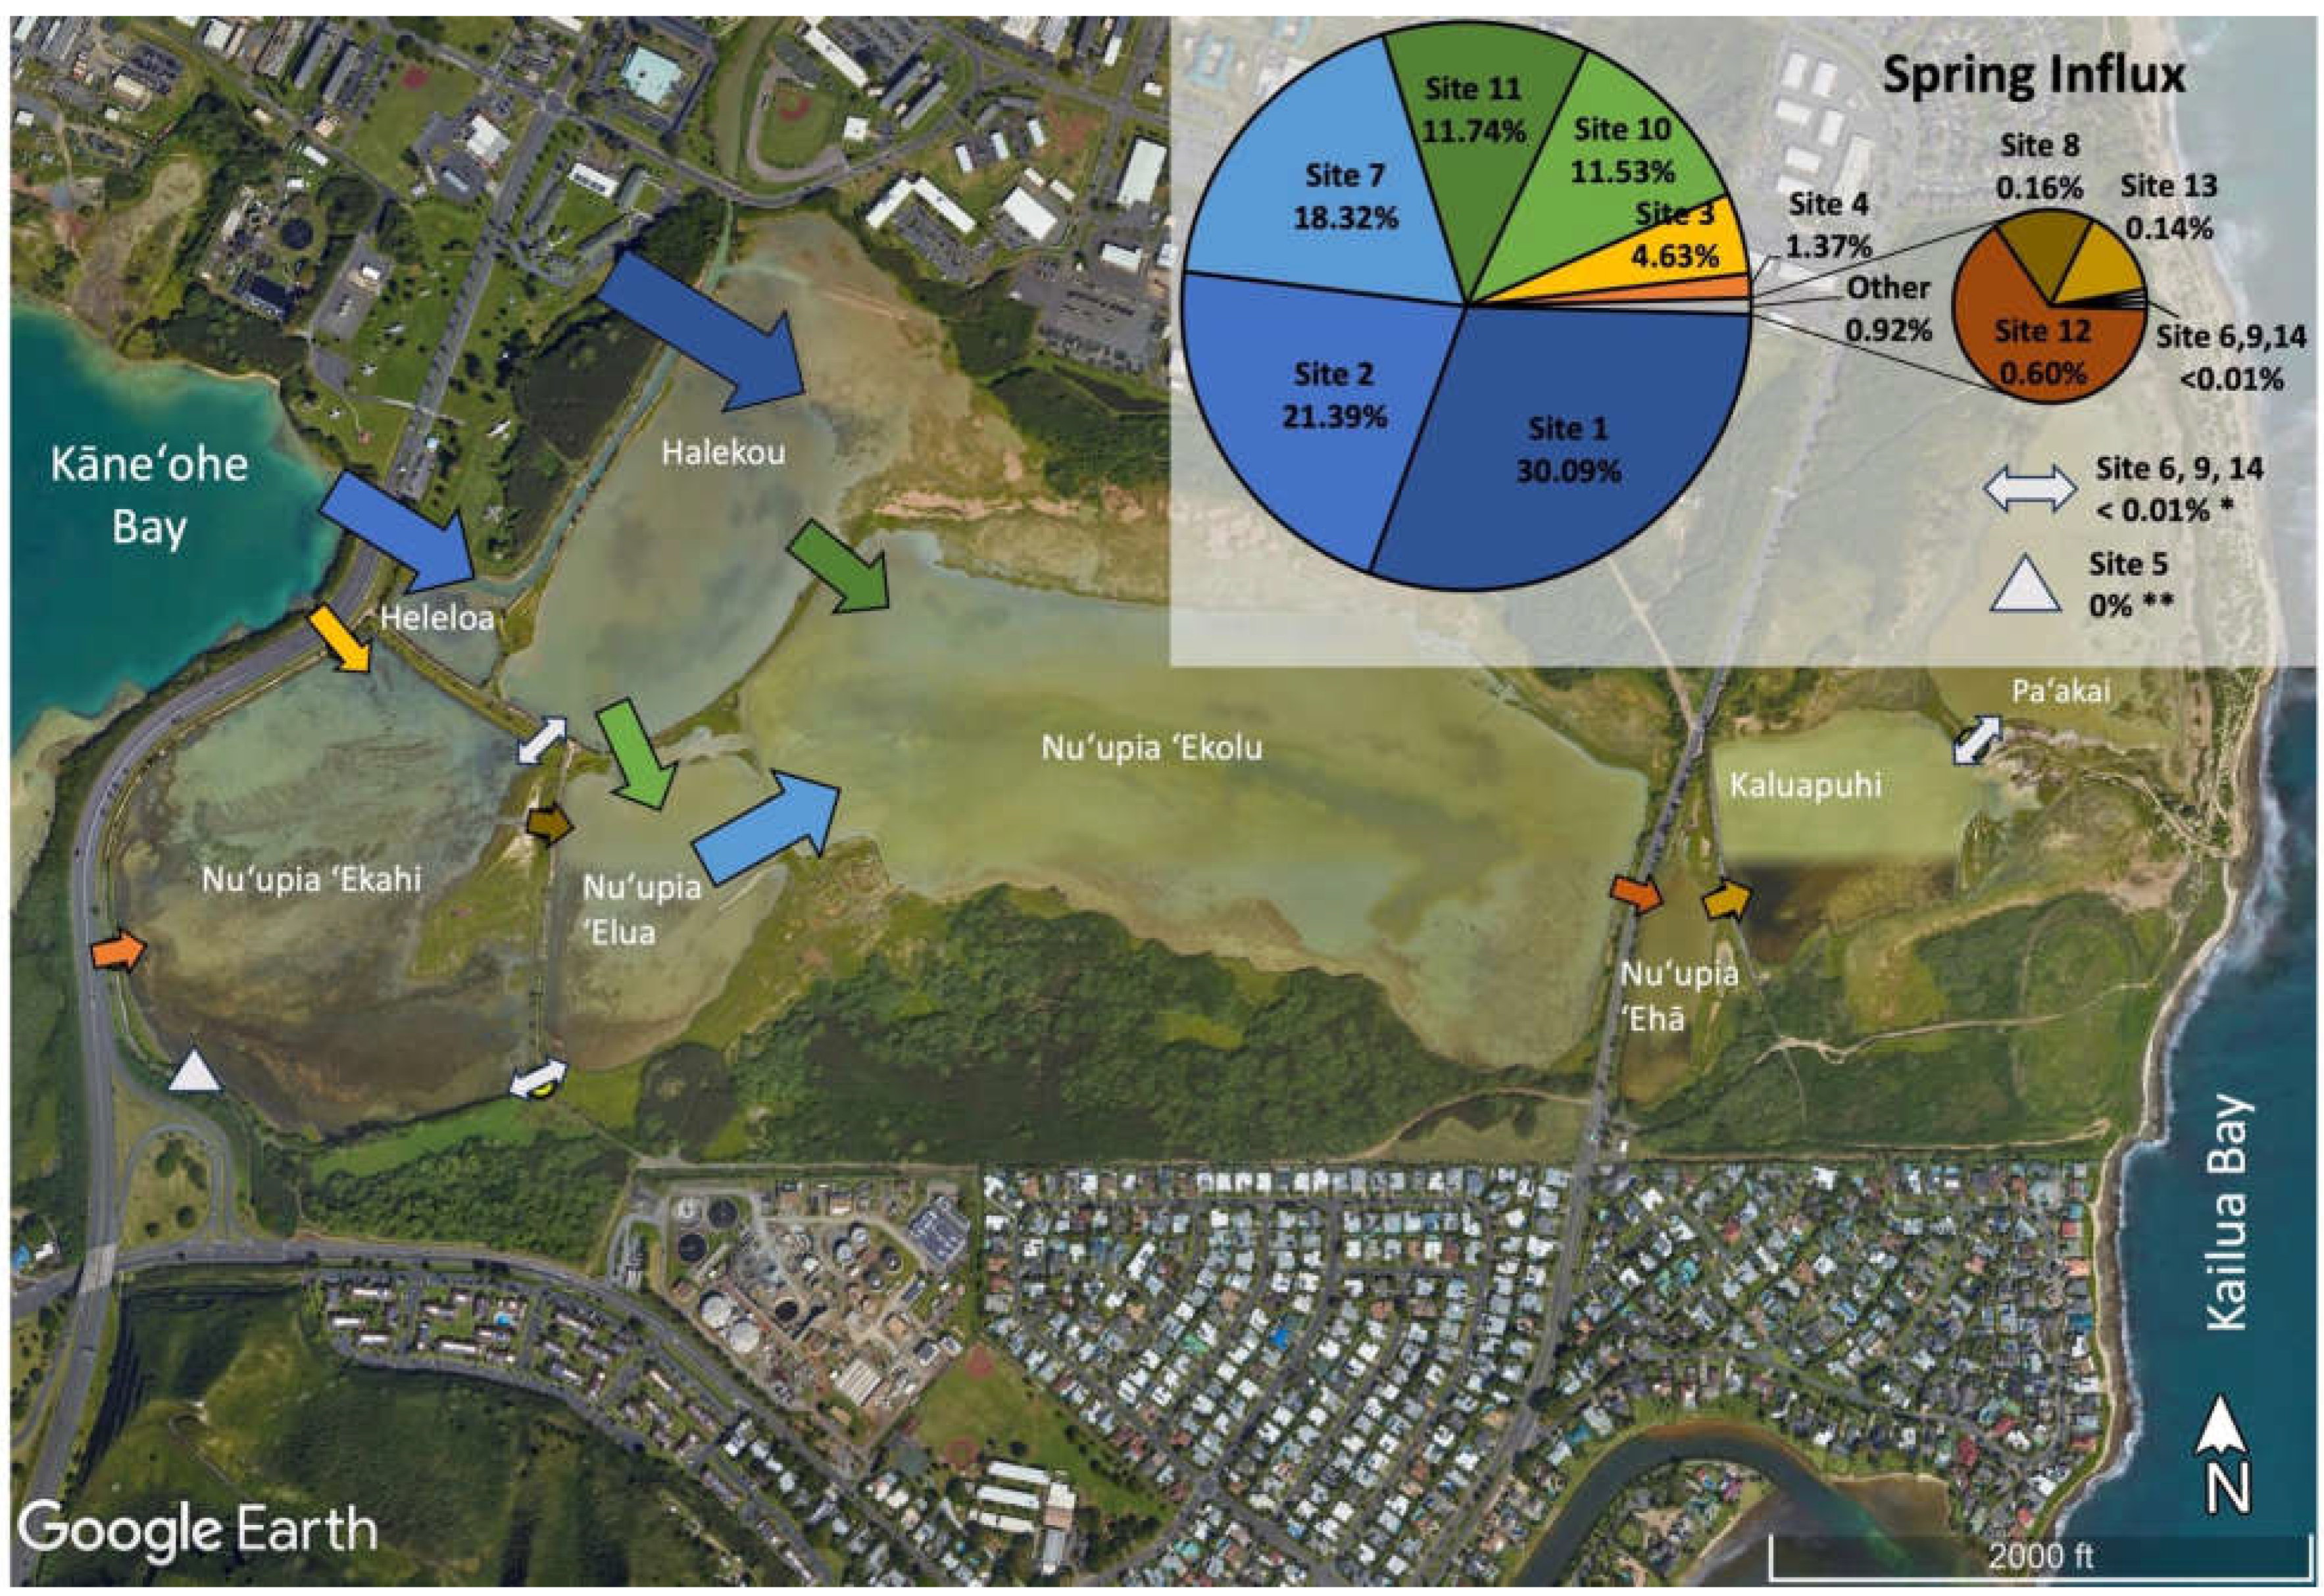
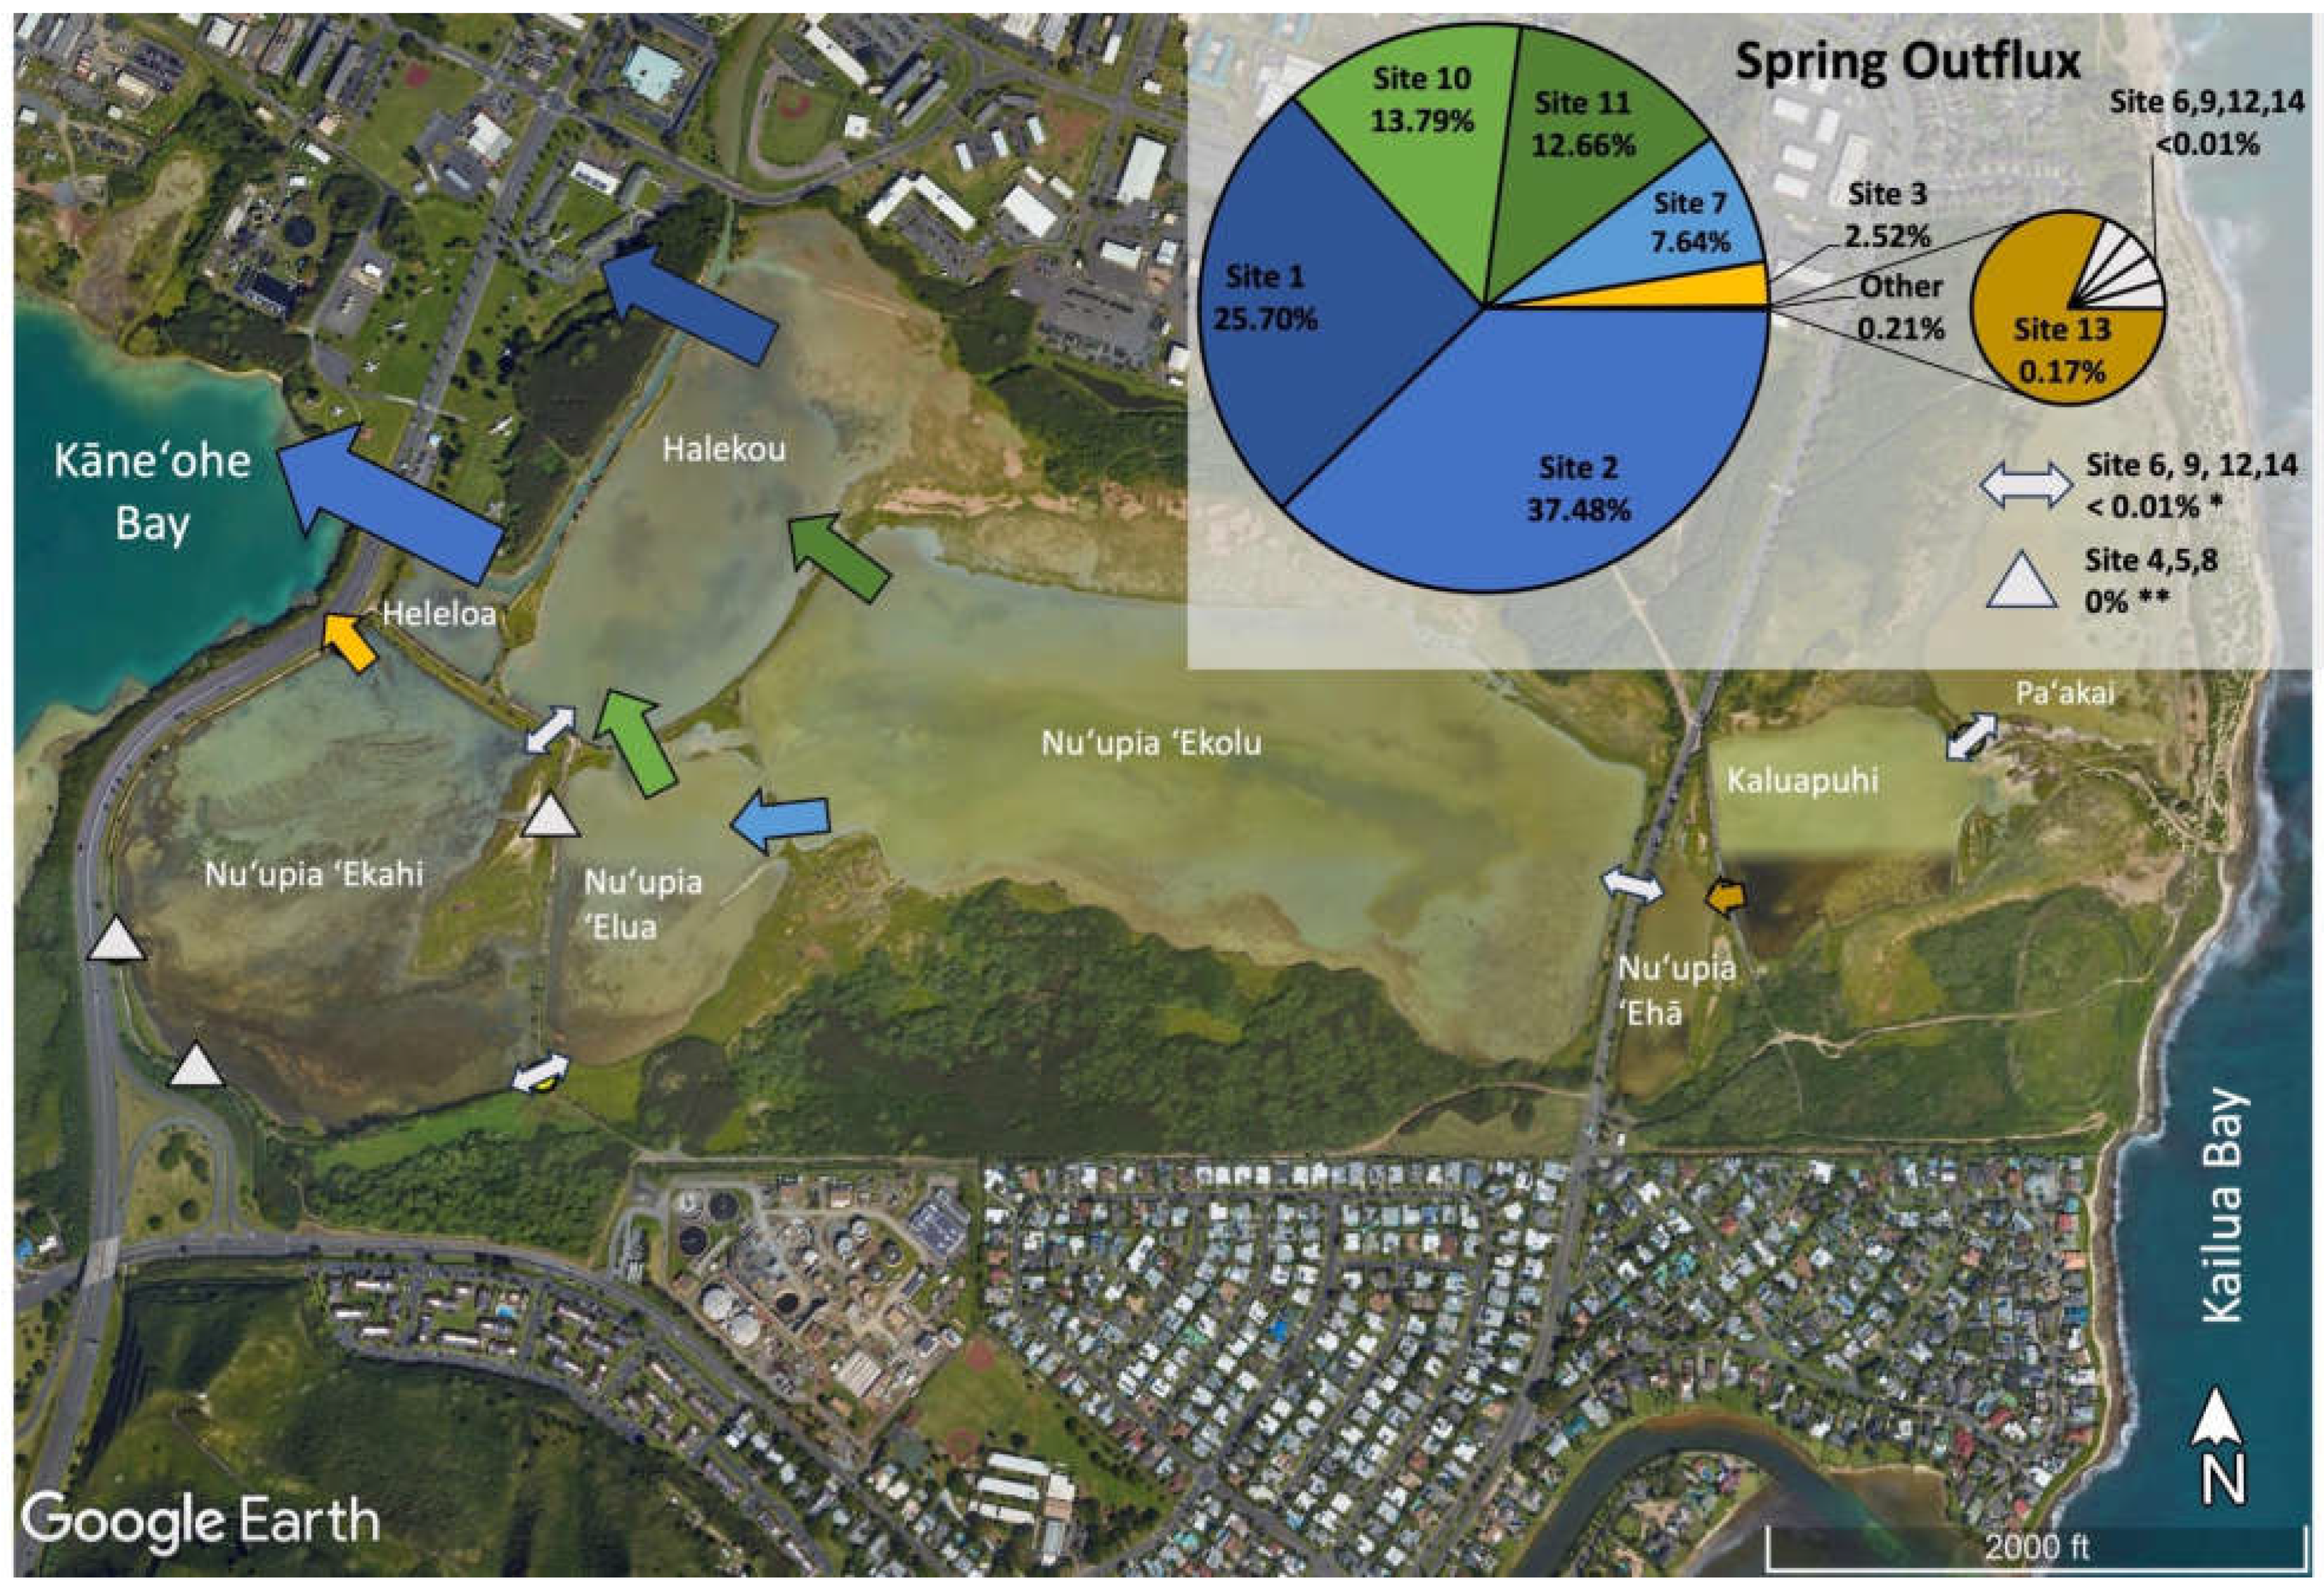
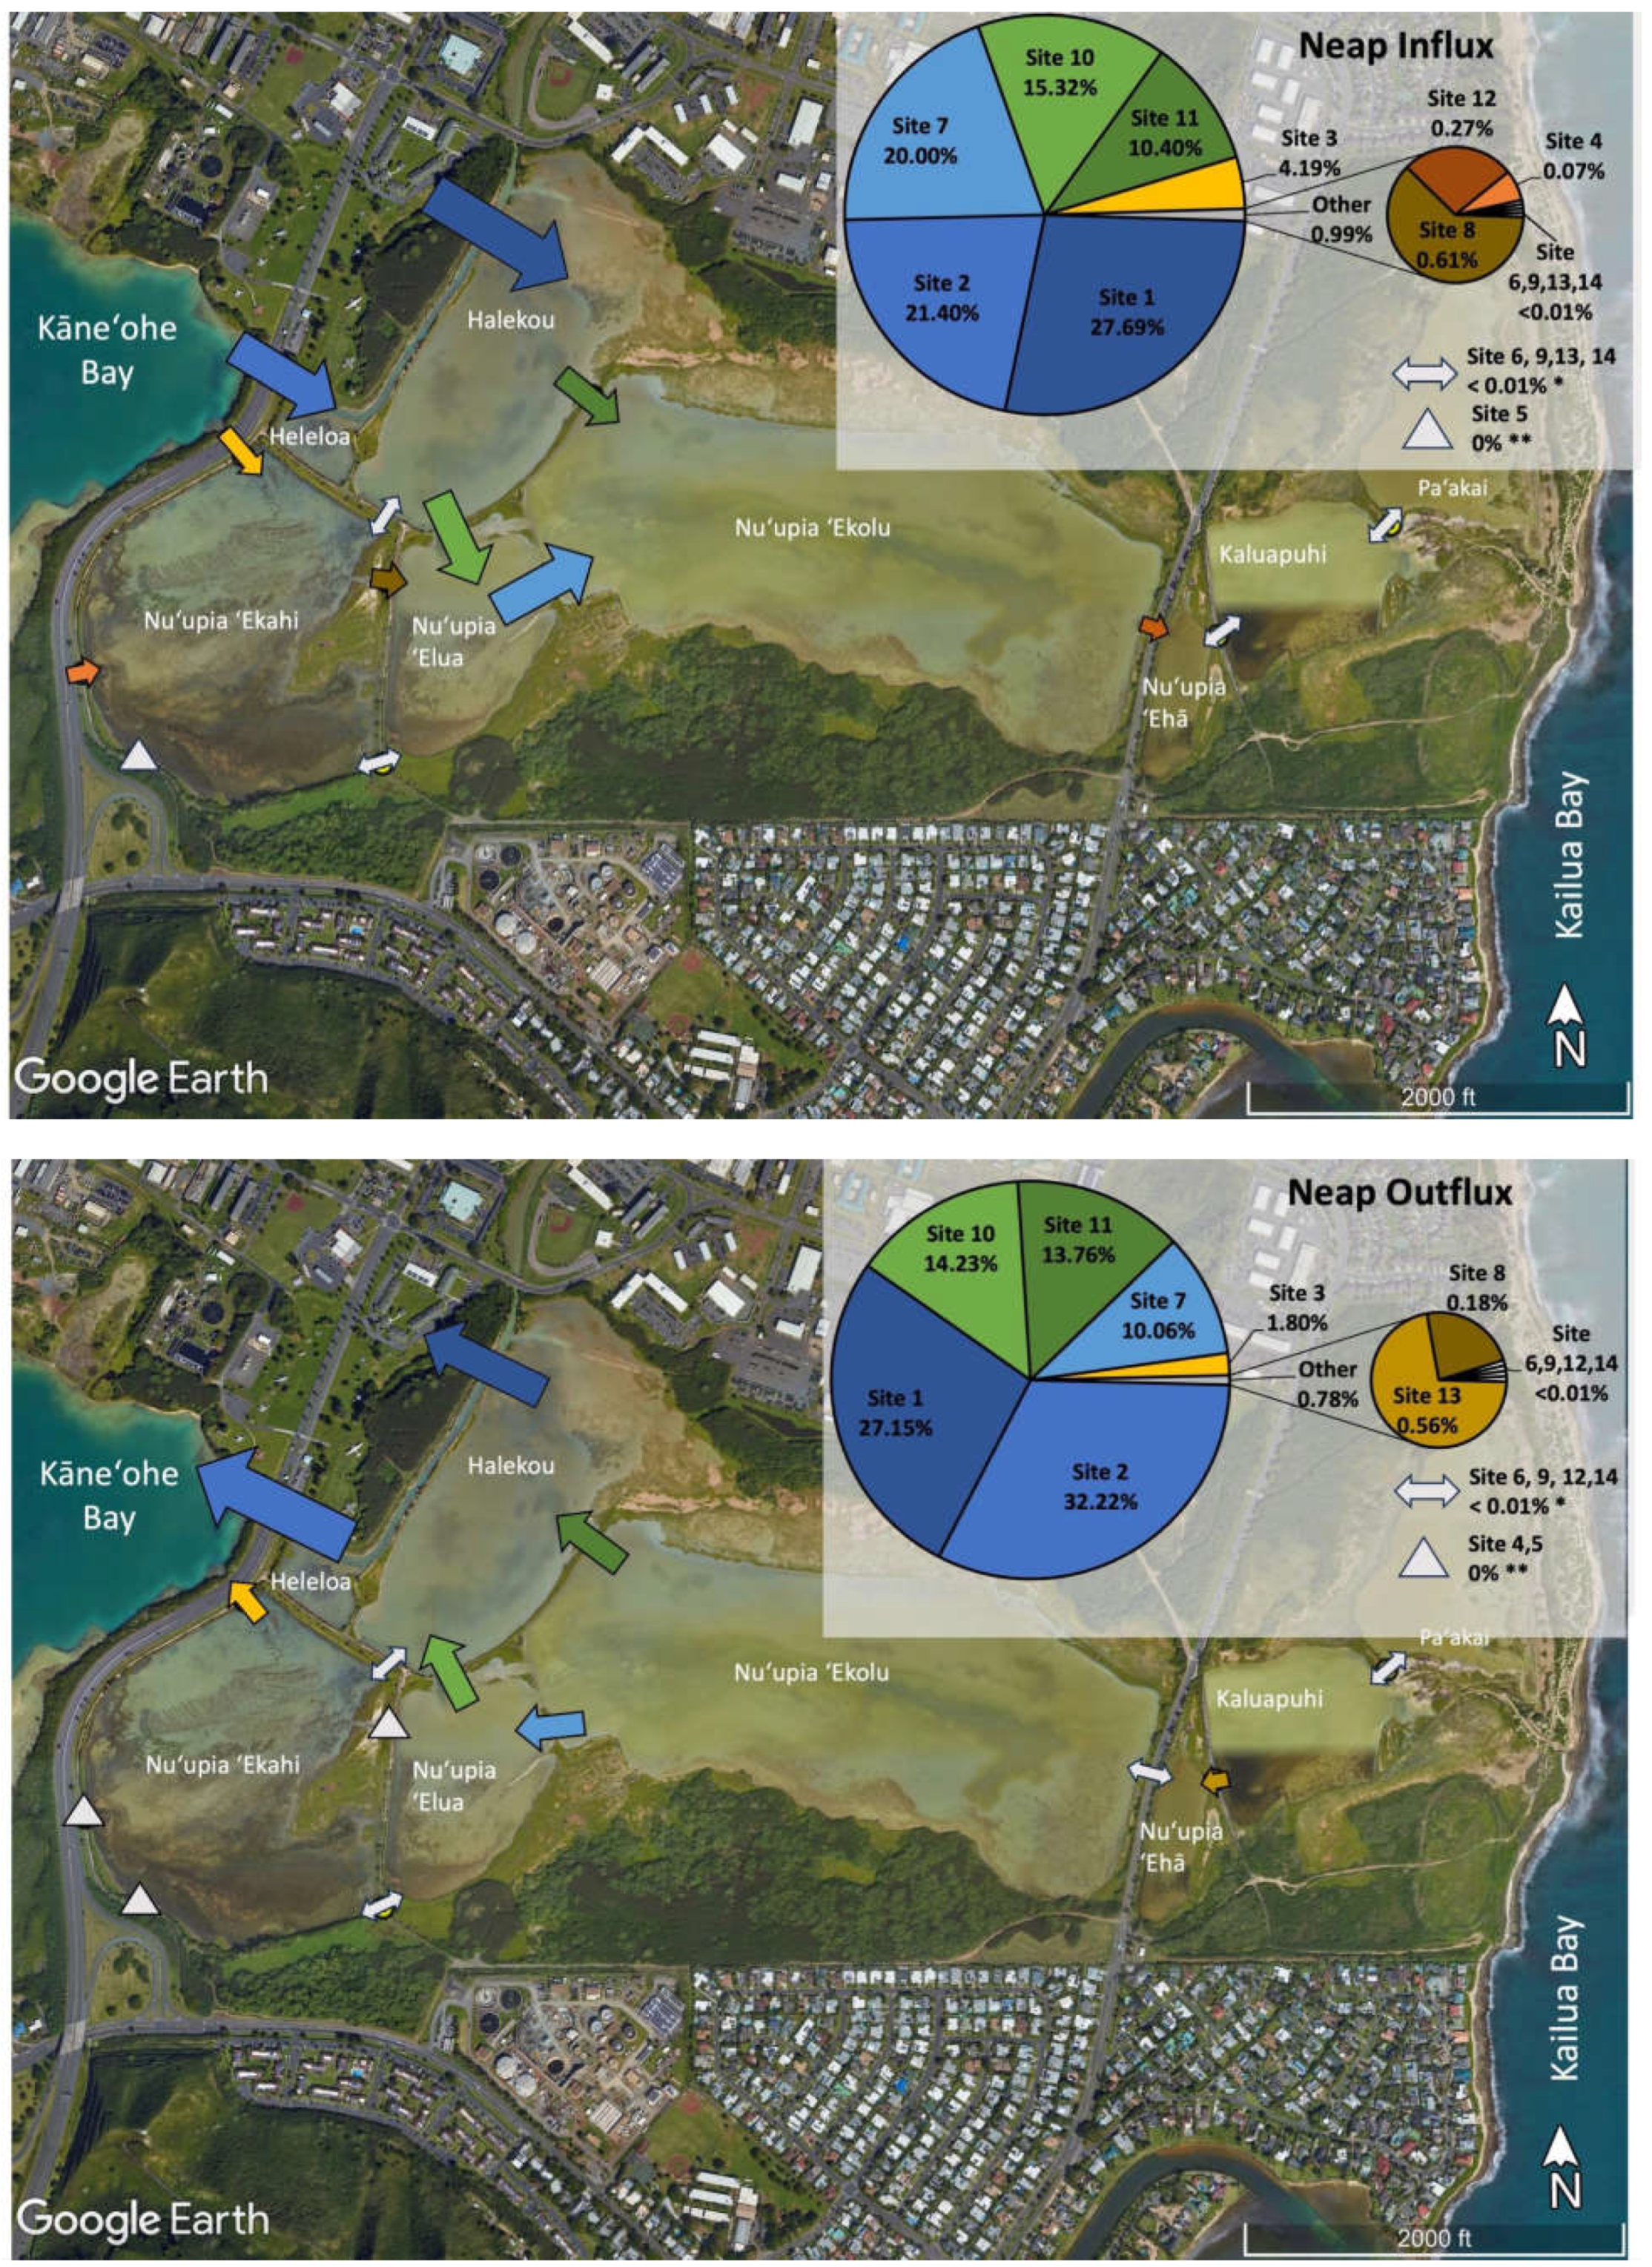
In order to compare the relative volumes of water exchanged at different sites, the relative water exchange contribution of each site in the pond system was assessed during spring influx, spring outflux, neap influx, and neap outflux (Table 2, Figure 5). Overall, we observed the majority of relative water volume flux at locations at the western end of the pond system directly connected Kāneʻohe Bay, while the eastern end of the pond system including Nuʻupia ʻEhā, Kaluapuhi and Paʻakai experienced relatively low flushing. Together Site 1 and 2 accounted for the large majority of total water volume exchanged within the pond system across all tidal stages with a combined relative contribution of ~50 – 60 % (Figure 5). Site 1 and 2 are located at the western end of the pond system and directly connect Kāneʻohe Bay through a dredged channel feeding water into Heleloa and Halekou ponds (Figure 5, Table 2). Site 10 and 11, connecting Halekou to Nuʻupia ʻElua and Nuʻupia ʻEkolu and Site 7, connecting Nuʻupia ʻElua to Nuʻupia ʻEkolu, together accounted for another ~35 – 45 % of total water volume exchanged within the pond system across tidal stages (Figure 5). The nine remaining sites account together for only ~3 – 7 % of total water volume exchanged within the pond system across tidal stages (Figure 5, Table 2). Site 3 and 4, which directly connect Nuʻupia ʻEkahi to Kāneʻohe Bay, are small in size and contribute to 2– 6% of total volume exchanged (Figure 4, Table 1, Table 2). Site 6 and 8 connect Nuʻupia ʻEkahi to Nuʻupia ʻElua, and Site 9 connects Halekou to Nuʻupia ʻEkahi. Together, they account for <1% of total volume exchanged (Figure 5, Table 1, Table 2). The eastern side of the pond system experienced relatively minimal flushing: Site 12, 13 and 14 exchanged <1% of total volume across all tidal stages (Figure 5, Table 1, Table 2).

3.3. Water Flux Lags across Nuʻupia Ponds system
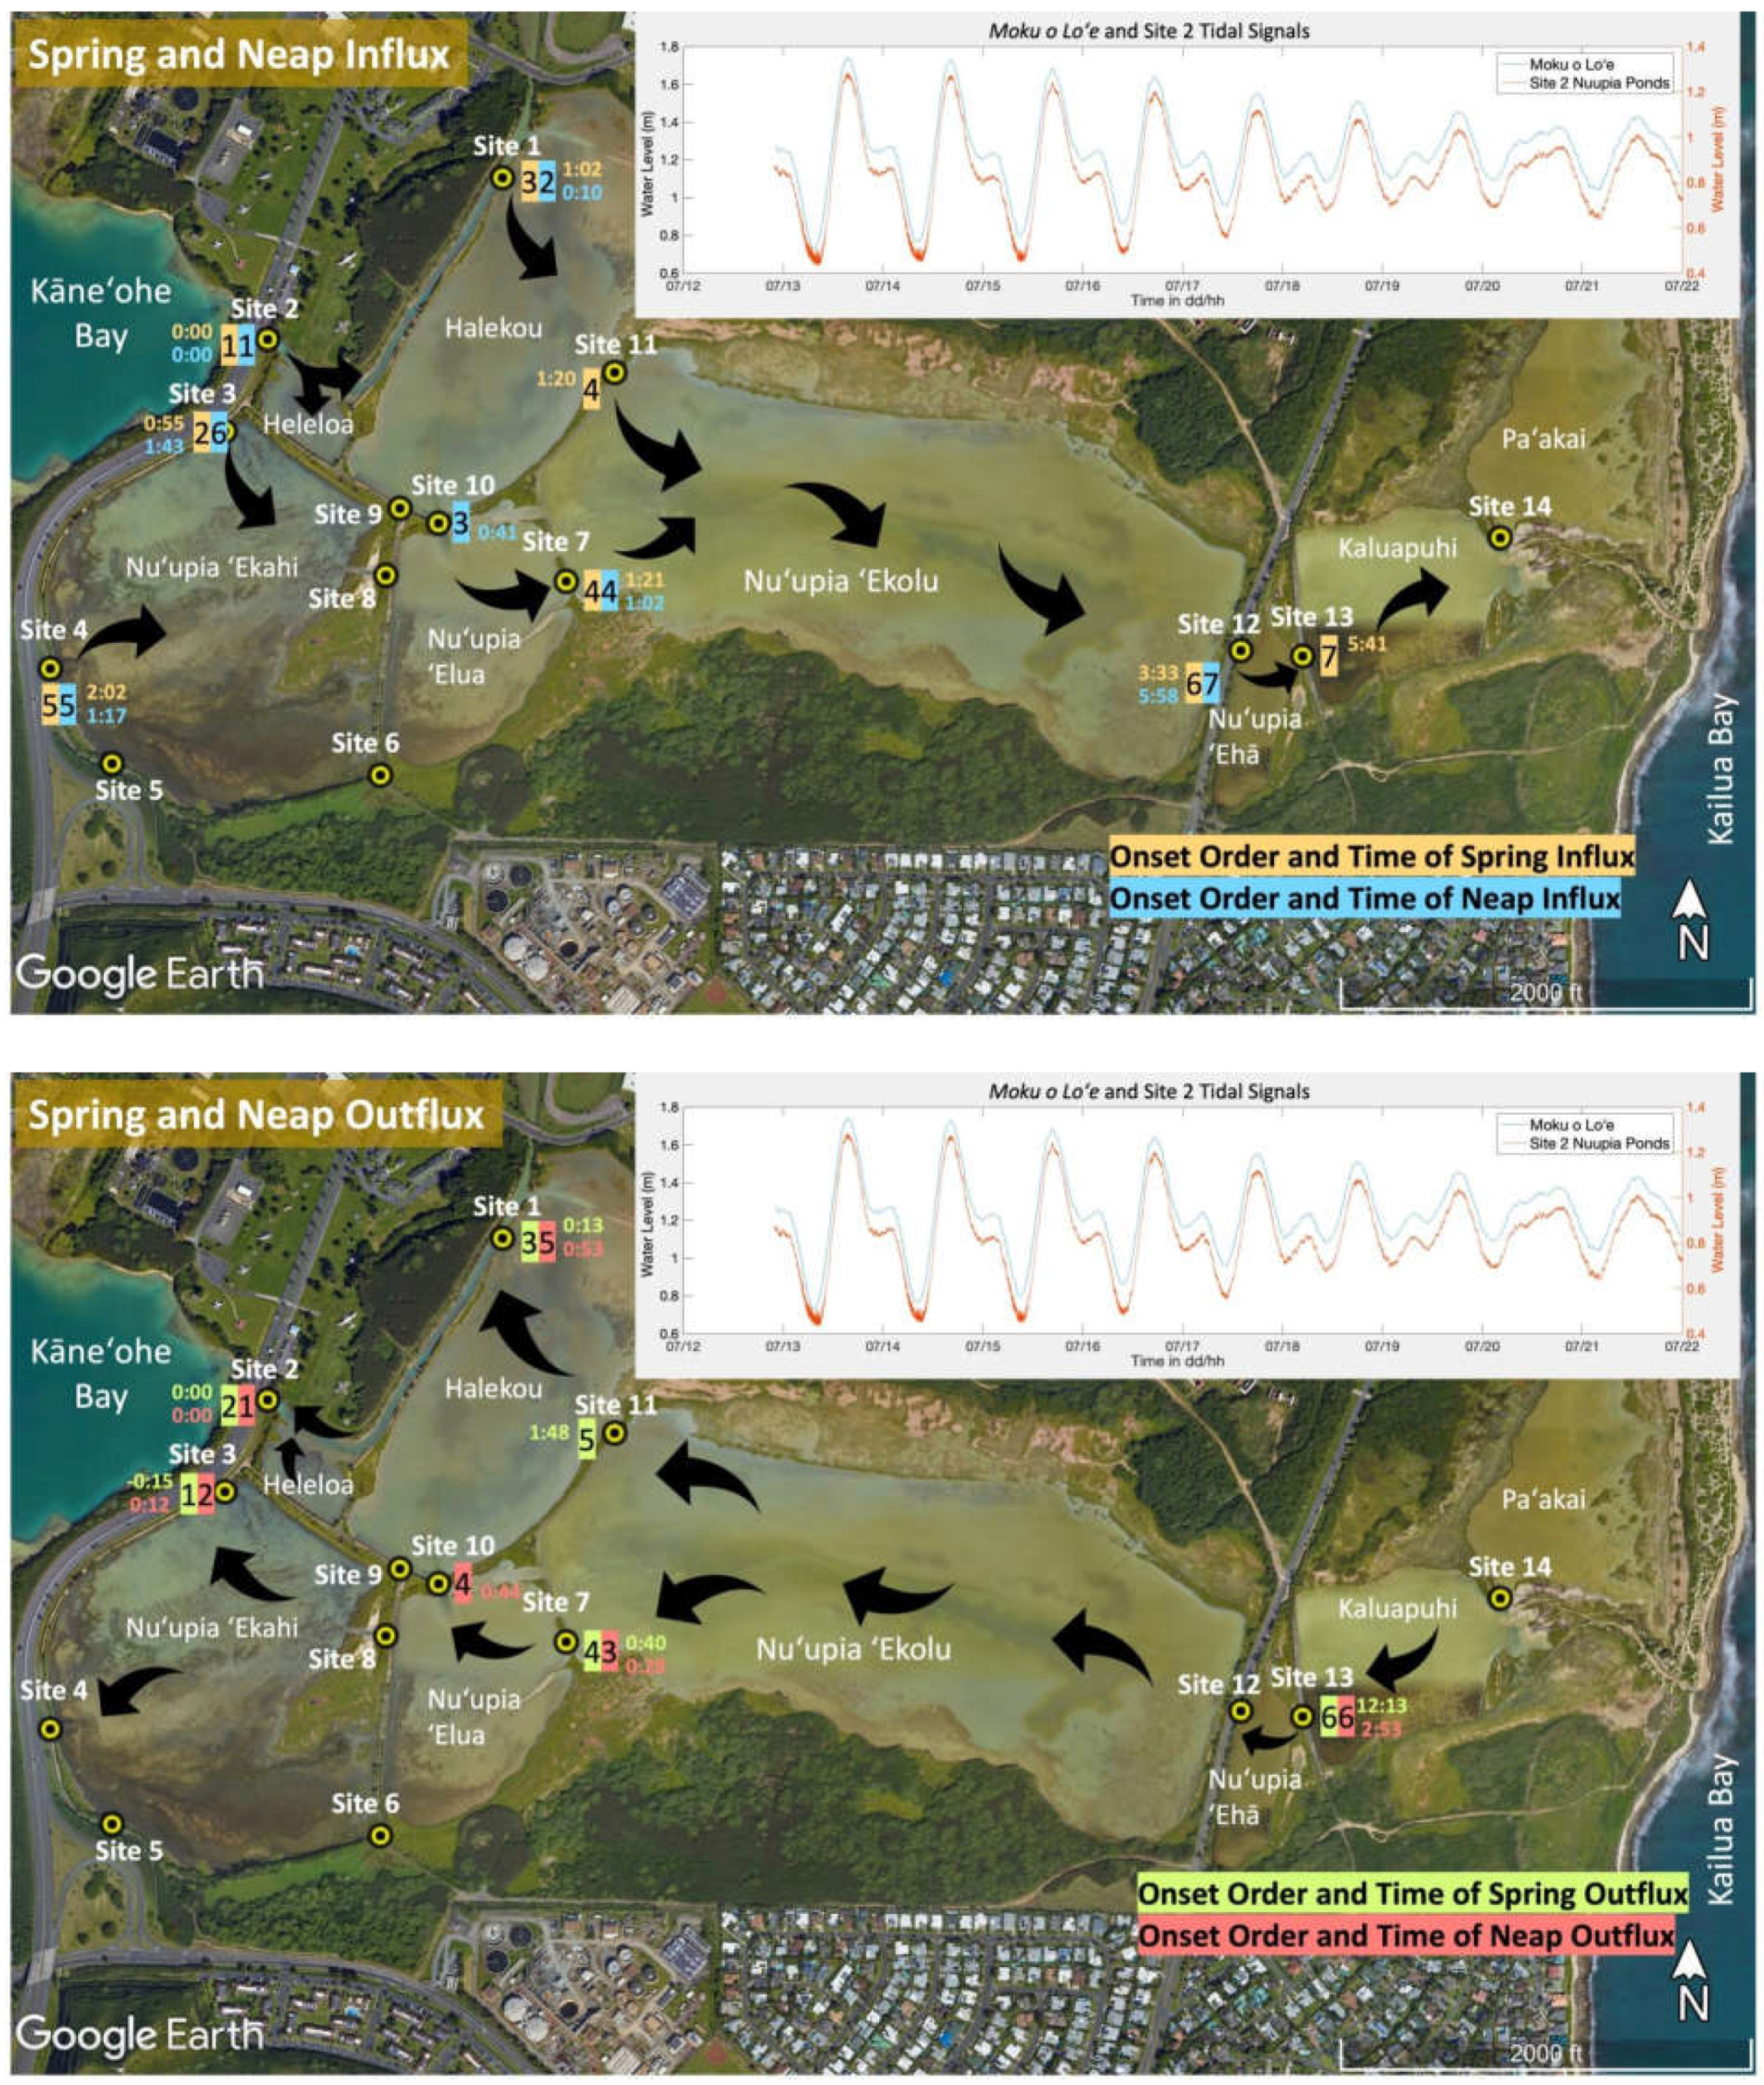
Tracking the times of the onset of inflow and outflow across sites, allowed us to get a better understanding of circulation across the system: Across all tides, we observed a trend of increasing time lag between the onset of influx/outflux among sites with from West to East: Site 2, which directly connects Kāneʻohe Bay through a dredged inflow channel to Nuʻupia Ponds, has a tidal signal that is close to identical with the reference tide at Moku o Loʻe tide gauge in Kāneʻohe Bay (Figure 6). For the purpose of visualizing time lags across the system, Site 2 was defined as time 00:00 in hours:minutes with all other sites showing a time lag in inflow/outflow (Figure 6, Table 3). Time lags became longer from the western to the eastern end of Nuʻupia Ponds system: While sites 2-11 had an average time lag of ~55 minutes across all tidal stages, Sites 12-14 showed an average time lag of ~6 hours (Table 3, Figure 6).
During flood tide, the Nuʻupia Pond system starts filling with Kāneʻohe Bay water at Site 2, closely followed by Site 1, as water starts flowing in through the dredged channel filling Heleloa and Halekou Ponds. Site 3 starts inflowing and filling Nuʻupia ʻEkahi early on during spring influx, but shows a longer lag during neap influx. Nuʻupia ʻElua and Helekou Ponds start filling Nuʻupia ʻEkolu Pond around the same time: Sites 10, 11 and 7 all show time lags similar in range between 40 – 80 minutes. Site 4 has a time lag of 1.3 – 2 hours. Time lags for Sites 6 and 9 are unknown as these sites were too shallow to measure flux. Site 8 had to be redeployed and therefore could not be accounted for in the time lag comparison. Nuʻupia ʻEhā, Kaluapuhi and Paʻakai Ponds fill the latest with time lags measured between 3.5 – 6 hours (Table 3, Figure 6A). Slight variabilities in the order of onset of influx are observed between spring and neap influx (Figure 6A). Nuʻupia Ponds start draining in a similar order. Sites 2 and 3 are the first to switch current direction to outflow, followed in order by Site 1, 7 and 11 during spring tide and Site 7, 10, and 1 for neap tide. Site 13 starts draining last with a particularly long-time lag of 12 hours during spring tide and 3 hours during neap tide (Table 3, Figure 6B).
The duration of tidal cycles was shorter during incoming tides (influx) compared to outgoing tides (outflux) at a majority of exchange points at both spring and neap tide: Mean tidal duration based on influx and outflux was 7.58 ± 1.67 s.d.h. and 9.20 ± 2.08 s.d.h for spring influx and neap influx, respectively, while mean tidal duration was 16.03 ± 2.67 s.d.h and 10.47 ± 2.13 s.d.h for spring outflux and neap outflux, respectively (Table 3). Collectively, the shorter lag time during high water compared to low water, the prolonged duration of dropping tides—especially evident during spring tides—and the enhanced velocities of influx currents indicate that Nuʻupia Ponds primarily experiences flood-dominated dynamics.
Figure 6. Time lag dynamics across Nuʻupia Ponds. For the purpose of visualizing time lags across the system, Site 2 was defined as time 00:00 with all other sites showing a time lag in inflow/outflow visualized with time (in hours: minutes) of onset since time 0:00 at each exchange point. The order of onset is marked with numbers. (A) Time lags for spring and neap influx. (B) Time lags for spring and neap outflux.
Preprints 109193 g006
Table 3. Time lag dynamics in Nuʻupia Ponds. Table shows the time of onset of influx and outflux for neap and spring tide, tidal duration, order of influx/outflux onset and time lags since time 0:00 at Site 2. Times in orange indicate a different deployment window. Times in blue indicate that the original measurement was during a different deployment window but could be adjusted to the original time window based on tidal similarity.
Preprints 109193 i003

3.4. Nuʻupia Volumes, Exchange Rates and Residence Times

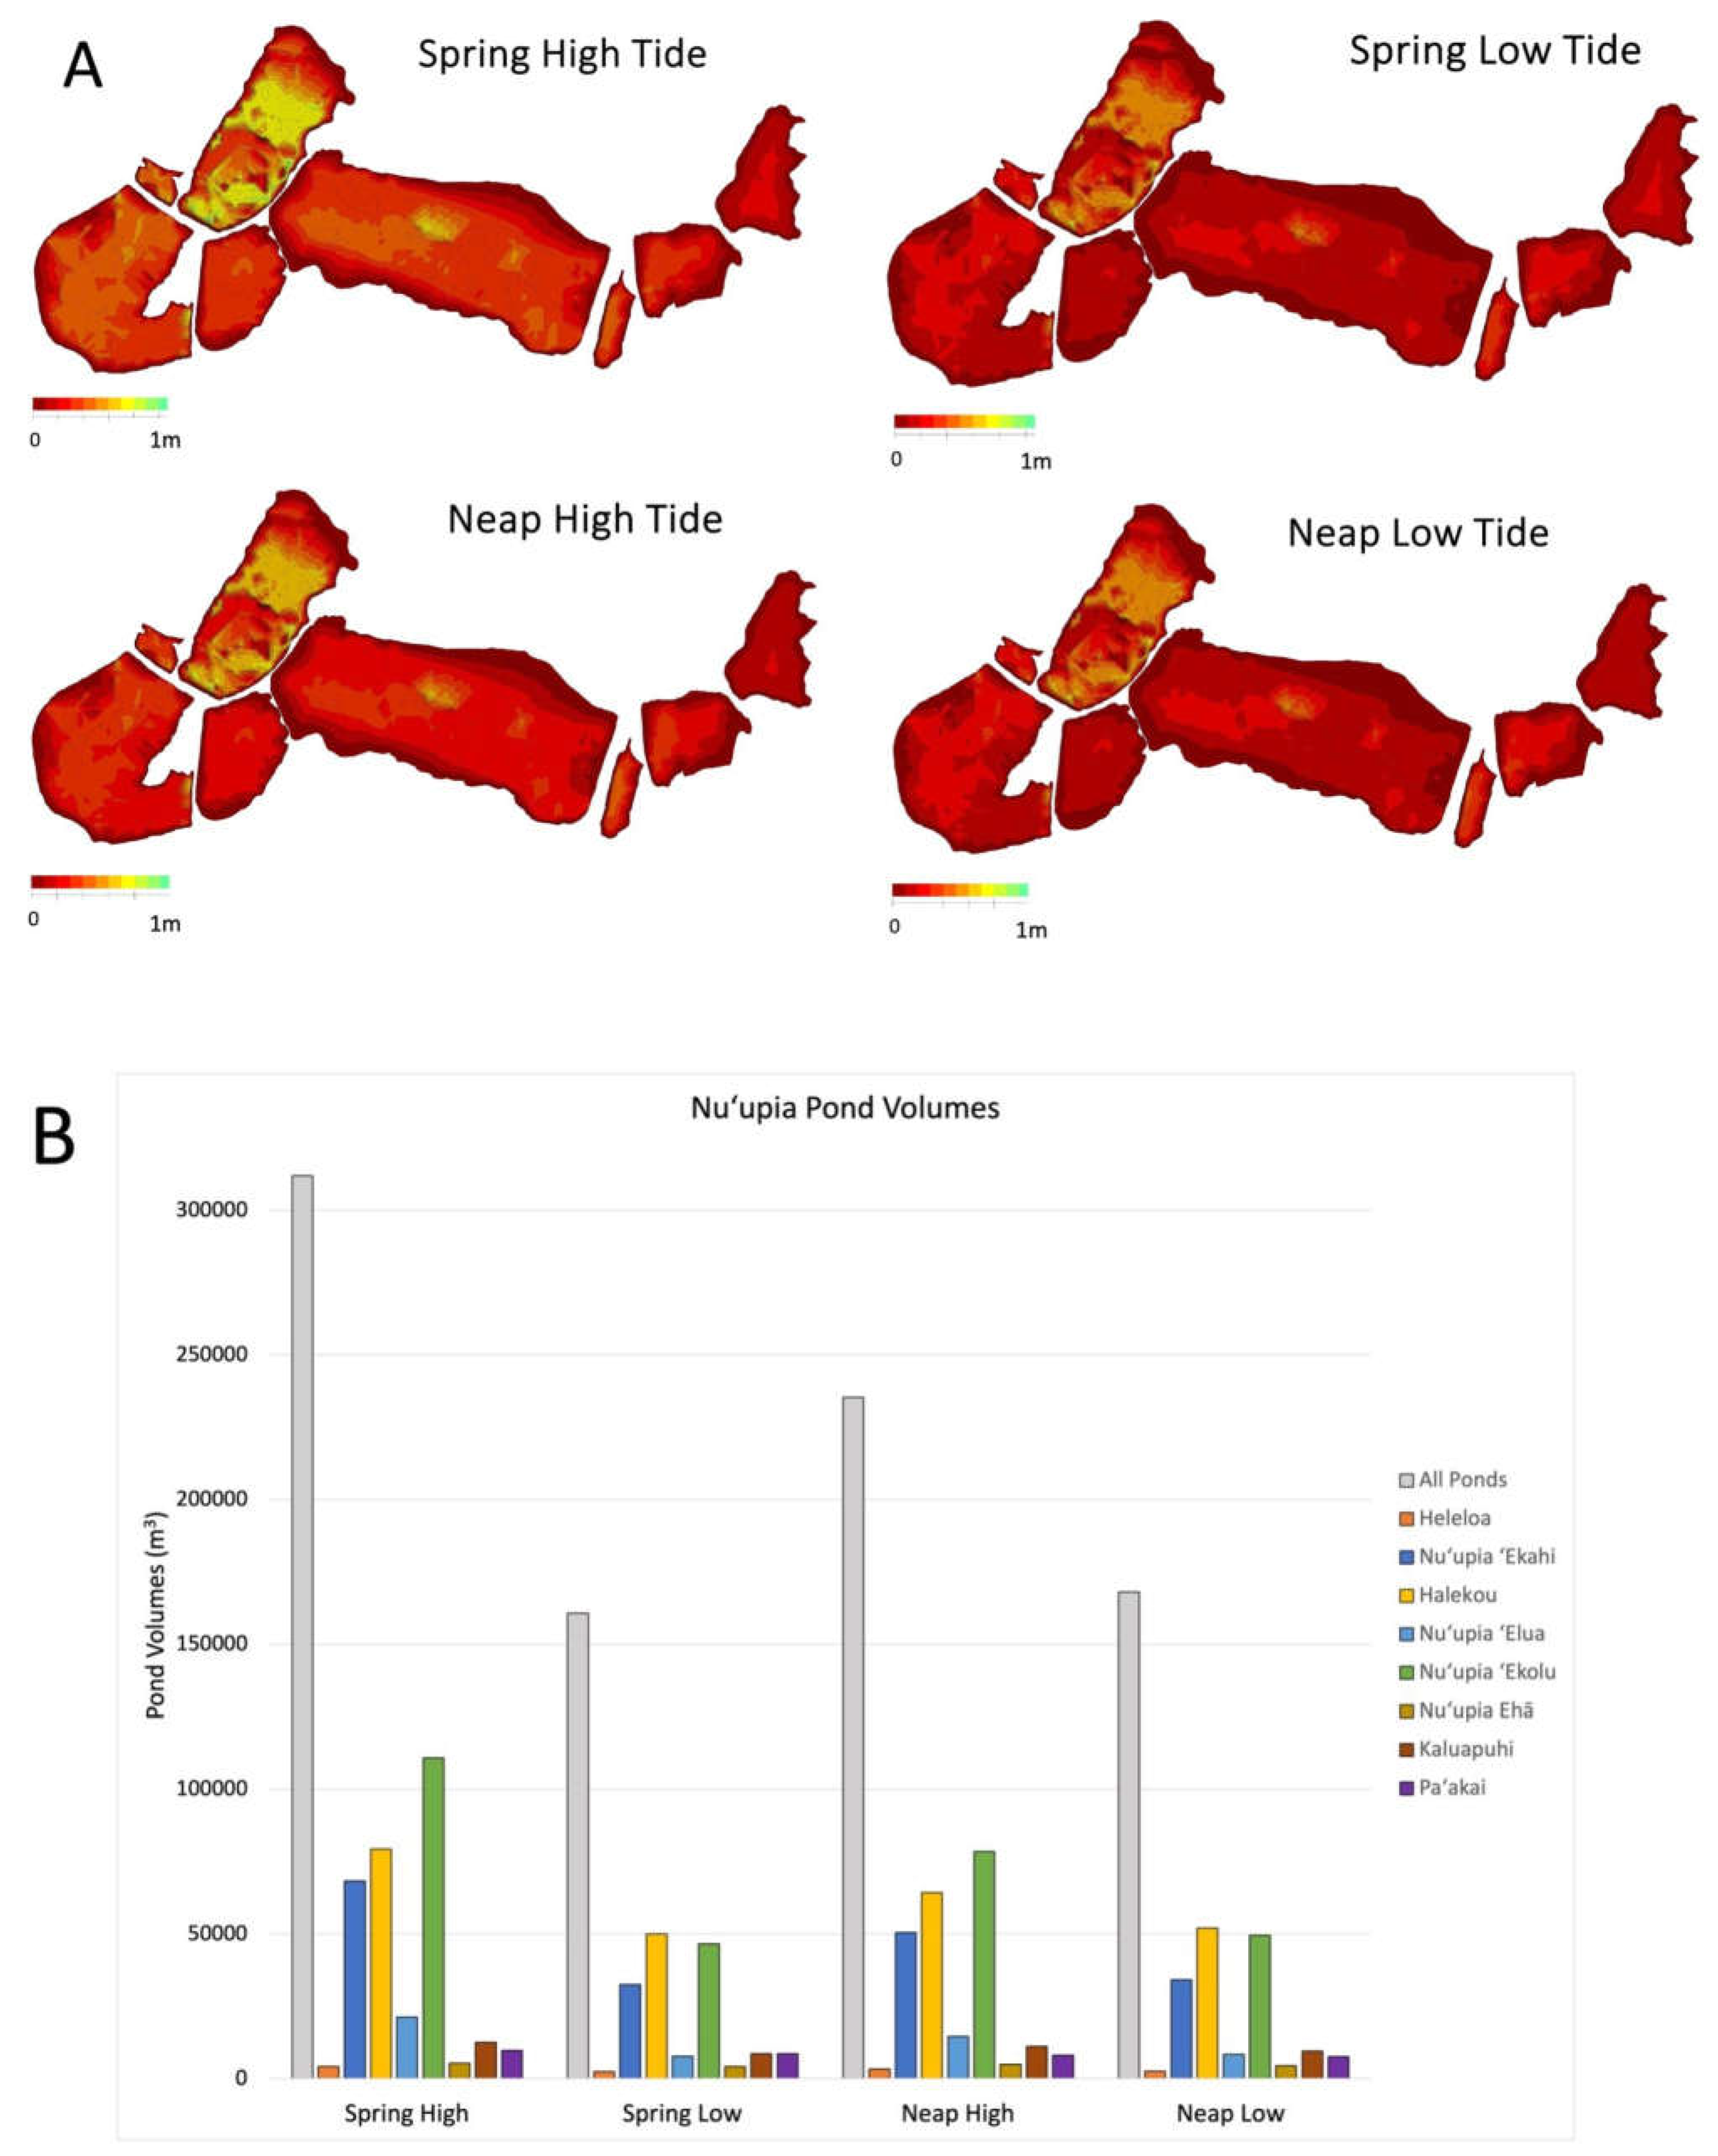
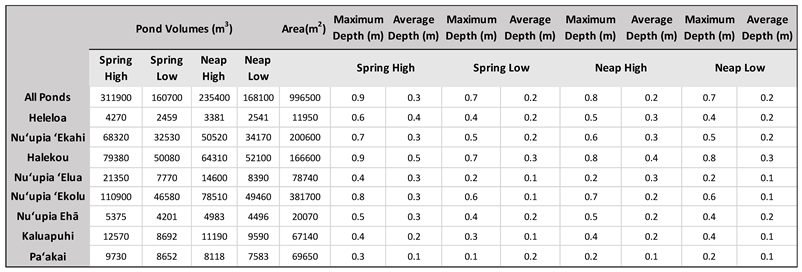
The bathymetry of Nuʻupia Ponds is characterized by a uniform and shallow bathymetry of ~ 0.2 – 0.3 m with some deeper portions (~ 0.9 m) in Halekou and Nuʻupia ʻEkolu Ponds (Table 4, Figure 7). Nuʻupia Ponds are the deepest during SH tide (Table 5, Figure 7A), averaging 0.3 m with a maximal water depth of 0.9 m resulting in a maximal volume of ~ 311,900 m3 for all ponds during SH tide (Table 4, Figure 7). During SL tide, the ponds retain a minimum water volume of approximately 160,700 m3, which corresponds to roughly 52% of the SH volume (Table 4, Figure 7) and water depth averages 0.2 m with a maximal depth of 0.7 m. NF tidal volume is 235,400 m3, ~75% of the SH tidal volume, with a mean depth of 0.20 m and a maximal depth of 0.8 m. NL tidal volume is 168,100 m3 and 54% of the SH volume, and has a mean depth of 0.20 m and a maximal depth of 0.7 m (Table 4, Figure 7). Volumes and depth range for all eight individual ponds are listed in Table 4.
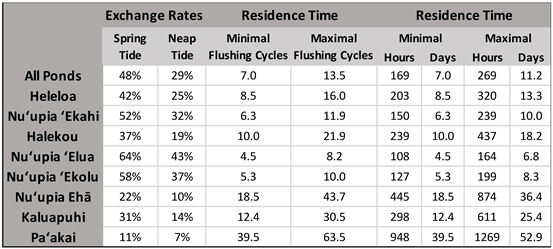
We determined that around 48% of the water within all ponds undergoes exchange during the ebb-flood transition at spring tide. In contrast, during the neap tide ebb-flood transition, only 29% of the water is exchanged (see Table 5). One flushing cycle was defined as the duration required to flush out 48% of total pond water during spring ebb tide and 29% during neap ebb tide and to replenish that water again with new Kāne‘ohe Bay water during the subsequent spring/neap flood tide. Using the average tidal duration for a full tidal cycle (flood and ebb) for spring and neap tides (Table 3) as a baseline, we defined one flushing cycle as 24 hours for spring tide and 20 hours for neap tide. Assuming that the incoming water would uniformly mix with the water already present in the ponds during the initial flushing cycle (52%), we estimated that approximately 7 flushing cycles are needed to dilute the initial 52% of water to a concentration of less than 1%. Hence, the minimum residence time of Nuʻupia Ponds is 7 flushing cycles approximately equivalent to 7 days, and occurs during spring tide when water exchange is at its peak (Table 5). In contrast, during periods of minimal water exchange (such as neap tides), it takes approximately 13 flushing cycles, roughly equivalent to 11 days, to dilute the 71% of retained water down to less than 1% concentration (Table 5). An overview of individual exchange rates and residence times can be found in Table 5.

4. Discussion

4.1. Site Specific Details and Technical Limitations

Peak water volume flux is a combination of the area and the flow velocity (c.f., Equation 1). Site 1 and 2 have the combination of the biggest channels and fastest velocities rendering the highest average and peak water volume fluxes as well as the largest proportion of relative water volume flux across the system with 50 – 60 % of relative flux (Table 2, Figure 4). Site 2 is also with a maximum of 1.33 m during spring influx, the deepest site compared to other exchange points. This contributes to higher water volume flux rates compared to sites that have similar width and velocities (Table 2). Site 3 has the highest water velocities with up to 0.68 m s−1, however it is comparably small in size with a width of only 3.45 m leading to low relative water volume fluxes despite the high flow velocity.
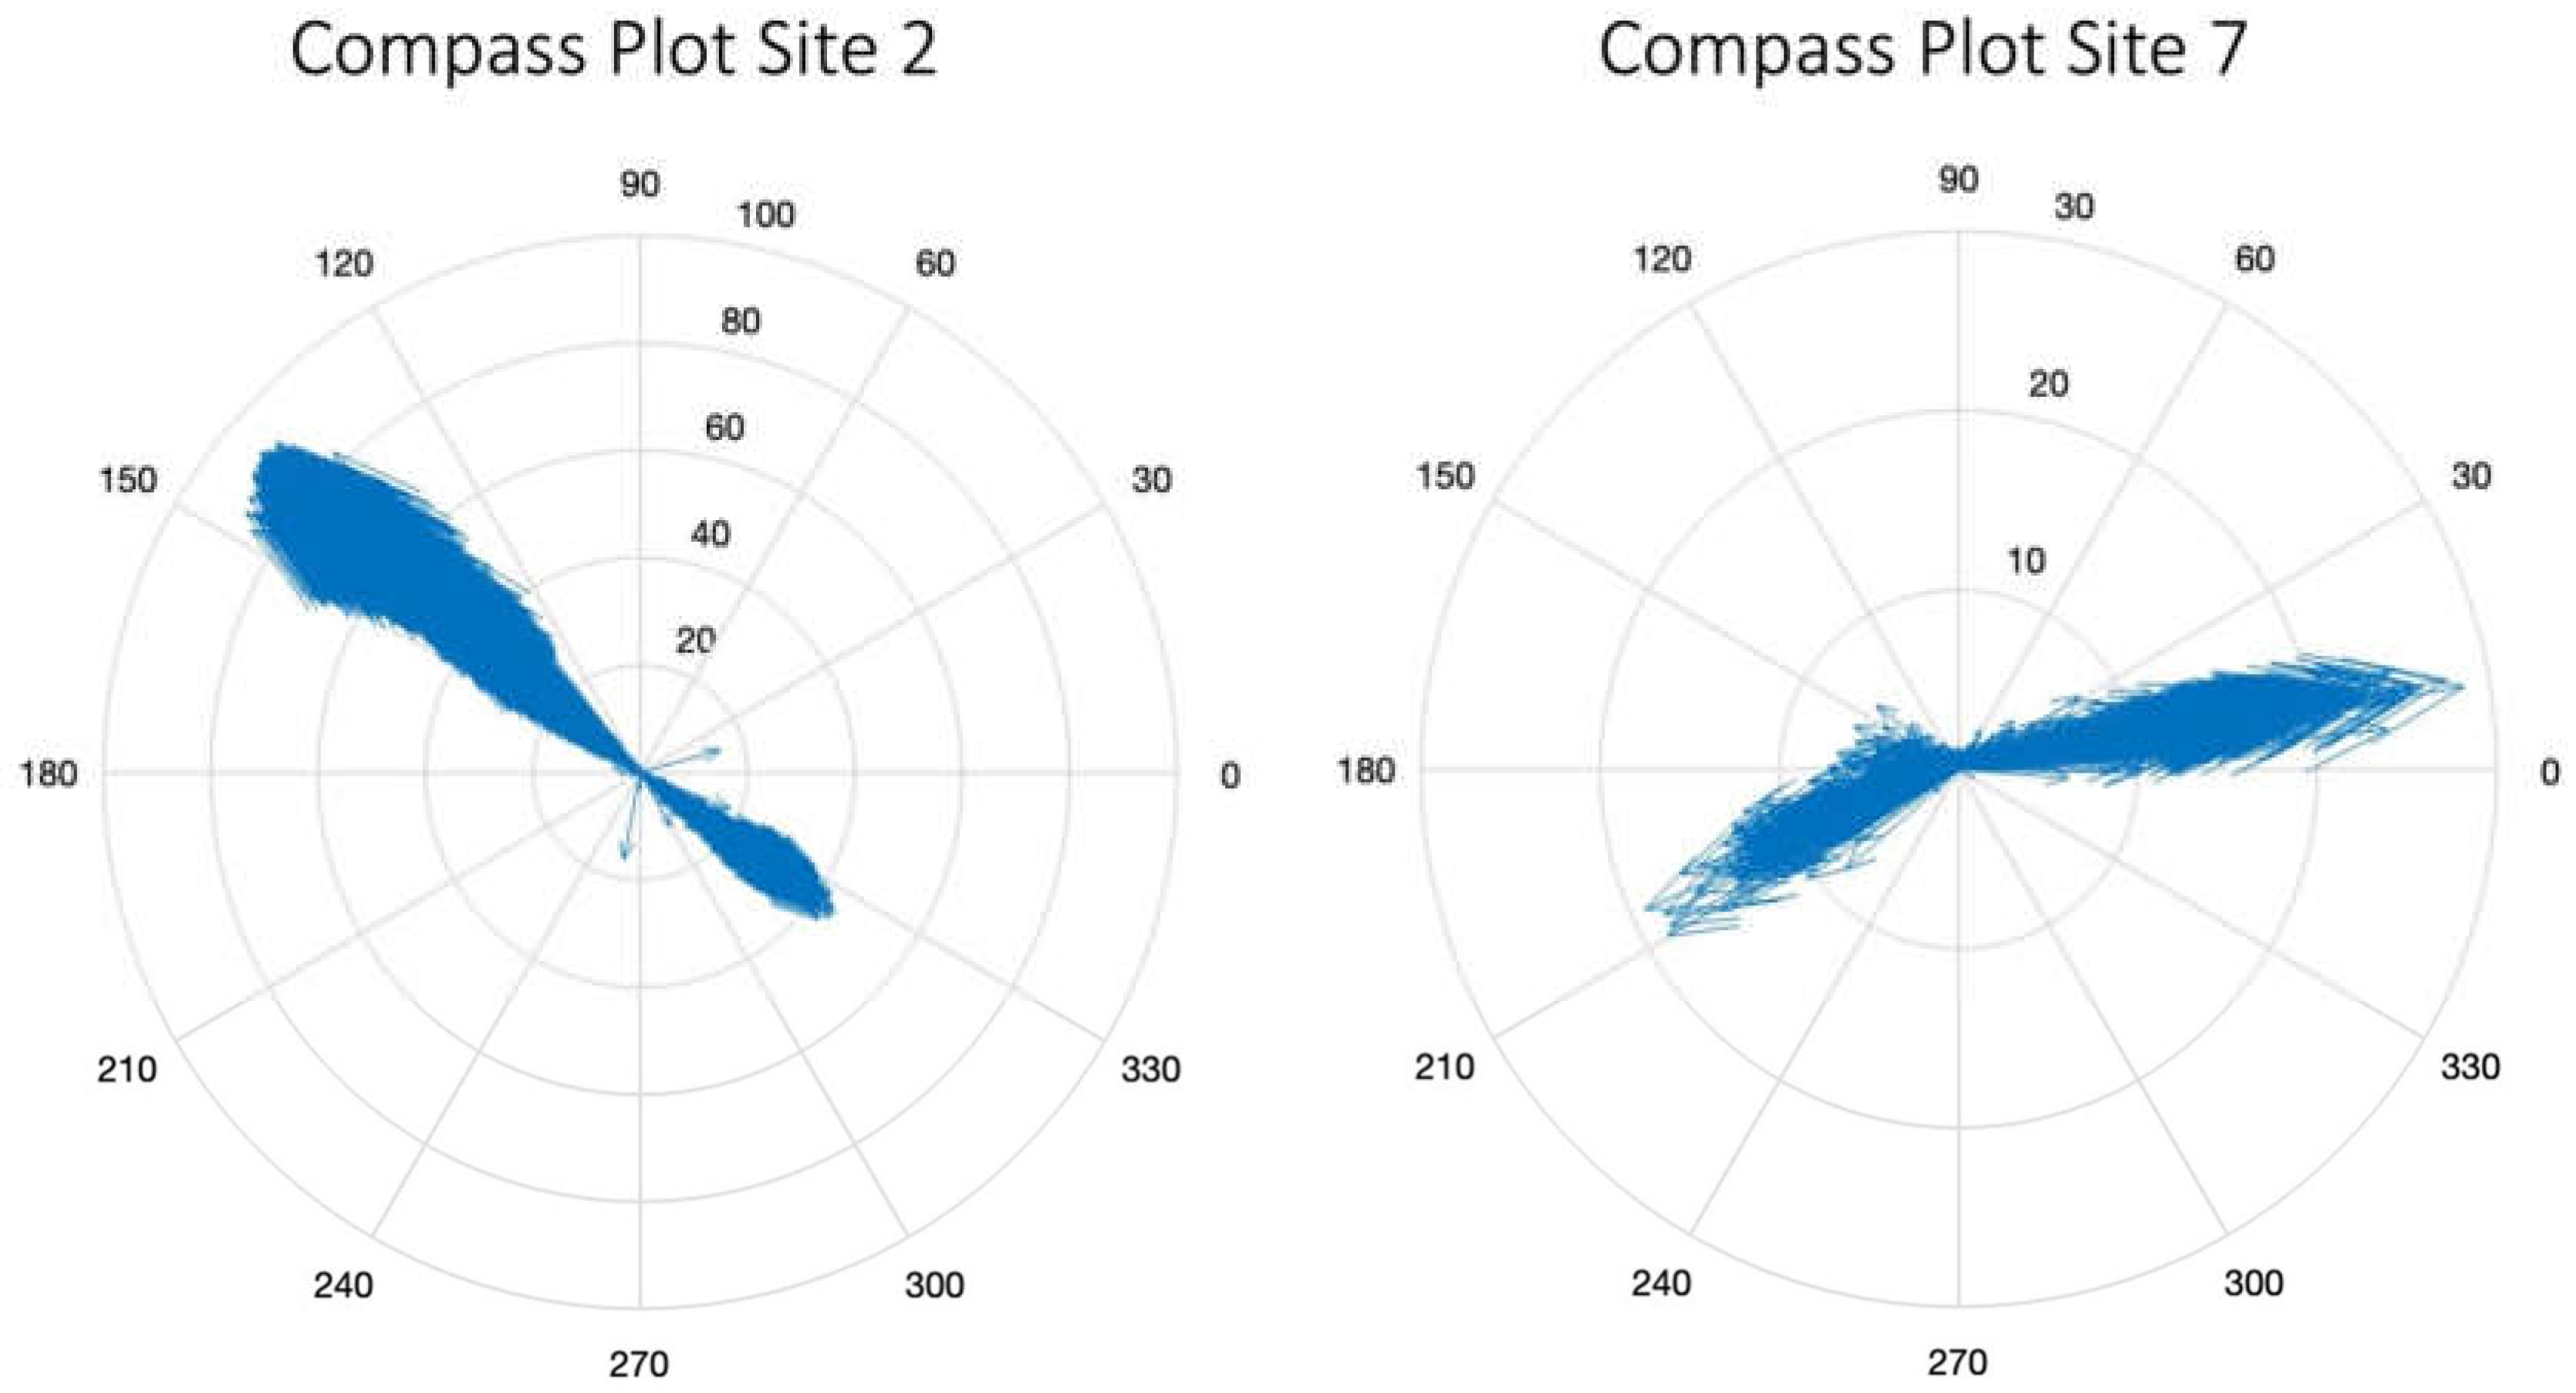
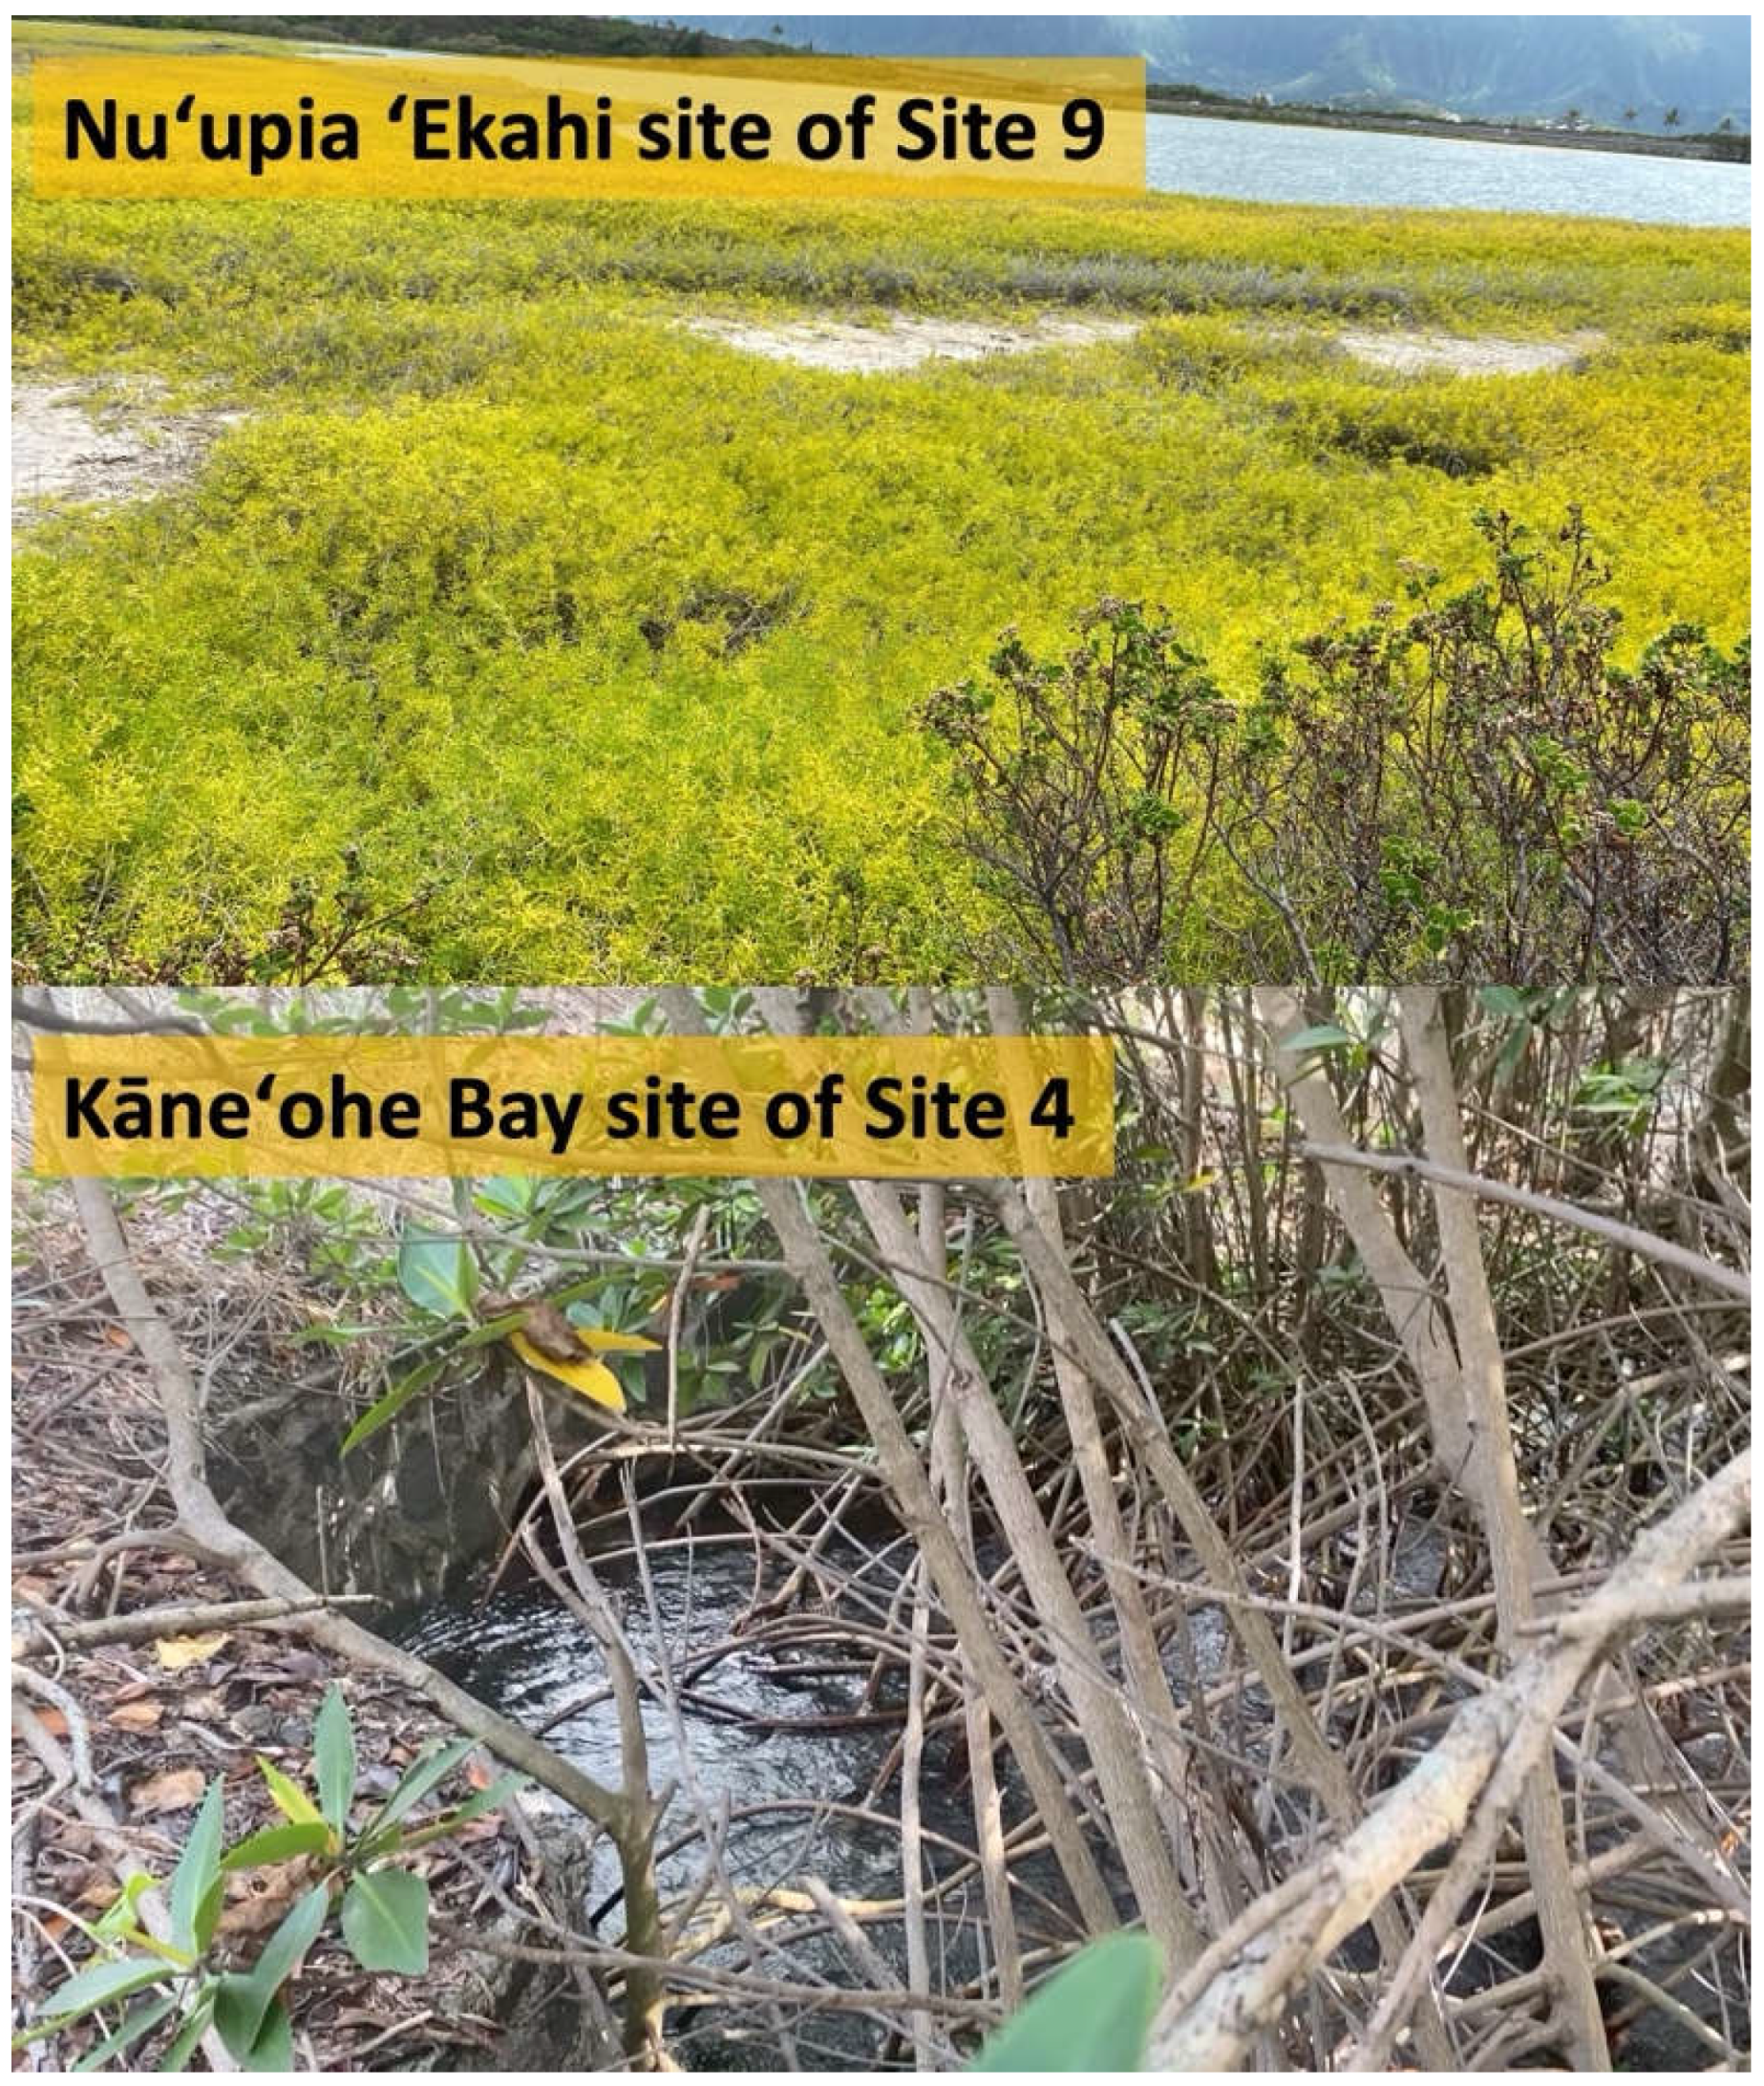
Most sites show clearly bidirectional flow (see flow direction compass plots in appendix, Figure A3). Site 7, connecting Nuʻupia ʻElua to Nuʻupia ʻEkolu, shows more variability in flow direction, likely because the nature of the exchange point presents a large gap that allows for more angled flow direction than a culvert does. Looking at the Kāneʻohe Bay site of Site 4, we see dense overgrowth by mangroves (see Figure A4 in appendix). Mangroves are known to inhibit flux [4,13,14]. It is possible that while Site 4 shows influx during both spring and neap tide (Table 2, Figure 4) due to the pressure gradient building up on the Kāneʻohe Bay site during flood tide, the barrier presented by mangroves is sufficient for the water flow seeking easier pathways during outflux. As such, Site 2 recorded a higher percentage of relative water volume flux during outflux compared to influx, indicating that it might be compensating for the outflux inhibited at Site 4 (Table 2, Figure 4).
Site 8, which connects Nuʻupia ʻEkahi and Nuʻupia Elua, recorded an influx during the spring tidal cycle only (Table 2, Figure 4). We observed no change in flow direction during spring outflux, however, the flow velocities drop. It is possible that during spring outflux, the pressure gradient forces water drainage through pathways with larger exchange points such as Site 7, Site 10 and Site 11 (Figure 4-6). Throughout the entire measurement period we observed only brief periods of outflux that become more frequent with neap tide at Site 8 (see appendix, Figure A5). For Site 12, we observed largely unidirectional flow in the form of influx across tidal cycles and no outflux during the selected spring or neap outflow timeframes (Table 2, Figure 3). However, brief periods of outflux were recorded ocasionally in between spring and neap tides at Site 12 and coincided with extremely low velocities, suggesting that the flow direction switches to wind driven westward flow due to a lack of pressure gradient from the west. Further, the observation that flow switches more frequently towards neap tide suggests that the pressure gradient pushing inward flow subsides from spring to neap tide. Another possible explanation for the lack of outflux at Site 12 may be a long time lag: By the time the pressure gradient switches to outflow in the eastern site of the system, an incoming new tidal cycle from the west “pushes” against the comparably smaller pressure gradient in the east. The long time lags weaken the tidally driven pressure gradients and flow velocities continuously from west to east (Table 2). While we recorded influx and outflux at Site 13 during spring tide, solely outflux was recorded during neap tide (Table 2, Figure 3). Flow velocities are higher during outflow periods (see Table 2). It is likely that the strong westward blowing wind is accelerating outflow, which is aligned with the westward direction, and that the combined wind and outflow pressure gradient cause the acceleration in velocity. The low velocities at spring influx are an indication that the pressure gradient is competing against the prevailing westward force caused by the trade winds (Figure 7). During neap tide the pressure gradient decreases even further and it is likely that the wind driven force does not allow for any influx.
Current meter data was collected for ten out of fourteen sites: Sites 5, 6, 9 and 14 were too shallow (<0.3m in depth) to measure flow with the CM-4 Shallow Water Tilt Current Meter and had only pressure sensor data recorded only (Figure 3B) leading to gaps in flow data for these locations when comparing water volume fluxes across the pond system. Site 5 presented a culvert with a small accumulation of water that was shallow and disconnected from the remaining pond system (Figure 3B). The pressure was not submerged as the water was too shallow, thus the measured signal is solely the atmospheric pressure measured. As there is no significant increase in pressure measured over the course of 14 days, we conclude that Site 5 is disconnected and does not facilitate any water exchange with the remaining system during the measurement period (Figure 3B). However, it could be possible that this site drains stormwater runoff during heavy rain events into Nuʻupia Ekahi Pond. It is likely that Site 6 and 9 facilitate minimal exchange between Nuʻupia ʻEkahi and Nuʻupia ʻElua Pond and Nuʻupia ʻEkahi and Helekou Pond respectively as they consist of culverts similar in size to Site 12 and 13 (Table 1) and empirical observations confirm minimal flow. Based on water volume flux at Site 12 and 13, which was measured to be 0.6 % at its maximum (Table 2), and given the comparably shallower water depth, we inferred a minimal exchange of <1% for Site 6 and 9. Site 9 seeps into marshland on the Nuʻupia ʻEkahi side of the exchange point (see Figure A4 in appendix), suggesting that if there is any exchange it is likely diffusive flow. Site 14 is a gap between Kaluapuhi and Paʻakai. Although larger in size, empirical observations showed very slow flow compared to other sites like Site 3 and 4, which are similar in size but have much higher water velocities. For these reasons we feel confident that the relative water volume flux of <1% lies within a realistic accuracy range for Site 14.
All data were collected during Hawaiʻi dry season [16] with minimal precipitation (Figure 7). While this study can be considered representative for the dry season, we do not expect significant alterations in flux dynamics during the Hawaiian winter/wet season due to the absence of direct freshwater stream input.

4.2. Management Implications

Water circulation is crucial for maintaining healthy water quality dynamics in fishponds, preventing stagnation and maintaining stable dissolved oxygen levels for aquatic biota to thrive [4,16]. Adequate levels of dissolved oxygen (DO) are crucial for the functioning of biological processes in aquatic environments. Decreases in DO can trigger significant shifts in productivity, biodiversity, and biogeochemical cycles, potentially resulting in notable alterations to food webs [18,19,20]. Oxygen depletion is often linked to excessive nutrient availability, causing eutrophication. This process can lead to oxygen deficiencies, ultimately resulting in large-scale fish mortality [19]. Further, the capability of water to hold dissolved oxygen decreases with increasing temperature and salinity. As such, there have been raised concerns regarding fish stress associated with the warming sea surface trends [16]. Thus, the combination of Nuʻupia Pondsʻ shallow water environment, high water temperatures, high water column and sediment oxygen demand (SOD) due to decomposition of organic matter renders particular importance of maintaining a well circulated environment with high flushing rates and low residence times. Increased exchange with well mixed ocean water from Kāneʻohe or Kailua Bay would be beneficial to ensure sufficient dissolved oxygen in a contained environment such as Nuʻupia Ponds.
Generally, the ponds on the western side of the pond system have higher flushing rates and lower residence times compared to the eastern side of the system: Heleloa, Nuʻupia ʻEkahi, Halekou, Nuʻupia ʻElua and Nuʻupia ʻEkolu have an average exchange rate of 51± 0.11% during spring tide and 31± 0.09% during neap tide, while the ponds at the eastern end (Nuʻupia Ehā, Kaluapuhi, Paʻakai) have a much lower average flushing rate of 21± 0.1% during spring tide and 10± 0.04 % during neap tide (Table 5). Minimal residence time for the western ponds is on average 7± 2.25 flushing cycles equaling to about 7 days and maximal residence time is 13.6± 5.45 flushing cycles equaling to just above 11 days. In contrast, residence times for ponds in the East are significantly higher: Minimal residence time for Nuʻupia Ehā, Kaluapuhi, Paʻakai is on average 23.5± 14.21 flushing cycles equaling to about 23.5 days and maximal residence time is 45.9± 16.57 flushing cycles equaling to just under 39 days (Table 5). Paʻakai, the most eastern pond, has the lowest exchange rates and the longest residence times with a minimal residence time of ~40 flushing cycles or 40 days and a maximal residence time of 63 flushing cycles or 53 days. In addition, both qualitative observations as well as Google Earth Imaging (Figure 1) suggest heavier sedimentation of the eastern ponds due to stagnant water. Re-establishing the former ocean connection with Kailua Bay could improve fishpond circulation and flushing as well as decrease residence times of Nuʻupia Ehā, Kaluapuhi, and Paʻakai (Figure 2B).
Further, lowering culverts at Kāneʻohe Bay site of Site 3 and 4 could increase water volume flux and exchange between Kāneʻohe Bayand Nuʻupia ʻEkahi: Influx at Site 3 (during neap tide only) and Site 4 (during both spring and neap tide) takes longer compared to nearby sites (Figure 5) suggesting that certain sea level on the Kāneʻohe Bay site needs to be reached before water can start flowing in through the culverts at Site 3 and 4. Thus, the height of culverts relative to the sea level affects the timing of influx/outflux at different sites and impairs efficient exchange at these sites. In addition, enlargement of existing culverts or strategic placement of additional culverts connecting Nuʻupia ʻEkahi to Kāneʻohe Bay would increase the exchange of Nuʻupia Pond and ocean water and decrease residence times for the Nuʻupia Pond system as a whole.
In addition to increasing exchange of Nuʻupia Ponds and ocean water, it is important to maintain circulation and flushing throughout the fishpond system. To ensure regular flushing between the individual ponds within Nuʻupia Pond system, enlargement of existing culverts at exchange points with low relative water volume flux (< 1%) such as Sites 6, 8, 9, 12, 13 and 14 (see Figure 4) or strategic placement of additional culverts would increase and more equally distribute water circulation across the system. Observations of dead fish at Site 13 suggest that one cause of fish mortality may be a lack of oxygen or impaired water quality, which can be caused by limited flushing and long residence times measured here. In addition, clearing existing exchange points from sediment, coral material and vegetation that might be clogging or blocking the drainage area, could enhance water exchange among ponds and improve circulation dynamics.
Mangroves fulfill important ecosystem functions in their native habitats such as protecting shorelines, stabilizing sediment, litterfall subsidy, and serving as nursery areas. Nevertheless, in coastal ecosystems of Hawai‘i, mangroves have resulted in a range of adverse ecological and economic consequences [21,22]. Nevertheless, in coastal ecosystems of Hawai‘i, mangroves have resulted in a range of adverse ecological and economic consequences: Mangroves tend to thrive in holotypic ecotones, which leads to their proliferation in estuarine environments, where their root systems can impede the flushing and circulation of fishponds [4,23,24]. Further, areas vegetated with mangroves have high sedimentation rates changing sandy habitats into muddy anoxic sediments as a result of bacterial decomposition of mangrove leaf detritus [23,25,26]. Drawdown of nitrogen and phosphate in areas with mangroves can lead to a decline of dissolved oxygen that can inhibit primary production rates in fishponds [25]. Therefore, by altering their environment, mangroves can trigger cascading adverse consequences for resident ecosystems in Hawaii, which has motivated their removal as a management action at fishponds [4,13,24]. At Nuʻupia Ponds Wildlife Management Area, mangroves have been documented to overgrow mudflats, causing heavy sedimentation and inhibiting flux as well as threatening the physical integrity and function of fishpond walls and channels [11]. Thus, removal of non-native mangroves (Rhizophora mangle) has been part of management plans in the past [11,24]. Pickleweed (Batis maritima) is an introduced colonizer of mudflats and fishponds forming a monotypic salt marsh vegetation diminishing habitat for native seabirds [11,27]. Between 1994-1995, approximately 10 acres of mangrove were removed from shorelines of Nuʻupia ʻEkahi, Nuʻupia ʻElua, and Heleloa Ponds. These removal efforts resulted in a documented increase of stilt forging and nesting in areas cleared of mangrove and other alien vegetation such as pickleweed [27,28]. As such, regular control of invasive species such as mangroves and pickleweed can help maintain important mudflat habitat for endangered and protected waterbird species, minimize sedimentation, and maximize water circulation across the Nuʻupia fishpond system. Further, it is advisable to clear the dense mangrove overgrowth in Kāneʻohe Bay at Site 4 (Figure A3) to increase water volume flux and overall exchange between Kāneʻohe Bay and Nuʻupia ʻEkahi.
Qualitative observations during field measurements suggest heavy sedimentation in all eight ponds with a thick anoxic sediment layer of Nuʻupia Ponds system. When anoxic sediment conditions lead to the buildup of reducing agents like sulfides and ferrous iron, these compounds can react with oxygen, effectively consuming it and creating a feedback loop that can further deplete oxygen [18,29]. This process is known as oxygen demand. In shallow aquatic ecosystem, the oxygen levels are determined by the balance between oxygen generation and consumption within the water column, as well as by sediment oxygen demand (SOD) [18]. Anoxic conditions can be detrimental to benthic organisms like worms, mollusks, and other bottom-dwelling species that rely on oxygen for respiration and leading to reduced biodiversity and changes in benthic community composition [30]. Dredging the upper sediment layer could prevent further sediment build up and deepen the water column, which could increase available dissolved oxygen in the water column. However, negative consequences such as resuspension of pollutants from sediments and disturbance of benthic and aquatic biota as well as bird populations should be carefully considered [31,32,33]. Conducting an environmental impact assessment prior to dredging operations to identify and address potential impacts and risks of dredging on water quality and ecosystems, is essential. Implementation of best management practices, which may include measures like sediment containment, water quality monitoring, and proper disposal or treatment of dredged can help mitigate potential adverse effects of dredging operations.
Overall, this study outlays the physical components of the Nuʻupia Ponds ecosystem and provides an important baseline that can guide further research and allow for evaluation of future ecosystem management regimes. Our findings suggest that there is considerable potential for strategic ecosystem management to enhance water circulation, thereby potentially benefiting ecosystem health. Integrating traditional Hawaiian ecosystem management practices with contemporary estuarine management methods can safeguard this culturally and economically important area, ensuring the sustainability of coastal ecosystems for generations to come.

Author Contributions

Conceptualization, P.M. and M.A.M.; E.C.F; methodology, P.M. and M.A.M.; software, P.M.; validation, P.M and M.A.M.; formal analysis, P.M.; investigation, P.M.; resources, P.M. and M.A.M; data curation, P.M. and M.A.M.; writing—original draft preparation, P.M.; writing—review and editing, P.M., M.A.M; visualization, P.M.; supervision, M.A.M; project administration, M.A.M; funding acquisition, E.C.F.; M.A.M. All authors have read and agreed to the published version of the manuscript.

Funding

This study was funded by the Department of Defense, under the Institutional Grant No. W9126G-21-2-0051.

Data Availability Statement

Data available on request due to restrictions eg privacy or ethical. The data presented in this study are available on request from the corresponding author. The data are not publicly available due to homeland security.

Acknowledgments

The project team wishes to acknowledge the contributions of Erik Franklin, who generously supported this project with administration and funding acquisition. Further, we would like to thank Peter Felician and Trey Summers, who assisted with collecting field data, making it truly a group effort. We would also like to thank Manuel Lankau for providing and assisting with the DrDepthPC Version 5.1.8. (Per Pelin) software program that was used to calculate pond volumes based on bathymetry data. Thanks also to the Department of Defense (DoD) for their financial support, the guidance provided and patience exhibited along the way. Special thanks to Senior Natural Resources Manager Lance Bookless, who provided us with invaluable information and insights about the pond system.

Conflicts of Interest

The authors declare no conflict of interest. The funders had no role in the design of the study; in the collection, analyses, or interpretation of data; in the writing of the manuscript, or in the decision to publish the results.

Appendix

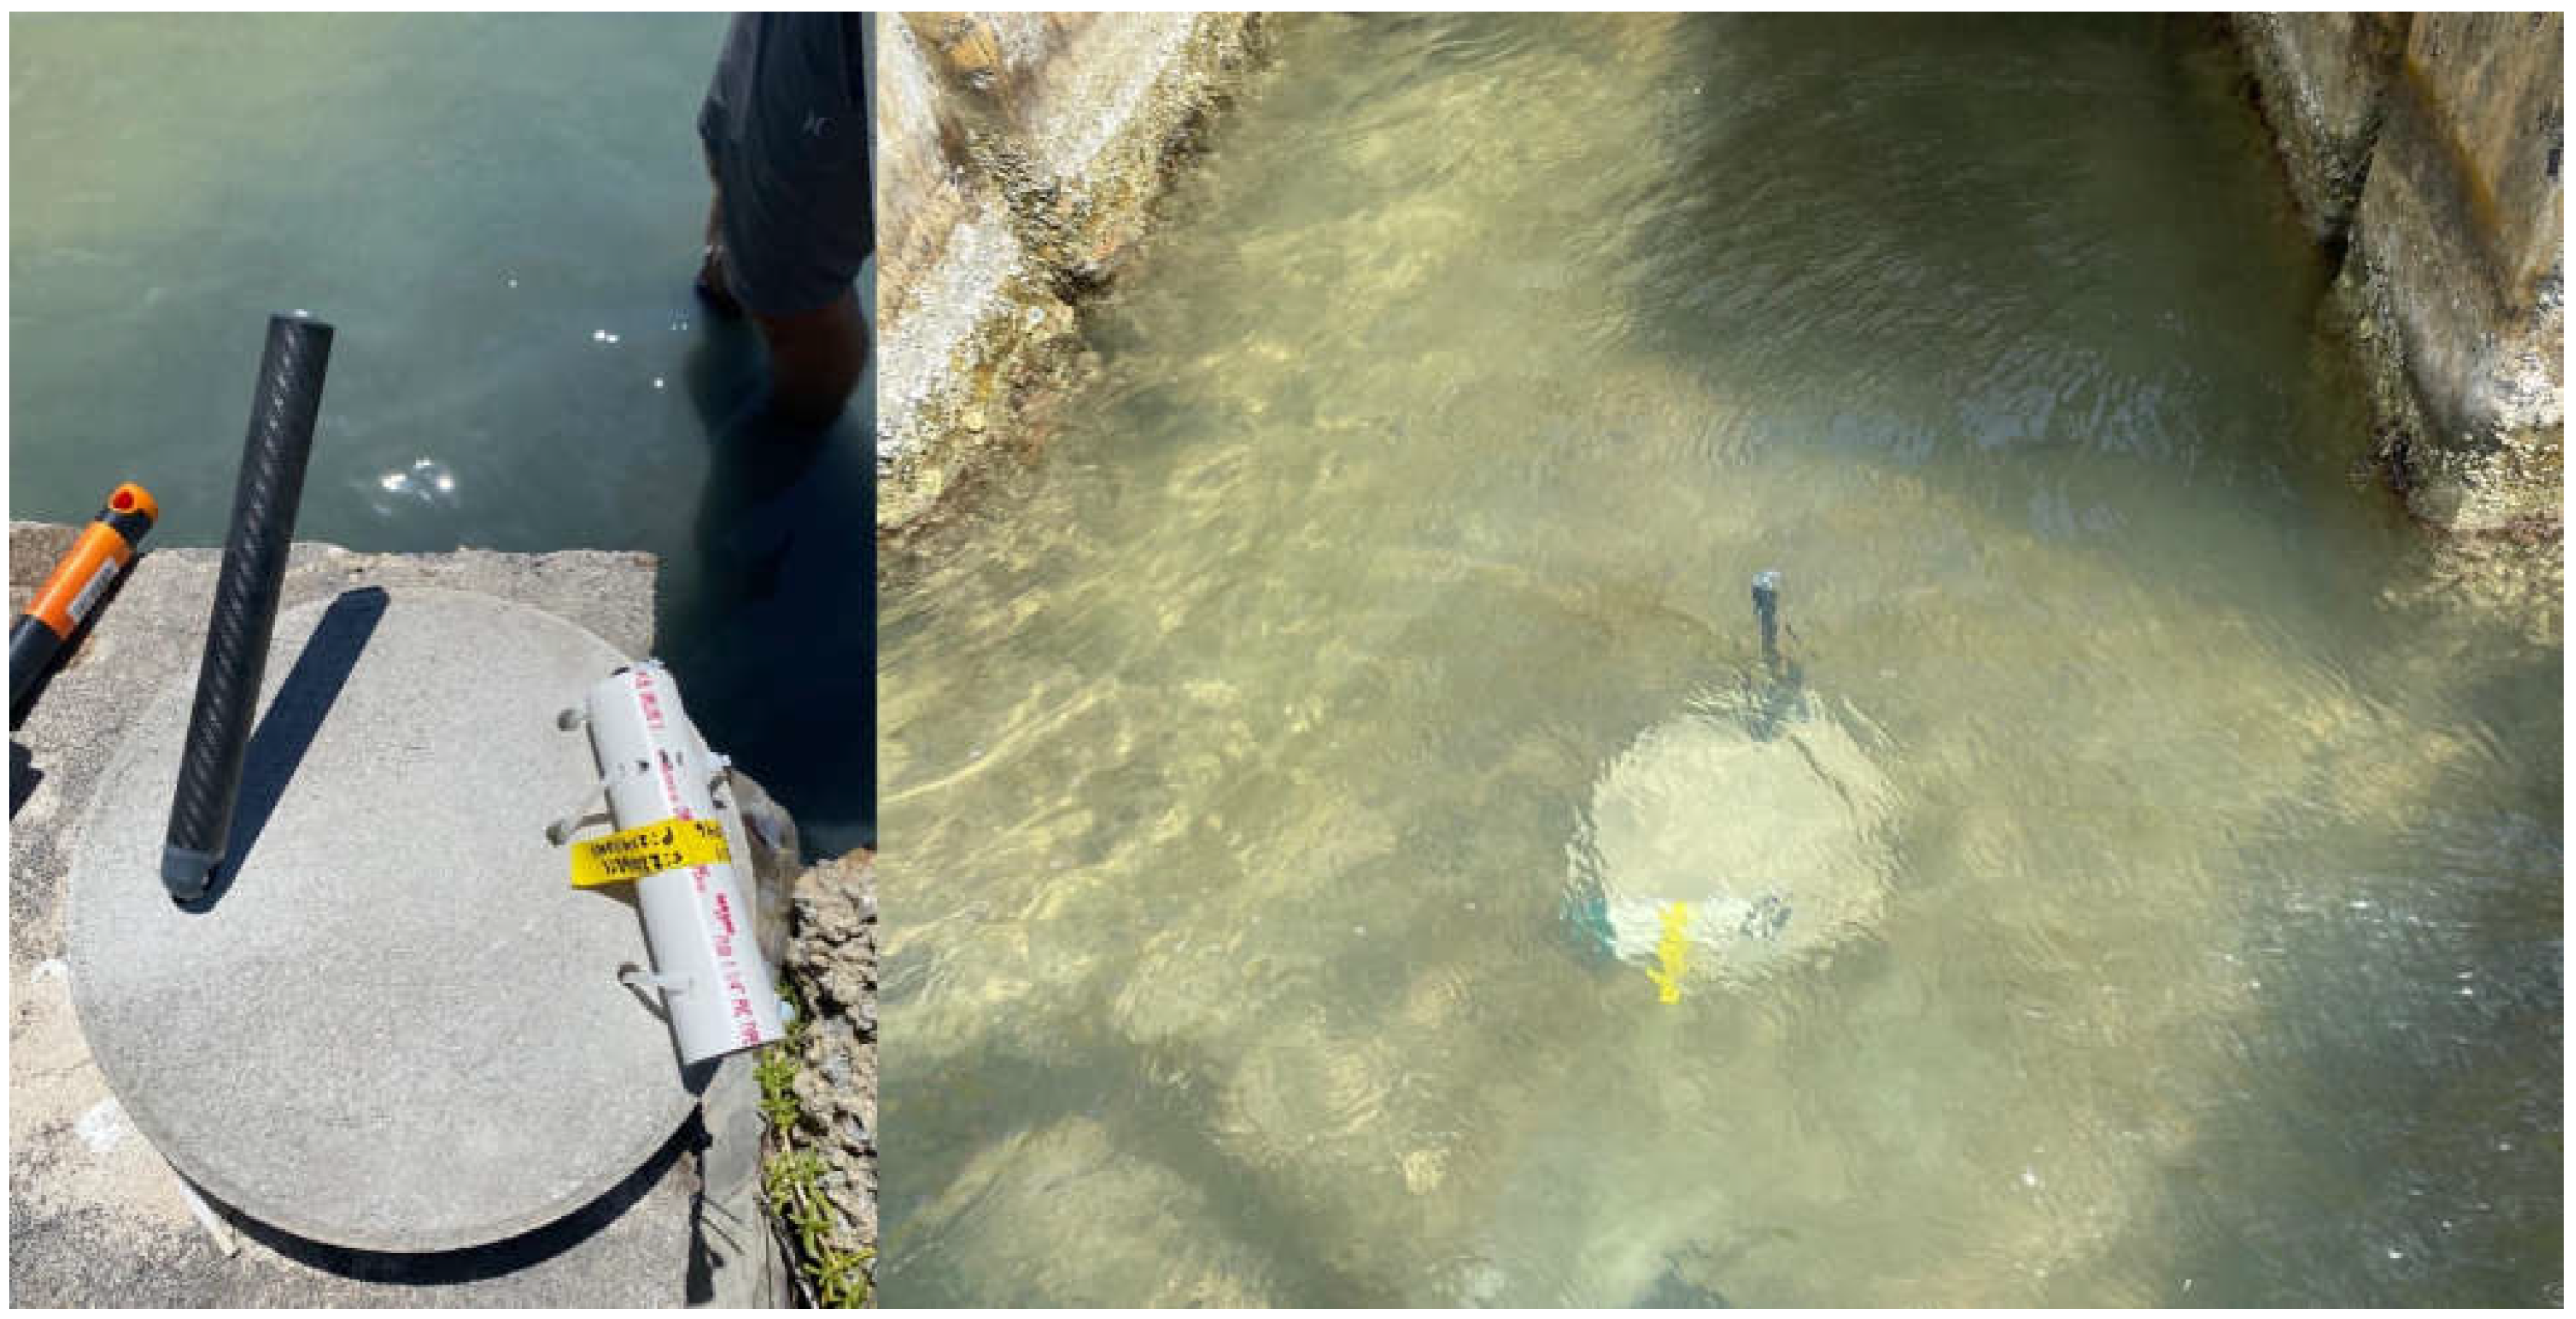
Figure A1. Deployment set-up. Each instrument packet included one TCM-4 Shallow Water (SW) Tilt Current Meters and one HOBO® water level logger mounted to a round concrete plate 16 inch in diameter and about 10 kg in weight. The instrument was placed at the culvert channel or gap.
Preprints 109193 g0a1
Figure A2. Current meters deployed at Site 8 and Site 11 were damaged during the first deployment in July, which led to flooding of the sensor housing and a loss of all data. The images show the bite marks that likely led to flooding of the housing. Site 8 and 11 were redeployed in September, 2022.
Preprints 109193 g0a2
Figure A3. Compass plot depicting flow direction and velocity in the Cartesian coordinate system for Sites 2 (left) and 7 (right). Overall, both sites show a bidirectional flow pattern. Site 7 shows more variability in flow direction.
Preprints 109193 g0a3
Figure A4. Top: Shows overgrowth of Nuʻupia ʻEkahi site of the exchange point at Site 9. The culvert outlet on that site is not clearly visible and must be heavily overgrown. Bottom: Kāneʻohe Bay site of exchange point at Site 4 shows dense mangrove overgrowth.
Preprints 109193 g0a4

References

  1. Safak, I.; Wiberg, P.L.; Richardson, D.L.; Kurum, M.O. Controls on residence time and exchange in a system of shallow coastal bays. Cont. Shelf Res. 2015, 97, 7–20. [Google Scholar] [CrossRef]
  2. Kim, C.-K.; Park, K.; Powers, S.P.; Graham, W.M.; Bayha, K.M. Oyster Larval Transport in Coastal Alabama: Dominance of Physical Transport over Biological Behavior in a Shallow Estuary. J. Geophys. Res. Oceans 2010, 115. [Google Scholar] [CrossRef]
  3. Defne, Z.; Ganju, N.K. Quantifying the Residence Time and Flushing Characteristics of a Shallow, Back-Barrier Estuary: Application of Hydrodynamic and Particle Tracking Models. Estuaries and Coasts 2015, 38, 1719–1734. [Google Scholar] [CrossRef]
  4. Möhlenkamp, P.; Beebe, C.K.; McManus, M.A.; Kawelo, A.H.; Kotubetey, K.; Lopez-Guzman, M.; Nelson, C.E.; Alegado, R. ʻAnolani Kū Hou Kuapā: Cultural Restoration Improves Water Budget and Water Quality Dynamics in Heʻeia Fishpond. Sustainability 2019, 11, 161. [Google Scholar] [CrossRef]
  5. Keala, G.; Hollyer, J.R.; Castro, L. Loko Ia: A Manual on Hawaiian Fishpond Restoration and Management; University of Hawaii at Manoa: Honolulu, HI, USA, 2007. [Google Scholar]
  6. Wyban, C.A. Tide and Current: Fishponds of Hawai‘i; University of Hawaii Press, 2020. [Google Scholar]
  7. Cornwell, E. Island Empowerment as Global Endowment: Understanding Hawaiian Adaptive Cultural Resource Management. JUE 2020, 10, 69–90. [Google Scholar] [CrossRef]
  8. Cobb, J.N. The Commercial Fisheries of the Hawaiian Islands in 1903; U.S. Government Printing Office: Washington, DC, USA, 1905. [Google Scholar]
  9. Nuʻupia Ponds : Heart of Mōkapu Watershed. Marine Corps Base Hawaii, 1998. 10.
  10. Malama Aina O Mokapu: Protecting Mokapu Lands. Honolulu : U.H. Sea Grant College Program, University of Hawaiʻi, Mānoa, 1992.
  11. Assessment for Nuʻupia Ponds Habitat Improvement Projects at Nuʻupia Wildlife Management Area. Marine Corps Base Hawaii; Marine Corps Base Hawaii: Kaneohe, Hawaii, 1996.
  12. Report of the Board of Commissioners of Agriculture and Forestry of the Territory of Hawaii for the period... [1908] Hawaii. Board of Commissioners of Agriculture and Forestry. Honolulu.
  13. Chimner, R.A.; Fry, B.; Kaneshiro, M.Y.; Cormier, N. Current Extent and Historical Expansion of Introduced Mangroves on O’ahu, Hawai’i. Pac. Sci. 2006, 60, 377–383. [Google Scholar] [CrossRef]
  14. Cox, E.; Allen, J. Stand Structure and Productivity of the Introduced Rhizophora Mangle in Hawaii. Estuaries 1999, 22, 276–284. [Google Scholar] [CrossRef]
  15. Universal User Guide for TCM-x Current Meters, MAT-1 Data Logger and Domino Software. Lowell Instruments. East Famouth, MA 02536, USA, 2022.
  16. McCoy, D.; McManus, M.A.; Kotubetey, K.; Kawelo, A.H.; Young, C.; D’Andrea, B.; Ruttenberg, K.C.; Alegado, R. ʻAnolani Large-Scale Climatic Effects on Traditional Hawaiian Fishpond Aquaculture. PLOS ONE 2017, 12, e0187951. [Google Scholar] [CrossRef] [PubMed]
  17. Young, C.W. Perturbation of Nutrient Level Inventories and Phytoplankton Community Composition During Storm Events in a Tropical Coastal System: Heeia Fishpond, Oahu, Hawaii. Master’s Thesis, University of Hawaii Manoa, Honolulu, HI, USA, 2011. [Google Scholar]
  18. Li, Y.; Xiong, X.; Zhang, C.; Liu, A. Sustainable Restoration of Anoxic Freshwater Using Environmentally-Compatible Oxygen-Carrying Biochar: Performance and Mechanisms. Water Res. 2022, 214, 118204. [Google Scholar] [CrossRef] [PubMed]
  19. Baxa, M.; Musil, M.; Kummel, M.; Hanzlík, P.; Tesařová, B.; Pechar, L. Dissolved Oxygen Deficits in a Shallow Eutrophic Aquatic Ecosystem (Fishpond) – Sediment Oxygen Demand and Water Column Respiration Alternately Drive the Oxygen Regime. Sci. Total Environ. 2021, 766, 142647. [Google Scholar] [CrossRef] [PubMed]
  20. Denise Breitburg et al. Declining oxygen in the global ocean and coastal waters. Science 2018. 359. eaam7240. [CrossRef]
  21. Gedan, K.; Kirwan, M.; Wolanski, E.; Barbier, E.; Silliman, B. The Present and Future Role of Coastal Wetland Vegetation in Protecting Shorelines: Answering Recent Challenges to the Paradigm. Climatic Change 2010, 106, 7–29. [Google Scholar] [CrossRef]
  22. Twilley, R.; Lugo, A.; Patterson-Zucca, C. Litter Production and Turnover in Basin Mangrove Forests in Southwest Florida. Ecology 1986, 67. [Google Scholar] [CrossRef]
  23. Allen, J.A. Mangroves as Alien Species: The Case of Hawaii. Global Ecology and Biogeography Letters 1998, 7, 61–71. [Google Scholar] [CrossRef]
  24. Drigot, D. C. 1999. Mangrove Removal and Related Studies at Marine Corps Base Hawaii. Tech Note M-3N in Technical Notes: Case Studies from the Department of Defense Conservation Program. U.S. Dept. of Defense Legacy Resource Management Program Publication: 170-174.
  25. Walsh, G.E. An Ecological Study of a Hawaiian Mangrove Swamp. Estuaries 1967, 83, 420–431. [Google Scholar]
  26. Crooks, J.A. Characterizing Ecosystem-Level Consequences of Biological Invasions: The Role of Ecosystem Engineers. Oikos 2002, 97, 153–166. [Google Scholar] [CrossRef]
  27. Rauzon, M.J.; Drigot, D.C. Red Mangrove Eradication and Pickleweed Control in a Hawaiian Wetland, Waterbird Responses, and Lessons Learned. Pages 240-248 In Veitch, C. R. and Clout, M. N. (eds.). Turning the tide: the eradication of invasive species. IUCN SSC Invasive Species Specialist Group. IUCN, Gland, Switzerland and Cambridge, UK.
  28. Drigot, D. C. An Ecosystem-Based Management Approach to Enhancing Endangered Waterbird Habitat on a Military Base. Stud. Avian Biol. 2001. 22: 329-337.
  29. Gautreau, E.; Volatier, L.; Nogaro, G.; Gouze, E.; Mermillod-Blondin, F. The Influence of Bioturbation and Water Column Oxygenation on Nutrient Recycling in Reservoir Sediments. Hydrobiologia 2020, 847, 1027–1040. [Google Scholar] [CrossRef]
  30. Karlson, K.; Rosenberg, R.; Bonsdorff, E. Temporal and Spatial Large-Scale Effects of Eutrophication and Oxygen Deficiency on Benthic Fauna in Scandinavian and Baltic Waters-a Review. Ann.l Rev. 2002, 40, 427–489. [Google Scholar]
  31. Roberts, D.A. Causes and Ecological Effects of Resuspended Contaminated Sediments (RCS) in Marine Environments. Environ. Int. 2012, 40, 230–243. [Google Scholar] [CrossRef] [PubMed]
  32. Wenger, A.S.; Harvey, E.; Wilson, S.; Rawson, C.; Newman, S.J.; Clarke, D.; Saunders, B.J.; Browne, N.; Travers, M.J.; McIlwain, J.L.; Erftemeijer, P.L.A.; Hobbs, J.P.A.; McLean, D.; Depczynski, M.; Evans, R.D. A critical analysis of the direct effects of dredging on fish.
  33. Fish Fish 2017. 18, pp. 967-98533.
  34. Thrush, S.F.; Dayton, P.K. Disturbance to Marine Benthic Habitats by Trawling and Dredging: Implications for Marine Biodiversity. Annu. Rev. Ecol. Evol. Syst. 2002, 33, 449–473. [Google Scholar] [CrossRef]
1
Exchange point here describes a combination of concrete culverts and gaps that could – in theory – facilitate water exchange between the eight individual ponds. Figure 3 shows images of the 14 potential exchange locations.
2
See Figure 1 in the appendix for images of the deployment set-up
3
With the exception of Site 2, for which the polyfit function did not provide a good fit.
4
Damaged current meters showed significant bite marks, making it likely that they were bitten open by a marine organism (see Figure A2 in the appendix for images)
Figure 1. (A) The study site Nuʻupia Ponds is located within the Kāneʻohe Bay Marine Corps Base on the northeast/windward side of the island of Oʻahu, Hawaiʻi. MCBH Weather Station is located northeast of the pond near the aircraft runway. (B) Eight individual ponds (Nuʻupia ʻEkahi, Nuʻupia ʻElua, Nuʻupia ʻEkolu, Nuʻupia Ehā, Halekou, Heleloa, Paʻakai and Kaluapuhi) are interconnected through a set of fourteen concrete culverts and gaps that facilitate water exchange to varying degrees (Site 1-14). Figures from Google Earth.
Preprints 109193 g001aPreprints 109193 g001b
Figure 2. (A) Nuʻupia Ponds are connected to Kāneʻohe Bay in the west through a channel flowing under the John A. Burns Freeway Bridge (Site 2), as well as Site 3 and Site 4. (B) Image of historic connection between Paʻakai Pond and Kailua Bay in the East. Figures from Google Earth.
Preprints 109193 g002
Figure 4. (A). Rating curves at each water exchange site over four tidal stages. Rating curves illustrate water volume flux (m3 s−1) relative to the water level (m) e.g., at the onset of spring influx, water level is low and increases as tide rises, while at the onset of spring outflux water height values are high and decrease as tidal height drops; similarly, for neap influx and outflux. The best fit line in indicated in red and 95% confidence intervals in a dashed pink line. Positive values indicate water volume flux into the Nuʻupia Ponds and negative values indicate water volume flux out of Nuʻupia Ponds. (B) Pressure signals at Sites 5, 6, 9 and 14, which were too shallow (<30 cm depth) to measure with current meters reliably. At these sites, solely a pressure sensor was deployed.
Preprints 109193 g004aPreprints 109193 g004b
Figure 5. Proportions of total water exchange across the system for each respective cycle at each exchange site during spring influx; spring outflux; neap influx; and neap outflux. Exchange site locations are marked with arrows. While not to scale, the size of arrows indicates the relative magnitude of water volume flux at each exchange site. The pie chart shows relative percentages of exchange across tidal stages for Sites 1-14.
Preprints 109193 g005aPreprints 109193 g005bPreprints 109193 g005c
Figure 7. Nuʻupia Ponds bathymetry and volumes over various tidal stages. (A) Pond Bathymetry Maps for SH, SL, NH, NL tides. Depth is indicated in meters. (B) Pond Volumes for SH, SL, NH, NL.
Preprints 109193 g007
Table 1. Summary of fishpond system exchange points, including a description, latitude and longitude, compass heading, total width (m) and instruments deployed at site.
Preprints 109193 i001
Table 2. Water Volume Flux (WVF) dynamics at Nuʻupia Ponds: Mean and peak water volume flux, average flow velocity, tidal cycle length, hourly rate of water volume flux, volume exchanged per tidal cycle and percentage of relative water volume flux.
Preprints 109193 i002
Table 4. Pond volumes across tidal stages (SH SL, NH, NL) as well maximum and average pond depth for the entire Nuʻupia Ponds system and individual ponds.
Preprints 109193 i004
Table 5. Exchange rates for spring and neap tides as well as residences times in flushing cycles, hours and days for the entire Nuʻupia Ponds system as well as individual ponds.
Preprints 109193 i005
Disclaimer/Publisher’s Note: The statements, opinions and data contained in all publications are solely those of the individual author(s) and contributor(s) and not of MDPI and/or the editor(s). MDPI and/or the editor(s) disclaim responsibility for any injury to people or property resulting from any ideas, methods, instructions or products referred to in the content.
Copyright: This open access article is published under a Creative Commons CC BY 4.0 license, which permit the free download, distribution, and reuse, provided that the author and preprint are cited in any reuse.
Alerts
Prerpints.org logo

Preprints.org is a free preprint server supported by MDPI in Basel, Switzerland.

Subscribe

© 2025 MDPI (Basel, Switzerland) unless otherwise stated