1. Introduction
The history of human civilization is inherently connected to the utilisation of bricks as a basic building material. Since the third century BCE, there have been numerous structures that use fired or burned bricks (Weaver, 1997). The chronicles of ancient civilizations give evidence to the enduring legacy of brick creation, and several studies infer that the qualities and durability of bricks are closely related to the quality of raw materials, manufacturing techniques such as firing temperature and many other factors (Fernandes et al., 2010; Johari et al., 2010; Mostaghelchi et al., 2013; Rasmussen et al., 2012). Firing temperature is recognized an important factor in brick production because burning triggers significant changes in mineralogy, texture, and physical properties, by impacting the porosity and pore dispersion of bricks (Job Ajala et al., 2016, 2017; Karaman et al., 2006; Velraj et al., 2009).
When clays are fired to make pottery, new minerals called firing minerals are formed. These products are primarily determined by the composition of the clays, the additives used to make pottery, the atmospheric conditions, and the duration of firing during pottery making. Gehlenite and diopside are high-temperature firing minerals. Gehlenite is formed at 800-850°C from illite and calcite decomposition products (Maritan et al., 2006) and calcite decomposition begins at 650°C and ends at 850°C, giving rise to new high-temperature calco-silicates and aluminum-calcium silicates such as pyroxene group members (diopside) and plagioclase feldspars (anorthite) (İssi et al., 2011; Papachristodoulou et al., 2006). The reaction between quartz and lime at 920 or 1000°C, depending on the quartz content, produced wollastonite. Wollastonite was discovered to replace gehlenite in the gehlenite bearing system at temperatures above 830°C (Böhme et al., 2019). Multidimensional approaches like X-ray powder Diffraction (XRD), Fourier Transform Infrared Spectroscopy (FTIR), Differential Thermal Analysis (DTA) and Scanning Electron Microscopy (SEM) have been demonstrated to be very effective in understanding the firing temperature (Ghale et al., 2019; Keller & Pickett, 1949; Legodi & De Waal, 2007; Mendelovici, 1997; Rasmussen et al., 2012; Rutherford et al., 2012; Velraj et al., 2014). Moreover, the Thermoluminescence (TL) and Optically Stimulated Luminescence (OSL) dating techniques are essential for establishing the time elapsed since the last high-temperature event, which usually coincides with the bricks' firing in a kiln (Aitken, 1985, 1998). The TL and OSL exploit the accumulation of charge carriers in mineral defects, providing a timeline for brick usage and reuse (Galli et al., 2006, 2020).
In India, most investigations have focussed on the ancient architectures of southern part of the country, utilizing similar methodologies to understand the effects of firing temperature and the physic-mechanical properties of ancient bricks (Dhanapandian et al., 2010; Govindasamy et al., 2019a; Kiruba & Ganesan, 2015; Raja Annamalai et al., 2014; V. Ramasamy et al., 2009; Ravisankar et al., 2013, 2014; Velraj et al., 2010, 2014). However, only one notable study analyzed the bricks of the Kamakhya Temple using XRD and FTIR techniques, revealing variations in firing temperatures (above and below 500°C) (Sheikh and Barua, 2013). Except for this, no archaeometry and dating of ancient artefacts from the region has been carried out so far. Hence, the present study aims to fill this gap by focusing on different archaeological sites of Upper Assam, to estimate technological parameters of bricks production such as raw materials used in manufacturing and the firing temperature using FTIR, XRD, and SEM-EDX techniques. Additionally, TL, OSL and IRSL) dating methods will be employed to determine the chronology and historical context of the Dihing Valley and nearby areas of Upper Assam. In this way it is possible to establish whether different brick production technologies exist and, thanks to the determination of an absolute chronology, determine the technological progress that has occurred in the bricks production.
1.1. Study Area
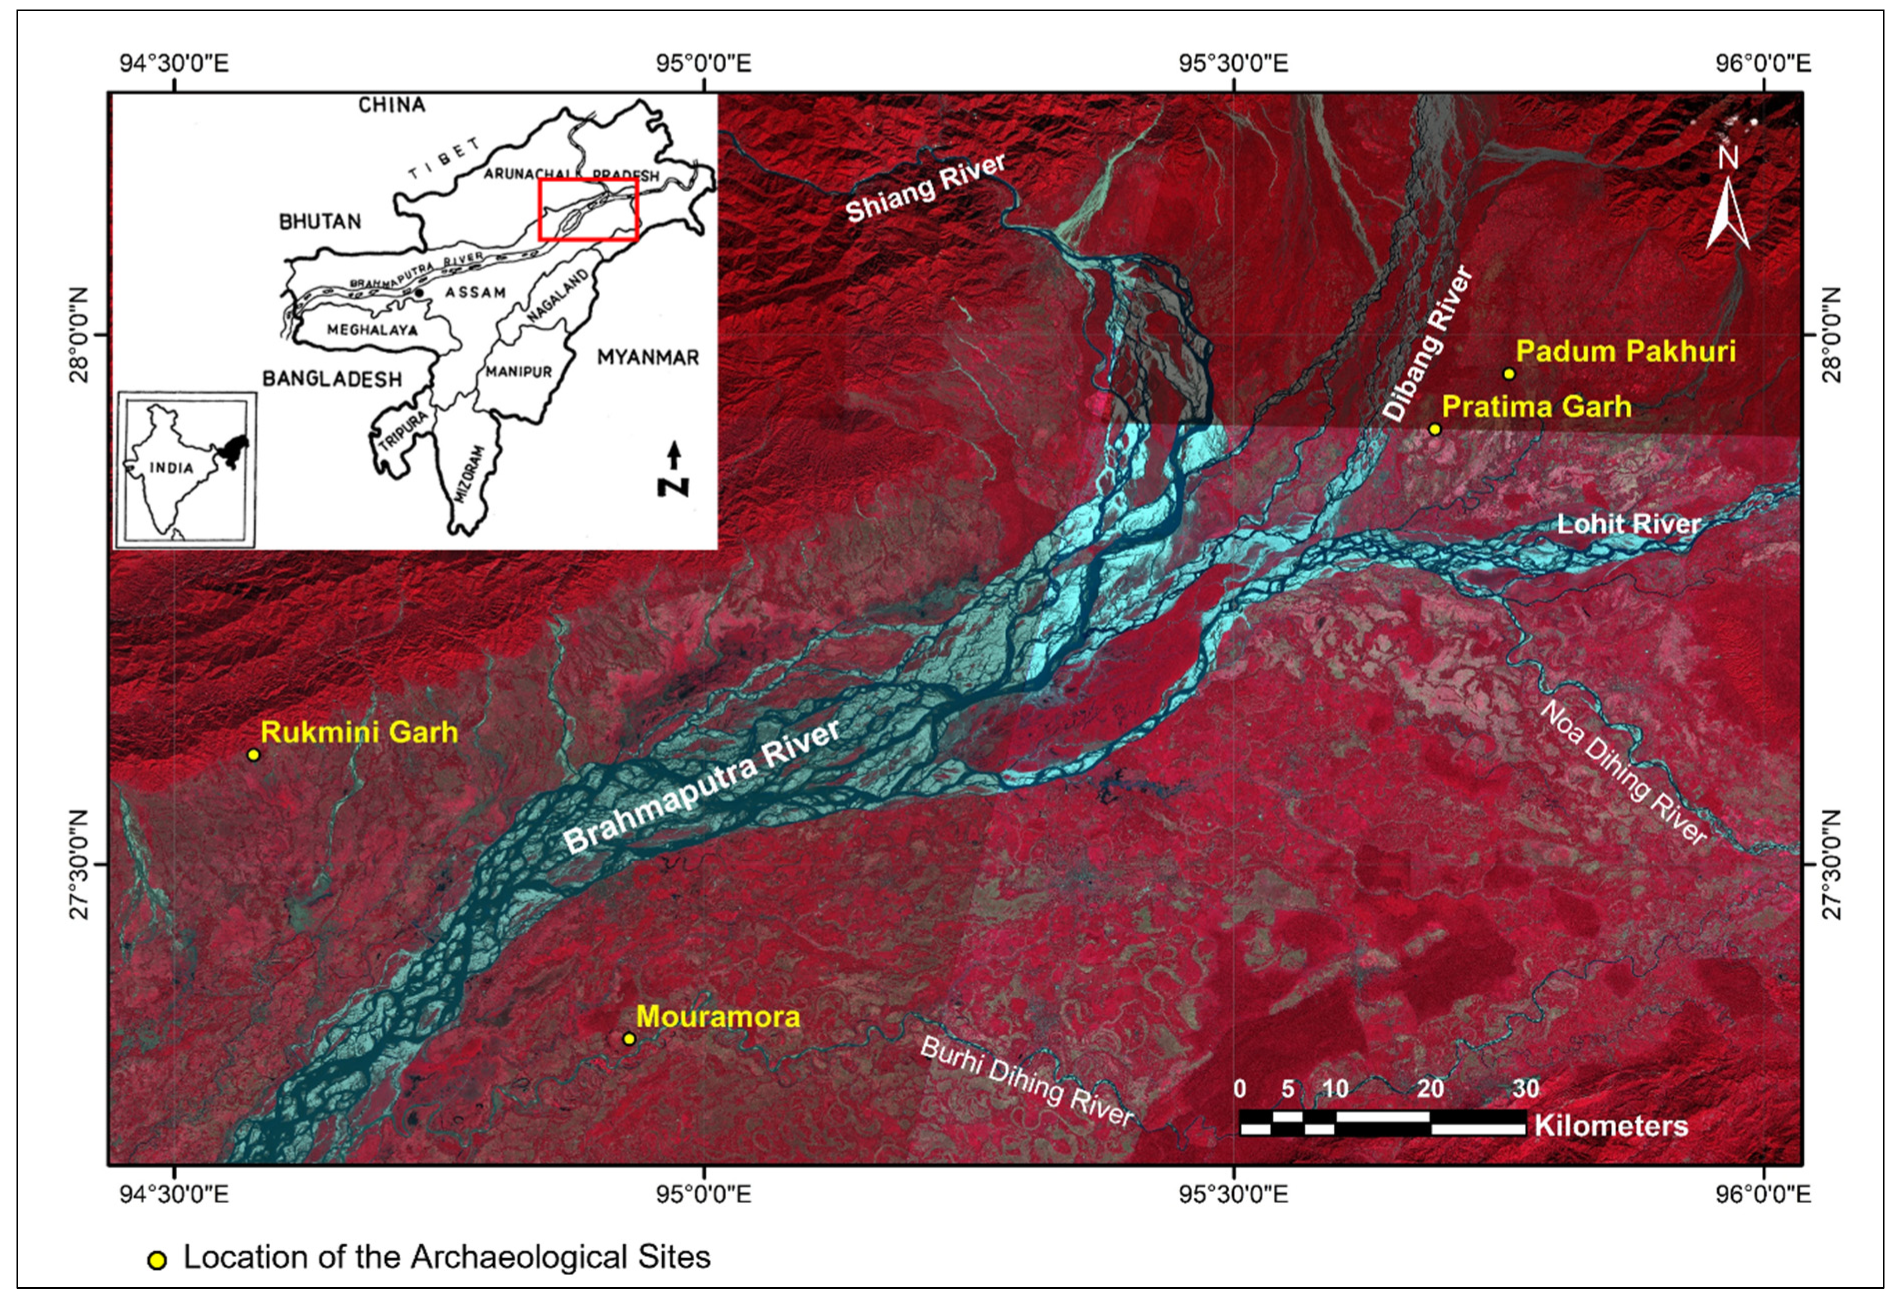
In recent years few important archaeological structures framed with bricks were noticed in four archaeological sites of Upper Assam. (
Figure 1). The locations and details of the archaeological sites are described below.
Figure 1.
Location map of the study area indicating archaeological sites.
Figure 1.
Location map of the study area indicating archaeological sites.
1.1.1. Mouramora Archaeological Spot
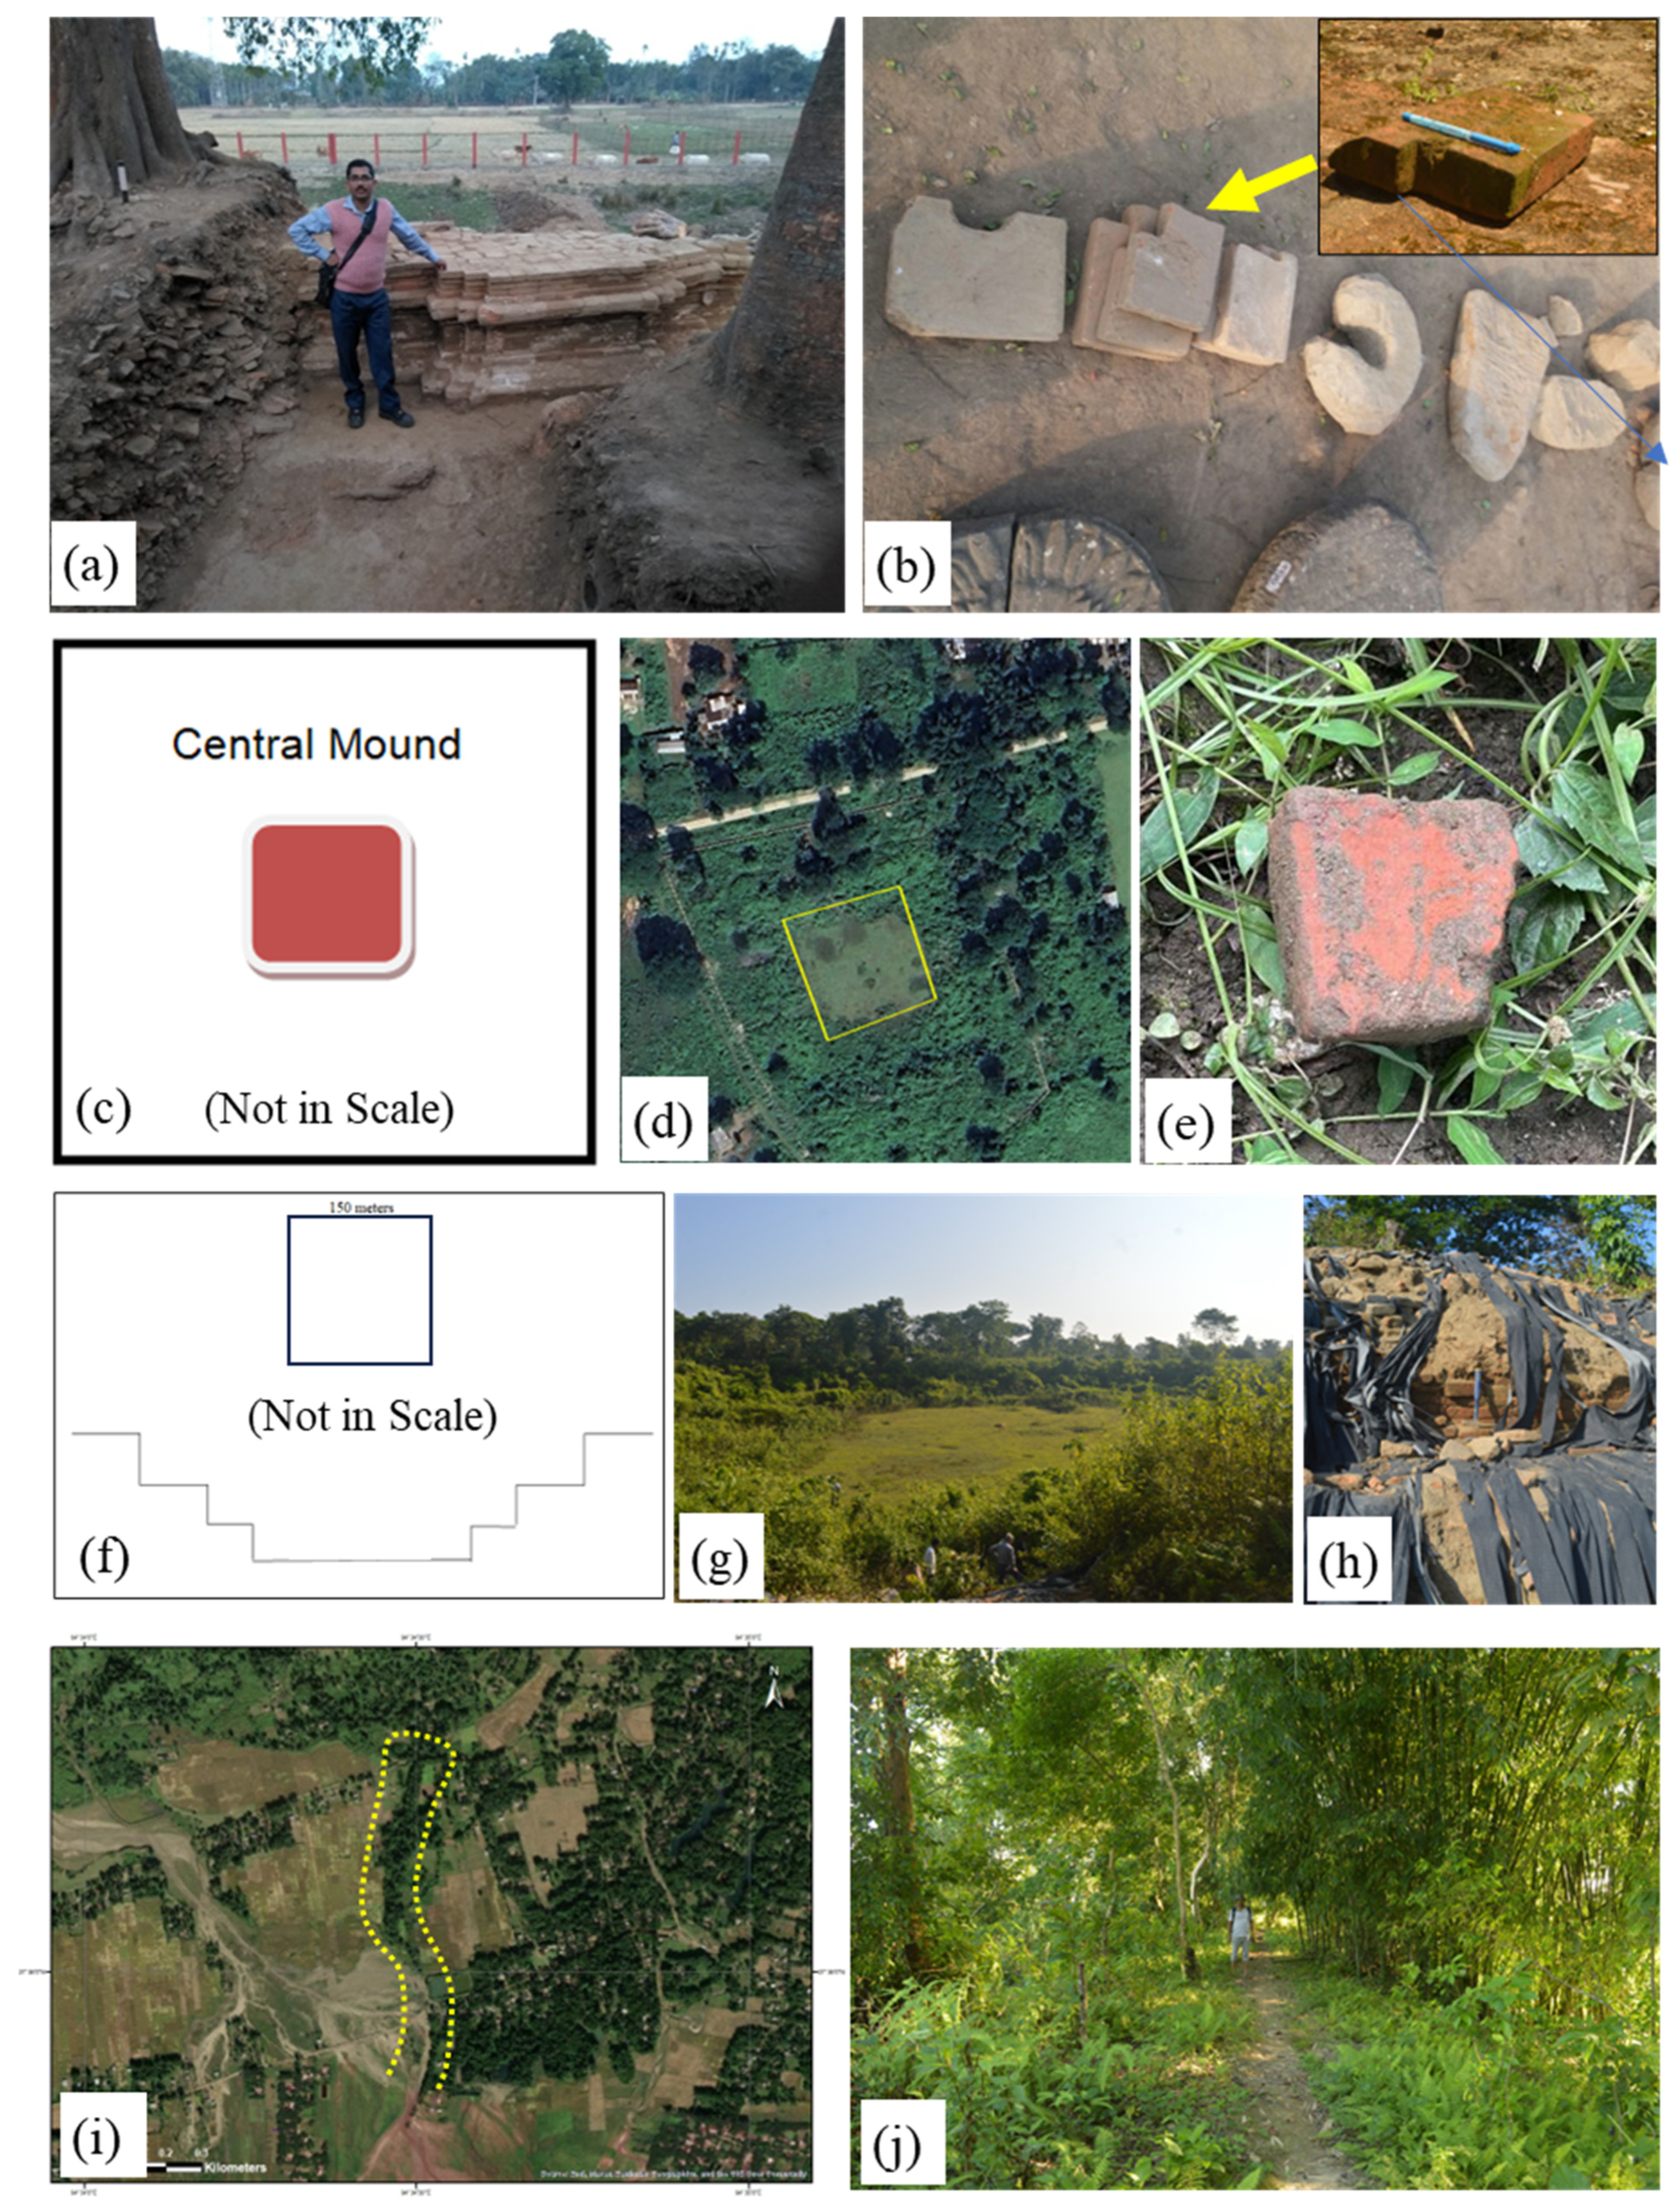
Mouramora is situated on the bank of a palaeo-channel of the River Dihing of Dibrugarh District of Assam, India having latitude 27°20ʹ7.051″ and longitude 94°55ʹ45.512″. It was excavated by the Archaeological Survey of Assam in the year 2017. The unearthed structure looks like a plinth of an old temple, may be constructed on the bank of old River Dihing, now found as palaeo-channel of it (
Figure 2a). The structure is built with a various shaped and sized bricks with sharp and curve edges (
Figure 2b). The bricks have different size that range from 30 cm × 21 cm to about 15 cm × 15 cm with a thickness of about 5 cm. The morphology of the structure and its structural arrangement indicates that it was prepared by a well-organized group of people. A total of three samples of different shape and size have been collected from the site for this work.
1.1.2. Pratima Garh Archaeological Spot
Pratima Garh is a square shaped defensive barricade located in the Sadiya of Tinsukia district of Assam, India having a latitude 27°54ʹ41.400″ and longitude 95°41ʹ25.500″ The length of one side of the barricade is measured almost 300 meters. There is an almost 4.5-meter-high central mound structure (
Figure 2c). Although the site is yet not excavated, one brick sample from this central mound was collected for the present study (
Figure 2d and
Figure 2e).
Figure 2.
Representative field photograph of four archaeological site, (a) Plinth like old temple structure of Mouramora; (b) Flat and varied shaped bricks used to make plinth like structure of Mouramora; (c) Sketch of the sample point of central mould structure of ancient Pratima Garh; (d) Satellite image representing remnants of central mould structure of ancient Pratima Garh; (e) Close up view of collected samples of Pratima Garh; (f) Top view sketch and cross sectional profile of the ancient tank of Padum Pukhuri; (g) Field photographs showing vegetation-covered Padum Pukhuri and (h) Intake bricks on the bank of Padum Pukhuri; (i) Satellite image representing remnants of long defensive embankment of Rukmini Garh; and (j) Field photographs of poorly preserved ancient embankment of Rukmini Garh with sample photographs (inset). .
1.1.3. Padum Pukhuri Archaeological Spot
The studied location is situated in the Sadiya near the Assam-Arunachal state boarder, India having a latitude 27°57ʹ48.110″ and longitude 95°45ʹ40.000″. It is an ancient tank with bank, fortified with bricks. It is a square shaped dry tank structure. The freshly measured depth of the tank is 3 meters and length of its one side is 150 meters (
Figure 2f). Systematic excavation of this pond is not yet started. The brick sample has been collected from the bank of the tank for the present study (
Figure 2g and
Figure 2h).
1.1.4. Rukmini Garh Archaeological Spot
Rukmini Garh is positioned in the Dhemaji district of Assam, India having a latitude 27°36ʹ11.933″ and longitude 94°34ʹ28.817″. It is a 550-meter (as preserve today) long defensive embankment started from foot hills of Eastern Himalayan (Arunachal-Himalaya) region, and is aligning along North-South direction (
Figure 2i). It is assumed that it was originally much longer in length. But due to the seasonal flood by Jokai River (neighbouring river), only 550-meter-long area is remained in poor condition. The construction pattern of the structure is uncommon. At first a core brick wall was constructed and the wall was covered with a thick cover of soil. The core brick wall and the soil cover together made a strong defensive embankment. Samples from the core of the embankment have been collected for the study (
Figure 2j). This place is not excavated yet.
2. Materials and Methods
To achieve the goal of the present study six brick samples have been collected from the specified archaeological sites of Upper Assam (three from Mouramora, one each from Pratima Garh, Rukmini Garh and Padum Pukhuri). The collected samples are studied systematically using the following procedures.
2.1. Colour of the Brick’s Identification
The colour of the brick has been identified using the Munsell colour chart, 1994 revised edition. All the samples from the Mouramora site, called Mouramora 1, 2, and 3, show a light red colour (7/6, HUE 2.5 YR). Other samples, such as Padum Pukhuri, Rukmini Garh, and Pratima Garh, display light red (6/6, HUE 10R), reddish yellow (6/6, HUE 5 YR), and weak red (5/4, HUE 10R) colours, respectively (
Figure 3).
Figure 3.
Photograph representing colour of the bricks of four archaeological site: (a-c) Mouramora site (d) Padum Pukhuri; (e) Rukmini Garh, and (f) Pratima Garh.
Figure 3.
Photograph representing colour of the bricks of four archaeological site: (a-c) Mouramora site (d) Padum Pukhuri; (e) Rukmini Garh, and (f) Pratima Garh.
2.2. XRD and FTIR Analysis
A small portion of the samples has been thoroughly grinded using an agate mortar to make a fine powder for XRD and FTIR analysis. The XRD analysis was carried out using the X-Ray diffractometer ULTIMA IV (Rigaku, Japan) with CuKα radiation in 2θ mode between 2° and 80° with ±2% basic accuracy. The mineral phases present in the studied bricks were identified after comparing their d-spacing and 2θ values in published literature (Chen, 1977; Lindholm, 1987; Tucker, 1988).
The FTIR spectra of the samples were determined after being pelletized with spectra grade KBr and recorded at room temperature in a wide range of wave numbers from 400 to 4000 cm-1 by using FTIR-SPECTRUM two (Perkin Elmer Inc.). The investigation of XRD and FTIR, analysis of the studied brick samples was performed at the CSIR-North East Institute of Science & Technology, Jorhat, India.
2.3. SEM and EDS Analysis
To understand the internal morphology of the brick samples, they were analysed using Scanning Electron Microscopy (SEM) and Energy Dispersive Spectrometer (EDS) techniques. The SEM coupled with the elemental analysis was done using Field Emission Scanning Electron Microscopy (FESEM) make in Carl ZEISS Microscopy, Germany. The samples coated with a thin layer of gold or platinum were examined with SEM, using various magnification for all the samples in the study. The investigation of SEM, and EDS analysis of the studied brick samples was performed at the CSIR-North East Institute of Science & Technology, Jorhat, India.
2.4. TL and OSL/IRSL Dating
For the TL and OSL/IRSL dating investigation, the material was sampled with a low-speed drill from the inner part of the bricks and all the procedures were followed under dim red light according to the fine-grain protocol (Zimmerman, 1971) the obtained polymineral fraction (4–11 μm) was deposited onto stainless steel discs and used for both TL and OSL/IRSL measurements. This fraction, mainly consisting in quartz and feldspars, can be excited by both blue (OSL) and infrared radiations (IRSL), the latter being effective only on feldspars.
TL/OSL/IRSL measurements were performed with a Risø TL-DA-20 reader, using blue-LEDs (470 ± 30 nm, ∼72mW/cm2) for OSL and infra-red LEDs (λ = 850 nm, ∼270 mW/cm2) for IRSL and detecting the emitted photons with an Electron Tube PDM 9107Q-AP-TTL-03 coupled with a U-340 filter for OSL and a Schott BG3/BG39 filter combination for IRSL measurements. The system is equipped with an internal 90Sr-90Y beta source (dose rate: 0.127 ± 0.05 Gy/s).
To evaluate the Equivalent Dose (E.D.), two different techniques were applied: the Multiple-Aliquot Additive protocol (MAAD, Aitken, 1985) was used with TL and the Single Aliquot Regenerative dose (SAR, Murray & Roberts, 1998) protocol with OSL and IRSL.
The annual dose rate was indirectly derived from the measurement of the radioactivity of the samples. The U and Th concentrations were obtained by total alpha counting using ZnS scintillator discs assuming a Th/U concentration ratio equal to 3.16 (Aitken, 1985). The contribution due to 40K content was deduced from the total concentration of K obtained by flame photometry. For IRSL, the effect of the internal K-content of feldspar was considered. Alpha particles are less effective in inducing luminescence than beta and gamma radiation. This was considered by the a-value determination, which is based on the comparison of the luminescence signals induced by alpha and beta laboratory irradiations. Because water absorbed part of the radiation that would otherwise reach the sample, the saturation water content was evaluate for each brick. The F value (i.e. the fraction of saturation to which the assumed average water content corresponds) was considered equal (75 ±10) % for all samples, considering the available information of humidity of the area. The cosmic ray contribution to the final dose rate was added (Prescott & Hutton, 1994). The TL/OSL/IRSL dating have been performed in the LAMBDA Lab of Department of Material Science of the University of Milano-Bicocca, Milano, Italy (Panzeri et al., 2022).
3. Results and Discussion
In the following the obtained data are discussed.
3.1. Identification of Mineral through FTIR Analysis
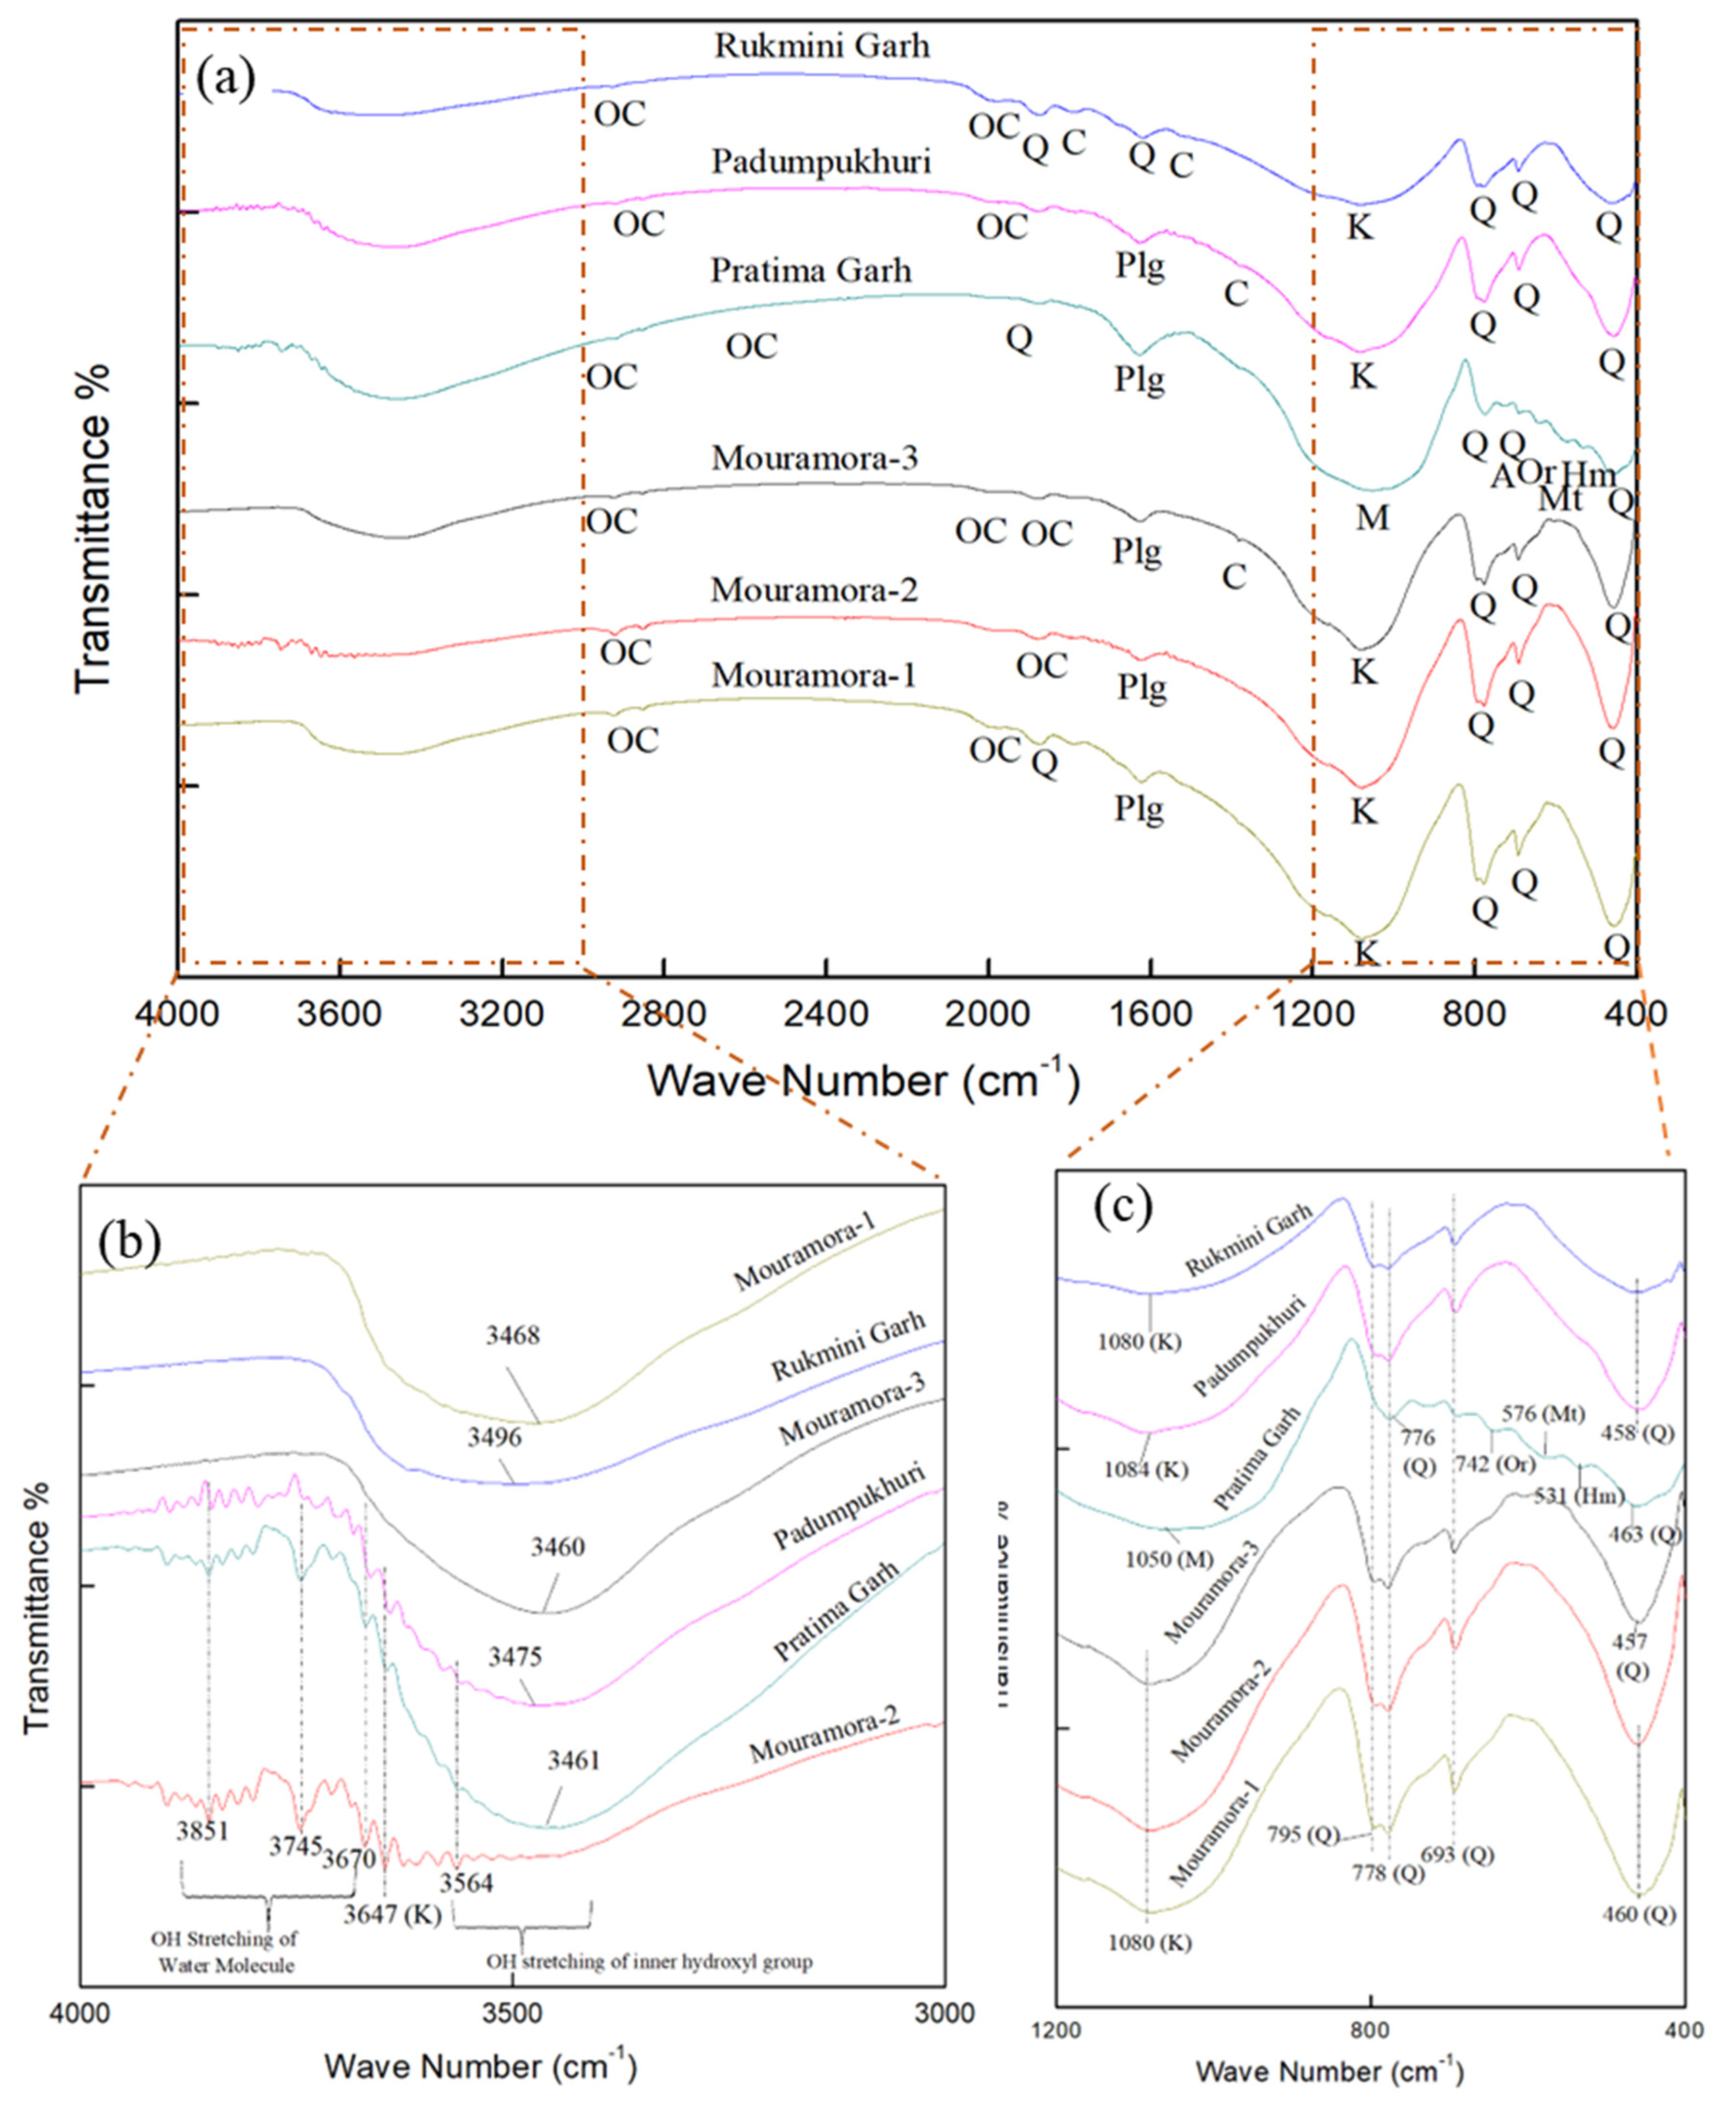
The FTIR spectra of the studied brick samples are depicted in
Figure 4 (a). Since a few FTIR spectra are not easy to recognize, the graphs have been separated into two ranges at 1200-400 cm
-1 and 4000-3000 cm
-1 (
Figure 4 b and c). The minerals identified in the spectrum were based on existing literature sources (listed in
Table 1). These minerals include quartz, feldspar (albite, orthoclase), kaolinite, palygorskite, chlorite, organic carbon, cerussite, hematite, and magnetite. All the brick samples under investigation contains quartz, kaolinite, organic carbon, and palygorskite (barring Rukmini Garh).
The presence of quartz was confirmed by characteristic vibrational peaks at 457-458cm-1 (Si-O asymmetrical bending) and 460-463 cm-1, (Si-O asymmetrical bending), 692-693 cm-1(Si-O symmetrical bending), and 776-778 and 795 cm-1 (Si-O symmetrical stretching). The existence of quartz in the Mouramora-1, Pratima Garh, and Rukmini Garh brick samples has been supported by the presence of weak absorption peaks at 1619 cm-1 and 1870-1876 cm-1.
The feldspar group of minerals is merely present in the Pratima Garh brick sample, which included orthoclase, microcline (K-feldspar), and albite (Na-feldspar). Their presence was established by vibrational peaks at 1050 cm-1(Si-Al-O stretching for microcline feldspar), 642 cm-1 (Al-O coordination vibrations suggesting orthoclase feldspar), and 725 cm-1 (Al-O-Si stretching for albite feldspar).
In general, four significant IR spectra of OH-stretching regions are employed to distinguish kaolinite, with relative intensities of 3695, 3665, 3650, and 3620 cm-1 (Elsass and Olivier, 1978; Bukalo et al., 2017). However, the presence of other minerals may influence the intensity and resolution of these vibration bands. The studied samples encompass no prominent kaolinite peaks at 3695, 3665, 3650, or 3620 cm-1. Bukalo et al., 2017assigned the OH stretching region peak with an intensity of 3647 cm-1 as kaolinite. In the presence of a peak at 3647 cm-1 with weak OH stretching of the inner hydroxyl group in the Mouramora-2 and Pratimagarh samples affirms the signatures of kaolinite. Other FTIR spectrum ranging from 3671-3851 cm-1 represents the OH stretching of water molecules. The 3460-3496 cm-1 spectra imply mixed layered OH stretching and bending vibrations inner-surface hydroxyl groups. The OH stretching of the inner hydroxyl group mineral chlorite was also observed in the Mouramora-2 samples at 3565 cm-1 regions. The IR spectrum for kaolinite with thin particles exhibits peaks at 1105 and 695 cm-1, however as the particle size increased, the vibrational bands shifted to 1080 and 689 cm-1 (Elsass and Olivier, 1978). Barring the sample Padumpukhuri, rest of the five studied samples displays broadening bands at 1080 and 1084 cm-1.
Carbonate minerals have been found in three different locations: Mouramora-3, Padum Pukhuri, and Rukmini Garh, with FTIR spectra of 1381, 1384, and 1788 cm-1. The carbonate mineral with a prominent relative intensity at 1396 cm-1 resembles the mineral cerussite (Lyon, 1967). However, Ramasamy et. al (2009) considered the intensity ranges of 1380-1385 cm-1 as indicative mineral of cerussite. Hence, the presence of spectra at 1381, 1384 and 1788 cm-1 is in good agreement with the carbonate mineral cerussite and calcite, respectively.
The complex nature of absorption bands in stretching and bending regions of water molecules is a distinguishing feature of palygorskite. Palygorskite may be responsible for the presence of bands in the region 1623-1630 cm-1. Many researchers have studied similar patterns (Hayashi et al., 1969; Russell, 1987; Serna et al., 1977).
An additional peak in the ranges 2919-2928, 2851-2854, 2004, 1984-1998, and 1878-1879 cm-1 indicates C-H stretching vibrations caused by a weaker organic compound (Bain & Fraser, 1994; Dios Cancela et al., 1996; Hajjaji et al., 2001; Song et al., 2001).
The prominent iron minerals hematite and magnetite were detected, with 531 and 576 cm-1 spectra in the Pratima Garh sample. Their presence was possibly due to replacement of Fe2+ and Fe3+ (Fysh & Fredericks, 1983).
3.2. Identification of Mineral through XRD Analysis
The XRD pattern of the studied brick samples has been presented in
Figure 5. Non-clay minerals identified include quartz, feldspar (orthoclase, microcline, oligoclase, sanidine, and albite), aragonite, dolomite, laumontite, ilmenite, siderite, hematite, chlorite, trona, pyrite,magnesite, wollastonite, goethite, and glauconite. However, kaolinite minerals are not recorded in the XRD results, despite appearing in the FTIR, due to the disorderliness (loss of crystalline nature) of the respective minerals. The minerals with the most intense reflections are quartz (3.34Å), orthoclase (3.29Å, 3.31Å), and wollastonite (3.32Å). The clay mineral kaolinite is not identified in the XRD analysis, which may indicate that this mineral is completely disordered. Carbonate and iron-bearing minerals are noted.
3.3. The Firing Temperature Analysis Using FTIR and XRD
The IR spectra of dioctahedral and trioctahedral layer silicates displays a very complex band system in the OH stretching region (Elsass & Olivier, 1978). In the present study, the absorption bands at 3671-3851 cm-1 and 3460-3496 cm-1 are assigned to the OH stretching of water molecules and OH stretching of the inner hydroxyl group, respectively and may corresponds to these complex stretching bands. However, upon heating of sample, it undergoes dehydration at 200°C and continues at 380°C, resulting in a weakening of the broad band of 3400cm-1 broad band and breaking of the crystal structure at 500°C (Elsass & Olivier, 1978). In addition, disorder in the octahedral and tetrahedral sheets is notable, with partial removal of the 535 cm-1 Si-O bending band and broadening of the Si-O stretching bands in the 1100-1000 cm-1 region (Elsass & Olivier, 1978). The broadening of Si-O stretching bands at 1100-1000 cm-1 region in the studied bricks implies a firing temperature of 500°C. Additionally, at 500°C, the absorption peak at 915 cm-1 indicates that Al (OH) vibrations in an octahedral sheet structure begin to collapse (Elsass & Olivier, 1978; Maniatis et al., 1982; Miller, 1961; Raja Annamalai et al., 2014; K. Ramasamy & Kamalakkannan, 1987). The absence of 915cm-1 spectra in the studied samples suggests that all the samples were fired above 500°C.
With increasing temperature, the Si-O stretching band shifts towards higher frequencies and broadens, with the maximum intensity around 1025 cm-1 at 100°C and shifting to the band around 1036 cm-1 at 600°C (Damjanović et al., 2011; Raja Annamalai et al., 2014). The silicate structure disappeared when the clay was fired to 650°C, and a broad symmetry band was detected at 1035 cm-1 for red clay and 1080 cm-1 for white clay (Maniatis & Tite, 1981; Raja Annamalai et al., 2014). The presence of an absorption band in five samples around 1080-1084cm-1 indicates that white clay of kaolinitic composition was used in the investigated brick samples, which were fired to 650°C.
The presence of hematite and magnetite, as indicated by the peak at 540 cm-1, is an indication of iron oxides formed during fabrication firing processes above 650°C (Raja Annamalai et al., 2014; Ravisankar et al., 2012, 2013). However, the presence of hematite implies that they were fired in open air or in a completely oxidising atmosphere at the time of manufacture (Ravisankar, Kiruba, Naseerutheen, et al., 2011; Ravisankar, Kiruba, Shamira, et al., 2011). The presence of hematite and magnetite in the studied Pratima Garh sample indicates that it was fired above 650oC in open air or in a perfectly oxidising atmosphere at the time of manufacture, and the type of clay used is plausibly red clay. It can also be inferred that the artisans of Pratima Garh brick were well aware of the technology implemented in firing the bricks under both an oxidizing and a reduced atmosphere, which is inferred by the presence of peaks of 531 and 576 cm-1 respectively.
During the firing of clay resembles remarkable changes at 1000 to 1200 °C, where the X-ray diffractogram of quartz become disappears. Gradually quartz decomposes from 800 to 1100°C, peaking at 1100°C and then disappearing. Up to 800°C, all the decomposed and disappearing phases contribute to the formation of a vitreous phase. At this point, the clay would be mostly amorphous, with some residual grains of quartz, neo formed mullite, hematite and other high-temperature mineral phases like microcline. As a result, except at 1200°C, quartz was a residual phase, i.e., a component of the raw clay that did not undergo chemical transformations during the firing stage. On the contrary, during the firing process, mullite, hematite and other silicates were formed. At temperatures ranging from 700 to 900°C, clays showed phyllosilicate destruction followed by vitrification, which is significant at temperatures above 1000°C (Castellanos et al., 2012).The presence of orthoclase, microcline, albite, hematite, and magnetite in the Pratima Garh, Rukmini Garh, Padumpukhuri and Mouramora- bricks supports the high firing temperature of more than 800°C.
Clay deposits typically contain some organic material, but artisans can also add organic compounds to the ceramic paste during the preparation process to increase plasticity (Shoval, 1994).
At ~400-650 °C, depending on the type of flux and other raw materials used, the initial ingredients decompose and CO2, S, and hydrocarbons are lost. Dehydration occurs at ~100°C, followed by dehydroxylation of clay minerals at temperatures ranging from ~450 to 750°C, depending on the type and purity of the clay (Russ et al., 2005). Dehydration and dehydroxylation of relatively pure clay minerals occur at various temperatures depending on the clay minerals present. Chlorite loses water at a relatively high temperature, usually starting at ~750, but this temperature is determined by the mineral chemistry. Illite (mica) transformation begins with dehydration at ~600-700°C. When carbonate minerals are heated, they release carbon dioxide; for example, calcite decomposition begins at 650°C. The temperature of phase transformation varies from sample to sample due to a variety of factors such as mineral grain size, heating rate, and how easily the evolved carbon dioxide can be lost to the atmosphere (Cultrone et al., 2004). At ~573°C, alpha/low quartz structurally transforms into beta/high quartz. Because this transition involves rotation rather than bond breaking, the reaction is reversible, and any high-quality quartz that remains after the high-temperature soak will invert to low-quality quartz during the cooling phase of the firing cycle. The brick expands as the temperature rises; however, if the cooling rate is too fast, highly damaging microcracking can occur (Grim, 1968).
The firing minerals that are generated during the production of pottery are dependent on a number of factors, including the makeup of the clay, materials added to it, the atmosphere, and the length of the firing process. High-temperature minerals such as gehlenite and diopside are formed from the decomposition products of illite and calcite (Maritan et al., 2006; İssi et al., 2011; Papachristodoulou et al., 2006). At 650°C, calcite starts to break down; at 850°C, high-temperature calco-silicates and alumino-calco-silicates, such as diopside and anorthite, are the products of this process. At temperatures higher than 830°C, wollastonite—which is created when quartz and lime react at approximately 920 to 1000°C—replaces gehlenite in systems that contain gehlenite (Böhme et al., 2019). The presence of wollastonite and feldspar (albite, orthoclase, and microcline) in the Pratima Garh, Padumpukhuri, Rukmini Garh and Mouramora-3 brick samples indicates that the bricks were fired at temperatures above ~800°C. The presence of the iron oxide minerals hematite and magnetite in the same sample, on the other hand, indicates that they were fired at temperatures higher than 650°C, as indicated by the FTIR and XRD studies. In their analytical study of ancient pottery, discovered that feldspar decomposes at temperatures ranging from 900 to 950°C (Iordanidis et al., 2009). The presence of feldspar in the samples indicates that they were all fired at temperatures lower than 900°C. This clearly shows that the Pratima Garh, Padumpukhuri, Rukmini Garh, and Mouramora-3 brick samples were fired at temperatures lower than 900°C in oxidising kiln atmospheric conditions. The estimated firing temperature of the samples is presented in
Table 2. However, research concentrating on Thermogravimetry-Differential Thermal Analysis (TG-DTA), apparent porosity, water absorption, and other pertinent aspects will be required to establish the accurate fire temperature of the investigated bricks.
3.4. The Firing Temperature Analysis Using and SEM-EDS
SEM-EDS provides valuable information on the pore structure and the glassy phase development used to study systematically the internal morphology changes occurring when fired in a temperature range 600°C to 1300°C and this can be employed and coupled with Energy Dispersive spectrometer (EDS) for minerals detection (Maniatis et al., 1983). Scanning Electron Microscope is a vital tools to examine ancient pottery and established the ancient ceramic technology (Tite & Maniatis, 1975). It is an excellent tool and it has been found useful in many applications to characterize the archaeological artifacts (Goldstein et al., 2003; Tite, 1992). The SEM with EDS analysis is non-destructive and capable of offering precise elemental composition information towards the analysis of archaeological potsherds. They conclude that the presence of Ca as tine grained and evenly distributed calcite in clays significantly affects the development of vitrification, if calcium present in the sample, say CaCO3, dissociates into CaO and vitrification sets in around 850°C.
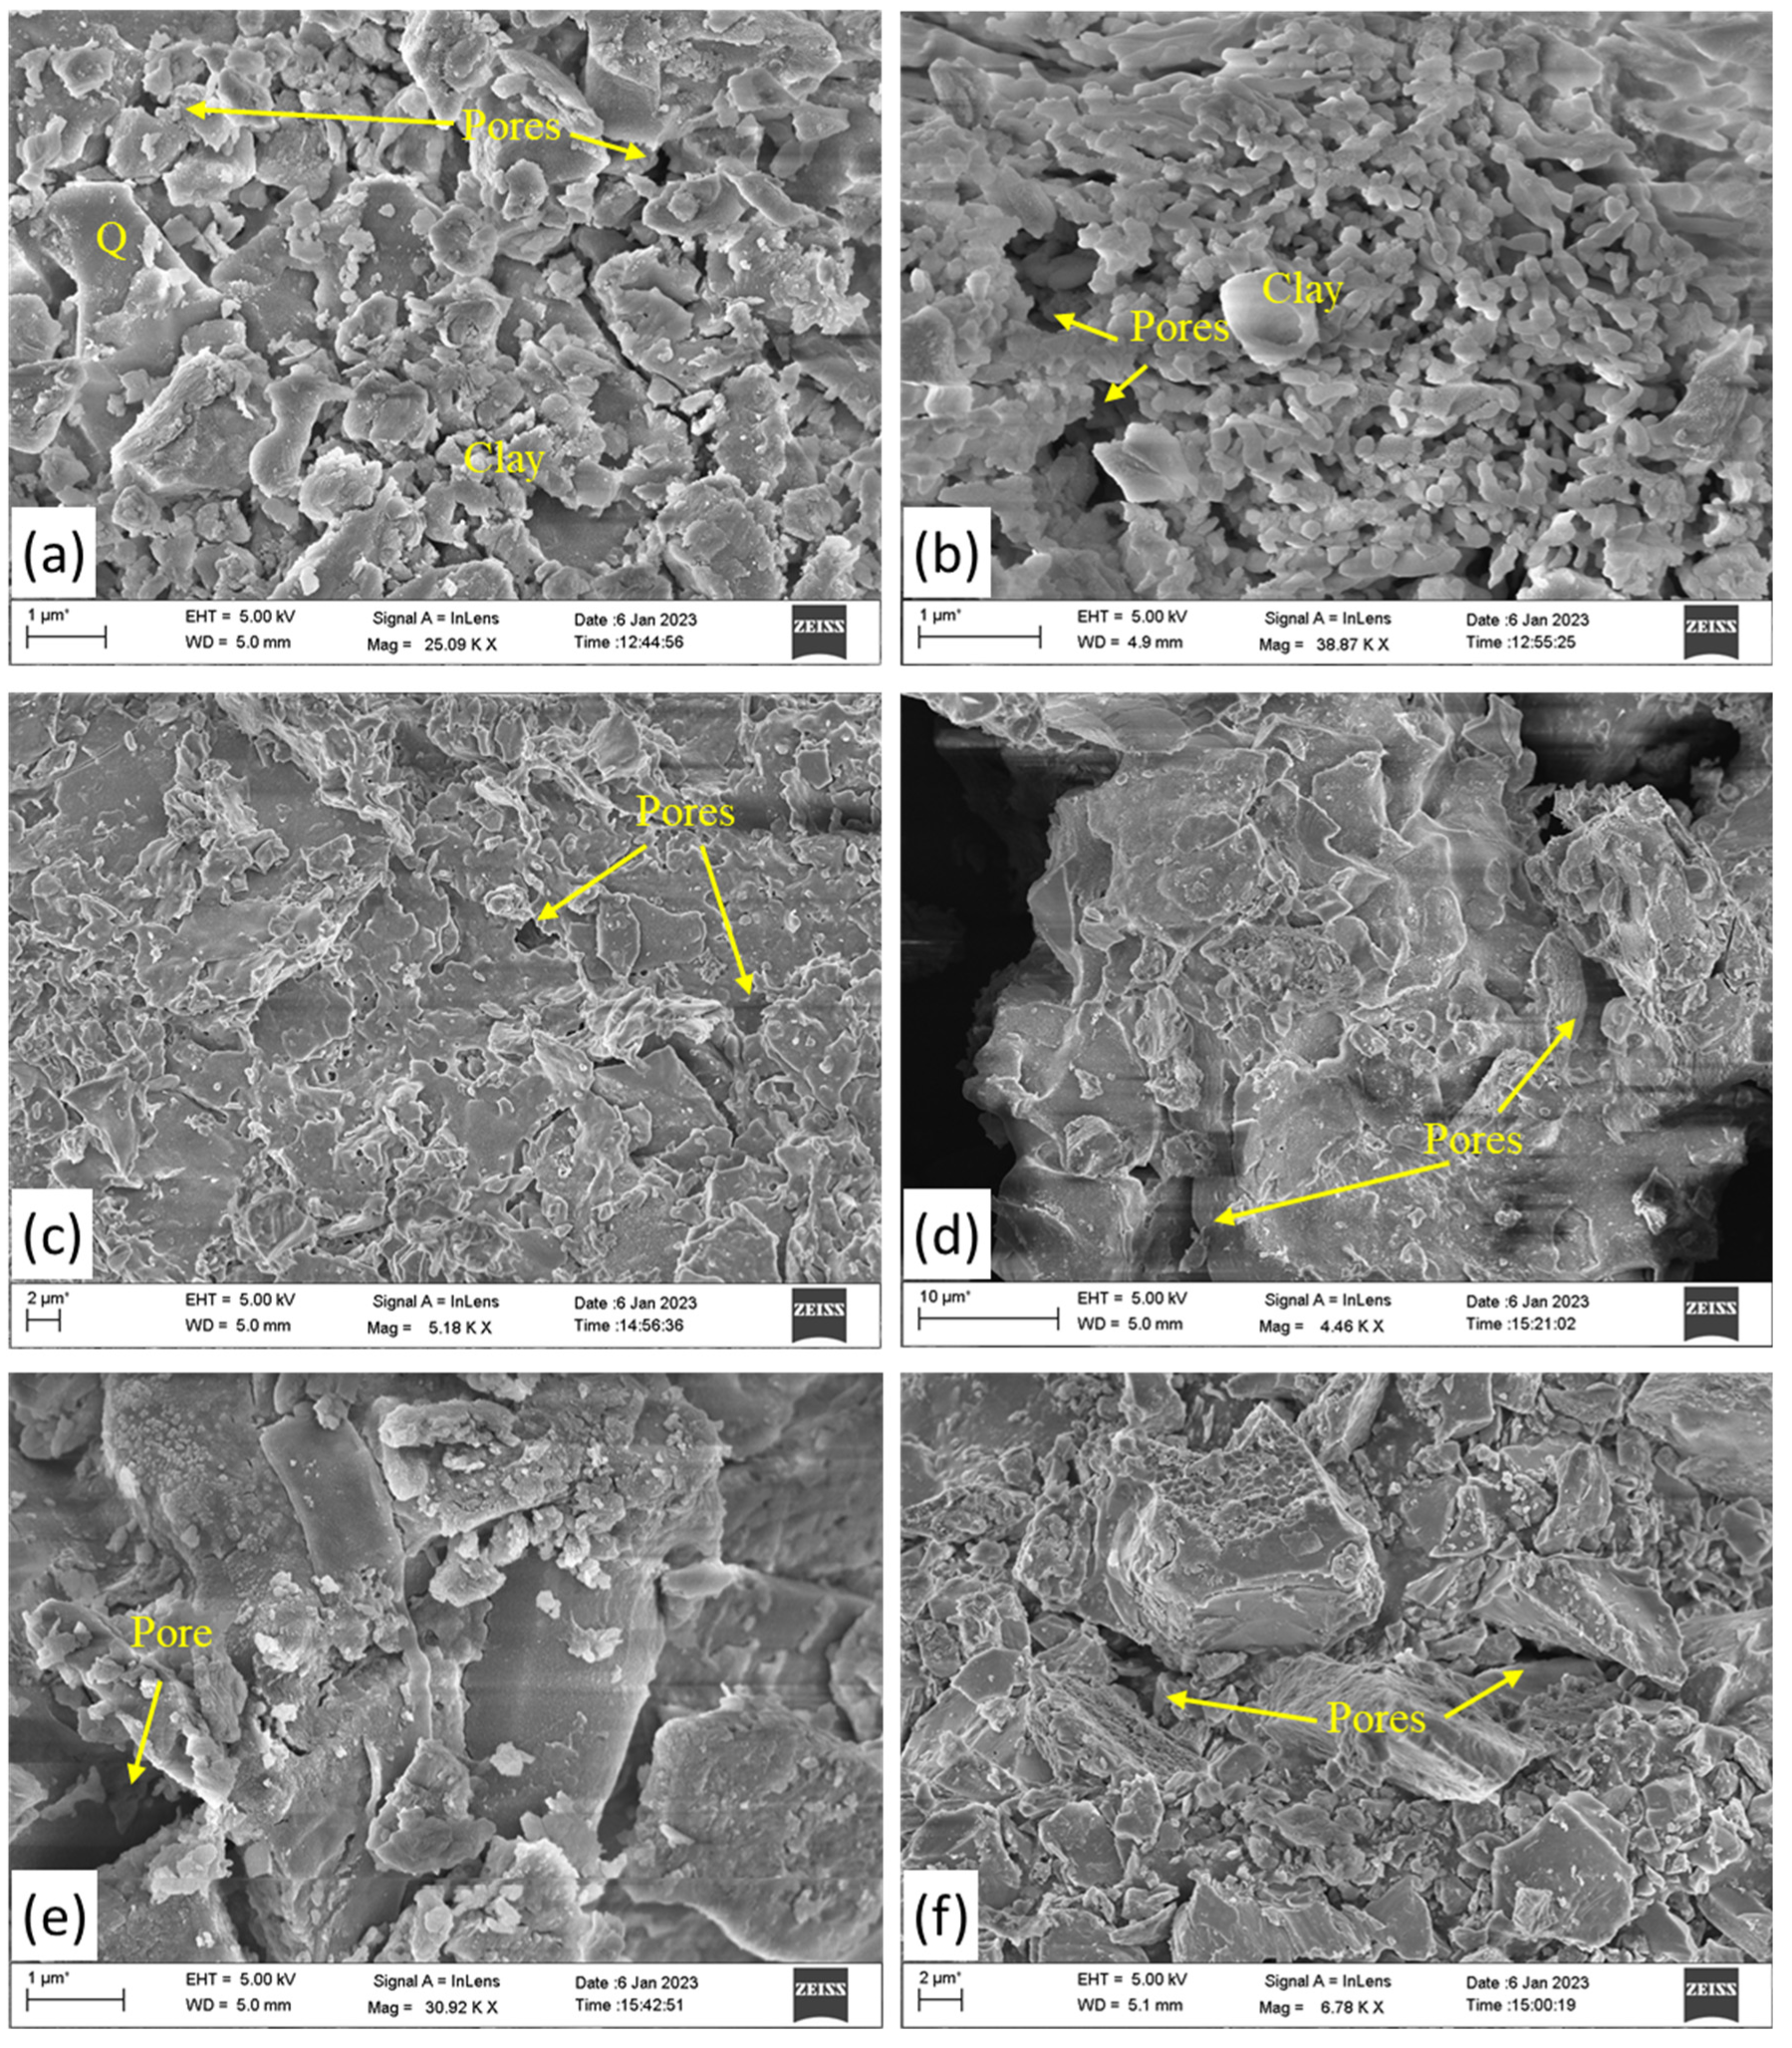
The non-calcareous clays fired at temperatures below 800°C will produce no vitrification (Maniatis & Tite, 1978). However, well- crystallized hematite is abundant in non-calcareous clays. The absence in the studied bricks of vitrification, is the evidence of firing temperature below 800°C during manufacturing by artisans and it is well evidenced by FTIR, and XRD study. Firing at 900°C produces much more pronounced changes in the clay body, sintering is quite advanced and much vitrification has been produced (Maniatis et al., 1983). (Leriche et al., 2017) Leriche et al. 2017, stated that continuous heating initiates densification which leading to a reduction in porosity and later it could lead to the generation of residual porosity and initial grain growth. They also opined that this process initially creates necks between particles, followed by developments of cylindrical shape interconnected pores and lastly pores change to a more spherical and isolated state as temperature increases. The SEM micrographs of the studied samples show the micropores are cylindrical shape with interconnected pores (
Figure 6a & b). as well as change in pores shape to spherical and isolated state (
Figure 6c-f) suggests that the heating temperature increases in the bricks of Mouramora-3, Padum Pukhuri, Pratima Garh, and Rukmini Garh, then the Mouramora-1 and Mouramora-2 bricks.
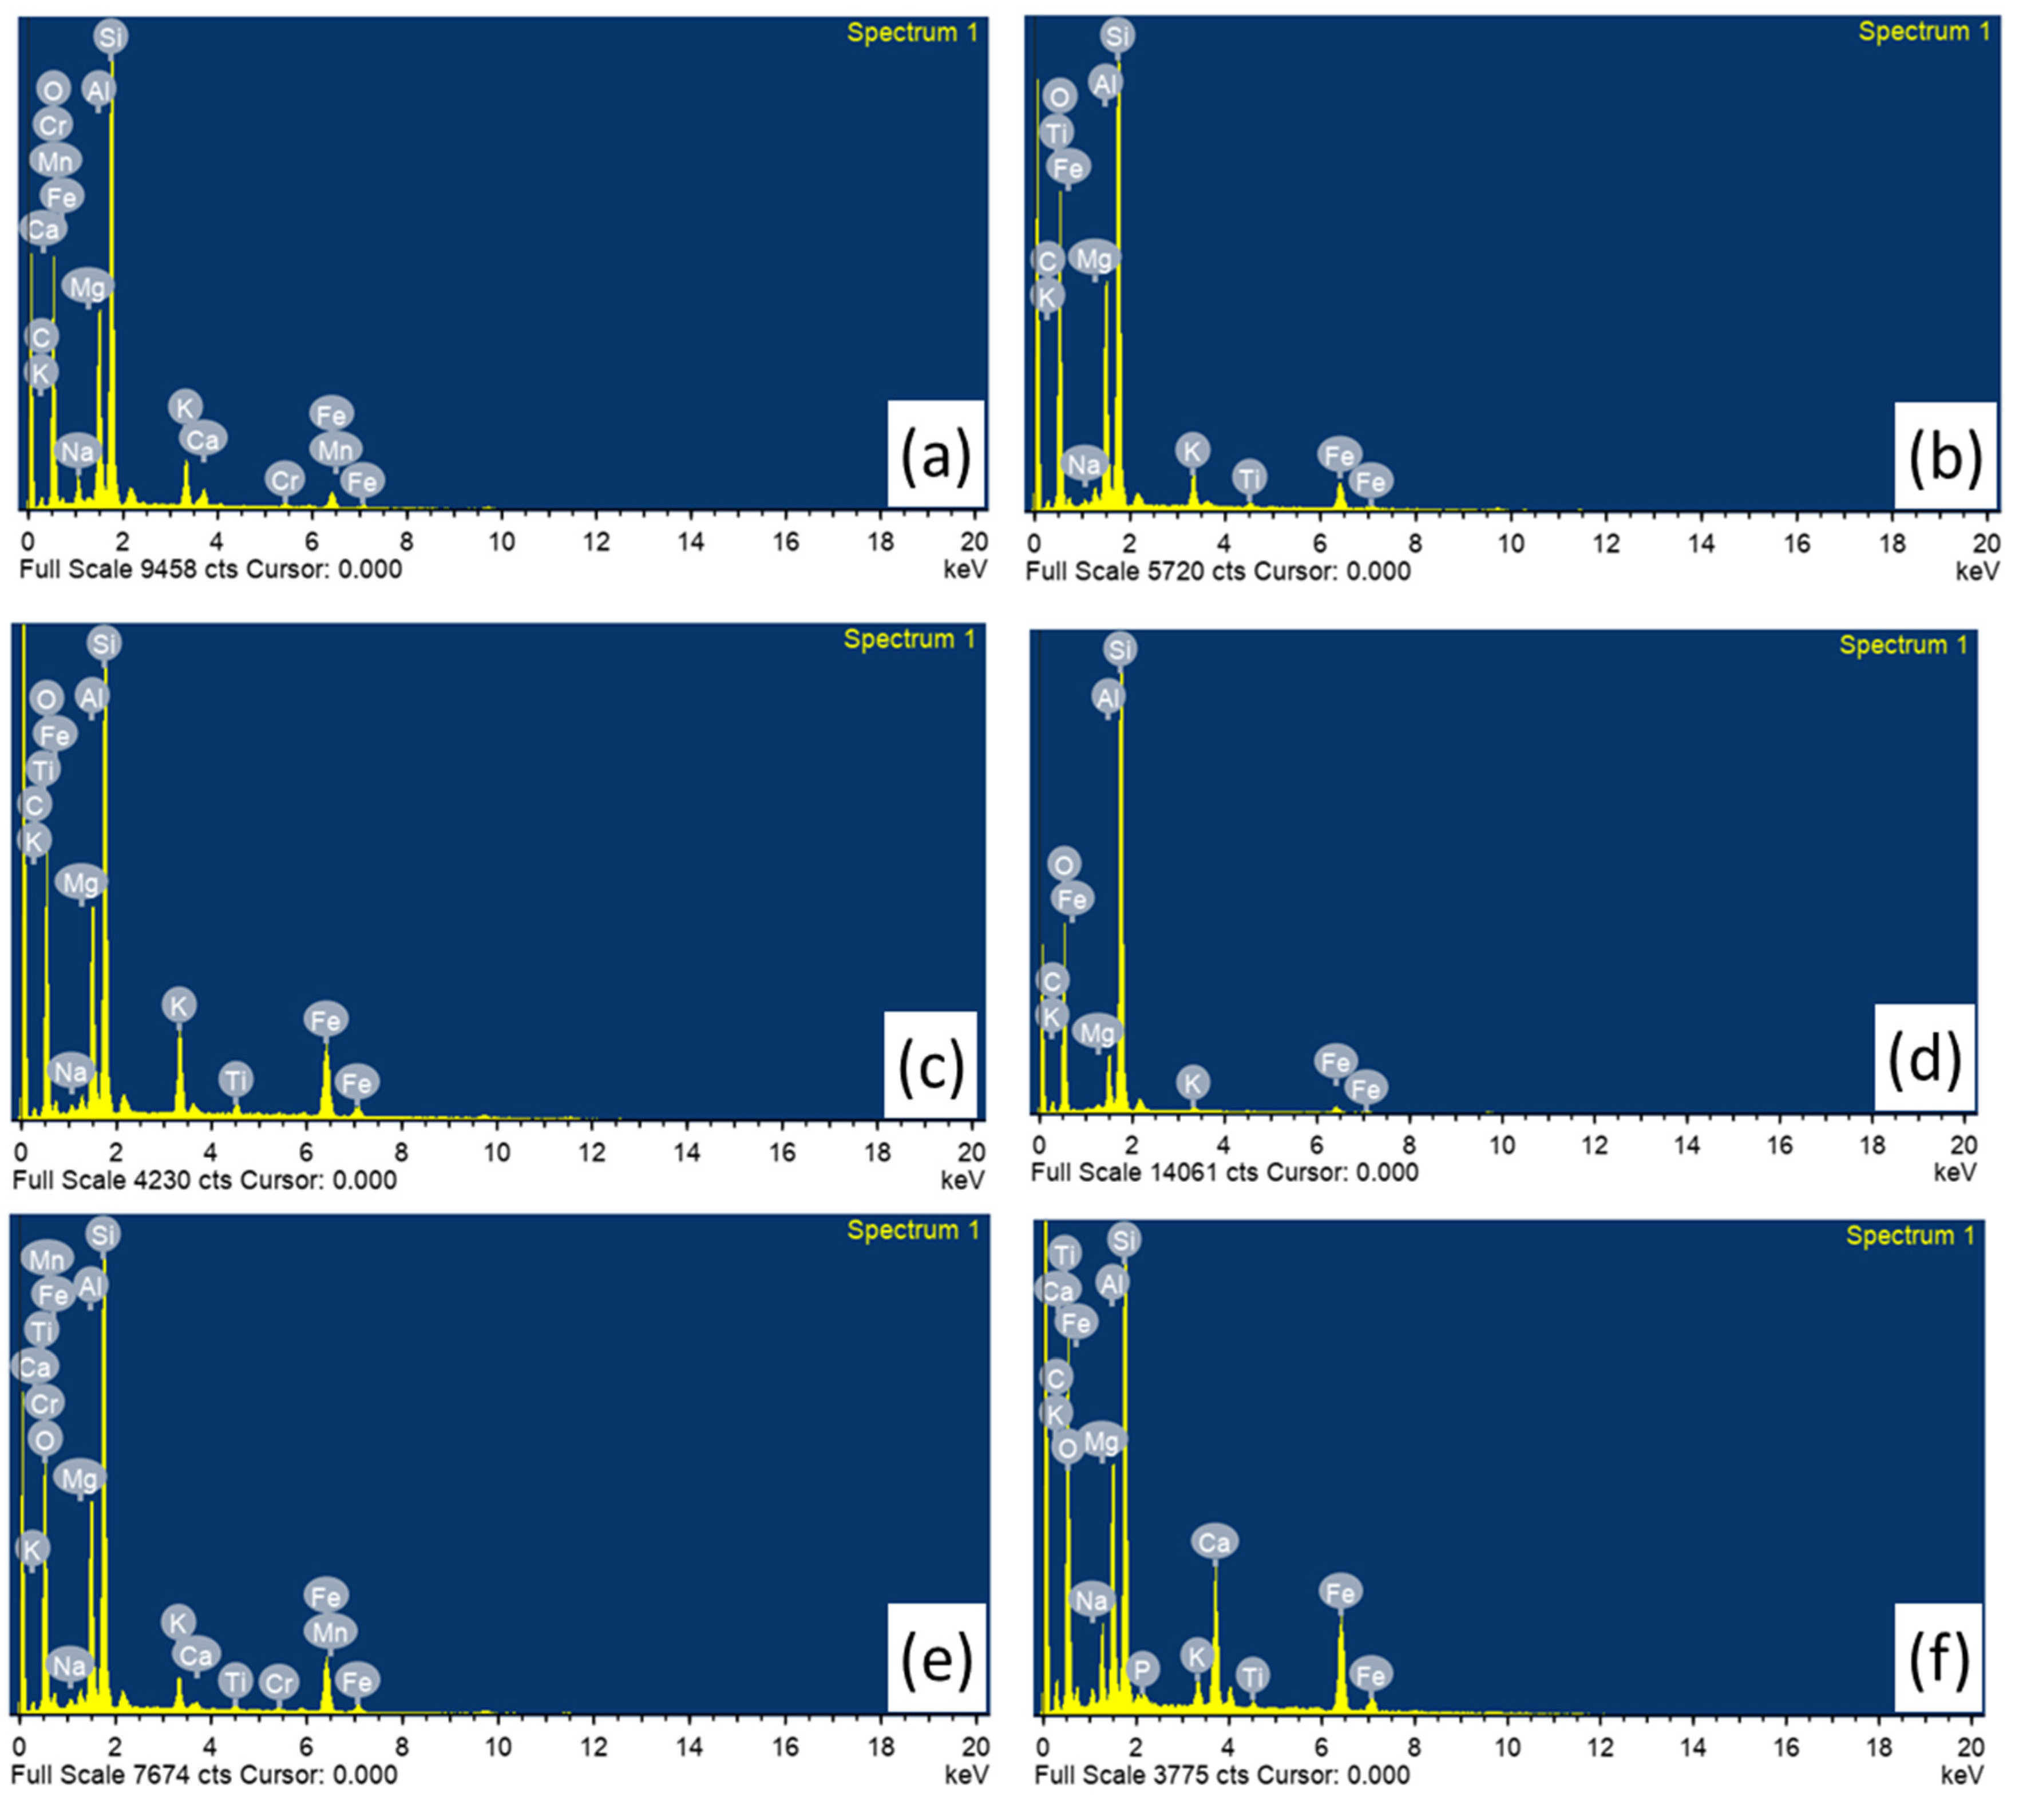
The chemical composition of the sample was obtained by EDS analysis and its representative spectrum is shown in Fig 7. From the EDS analysis, the potsherds mainly have the concentrations of silica (SiO2), alumina (Al2O3) and fluxes (Na2O, K2O, Fe2O3, CaO, MgO and TiO2) as the compositions were identified in all the samples except Na2O, CaO and TiO2 in Padum Pukhuri, CaO and TiO2 in Mouramora 1 and CaO in Mouramora 2. Researchers claim that the total flux concentration within potsherds provides valuable insights into the thermal behaviour of bricks, contributing to the formation of a vitreous or glassy phase (Lecomte et al., 2004; Osborn & Muan, 1960). When multiple components like Na2O, TiO2, Fe2O3, CaO, and MgO, are present along with SiO2 and Al2O3, a large portion of liquid is generated which is referred to as glassy or vitreous phase (Garzón et al., 2022). The total flux content of potsherds was determined using the formula Total Flux Content = RO + R2O + Fe2O3 + TiO2, where RO = CaO + MgO and R2O = K2O + Na2O (Garzón et al., 2022; Sánchez-Soto et al., 2023). In the present study the total flux content has been calculated, which values ranges 8.91–25.77 wt%, where samples from Mouramora-3, Padum Pukhuri, Pratima Garh, and Rukmini Garh exhibited higher values, whereas Mouramora-1 and Mouramora-2 bricks displayed lower values.
If the fluxes concentration (K2O, Fe2O3, CaO, MgO and TiO2) are more than 9% the clays are classified as low refractory and classified as high refractory if the fluxes in the sample are less than 9% (Ravisankar et al., 2013). On the other hand the clays containing CaO greater than 6%, are known as Calcareous clays and CaO less than 6% are known as non-calcareous clays (Maniatis & Tite, 1981). Based on the above statement and from EDS results it is inferred that the baring Pratima Garh bricks all the studied samples have been made of non-calcareous clay. Moreover Mouramora-1, Mouramora-2 and Padum Pukhuri show high refractory clay and Mouramora-3, Pratima Garh and Rukmini Garh reflect low refractory characteristics. From the analysis, silica is enriched in all the samples and found as the major element in all the bricks percentage varies from 66.81% to 82.10%. All the bricks having low refractory clay consists high Iron oxide content ranges from 10.88% to 12.84%. The chromium concentrations have been noticed in two of the studied samples Mouramora-1 (0.53%) and Rukmini Garh (0.47%). It should be noted, however, that the pottery composition depends both in the clay source and in the recipe used to prepare the clay paste (Papachristodoulou et al., 2006). The variation of chemical composition of bricks may imply pottery from different production sites or reflect the natural inhomogeneity of local clay deposits and the application of different manufacture processes in local workshops. The SEM-EDS result for the firing temperature analysis is in good agreement with the FT-IR, and XRD results.
3.5. TL, OSL and IRSL Results
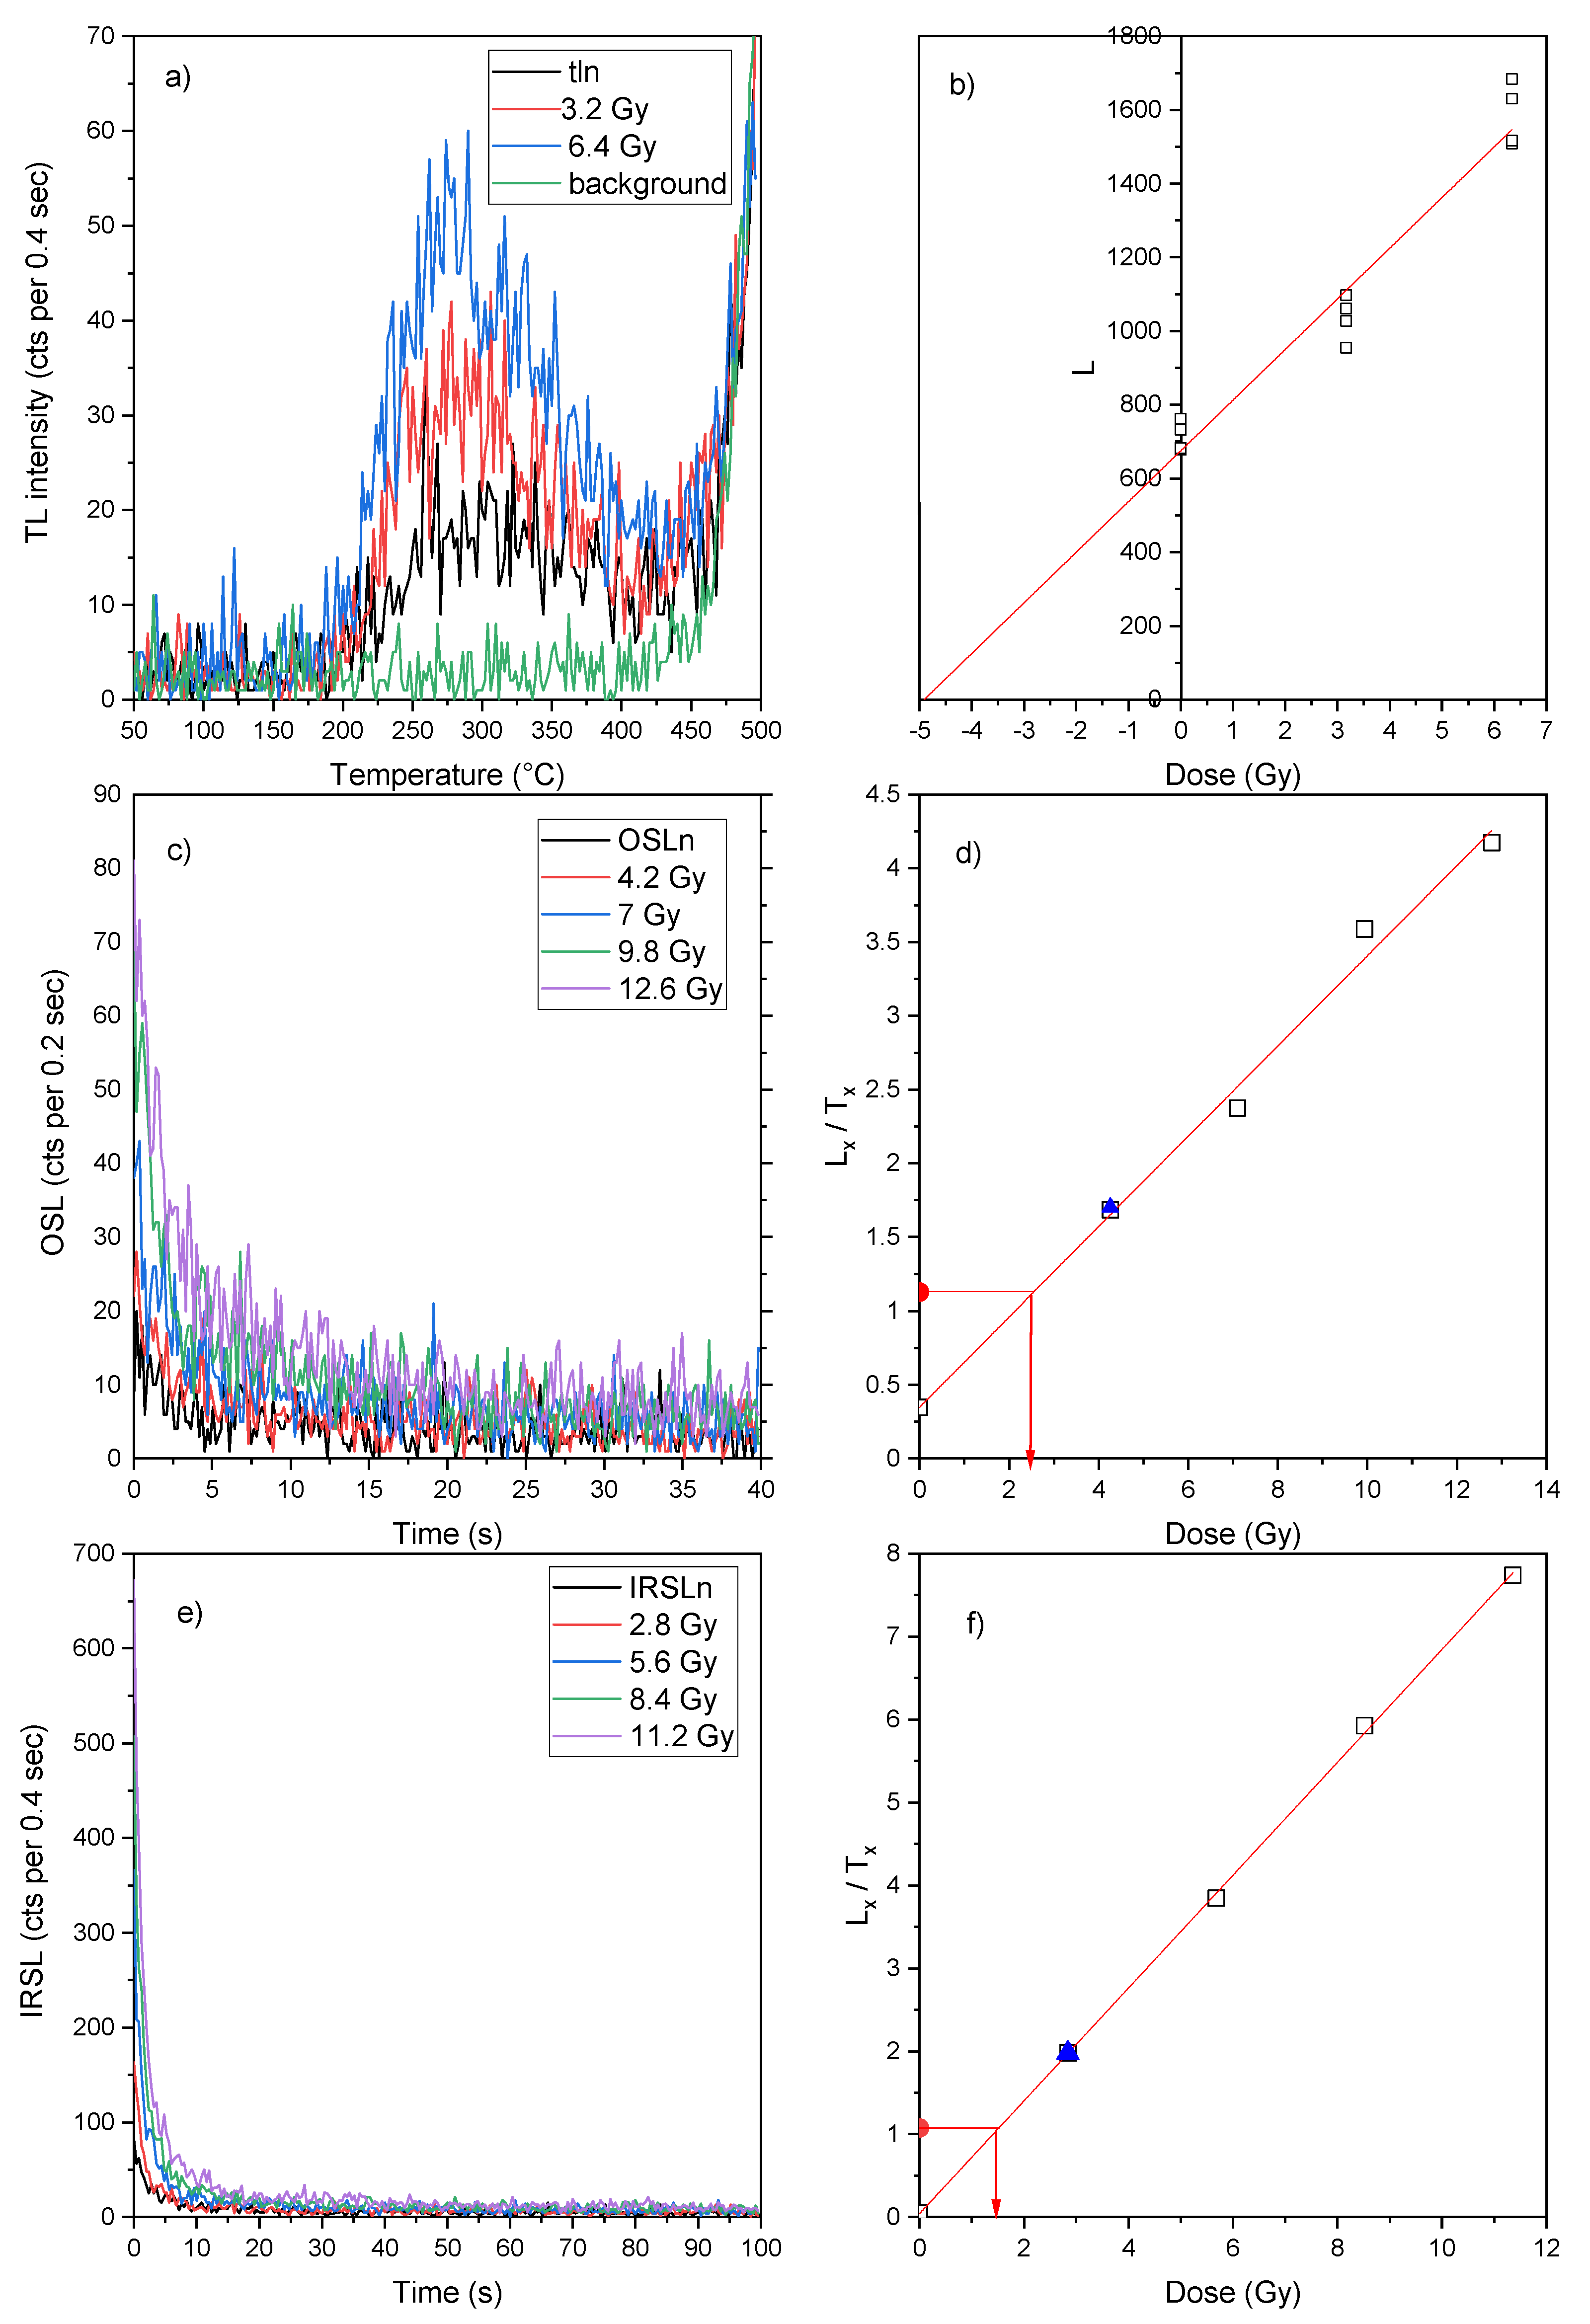
TL, OSL and IRSL equivalent doses (E.D.) were evaluated for all samples; because no mineralogical phase separation has been performed on the brick samples, any luminescent mineral contributes to the emission, quartz and feldspars being the main emitters. Both quartz and feldspars have a TL emission in the blue region of the spectrum and their contribution is not separate. For what concerns OSL, while the blue light stimulates the emission of both quartz and feldspars, IR-light only stimulates that of feldspars, for this very reason both OSL and IRSL has been performed. Typical examples of TL glow curves are shown in
Figure 8a. Based on the plateau test, that allows to identify the thermally stable portion of the curves (Aitken, 1985), the TL signals were integrated between 300 and 350 °C. Plotting the intensity of the TL signal vs. the laboratory imparted dose, E.D. was extrapolated by linear regression, as illustrated in
Figure 8b. The results of such evaluations are summarized in
Table 3.
Typical OSL/IRSL shine-down curves are shown in
Figure 8c-e. The samples were stimulated for 40 s in case of OSL measurement and 100 s for IRSL. The preheat temperature was 200°C for 10 while the cut-heat was 180°C and it was chosen using a preheat plateau test. For the E.D. determination, the initial part of the OSL/IRSL decay curve was used, specifically the first 0.6 s for OSL and the first 1.6 s for IRSL. The background was assumed as the average signal of the last 10s (OSL) or 20s (IRSL) of stimulation. Plotting the intensity of the OSL/IRSL signal vs. the laboratory imparted dose, E.D. was determined by interpolation of the natural signal on the linear regression, as illustrated in
Figure 8d and 8f.
In general, it can be said that the luminescence signals of the samples are rather weak, especially as regards the OSL signal. For this reason, it was possible to use this technique only to date the Padum Pukhuri sample, whose OSL curves have a sufficiently high intensity. IRSL, on the other hand, is the technique that gave the most intense signals for all samples.
By looking at the dating results obtained with TL, OSL and IRSL (
Table 3), it is possible to observe that the low luminescence intensity of the samples caused high errors in the ages obtained. The results obtained with TL are in good agreement with those obtained with IRSL, except for the Padum Pukhuri sample. For the latter sample there is instead a good agreement between the ages obtained with TL and OSL.
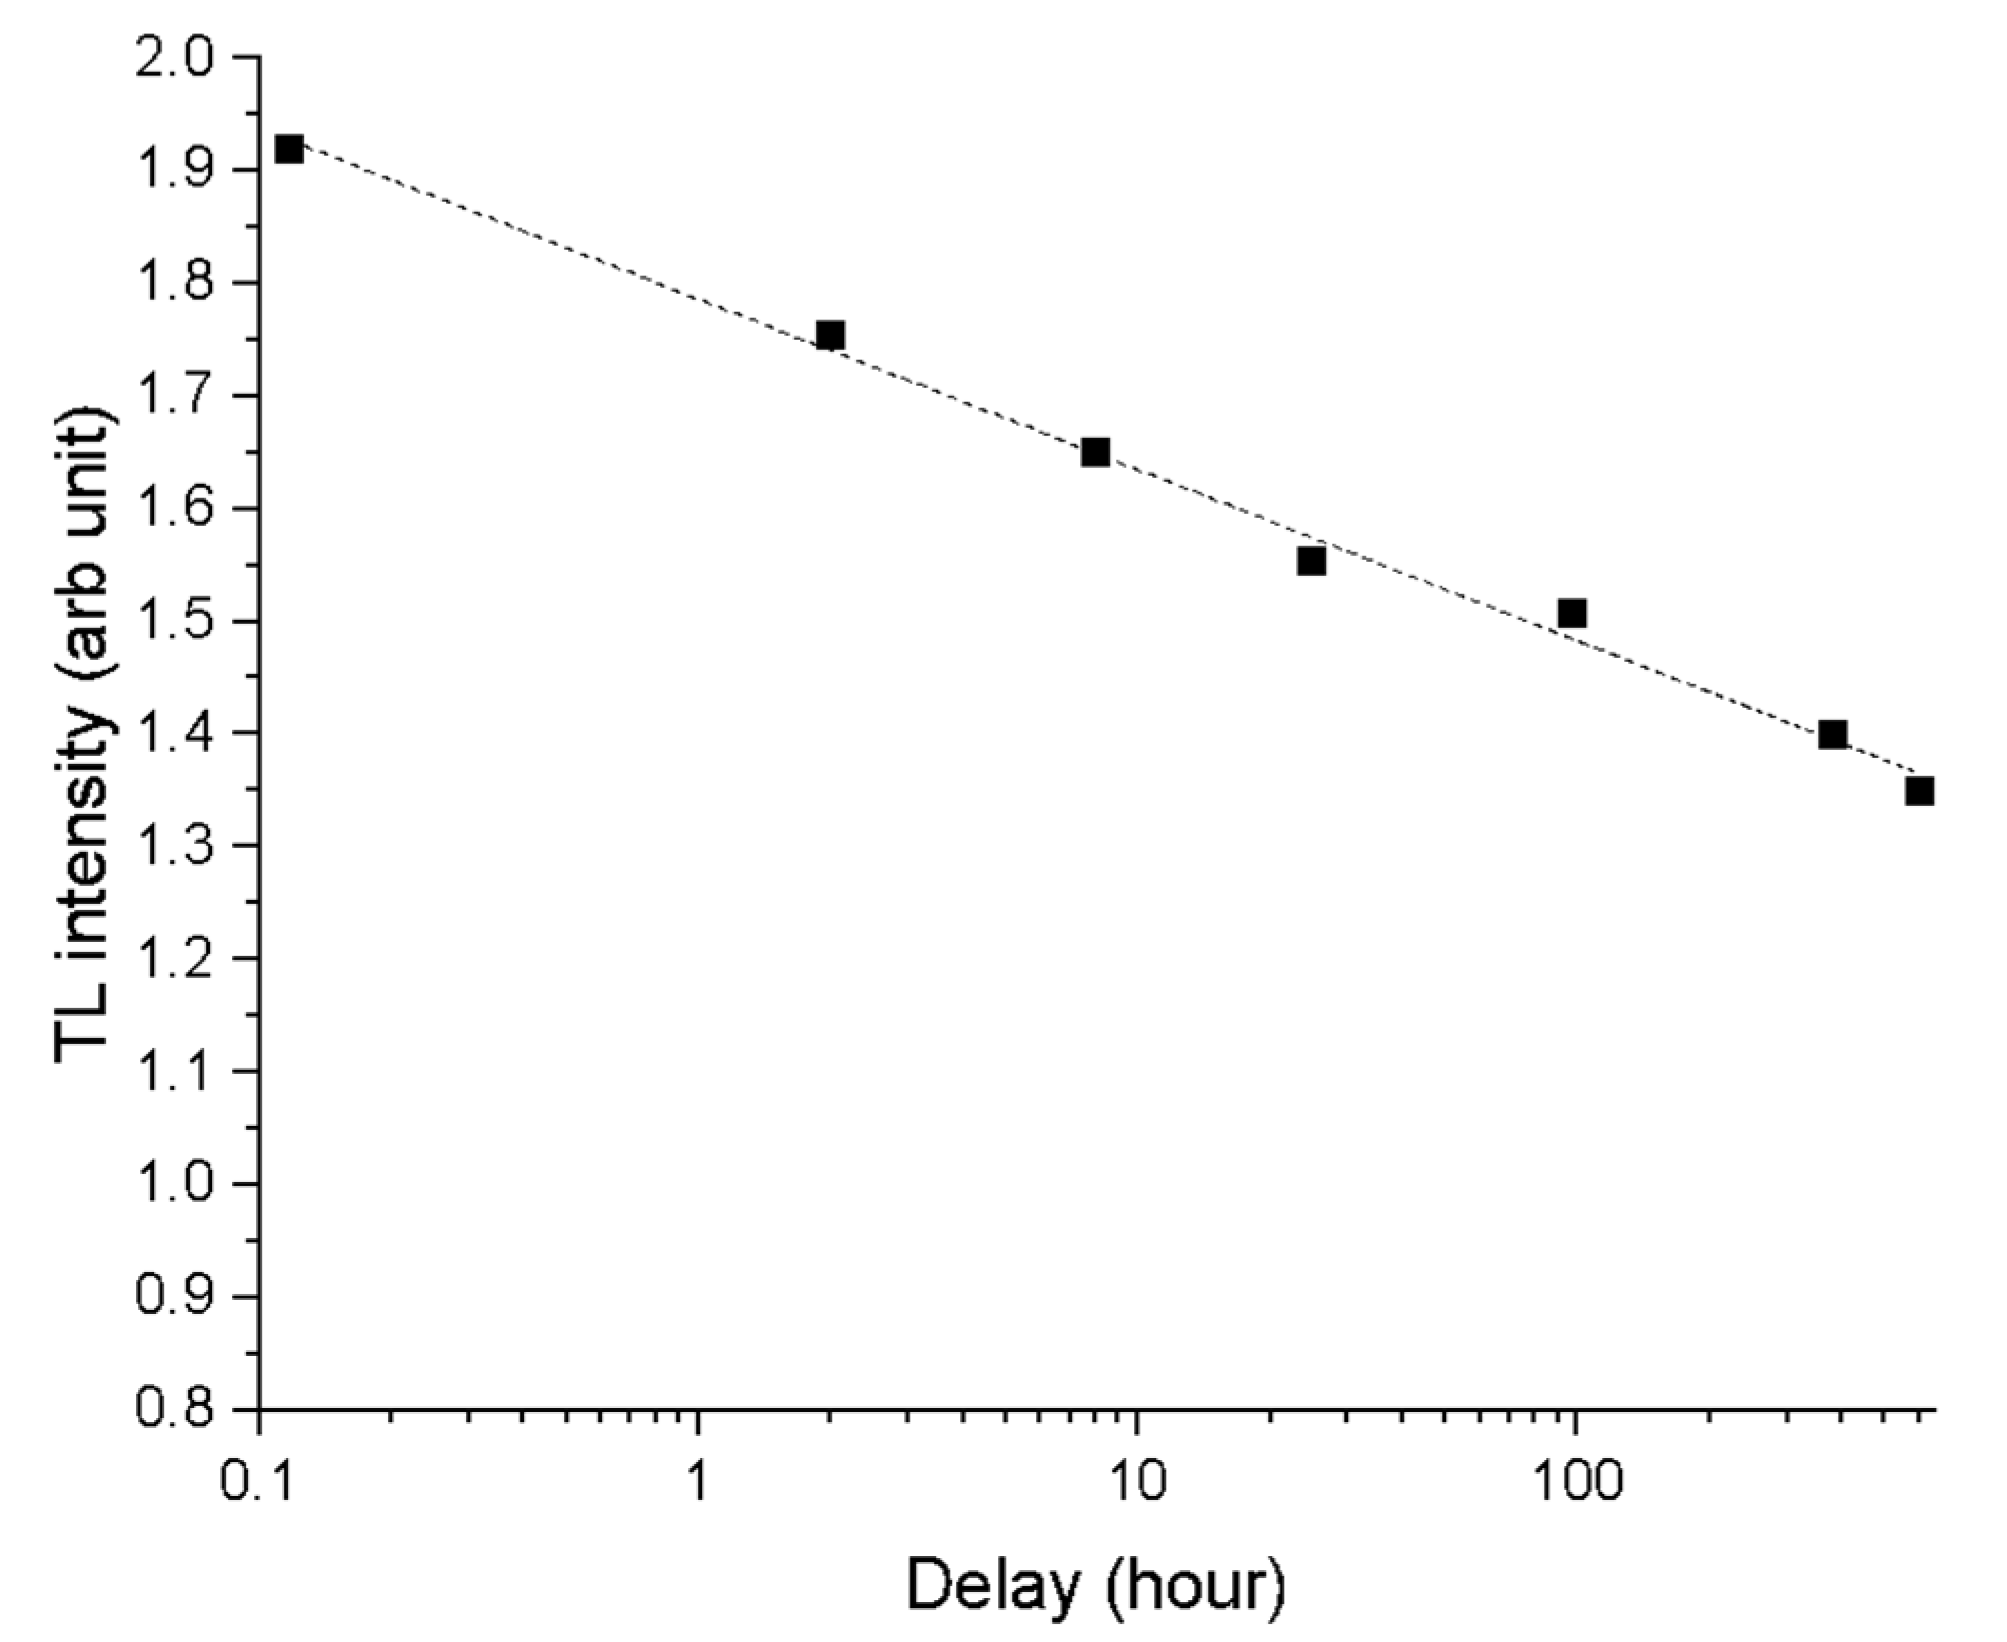
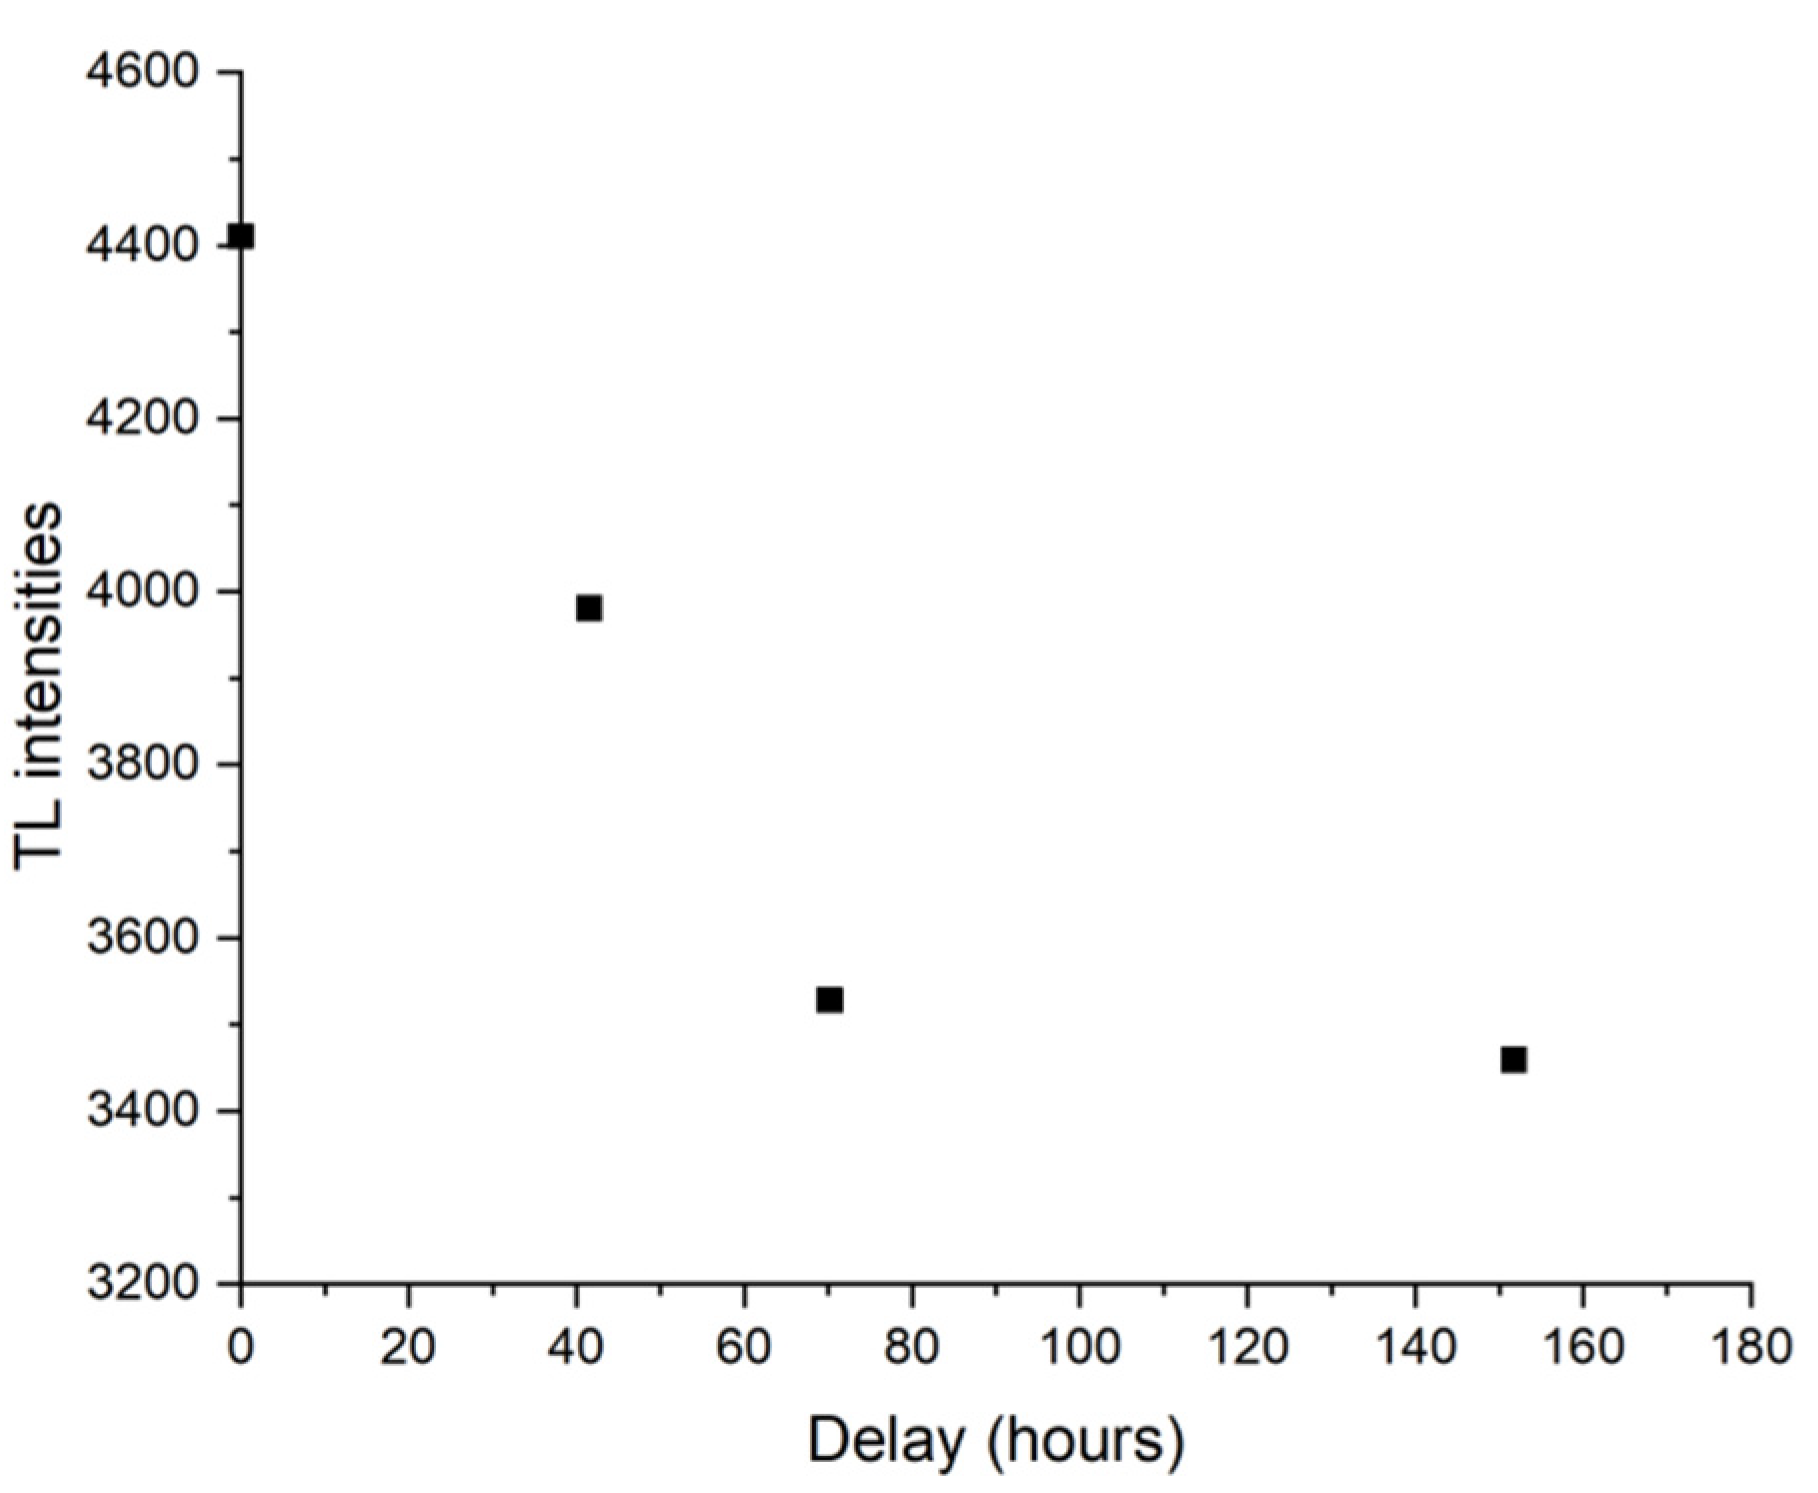
It is well-known that minerals like feldspars can give underestimated ages for the presence of anomalous fading (Wintle, 1973), a malign phenomenon due to the loss of charge from thermally stable defect sites via non-thermal mechanisms. A specific fading test was therefore performed at room temperature for one months and a significant loss of signal has been observed, as shown in
Figure 9 for the Padum Pukhuri sample. Therefore, fading evaluations were performed on all samples for all the luminescence technique used (TL, IRSL and OSL). For each sample and for each type of luminescence the g-values (Huntley & Lamothe, 2001) were determined (see
Table 4). The ages of the samples obtained were then recalculated according to the equation of (Huntley & Lamothe, 2001) to obtain the dates corrected for the fading phenomenon (
Table 4).
The high g-values (> 7%) obtained for nearly all the samples suggest the presence of some luminescent mineralogical phase other than feldspars with a high fading rate. In literature (Garcia Guinea et al., 1999) reported a TL emission of kaolinite in the blue region of the spectrum. Ten years later it was found that this mineral could be potentially valid for dosimetric purposes since it is sensitive to radiation and possesses a good dose linearity in the range of 50mGy to 8 Gy (Correcher et al., 2010). However, the stability of the TL signal during six months of storage shows an initial rapid decay (ca. 60%) followed by a mild slope reaching the stability after six months. Moreover, this mineral stands as very promising candidates towards IRSL dating, based on the very good IRSL response of this material to artificial beta irradiation (Polymeris et al., 2013).
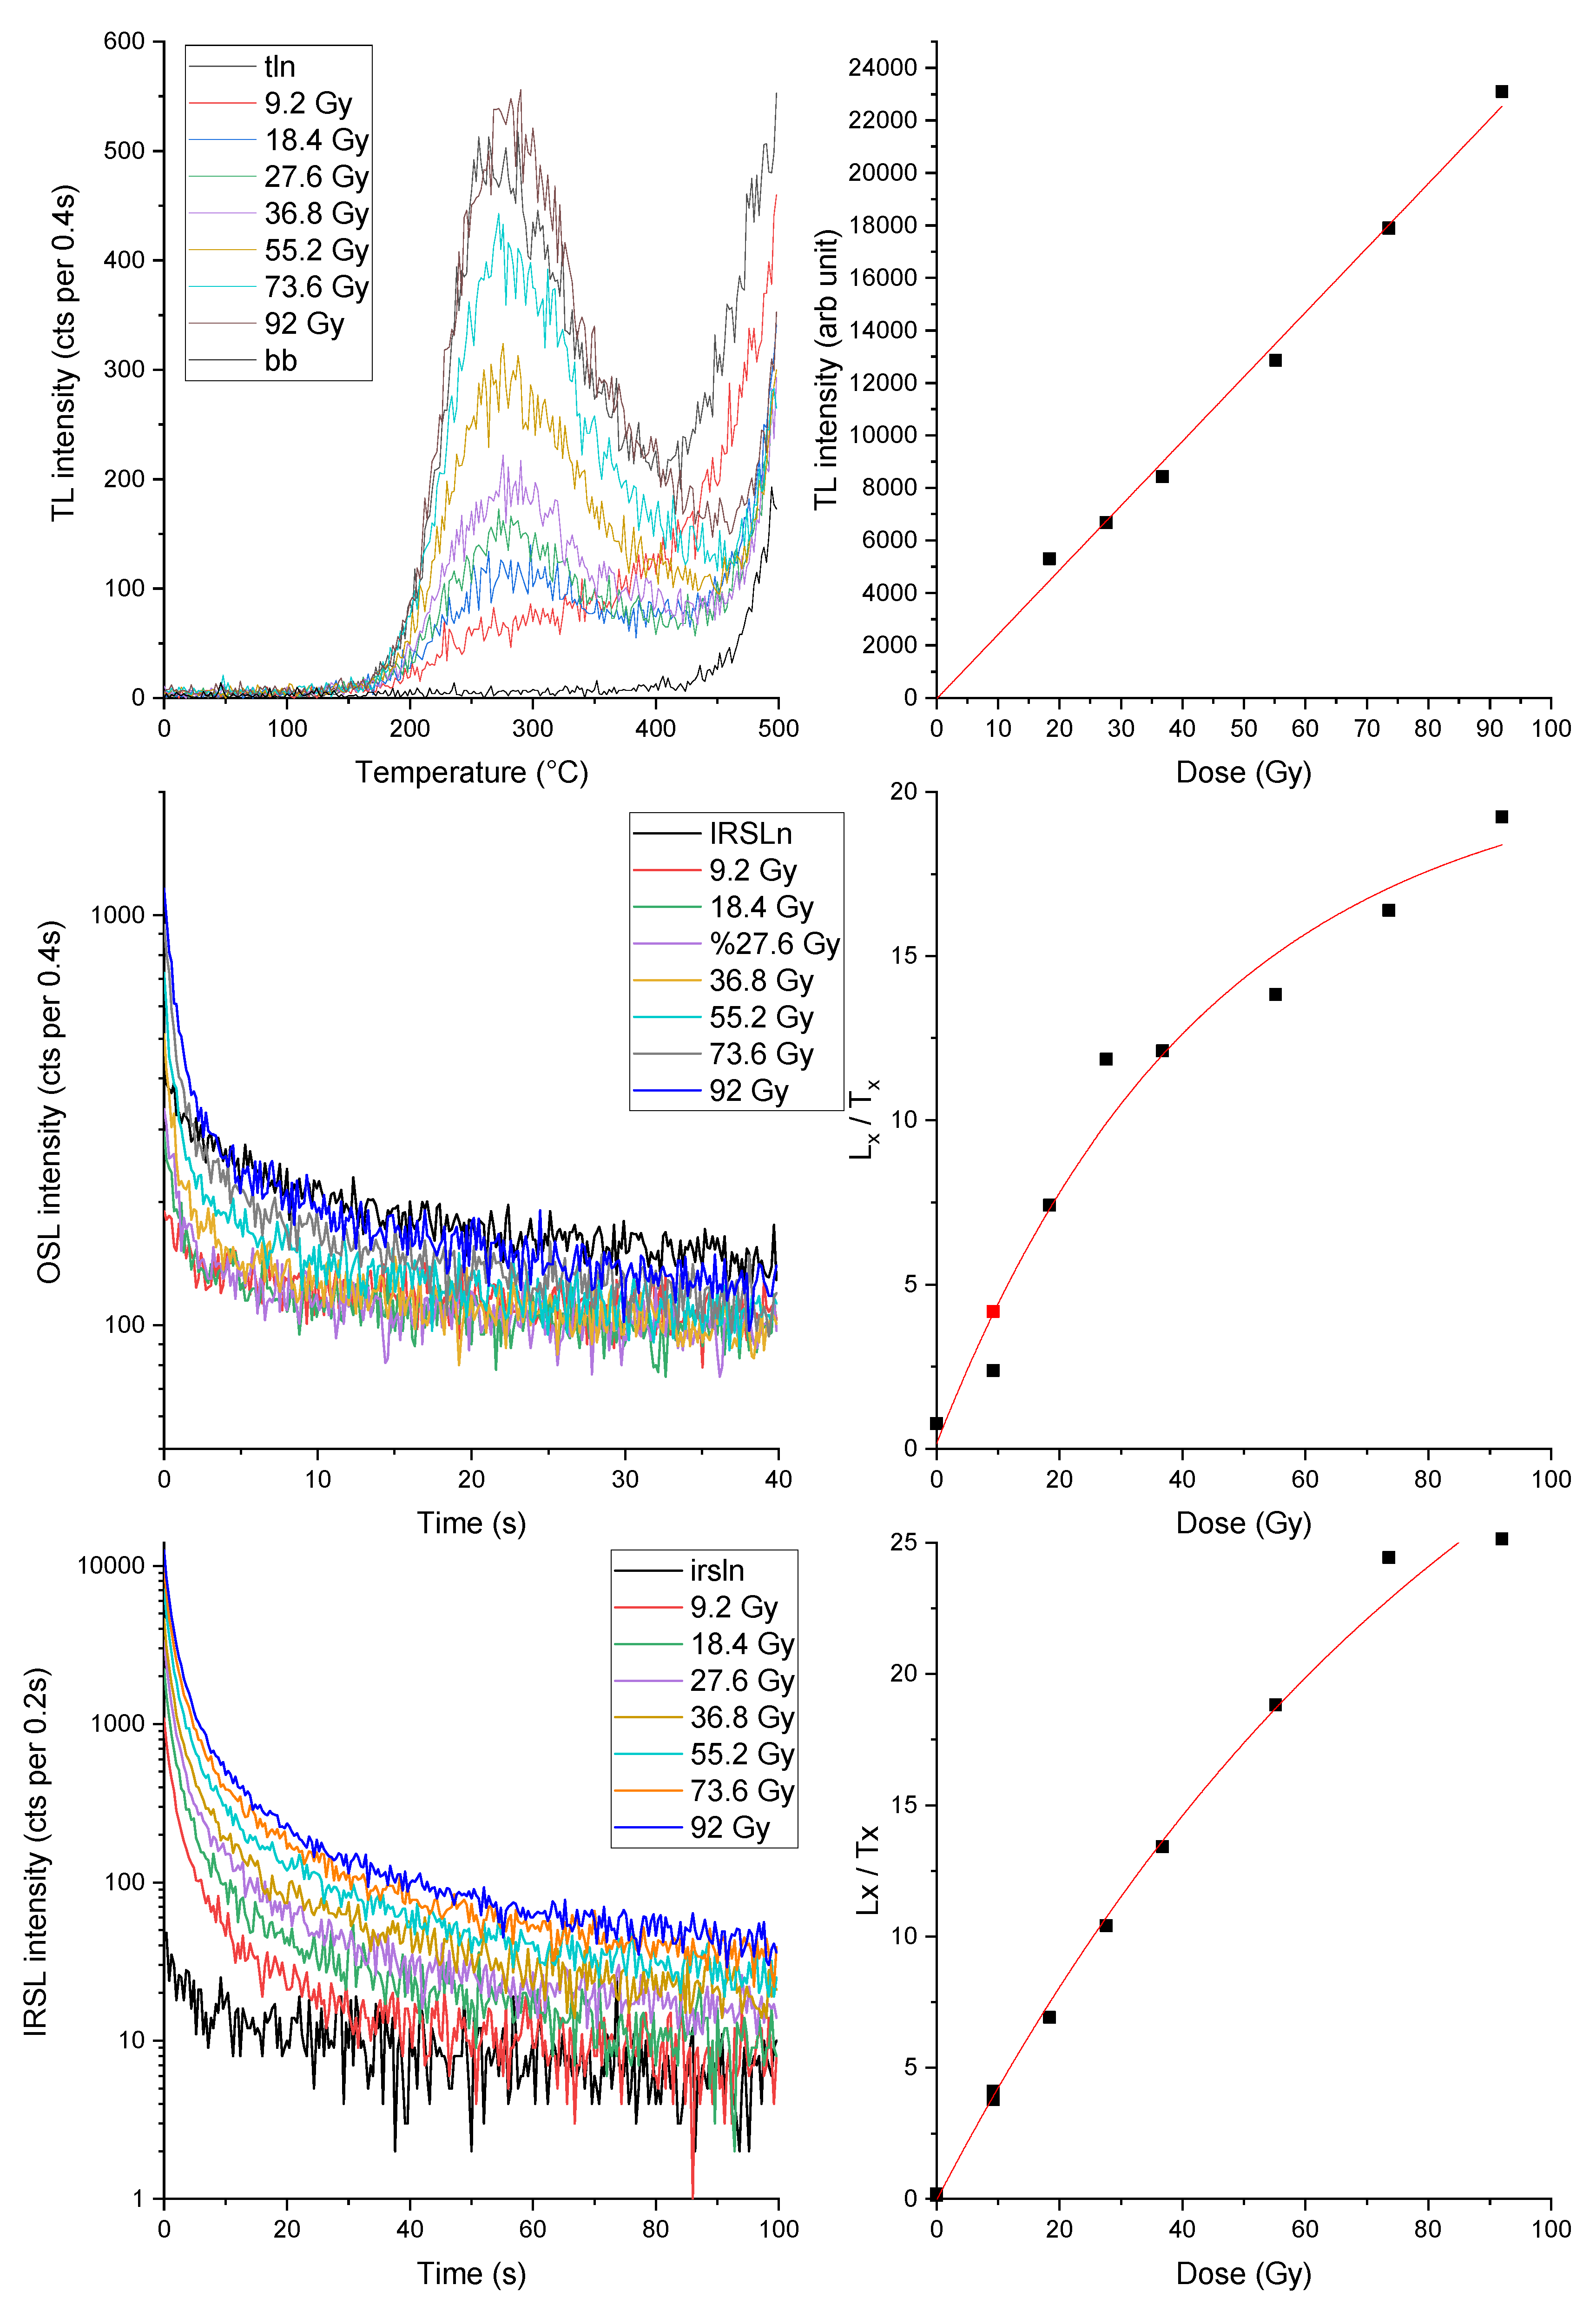
Based on these results and on data obtained by FTIR and XRD analyses that confirm the presence of kaolinite in all the bricks studied, the dosimetric properties of kaolinite were more deeply investigated. Hence, the TL, OSL and IRSL measurements were carried out on a kaolinite coming from Monte Bracco (Barge, CN, Italy). The sample present luminescence signal either when heated or when illuminated with blue and IR light;
Figure 10 shows TL, OSL and IRSL signals when irradiated with dose from 9 to 92 Gy. There is a linear growth of signal with dose in TL (at least up to 92 Gy), OSL and IRSL (up to about 37 Gy). At this point the stability of the TL, OSL and IRSL signals of kaolinite were investigated. A fading test was performed and it was noted that the measured luminescence signal (TL, OSL and IRSL) decreases as the time between irradiation and measurement increases (
Figure 11). Unfortunately, it was not possible to determine the g-value for any of the luminescence techniques used as the decay of the luminescence signals does not follow the exponential decay law used for feldspars. The significant loss of luminescent signal over time, however, allows us to identify kaolinite as a possible cause of the high g-values obtained on the bricks analyzed in this work.
3.6. Chronology of Bricks
The mineralogical characterisation and chronology of the present study infers the existence of two distinct group with technology having different firing temperature. One below 650ºC resembling XI-XIV centuries CE on the South Bank of the River Brahmaputra and other above 650ºC up to 830 ºC resembling VII-X centuries CE (Table-5) on the North Bank of the River Brahmaputra. These two divisions could indicate two different civilizations with technologies that permit to fire the bricks in different oxidizing kiln atmospheric conditions. From the present investigation it can be summarized that the first group of people were lived during VII-X centuries CE which were technologically sound and their state boundaries might be limited to northern bank of Brahmaputra as well as foothills of Arunachal Pradesh (studied bricks were from Padum Pukhuri, Pratima Garh and Rukmini Garh). The second group of people were lived during XI-XIV centuries CE which were technologically less sound then the first group and their state boundaries might be confined to the southern bank of the river Brahmaputra. Sheikh (Sheikh, 2017) performed dating of bricks from Kamakhya Temple of Assam, India suggesting two distinct age ranges as 500 CE and 800 CE. He opined that some segment of the existing Kamakhya temple might have been reconstructed later in 800 CE, which bricks production technology was more sound then the earlier inhabitant. Hence, it can be assumed that the bricks found from northern bank of Brahmaputra as well as foothills of Arunachal Pradesh (Padum Pukhuri, Pratima Garh and Rukmini Garh) along with those bricks from Kamakhya Temple dating to 800 CE were probably manufactured by a similar group of people residing in that time.
It is relevant to remember, dating the bulk material of construction bricks can mislead from the correct age, since the dated event corresponds to the last heating (> 500 °C) of the material, generally related to the brick production, that can be significantly different from that of the construction, also due to the practice of reuse of old bricks. But it is noteworthy that the cause of technological changes between the two group might be a scope for the further research.
The use of production material like calcareous and non-calcareous clay having low and high refractory nature for making bricks also infers that the bricks may produce in different production sites or reflect the natural inhomogeneity of local clay deposits and the application of different manufacture processes in local workshops.
Figure 4.
FTIR spectrum of studied brick samples (a) FTIR spectrum ranges from 4000-400 cm-1, (b) FTIR spectrum ranges from 4000-3000 cm-1 and (c) FTIR spectrum ranges from 1200-400 cm-1 (Q-Quartz, Or-Orthoclase, A-Albite, Mt-Magnetite, Hm-Hematite, K-Kaolinite, Plg-Palygorskite, C-Carbonates, Ch-Chlorite, OC-Organic Carbon).
Figure 5.
XRD pattern of studied brick samples (Q-Quartz, Feldspar (Or-Orthoclase, Mc-Microcline, Olg-Oligoclase, Sa-Sanidine, Ab-Albite), Arag-Aragonite, Dol-Dolomite, Lau-Laumontite, Ilm-Ilmenite, Sd-Siderite, Wo-Wollastonite, Hm-Hematite, Chl-Chlorite, T-Trona, Py-Pyrite, Mgs-Magnesite, Gth-Geothite, and Gl-Glauconite).
Figure 6.
Representative SEM backscattered image of surface morphology of studied fired brick samples, (a) Mouramora-1, (b) Mouramora-2, (c) Mouramora-3, (d) PadumPukhuri, (e) Pratima Garh, (f) Rukmini Garh.
Figure 6.
Representative SEM backscattered image of surface morphology of studied fired brick samples, (a) Mouramora-1, (b) Mouramora-2, (c) Mouramora-3, (d) PadumPukhuri, (e) Pratima Garh, (f) Rukmini Garh.
Figure 7.
Representative EDS pattern of studied fired brick samples, (a-c) Mouramora-1; Mouramora-2 and Mouramora-3 respectively, (d) PadumPukhuri; (e) Rukmini Garh and; (f) Pratima Garh.
Figure 7.
Representative EDS pattern of studied fired brick samples, (a-c) Mouramora-1; Mouramora-2 and Mouramora-3 respectively, (d) PadumPukhuri; (e) Rukmini Garh and; (f) Pratima Garh.
Figure 8.
a) TL glow curves, c) OSL and e) IRSL shine down curves f Padum Pukhuri sample.b) Growth curve of the TL signal with imparted additive dose. TL glow-curves were integrated between 300-3500°C and the signal of the background in the same temperature interval (green line) was subtracted. Sensitivity corrected d) OSL and f) IRSL response to a fixed dose vs the laboratory imparted regenerative dose. The red dot is the natural signal and the blue triangle is the recycling ratio point.
Figure 9.
Anomalous fading TL data obtained on Padumpukhuri sample. Seven samples were irradiated with a dose of 6.4 Gy. A sample was measured immediately after irradiation while the others were kept in the dark for periods ranging from one hour to a month.
Figure 9.
Anomalous fading TL data obtained on Padumpukhuri sample. Seven samples were irradiated with a dose of 6.4 Gy. A sample was measured immediately after irradiation while the others were kept in the dark for periods ranging from one hour to a month.
Figure 10.
Luminescence signals of kaolinite. a) TL glow curves and b) corresponding growth of TL signal with dose; c) OSL shine-down curves and d) corresponding growth of OSL signal with dose; e) IRSL shine-down curves and f) corresponding growth of IRSL signal with dose.
Figure 10.
Luminescence signals of kaolinite. a) TL glow curves and b) corresponding growth of TL signal with dose; c) OSL shine-down curves and d) corresponding growth of OSL signal with dose; e) IRSL shine-down curves and f) corresponding growth of IRSL signal with dose.
Figure 11.
Anomalous fading TL data obtained on kaolinite. The sample was irradiated with 92 Gy and the TL signal was measured. A test dose equal to 10Gy was then imparted on the same aliquot and used to normalize the signal in order to consider the sensitization of the sample between the different irradiation and measurement cycles. At this point the same aliquot was irradiated again with 792Gy and stored in the dark for a certain time after which the TL curve and the related test dose were recorded.
Table 1.
FTIR spectra wave numbers with assign mineralogy of the studied brick samples.
Table 1.
FTIR spectra wave numbers with assign mineralogy of the studied brick samples.
| |
|
Frequency with relative Intensity (cm-1) |
|
|
|
| Assigned mineralogy/Assignment |
Sample No with absorption Frequency and relative Intensity (cm-1) |
|
Reference |
| MOURAMORA-1 |
MOURAMORA-2 |
MOURAMORA-3 |
PADUMPUKHURI |
PRATIMA GARH |
RUKMINI GARH |
|
| Quartz |
1870VW |
- |
- |
- |
1876VW |
1873W |
(Chutia et al., 2020; Hlavay et al., 1978; Keller & Pickett, 1949; V. Ramasamy et al., 2004, 2009) |
| - |
- |
- |
- |
- |
1619VW |
| - |
795S |
795S |
- |
- |
- |
| 778S |
778S |
778S |
778S |
776M |
778SSp |
| 693S |
693M |
694S |
692M |
693M |
693S |
| 460S |
461S |
- |
- |
463S |
- |
| - |
- |
457S |
458S |
- |
458S |
| Microcline |
- |
- |
- |
- |
1050S |
- |
(Theodosoglou et al., 2010) |
| Orthoclase |
- |
- |
- |
- |
642W |
- |
(V. Ramasamy et al., 2009) |
| Albite |
- |
- |
- |
- |
725W |
- |
(Legodi & De Waal, 2007) and references therein |
| OH Stretching of Water Molecule |
- |
3851VW |
- |
- |
3851VW |
- |
(Elsass & Olivier, 1978; Bukalo et al., 2017; Govindasamy et al., 2019a; Seetha & Velraj, 2016) |
| - |
3746VW |
- |
- |
3745W |
- |
| - |
3671VW |
- |
- |
- |
- |
| OH stretching of inner hydroxyl group |
- |
- |
- |
- |
- |
3496 WBr |
| - |
- |
- |
3475W |
- |
- |
| 3468W |
- |
3460W |
- |
3462M |
- |
| Kaolinite |
1080S |
1080S |
1081S |
1084SBr |
- |
1081SBr |
| - |
3647VW |
- |
- |
- |
- |
| Chlorite |
- |
3565VW |
- |
- |
- |
- |
(Jozanikohan & Abarghooei, 2022) |
| Palygorskite |
1623W |
1630W |
1625W |
1629W |
1629W |
- |
(V. Ramasamy et al., 2009) |
| Carbonate Minerals |
- |
- |
- |
- |
- |
1788W |
(Lyon, 1967; V. Ramasamy et al., 2009) |
| - |
- |
1384W |
1381VW |
- |
- |
| Magnetite |
- |
- |
- |
- |
576W |
- |
(Hindy et al., 2018) |
| Hematite |
- |
- |
- |
- |
531W |
- |
(Chutia et al., 2020; V. Ramasamy et al., 2009) |
| Organic compound |
2922VW |
2922VW |
2919VW |
2919VW |
2919VW |
2928 VW |
(Hindy et al., 2018; Libretexts, 2014; Raja Annamalai et al., 2014; V. Ramasamy et al., 2009; Shillito et al., 2009) Ramasamy 2009 and reference therein |
| 2851VW |
2851VW |
2854VW |
2854VW |
2854VW |
- |
| - |
- |
- |
- |
2356VW |
- |
| - |
- |
- |
2004VW |
- |
- |
| 1998VW |
- |
1998VW |
- |
- |
1984 VW |
| - |
1878VW |
1879VW |
1879VW |
- |
- |
Table 2.
Estimation of firing temperature of studied brick samples based on FTIR and XRD analysis.
Table 2.
Estimation of firing temperature of studied brick samples based on FTIR and XRD analysis.
| S.No. |
Sample ID |
Colour |
Type of the Clay |
Estimation of firing temperature |
| 1 |
Mouramora-1 |
Light red colour |
White clay |
Below 650ºC |
| 2 |
Mouramora-2 |
Light red colour |
White clay |
Below 650ºC |
| 3 |
Mouramora-3 |
Light red colour |
White clay |
Above ~ 800ºC |
| 4 |
Padum Pukhuri |
Light red |
White clay |
Above ~ 800ºC |
| 5 |
Rukmini Garh |
Reddish yellow |
White clay |
Above ~ 800ºC |
| 6 |
Pratima Garh |
Weak red |
Red clay |
Above ~ 800ºC |
Table 3.
Saturation water contents (W), a-values, U, Th and K2O concentrations. E.D., dose rates for quartz and feldspars, ages, dates and errors obtained with different luminescence technique on brick samples.
Table 3.
Saturation water contents (W), a-values, U, Th and K2O concentrations. E.D., dose rates for quartz and feldspars, ages, dates and errors obtained with different luminescence technique on brick samples.
| SAMPLE ID |
W (%) |
a value |
ppm U (± 5%) |
ppm Th (± 5%) |
K2O
(± 3%) |
E.D. (Gy) |
Dose rate (mGy/a) |
Age (y) |
Date |
Error |
| Mour1 TL |
18 |
0.14 |
4.1 |
12.9 |
2.98 |
2.2 ± 0.3 |
6.9 ± 0.3 |
320 |
1700 |
60 |
| Mour-1 IRSL |
18 |
0.14 |
4.1 |
12.9 |
2.98 |
2.6 ± 0.8 |
7.5 ± 0.3 |
350 |
1670 |
90 |
| Mour-2 TL |
23 |
0.18 |
4.3 |
13.8 |
2.56 |
2.7 ± 0.3 |
7.2 ± 0.4 |
380 |
1640 |
60 |
| Mour-2 IRSL |
23 |
0.18 |
4.3 |
13.8 |
2.56 |
3.1 ± 0.5 |
7.8 ± 0.4 |
400 |
1620 |
90 |
| Mour-3 TL |
24 |
0.14 |
4.2 |
13.4 |
3.52 |
2.7 ± 0.3 |
7.6 ± 0.4 |
360 |
1640 |
70 |
| Mour-3 IRSL |
24 |
0.14 |
4.2 |
13.4 |
3.52 |
1.8 ± 0.2 |
7.7 ± 0.4 |
230 |
1790 |
60 |
| Rukmini |
|
| Prat TL |
33 |
0.14 |
5.0 |
15.8 |
3.52 |
3.6 ± 0.3 |
7.3 ± 0.4 |
490 |
1530 |
60 |
| Prat IRSL |
33 |
0.14 |
5.0 |
15.8 |
3.52 |
4.2 ± 0.3 |
7.9 ± 0.4 |
530 |
1490 |
70 |
| PadumTL |
30 |
0.25 |
2.7 |
8.5 |
1.48 |
4.9 ± 0.4 |
4.9 ± 0.2 |
1000 |
1020 |
120 |
| PadumOSL |
30 |
0.25 |
2.7 |
8.5 |
1.48 |
4.2 ± 1.0 |
4.9 ± 0.2 |
860 |
1160 |
250 |
| PadumIRSL |
30 |
0.25 |
2.7 |
8.5 |
1.48 |
1.6 ± 02 |
5.5 ± 0.2 |
290 |
1730 |
60 |
Table 4.
g-values, ages and dates corrected for anomalous fading.
Table 4.
g-values, ages and dates corrected for anomalous fading.
| SAMPLE ID |
g-value |
Age faded |
Date faded |
| Mour1 (TL) |
6.8 ± 0.4 |
630 ± 130 |
1390 ± 130 |
| Mour-1 (IRSL) |
7.9 ± 0.5 |
920 ± 220 |
1100 ± 220 |
| Mour-2 (TL) |
8.4 ± 1.8 |
1010 ± 300 |
1010 ± 270 |
| Mour-2 (IRSL) |
5.7 ± 1.5 |
870 ± 250 |
1150 ± 250 |
| Mour-3 (TL) |
9.0 ± 0.3 |
1170 ± 280 |
850 ± 280 |
| Mour-3 (IRSL) |
9.8 ± 0.3 |
910 ± 250 |
1110 ± 250 |
| Prat (TL) |
8.6 ± 2.1 |
1410 ± 390 |
610 ± 390 |
| Prat (IRSL) |
9.0 ± 0.2 |
1860 ± 300 |
160 ± 500 |
| Padum (TL) |
3.4 ± 0.7 |
1350 ± 180 |
670± 180 |
| Padum (OSL) |
3.3 ± 0.6 |
1140 ± 360 |
880 ± 360 |
| Padum (IRSL) |
9.1± 0.1 |
1040 ± 200 |
980 ± 200 |
Table 5.
Estimated ages, firing temperature and type of clay used in the studied archaeological sites.
Table 5.
Estimated ages, firing temperature and type of clay used in the studied archaeological sites.
| Name of Archaeological sites |
Type of Clay used |
Calculated Age |
Estimated Firing Temperature |
| Mouramora-1 |
Non-calcareous |
XI-XIV sec CE |
Below 650ºC |
| Mouramora-2 |
Non-calcareous |
Below 650ºC |
| Mouramora-3 |
Non-calcareous |
Above ~800 ºC |
| Pratima Garh |
Calcareous |
VII-X sec CE (i.e., pre-Ahom) |
Above ~800 ºC |
| PadumPukhuri |
Non-calcareous |
Above ~800 ºC |
| Rukmini Garh |
Non-calcareous |
Not datable |
Above ~800 ºC |
