Preprint
Article

Consequences of Immunoglobulin Domain-Containing Protein Retro-Proteins

Altmetrics

Downloads

137

Views

98

Comments

0

Submitted:

13 June 2024

Posted:

14 June 2024

You are already at the latest version

Alerts
Abstract
Amino acid sequences of native proteins are generally not palindromic. The protein molecule obtained as a result of reading the amino acid sequence backwards, i.e., a retro-protein, having the same amino acid composition and the same hydrophobicity profile as the native sequence may behave as a different molecule. Here we have used R4, a directed evolution product of Scfv-13, a protein that binds β-galactosidase, and report the properties of the retro-R4 (rR4). rR4 remains a binding protein and its new target is Glutamine-fructose-6-phosphate aminotransferase (GLMS), a native E. coli protein. Additionally, a tight junction immunoglobulin domain- containing membrane protein, junctional adhesion molecule A (JAMA) retro-protein retains the ability to drive cell-cell interactions. Thus, protein engineering suggests a new potential application to retro-proteins of the immunoglobulin superfamily.
Keywords: 
Subject: Biology and Life Sciences  -   Biophysics

1. Introduction

Proteins are biological macromolecules composed of amino acids. Protein structure [1] is the first obstacle to achieving function. Since the original report by Anfinsen [2], describing the principles that govern the folding of proteins, it is generally accepted that structure of a protein are determined by its amino acid sequence when read from the N-terminus to the C-terminus. Inverted sequences are occasionally found in genomic DNA, nevertheless, a native retro-protein has not been reported thus far. A retro-protein is the result of reading its coding sequence backwards or the opposite sense. A retro-protein obviously has the same amino acid composition and the same hydrophobicity profile as the native sequence. Since these proteins are not native, some questions follow logically: does a retro-protein fold to a well-defined native-like structure as natural proteins do? does a retro-protein fold to a structure similar to the native conformation of the original protein? Does the function of the retro-protein correlate to the native protein?
Natural and de novo designed proteins and peptides are gaining an ever-growing interest as therapeutics [3]. Chief among protein engineering efforts has been antibody design [4]. Antibodies are proteins that are capable of antigen recognition. Antibody’s structure classifies them as members of the immunoglobulin superfamily (IgSF), the largest superfamily of proteins [5,6]. Antibody (Ab) engineering consists of modifying Ab sequences and/or structures to enhance or decrease their functions. Abs, in particular monoclonal, have revolutionized the fields of diagnosis and immunotherapy for the treatment of a variety of diseases and cancers [7]. Challenging issue remain for their production with the highest response rate in patients and the lowest toxicity [4]. Thus, Ab engineering is a major translational challenge to producing effective monoclonal Abs, with optimal processing, stability, and tolerance [8].
All Abs are comprised of paired heavy and light polypeptide chains, and the generic term immunoglobulin is used for all such proteins [9]. The light chain is made up of two immunoglobulin (Ig) domains. Many proteins are partly or entirely composed of Ig domains because they were first described in antibody molecules [9]. Ig domains are characteristic of proteins of the Ig superfamily, including antibodies, T-cell receptors, MHC molecules, cell adhesion, and many others [10]. The Ig domain consists of a sandwich of two β sheets held together by a disulfide bond and receives the name of the immunoglobulin fold [10]. The most common antibody format is a single chain fragment variable (scFv) [11]. ScFv contains the complete antigen-binding domain of an intact antibody. ScFv fragments have found great medical applications [12]. Several approaches have been employed to increase the affinity, avidity and structural stability related to these antibody fragments [12,13]. Among all strategies to engineer ScFv antibodies there is no attempt to use the retro-protein approach.
Antibody mimetics represent the fourth generation of antibody engineering, following polyclonal antibodies, monoclonal antibodies, and genetically engineered antibody fragments [14]. Nevertheless, the approach to the development of these molecules has been met with numerous roadblocks, which suggests that a new workflow [14,15,16]. New strategies for example explore next generation antibody-drug conjugates, nevertheless increased complexity, multimodal nature and/or involvement in difficult-to-predict effects such as anticancer immunity continue to be a stumbling block for the engineering of these molecules [17].
During the 1990s, several reports described the consequences of inverting peptides and proteins. Guichard and colleagues [18] described the synthesis of three analogues of the model peptide of sequence IRGERA corresponding to the COOH-terminal residues 130-135 of histone H3. The retro-inverso-peptide IRGERA mimicked the structure and antigenic activity of the natural L-peptide [18]. When antibodies were raised against these variants, large differences in Ka values were observed when each monoclonal antibody was tested with respect to the other peptides [18]. Furthermore, antigenicity and immunogenicity can be achieved by retro-inverso-isomers of natural antigenic peptides. Hybrid peptides derived from cercropin A and melittin, maintain antimicrobial activity when prepared as retro-inverso forms [19]. Other examples of retro-peptides or retro-proteins exist but not abundantly [20,21,22]. Retro proteins are dissimilar to the original sequences despite their common hydrophobic and or hydrophilic pattern, amino acid composition and consequent tertiary contacts. Recent advances in protein folding prediction [23] contribute to our understanding of the protein folding space. Nevertheless, they cannot yet be used to predict the function of a protein.
In this article we have selected two members of the IgSF, one with cell adhesive properties and a second with recognition capabilities. Each has been converted to retro-inverted forms, and their function analyzed. ScFv-13 is a human antibody fragment specific for β-galactosidase (β-gal) [24], categorized as an antigen recognition molecule. ScFv13 has been the subject of protein engineering strategies in vivo resulting in scFv-13.R4 (from here on R4), a mutant version with high affinity for β-gal and greater solubility [25]. Furthermore, a membrane protein of the IgSF, a cell adhesion molecule (CAM), junctional adhesion molecule A (JAMA) was also the subject of this study. We report the consequences of employing the retro-protein strategy on both of these examples of Ig domain-containing proteins.

2. Materials and Methods

2.1. Proteins and Plasmids

Anti-β-galactosidase ScFv antibody synthetic construct accession number: GenBank: CAA12398.1 (https://www.ncbi.nlm.nih.gov/protein/3090426). This sequence is also known as ScFv13. The amino acid sequence of ScFv13.R4 (R4) and retro R4 can be found in Figure S1. GLMS (Glutamine-fructose-6-phosphate aminotransferase), accession number P17169, and its corresponding crystal structure PDB ID 2J6H. The amino acid sequence of all the proteins used in this article have been placed in the Supplementary section, Figure S1. All plasmids hosting the proteins were pET28a, Kanamycin resistant. Other proteins include: β-galactosidase (Millipore Sigma, Burlington, Massachusetts, United States), anti-MBP mouse monoclonal antibody (catalog number E8032S, New England Biolabs, Massachusetts, United States), anti-6xHis tag mouse monoclonal antibody (catalog number MA1-135, ThermoFisher Scientific, Massachusetts, United States).

2.2. Protein Expression and Purification

All proteins were expressed in Shuffle T7 Express competent E. coli (New England Biolabs). Growth media was composed of Terrific Broth solution I (24 g yeast extract, 12 g tryptone, and 4 mL 100% glycerol per L of ddH2O), Terrific Broth solution II (50 g capsule per L of ddH2O, MP Biomedicals), supplemented with 100 µg/mL of Kanamycin. Protein expression was induced at OD600 of 1 with a final concentration of 0.25 mM IPTG (Apex Bioresearch, Genesee Scientific, El Cajon, California, USA). Temperature was lowered to 16 C and maintained for 18 h to promote proper protein folding. Protein purification was achieved with a standard buffer (50 mM Tris pH 8, 500 mM NaCl), and membrane protein extraction was carried out using the same buffer supplemented with 5% CHAPS (AG Scientific, San Diego, California, United States). His tagged proteins were purified according to Ni-NTA resin’s manufacturer’s instructions (Prometheus Protein Biology, Genesee Scientific, El Cajon, California, United States). Amylose resin purification was carried out according to manufacturer’s recommendations (New England Biolabs, Massachusetts, United States).

2.3. Protein Modeling

Models and molecular graphics images were produced using the UCSF Chimera v. 1.15 package from the Resource for Biocomputing, Visualization, and Informatics at the University of California, San Francisco (supported by NIH P41 RR-01081) [26].

2.4. Web-Based Analysis Tools

Ramachandran Plots were obtained from the EMBL’s European Bioinformatics Institute (https://www.ebi.ac.uk/).

2.5. Enzyme-Linked Immunosorbent Assay (ELISA)

This assay was used to evaluate the binding of purified R4 and rR4 to β-galactosidase (β-gal). ELISA plates were coated overnight at 4°C with 50 μL/well of β-gal in PBS (10 μg/mL). Plates were then blocked at room temperature for 2 h with 5% non-fat milk in PBS. Plate washing was accomplished using PBS supplemented with 0.1% Tween 20 (PBST), purified R4 or rR4 samples serially diluted in PBS with 50 μg/mL BSA (PBS-BSA) were added to the plates (100 μL/well). Plates were incubated for 1 h at room temperature and then washed with PBST. Horseradish peroxidase (HRP)-conjugated anti-6x-His antibody in PBS-BSA was added to the plates (50 μL/well). After 1 h of incubation at room temperature, plates were washed and then incubated with SigmaFast OPD HRP substrate (Millipore Sigma, Burlington, Massachusetts, United States) for 20 min. The reaction was quenched with H2SO4, and the absorbance of the wells was measured at 490 nm. Equilibrium dissociation constants for wt R4, and rR4 were determined as described by Martineau [24]. The dissociation constant Kd for R4 and rR4 was extracted from the absorbance data using Prism (GraphPad, Massachusetts, United States).

2.6. Mass Spectrometry Assay and Analysis

The analysis was performed at the Fritz B. Burns Biological Mass Spectrometry Facility. Brigham Young University, Provo UT 84602. A typical protocol can be found in the literature [27].

2.7. Size Exclusion Chromatography

All size exclusion chromatography was performed using the NGC Chromatography System and its accompanying software ChromeLab (BioRad, Hercules, California, USA). The SEC column used to purify proteins of interest was ENrich™ SEC 650 10 × 300 (BioRad, Hercules, CA, USA). Protein concentration was determined by using the Nanodrop Onec from ThermoFisher Scientific. PBS was employed as a running buffer for SEC. Fractions were pooled and concentrated as mentioned above. Product peaks were compared for the position to the size exclusion standards from BioRad Catalog Number 151-1901.

2.8. Outer Membrane Vesicle Production (OMV)

Production of OMVs from Shuffle T7 express cells was performed according to a previous report by Prachayasittikul and colleagues in 2007 [28]. Briefly, 1 L of cultured E. coli typically yielded 5 g of cells. After centrifugation the pellets were incubated with 50 mL of 100 mM EDTA pH 8.0 for 1 h. Centrifugation at 15,000 g for 1 h removed unbroken cells. Ultracentrifugation at 100,000 g for 1 h yielded OMVs. PBS was used to resuspend OMVs.

2.9. Cell Aggregation Assay Using FlowCytometry (FC)

For this assay we expressed cell adhesion molecules JAMA or rJAMA in Shuffle T7 Express. Cells were induced at OD600 of 1 with 1 mM IPTG. Cells continue shaking over night at room temperature. After OD600 is matched cells are diluted 1:5 in PBS and examined using FC. The assay inspection of cell-adhesion molecules aggregation through FC protocols (iCLASP), has been developed by our laboratory and was recently published [29].

2.10. Bacterial Outer Membrane Vesicles (OMVs) Analysis

Size and volume of OMVs were confirmed by ZetaView (Particle Metrix, Ammersee, Germany). Settings for the reading of the sample were: laser wavelength: 488 nm; filter wavelength: scatter; sensitivity: 65; shutter: 150; cell temperature: 22°C; particles per frame 35-140. All samples were sonicated using Branson 2800 ultrasonic water bath (Emerson Electric Co., St. Louis, Missouri, United States) for 30 seconds prior to sample preparation. All samples were prepared as 1:250 dilution in Dulbecco’s Phosphate-Buffered Saline (DPBS). The machine was auto aligned with Applied Microspheres NanoStandards—0.1 um, 100 nm polystyrene beads standard solution (Particle Metrix, Ammersee, Germany) in a 1:500,000 dilution. All samples on the cell were scanned by 11 positions with a minimum of 7 successful measurements.

2.11. Statistical Analysis

Flow Cytometry data (Experimental Slope) were analyzed using SAS software version 9 (SAS Institute Inc., Cary, NC, USA) and the Mixed Procedure method to generate p-values, standard deviation, and standard error and to determine statistical significance. For all experiments, α = 0.05. Data was collected for each sample in four different experiments (n = 4). Each condition was measured in 12-replicates. Thus, for each data points correspond to the average of 12-replicates and n = 4, or 48 data points. Statistical differences were identified for all samples in each graph. The final analysis concluded that all treatments are statistically significant (p < 0.01) and significantly different from each other and the control. For statistical analysis, we employed t-test, and the asterisk represents a statistical significance between groups of four separate experiments and their standard deviation (SD).

2.12. Negative Staining Electron Microscopy of a Preparation of Shuffle T7 Express E. coli OMVs

Samples of OMVs were examined by transmission electron microscopy. The samples were placed on formvar-coated copper grids (Ted Pella Inc., Redding, California, United States) and allowed to stay for 2 min. The sample excess was removed using filter paper. After drying, the samples were treated with a 0.3% aqueous solution of uranyl acetate (pH 4.0) for negative staining. Negatively stained preparations were examined with a Thermo-Fisher Helios Nanolab 600 scanning electron microscope (Hillsborough, OR) operated in scanning transmission electron microscopy (STEM) mode using an accelerating voltage of 30 kV.

3. Results

3.1. Protein Sequences and Plasmids
ScFVs are a type of recombinant antibody, usually ~25 kDa single polypeptides that contain the variable light chain (VL) and variable heavy chain (VH) of an antibody [30]. These two chains are connected by a flexible linker peptide made up of glycine and serine with dispersed hydrophilic residues for increased solubility [31,32]. This is a typical approach observed in literature [33,34]. The amino acid sequence of R4 was obtained from the literature [24,25]. Exact amino acid sequences of both R4 and retro protein R4 (rR4) can be obtained in the Supplementary Figure S1. R4 and rR4 were subcloned into pET28a (kanamycin resistant) plasmid between NcoI and XhoI leaving the 6xHis tag in frame. Figure 1contains basic characterization of the structure of both R4 and rR4. Specifically, both proteins acquire the proper folding of IgSF members. Looking specifically at the Ramachandran plots for these modeled ScFv antibodies, we determined that rR4 has similar secondary structure to that of R4, with some exception to left-handed α-helix.
Further characterization of ScFv R4 and rR4 was carried out using Size Exclusion Chromatography (SEC). Figure 2A demonstrates qualitatively how R4 and rR4 have different aggregation profiles. R4 appears to elute at its predicted size (29.5 kDa) while rR4 elutes in many aggregated states, beyond monomeric size. The rR4 SEC profile corresponds to a mixture of sizes, between monomeric, dimeric and largely aggregated. Under the peak at 10 mL it’s possible to observe other proteins contaminating the sample, close to the 70 kDa mark (see Figure 4). This was described also for other targets of retro-protein design, where expression and purification were unique and decreased when compared to the parent proteins [20]. Yields of R4 are 10 times greater than those of rR4 per liter of E. coli culture.
Using the monomeric forms of R4 and rR4 we performed an ELISA assay to determine binding to β-Gal. Figure 2B clearly indicates that while R4 has great affinity for β-Gal, rR4 does not, Kd values illustrate this point further. The Kd quotient between rR4 and R4 is greater than 15 fold.
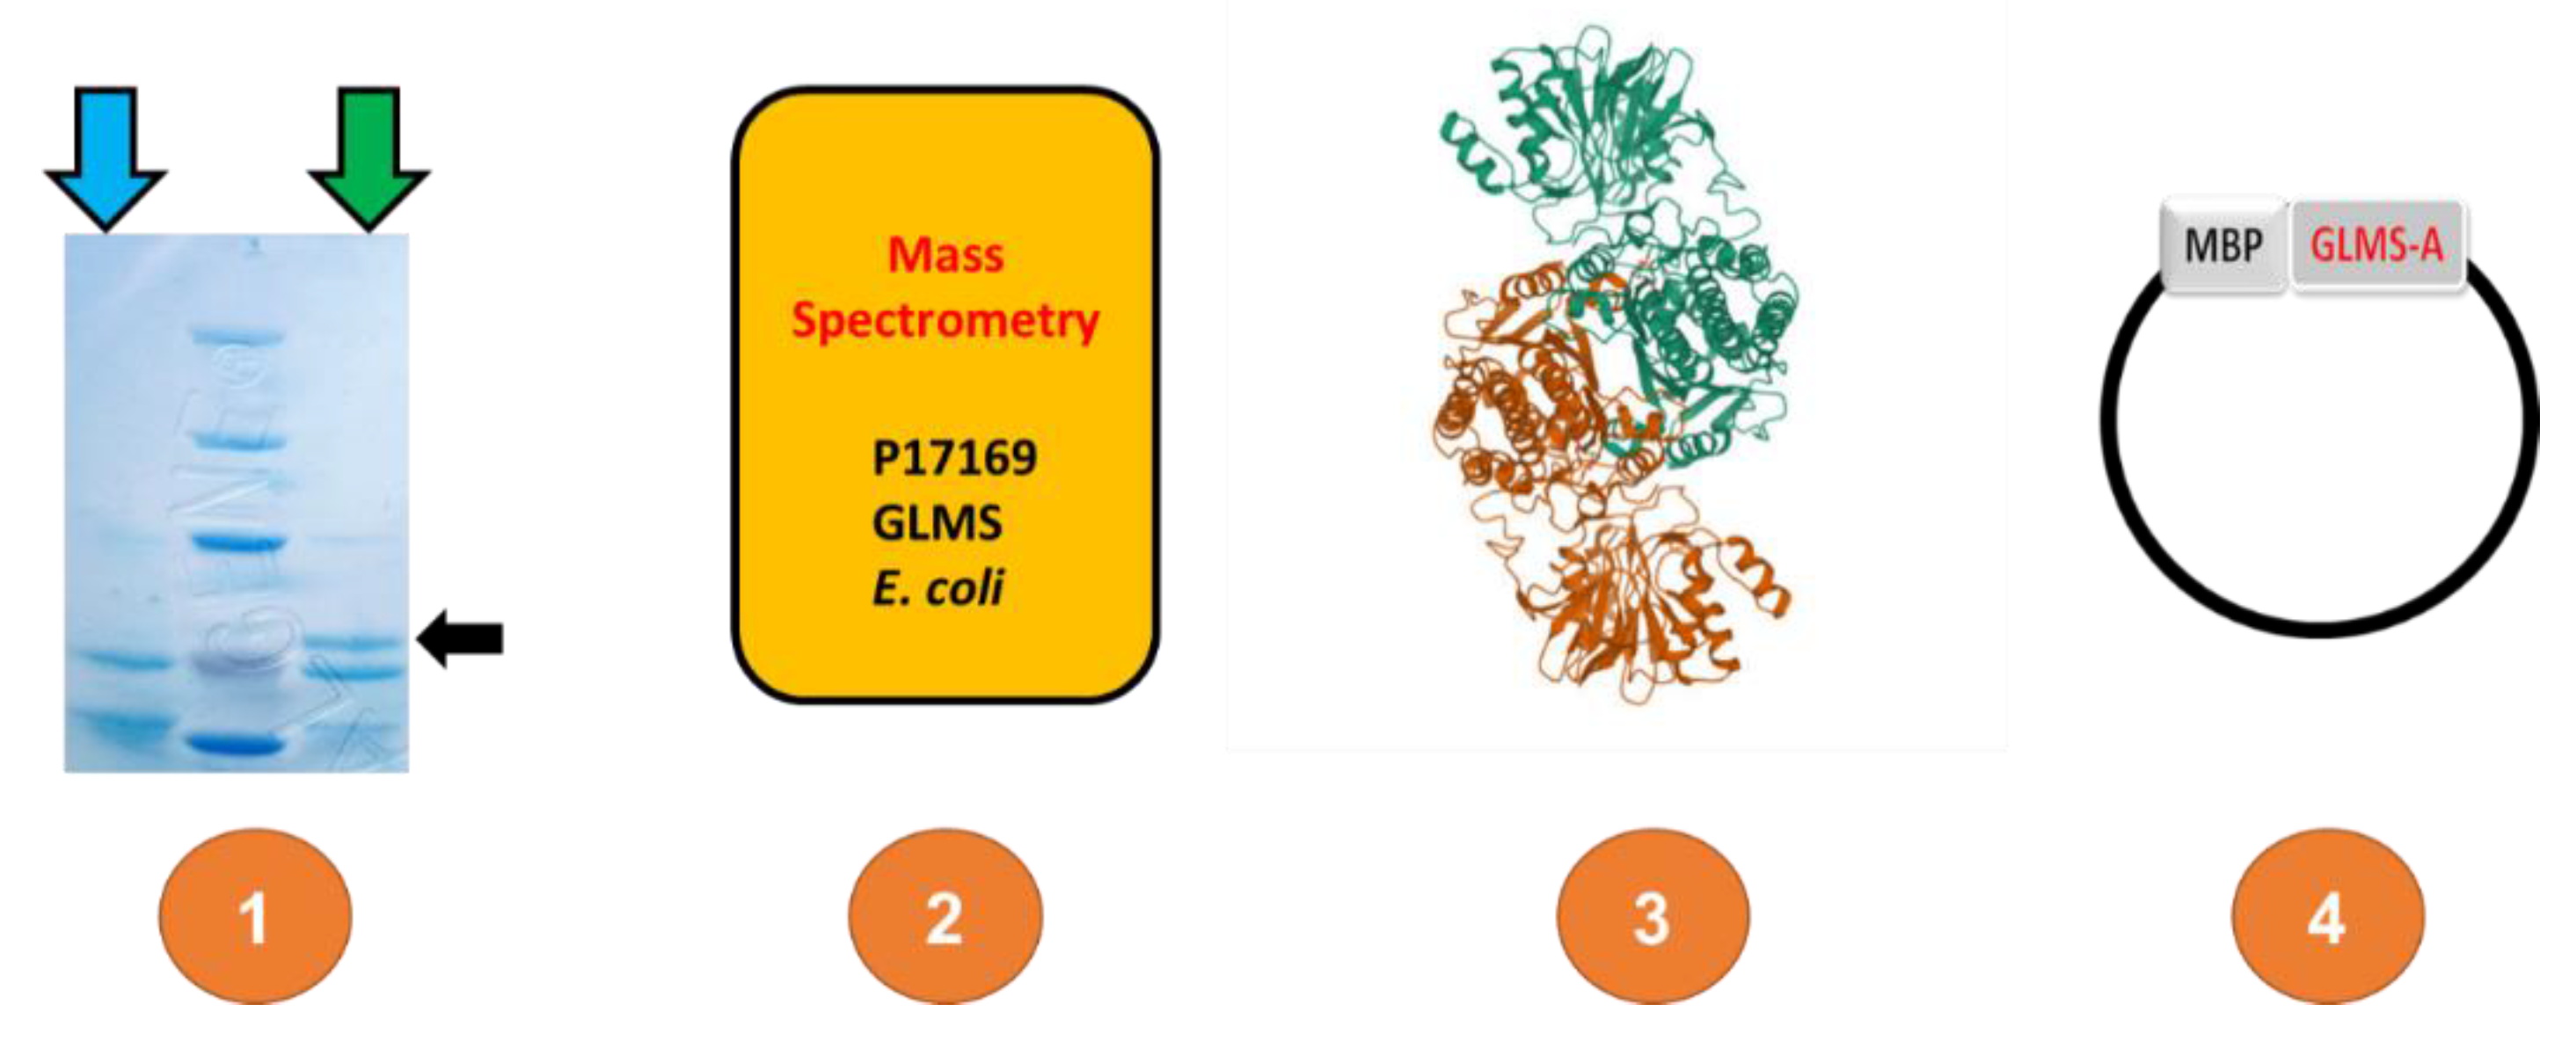
Considering the findings of Figure 2, where the SEC profile of rR4 was different to that of R4 we decided to purify both proteins in the absence of Imidazole in the washing steps. Only apply 200 mM Imidazole pH 8.0 in the elution step. Purified proteins were loaded in a gel and examined Coomassie stained. The results can be observed in Figure 3, segment 1. A protein of approximately 70 kDa contaminates the rR4 eluate while the same band is not present in the NiNTA purified R4. The newly discovered protein was examined by Mass Spectrometry (Supplementary files) and identified as Glucosamine-6-phosphate synthase (GLMS). Figure 3, segment 3, shows the crystal structure of GLMS. This structure depicts two domains, A and B, and the formation of a dimer (green and orange) through the B domain. Considering that the B domain will lead to self-association of GLMS we decided to create an maltose binding protein (MBP) fusion and GLMS-A domain. The strategy will then produce a monomeric molecule that can be studied by SEC as to mobility and changes in aggregation number due to the presence of rR4. Figure 3, segment 4, represents a plasmid with the intended fusion MBP_GLMS-A.
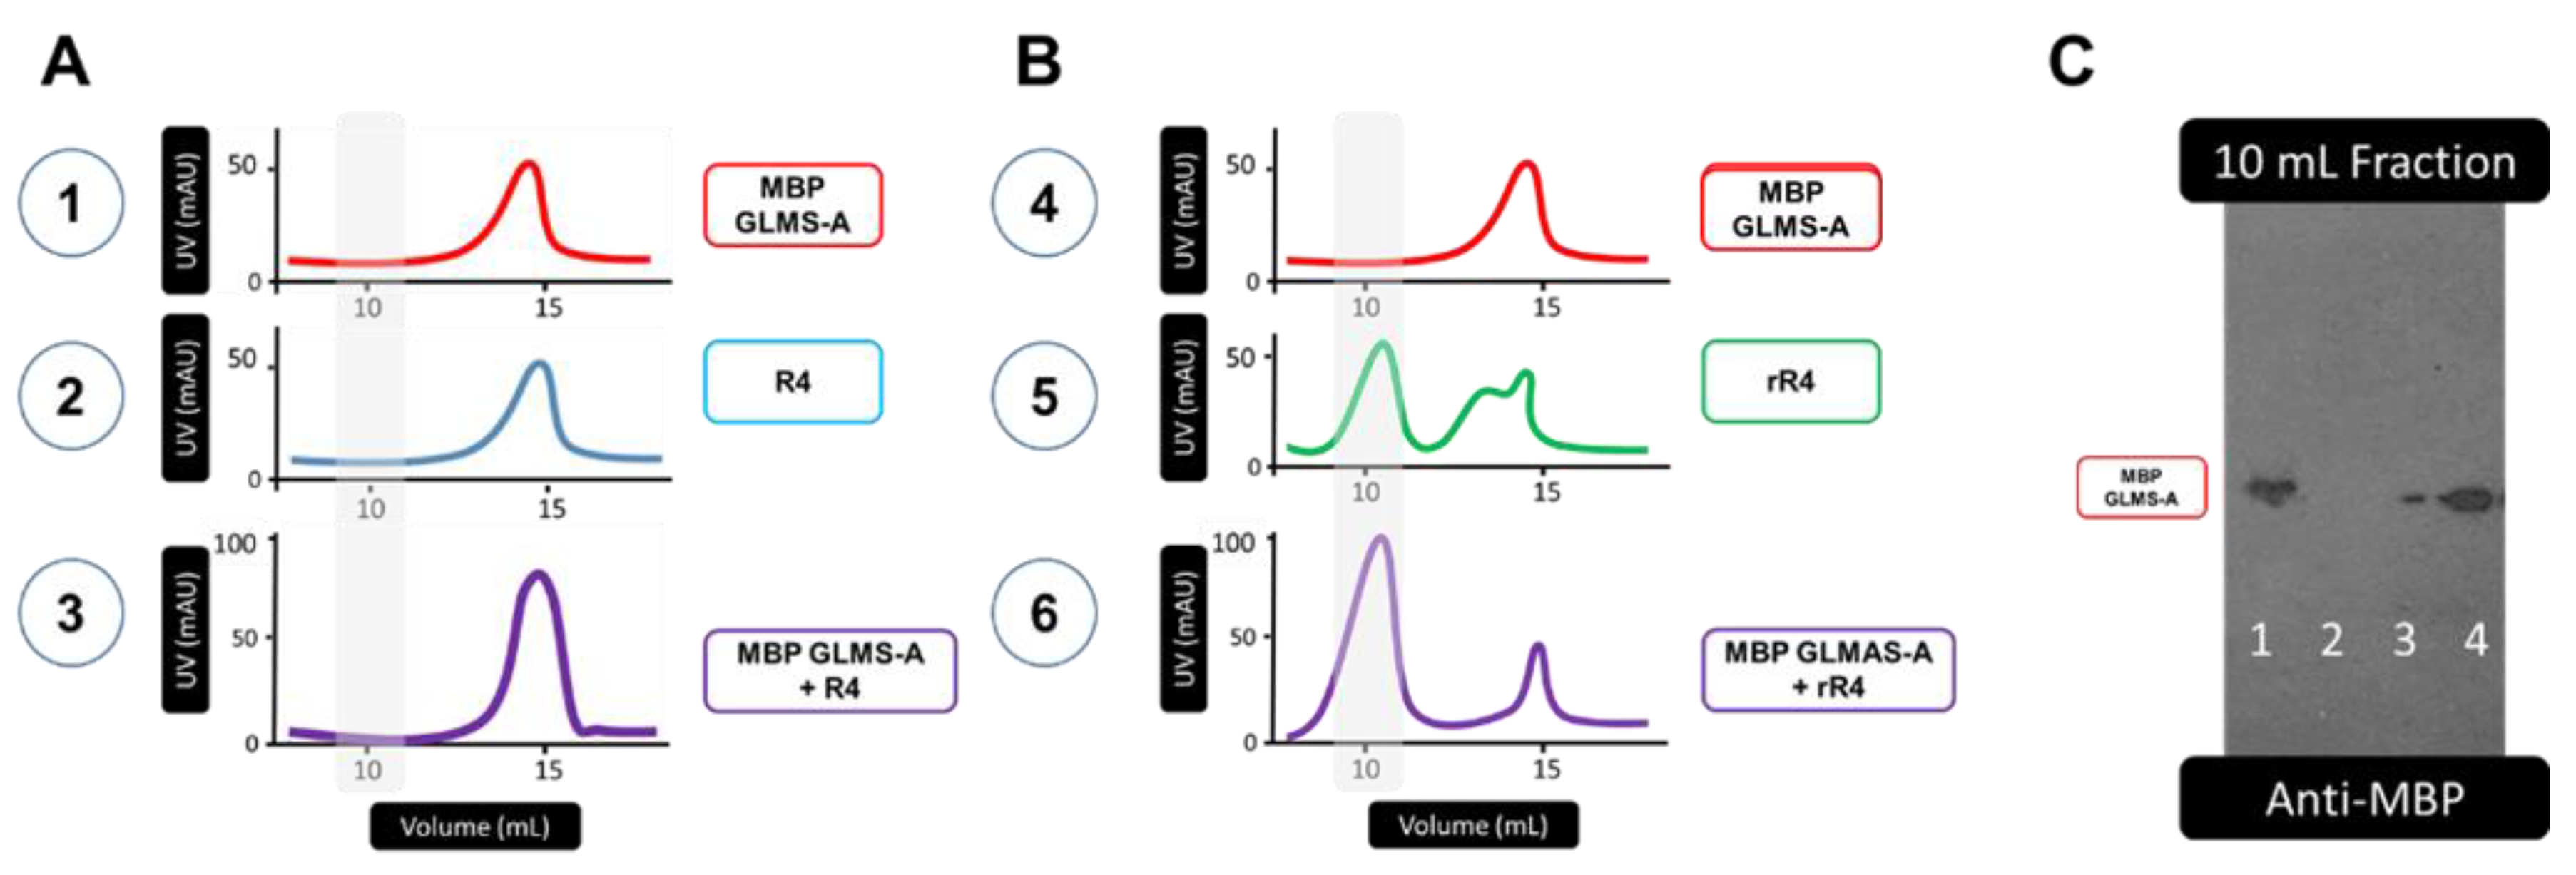
Following the cloning of GLMS-A into pMALc2x plasmid to generate MBP_GLMS-A we proceeded to perform SEC and Western blot analysis of the corresponding proteins. Figure 4 contains R4 (segment A.1), MBP_GLMS-A (segment A.2) and a mixture of both proteins (segment A.3) and their SEC profiles. We observed that single proteins elute at a monomeric size and that the mixture of both proteins also eluted as an addition of the monomeric sizes (overlapping peak). Figure 4.B contains rR4 (segment B.4), MBP_GLMS-A (segment B.5) and a mixture of both proteins (segment B.6) and their SEC profiles. As expected MBP_GLMS-A elutes as monomeric, rR4 elutes as a mixture of monomeric and aggregated. The mixture of rR4 and MBP_GLMS-A shifted to an elution volume that indicates interaction between proteins. To conclude that indeed MBP_GLMS-A has interacted with rR4 we conducted Western blot with anti-MBP antibody (1:50,000) and show the results in Figure 4.C. The results indicate that MBP_GLMS-A can be found in association with rR4 and not with R4 nor as a self-aggregate.
Figure 4. Comparison of SEC profiles of purified proteins and their mixtures. A) SEC of individual proteins, MBP_GLMS-A and R4 as well as a mixture of purified proteins. B) SEC of individual proteins, MBP_GLMS-A and rR4 as well as a mixture of purified proteins. C) Western blot using anti-MBP antibody. Lanes: 1 purified MBP_GLMS-A as positive control; 2 10-ml SEC fraction of MBP GLMS-A (A.1); 3 10-ml SEC fraction of mixture R4+ MBP GLMS-A (A.3); 4 10-ml SEC fraction of mixture rR4+ MBP GLMS-A (B.6).
Preprints 109263 g004
Having observed the conservation of function in rR4 respect to binding or recognition, although with a different target than R4’s target, we set out to determine if a different member of the IgSF, junctional adhesion molecule A (JAMA) would preserve its function of cell adhesion molecule (CAM), specifically cell-cell interactions [35]. CAMs of the IgSF regulate important processes such as cell proliferation, differentiation and morphogenesis. JAMA is an IgSF-CAM with no catalytic activity. Nevertheless, JAM-A is involved in a variety of biological processes. Recently we have presented evidence that JAMA is calcium sensitive [36] and further more its aggregation can be triggered by cations, with the greatest effect being triggered by Zinc [37].
We prepared pET28a plasmids, for E. coli expression, of JAMA and rJAMA. To observe cell-cell interactions driven by CAMs we fuse these proteins to outer membrane protein W (OmpW), a native membrane protein of E. coli, that populates exclusively the outer membrane. OmpW-JAMA and OmpW-rJAMA sequences can be extracted from Figure S1. Furthermore, due to the difficulty of working with membrane proteins and the inevitable use of detergents, we created MBP fusion proteins of the soluble domains of JAMA and rJAMA. These proteins are soluble and enable the study of aggregation. JAMA mediates cell-cell interaction in the tight junctions of endothelial and epithelial cells by conducting homotypic interactions between JAMA proteins of adjacent cells [38].
Figure 5A demonstrates through SEC profiles how JAMA and rJAMA soluble domains behave in solution. JAMA is expected to behave mostly as a monomer in the absence of environmental factors present at the tight junction where it can form dimers and other levels of aggregation [36,37,38]. Examining the SEC profiles in Figure 5A, we observe a contrast between monomeric JAMA and multimeric rJAMA. According to elution volumes, rR4 appears to have a molecular weight greater than 500 kDa.
JAMA aggregation is believed to occur in a Trans orientation, between JAMA in opposite or neighboring cells [38]. To determine if rJAMA has the same property of forming Trans interactions and thus driving cell-cell interactions we expressed full-length JAMA or rJAMA on the surface of E. coli. We have recently published the strategy and methodology to express CAMs on the outer membrane of E. coli [29,39]. Our method, named iCLASP, uses Flow Cytometry protocols to determine the extent of aggregation of bacteria expressing CAMs. Figure 5B represents a visual demonstration of unicellular behavior of E. coli in the absence of CAMs and the aggregation induced by CAM overexpression. Figure 5C demonstrates that both JAMA and rJAMA induce aggregation above the control (no CAM expression). Also, we observed that JAMA responds to the influence of Zinc by further aggregating, while rJAMA did not display this behavior. From our previous experiments we expected this could be the case considering JAMA is a monomer while rJAMA is already an oligomer. The evidence indicates that rJAMA is forming cell-cell interactions, corresponding to Trans interactions.
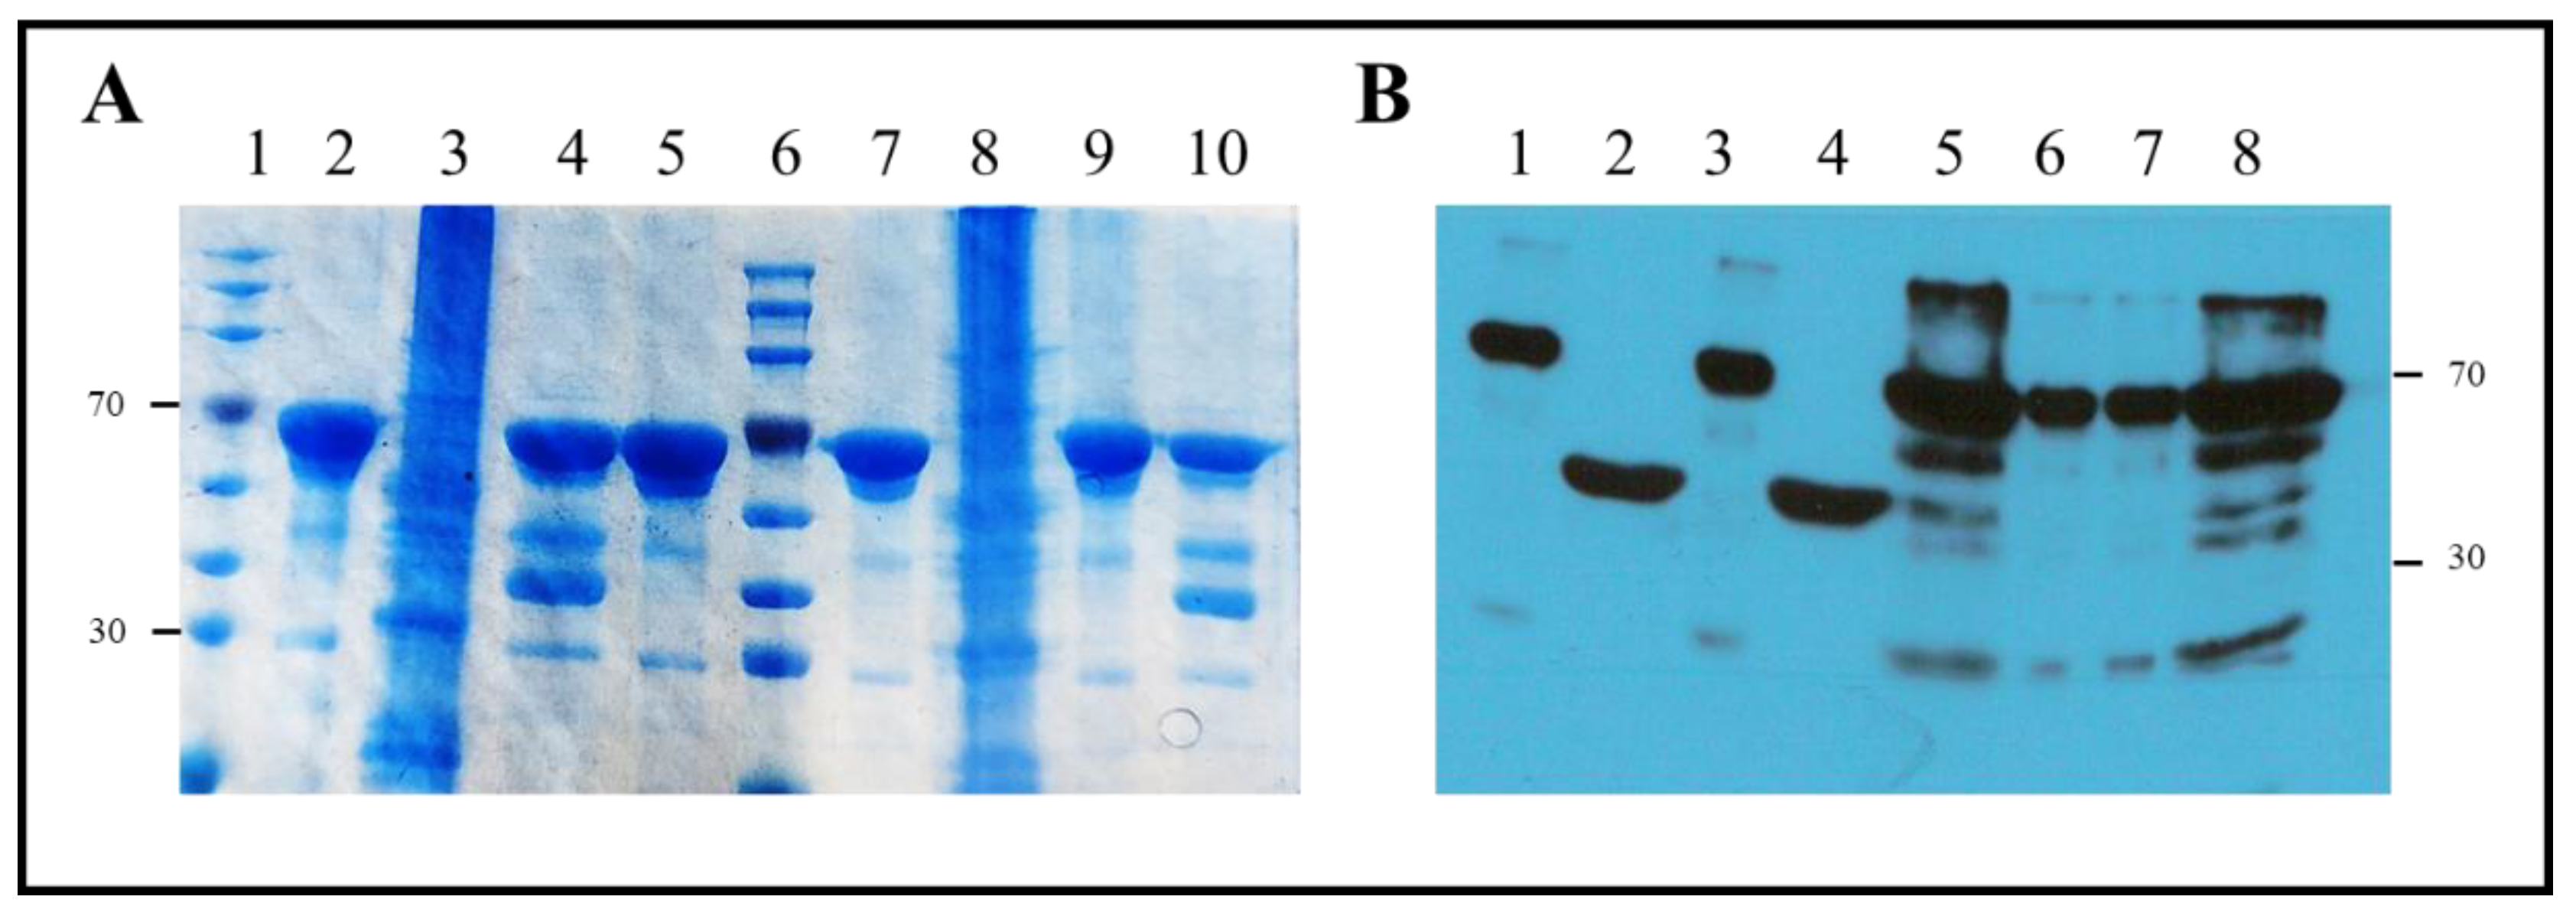
Following our design to demonstrate rR4 has affinity for a new target, GLMS, we decided to perform a pulldown experiment using recombinant MBP-JAM and MBP-rJAMA still attached to the Amylose resin that enables MBP-fusions to be purified [40]. In Figure 6 we observe that JAMA has affinity for JAMA but not for rJAMA, and vice versa.
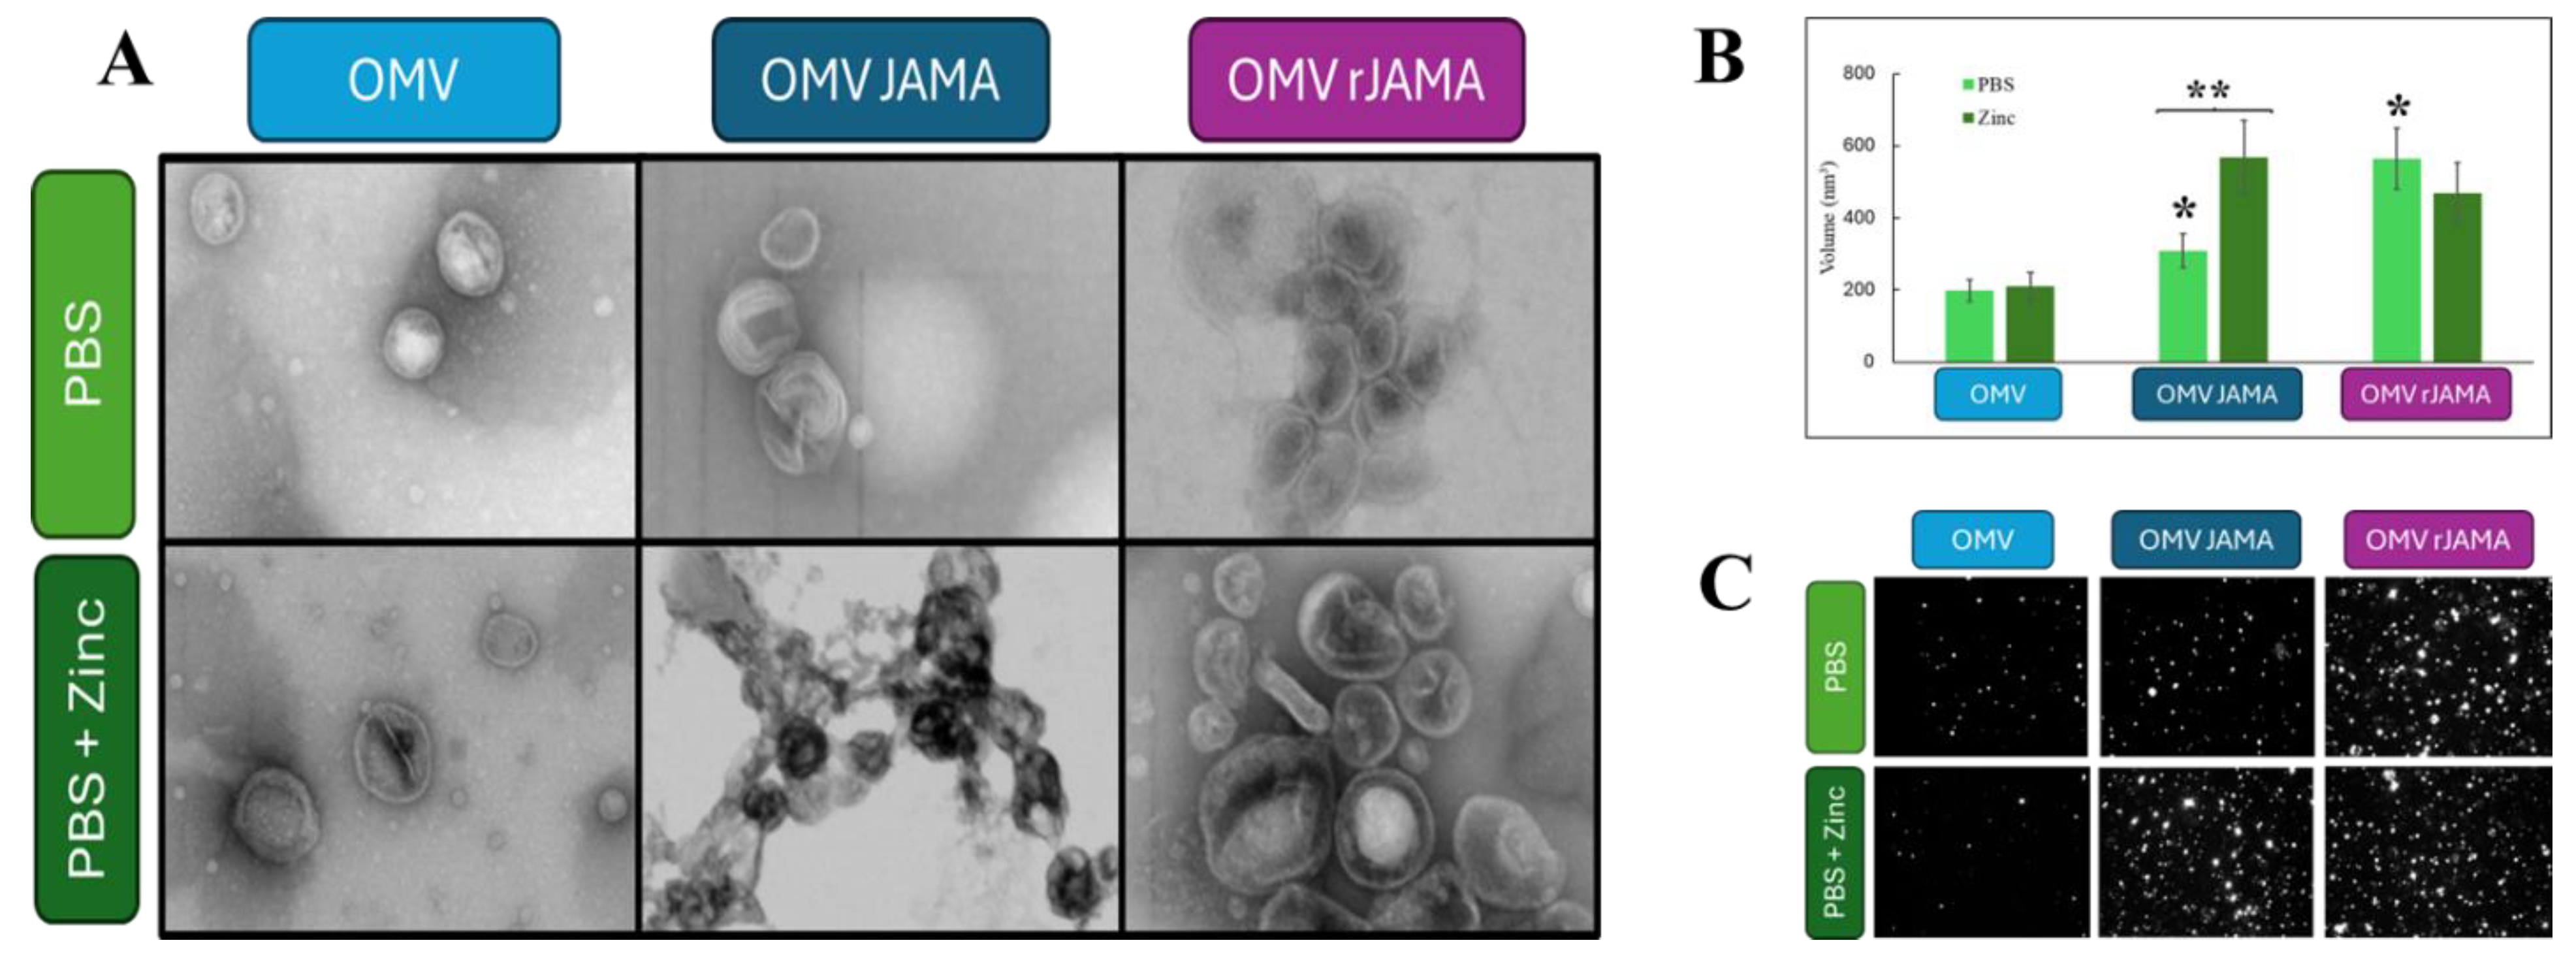
Our final experimental design employed a known technique to extract outer membrane vesicles (OMVs) from bacteria using EDTA [28]. Cells expressing OmpW alone (labeled as OMV) or OmpW fusions, JAMA or rJAMA (labeled as OMV JAMA and OMV rJAMA respectively) were examined by qualitative and quantitative methods. Figure 7A shows the results of our tests in a qualitative form by using Electron Microscopy images of OMV, OMV JAMA or OMV rJAMA in the presence of buffer (PBS) or Zinc. As expected OMV and OMV rJAMA did not seem to form aggregates or larger aggregates in the presence of Zinc respectively. On the other hand OMV JAMA did form larger aggregates in the presence of Zinc as expected. Figure 7B and C correspond to a quantitative line of experimentation using ZetaView [41]. A different approach to analyse OMVs regarding their size, and volumetric characteristics is through single particle interferometric reflectance imaging sensing (SP-IRIS) [42]. ZetaView is a nanoparticle tracking analysis (NTA) instrument for measuring hydrodynamic particle size and volume, concentration and fluorescence [41]. Figure 7B presents a graph that depicts the volume of the OMV isolated from the different E. coli cells expressing the above-mentioned proteins. OMV JAMA and OMV rJAMA had a statistically significant larger volume than OMV alone. Finally, OMV JAMA in the presence of Zinc displayed a larger volume that was statistically significant when compared to OMV JAMA in PBS only. The same was not quantified in OMV rJAMA. Figure 9C depicts still images of the recordings obtained during the experimentation and is a qualitative representation of the qualitative data observed in Figure 7.B. Original images can be found in the Supplementary materials.

4. Discussion

The literature of retro-proteins is limited to a handful of cases. As already stated, there are no native retro-proteins thus we resource to design and engineer non-natural retro proteins. In the past, examples of retro-proteins focus on peptides and alpha helical proteins. Peptidomimetics that are efficient in modulating protein-protein interactions and at the same time resistant to proteolysis have potential in therapeutic applications. Controversial due to underperformance, a peptidomimetic strategy is to employ D-amino acids and reversed sequences to mimic a lead peptide conformation, either separately or as the combined retro-inverso peptide. In the year 2013, Atzori and colleagues [43] used this strategy to examine the conformations of inverse, reverse and retro-inverso peptides of p53(15–29) using implicit solvent molecular dynamics simulation and circular dichroism spectroscopy. They concluded that a retro-inverso peptide is disadvantaged as a mimic and further chemical modification is required to enable this concept to be used with value in peptidomimetic design. Others have concluded that reversing the peptide sequence of a sequence of amino acids structured as a β-sheet retains the structural property but impacts the peptide’s molecular surface behavior [44]. The fold of retro-protein A, originated from the retro-sequence of the B domain of Staphylococcal protein A, was studied two decades ago [21]. Retro-protein A also forms a three-helix bundle structure in solution, preserving the topology of native protein A, yet two main structural aspects are highlighted as a conclusion: secondary structure elements in the retro-protein do not exactly match their counterparts in the original protein structure, and the amino acid side chain contract pattern of the hydrophobic core is partly conserved [21].
The retro proteins obtained from reading backwards the sequences of the SH3, a 61-residue protein that folds as a five-stranded orthogonal β-sheet sandwich, was engineered and expressed in E. coli cells [20]. Expression yields were always low, never sufficient to undergo purification and further structural characterization of the protein [20]. Finally, after applying Far-UV Circular Dichroism analysis and temperature scans, Lacroix and colleagues concluded that retro-SH3 could be unfolded [20]. More recent reports suggest that the retro-inverso strategy works poorly in molecular mimicry of biologically active helical peptides [45]. More positive reports to retro-inverso strategies describe a Urokinase Receptor Antagonists for the Treatment of Metastatic Sarcomas [46], antimicrobial peptides [47], a solubilizing fusion tag [48], and a retro-inverso collagen modulator peptide with enhanced stability and activity in vitro [49].
In the present work, we have attempted to study retro proteins that contain Ig domains, ScFv and JAMA. Similar to what was anticipated in the literature, we faced solubility issues and lower yields, especially rR4 (data not shown). Nevertheless we did not encounter a loss of folding as stated by others [20]. We determined that by identifying function in both rR4 and rJAMA. The primary structure of a protein determines its three-dimensional structure, or fold, which in turn influences its function [50]. This is known as the sequence-structure-function paradigm. Proteins with similar amino acid sequences often perform similar biochemical functions, even if they come from distantly related organisms. Thus, based on protein homology and structural properties we can identify function. As hinted in the literature, retro- or retro-inverso proteins have the exact same amino acid composition but the primary structure, the order in which these amino acids are synthesized and chemically and biophysically react to the environment as a new unit is completely different. In our experimentation we observed that rR4 folding had great similarity to R4 when Ramachandran plots were compared (Figure 1). Nevertheless, without proper crystal structures the models used to generate the plots could be influenced by our ability to predict secondary and tertiary structures of proteins. Folding of proteins occurs in part due to clashes between amino acids and hydrophobicity profiles of those amino acids. In any event, rR4 and rJAMA, due to the presence of function can be folded based on their respective primary sequence. As discussed above, native retro-protein has not been reported thus far, and aside from some retro-inverso peptides, functional retro-proteins have not been identified or characterized.
Cell adhesion molecules (CAMs) perform a wide range of functions at cell contacts, ranging from mechanical support to target recognition, from differentiation and specialization of membrane microdomains to the initiation, organization and regulation of signaling platforms, among CAMs is the largest protein family, the immunoglobulin superfamily (IgSF) [5,9,10]. We have determined that rR4 in spite of low yields, retains its ability for target recognition. R4 is an ScFv specifically targeting β-Gal. That property was lost in rR4 but through Mass Spectrometry we identified GLMS as the target for rR4. Due to the fact that GLMS is a native E. coli protein and contamination was always a concern we did not complete the analysis with an ELISA.
In the case of JAMA, rJAMA retained its ability perform cell-cell interactions by self-assembly of its extracellular domain. We characterized the aggregation profile of JAMA and rJAMA and determined that rJAMA forms large aggregates that deviate from JAMA’s behavior in solution. As membrane proteins both JAMA and rJAMA drive cell-cell interactions with similar phenotypic consequences to E. coli. Whole cell aggregation of E. coli. was characterized by our quantitative methodology iCLASP but could not be properly used to determine quantitatively a contrast in cell behavior. We decided to extract OMVs from cells expressing JAMA or rJAMA. This strategy also bypassed the reduced yields of soluble retro-proteins. In part it could also be due to the different set of chaperones that aid protein folding when the target is soluble, or membrane bound [51,52,53,54]. When OMVs were characterized, we observed that the behavior of soluble JAMA and rJAMA was replicated. OMV JAMA has a lesser ability to aggregate OMVs while cell-cell interactions (OMV-OMV) was largely enhanced by the presence of Zinc (Figure 7). Opposite to JAMA, rJAMA had a superior ability to create OMV-OMV interactions, also demonstrated insensitivity to Zinc (Figure 7), and correlated to the SEC profile of soluble rJAMA (Figure 5). The use of ZetaView nanoparticle tracker represented a great tool for qualitative and quantitative characterization of OMVs (Figure 7B and 7C). Previously we have used SEC to characterize soluble JAMA and rJAMA only qualitatively. Because rJAMA was already aggregated beyond the SEC sensitivity we could not confirm the effects of Zinc. JAMA’s susceptibility to Zinc was reported by our group previously [37]. Using ZetaView we have confirmed that rJAMA is not dependent on Zinc.
Through our experimental design and performance, we have provided evidence that Ig domain-containing proteins can be converted to retro-proteins. Although yields are low and challenging, the function of these new primary sequences is retained as to known functions of the parental protein. The challenge, as faced with rR4 relies on identifying new targets for these retro-ScFvs. When the amino acid sequence of rR4 and rJAMA were used in the BLAST tool the results were “No significant similarity found.” These results confirm that these retro proteins have sequences that are extremely unique, perhaps something nature has never encountered and never had to fold. Additionally, perhaps another indication is that retro-native proteins do not exist. The problem of folding these proteins could be solved by enhancing the chaperone battery present in a cell, e.g., GroEL [55]. The use of fusion proteins like MBP can also assist in increasing yields [56]. We reported that R4 yields are 10 times more than those of rR4. MBP-JAMA expressed 3-4-fold more than MBP-rJAMA. These approaches can overcome unfavorable crowding of amino acids in retro proteins, and long sequences of amino acids in an order that has never been synthesized. The amino acid residues have a chiral center and reversing the sequence could alter the structure of the peptide and eventually change or modify its function as observed with rR4. Retro proteins can modify other properties such as lateral conductivity (conductivity on the surface of water by using Langmuir monolayer) even when the hydrophobicity and the sequence length are the same [57]. It remains to be explored if these proteins are less susceptible to proteases.

5. Conclusions

In our study, the findings are compelling in terms of how the peptide primary structure plays an essential role to dictate specific surface activity for molecules that have a similar secondary (Ig domain, β-sheet) structure and identical hydrophobic profiles. According to our results, R4 and JAMA as templates for retro-proteins, preparing retro-proteins of Ig-domain (β-sheet)-containing proteins appear more successful than retro-peptides or retro-proteins of α-helical nature. Here we provide both qualitative and quantitative evidence of retro proteins that retain function while changing specificity. Our findings could have a role in the future of peptidomimetics or design of therapeutics.

Acknowledgments

The authors would like to acknowledge the BYU Electron Microscopy Facility for providing access to the equipment and expertise that allowed this project to be performed. Additionally, the Fritz B. Burns Biological Mass Spectrometry Facility. Both core facilities are located at Brigham Young University, Provo UT 84602.

References

  1. Adhav, V.A.; Saikrishnan, K. The Realm of Unconventional Noncovalent Interactions in Proteins: Their Significance in Structure and Function. ACS Omega 2023, 8, 22268–22284. [Google Scholar] [CrossRef]
  2. Anfinsen, C.B. Principles that govern the folding of protein chains. Science 1973, 181, 223–230. [Google Scholar] [CrossRef]
  3. Iorgulescu, J.B. Reporting of Immunotherapy and Biologic Therapy in the National Cancer Database. JAMA Oncol. 2023, 9, 1003. [Google Scholar] [CrossRef]
  4. Saeed, A.F.; et al. Antibody Engineering for Pursuing a Healthier Future. Front. Microbiol. 2017, 8, 495. [Google Scholar] [CrossRef]
  5. Aricescu, A.R.; Jones, E.Y. Immunoglobulin superfamily cell adhesion molecules: Zippers and signals. Curr. Opin. Cell Biol. 2007, 19, 543–550. [Google Scholar] [CrossRef]
  6. Berezin, V.A.; Walmod, P.S. Cell adhesion molecules: Implications in neurological diseases. Advances in neurobiology; Springer: New York, NY, USA, 2014; 410 pages. [Google Scholar]
  7. Alejandra, W.P.; et al. Production of monoclonal antibodies for therapeutic purposes: A review. Int. Immunopharmacol. 2023, 120, 110376. [Google Scholar] [CrossRef]
  8. Elgundi, Z.; et al. The state-of-play and future of antibody therapeutics. Adv. Drug Deliv. Rev. 2017, 122, 2–19. [Google Scholar] [CrossRef]
  9. Janeway, C. Immunobiology: The Immune System in Health and Disease. 2001: Garland Pub.
  10. Williams, A.F. and A. N. Barclay, The immunoglobulin superfamily--domains for cell surface recognition. Annu Rev Immunol 1988, 6, 381–405. [Google Scholar]
  11. Bemani, P., M. Mohammadi, and A. Hakakian, ScFv Improvement Approaches. Protein Pept Lett 2018, 25, 222–229. [Google Scholar] [CrossRef]
  12. Silva, T.A.; et al. Potential of an anti-bevacizumab idiotype scFv DNA-based immunization to elicit VEGF-binding antibody response. Gene Ther 2023, 30, 598–602. [Google Scholar] [CrossRef]
  13. Dreier, B. and A. Pluckthun, Rapid Selection of High-Affinity Antibody scFv Fragments Using Ribosome Display. Methods Mol Biol 2018, 1827, 235–268. [Google Scholar]
  14. Zhang, S., L. Wu, and M. Dang, Antibody mimetics: The next generation antibody engineering, a retrospective and prospective analysis. Biotechnol J 2024, 19, e2300532. [Google Scholar]
  15. Keri, D.; et al. Next generation of multispecific antibody engineering. Antib Ther 2024, 7, 37–52. [Google Scholar] [CrossRef]
  16. Qerqez, A.N., R. P. Silva, and J.A. Maynard, Outsmarting Pathogens with Antibody Engineering. Annu Rev Chem Biomol Eng 2023, 14, 217–241. [Google Scholar]
  17. Tsuchikama, K.; et al. Exploring the next generation of antibody-drug conjugates. Nat Rev Clin Oncol 2024, 21, 203–223. [Google Scholar] [CrossRef]
  18. Guichard, G.; et al. Antigenic mimicry of natural L-peptides with retro-inverso-peptidomimetics. Proc Natl Acad Sci U S A 1994, 91, 9765–9769. [Google Scholar] [CrossRef] [PubMed]
  19. Chorev, M. and M. Goodman, Recent developments in retro peptides and proteins--an ongoing topochemical exploration. Trends Biotechnol 1995, 13, 438–445. [Google Scholar]
  20. Lacroix, E., A. R. Viguera, and L. Serrano, Reading protein sequences backwards. Fold Des 1998, 3, 79–85. [Google Scholar]
  21. Olszewski, K.A., A. Kolinski, and J. Skolnick, Does a backwardly read protein sequence have a unique native state? Protein Eng 1996, 9, 5–14. [Google Scholar]
  22. Mittl, P.R.; et al. The retro-GCN4 leucine zipper sequence forms a stable three-dimensional structure. Proc Natl Acad Sci U S A 2000, 97, 2562–2566. [Google Scholar] [CrossRef]
  23. Jumper, J.; et al. Highly accurate protein structure prediction with AlphaFold. Nature 2021, 596, 583–589. [Google Scholar] [CrossRef]
  24. Martineau, P., P. Jones, and G. Winter, Expression of an antibody fragment at high levels in the bacterial cytoplasm. J Mol Biol 1998, 280, 117–127. [Google Scholar]
  25. Karlsson, A.J.; et al. Engineering antibody fitness and function using membrane-anchored display of correctly folded proteins. J Mol Biol 2012, 416, 94–107. [Google Scholar] [CrossRef]
  26. Pettersen, E.F.; et al. UCSF Chimera--a visualization system for exploratory research and analysis. J Comput Chem 2004, 25, 1605–1612. [Google Scholar] [CrossRef]
  27. Goldman, A.R.; et al. Proteome Analysis Using Gel-LC-MS/MS. Curr Protoc Protein Sci 2019, 96, e93. [Google Scholar] [CrossRef]
  28. Prachayasittikul, V.; et al. EDTA-induced membrane fluidization and destabilization: Biophysical studies on artificial lipid membranes. Acta Biochim Biophys Sin (Shanghai) 2007, 39, 901–913. [Google Scholar] [CrossRef]
  29. Rollins, J.; et al. Expression of Cell-Adhesion Molecules in E. coli: A High Throughput Screening to Identify Paracellular Modulators. Int J Mol Sci 2023, 24. [Google Scholar]
  30. Worn, A. and A. Pluckthun, An intrinsically stable antibody scFv fragment can tolerate the loss of both disulfide bonds and fold correctly. FEBS Lett 1998, 427, 357–361. [Google Scholar] [PubMed]
  31. Tassew, N.G.; et al. Sustained in vivo inhibition of protein domains using single-chain Fv recombinant antibodies and its application to dissect RGMa activity on axonal outgrowth. J Neurosci 2009, 29, 1126–1131. [Google Scholar] [CrossRef]
  32. Boldicke, T. , Single domain antibodies for the knockdown of cytosolic and nuclear proteins. Protein Sci 2017, 26, 925–945. [Google Scholar] [CrossRef]
  33. de Aguiar, R.B.; et al. Generation and functional characterization of a single-chain variable fragment (scFv) of the anti-FGF2 3F12E7 monoclonal antibody. Sci Rep 2021, 11, 1432. [Google Scholar] [CrossRef] [PubMed]
  34. Ahmad, Z.A.; et al. scFv antibody: Principles and clinical application. Clin Dev Immunol 2012, 2012, 980250. [Google Scholar] [CrossRef] [PubMed]
  35. Steinbacher, T., D. Kummer, and K. Ebnet, Junctional adhesion molecule-A: Functional diversity through molecular promiscuity. Cell Mol Life Sci 2018, 75, 1393–1409. [Google Scholar] [PubMed]
  36. Mendoza, C.; et al. Calcium regulates the interplay between the tight junction and epithelial adherens junction at the plasma membrane. FEBS Lett 2022, 596, 219–231. [Google Scholar] [CrossRef] [PubMed]
  37. Mendoza C., N. S.H., Peterson K., and Mizrachi D., Cations as Molecular Switches for Junctional Adhesion Molecule-A. Biomedical Journal of Scientific & Technical Research, 2022.
  38. Ebnet, K. Junctional Adhesion Molecules (JAMs): Cell Adhesion Receptors With Pleiotropic Functions in Cell Physiology and Development. Physiol Rev 2017, 97, 1529–1554. [Google Scholar] [CrossRef] [PubMed]
  39. Rollins, J.; et al. Expression of cell-adhesion molecules in E. coli: A high-throughput method to identify paracellular modulators. 2021, Cold Spring Harbor Laboratory.
  40. Duong-Ly, K.C.; Gabelli, S.B. Affinity Purification of a Recombinant Protein Expressed as a Fusion with the Maltose-Binding Protein (MBP) Tag. Methods Enzymol. 2015, 559, 17–26. [Google Scholar]
  41. Bachurski, D.; et al. Extracellular vesicle measurements with nanoparticle tracking analysis - An accuracy and repeatability comparison between NanoSight NS300 and ZetaView. J Extracell Vesicles 2019, 8, 1596016. [Google Scholar] [CrossRef] [PubMed]
  42. Daaboul, G.G.; et al. Digital Detection of Exosomes by Interferometric Imaging. Sci. Rep. 2016, 6, 37246. [Google Scholar] [CrossRef] [PubMed]
  43. Atzori, A.; et al. Effect of sequence and stereochemistry reversal on p53 peptide mimicry. PLoS ONE 2013, 8, e68723. [Google Scholar] [CrossRef]
  44. Ambroggio, E.E.; et al. Reversing the peptide sequence impacts on molecular surface behaviour. Colloids Surf B Biointerfaces 2016, 139, 25–32. [Google Scholar] [CrossRef]
  45. Li, C.; et al. Limitations of peptide retro-inverso isomerization in molecular mimicry. J Biol Chem 2010, 285, 19572–19581. [Google Scholar] [CrossRef] [PubMed]
  46. Carriero, M.V.; et al. Retro-inverso Urokinase Receptor Antagonists for the Treatment of Metastatic Sarcomas. Sci Rep 2017, 7, 1312. [Google Scholar] [CrossRef] [PubMed]
  47. Franco, O.L. , Development of antimicrobial peptides as a strategy for infectious disease control. Peptides 2022, 150, 170761. [Google Scholar] [CrossRef] [PubMed]
  48. Xie, X.; et al. Retro-protein XXA is a remarkable solubilizing fusion tag for inclusion bodies. Microb Cell Fact 2022, 21, 51. [Google Scholar] [CrossRef]
  49. Errante, F.; et al. Retro-Inverso Collagen Modulator Peptide Derived from Serpin A1 with Enhanced Stability and Activity In Vitro. J. Med. Chem. 2024, 67, 5053–5063. [Google Scholar] [CrossRef]
  50. Sercinoglu, O. and P. Ozbek, Sequence-structure-function relationships in class I MHC: A local frustration perspective. PLoS ONE 2020, 15, e0232849. [Google Scholar] [CrossRef]
  51. Pfanner, N. , Who chaperones nascent chains in bacteria? Curr. Biol. 1999, 9, R720–R724. [Google Scholar] [CrossRef]
  52. Lill, R.; et al. The “trigger factor cycle” includes ribosomes, presecretory proteins, and the plasma membrane. Cell 1988, 54, 1013–1018. [Google Scholar] [CrossRef]
  53. He, W.; et al. Chaperone Spy Protects Outer Membrane Proteins from Folding Stress via Dynamic Complex Formation. mBio 2021, 12, e0213021. [Google Scholar] [CrossRef]
  54. Castanie-Cornet, M.P., N. Bruel, and P. Genevaux, Chaperone networking facilitates protein targeting to the bacterial cytoplasmic membrane. Biochim. Biophys Acta 2014, 1843, 1442–1456. [Google Scholar] [CrossRef]
  55. Marchenkov, V.V. and G.V. Semisotnov, GroEL-assisted protein folding: Does it occur within the chaperonin inner cavity? Int. J. Mol. Sci. 2009, 10, 2066–2083. [Google Scholar] [CrossRef] [PubMed]
  56. Raran-Kurussi, S.; Keefe, K.; Waugh, D.S. Positional effects of fusion partners on the yield and solubility of MBP fusion proteins. Protein. Expr. Purif. 2015, 110, 159–164. [Google Scholar]
  57. Alvarez, A.B.; et al. Stitching together a nm thick peptide-based semiconductor sheet using UV light. Colloids Surf B Biointerfaces 2021, 203, 111734. [Google Scholar] [CrossRef] [PubMed]
Figure 1. Basic structure of R4 and rR4. A) Conceptual model of derived ScFv. B) The structure of an ScFv (PDB ID 1BVK) for schematic representation, shows the two domains and a typical Ramachandran plot. C) The structure of rR4 (generated using UCSF Chimera v. 1.15 package) shows the two domains of the protein and its Ramachandran plot.
Preprints 109263 g001
Figure 2. Size exclusion chromatography (SEC) profile purification of R4 and rR4 and ELISA. A) R4 SEC profile shows a monomer protein peak at about 15 mL, corresponding to 30 kDa mass. B) rR4 SEC profile retains monomeric properties such as R4 but additionally presents other oligomeric properties. B) Both R4 and rR4 were subjects to the ELISA assay against β-galactosidase (β-gal). β-gal is the intended target for R4. The dissociation constant Kd for R4 and rR4 was extracted from the absorbance data using Prism (GraphPad, Massachusetts, United States). R4 (Kd 106.11±37 nM) rR4 (Kd 1737.82±207 nM).
Preprints 109263 g002
Figure 3. Identification of binding partner of rR4. Validation of R4 and rR4 by SDS-PAGE and Mass Spectrometry. 1. SDS PAGE shows the R4 (light blue arrow) and rR4 (green arrow) share the same molecular weight 30 kDa. Additionally, when rR4 is purified using NiNTA resin, a protein co-elutes (black arrow) that is absent in the R4 purification. The lane between the arrows corresponds to a Molecular Weight marker. 2. Mass Spectrometry identified this protein as Glucosamine-6-phosphate synthase (GLMS), protein accession number P17169. 3. Crystal structure of GLMS (PDB ID 1JXA) forming a homodimer between the B domains. 4. Proposed plasmid construct to study GLMS and rR4 interactions. The construct is a fusion protein between MBP and the domain A of GLMS (Figure 1S).
Preprints 109263 g003
Figure 5. E. coli expression of JAMA and rJAMA. A) MBP-JAMA SEC shows a monomeric peak at 16 mL volume, a predicted size of 70 kDa. MBP-rJAMA SEC shows a shift to higher order of aggregation, a predicted molecular weight of over 500 kDa. B) E. coli cells expressing outer membrane protein W (OmpW) retains unicellular behavior, and OmpW-cell adhesion molecules (CAMs) changing phenotype of E. coli to multicellular aggregates. The orange bar represents 2 µm. The panel to the right of the pictures represents a model of the technique. C) Cell aggregation can be determine using Flow Cytometry [29]. In this technique, named iCLASP, a slope is determined for all the cells moving through the detector and recorded by size. A greater slope corresponds to greater aggregation. The graph plots the slope for the cells expressing OmpW only or our test CAMs.
Preprints 109263 g005
Figure 6. Characterization of JAMA and rJAMA homotypic interactions. A) Pull down of OmpW-JAMA or rJAM by MBP fused to the corresponding soluble domains. Lanes: 1- Molecular Weight marker; 2 MBP-JAMA; 3 Detergent lysate OmpW-JAMA; 4 Pull down of OmpW-JAMA with MBP-JAMA; 5 Pull down of OmpW-JAMA with MBP-rJAMA; 6- Molecular Weight marker; 7 MBP-rJAMA; 8 Detergent lysate OmpW-rJAMA; 9 Pull down of OmpW-rJAMA with MBP-JAMA; 10 Pull down of OmpW-JAMA with MBP-rJAMA. B) Western blot, anti-6xHis tag. Lanes: 1 MBP-JAMA; 2 Lysate OmpW-JAMA; 3 MBP-rJAMA; 4 Lysate OmpW-rJAMA; 5 Pull down of OmpW-JAMA with MBP-JAMA; 6 Pull down of OmpW-rJAMA with MBP-JAMA; 7 Pull down of OmpW-JAMA with MBP-rJAMA; 8 Pull down of OmpW-rJAMA with MBP-rJAMA.
Preprints 109263 g006
Figure 7. Characterization of outer membrane vesicles (OMVs) from E. coli expressing JAMA or rJAMA. A) Electron microscopy imaging of OMVs from cells expressing OmpW, OmpW-JAMA or OmpW-rJAMA. OMVs are subject to PBS or PBS+2 mM ZnCl2. B) Characterization of OMV’s volume using ZetaView under the same conditions as described in panel A. Asterisks: (*) represent p<0.05 of sample against OMV. (**) represent p<0.05 of JAMA versus JAMA in the presence of Zinc. C) Visual representation of the results in panel B obtained using ZetaView software.
Preprints 109263 g007
Disclaimer/Publisher’s Note: The statements, opinions and data contained in all publications are solely those of the individual author(s) and contributor(s) and not of MDPI and/or the editor(s). MDPI and/or the editor(s) disclaim responsibility for any injury to people or property resulting from any ideas, methods, instructions or products referred to in the content.
Copyright: This open access article is published under a Creative Commons CC BY 4.0 license, which permit the free download, distribution, and reuse, provided that the author and preprint are cited in any reuse.
Prerpints.org logo

Preprints.org is a free preprint server supported by MDPI in Basel, Switzerland.

Subscribe

© 2024 MDPI (Basel, Switzerland) unless otherwise stated