1. Introduction
Over the next twenty years, the Cislunar region is set to host over 50 missions with various payloads, highlighting its growing importance across scientific, commercial, and military sectors, key for expansion and investment [
1,
2,
3,
4]. The Cislunar region includes the spatial volume between the Earth and the Moon, separated by almost 400,000 km. This region is heavily influenced by the gravitational forces of both celestial bodies, resulting in highly nonlinear and more chaotic behavior compared to orbits close to Earth, which makes predicting the evolution of debris clouds through the system challenging. Debris poses a significant risk to missions, as even a single collision may result in catastrophic failure. Enhancing the understanding of these impacts will improve safety measures, considering the inherent risks and dangers of this environment.
The concern over debris has been a focus of previous studies. Previous works focus on the near-Earth environment, assuring the safety of missions around the Earth. Some studies use the two-body problem (2BP) [
5] in which debris behavior differs from the dynamical model of interest, the circular restricted three-body problem (CR3BP). Other researchers have studied fragmentation events near the Sun-Earth Lagrange Points [
6], using the CR3BP equations for the Sun-Earth system. Their findings indicate that approximately half of the fragments moved closer to Earth, while the other half moved away from it. Other studies focus on Cislunar debris due to meteoroids [
7,
8] and Kordylewski clouds [
9,
10]. Although these issues are also important and a point to consider when planning a mission, it does not cover all the dangers in the region. Other investigations study the evolution of space debris resulting from catastrophic mishaps close to the Earth-Moon Lagrange Points. Additionally, these studies analyze the survivability of spacecraft in periodic orbits, applying perturbations such as the solar gravity [
9,
11,
12,
13,
14,
15,
16,
17]. Although the results from these studies are more precise, the higher computational cost limits the number of debris fragments that are considered. Fragmentation events in the vicinity of L
Earth-Moon Lagrange Points are studied for different periodic orbits, such as near-rectilinear halo orbit, distant retrograde orbits (DRO) and Lyapunov orbits [
1]. Black et al. used a modified NASA Standard Breakup Model to simulate spacecraft fragmentation in
and
Lyapunov orbits [
18,
19]. They studied fragment behavior based on energy levels and orbit locations near the
Lagrange point.
As mentioned, different studies analyze the effects of explosions in such region, but the literature frequently overlooks the high computational cost of simulating fragmentation events. Due to limitations on debris generation, it is often difficult to obtain patterns of evolution and relationships between explosions in different orbits and regions. This research bridges that gap by creating a comprehensive historical database of mishaps in key regions of interest in the Cislunar realm. By conducting detailed simulations of explosions in different Cislunar orbits, this study aims to thoroughly assess their impacts, with a particular focus on libration point orbits and the vicinity of the Moon. The research also examines the potential effects on other orbiting satellites to evaluate the safety and viability of future missions, considering both existing and predicted debris. Key contributions of this work include developing an efficient computation process for modeling explosions, creating comprehensive databases to improve computational efficiency, and analyzing debris to identify danger zones and enhance safety measures. Additionally, the research examines explosions in various families to study debris evolution and develops a Graphical User Interface (GUI) to facilitate understanding and analysis of debris-related issues.
The structure of this paper is organized as follows. The methodology used is explained in
Section 2, including the dynamical and fragmentation models used.
Section 3 presents the fragmentation events, the locations where these occur, the time of study chosen to analyze the debris evolution, and the definition of the process regarding the computation of the mishaps.
Section 4 summarizes the simulations, describing the steps required to generate the database related to three different orbits, with their explosions and resulting debris. Results from explosions in L
and L
Lyapunov orbits are analyzed and compared in
Section 5. Additionally, a simulation of 200 explosions occurring in a DRO is conducted to study patterns influenced by the stability of the orbit. Finally,
Section 6 concludes the study by discussing the improvements achieved and summarizing the future work.
2. Methodology
This section outlines key concepts related to the methodology used in this research, including the dynamics and fragmentation models.
2.1. Dynamical Model – The Circular Restricted Three-Body Problem
The circular restricted three-body problem (CR3BP) is a simplified dynamical model useful to describe the motion of a spacecraft under the influence of two primaries [
20]. More specifically, in the Cislunar region, the Earth and Moon are the larger and smaller primaries, respectively. The spacecraft is the third body of the problem and its mass is negligible compared to the primaries. In this way, a rotating frame is defined, where the
-axis is directed from the Earth-Moon barycenter to the Moon, and the
-axis points from the barycenter towards the direction of the angular momentum vector of the system.
A dimensionless system of differential equations is implemented in the CR3BP. In order to nondimensionalize the problem, some characteristic values are defined [
21]. The values used are included in
Table 1. The mass ratio of the system is defined as
, which helps to normalize the problem [
20]. Earth and Moon’s positions are defined as
and
, respectively. Finally, note that the characteristic time guarantees the mean motion of the primaries to be equal to unity (
). The equations of motion (EOM) that govern the evolution of the third body, depending on the derivatives with respect to dimensionless time are
The EOM depend on the pseudo-potential function of the system,
, given by
where
and
represent the distances from the Earth and the Moon to the spacecraft, respectively. The state vector in the CR3BP,
, is defined to include three components of position and velocity.
There are other variables of interest for the CR3BP model, such as the Lagrange points, also known as libration points. Their locations represent the regions of space where the spacecraft has zero velocity and acceleration [
22], remaining stationary with respect to the Earth and the Moon. The solutions are included in
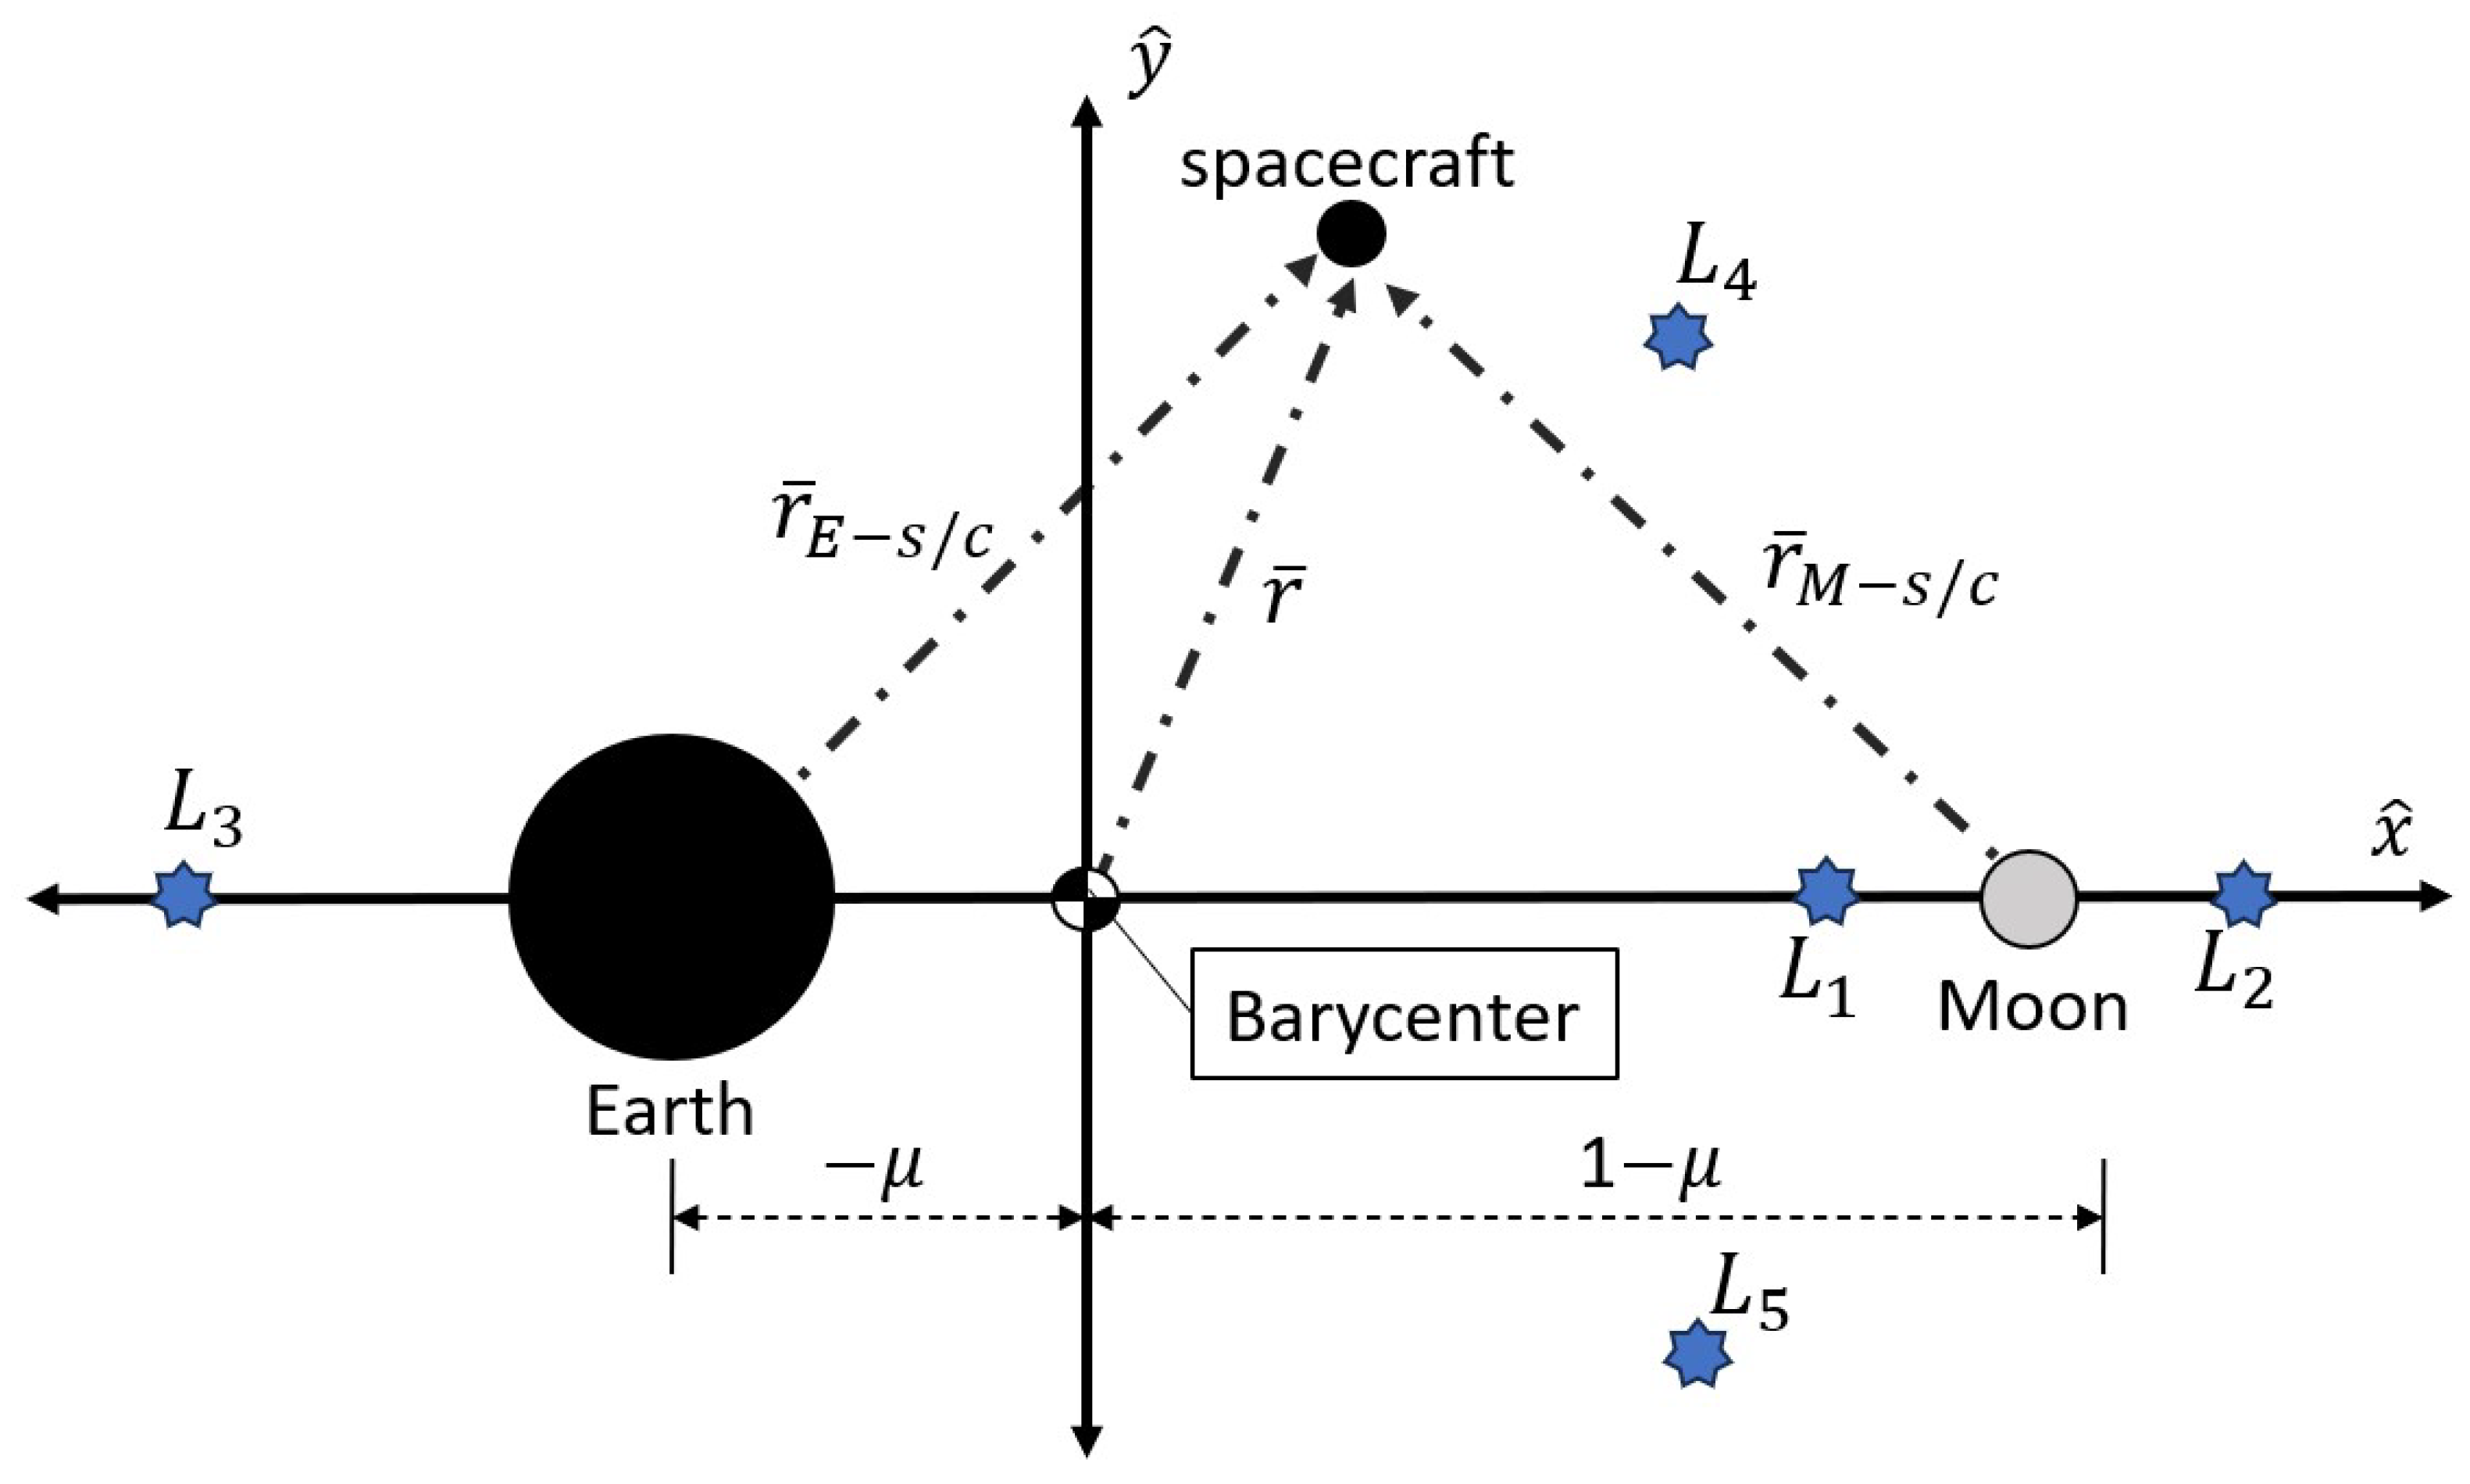
Table 2. A diagram for the Earth-Moon CR3BP model is shown in
Figure 1, showing the three bodies and the Lagrange points in the barycentric rotating frame.
Solutions around the libration points are categorized by families of periodic orbits. In the Cislunar region, the highly nonlinear dynamics cause some periodic orbits to deviate from two-body problem (2BP) characteristics due to perturbations from the Moon [
23]. The orbit families in the CR3BP are defined by their period, stability, and Jacobi constant. The Jacobi constant is a scalar integral for the system
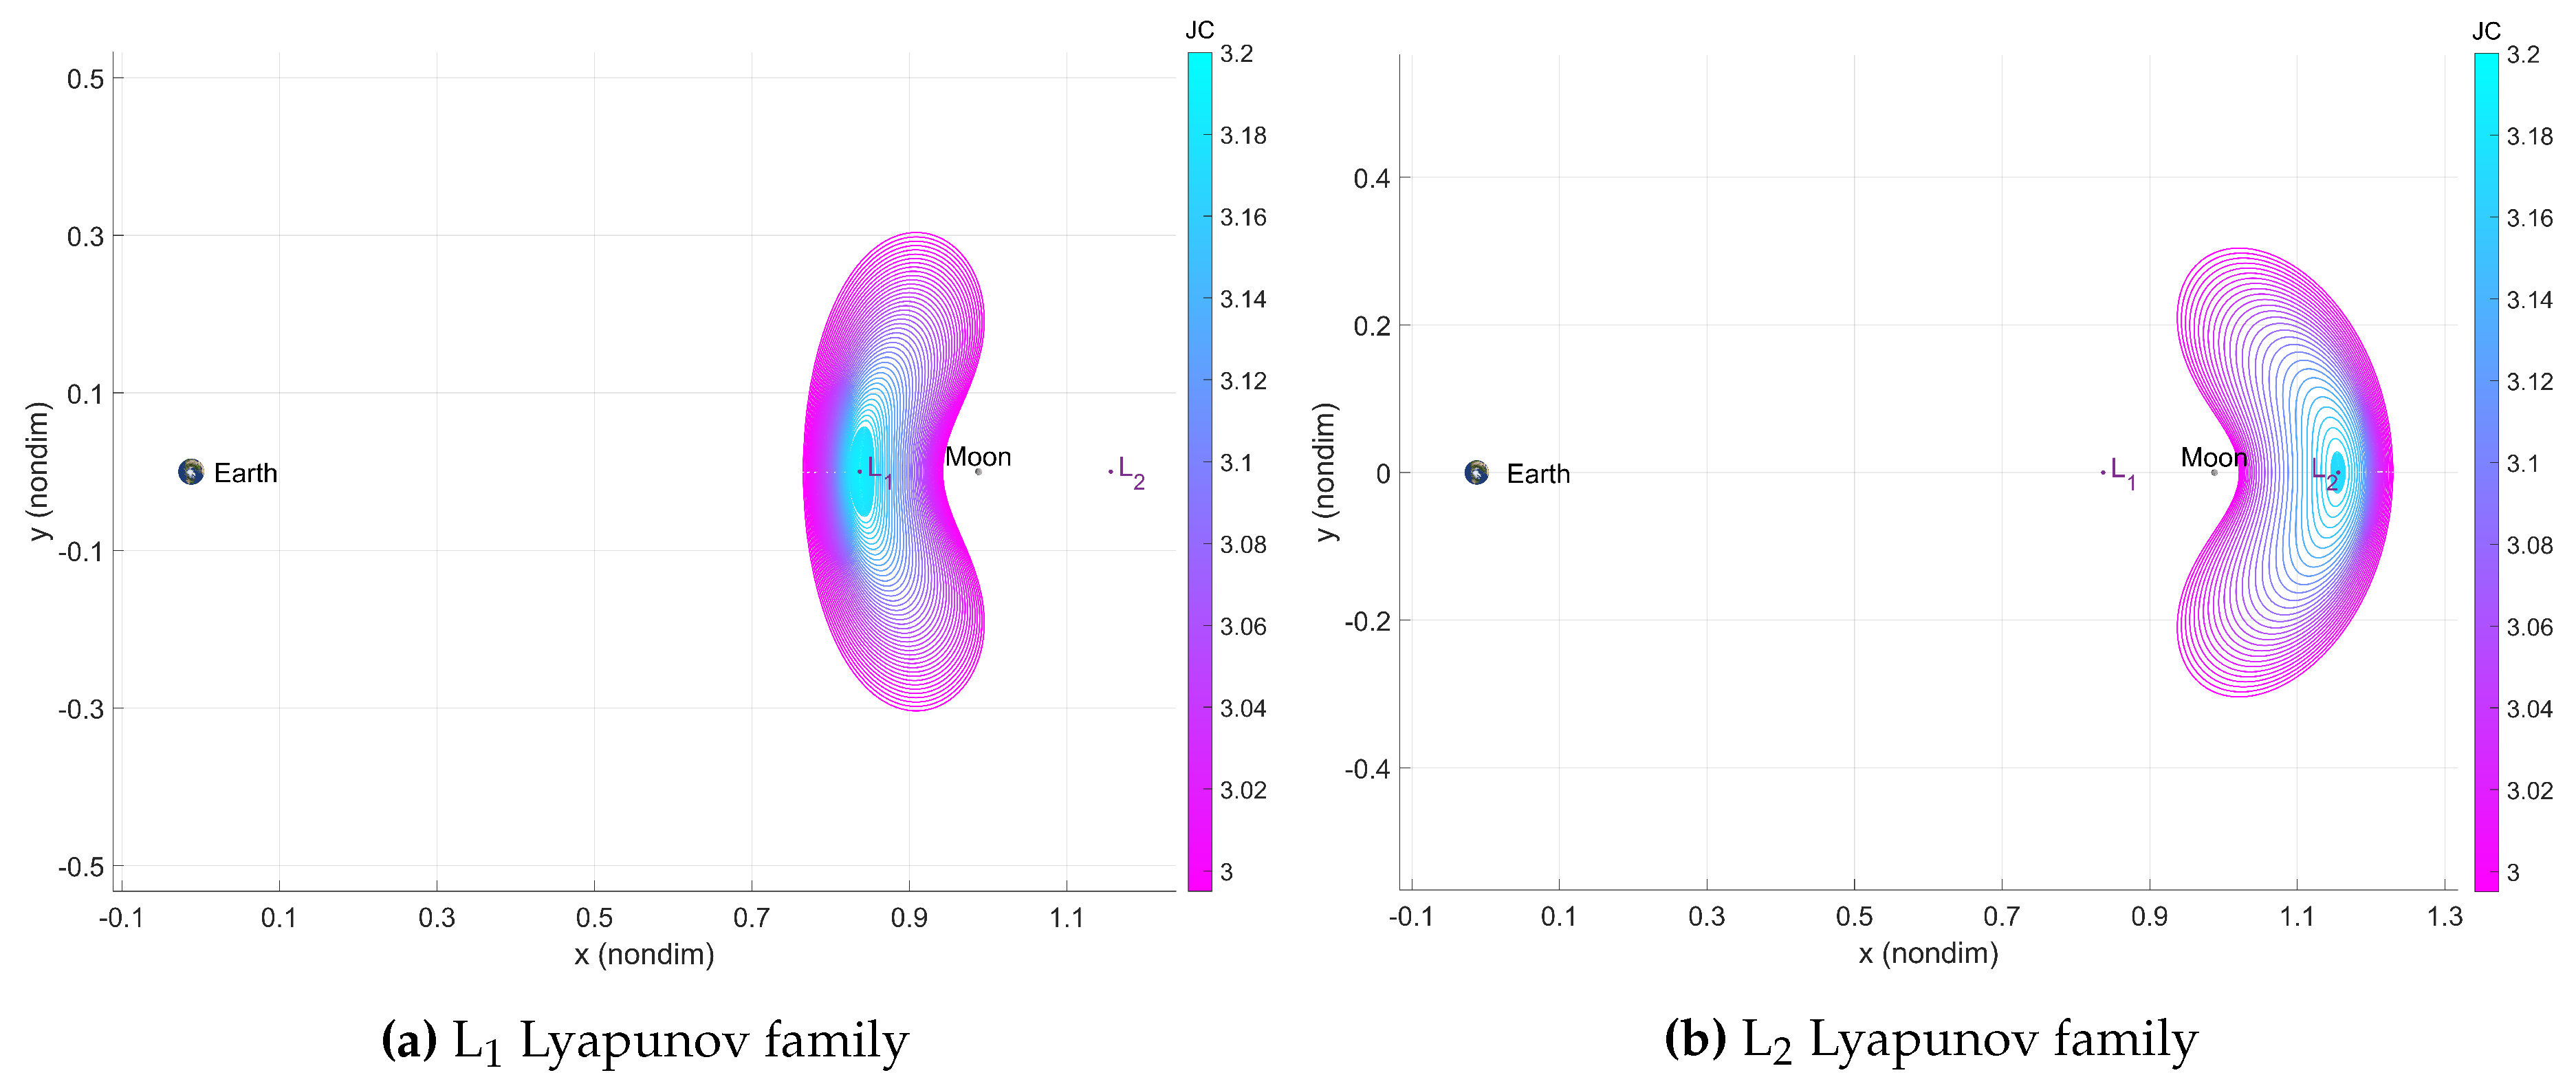
that gives information about the energy of the spacecraft. This study focuses on Lyapunov orbits, presenting results for those around L
and L
(
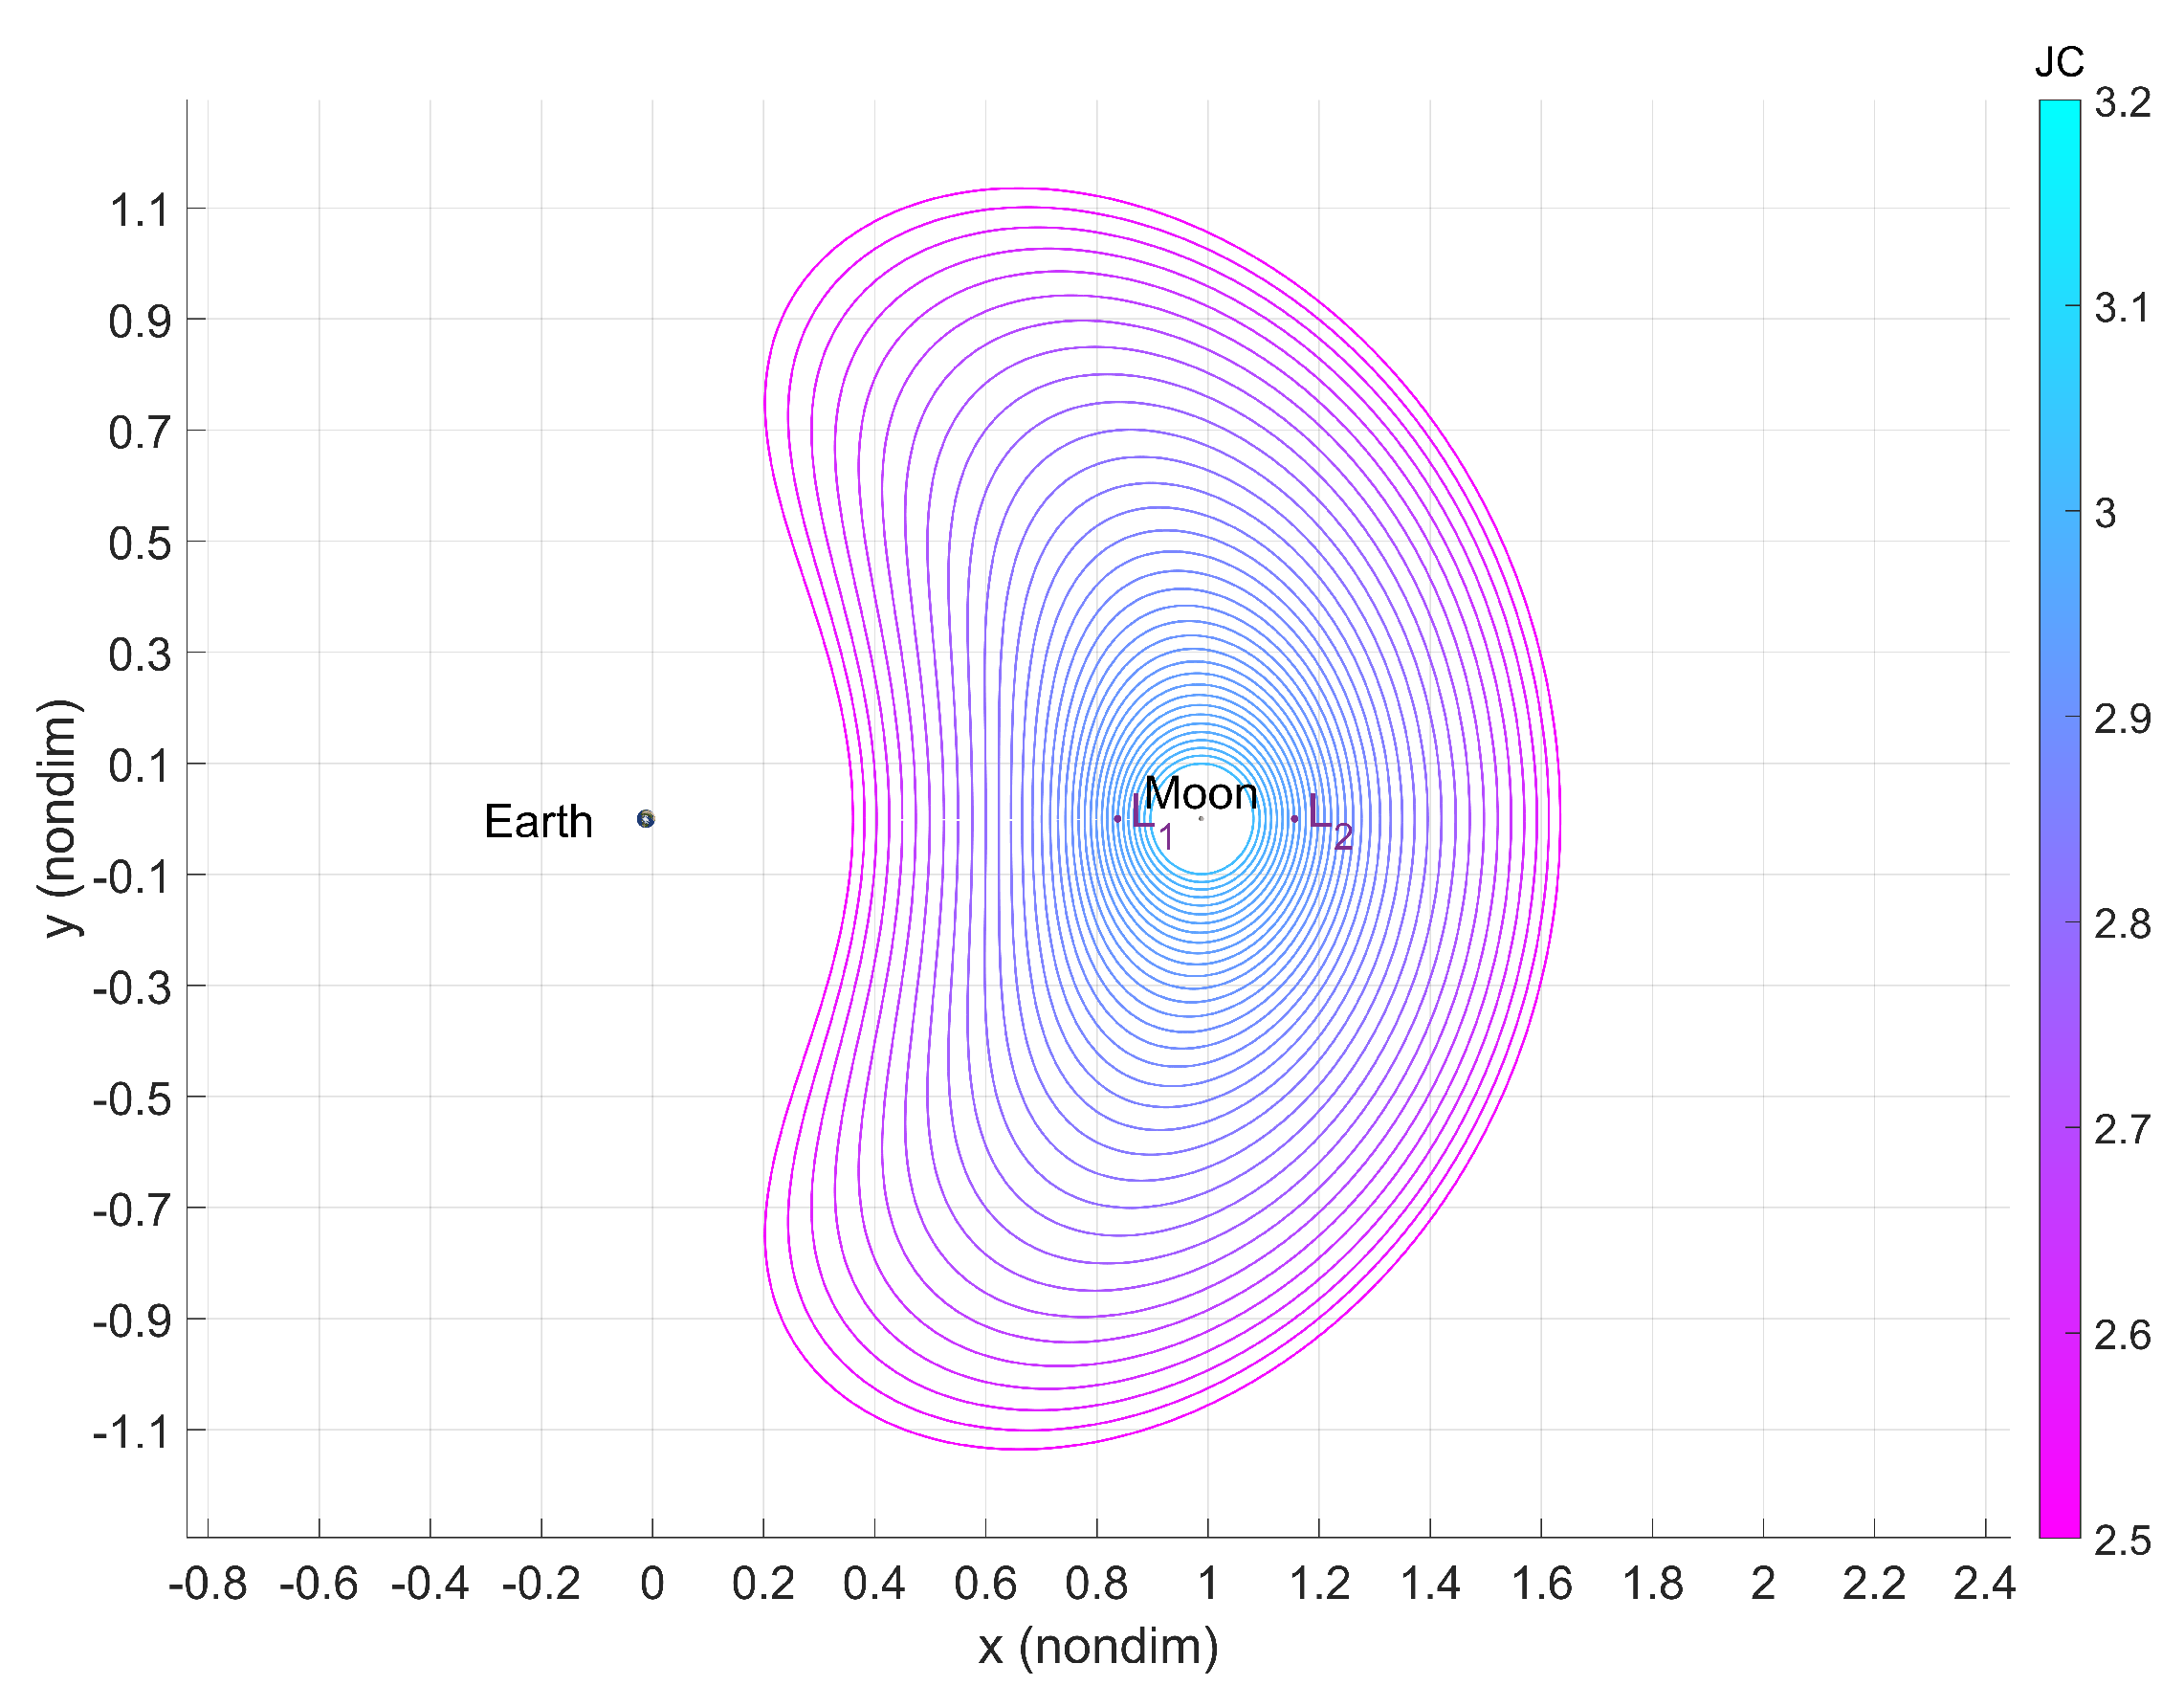
Figure 2). These planar periodic orbits originate near each Lagrange point and, in this study, are within the Moon’s sphere of influence (SoI), covering the Cislunar region and presenting close Lunar passages, which are crucial for analyzing spacecraft explosions in these orbits. The analysis is extended to 3D DROs for a stable spatial orbit (
Figure 3), but not that it may be extended to any other family.
The classical radius of the SoI in the 2BP is calculated using an equation that relates the masses of the two bodies and their distance from each other [
21]. For the Moon, this is defined as:
where
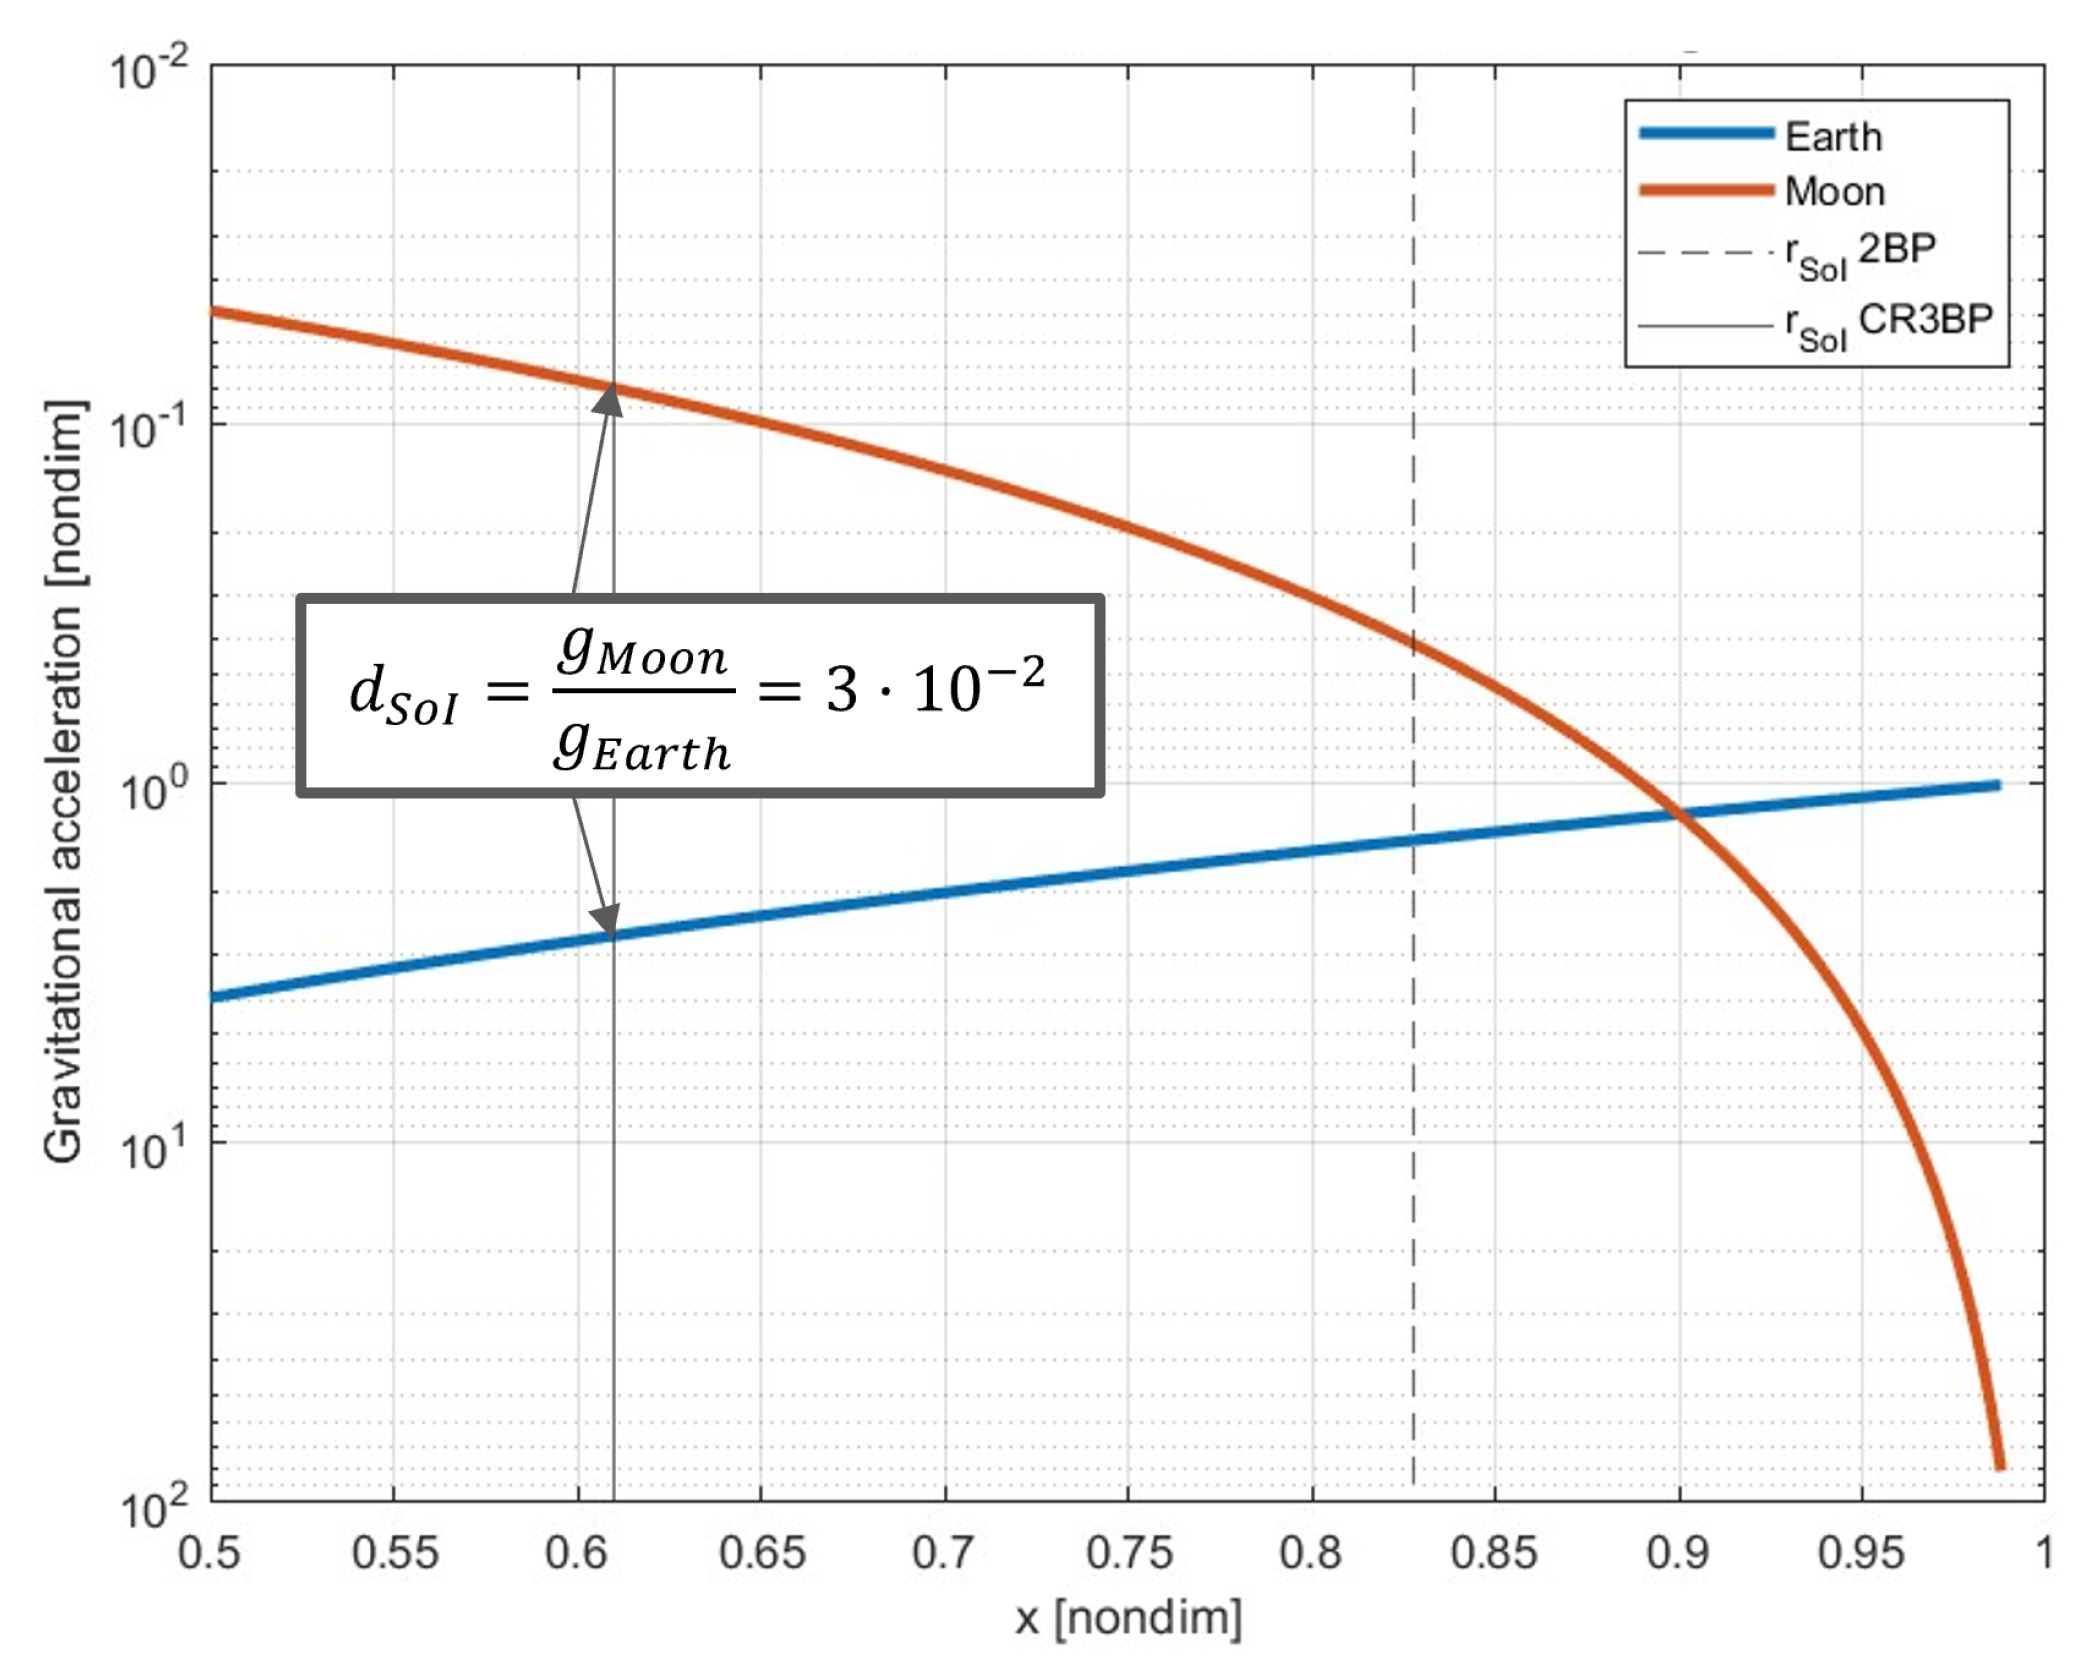
is the distance between the Earth and the Moon. However, in the context of the CR3BP, the radius of the Moon’s SoI is relatively small. This research focuses on periodic orbits near the L
and L
libration points, which fall outside the classical Moon’s SoI. To address this, a new radius is determined based on the gravitational influence of the bodies, defined as
, where
depends on a predefined gravitational ratio [
21]. The Earth’s classical SoI radius is large enough for this study; only the Moon’s SoI is redesigned, although the process may be applied to other SoIs, allowing for case-by-case customization. Applied to the Earth-Moon CR3BP, the gravitational influence along the
-axis is shown in
Figure 4. Comparing the new value with the classical, the following is found:
where the new SoI covers the orbits of interest in this research.
2.2. Fragmentation Model – The NASA Standard Break-Up Model
A fragmentation model defines a breakup event through statistical distributions for a given parameter. The main parameters to compute these events are the area-to-mass ratio, size, and velocity of each fragment after an explosion or collision [
24]. There are various fragmentation models to generate fragmentation events based on these parameters. In this research, the NASA Standard Break-Up Model (NASA SBM) is applied. Originally created in the 1970s and continuously improved over the years, with EVOLVE 4.0 being the most recent version [
24], this method classifies fragmentation as either catastrophic or non-catastrophic [
25], with catastrophic break-ups exceeding a specific energy level of 40 J/g. Explosions are thus considered catastrophic events, while some collisions may be non-catastrophic.
2.2.1. Mass Distribution
To proceed with the creation of the explosion, it is required to select a particle characteristic length of study,
that represents the size of the fragments generated. Note that this parameter is different from the characteristic distance,
, defined for the CR3BP system. The amount of particles is roughly based on the particle characteristic length, although the characteristics of each particle, i.e., the mass and ejection velocity, are random along statistical distributions [
24].
The NASA SBM is a statistical model based on empirical data from different fragmentation events and the observation of the resultant debris [
16]. The detection systems considered in this model are generally effective for fragments with a minimum length of 10 cm [
24]. Therefore, parameters are better defined for particles of this size, leading this study to focus on spacecraft explosions with a characteristic fragment length of 11 cm. The following equations define the model for the fragmentation cases to be studied. First, the number of fragments generated for a specific
after an explosion is calculated:
The area-to-mass
distribution is calculated from the initial characteristic length. The variables of the distribution are
and
. Johnson et al. [
24] define the variables included in Eq. (
8) as a function of
:
where the statistical parameters included are defined as a function of
[
24]:
The values of the parameters computed for
cm (
) are
The cross-sectional area
is then computed and the mass conversion of each fragment is obtained:
where
M represents the mass of each fragment.
2.2.2. Change in Velocity Distribution
The ejection velocity of the collision fragments is determined by a specific distribution function. The distribution of the velocity change for each fragment is given by:
In this equation,
represents the distribution function of the velocity change, where
N denotes a normal distribution. The statistical parameters
and
are the mean and standard deviation of the velocity change, respectively:
and
is defined as
where
is the unknown parameter of the equation, which is obtained by solving Eq. (
16) for it. These parameters are defined according to the work of Johnson et al. for explosions [
24].
2.2.3. Mass Correction
The implementation of the NASA Break-Up Model generates a random number of fragments. However, the resultant mass is typically smaller than the initial mass of the spacecraft. A correction is applied by adding a maximum of 20 fragments with larger characteristic lengths in the range of
m to
m. These particles simulate spacecraft components that are not completely destroyed during the explosion [
16], such as pressure tanks or nozzle bells. The
parameter that depends on the particle characteristic length is obtained by the following distribution:
where
is a random variable uniformly distributed between 0 and 1,
is a constant equal to 1.6, and L
and L
are the lower and upper boundaries of the characteristic length of the fragments, respectively, that the defines the values of
and
:
The
obtained when applying the distribution indicated in Eq. (
20) is used to identify the characteristic length of the bigger fragments. By calculating the new
in Eqs. (
7), (
8), and (
16), the velocity and mass of the fragments are determined. This process is iteratively repeated until the total mass of all fragments equals the mass of the entire spacecraft, with a maximum allowance of 20 additional fragments. For example, in the case of
cm, Eq. (
7) gives a solution of 206 fragments. Following this correction, the total number of fragments is between 207 and 226.
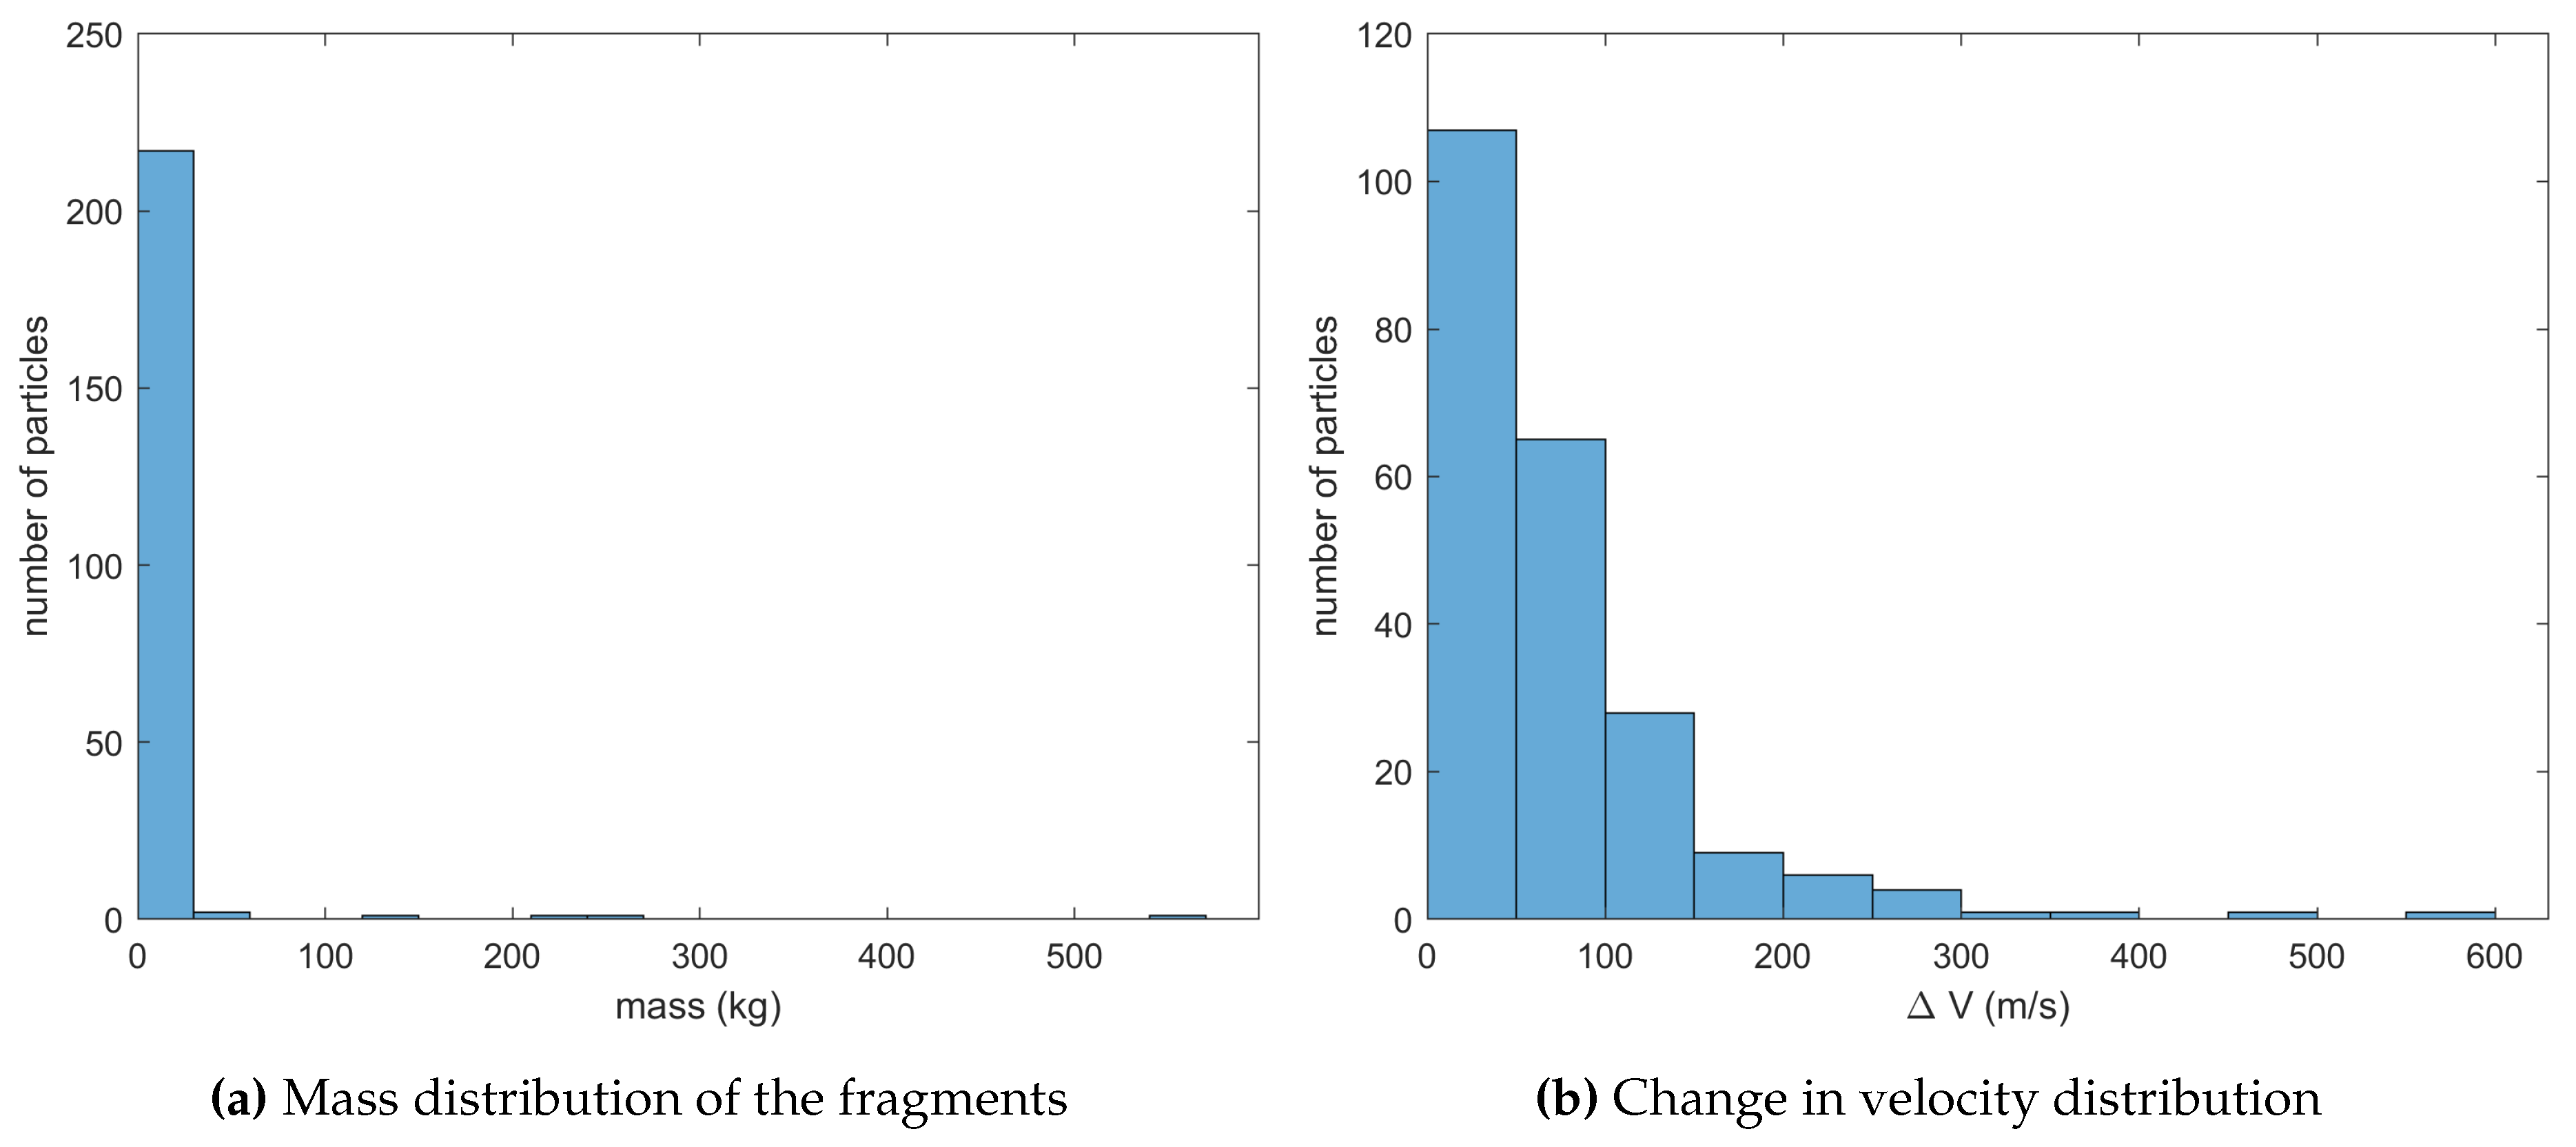
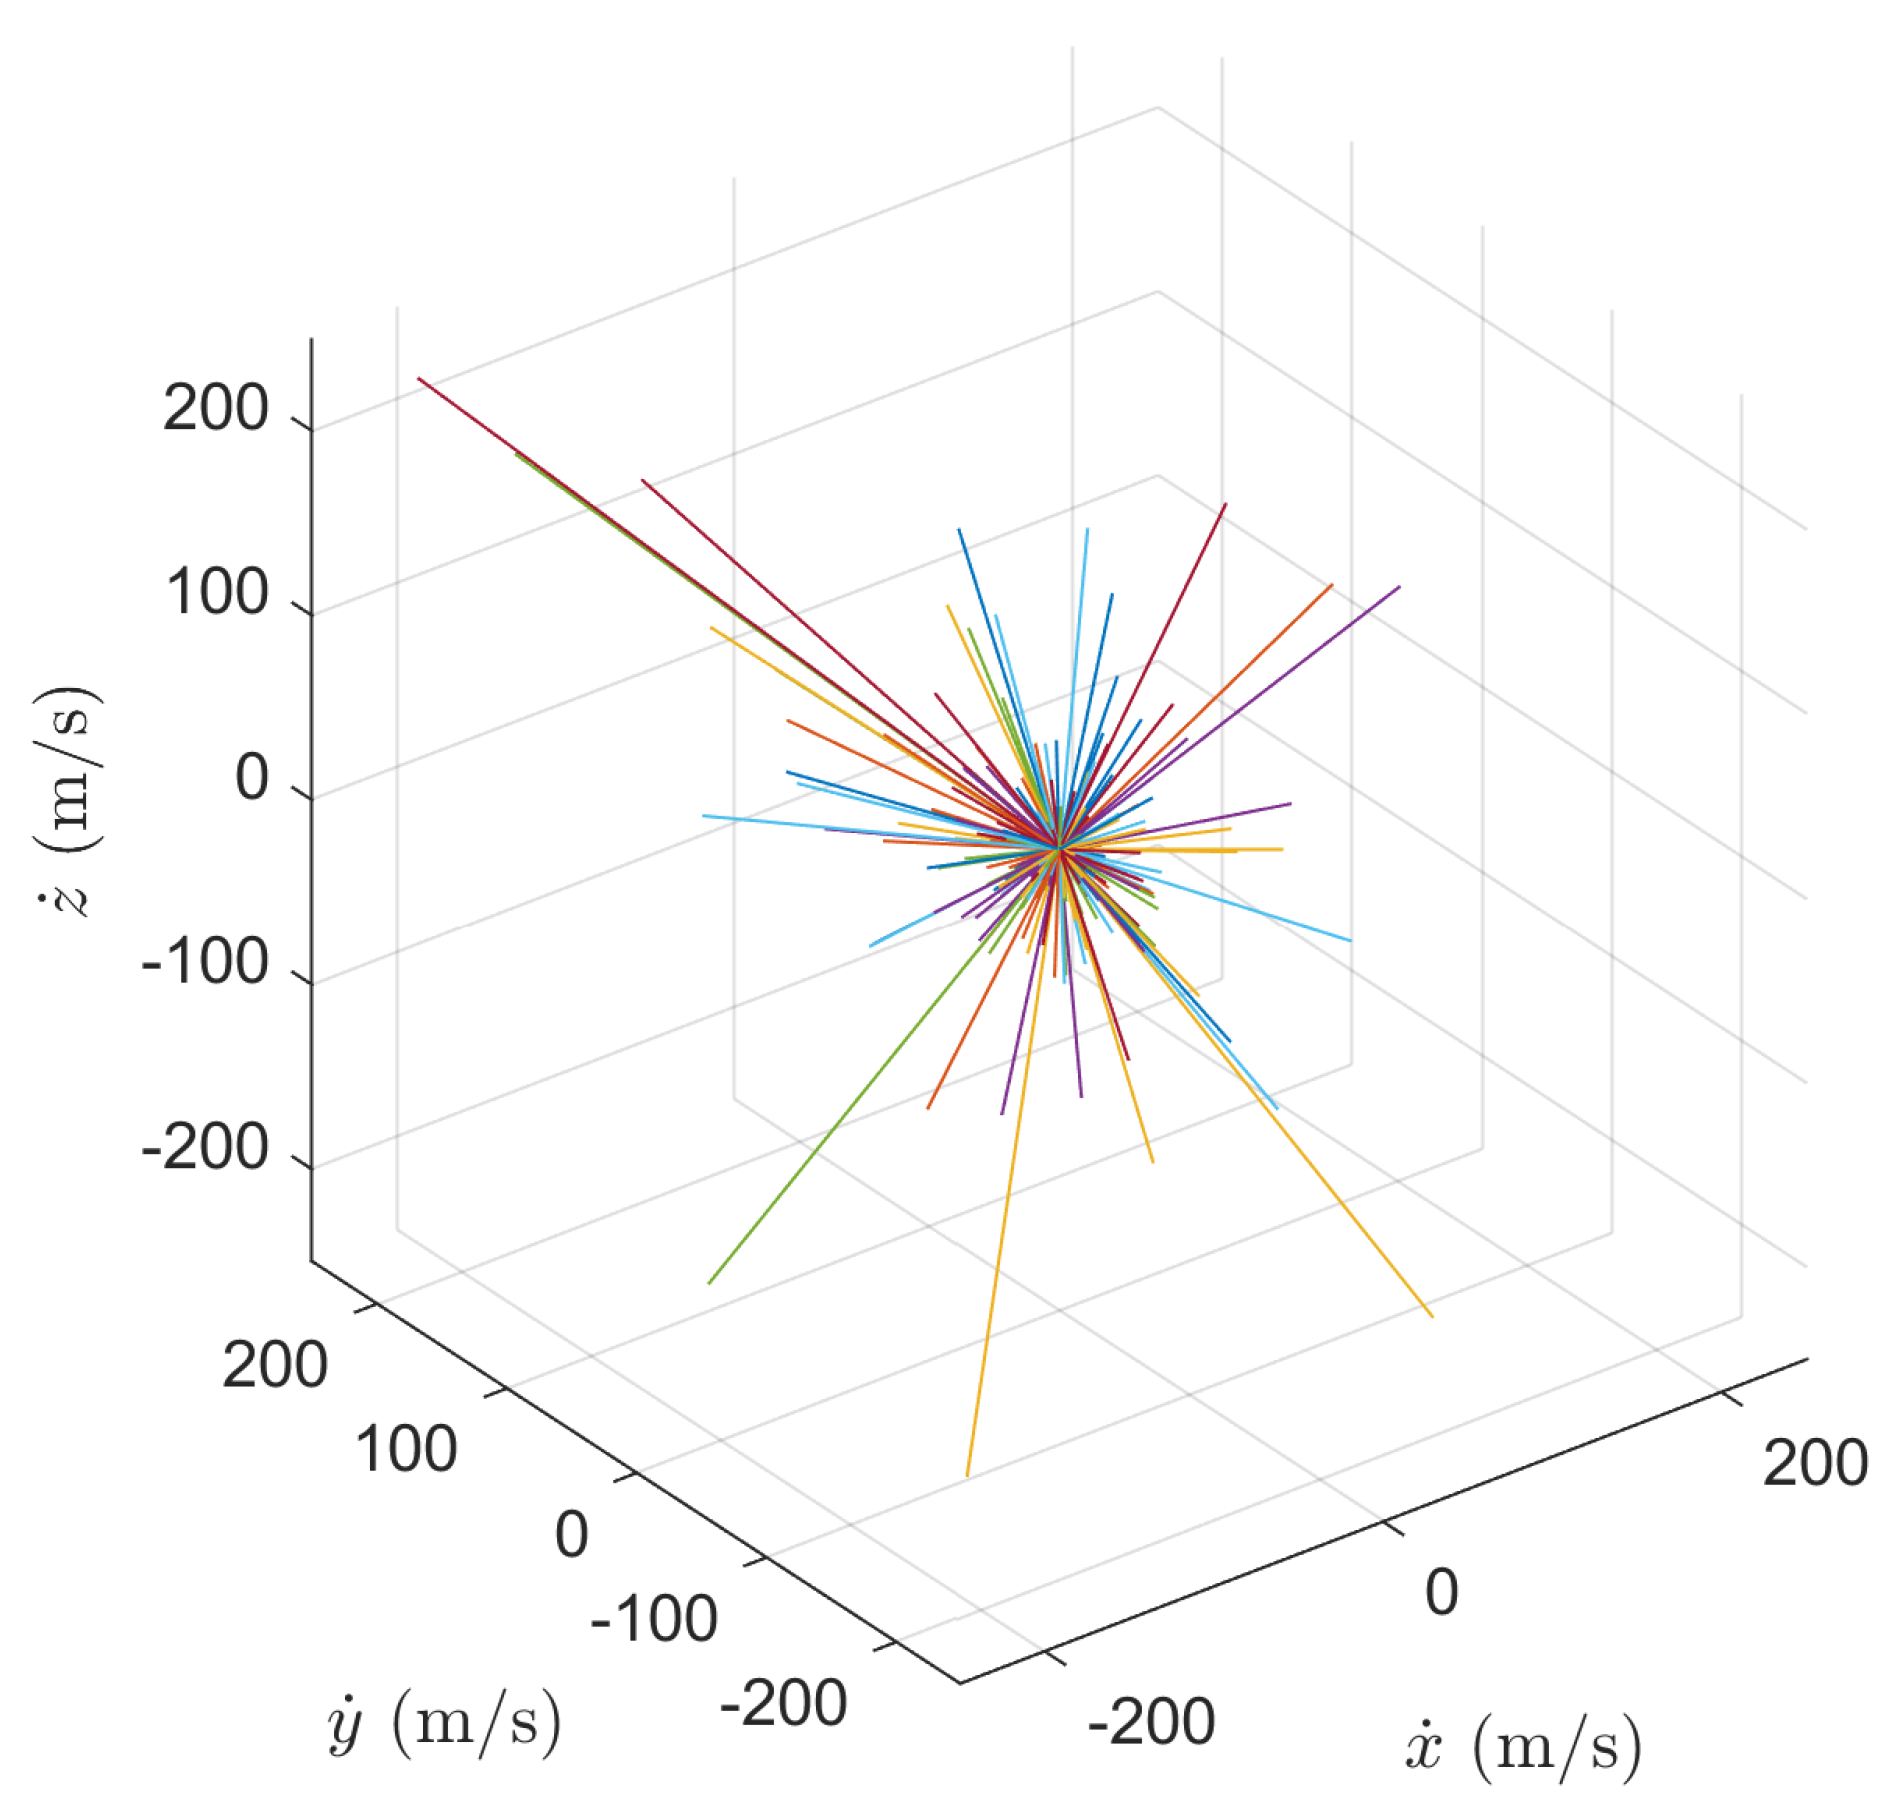
Figure 5 represents the statistical distributions applied for this specific characteristic length. Finally, when analyzing the velocity distribution in terms of direction,
Figure 6 shows spikes that distort the distribution, accurately resembling a real explosion.
2.2.4. Computation process
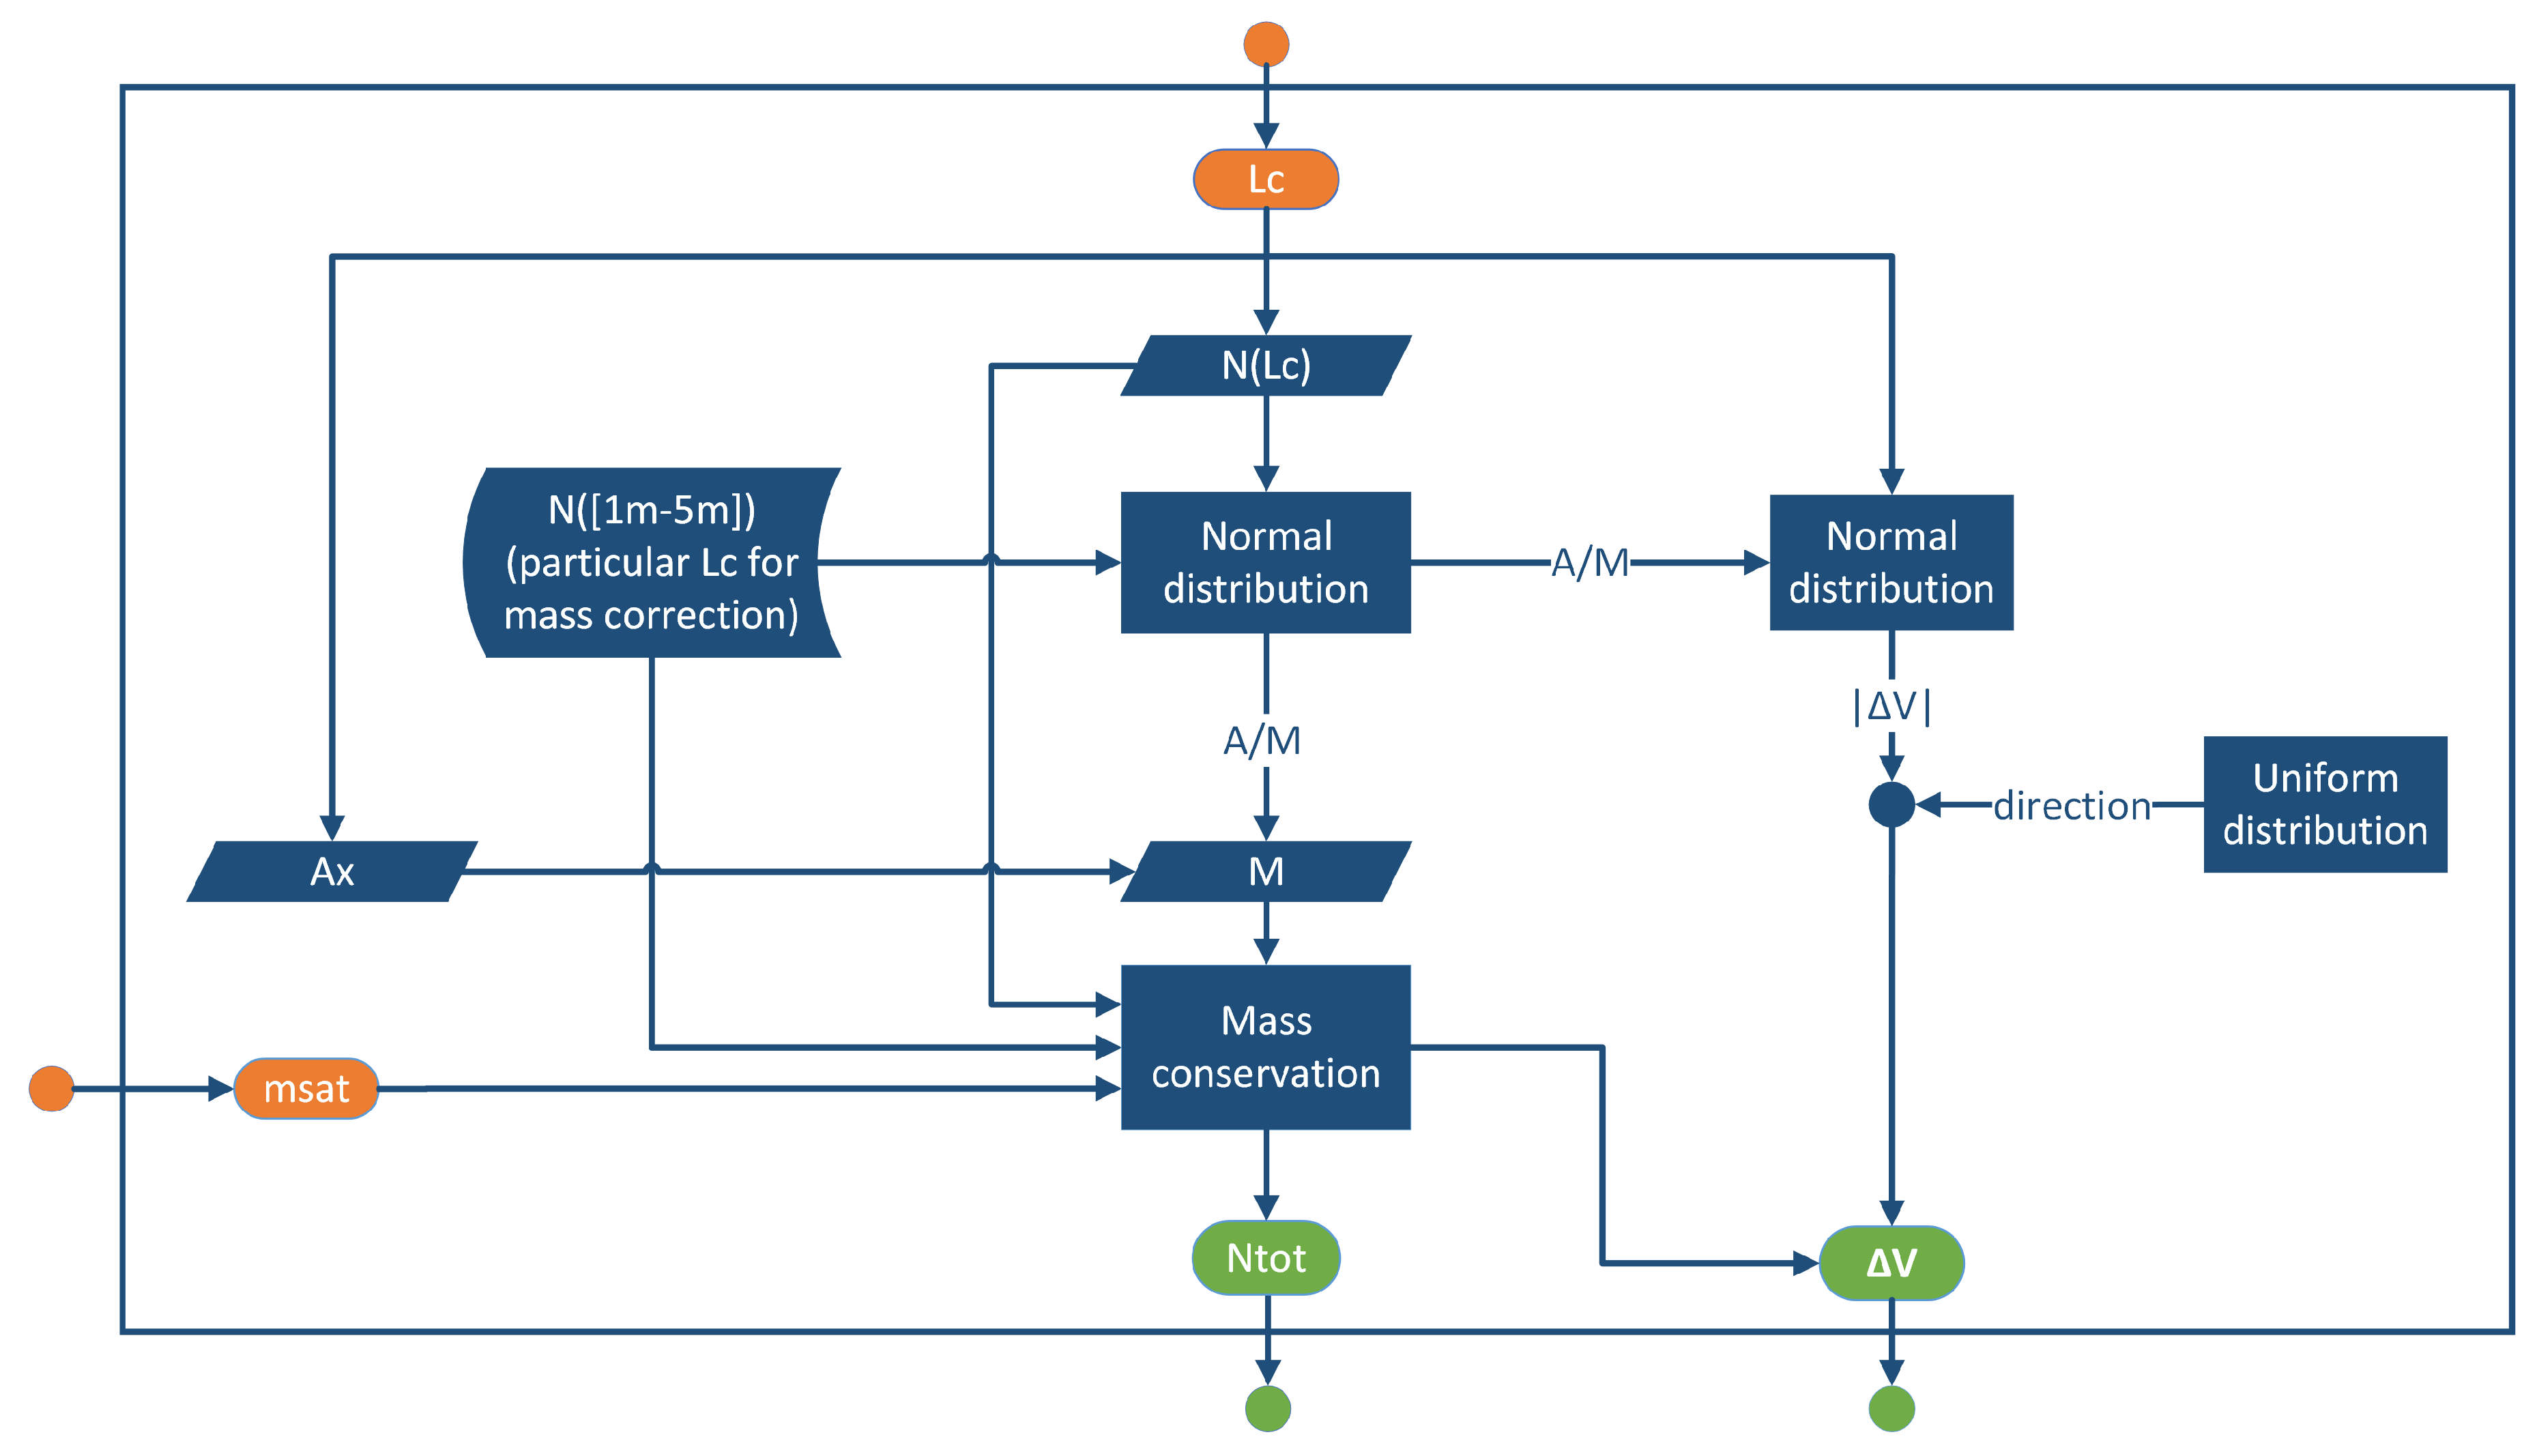
Figure 7 illustrates the computation process for the NASA SBM. Two inputs are required to start the simulation: the particle characteristic length,
, and the total mass of the satellite,
. The characteristic length is used to determine the number of fragments,
), as well as the cross-sectional area,
. The number of fragments is normally distributed to obtain the area-to-mass ratio,
. First,
is related to obtain the mass of each fragment:
M. A random number of larger particles,
N([1m,5m]), is used to ensure mass conservation, obtaining the original
. Subsequently, the total number of fragments,
, is calculated. Lastly, the selected
and
are used in a normal distribution to determine the scalar value of the ejection velocity for each particle,
. The
direction of the velocities is determined using a uniform distribution, resulting in the ejection velocity vectors,
. The outputs of the break-up model are both
and
.
3. Fragmentation Event
The computation of the explosions requires initial conditions. The fragmentation event is configured in a system bounded inside the SoI of the Earth. This section presents the locations where the explosions are generated and the time of evaluation to study the dispersion of the fragments.
3.1. Setting Up Explosion Characteristics and Propagation Modes
The explosion requires some characteristics to be correctly set up, both for pre- and post-fragmentation. The location of the break-up events and the evolution time of the study must be defined in advance.
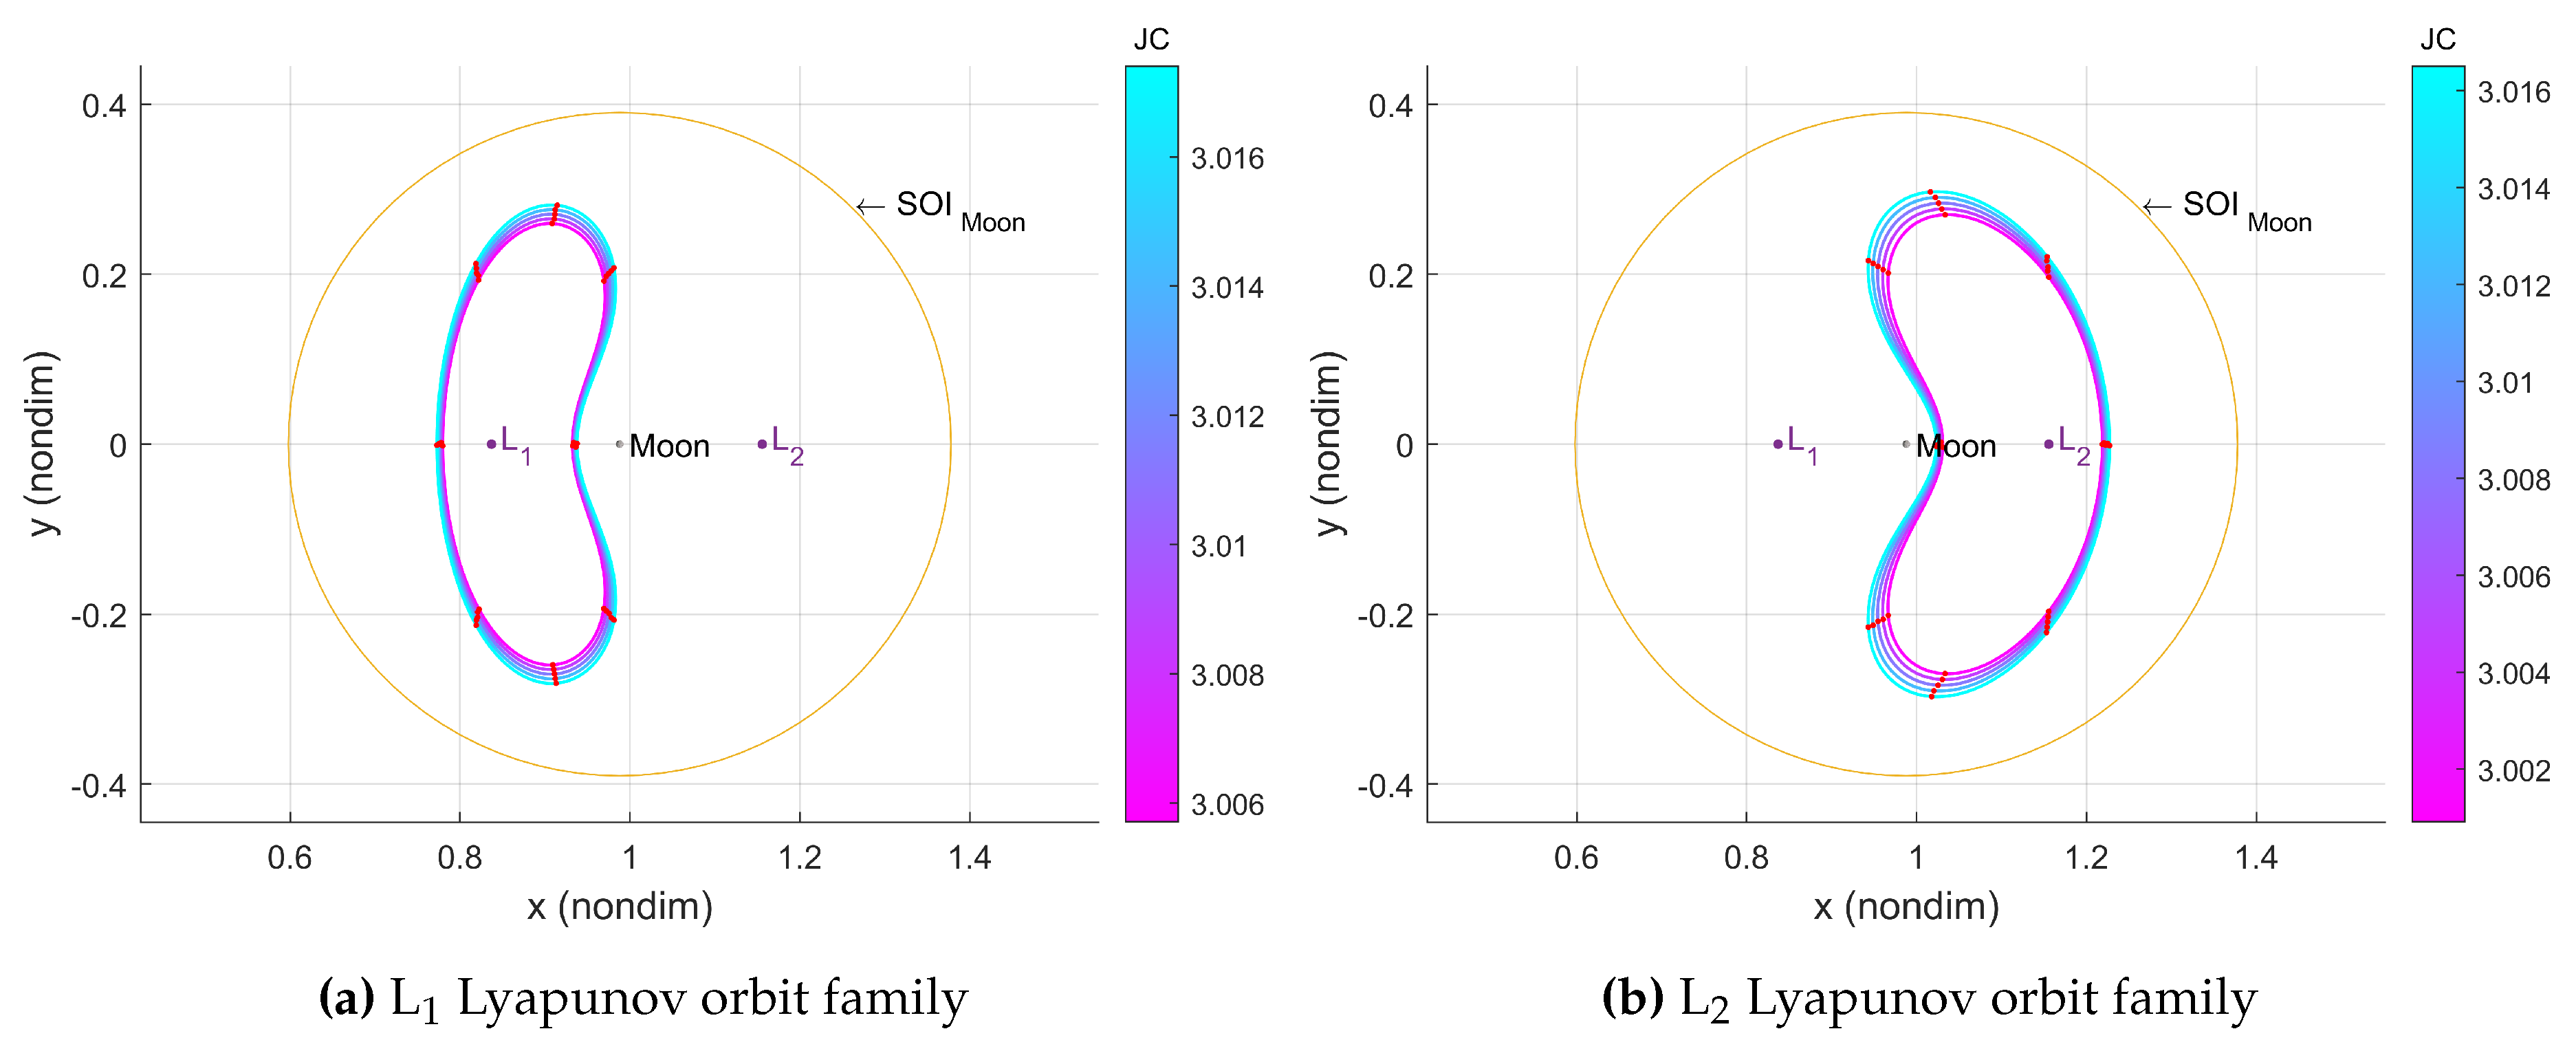
Position of the break-up event: Eight positions are defined as equally spaced in time throughout each orbit. The spacecraft is first located at the periapsis of the orbit, and the remaining locations are calculated by adding
of the orbital period. This division not only segments the orbits into similar sections but also facilitates locating the spacecraft at specific positions, such as perilune or other significant regions.
Figure 8 illustrates the configuration of explosions for the study of L
and L
Lyapunov orbit families contained within the SoI of the Moon.
Time of propagation: Simulations are propagated over a period of 2 years, with results plotted for both a short-term and long-term analysis. The short-term mode includes the first 50 days, encompassing the fragmentation events occurring approximately in the first 20 days of the propagation, and the subsequent debris evolution. The long-term mode extends to 2 years to analyze how debris continues to evolve over an extended period. This is set as the maximum time due to error propagation in the dynamical model for larger timescales.
The results of these simulations are presented below.
3.2. Process to Compute a Fragmentation Event
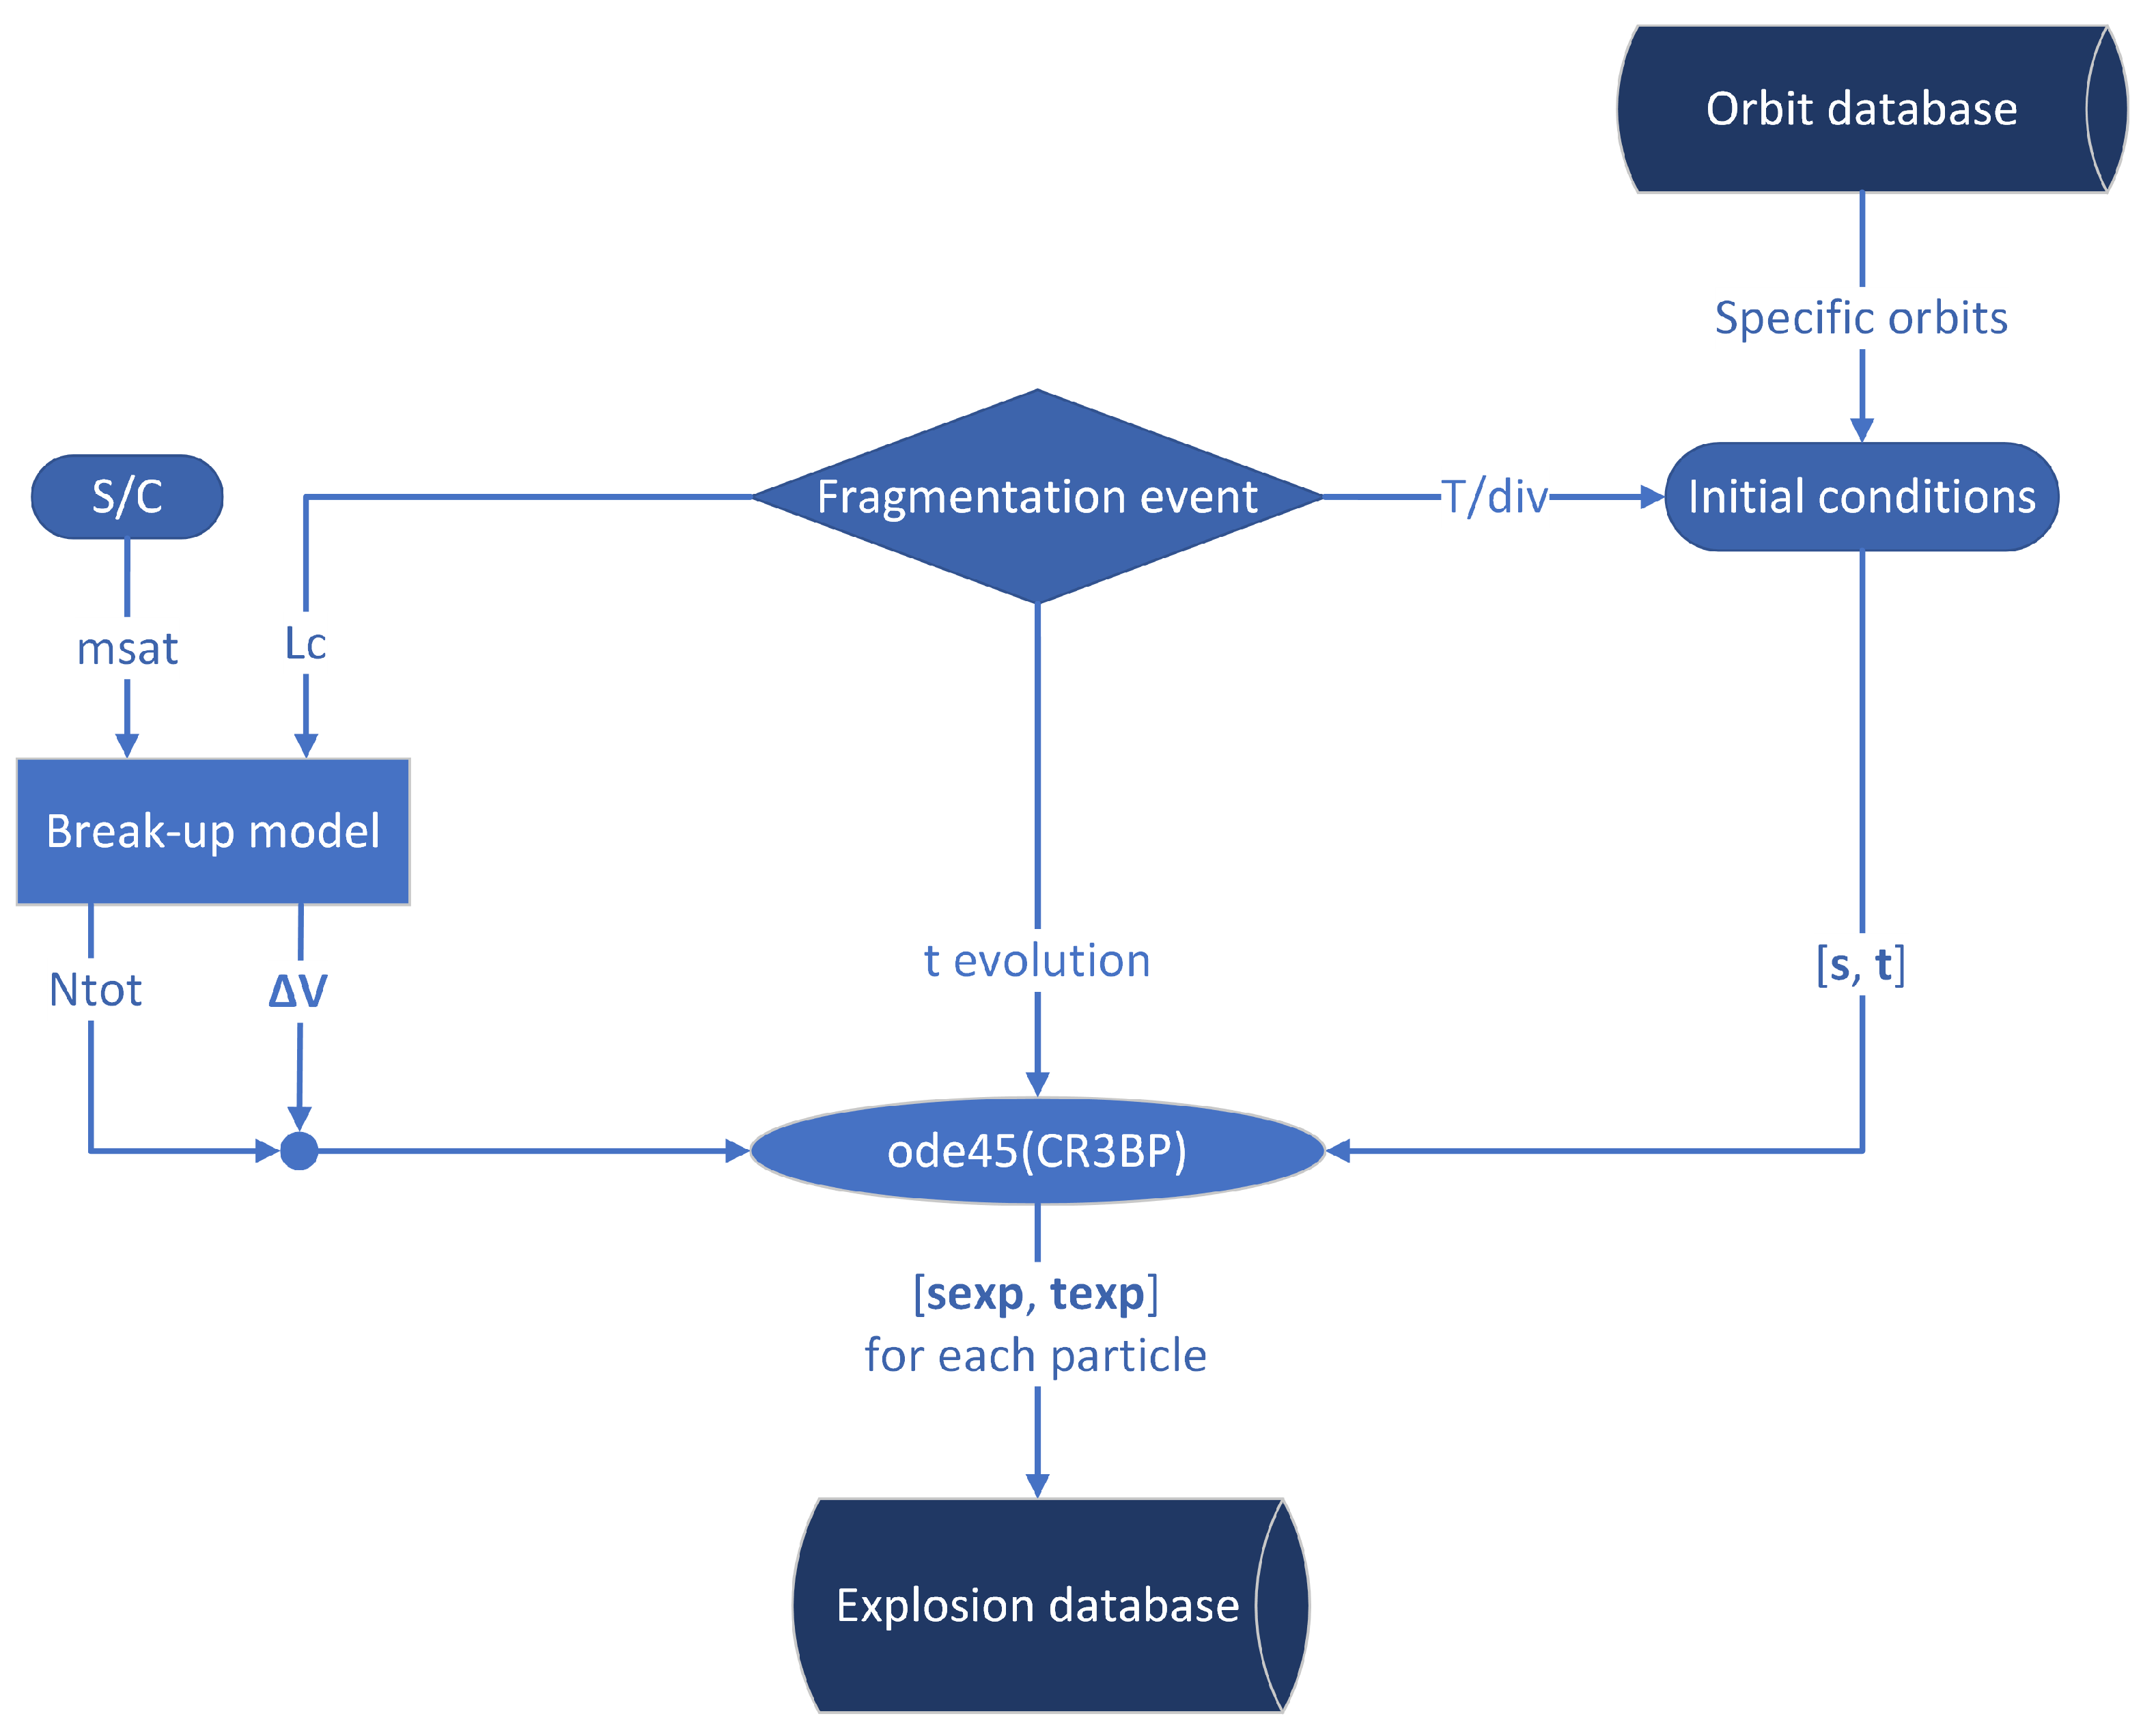
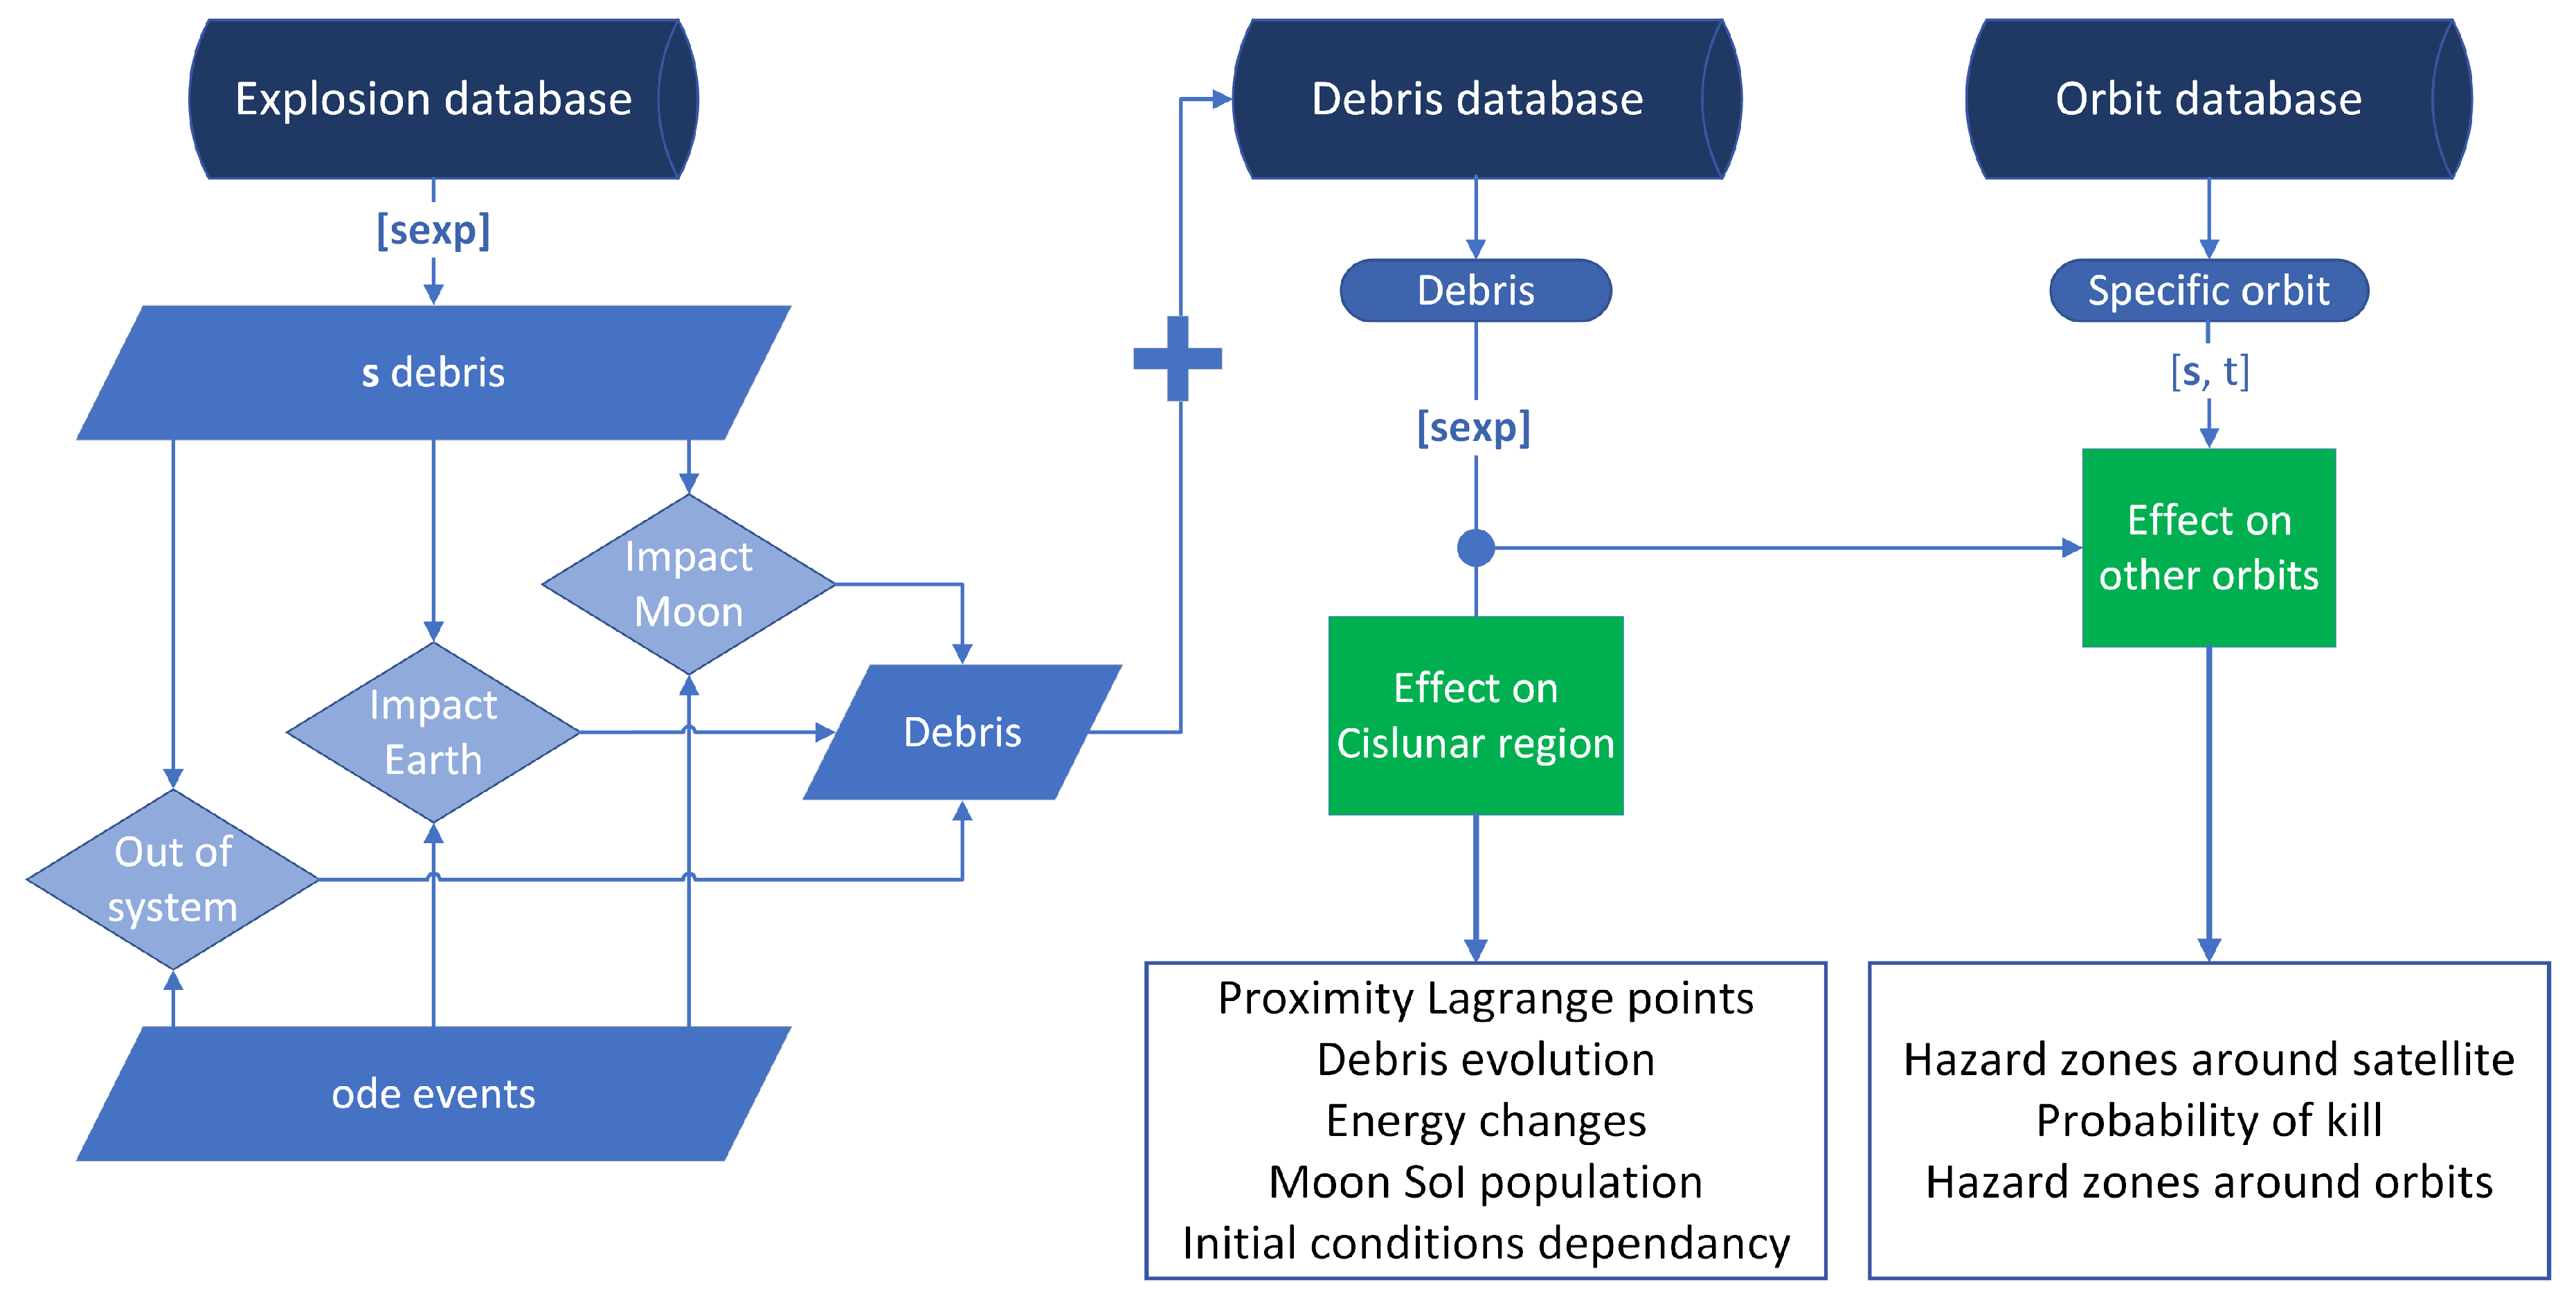
To assess the impact of explosions, a few steps are necessary to compute fragmentation events. Such a process is presented in the flowcharts in
Figure 9 and
Figure 10. The first step to proceed with the study is to generate an explosion. Some initial conditions related to the spacecraft and the orbits are required. Such initial conditions include the mass of the spacecraft
and the state vector necessary to propagate the orbit using the CR3BP (
). The fragmentation event is also configured, defining three variables: the fragments’ characteristic length to compute the
break-up model,
, the time of evolution of the study,
, and the locations of the explosions, determined by equally dividing the period of the specific orbits,
, where
div corresponds to the number of divisions (in this case,
). The initial conditions of the orbits are defined by their state vector and period percentage,
. The outputs of the break-up model,
and
, are used to propagate
during a specific time of evolution
. Each fragment is propagated using
ODE45, obtaining an array of state vectors,
, containing the evolution of each particle for each time step,
. Note that
is a cell-array. The set of state vectors and time steps of each particle,
[, ], builds the explosion database.
A procedure is established to analyze the impact on the Cislunar region (
Figure 10). Using the explosion database and selecting a specific time of evolution, the state vectors defined as
included in
debris are classified based on whether the particles impact the Moon or Earth, escape the Earth-Moon system through Earth’s SoI, or continue orbiting the region. The debris is classified computing
ODEevents, where all necessary parameters, such as the
, mass, and ejection velocity of each fragment, are extracted for upcoming studies. These may be stored in a debris database if needed for future work. The effect on the Cislunar region is then assessed by examining the location of the debris,
, and studying their proximity to the Lagrange points, their evolution with respect to the Moon’s SoI, and identifying patterns in their propagation. More studies are conducted on other orbits, analyzing the hazard zones and the probability of kill for other orbiting satellites. This involves examining both the likelihood of a fragment impacting a satellite and the probability of a satellite being destroyed by such an impact [
11]. Understanding these effects helps to determine the safety of potential missions in the vicinity and may aid in the creation of policies for Cislunar traffic.
4. Simulation – Generation of Databases
In this research, the local databases detailed in
Section 3.2 are created through the development of Graphical User Interfaces (GUIs) in
MATLAB. There are three key databases integral to this process: the orbit database, the explosion database, and the debris database.
4.1. Orbit Database
A pre-computed list of initial conditions (IC) includes some periodic orbit families. A new database is then created, called orbit database, which includes only the trajectories and IC that are relevant to the study. The orbit database starts through the selection of the orbits to be studied (Fig.
Figure 11). The program then generates a folder and saves a new file containing the specific IC that include the state vectors where the fragmentation events will occur in the selected orbits.
-
Steps 1 and 2: The user selects the initial conditions to propagate each orbit in a chosen family. This includes:
First, the family or families of orbits to be studied.
Secondly, a range for the Jacobi constant to identify specific orbits for the study.
Step 3: A list of the specific orbits selected is shown sorted in decreasing . The user then decides which orbits are included in the study.
Step 4: The program generates a folder and saves a .mat file containing the state vectors where the fragmentation events occur.
The orbit database is included in the .mat file called
ICD_Family_numberofexplosions.mat, where
ICD means “initial conditions data”. Note that as the case of study computed in this research is set up for 8 explosions per orbit, depending on the number of orbits selected, a multiple of 8 is the total number of explosions.
Figure 11 shows an example of 7 orbits, i.e., 56 explosions. If more than one family is selected for the study, this is also specified. For example, when selecting L
and L
Lyapunov orbits and DROs,
_L1L2DRO_ is the name specified in the
_Family_ of the .mat file.
4.2. Explosion Database
To create the explosion database (
Figure 12), the user selects the desired orbit database file and specifies the propagation time. Since explosion computations take from 20 minutes to several hours, a progress bar is provided to estimate the completion time. Once the explosion data is generated and stored in separate files, it is recompiled based on user preferences, allowing for various analyses. For instance, explosions from different orbital families may be studied simultaneously, or specific parameters such as explosions at perilune. After compiling the explosion data, plots are generated, and results are obtained.
Step 1: The user selects the specific initial conditions obtained from the orbit database.
Step 2: The user specifies the propagation time. Suggested values are 50 days and 2 years for short- and long-term studies, but any time of interest in months may be entered.
-
Step 3: Explosions are calculated for each initial condition:
Step 4: A separate file is created for each initial condition, storing the data of the initial conditions and fragments.
4.3. Debris Database
The debris database is used to classify and analyze the generated debris, focusing on their location, evolution, and proximity to key points like the Lagrange points and or collisions (
Figure 13). This comprehensive database structure facilitates detailed analysis and enhances the understanding of debris behavior in the Cislunar region.
Step 1: The user selects one or more explosion databases.
Step 2: From the chosen explosion databases, the user may select all or specific explosions.
Step 3: The selected data is compiled for result analysis.
Step 4: Basic plots for understanding the system are generated and saved in a folder specified by the user. If the same folder is used in subsequent studies, comparison analyses will also be available.
5. Results
With an efficient method for creating databases and exploring the problem of Cislunar debris established, an example is now provided for explosions occurring in the L and L Lyapunov orbit families, as well as 3D DRO orbits. The resulting debris databases are studied separately to analyze individual results and then compared to identify characteristics of debris behavior.
5.1. L Lyapunov Orbits
In this case, 40 explosions are computed for 5 orbits within the L
Lyapunov family. The selected orbits are represented in
Figure 8, corresponding to orbits with Jacobi constants near 3. This criterion is based on the size of the orbits and their close Lunar passages.
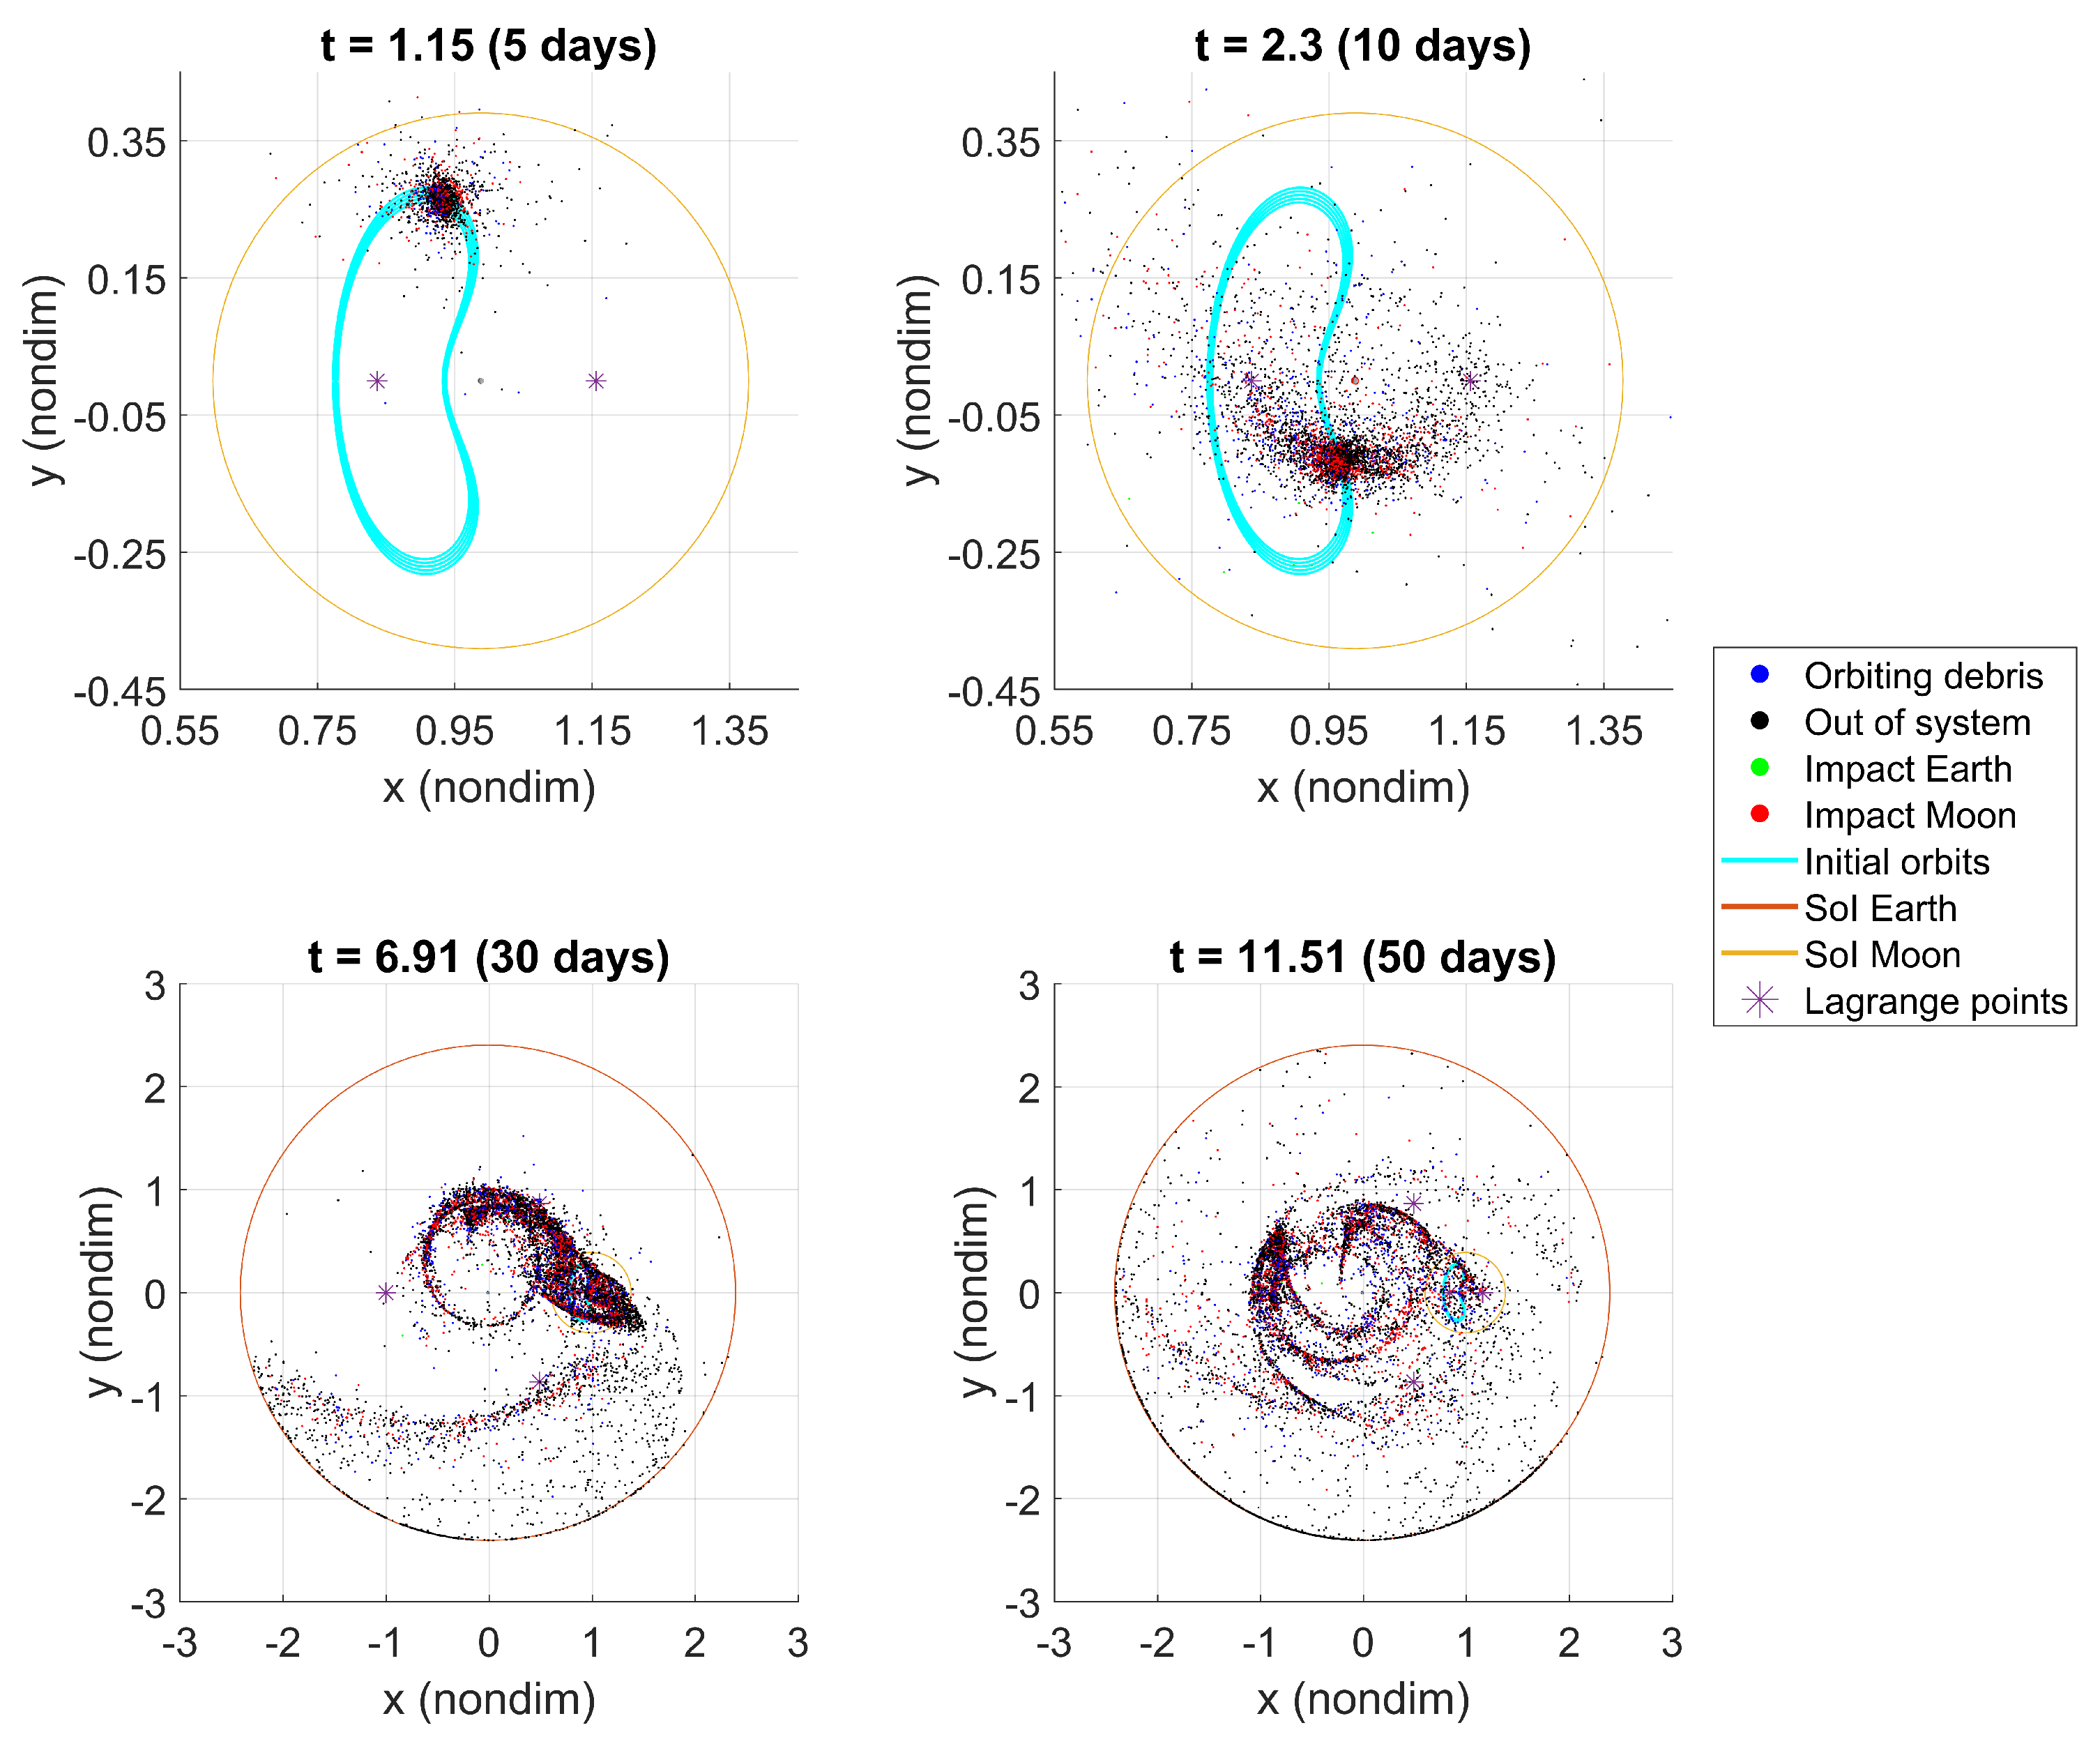
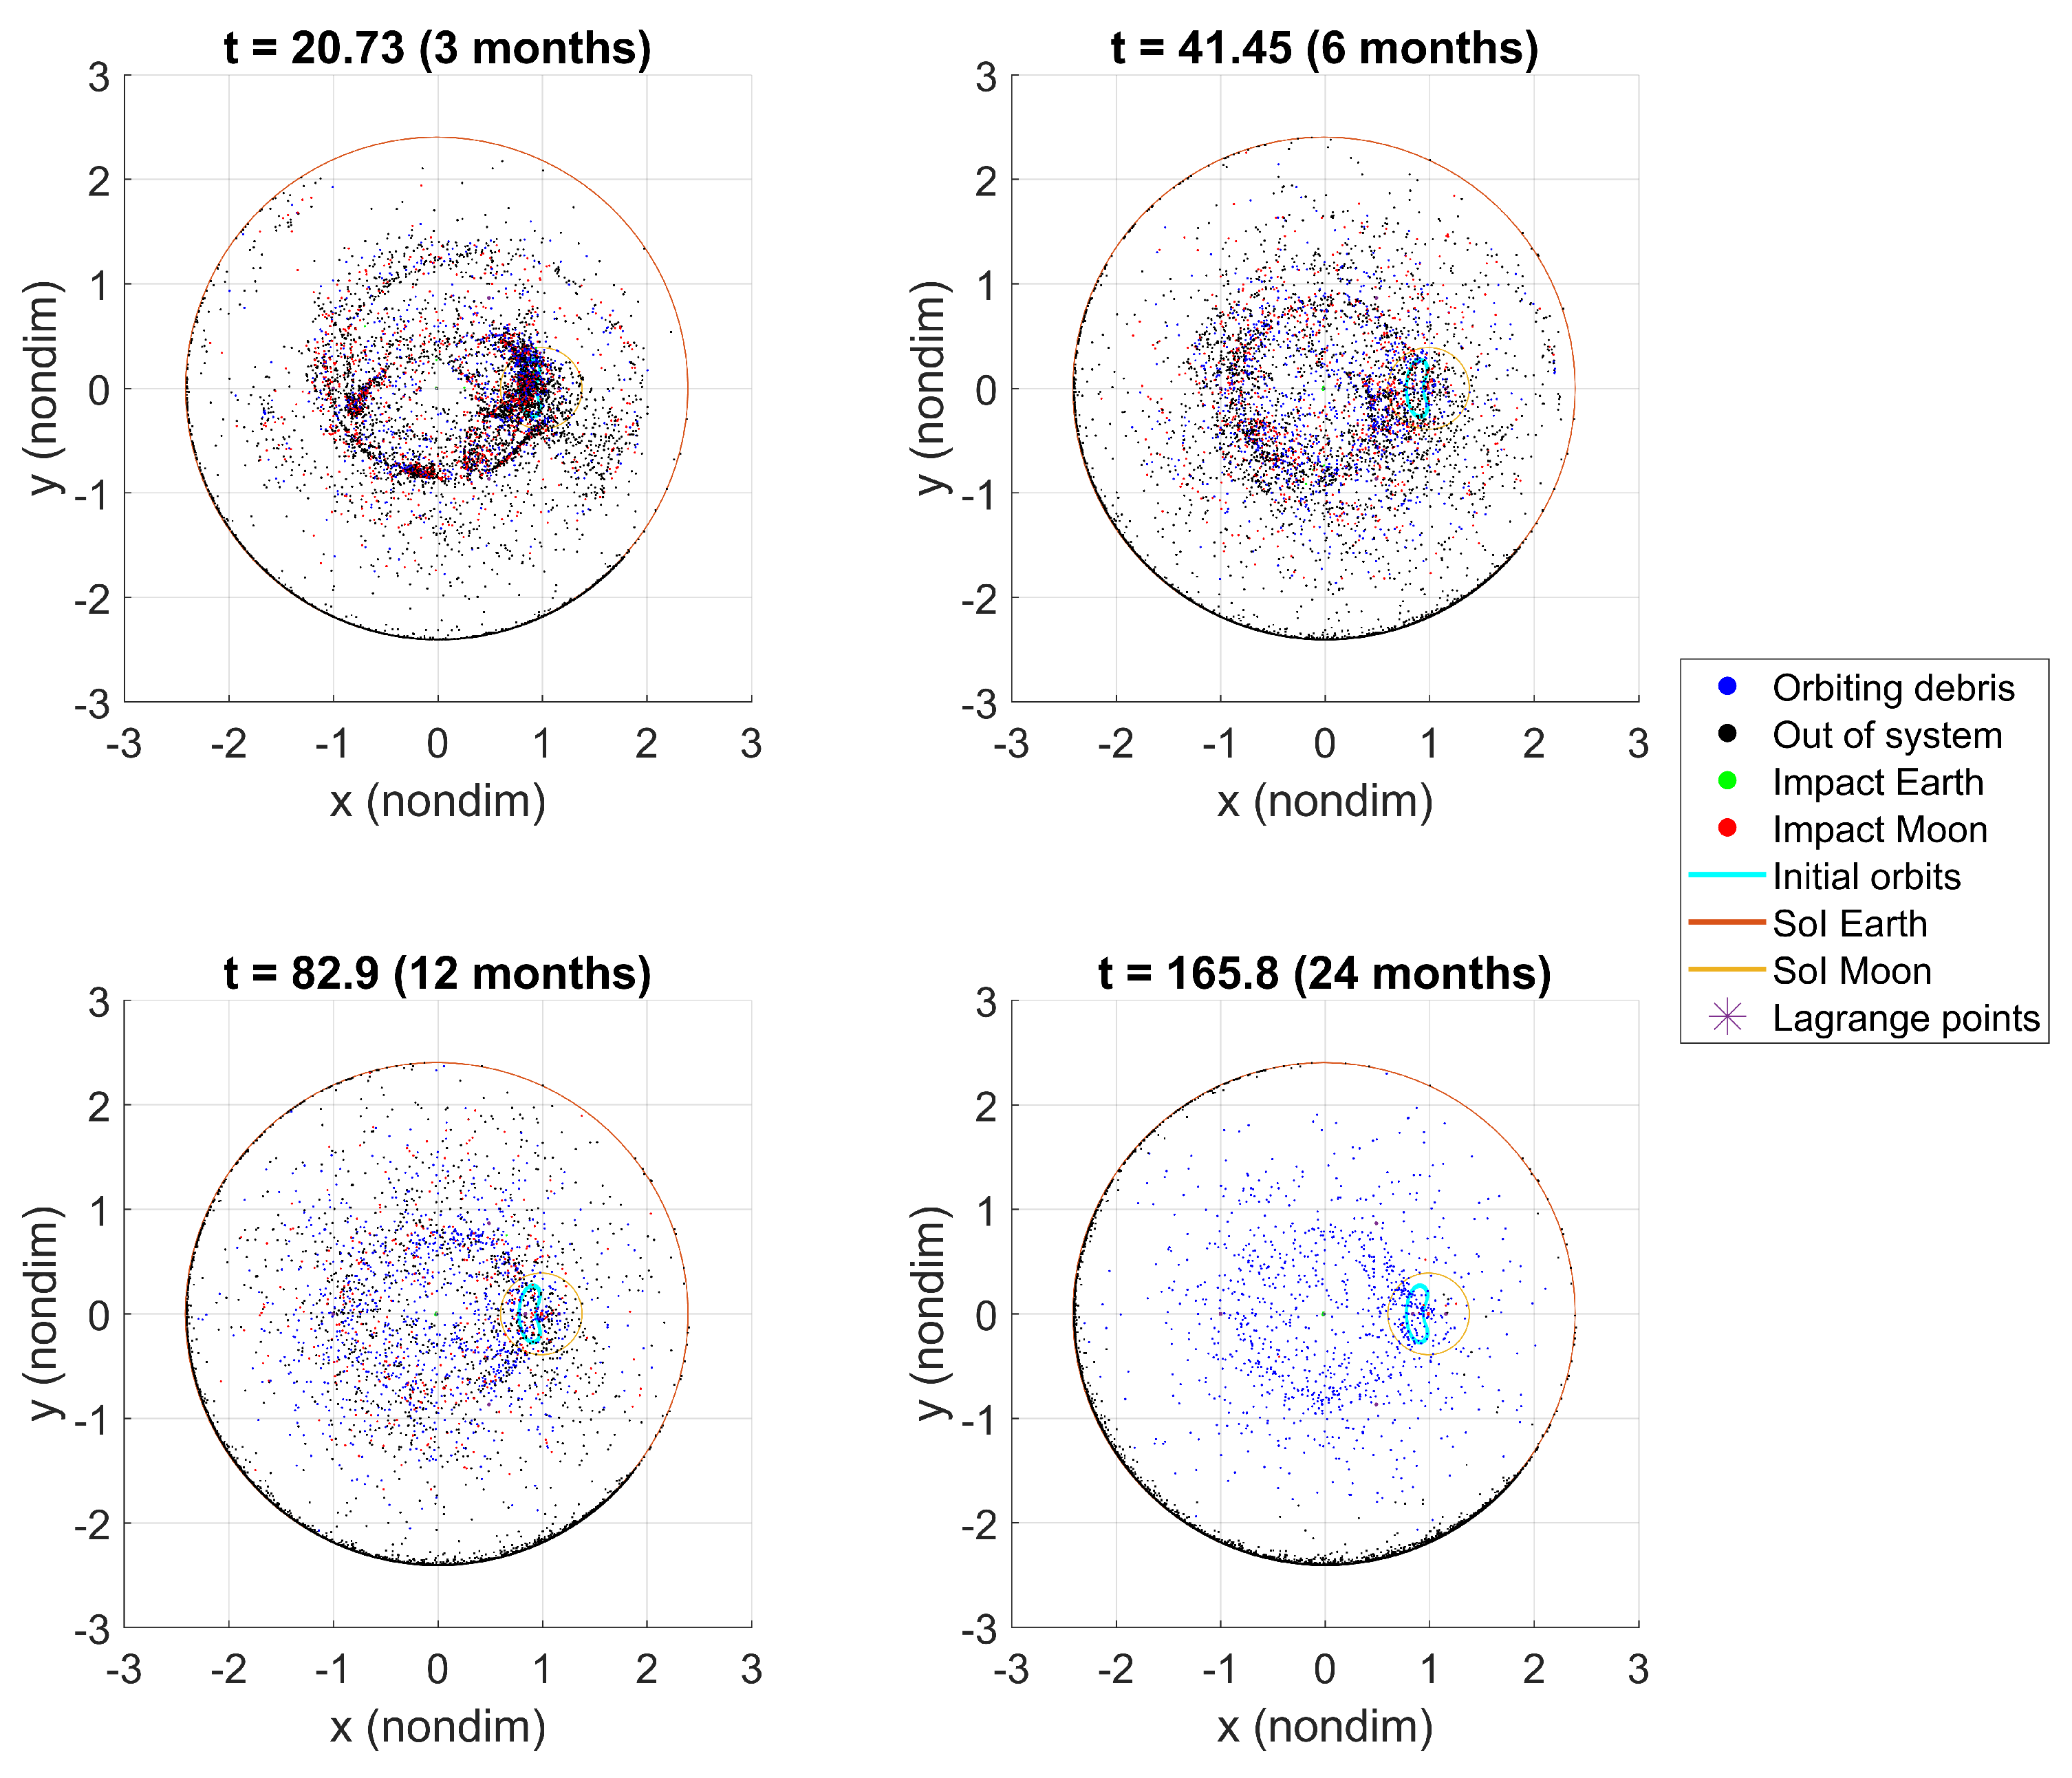
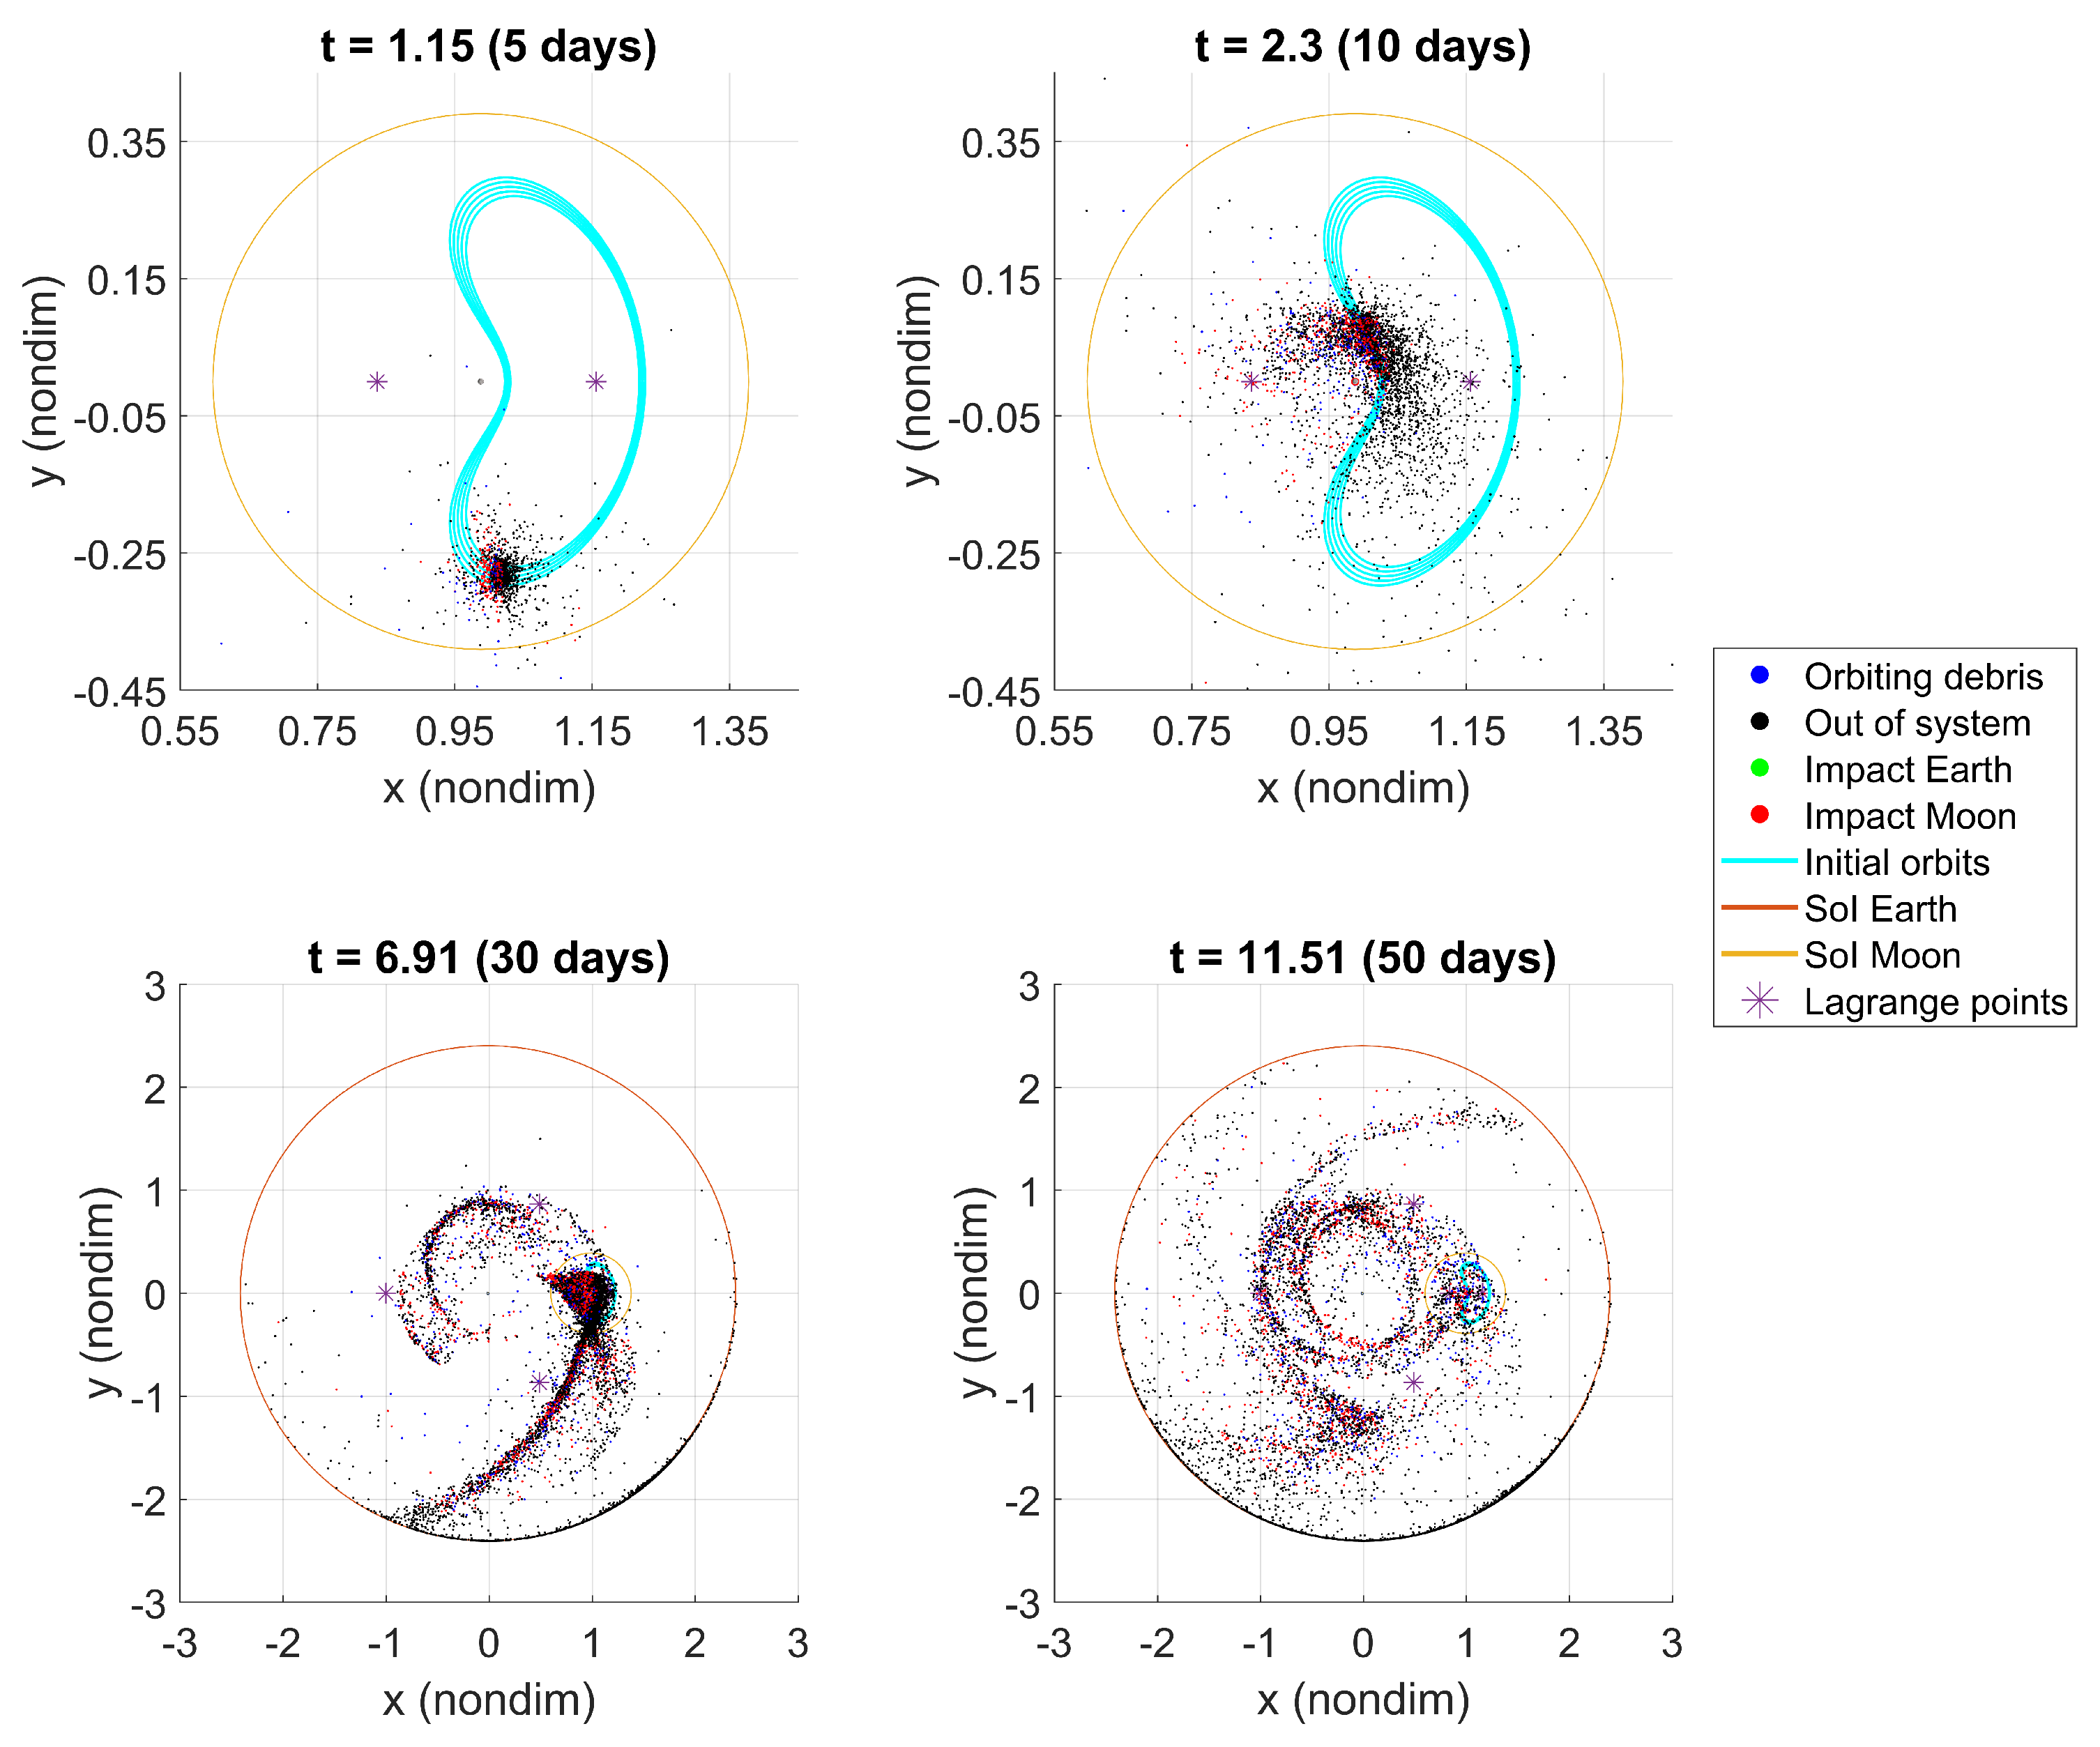
Figure 14 and
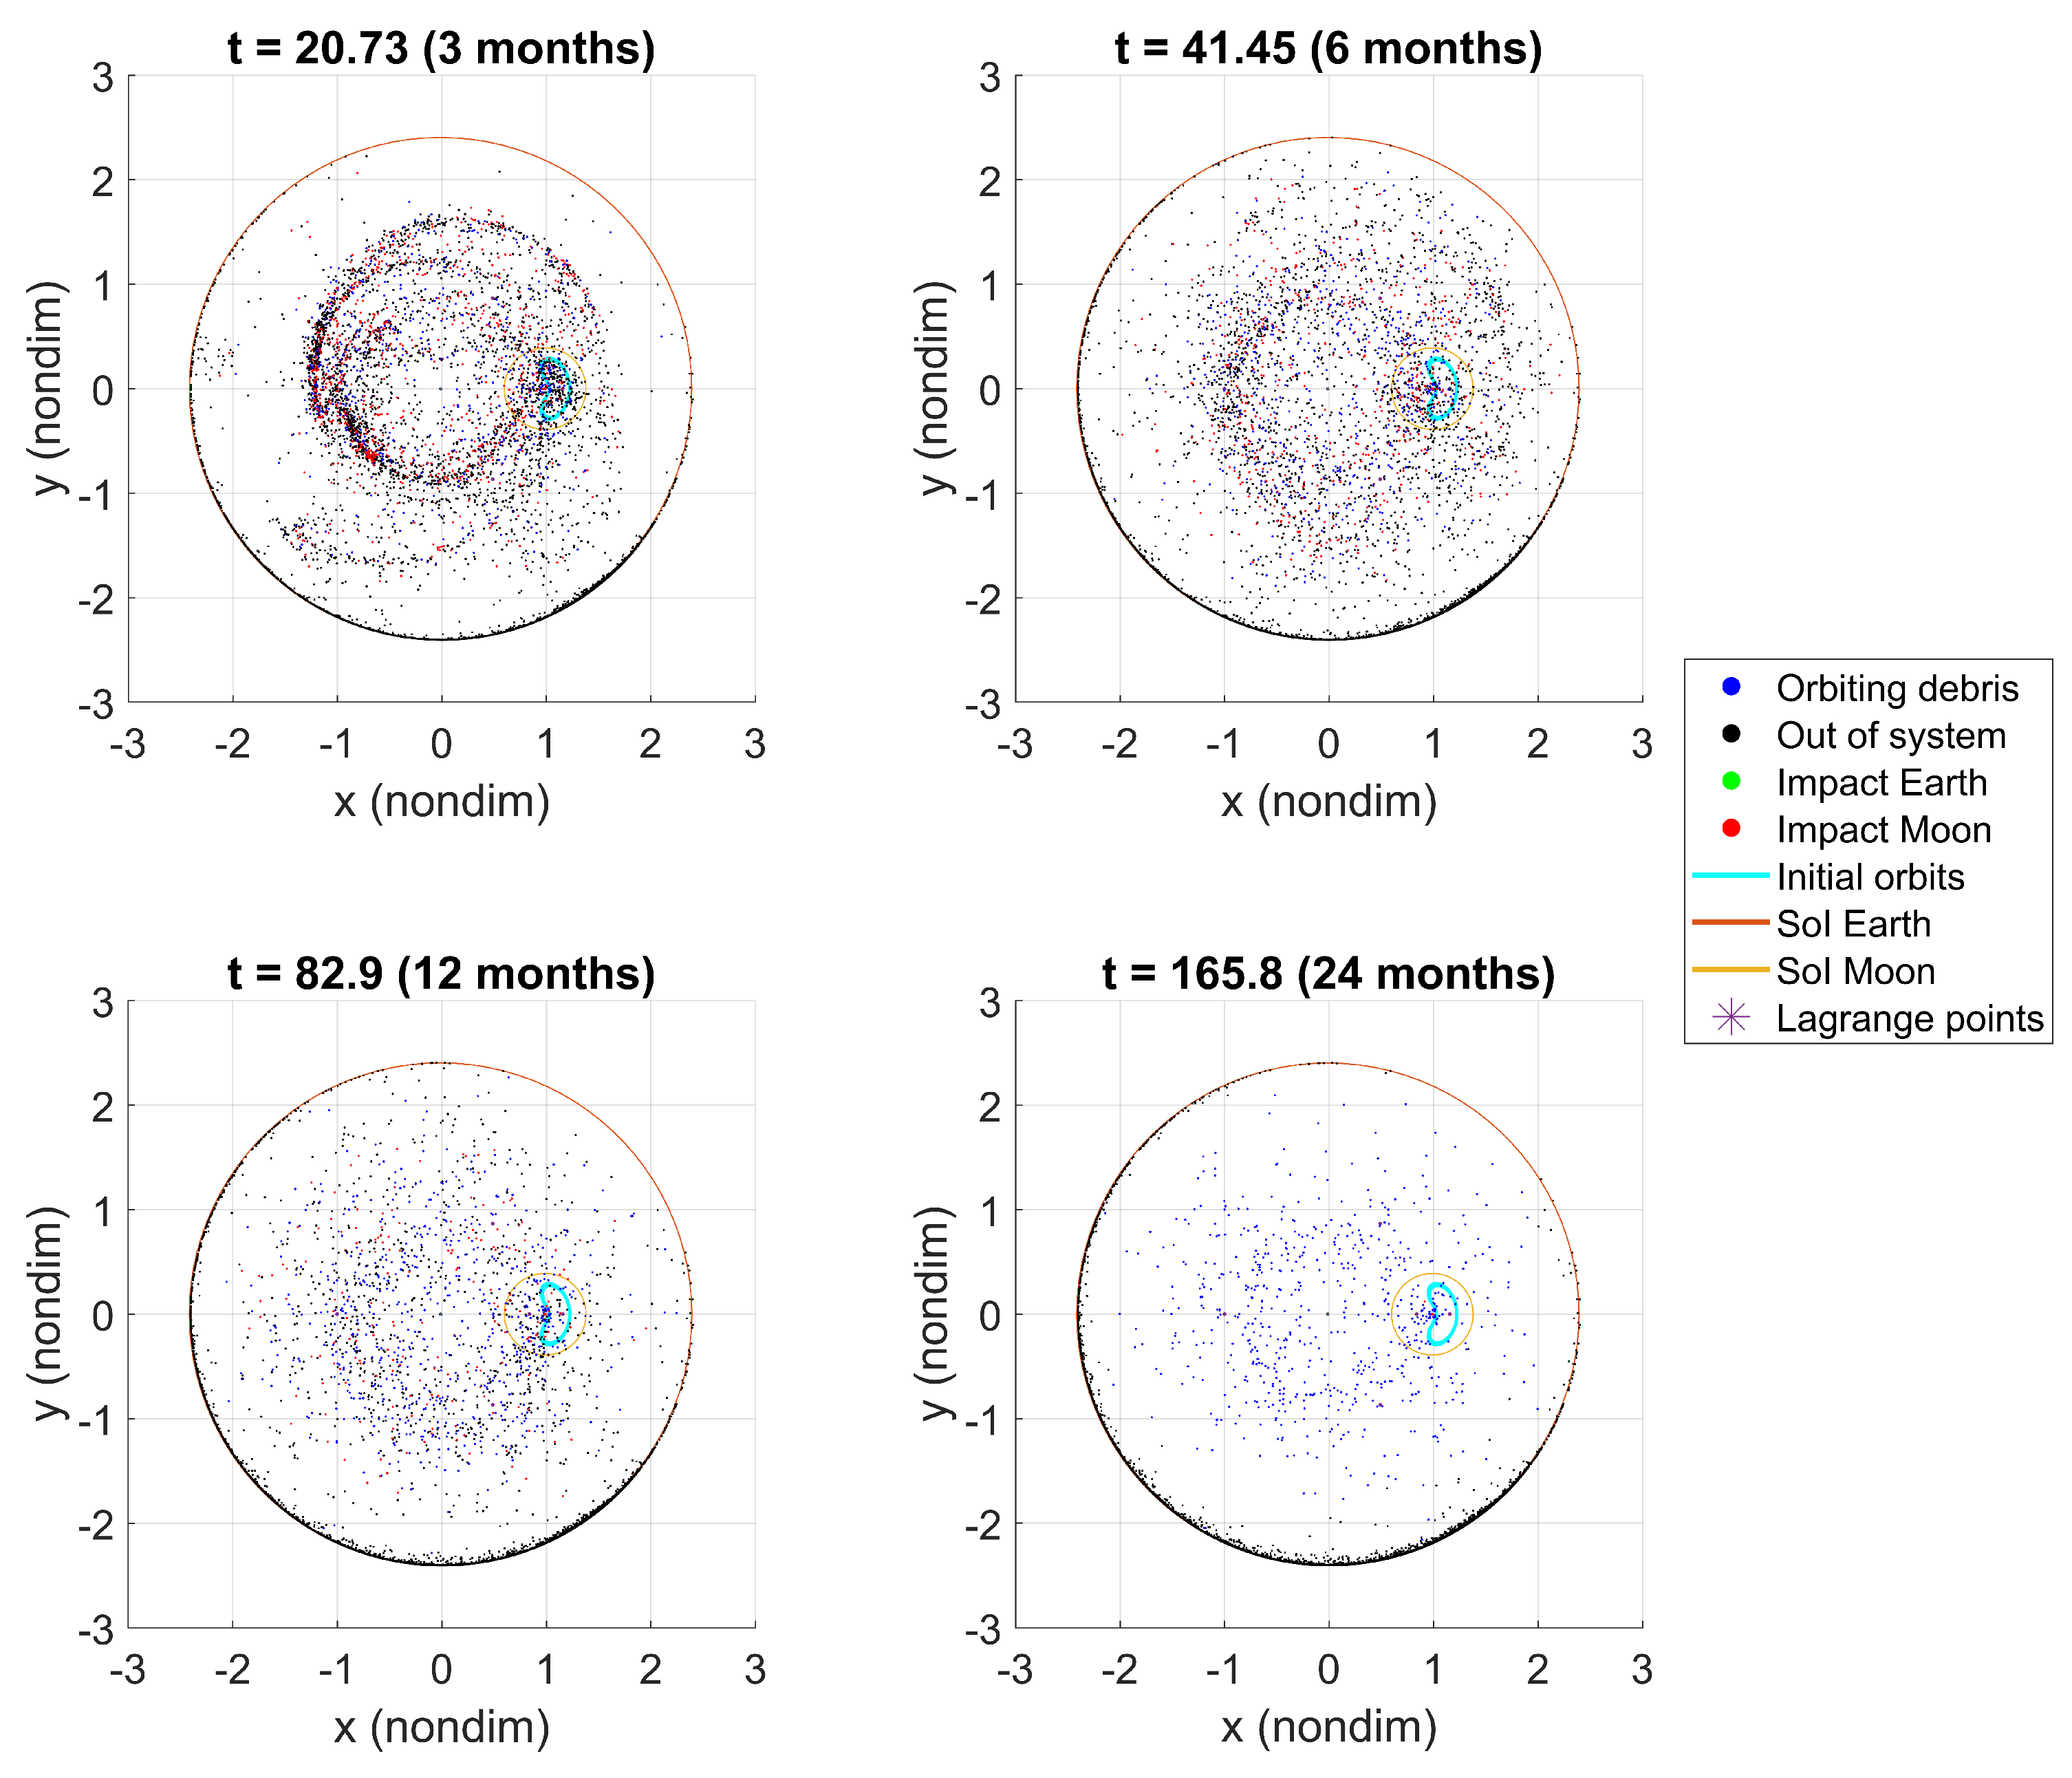
Figure 15 represent the short- and long-term debris propagation, respectively. The debris are color-coded based on the type: green points represent debris that impact the Earth; red dots those that impact the Moon; black dots signify debris that escape the system (defined by the Earth’s SoI at
km); and blue dots represent fragments that continue orbiting within the Cislunar region. Although explosions occur in Lunar orbits, the great increase in velocity applied to each fragment results in two dominant behaviors: most particles either escape Earth’s SoI or enter orbits around the Earth. This is evident after 30 days of evolution in
Figure 14. Debris cloud density in the Cislunar region decreases drastically over time (
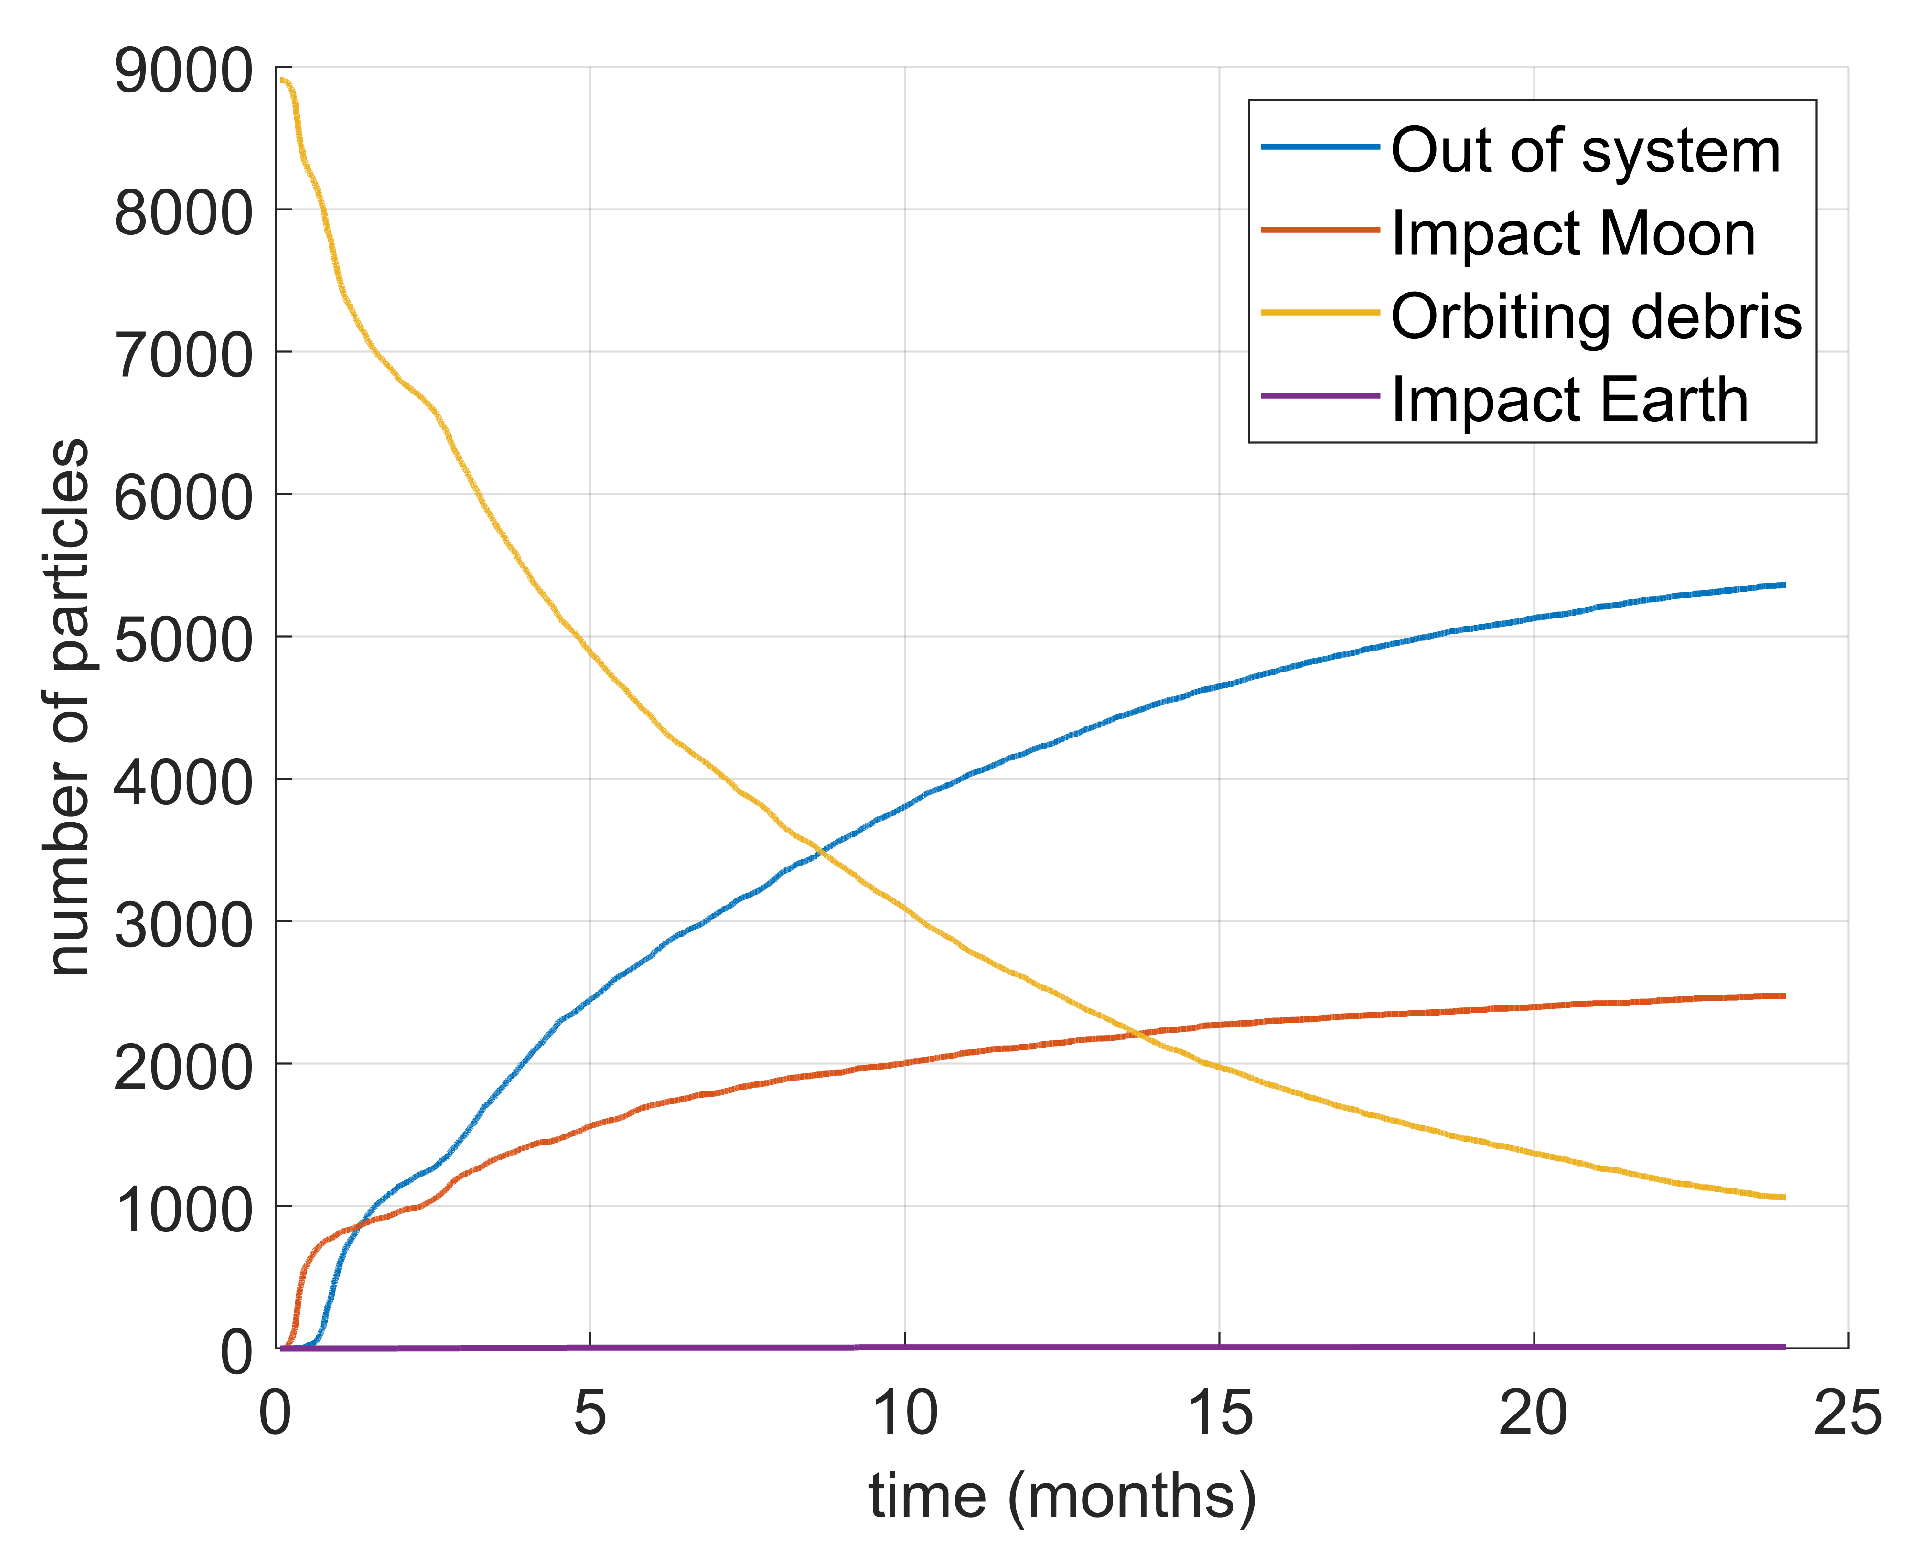
Figure 15), suggesting that the latter behavior is more frequent in this case. Finally, many fragments impact the Moon directly after the explosions, and most of the remaining debris eventually exit the system (
Figure 16). Only a negligible amount of debris impacts the Earth.
5.2. L Lyapunov Orbits
The same simulation is now carried out for explosions occurring in L
Lyapunov orbits following the criteria explained for the L
Lyapunov orbits. The fragmentation event for this case is also presented in
Figure 8. The debris propagation is presented in
Figure 17 and
Figure 18.
At first sight, similar conclusions are seen compared to L
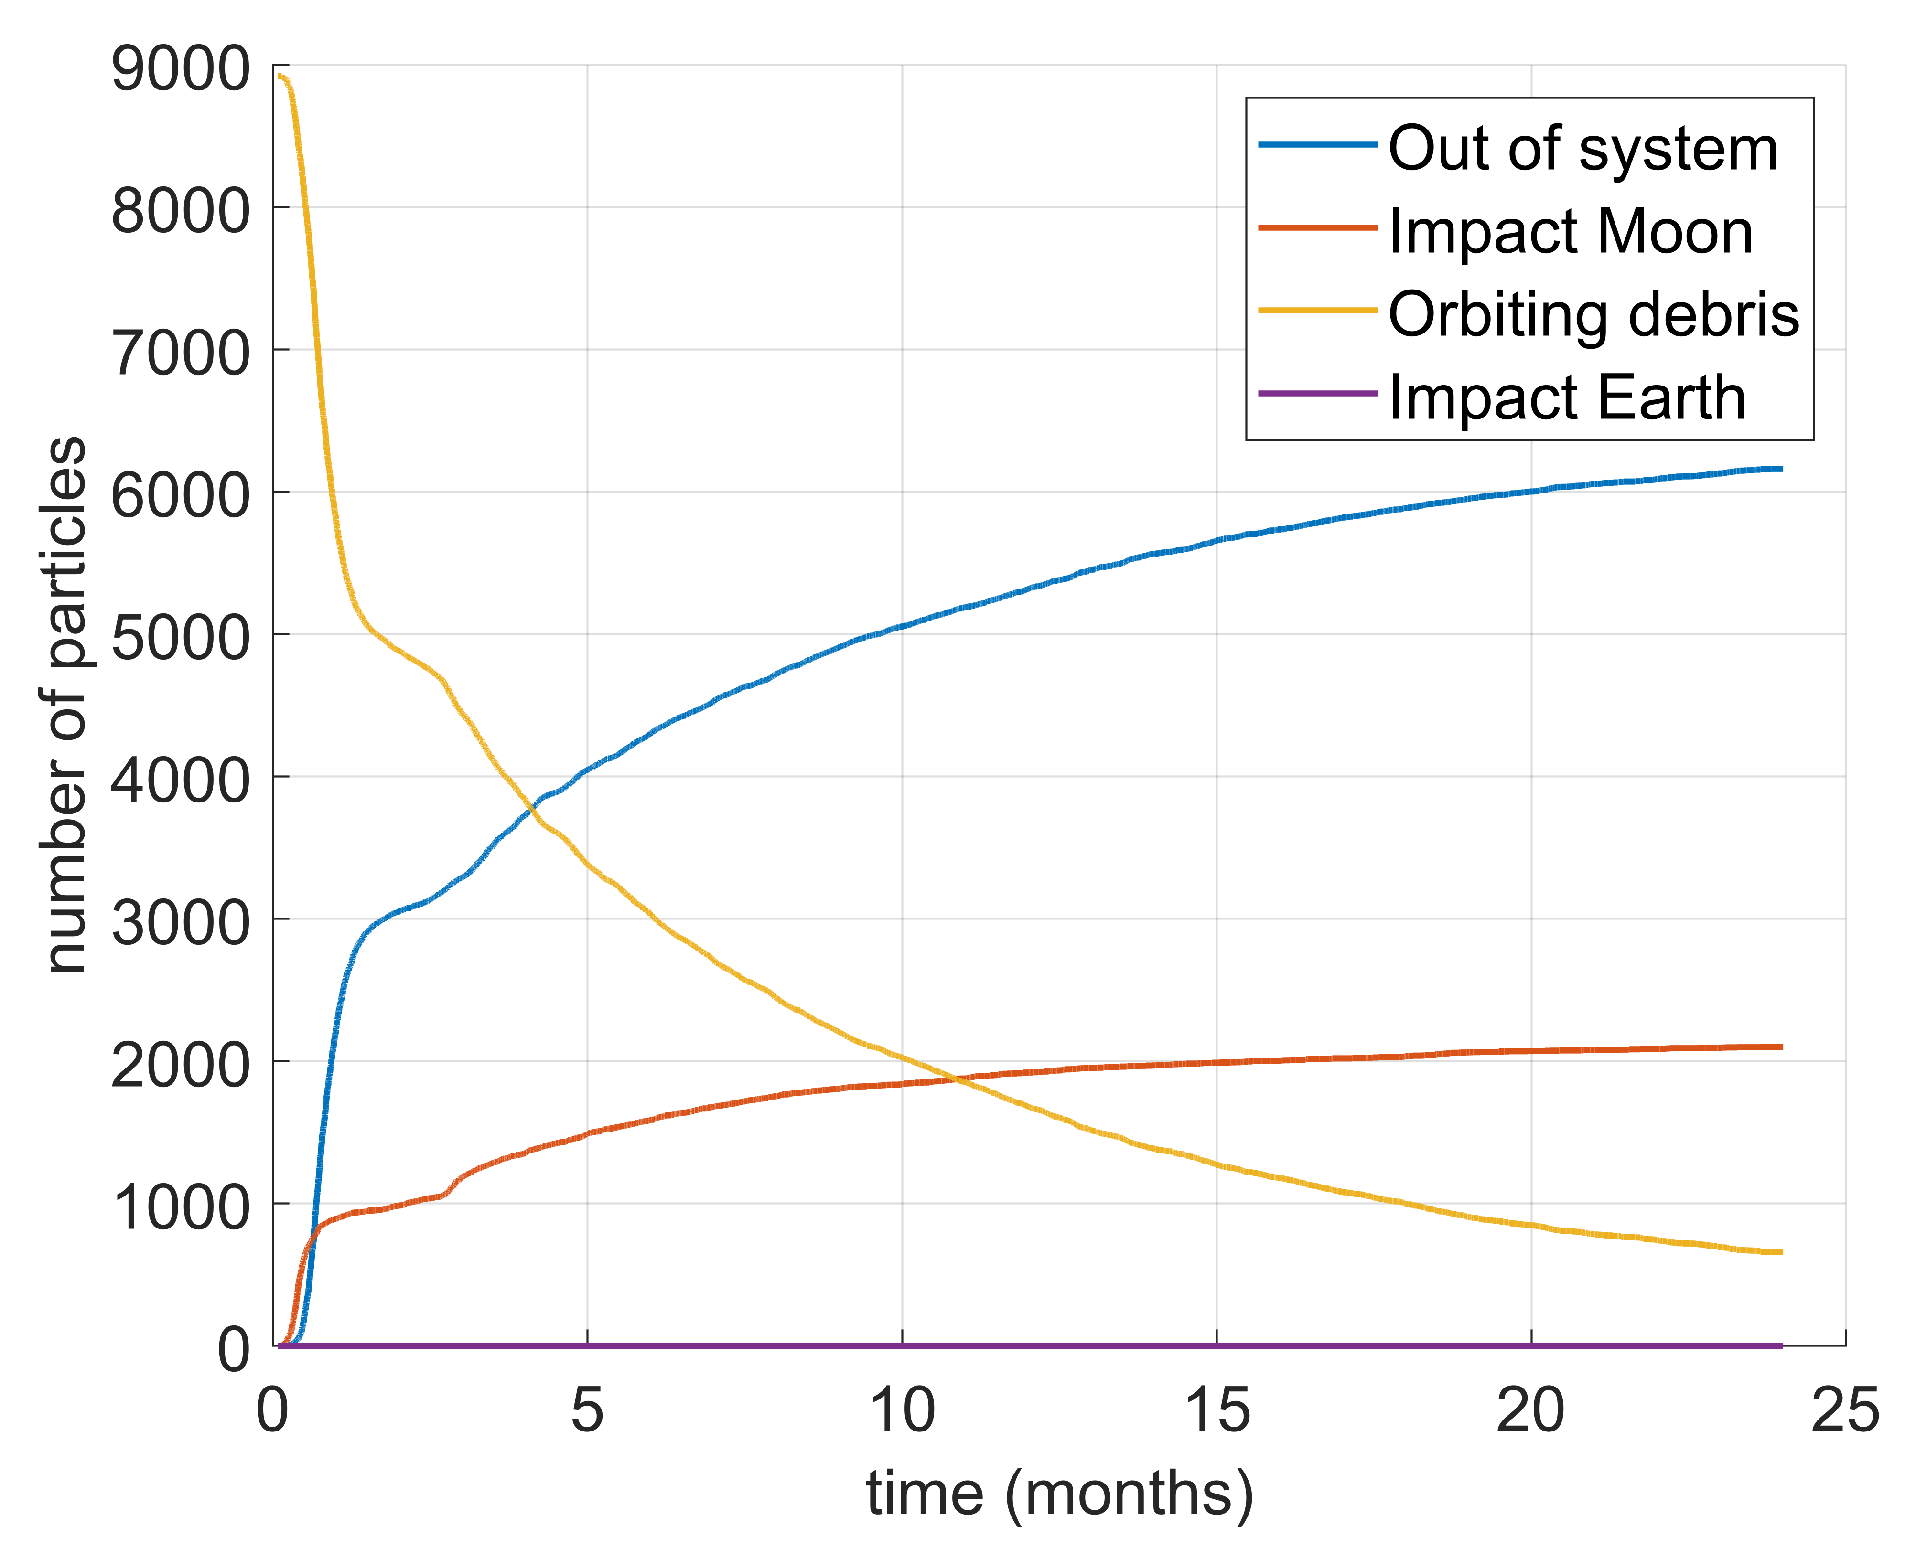
Lyapunov results. Directly after the fragmentation events occur, a large number of fragments escape the system (
Figure 19). This is due to the initial orbits being in the vicinity of L
, which is closer to the boundary of the system. In order to further analyze the results of both cases, other plots are obtained next to draw further comparisons.
5.3. Comparison
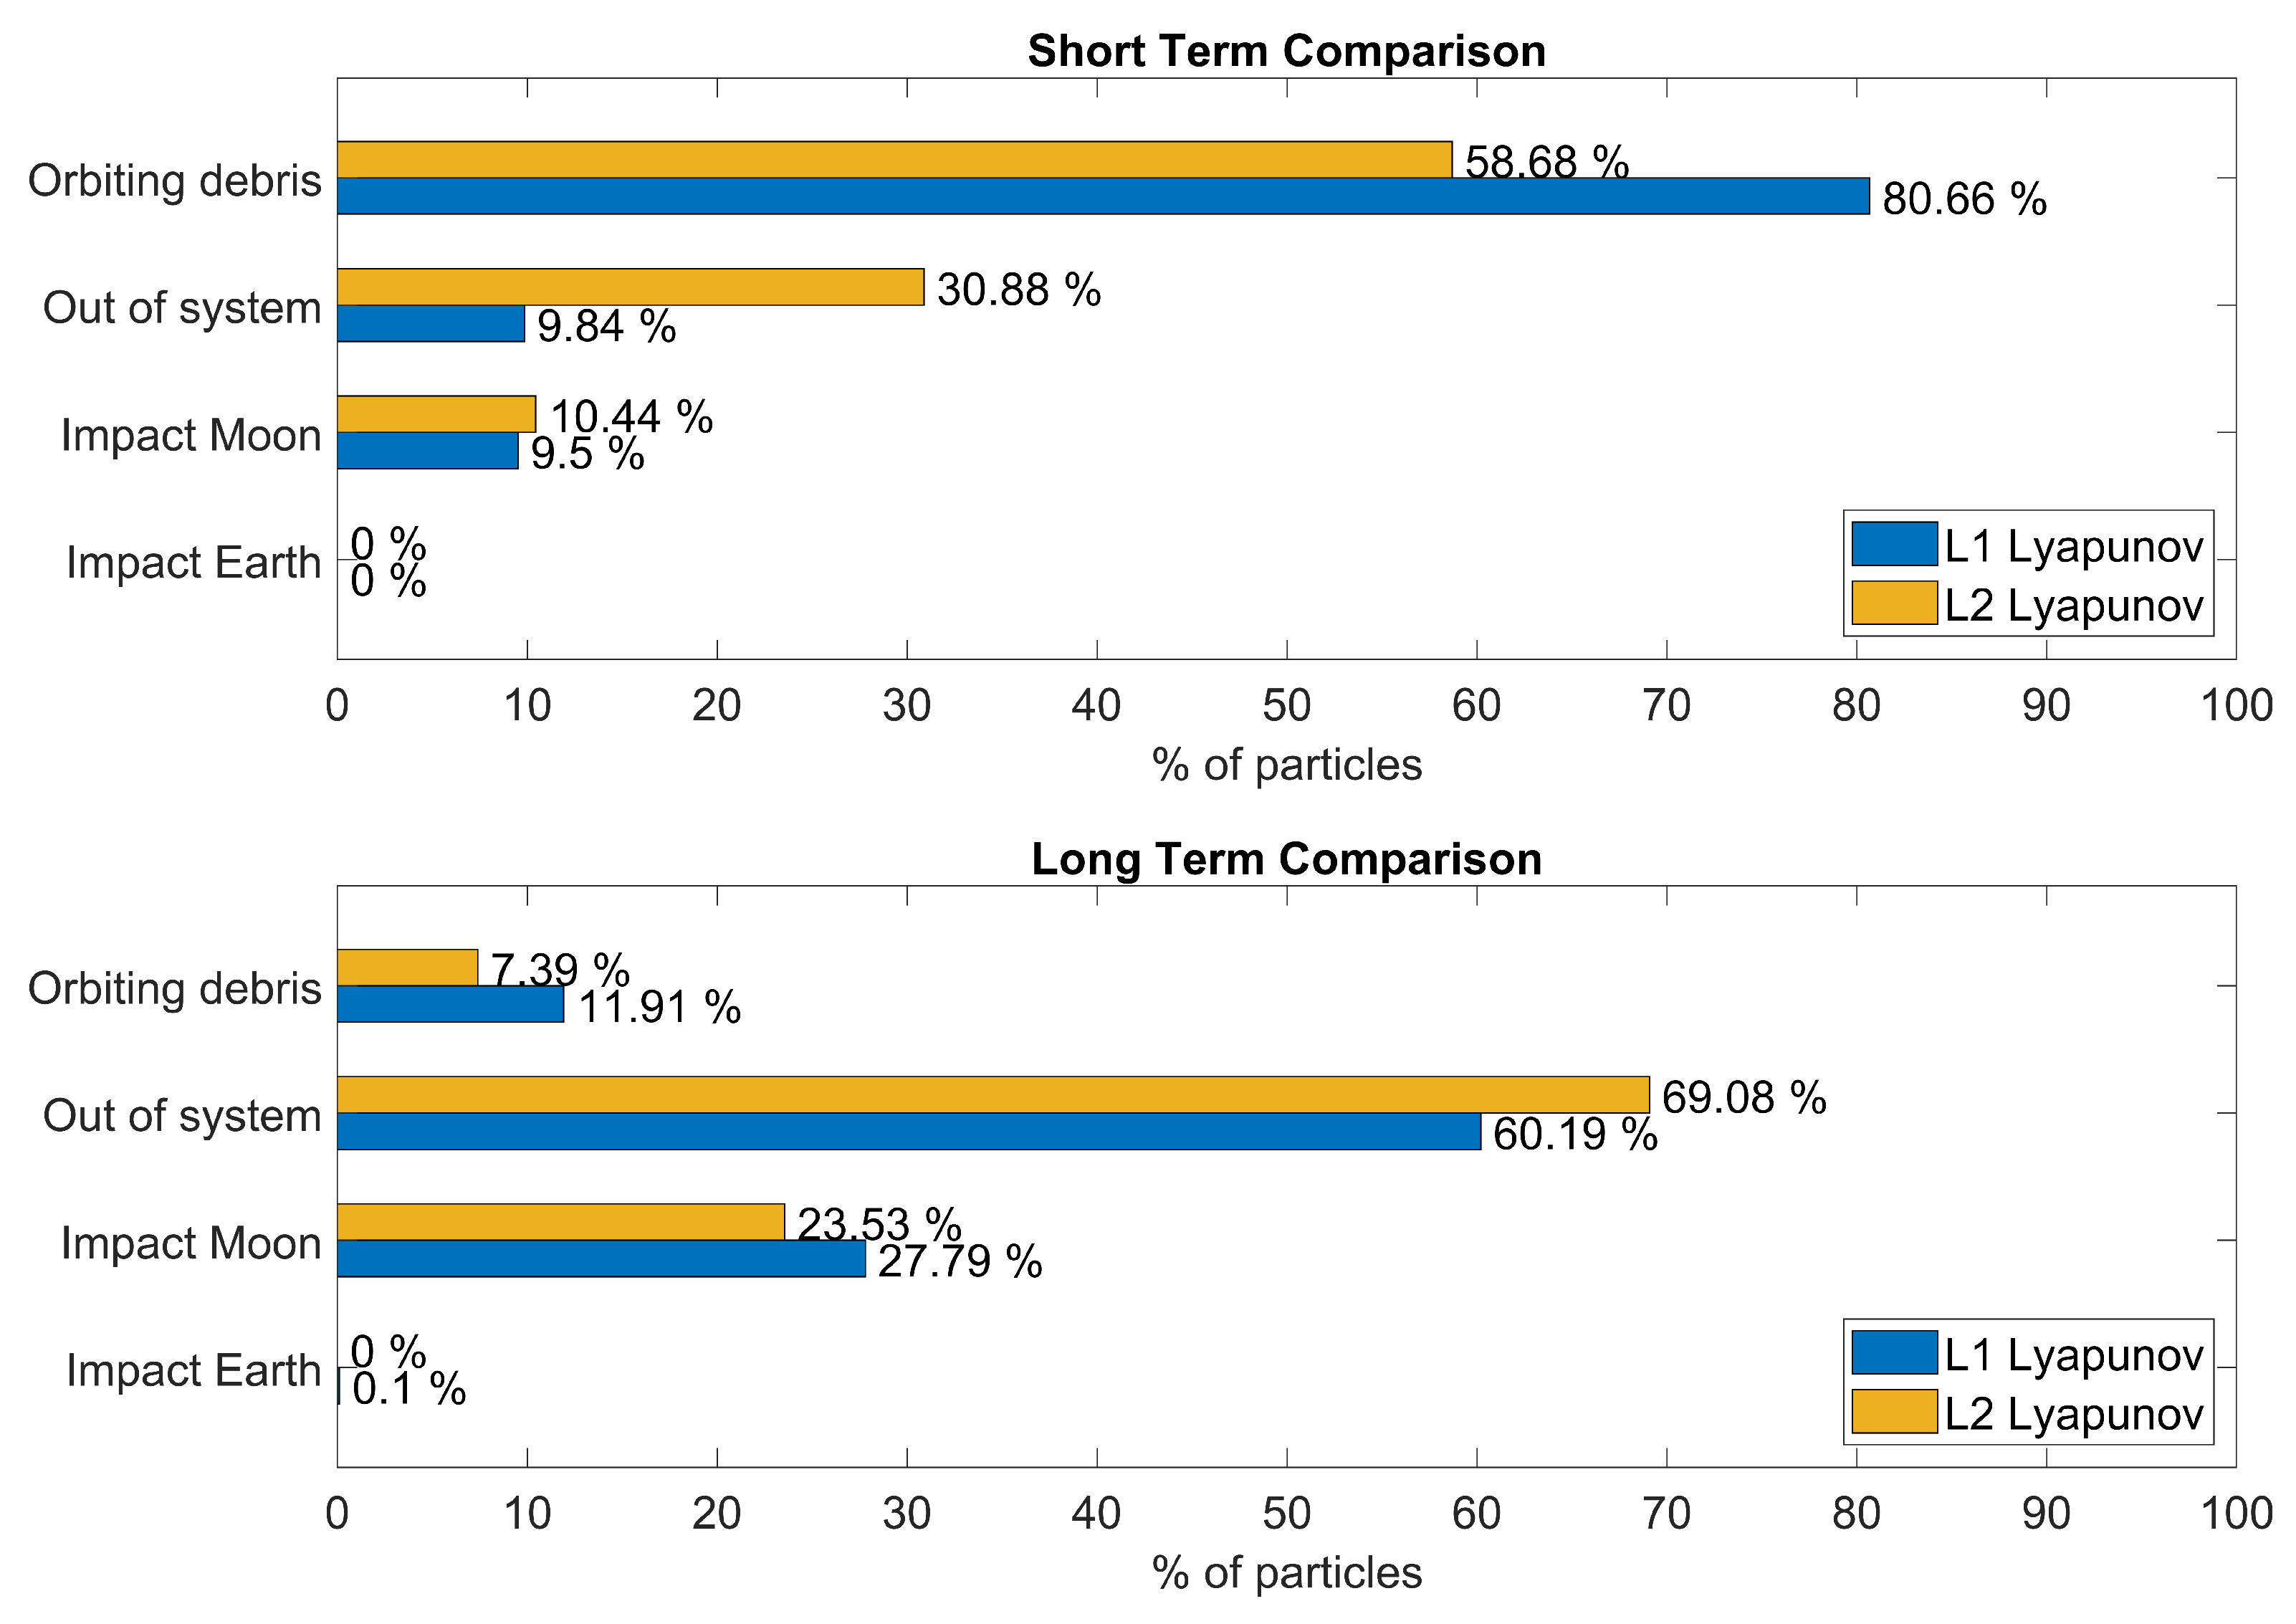
A comparison of the debris evolution for fragmentation events in both L
and L
Lyapunov orbits, analyzed over the short and long term, is presented in
Figure 20 As mentioned above, the main difference is that, in the case of L
Lyapunov orbits, the number of fragments escaping from the system is significantly higher than in the case of L
Lyapunov orbits in the short term. In the long term, results are similar for both cases. This suggests that the initial higher escape rate for L
Lyapunov debris is largely due to its proximity to the boundary of the Earth-Moon system.
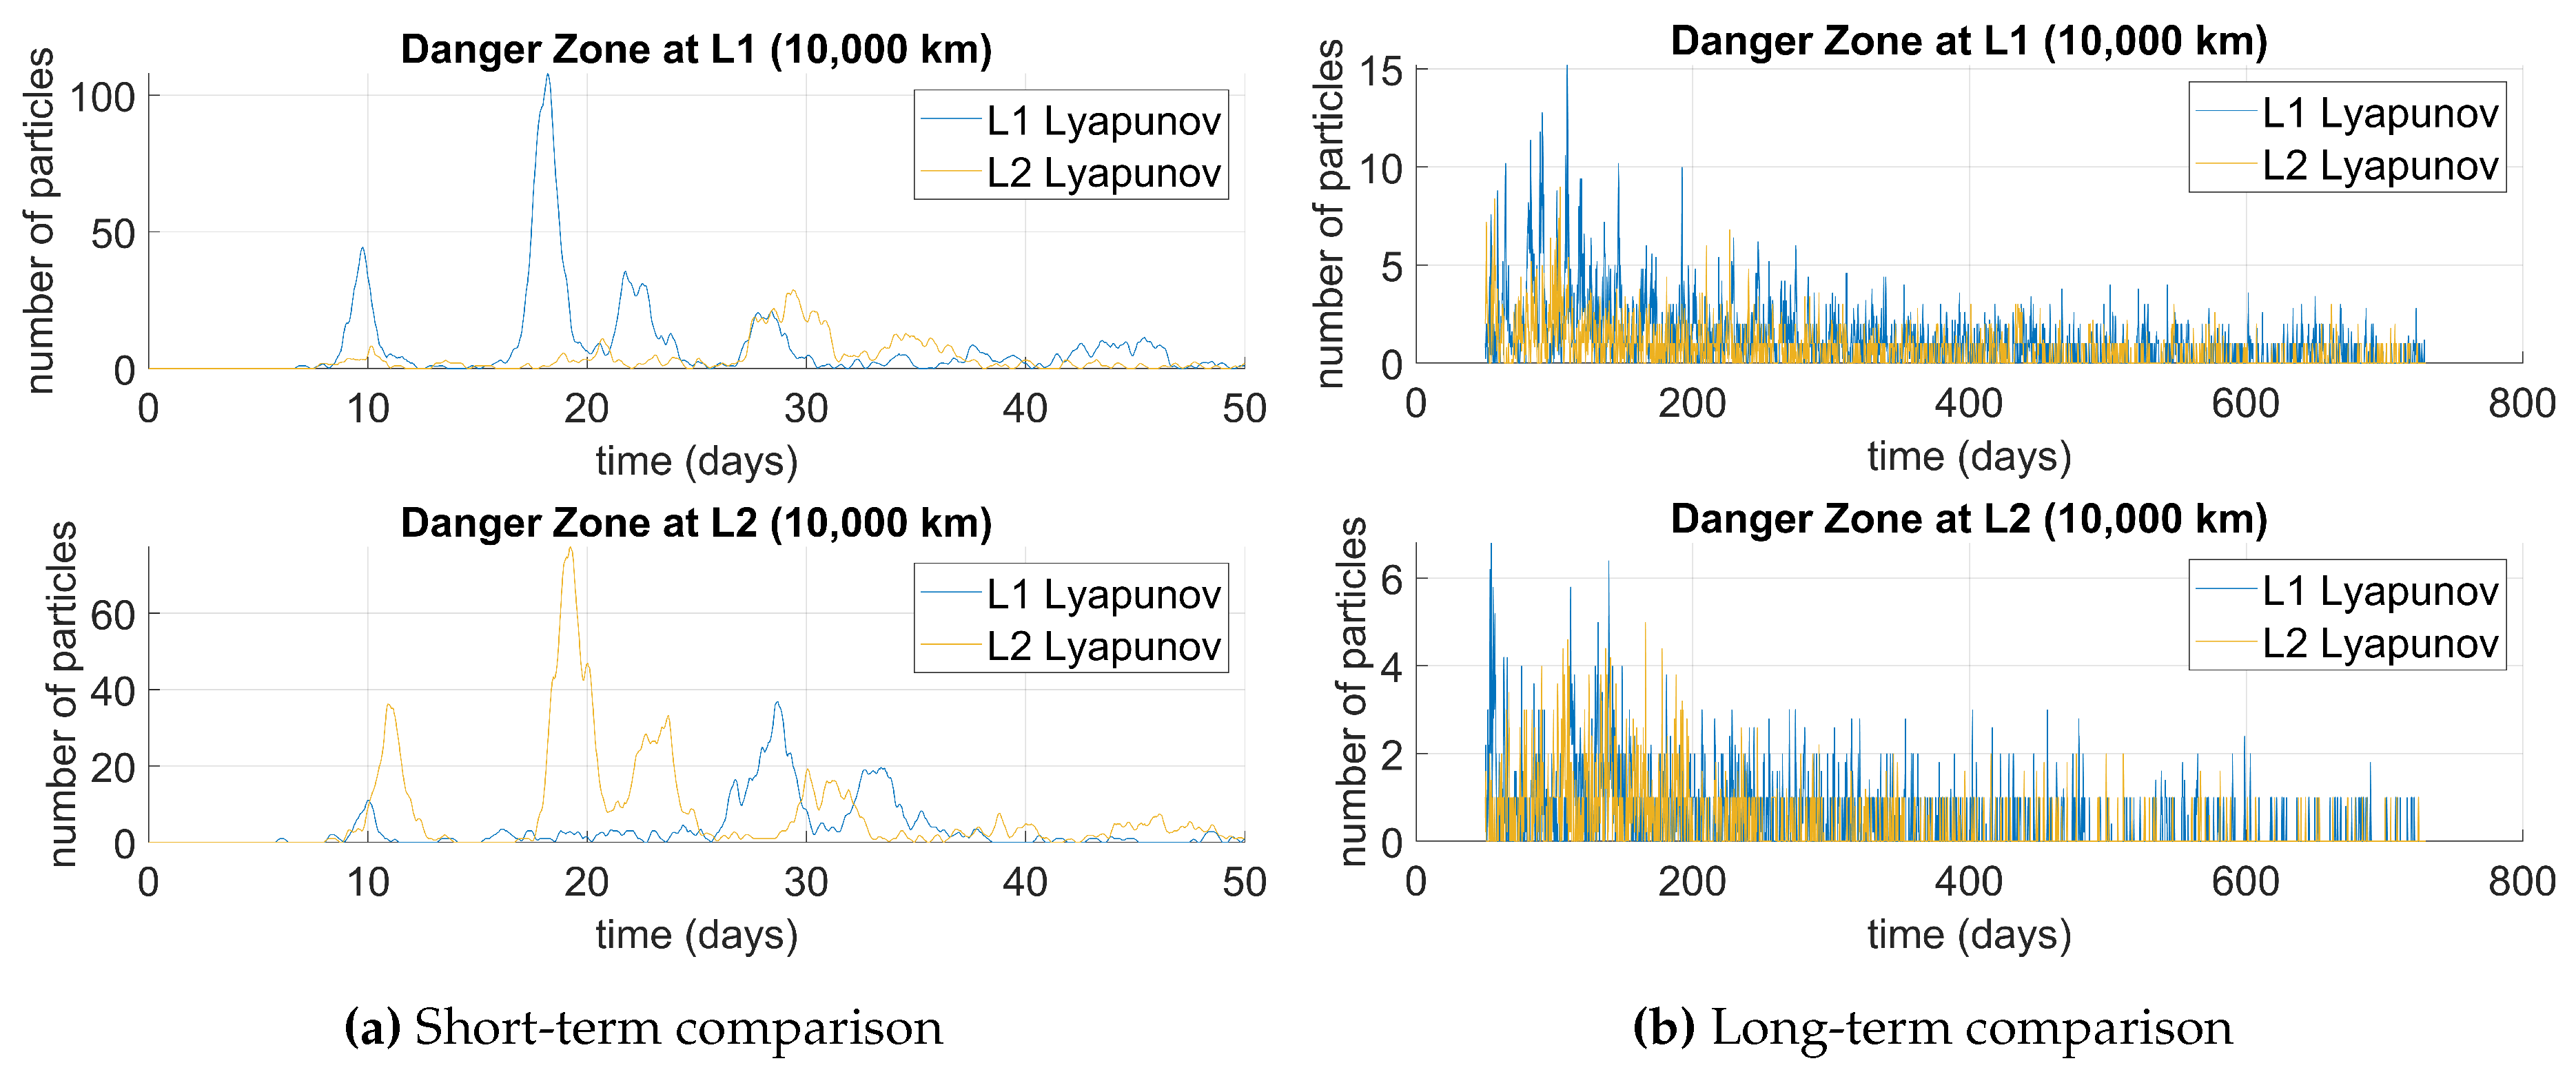
To study debris behavior throughout the simulation, danger zones are defined as spherical volumes centered at points of interest. When a fragment enters a danger zone, it is considered to have some probability of impacting an arbitrary object within that zone [
11]. For this analysis, danger zones are applied to the L
and L
Lagrange points, each with a radius of
km.
Figure 21 represents the occurrence of debris in the defined danger zones over time. The amount of debris in each region varies depending on the orbit family, but the Lyapunov orbits studied exhibit similar trends: over time, the number of particles decreases as more escape the system. As expected, explosions in L
Lyapunov orbits result in major spikes in the L
danger zone, while L
Lyapunov explosions cause similar spikes in the L
danger zone.
5.4. 3D DRO Orbits
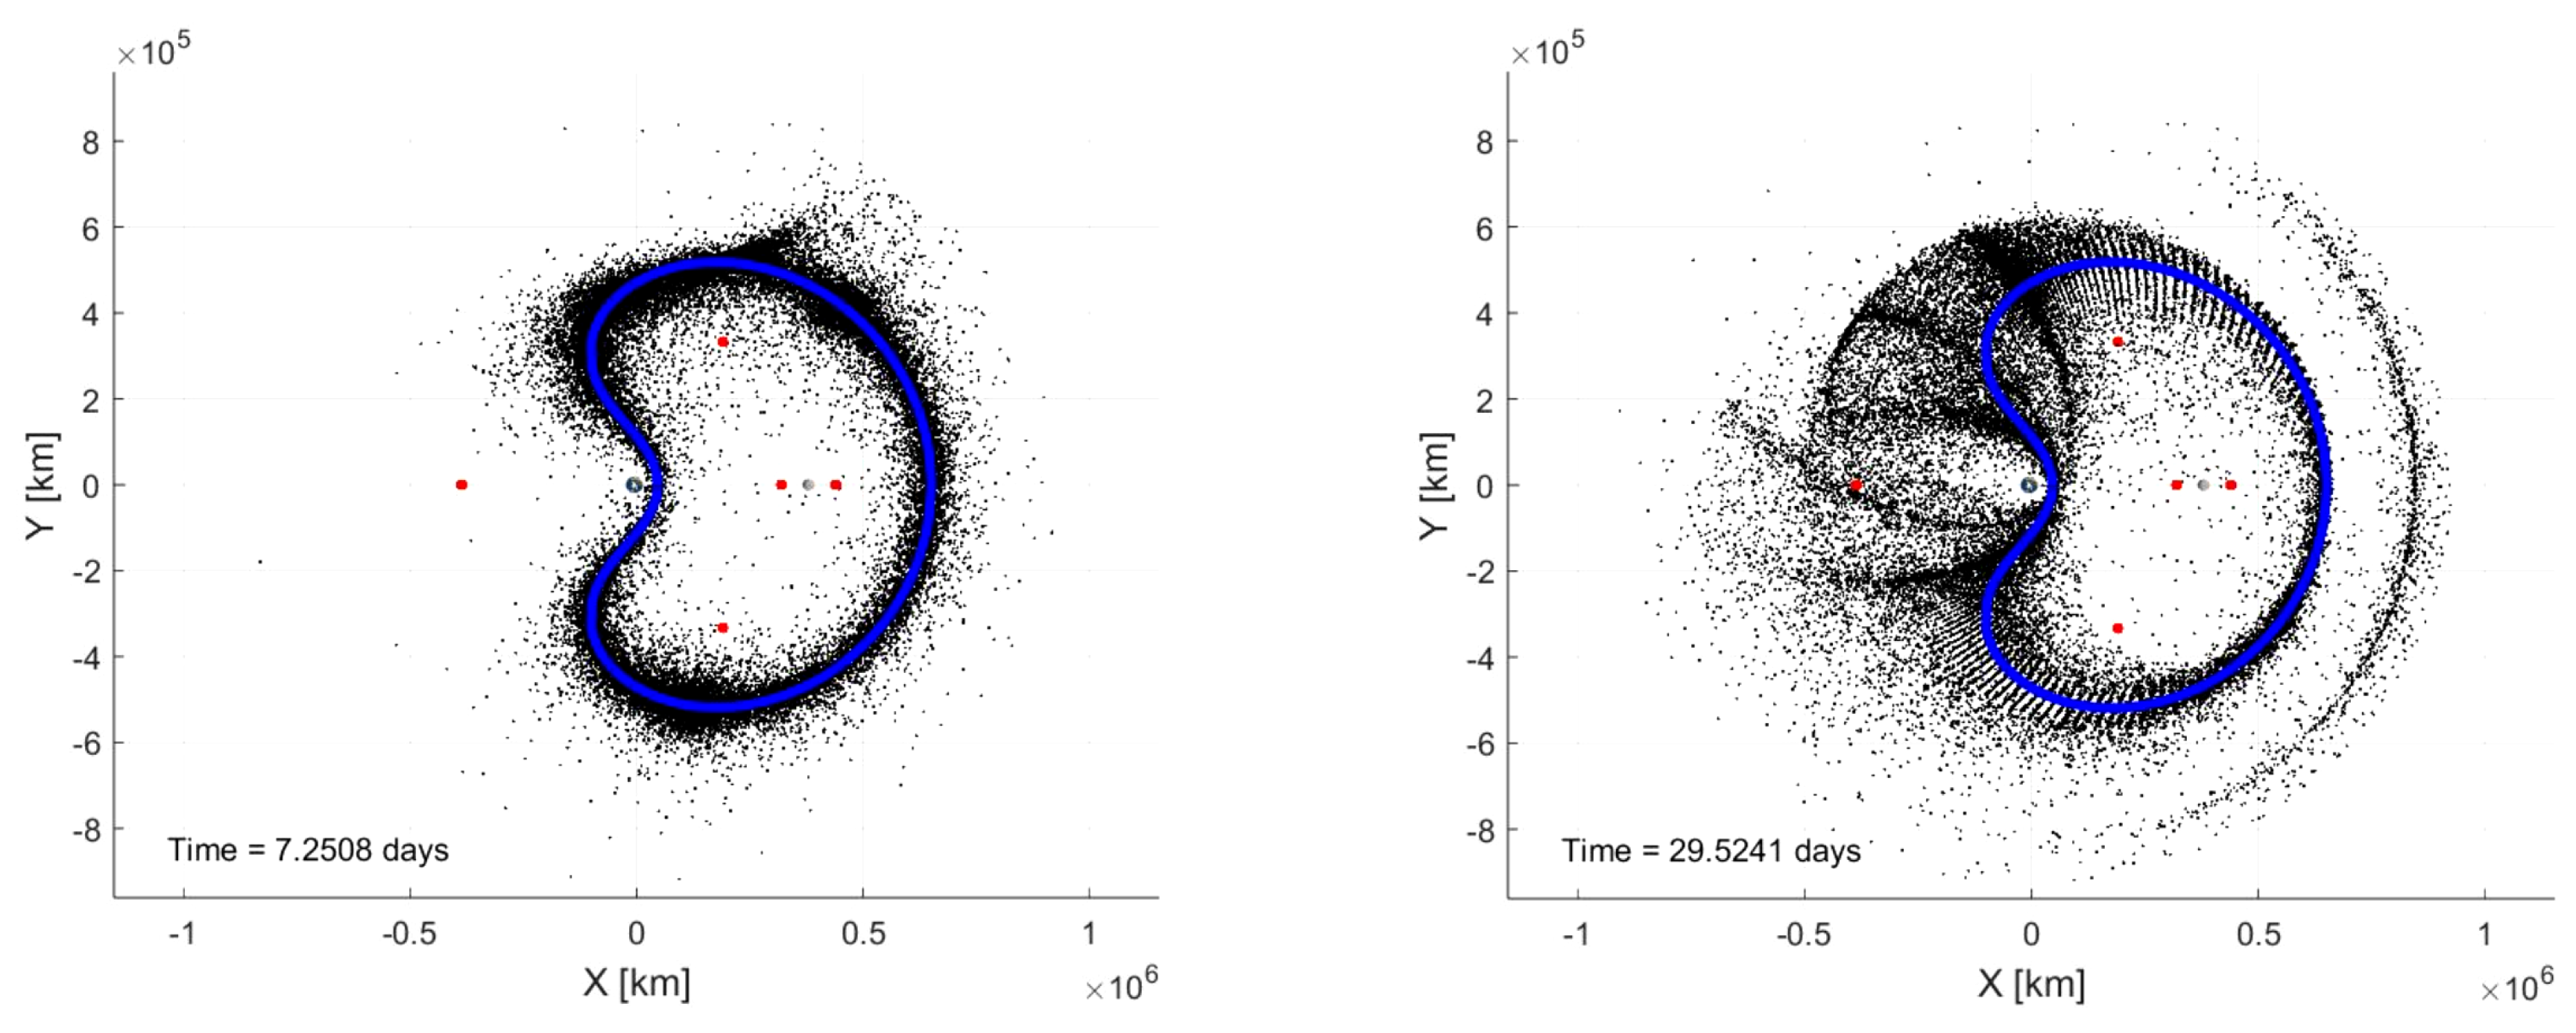
Lyapunov orbits are unstable and planar, leading to debris scattering away from the periodic orbit soon after an explosion. In contrast, a three-dimensional DRO (DRO3), which is stable in nature, is analyzed in this section. The DRO3 orbit bifurcates from the planar DRO family, extending into 3D while maintaining stability. For this study, 200 explosions are analyzed, compiling and examining the outputs of numerous satellites. The DRO3 orbit family is chosen due to its stability and extensive coverage of the Cislunar region, which has been proposed useful for surveillance applications. Animations and still images (
Figure 22) demonstrate this stability, showing that particles tend to remain close to the initial orbit path (depicted in blue) for a longer time compared to Lyapunov orbits.
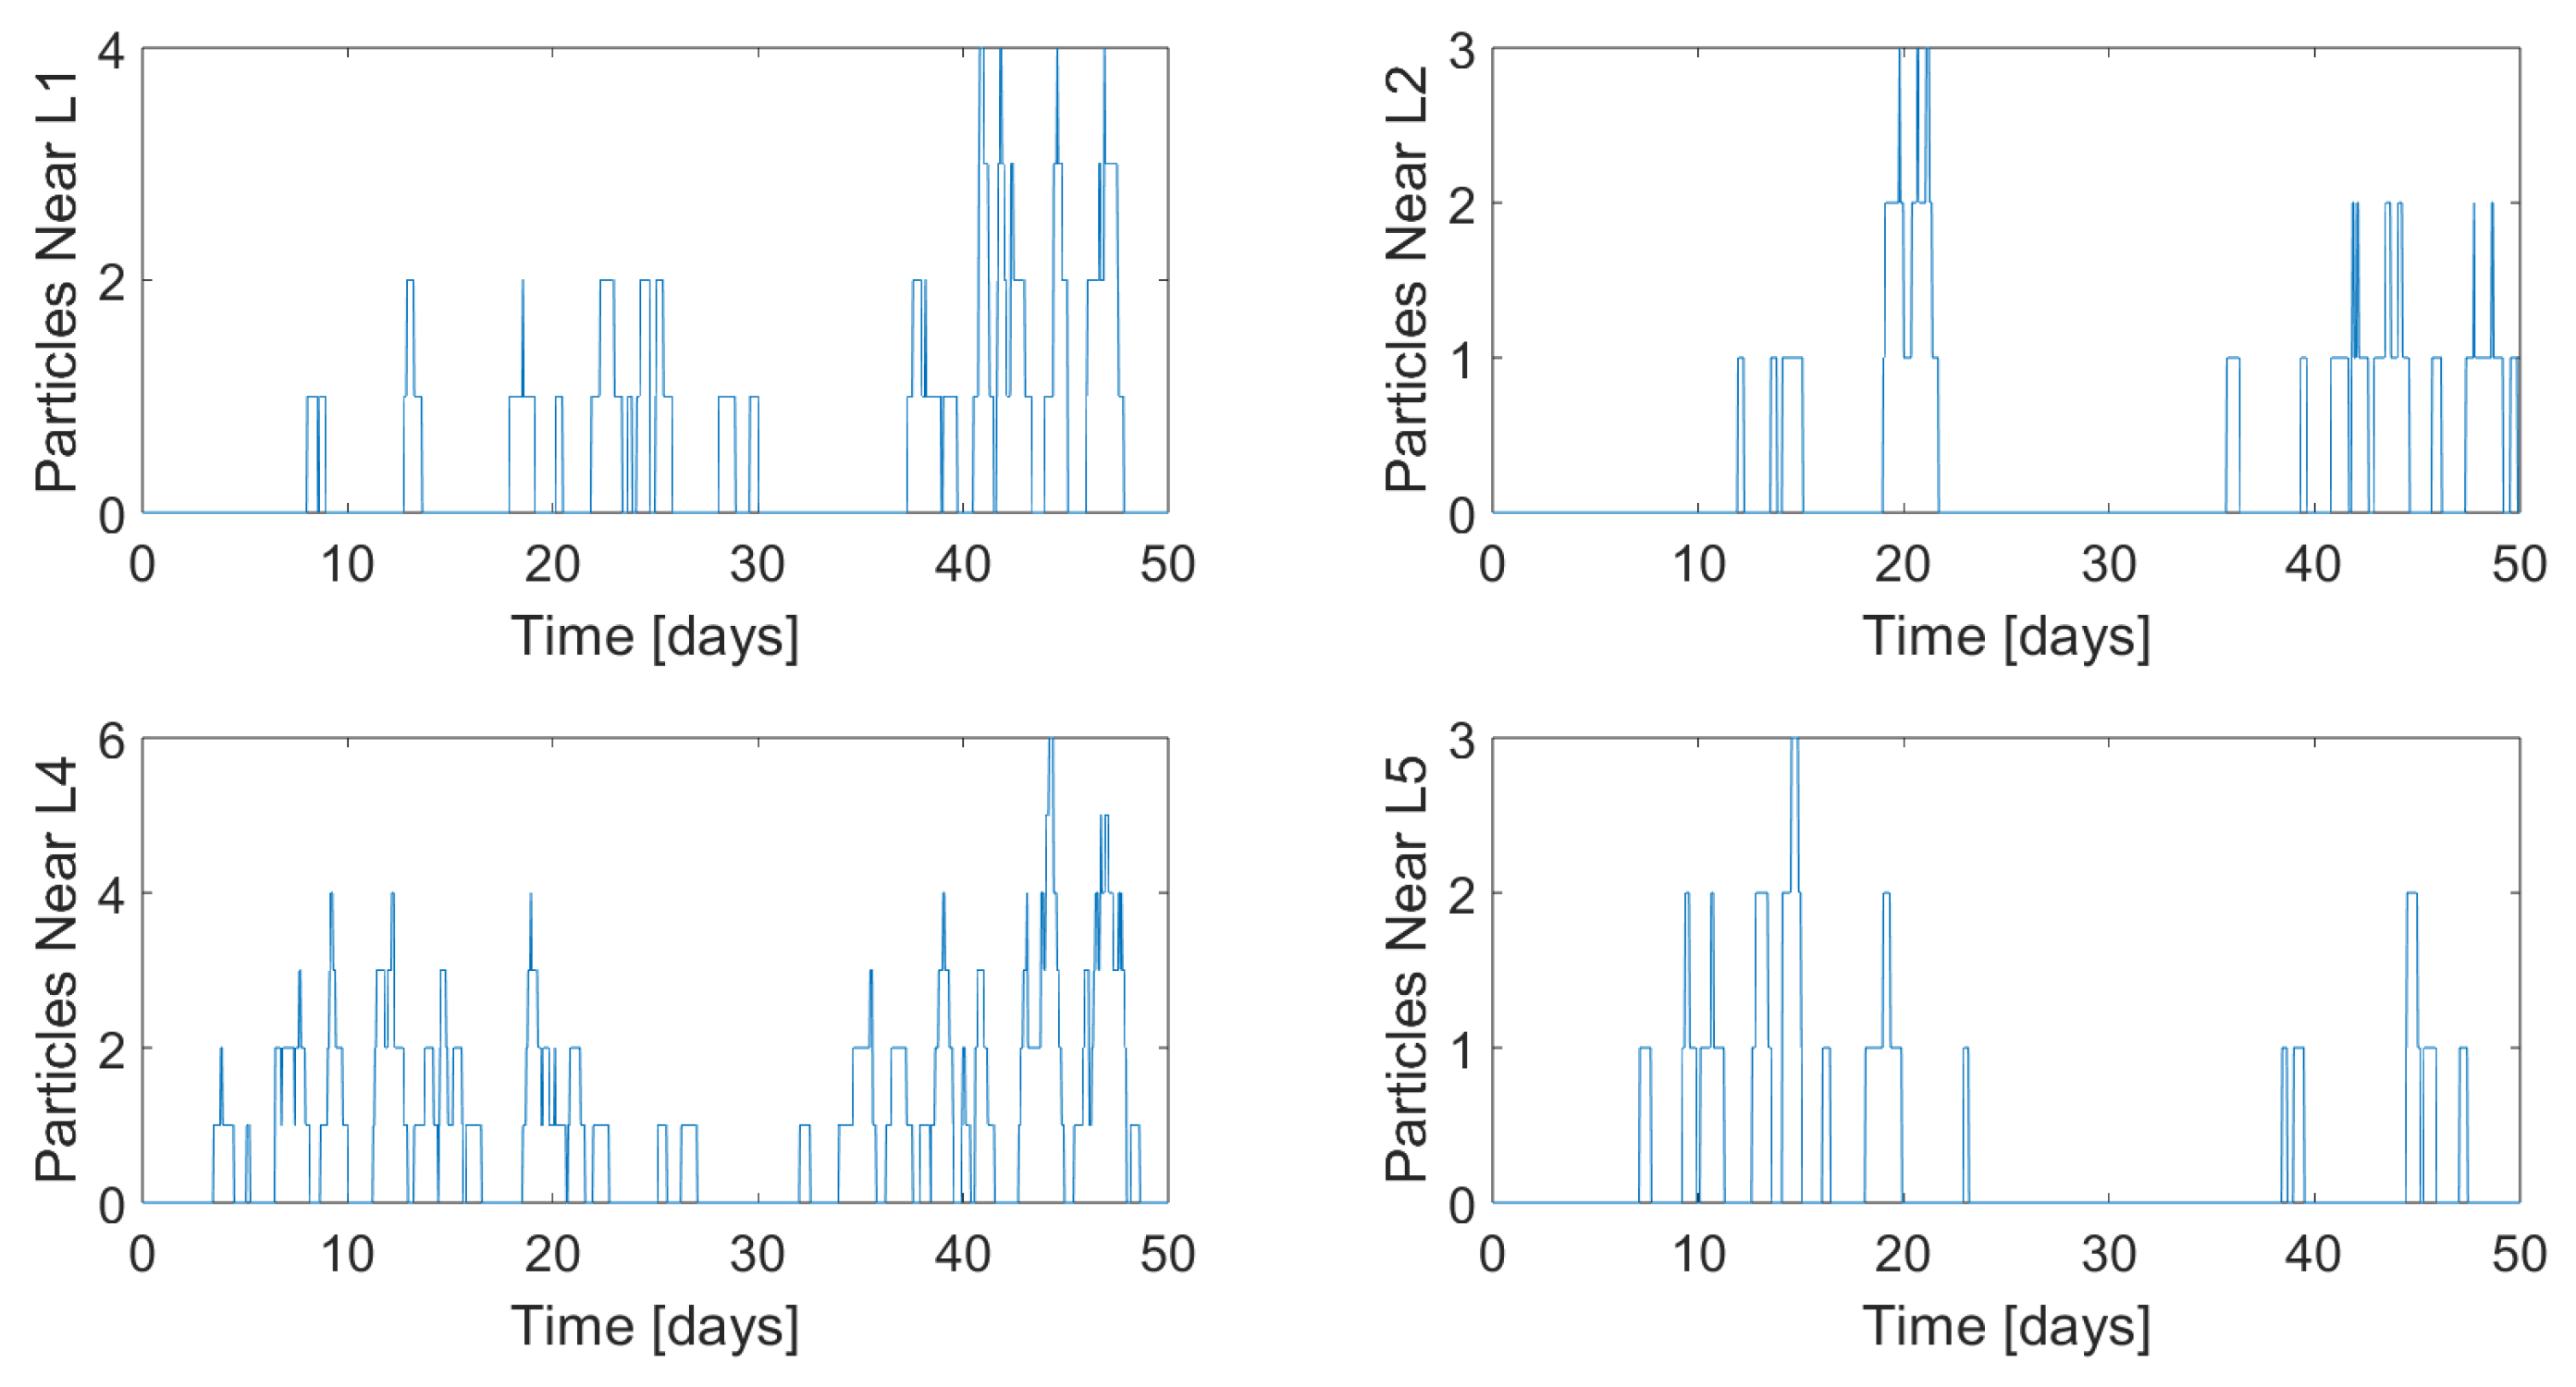
The plots in
Figure 23 correspond to danger zones with radius 40,000 km about L
, L
, L
, and L
respectively. Animations facilitate qualitative analysis, revealing that relatively few particles leave the system, likely due to the orbit’s stability (illustrated by the developing ring in
Figure 22). In turn, the primary impact is on future DRO3 missions.
Figure 23 shows that very few particles approach the Lagrange points over a 50-day period (note that the stills in
Figure 22 provide a 2D view of a 3D orbit).
6. Summary and Final Remarks
Debris behavior in Cislunar space is analyzed using the CR3BP dynamic model, and the resulting data is stored in a database for future use to address the challenge of computational complexity and time. The results of simulating catastrophic failures at various points in several orbit families, including L and L Lyapunov and a DRO3, are analyzed and compared. The results are useful for quantitative and qualitative analysis, especially in terms of impact on the Cislunar region over time.
This research represents a step ahead in the study of spacecraft fragmentation, a field of interest for safety of future Cislunar missions. Although debris analysis has been done previously, there are some gaps in the impact assessment, such as debris computation which leads to problems related to memory and time computation. These issues have been identified and solved by the creation of an open-source code that includes the GUI process and the databases of periodic orbits IC and the explosions propagated in this study. Note that the open-source database includes initial conditions for all relevant periodic orbits in the Cislunar realm. By following the entire process for generating new databases, the computation may take around 20 minutes to 4 hours. It is possible to create different debris databases with a time investment of 5 minutes once the explosions are saved. By applying the new process, some results have been obtained and analyzed, leading to conclusions about the fragmentation events and confirming the chaotic behavior of the system.
The results obtained so far confirm the effectiveness of the new process in the propagation of spacecraft fragments. The open-source tool, code, and database enhance computational efficiency and provide deeper insights into debris behavior and its implications for space safety. Further work in this research will help to understand and reduce the risks associated with fragmentation events in the Cislunar region. This includes completing simulations involving other Cislunar orbit families, as well as determining and implementing other methods of comparison and analysis.
Author Contributions
Conceptualization, M.L., D.C. and Z.H.; methodology, M.L.; software, M.L. and Z.H.; validation, D.C.; formal analysis, M.L.; investigation, M.L.; resources, D.C.; data curation, M.L.; writing—original draft preparation, M.L.; writing—review and editing, D.C. and Z.H.; visualization, M.L., Z.H. and D.C.; supervision, D.C.; project administration, D.C. All authors have read and agreed to the published version of the manuscript.
Funding
This research received no external funding
Institutional Review Board Statement
Not applicable.
Informed Consent Statement
Not applicable.
Data Availability Statement
The codes used to compute the GUI process of the database creation are available as a free-source repository in
Github. Information regarding the use of the code is also available and included in a
readme in the same repository. Additionally, the pre-computed dataset used in this study has been uploaded to the Mendeley Data communal data repository (powered by Digital Commons Data), as well as the files generated for the explosions analyzed in this study, which build the explosion database. The link is indicated in the readme file of the GitHub repository.
Conflicts of Interest
The authors declare no conflicts of interest.
Abbreviations
The following abbreviations are used in this manuscript:
| CR3BP |
Circular Restricted Three-Body Problem |
| BCR4BP |
Bicircular Restricted Four-Body Problem |
| GUI |
Graphic User Interface |
| IC |
Initial Conditions |
| DRO |
Distant Retrograde Orbit |
| L
|
First Lagrange Point |
| L
|
Second Lagrange Point |
| SoI |
Sphere of Influence |
| NASA SBM |
NASA Standard Break-Up Model |
References
- Guardabasso, P.; Lizy-Destrez, S. Lunar Orbital Debris Mitigation: Characterisation of the Environment and Identification of Disposal Strategies. 2021.
- Baker-McEvilly, B.; Doroba, S.; Gilliam, A.; Criscola, F.; Canales, D.; Frueh, C.; Henderson, T. A review on hot-spot areas within the Cislunar region and upon the Moon surface, and methods to gather passive information from these regions. AAS/AIAA 33rd Space Flight Mechanics Meeting, 2023. [Google Scholar]
- NASA. Artemis Plan; NASA’s Lunar Exploration Program Overview 2020.
- Abell, P.; Bailey, B.; Beaty, D.; Beinhoff, D. The Lunar Exploration Roadmap: Exploring the Moon in the 21st Century: Themes, Goals, Objectives, Investigations, and Priorities. Lunar Exploration Analysis Group 2013. [Google Scholar]
- Letizia, F.; Colombo, C.; Lewis, H.; McInnes, C. Debris cloud evolution in Low Earth Orbit. 2013, Vol. 4.
- Landgraf, M.; Jehn, R. Space Debris Hazards from Explosions in the collinear Sun-Earth Lagrange points 2001.
- Davidson, J.R. Environmental Problems of Space Flight Structures: II. Meteoroid Hazard; National Aeronautics and Space Administration, 1963.
- Burbank, P.B.; Cour-Palais, B.G.; Mc Allum, W.E. A meteoroid environment for near-earth, cislunar, and near-lunar operations. Technical report, 1965.
- Bettinger, R.A.; Boone, N.; Hamilton, N.S.; Little, B.D. Spacecraft Charging Vulnerability near the Stable Earth-Moon Lagrange Points. 2021 IEEE Aerospace Conference (50100), 2021, pp. 1–9. [CrossRef]
- Slíz-Balogh, J.; Barta, A.; Horváth, G. Celestial mechanics and polarization optics of the Kordylewski dust cloud in the Earth–Moon Lagrange point L5 – I. Three-dimensional celestial mechanical modelling of dust cloud formation. Monthly Notices of the Royal Astronomical Society 2018, 480, 5550–5559. [Google Scholar] [CrossRef]
- Boone, N.; Bettinger, R. Debris Propagation Following a Spacecraft Mishap at the Collinear Earth-Moon Lagrange Points. 2021, pp. 1–15. [CrossRef]
- Wilmer, A.P.; Boone, N.R.; Bettinger, R.A. Artificial Debris Propagation in Cislunar Periodic Orbits. 2021 AAS/AIAA Astrodynamics Specialist Conference, 2021.
- Boone, N.R.; Bettinger, R.A. Spacecraft survivability in the natural debris environment near the stable Earth-Moon Lagrange points. Advances in Space Research 2021, 67, 2319–2332. [Google Scholar] [CrossRef]
- Boone, N.; Bettinger, R. Artificial Debris Collision Risk Following a Catastrophic Spacecraft Mishap in Lunar Orbit. 2021.
- Bettinger, M.R.; Boone, N.; Hamilton, M.N.; Little, L.C.B. Survivability Analysis in the Shadow of Apollo: Part II–Spacecraft Charging Vulnerability Near the Stable Earthmoon Lagrange Points.
- Boone, N.; Bettinger, R. Long-Term Evolution of Debris Clouds in Low Lunar Orbit. 2022.
- Wilmer, A.P.; Boone, N.R.; Bettinger, R.A. Debris Propagation and Spacecraft Survivability Assessment for Catastrophic Mishaps Occurring in Cislunar Periodic Orbits. The Journal of Space Safety Engineering 2022, 9, 207–222. [Google Scholar] [CrossRef]
- Black, A.; Frueh, C. Characterizing Cislunar Fragmentations. The Advanced Maui Optical and Space Surveillance Technologies Conference, Maui, HI, 2023.
- Black, A.; Frueh, C. Investigation of Fragmentation Events in the Cislunar Domain. 33rd AAS/AIAA Space Flight Mechanics Meeting, Austin, TX, 2023.
- Vallado, D.; McClain, W. Fundamentals of Astrodynamics and Applications; Fundamentals of Astrodynamics and Applications, Microcosm Press, 2001.
- Canales Garcia, D. Transfer design methodology between neighborhoods of planetary moons in the circular restricted three-body problem. PhD thesis, Purdue University, 2021. [CrossRef]
- Curtis, H. Orbital Mechanics: For Engineering Students; Aerospace Engineering, Elsevier Science, 2015.
- Frueh, C.; Howell, K.; DeMars, K.J.; Bhadauria, S. Cislunar space situational awareness. 31st AIAA/AAS Space Flight Mechanics Meeting, 2021, pp. 6–7.
- Johnson, N.; Krisko, P.; Liou, J.C.; Anz-Meador, P. NASA’s new breakup model of evolve 4.0. Advances in Space Research 2001, 28, 1377–1384. [Google Scholar] [CrossRef]
- Liou, J.C. Orbital Debris and Future Environment Remediation. Presentation, 2012.
Figure 1.
CR3BP model in the Earth-Moon barycentric rotating frame.
Figure 1.
CR3BP model in the Earth-Moon barycentric rotating frame.
Figure 2.
Lyapunov orbits family family.
Figure 2.
Lyapunov orbits family family.
Figure 3.
Direct retrograde orbit family.
Figure 3.
Direct retrograde orbit family.
Figure 4.
Gravitational influence due to the Earth and the Moon along the -axis.
Figure 4.
Gravitational influence due to the Earth and the Moon along the -axis.
Figure 5.
NASA standard break-up model mass and velocity distributions for cm.
Figure 5.
NASA standard break-up model mass and velocity distributions for cm.
Figure 6.
Explosion velocity distribution for NASA SBM.
Figure 6.
Explosion velocity distribution for NASA SBM.
Figure 7.
Flowchart of NASA SBM.
Figure 7.
Flowchart of NASA SBM.
Figure 8.
Break-up locations in L and L Lyapunov orbit families.
Figure 8.
Break-up locations in L and L Lyapunov orbit families.
Figure 9.
Procedure for the generation of the explosion.
Figure 9.
Procedure for the generation of the explosion.
Figure 10.
Procedure for analysis of impact on the Cislunar region.
Figure 10.
Procedure for analysis of impact on the Cislunar region.
Figure 11.
GUI for the computation of the orbit database.
Figure 11.
GUI for the computation of the orbit database.
Figure 12.
GUI during the computation of the explosion database.
Figure 12.
GUI during the computation of the explosion database.
Figure 13.
GUI to compute the debris database.
Figure 13.
GUI to compute the debris database.
Figure 14.
Debris simulation over 50 days for explosions in L Lyapunov orbits.
Figure 14.
Debris simulation over 50 days for explosions in L Lyapunov orbits.
Figure 15.
Debris simulation over 2 years for explosions in L Lyapunov orbits.
Figure 15.
Debris simulation over 2 years for explosions in L Lyapunov orbits.
Figure 16.
Evolution of debris through the time of study for L Lyapunov explosions.
Figure 16.
Evolution of debris through the time of study for L Lyapunov explosions.
Figure 17.
Debris simulation over 50 days for explosions in L Lyapunov orbits.
Figure 17.
Debris simulation over 50 days for explosions in L Lyapunov orbits.
Figure 18.
Debris simulation over 2 years for explosions in L Lyapunov orbits.
Figure 18.
Debris simulation over 2 years for explosions in L Lyapunov orbits.
Figure 19.
Evolution of debris through the time of study for L Lyapunov explosions.
Figure 19.
Evolution of debris through the time of study for L Lyapunov explosions.
Figure 20.
Comparison of debris evolution of explosions occurring in L and L Lyapunov orbits.
Figure 20.
Comparison of debris evolution of explosions occurring in L and L Lyapunov orbits.
Figure 21.
Comparison of number of particles inside L and L danger zones.
Figure 21.
Comparison of number of particles inside L and L danger zones.
Figure 22.
Debris propagation from a 3D DRO at different times.
Figure 22.
Debris propagation from a 3D DRO at different times.
Figure 23.
Count of particles in proximity to Lagrange points over time.
Figure 23.
Count of particles in proximity to Lagrange points over time.
Table 1.
Characteristic parameters that define the Earth-Moon CR3BP.
Table 1.
Characteristic parameters that define the Earth-Moon CR3BP.
| Parameter |
Definition |
Value |
| Distance |
Earth-Moon distance |
km |
| Mass |
Sum of Earth and Moon masses |
kg |
| Time |
Time for the Moon to travel one radian around Earth |
days |
| Mass ratio |
Proportion of the Moon mass |
|
Table 2.
Solutions of the Lagrange points for the Earth-Moon system.
Table 2.
Solutions of the Lagrange points for the Earth-Moon system.
| Lagrange Point |
Coordinates (nondim) |
Coordinates (km) |
|
|
|
|
|
|
|
|
|
|
|
|
|
|
|
|
Disclaimer/Publisher’s Note: The statements, opinions and data contained in all publications are solely those of the individual author(s) and contributor(s) and not of MDPI and/or the editor(s). MDPI and/or the editor(s) disclaim responsibility for any injury to people or property resulting from any ideas, methods, instructions or products referred to in the content. |
© 2024 by the authors. Licensee MDPI, Basel, Switzerland. This article is an open access article distributed under the terms and conditions of the Creative Commons Attribution (CC BY) license (https://creativecommons.org/licenses/by/4.0/).
