1. Introduction
Piers and columns represent a class of hydraulic structures that are both common and important. Examples of such structures include piers of various bridges, dividing piers of porous sluice gates, structural support columns inside underground lock chambers, rectification piers/columns of pumping station inlet/outlet basins and inlet/outlet canals, and support columns of high pile piers. In contrast to the unimpeded flow of water in natural rivers, the introduction of piers and columns into the waterway results in a number of changes to the characteristics of water movement. These include alterations to the velocity of the water, the water level, the shear force and a number of other factors. This change is sometimes beneficial, such as the use of a variety of rectification piers/columns of the pumping station in and out of the flow of water homogenisation, in order to improve the pumping station in and out of the water flow pattern and unit inlet/outlet conditions. However, some may be unfavourable. For instance, the pier impedes the movement of water caused by the upstream channel's surface congestion, which affects the river's flood control. Additionally, the pier/columns' localised changes in the local flow caused by local scouring affect the project's safety. Consequently, the impact of piers and columns on water movement has been a significant area of investigation within the field of water conservancy engineering. [
1,
2,
3,
4,
5,
6]
In the field of pier/column winding flow, physical modelling tests represent a significant and widely employed research methodology [
7,
8,
9]. Some scholars have previously observed that "sixty years ago, it was believed that the flow field at bridge piers was too complex to be measured or even visualised." [
10]. Subsequently, with the advent of sophisticated measurement techniques such as ADV and PIV, the intricate flow field around bridge piers has been successfully quantified, and continues to be a pivotal aspect of related research. Keshavarzi, A., et al. [
11], in the The study of coherent turbulence around a single circular bridge pier and its influence on the scour pattern of the riverbed employed an acoustic Doppler velocimeter (Micro-ADV) to measure the flow field around an open channel bed at 102 locations in the vicinity of an open channel. Pagliara, S., et al. [
12] conducted a study to investigate the effect of spacing between two in-line circular columns on the flow structure. This was achieved by utilising a micro-acoustic Doppler velocimeter (ADV) at 102 points near the bed of an open channel. The objective was to develop a reliable method for predicting the maximum depth of localized scour around a bridge pier.Vijayas Furthermore, B.A. Ree and colleagues [
13] employed three-dimensional microacoustic Doppler velocimetry (ADV) to measure the instantaneous velocity of individual piers of various shapes, including rectangular, oblong, trapezoidal, triangular, and lenticular. They then discussed the changes in mean velocity and Reynolds stress induced by the shape of the piers and compared them with a flat plate surface. In their study, Li, J., et al. [
14] employed particle image velocimetry (PIV) to quantify the flow field in the vicinity of the pier. U. Jenssen and M. Manhart [
15] employed stereoscopic particle image velocimetry (PIV) to examine the turbulent flow within a scour hole surrounding a cylinder in a sand bed. Their objective was to elucidate the flow dynamics and the underlying turbulent structure. J. Unger and W. H. Hager [
16] utilized PIV to investigate the internal flow characteristics surrounding a circular bridge pier. Their aim was to characterize the turbulent flow. The internal flow characteristics around a circular bridge pier were investigated by particle image velocimetry, resulting in a quasi-spatial visualization of the velocity field. The temporal evolution of the vertical deflected flow in front of the pier and the horseshoe vortex in the enlarged scour hole were investigated, and velocity and vorticity distributions were derived.
Another significant approach to the investigation of pier-deflected flow is the CFD technique. Although CFD commenced later than physical modelling tests, it has developed at a rapid pace and has gradually become an important research tool in recent years, as a result of the continuous progress of technology [
17,
18,
19]. The combination of a physical model and a mathematical model has become the dominant research programme in the field of pier and column flow.
In numerous CFD studies, FLUENT is employed for three-dimensional fine numerical simulation of the flow field around bridge piers with the objective of obtaining more realistic and comprehensive flow information. K. H. M. Ali and O. Karim [
20] utilised FLUENT to predict the three-dimensional flow field around the cylinder, resulting in the identification of the rule governing the change in shear stress within the bed in proximity to the cylinder. Solutions were obtained for rigid beds and scour holes of different sizes due to different durations. M. Salaheldin Tarek, et al. [
21] employed a three-dimensional numerical model, FLUENT, to simulate the separation turbulence around a vertical circular pier in clear water. Calculation was conducted using a variety of turbulence models, with the results being compared with a number of sets of experimental data that were available in the literature. W. Cui, et al. [
22] conducted a numerical simulation of the flow around a combined pier with a Reynolds number in the range of 1.0 × 10⁶ to 2.76 × 10⁶ using the technique of fluid dynamics software FLUENT. The time courses of lift and drag coefficients for three different types of combined piers (e.g., combined cylindrical piers, truncated conical piers, and combined truncated conical piers) were analysed for different water depths based on the detached eddy simulation (DES). M. Nasim, et al. [
23] simulated the flooding effect of bridge piers using the finite volume method in the ANSYS-FLUENT software package. The shape of the pier cross-section was found to have a significant effect on the fluid pressure exerted on the pier under flood loading. K. Lahsaei, et al. [
24] simulated the three-dimensional flow around a river pier under rigid riverbed conditions using ANSYS FLUENT software.
Another frequently used 3D fine numerical simulation software is FLOW-3D.M. In their study, Ghasemi and S. Soltani-Gerdefaramarzi [
25] employed the Flow-3D modelling function to simulate local scour around a cylindrical bridge pier in a non-cohesive bed sediment. The simulations were conducted at different flow rates of 5, 10, 19 and 30 L/sec, with parameters such as flow velocity, fluid depth, Froude number, height of filled sediment and change in net sediment motion investigated. M. Jafari, et al. [
26] investigated the hydrodynamic behaviour around the piers of a diagonal bridge complex settling on a foundation using the FLOW-3D numerical model. It was demonstrated that the flow pattern around a bridge pier cluster is distinct from that of a single pier due to nonlinearity and interaction between different phenomena. Consequently, the results of the flow pattern around a single pier cannot be generalized to a bridge pier cluster.H. K. Jalal and W. H. Hassan [
27] conducted a numerical investigation of the problem of localized scour around a circular bridge pier using the FLOW-3D model. The results were compared with those of the experimental model of Melville Laboratory. The findings indicated that the proposed Flow-3D model was an effective tool for predicting and simulating scour depths around bridge piers and an economical method for predicting the potential outcomes.Man, C., In a subsequent study, et al. [
28] investigated the impact of distinct turbulence modes on the formation of bridge pier scour pits within the Flow-3D software. The simulated scour results were found to diverge significantly from the observed data collected from previous literature, due to the non-applicability of the meshing method in the Flow-3D software.
Due to the high computational effort required for 3D numerical simulations, they are predominantly employed for laboratory-scale studies and are primarily conducted on a limited number of bridge piers (1-2). In contrast to laboratory-scale studies, real bridges tend to have large spans, a large number of piers, and the length of the river section affected is much larger than the laboratory scale. In order to accurately reflect the impact of real bridges on water movement, numerous scholars have conducted related studies utilising two-dimensional mathematical models with a greater applicability area and superior computational economy. Cetina and Mario Krzyk [
29] employed the two-dimensional depth-averaged mathematical model, PCFLOW2D, on a 600 m-long river segment. The investigation examined the alterations to the velocity field and free surface elevation resulting from the design piers of a new bridge. Some local flow details, such as the rise of upstream water level and the increase of velocity between the piers, were accurately predicted. J. G. Duan [
30] employed a two-dimensional depth-averaged hydrodynamic model to simulate the flow field around a circular bridge pier in clear water. The two-dimensional model not only simulated vortex shedding in the turbulent wake, but also simulated the distribution of bed shear stress. The simulated bed shear stress contours are in close agreement with experimental measurements and three-dimensional (3D) modelling results. The 2D model is considerably more straightforward than the 3D model and requires a much shorter computational time, which suggests that the enhanced 2D model is an effective tool for simulating the bed shear stress distribution around bridge piers. W. Wang, et al. [
31] investigated the impact of bridge piers on the flood hazard of the Jialing River using the 2D numerical model Mike 21 FM. A comparison of the numerical results with and without bridge piers enabled the analysis of the influence of the backwater effect on the flow field.
X. Zhang et al. [
32] constructed a hydrodynamic model based on MIKE21, taking elliptical bridge piers as an example, and applied it to the numerical simulation of the hydrodynamics of the river downstream of the Yellow River. This simulation examined the influence of changes in the morphology of the bridge piers on the river flow rate, water level and flow field. In a similar vein, H. Xiong, et al. [
33] employed the MIKE 21 hydrodynamic module and transportation module to investigate the hydrodynamics and water quality of the Wuhan river section under varying pier densities. Z. Sun et al. [
34] employed the Deflt3D mathematical model to conduct a series of numerical experiments on the flow field of the estuary of the Qiantang River under various combinations of single and multiple bridges. This was done in order to investigate the complex response of tidal currents to multiple bridges. C. Xiaocen et al. [
35] also employed the Deflt3D model to investigate the flow field of the Ningbo River under different combinations of single and multiple bridges. This was done in order to investigate the complex response of tidal currents to multiple bridges. C. Xiaocen, et al. [
35] established a two-dimensional non-constant flow mathematical model of the Yongjiang River in order to study the influence of the built bridges on flood control and tidal flow. The Delft3D model was employed to determine and verify parameter rates, which were then used to conduct a study on the influence of the bridges on the Yongjiang River's flow rate and water level under typical flood and tidal conditions. C. Jun, et al. [
36] conducted a study on the cumulative effects of bridge and pier groups on river flooding under typical flood and tide conditions based on the Delft3D mathematical model. The study compared the effects of single-type and two-type engineering groups on the flood level and flow rate of the river. A. Abdou, et al. [
37] employed the Delft3D mathematical model to simulate a straight river channel and investigate the effects of different configurations (i.e., the number of bridge piers, the span characteristics, and the different reach characteristics) on the flow rate and water level of the Ningbo River. The characteristics, number of piers, and different reach locations of bridge pier clusters in a river cross-section were investigated for their influence on the morphodynamics. The study focuses on sandy lowland rivers that exhibit stable alternating bars and low Froude numbers.
The majority of researchers engaged in these two-dimensional numerical simulations utilise a single computational grid cell to simulate a bridge pier. This method contravenes the recommendations set out in the majority of user manuals.These manuals stipulate that a minimum of five grid cells are required to accurately capture a hydrodynamic feature. Furthermore, some scholars have proposed the use of adjusting the local roughness or local topography of the riverbed as a method for the treatment of bridge piers [
35,
36]. The aforementioned treatments do not accurately reflect the complex water movement in the vicinity of the bridge pier, nor do they guarantee the reliability of the long-term cumulative effects of phenomena such as local scour.
For this reason, this study employs the Delft3D software, which is based on the measured data, and takes the computational accuracy and computational efficiency as the criteria. Numerical experiments were carried out and compared and analysed for a variety of schemes for numerical simulation of bridge pier winding flow. An optimised scheme was proposed, and the optimised scheme was applied to an engineering example to prove the feasibility of the scheme. The findings of this study can serve as a reference point for future scientific research and engineering design projects.
3. Mathematical Model and Calculation Scheme
3.1. Mathematical Model
3.1.1. Governing Equations
In this paper, Delft3D software is used for two-dimensional numerical simulation. The software plane adopts orthogonal curve coordinate system, and the vertical direction adopts σ coordinate transformation. The control equation is as follows.
The σ co-ordinate system is defined as:
with:
z:the vertical co-ordinate in physical space.
ζ:the free surface elevation above the reference plane.
d:the depth below the reference plane.
H:the total water depth。
The depth-averaged continuity equation:
with
and
the transformation coefficients from rectangular coordinates to curvilinear coordinates in the ξ-and η-direction respectively.With U and V the depth averaged velocities
And Q representing the contributions per unit area due to the discharge or withdrawal of water,precipitation and evaporation[M1] :
With and the local sources and sinks of water per unit of volume [1/s],respectively.P the non-local source term of precipitation and E non-local sink term due to evaporation.
The momentum equations in ξ- and η-direction are given by:
With:
: the vertical eddy viscosity coefficient;
:the Coriolis parameter,1/s;
:the reference density of water,kg/m3;
、:the pressure gradients in ξ- and η-direction,kg/(m2s2);
、:the unbalance of horizontal Reynold’s stresses in ξ- and η-direction,m/s2.
、:the contributions due to external sources or sinks of momentum in ξ- and η-direction,m/s2。
3.1.2. Mathematical Model Parameters
The flume mathematical model simulation range is the effective working section of the flume, which is a rectangular area with a length of 12.0m, a width of 0.42m, a height of 0.48m, and a cylindrical pier with a diameter of 5cm. The model inlet is given the flow boundary Q=20L/s, and the outlet is given the water level boundary H=0.134m.
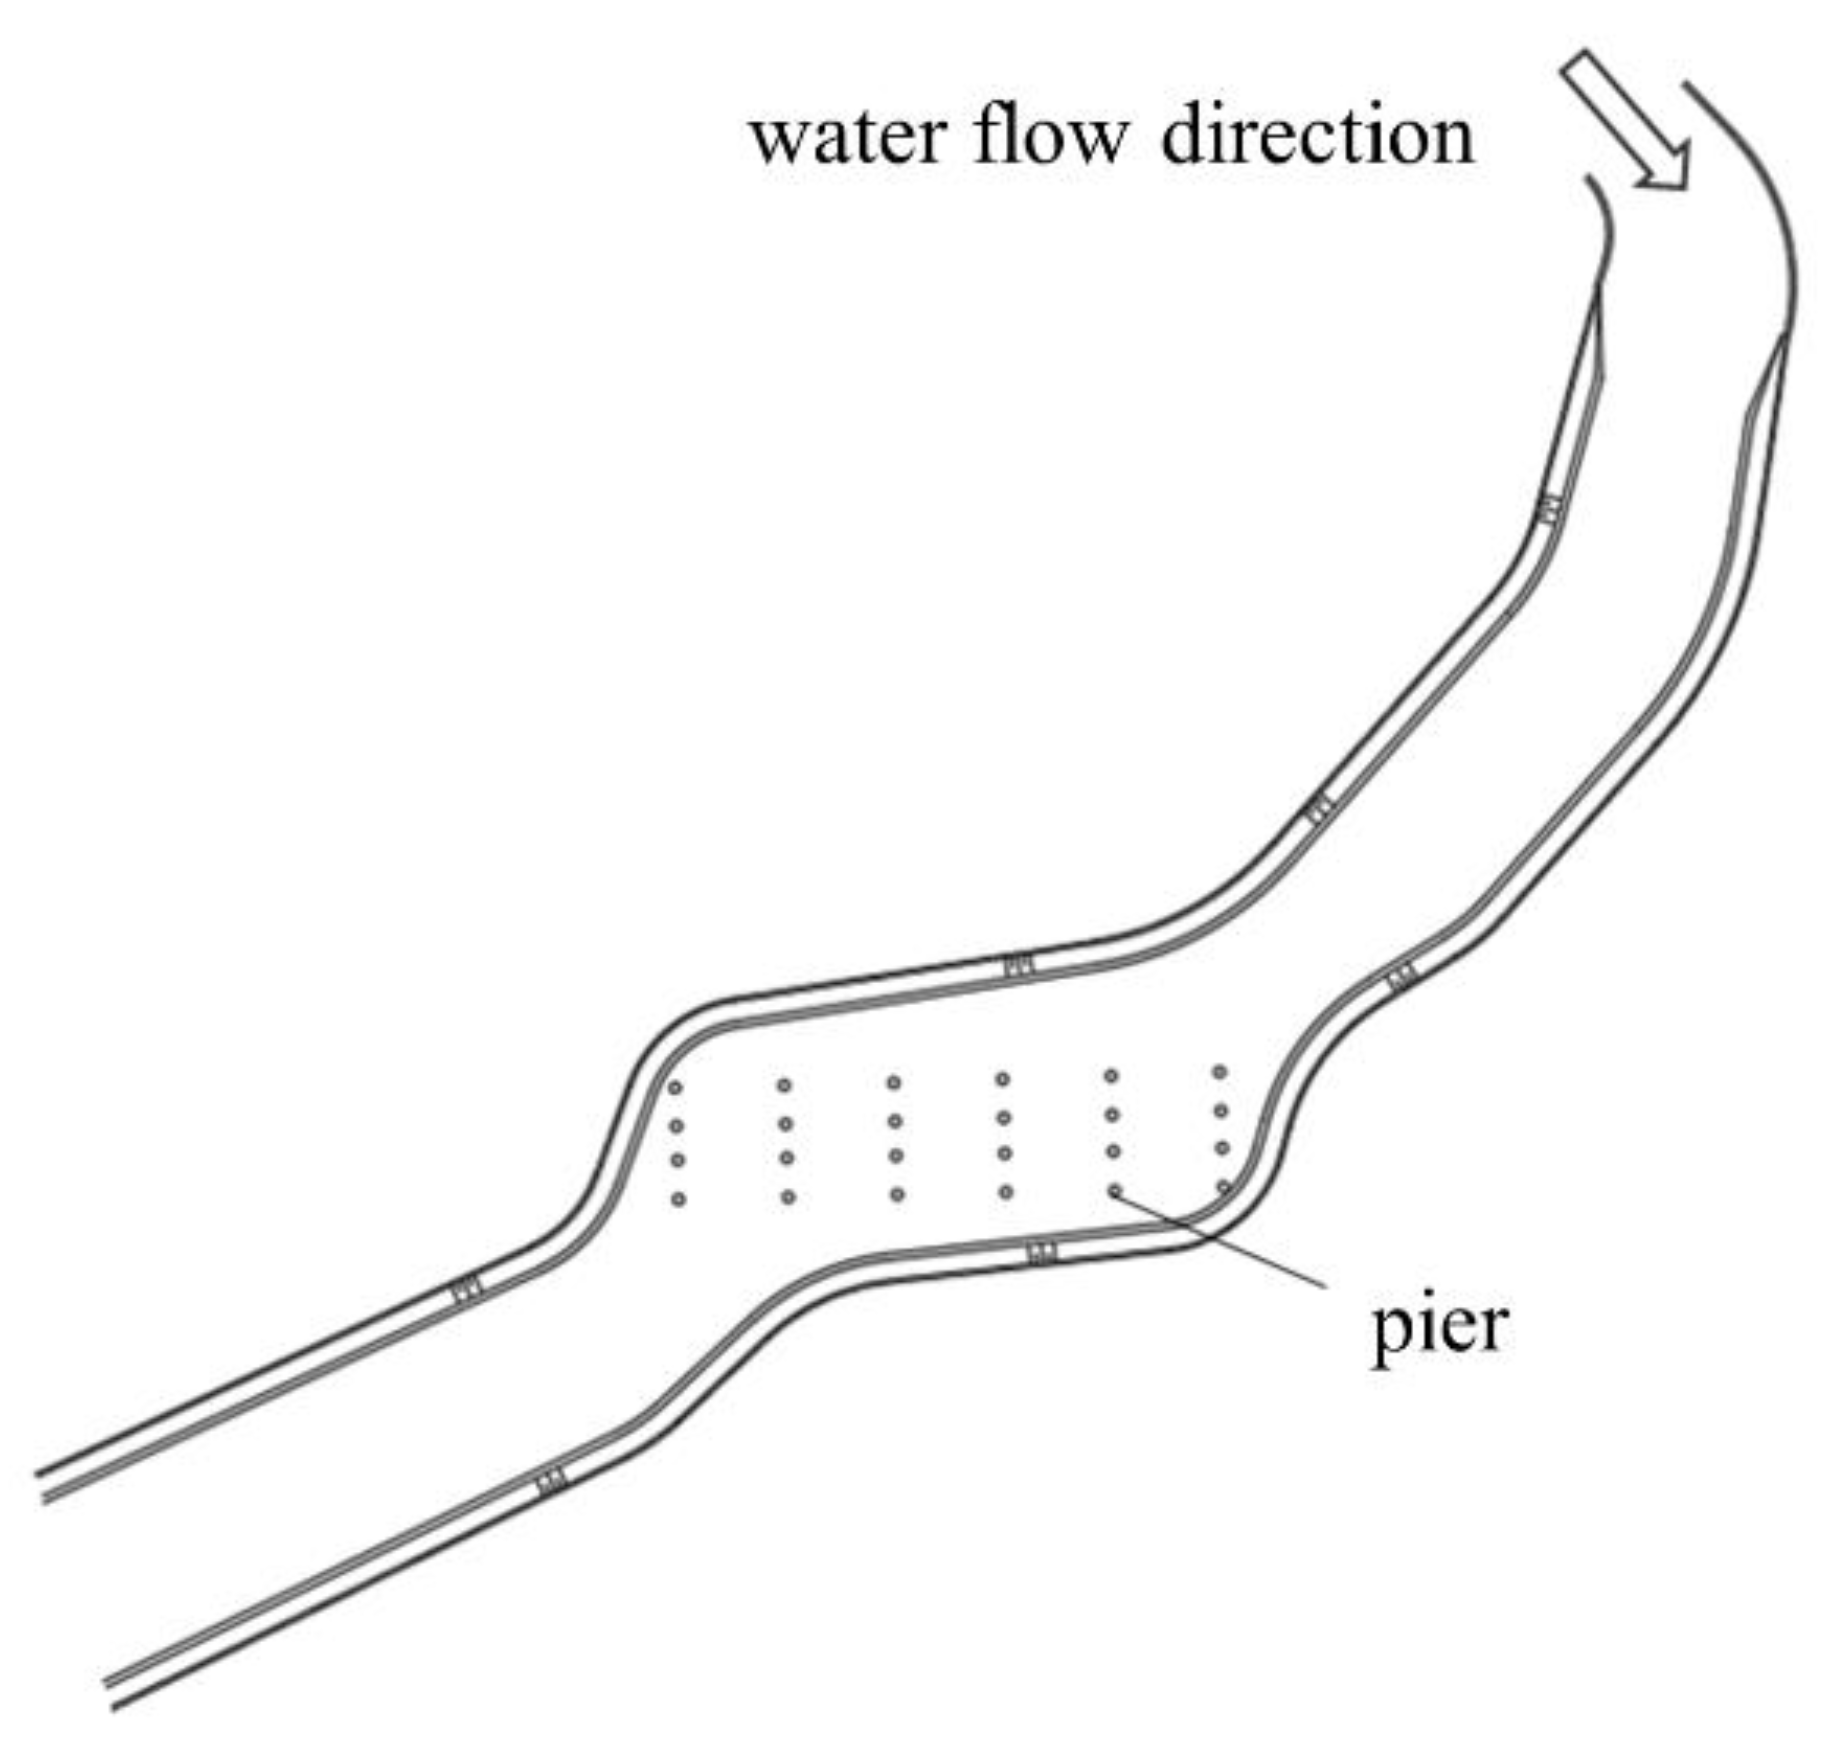
The calculation range of the bridge project is consistent with
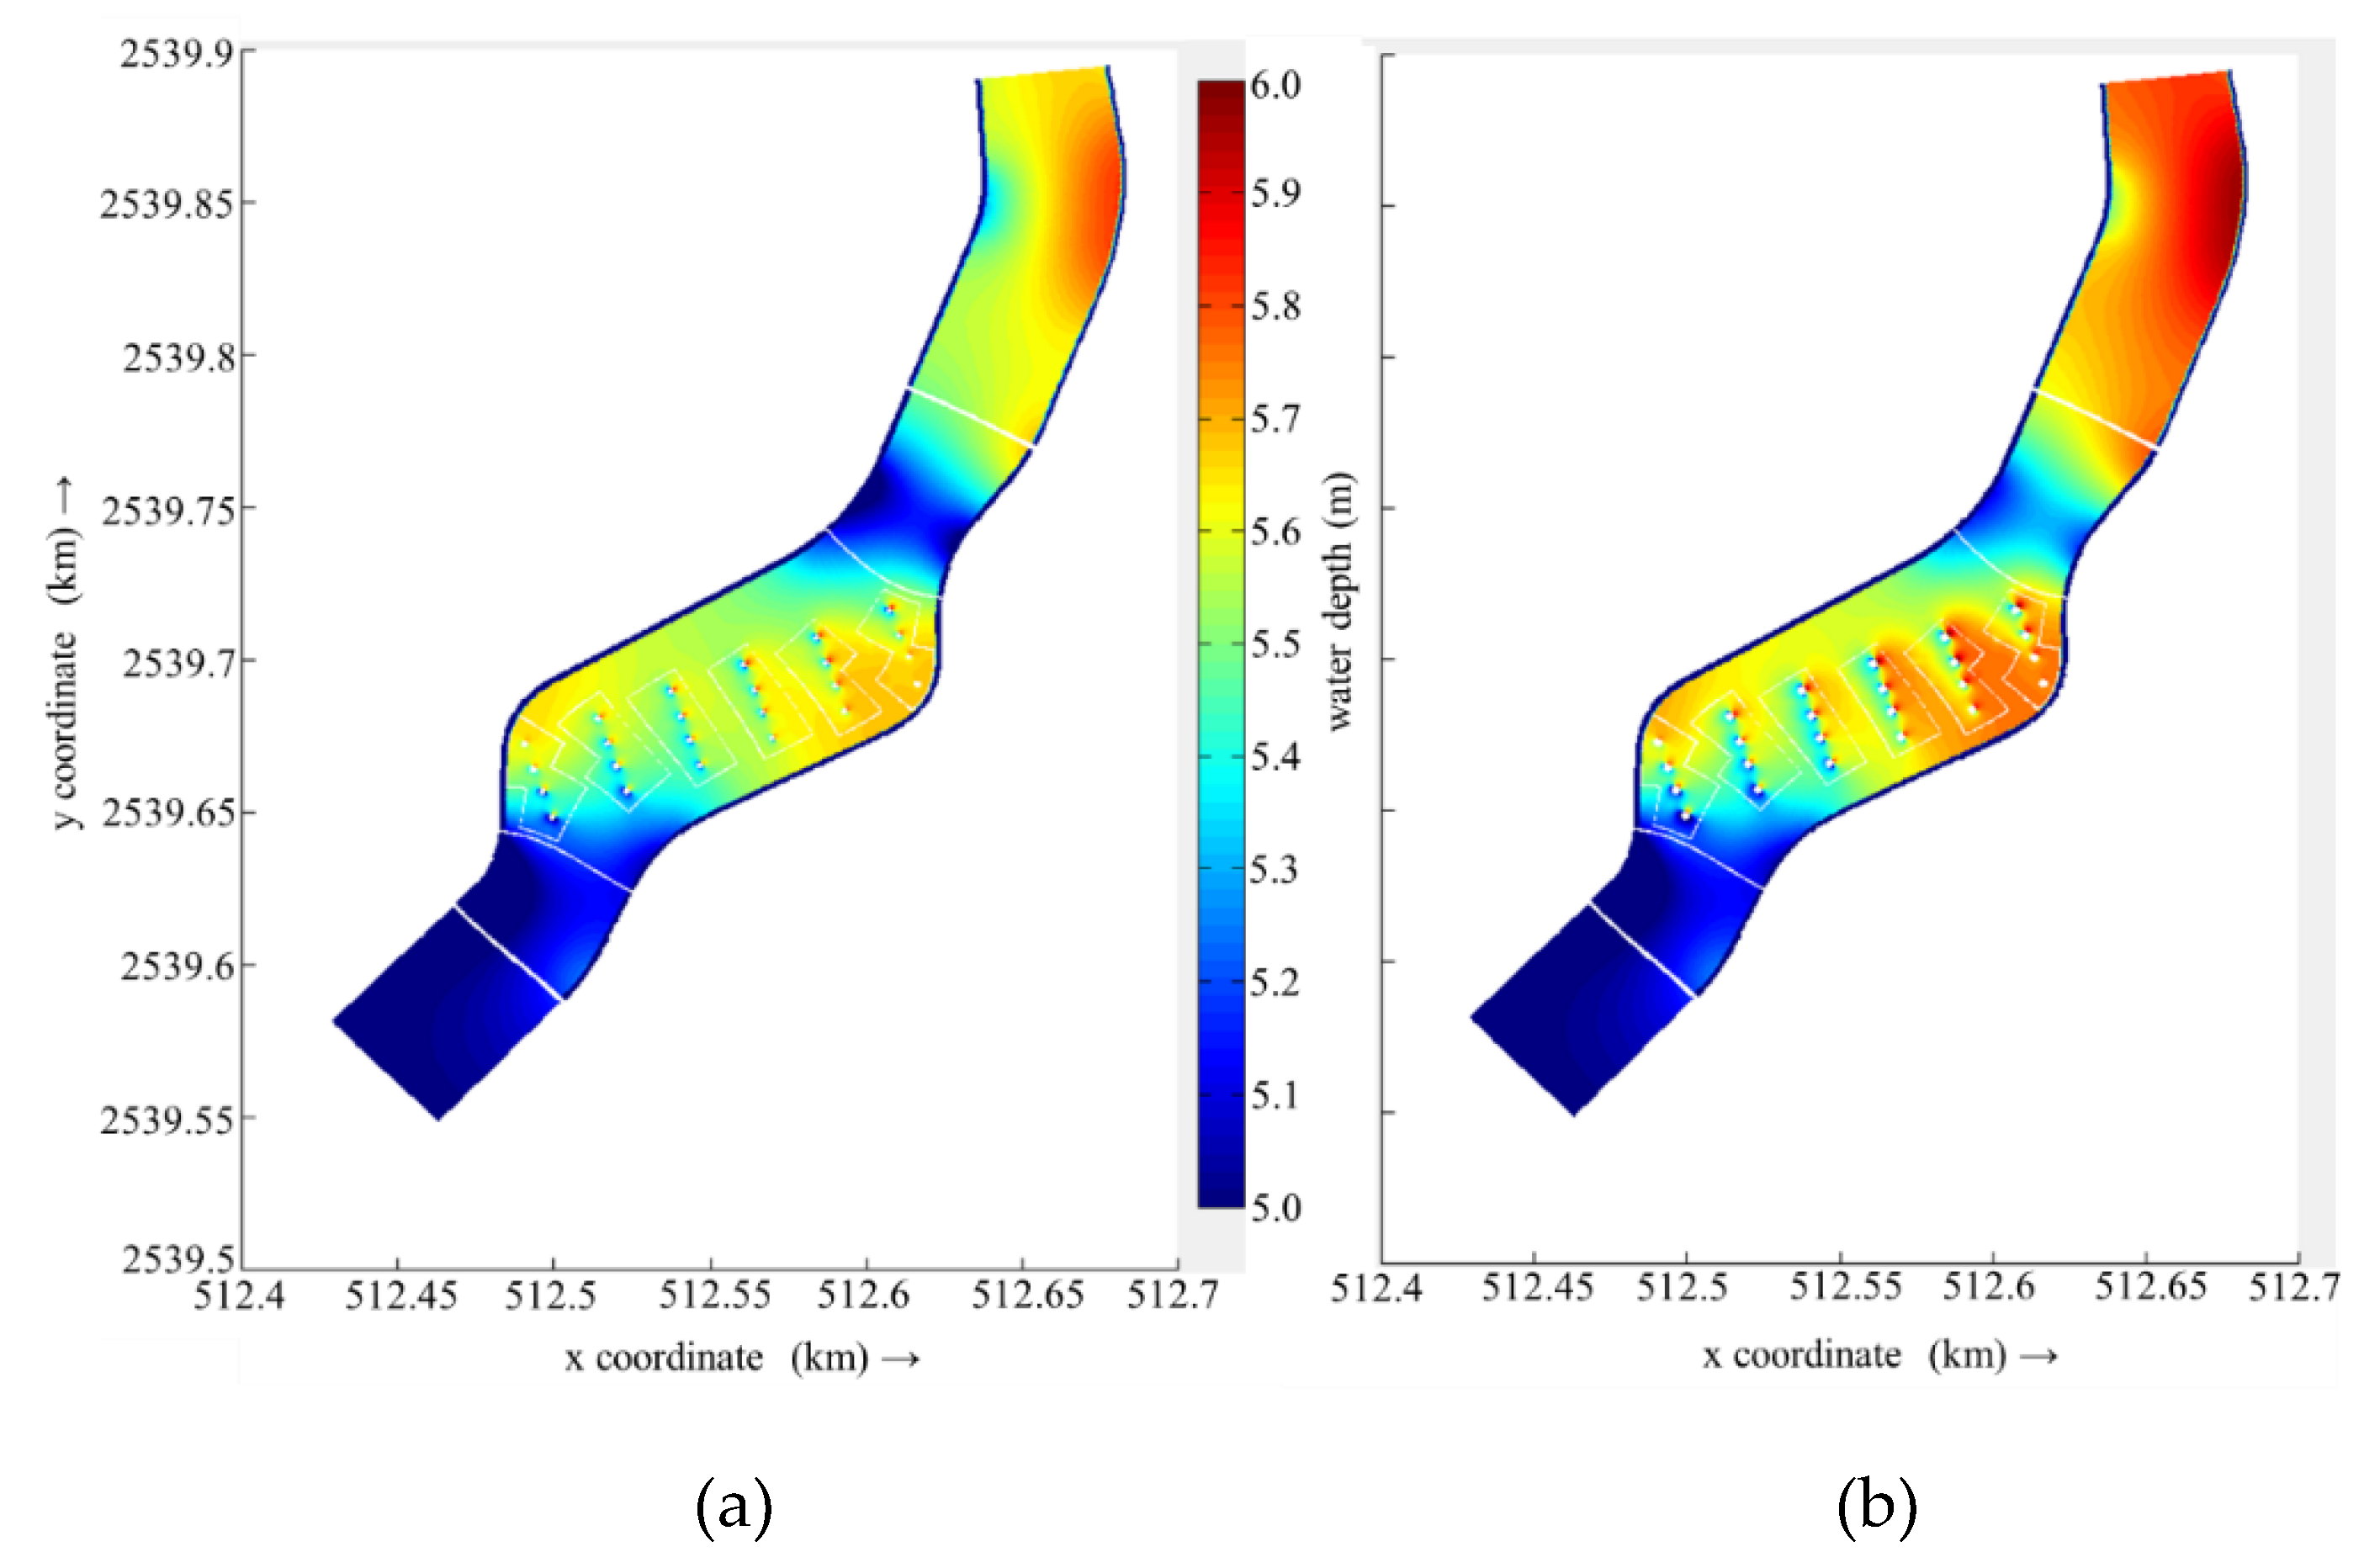
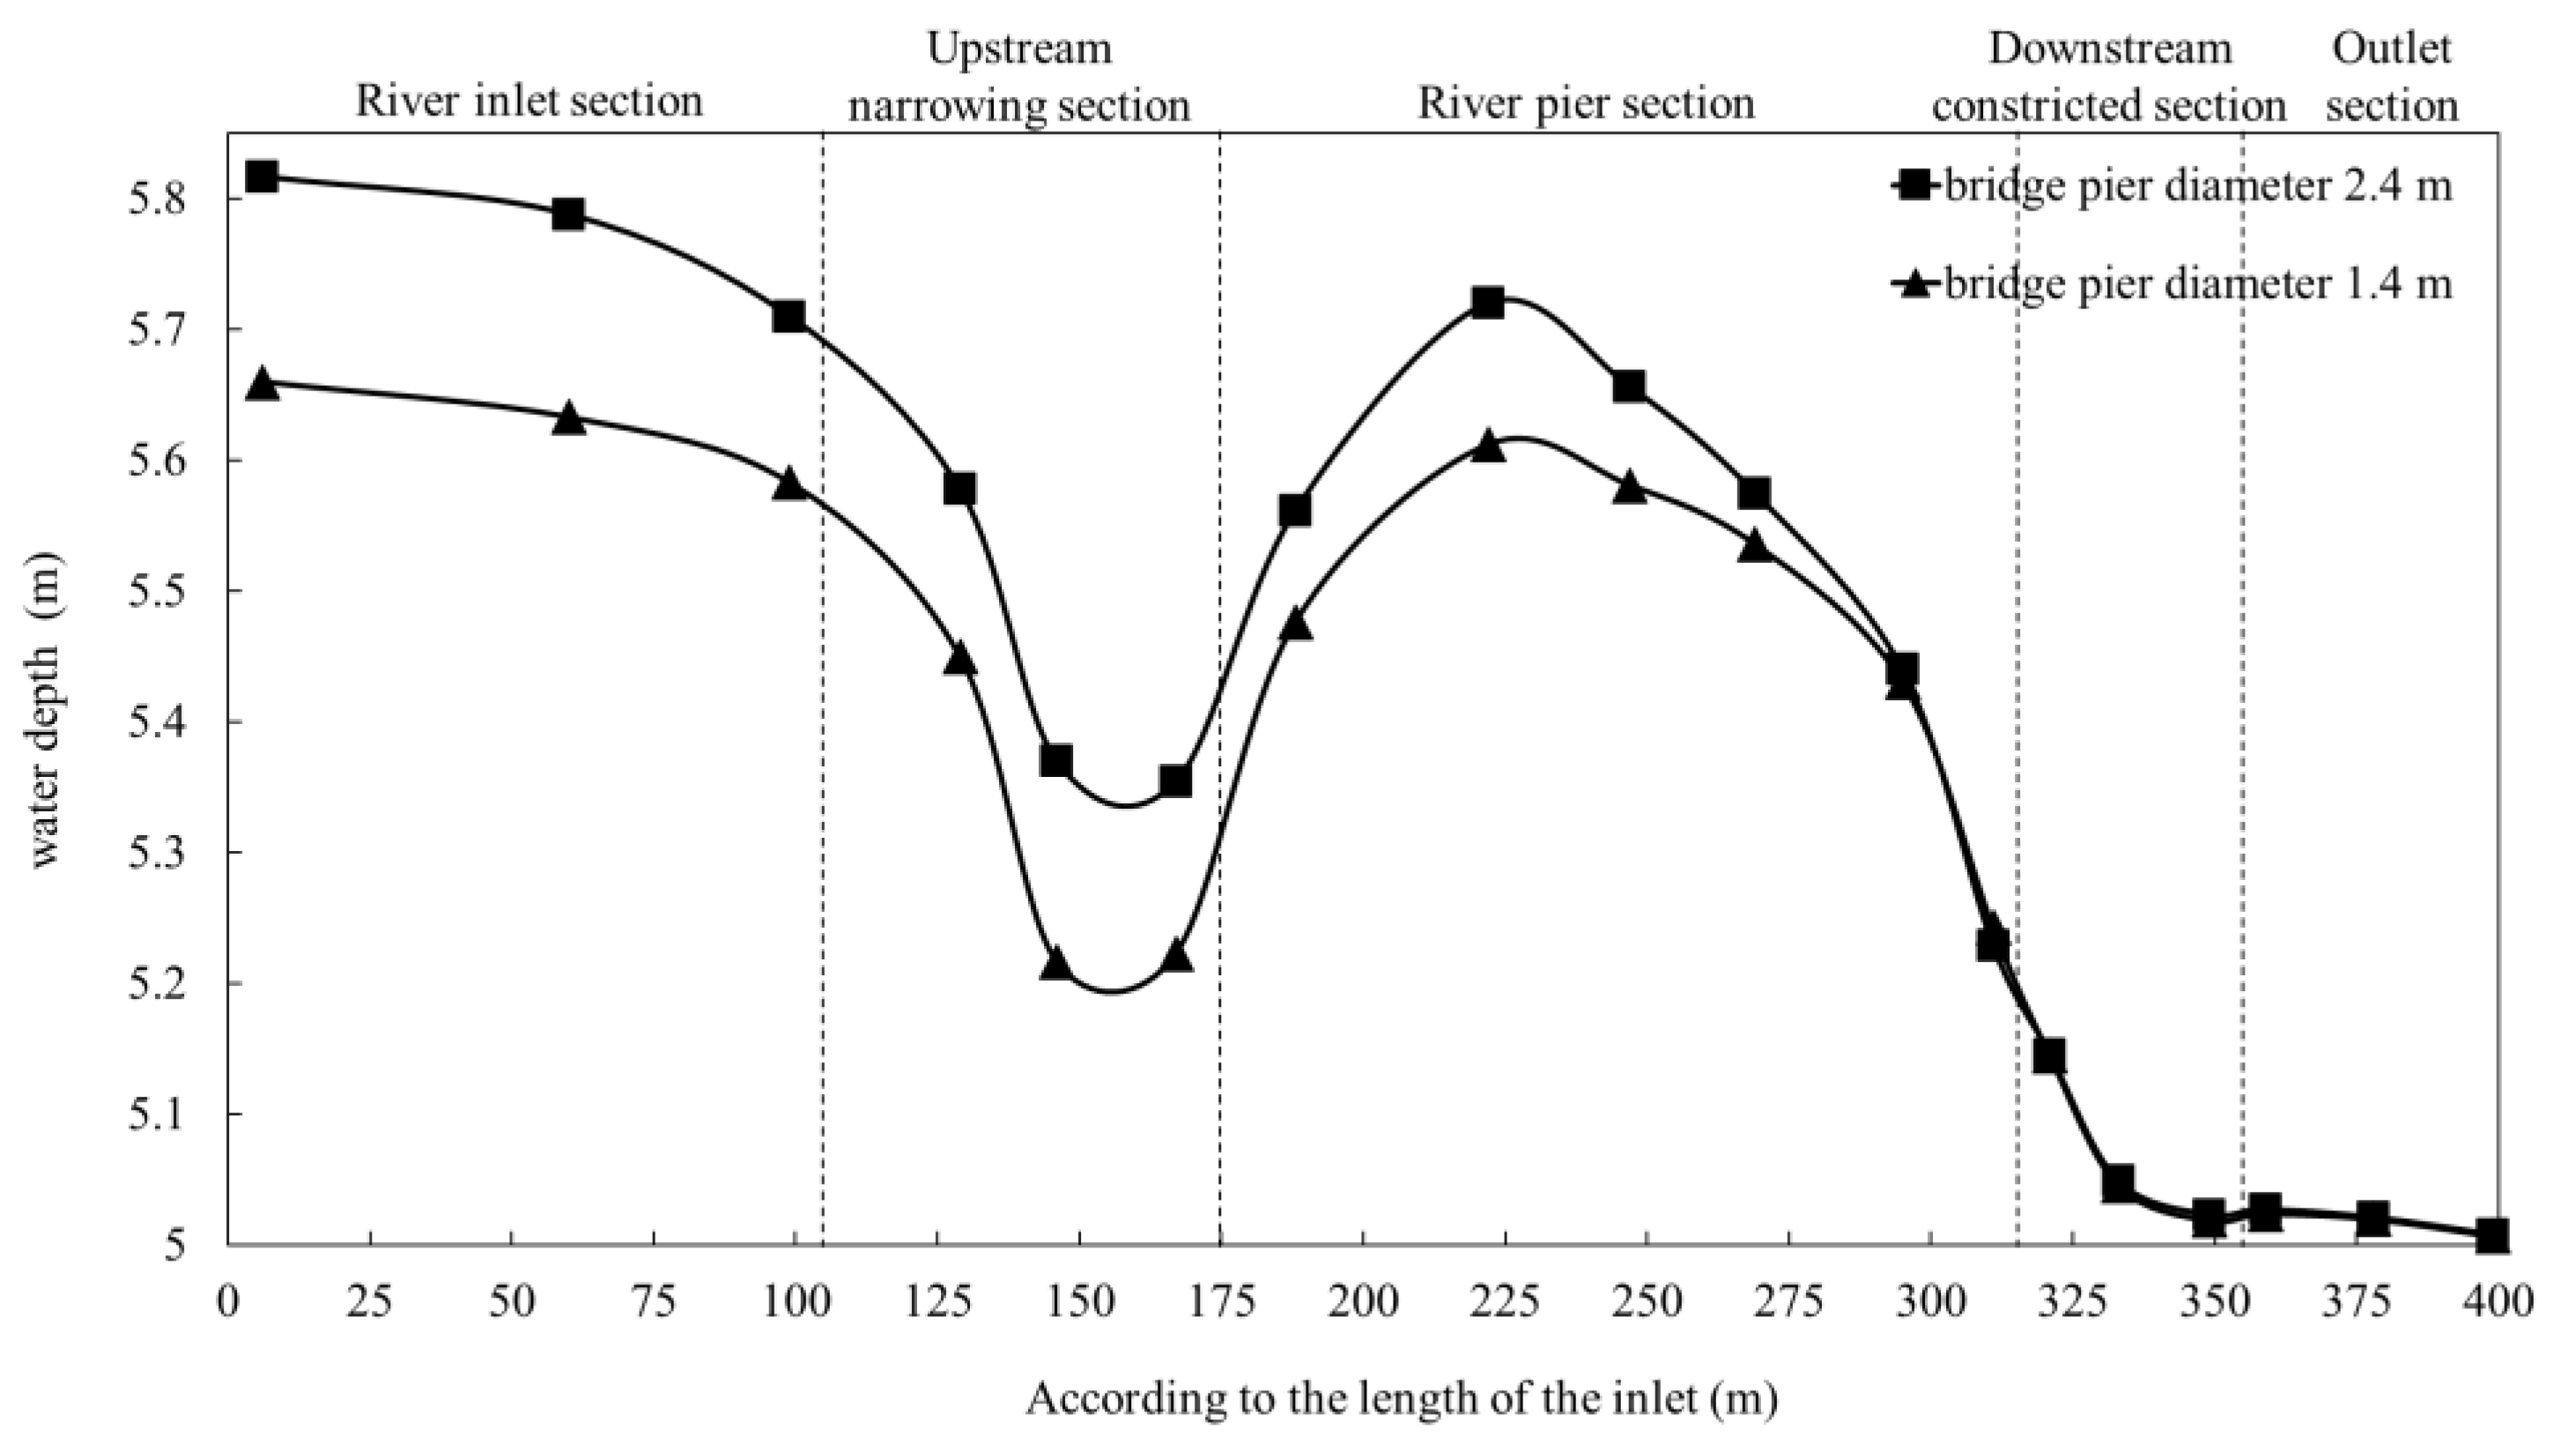
Figure 3. The total length of the river is approximately 1.2 km, the width of the river is 60–80 m, and the riverbed elevation is set according to the measured data. The diameter of the bridge piers was set at 1.4m prior to engineering modification and 2.4m following the latter. The upstream boundary of the model is defined by a flow rate of 800 m
3/s, while the downstream boundary is defined by a water level of 47.0 m.
The solid wall and pier surface of the mathematical model are defined by a no-slip boundary and a specified roughness height (ks).
The initial condition of the mathematical model is defined as a cold start condition, with the initial water level, h0, specified.
3.2. Mesh-Independent Analysis
In order to obtain a more ideal grid resolution, four groups of different resolution grids (R1, R2, R3, R4) are set up in the numerical simulation. The grid scale is expressed as a proportion of the diameter of the bridge pier Dp, and the specific data are given in
Table 2.
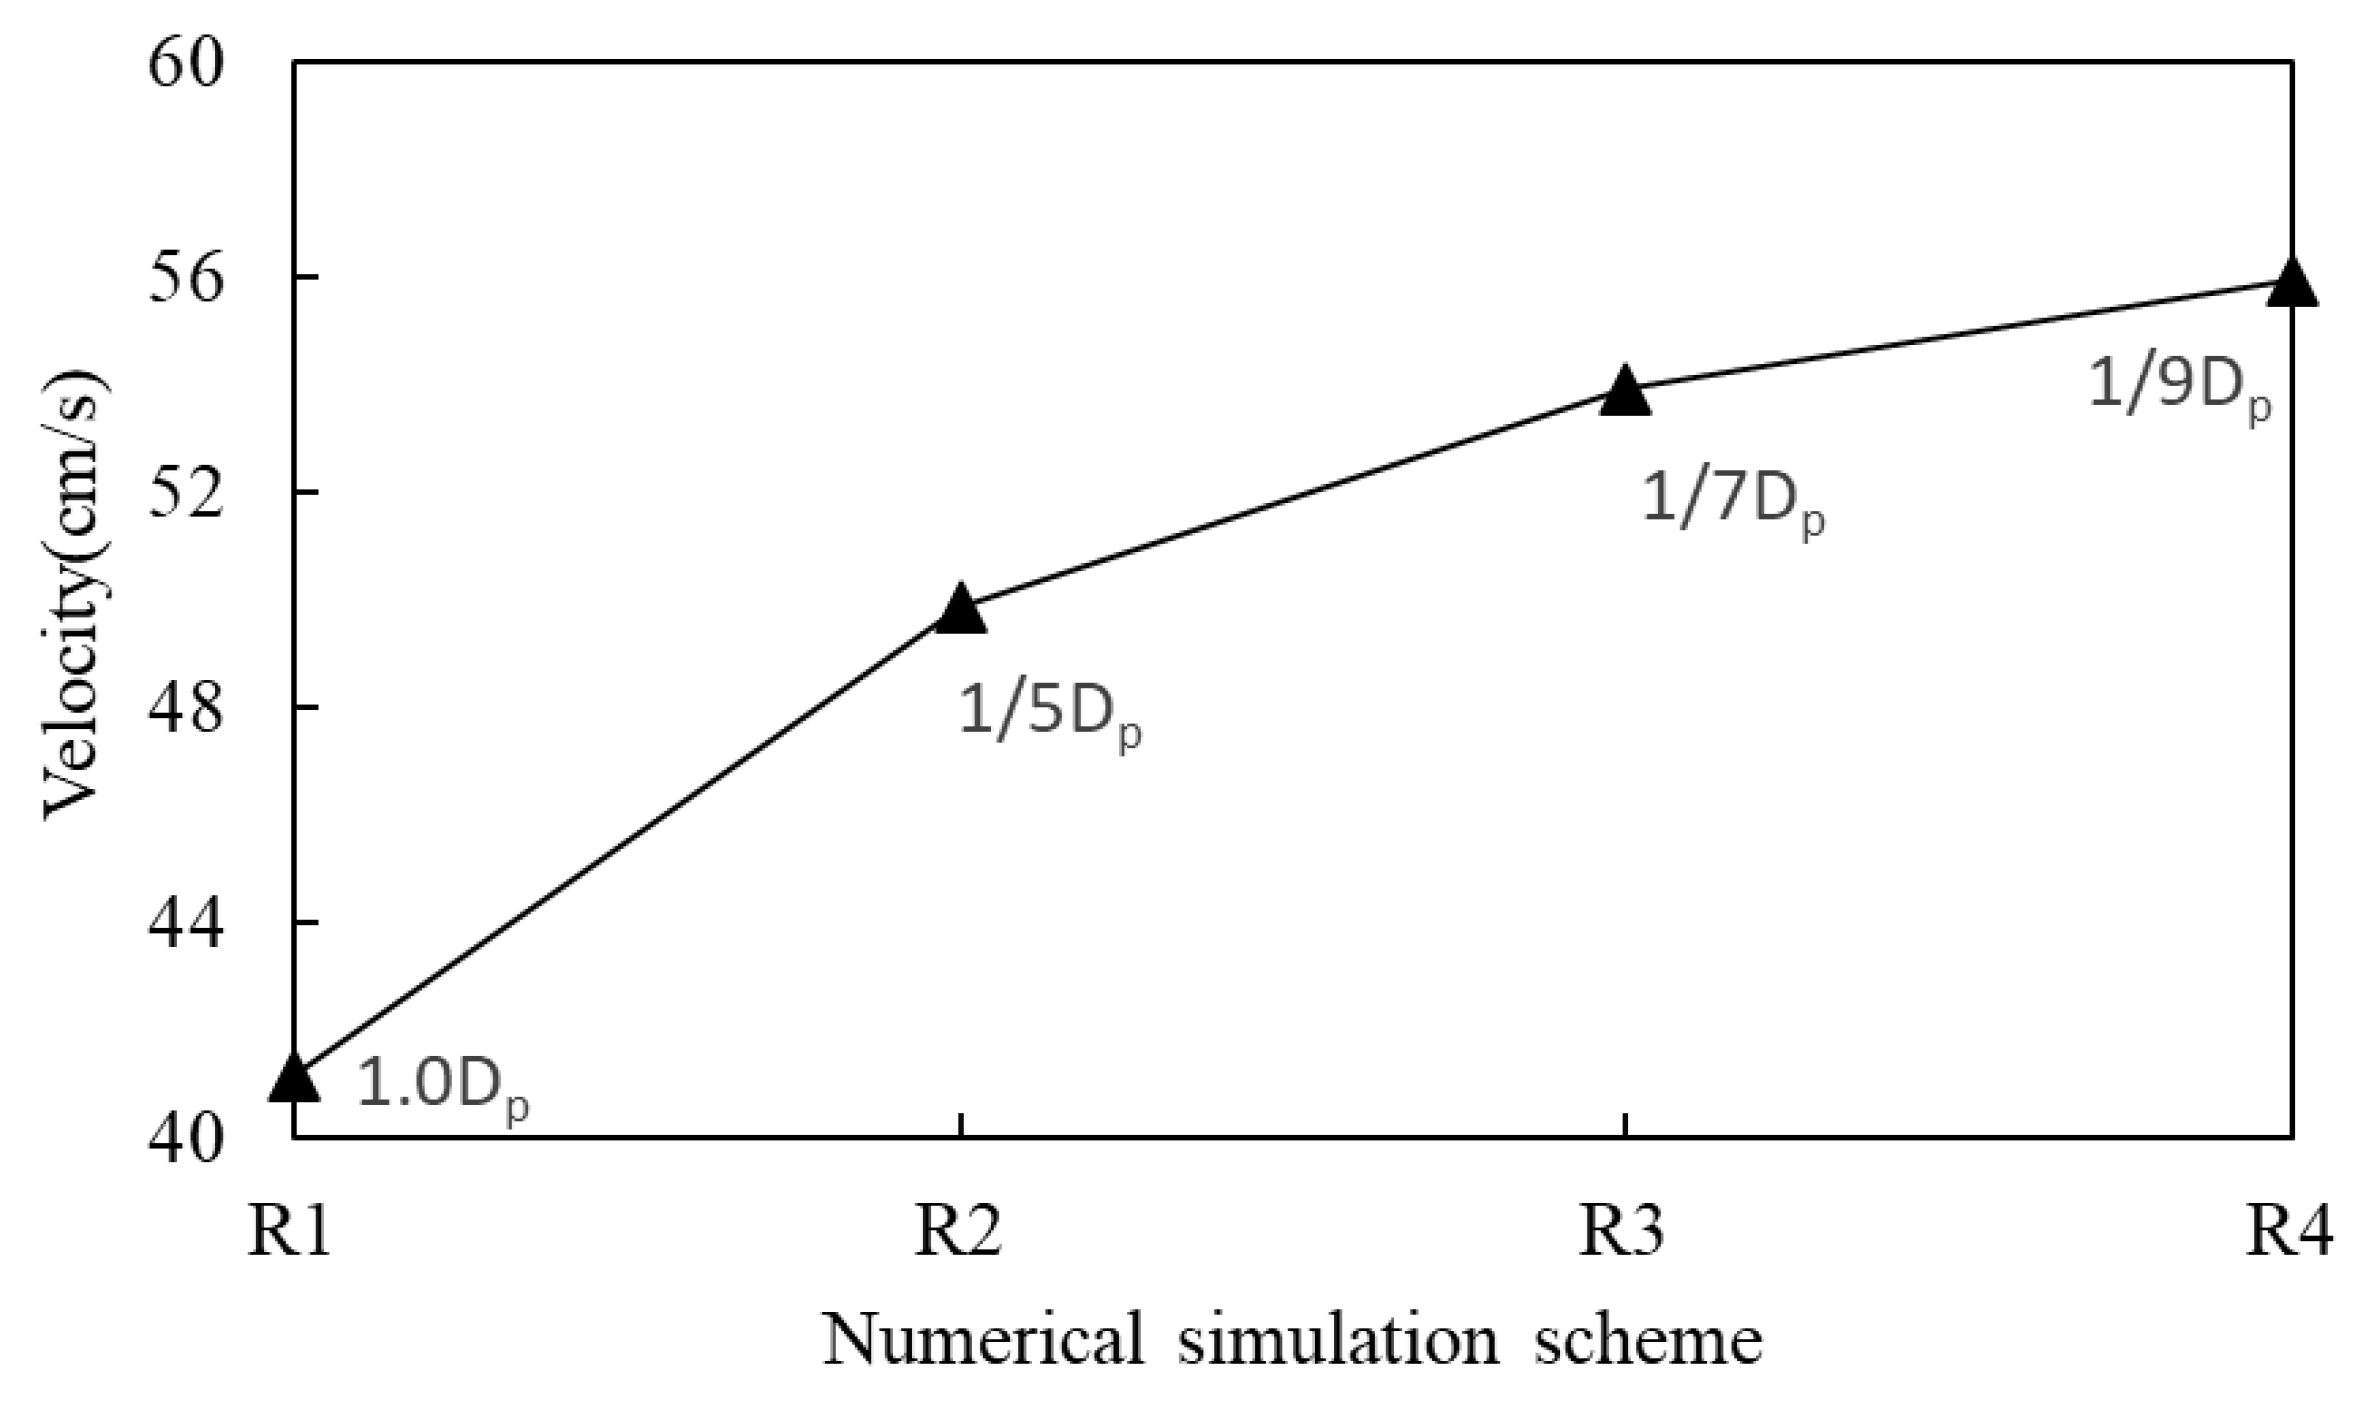
The R1 grid size is Dp, which is the same as the model pier diameter. One grid can approximate the simulation unit pier. The R2 grid size is 1/5Dp, which contains 5 grids within an pier diameter. This is in accordance with the user manual, which suggests that at least 5 grids are needed to capture a feature size. The R3 grid size is 1/7Dp, which contains 7 grids within an pier diameter. Finally, the R4 grid size is 1/9Dp, which contains 9 grids within one pier diameter. Schematic diagrams of the grids for R1 and R4 are provided in
Figure 4 and
Figure 5, respectively.
For each set of grids, numerical simulations were conducted without piers and with a single cylindrical pier, and the results were subjected to analysis.
Table 3 presents the numerical simulation results of the water level in section A-A with varying grid resolutions.
The data presented in the table indicates that when there is no bridge pier in the flume, the water level in section A-A remains consistent across the various grid cell sizes. This result aligns with the physical model outcomes.
When a 5 cm diameter cylindrical pier is set in the flume, there is a significant difference in the numerical simulation results. As the grid cell size is reduced, the numerical calculation error is gradually reduced. When the grid cell size is 1/9Dp, the error is reduced to -0.009 cm.
Figure 6 presents the variation in the maximum flow velocity at different grid cell scales. As the grid resolution is increased, the calculated maximum flow velocity also gradually increases. The change is gradual and smooth. When the cell grid size is 1/9Dp, the maximum flow velocity calculated value is 0.557 m/s, which coincides with the physical model measurements of 0.55 m/s. The location of the emergence of the bridge pier is on both sides of the bridge.
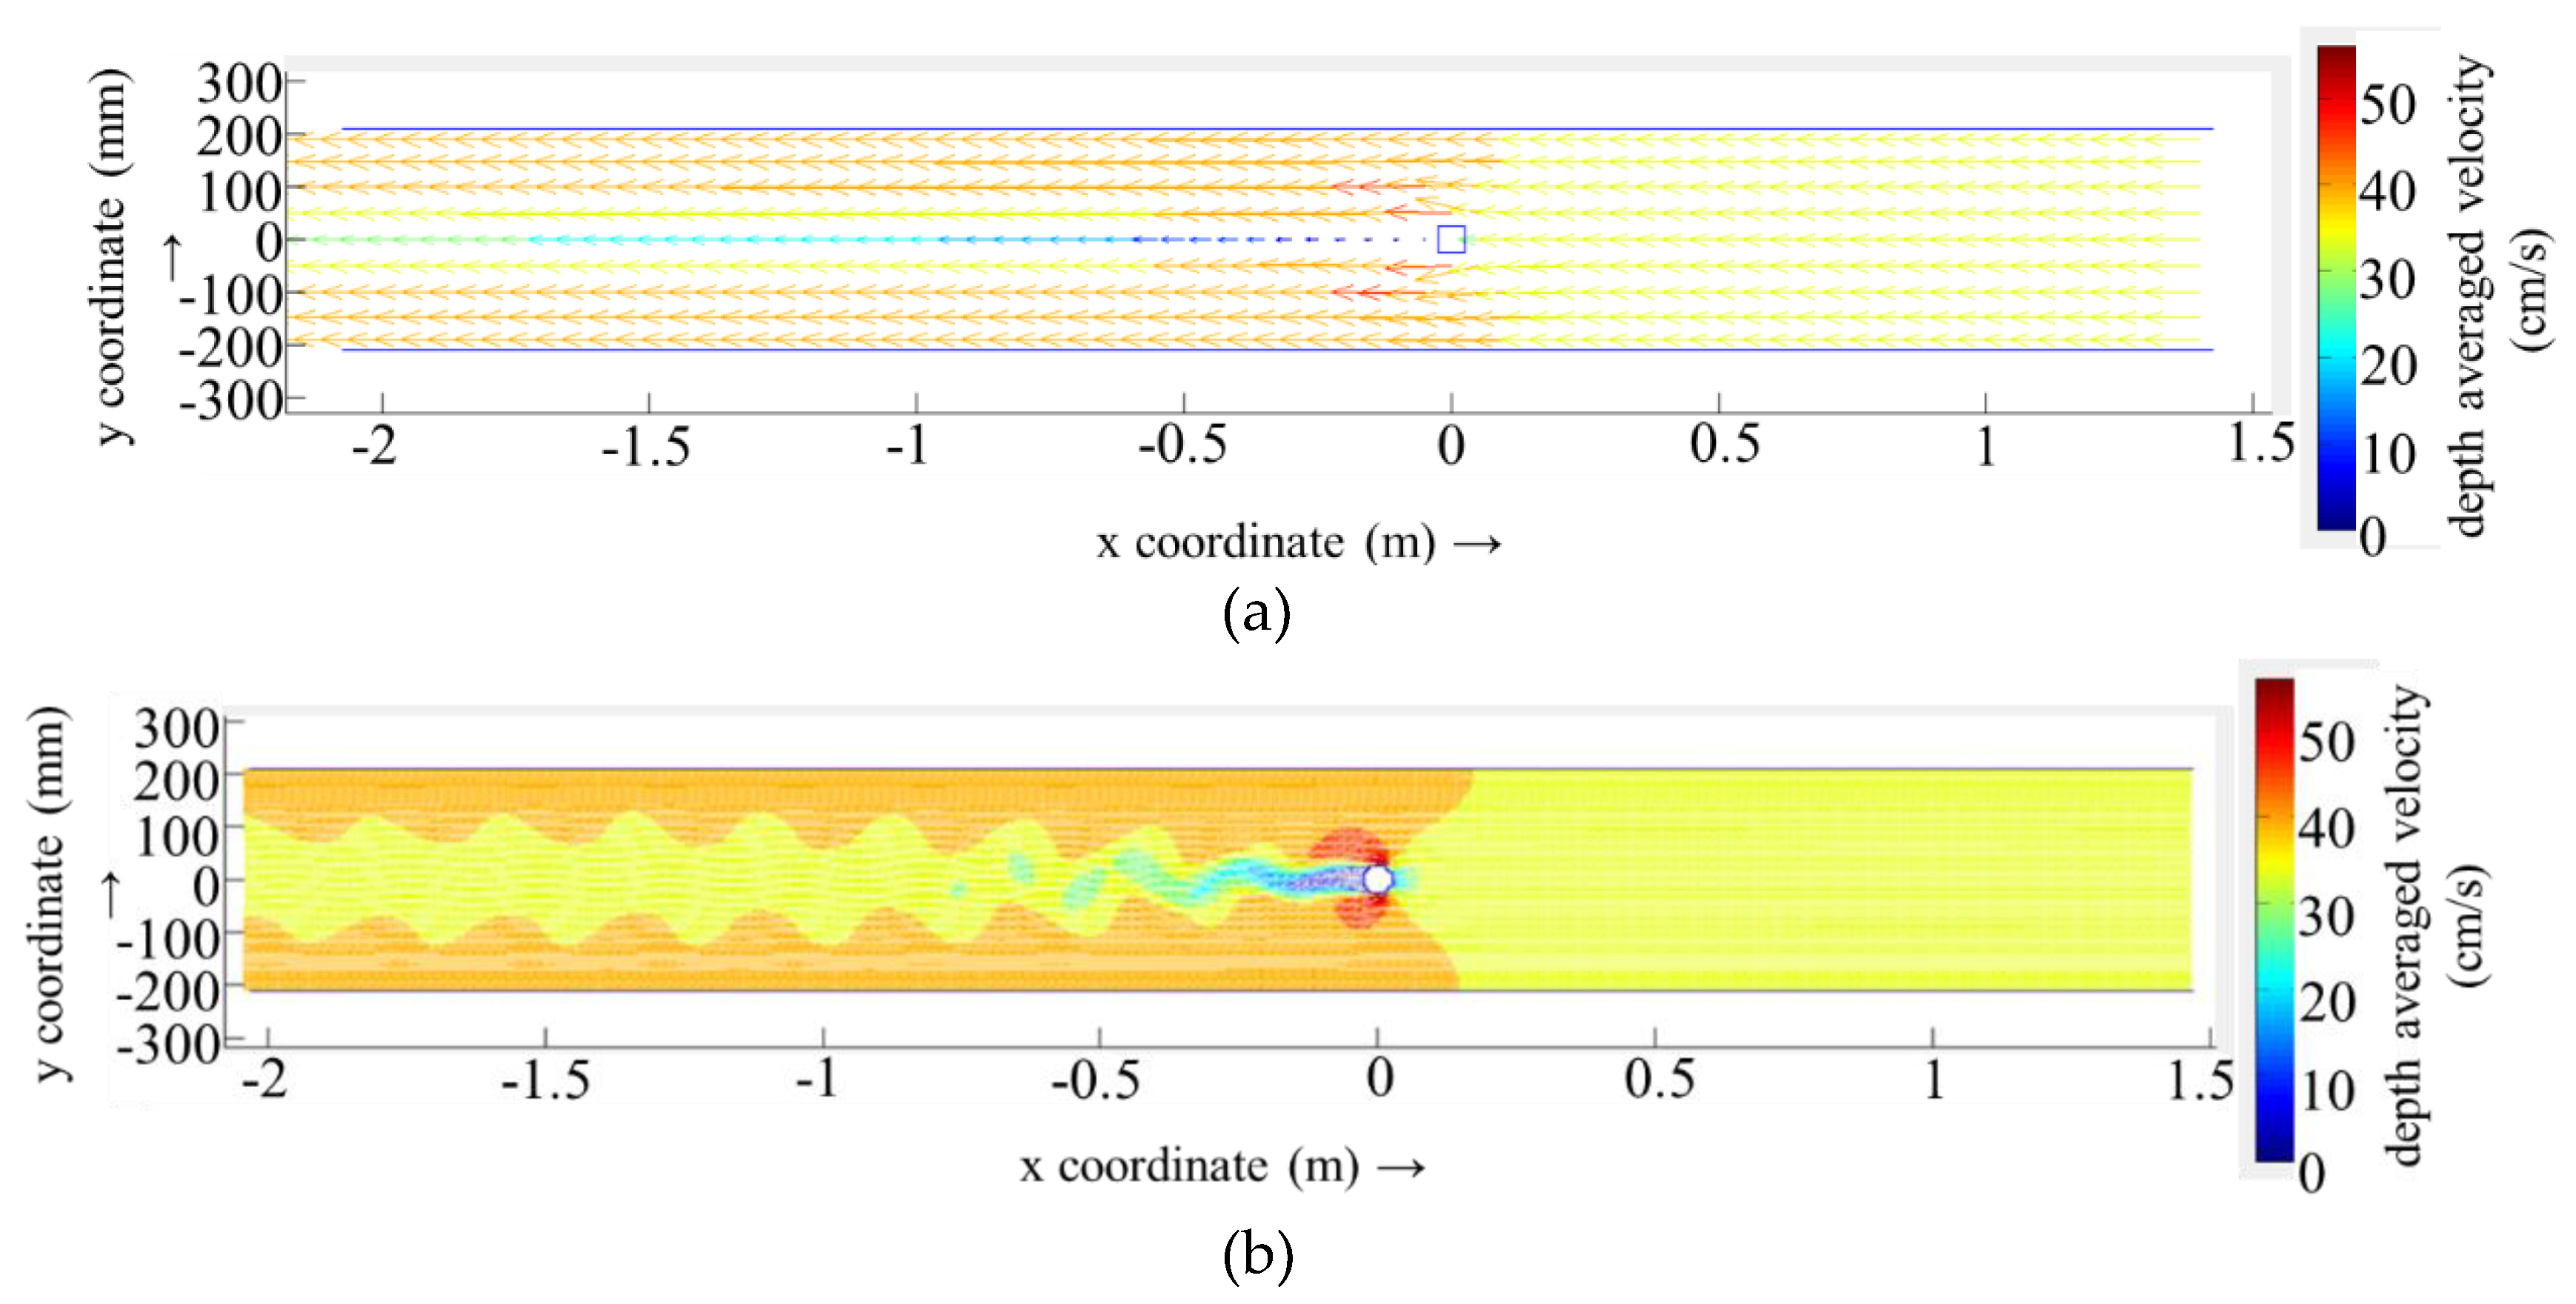
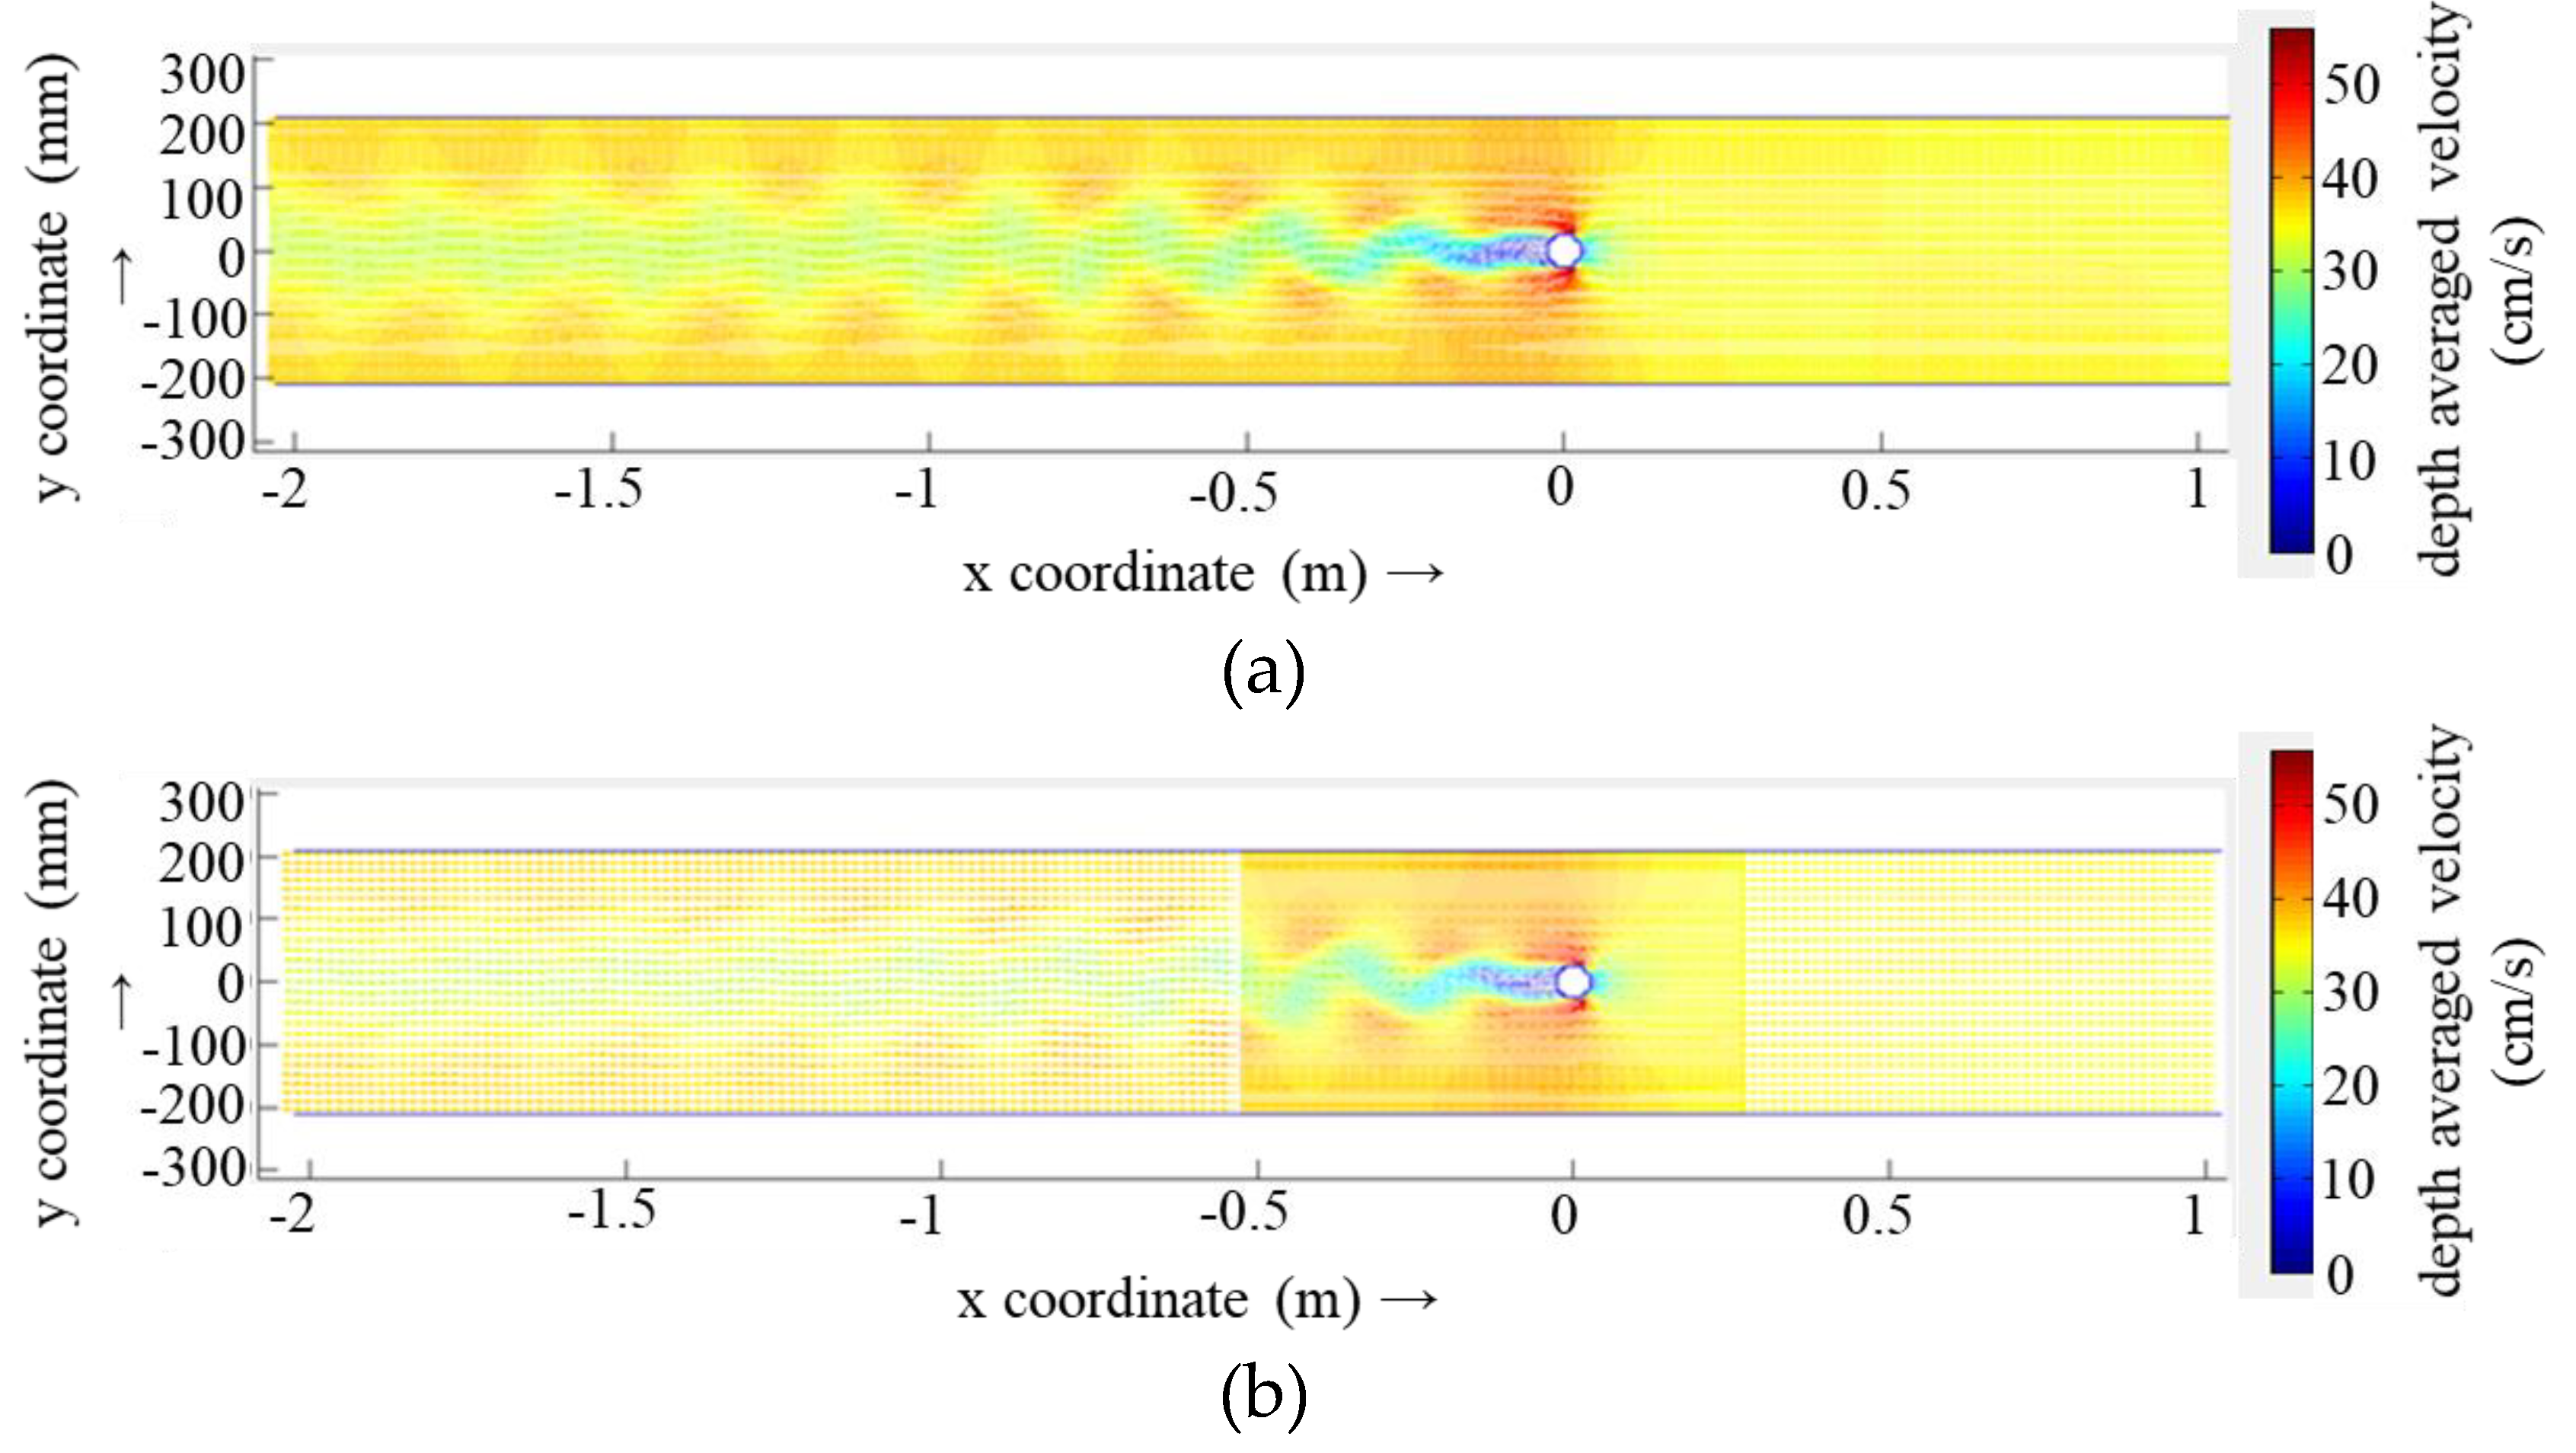
Figure 7 presents the setting of the pier case, R1 and R4 programs, as they pertain to the calculation of the region of the plane water flow pattern. As presented in
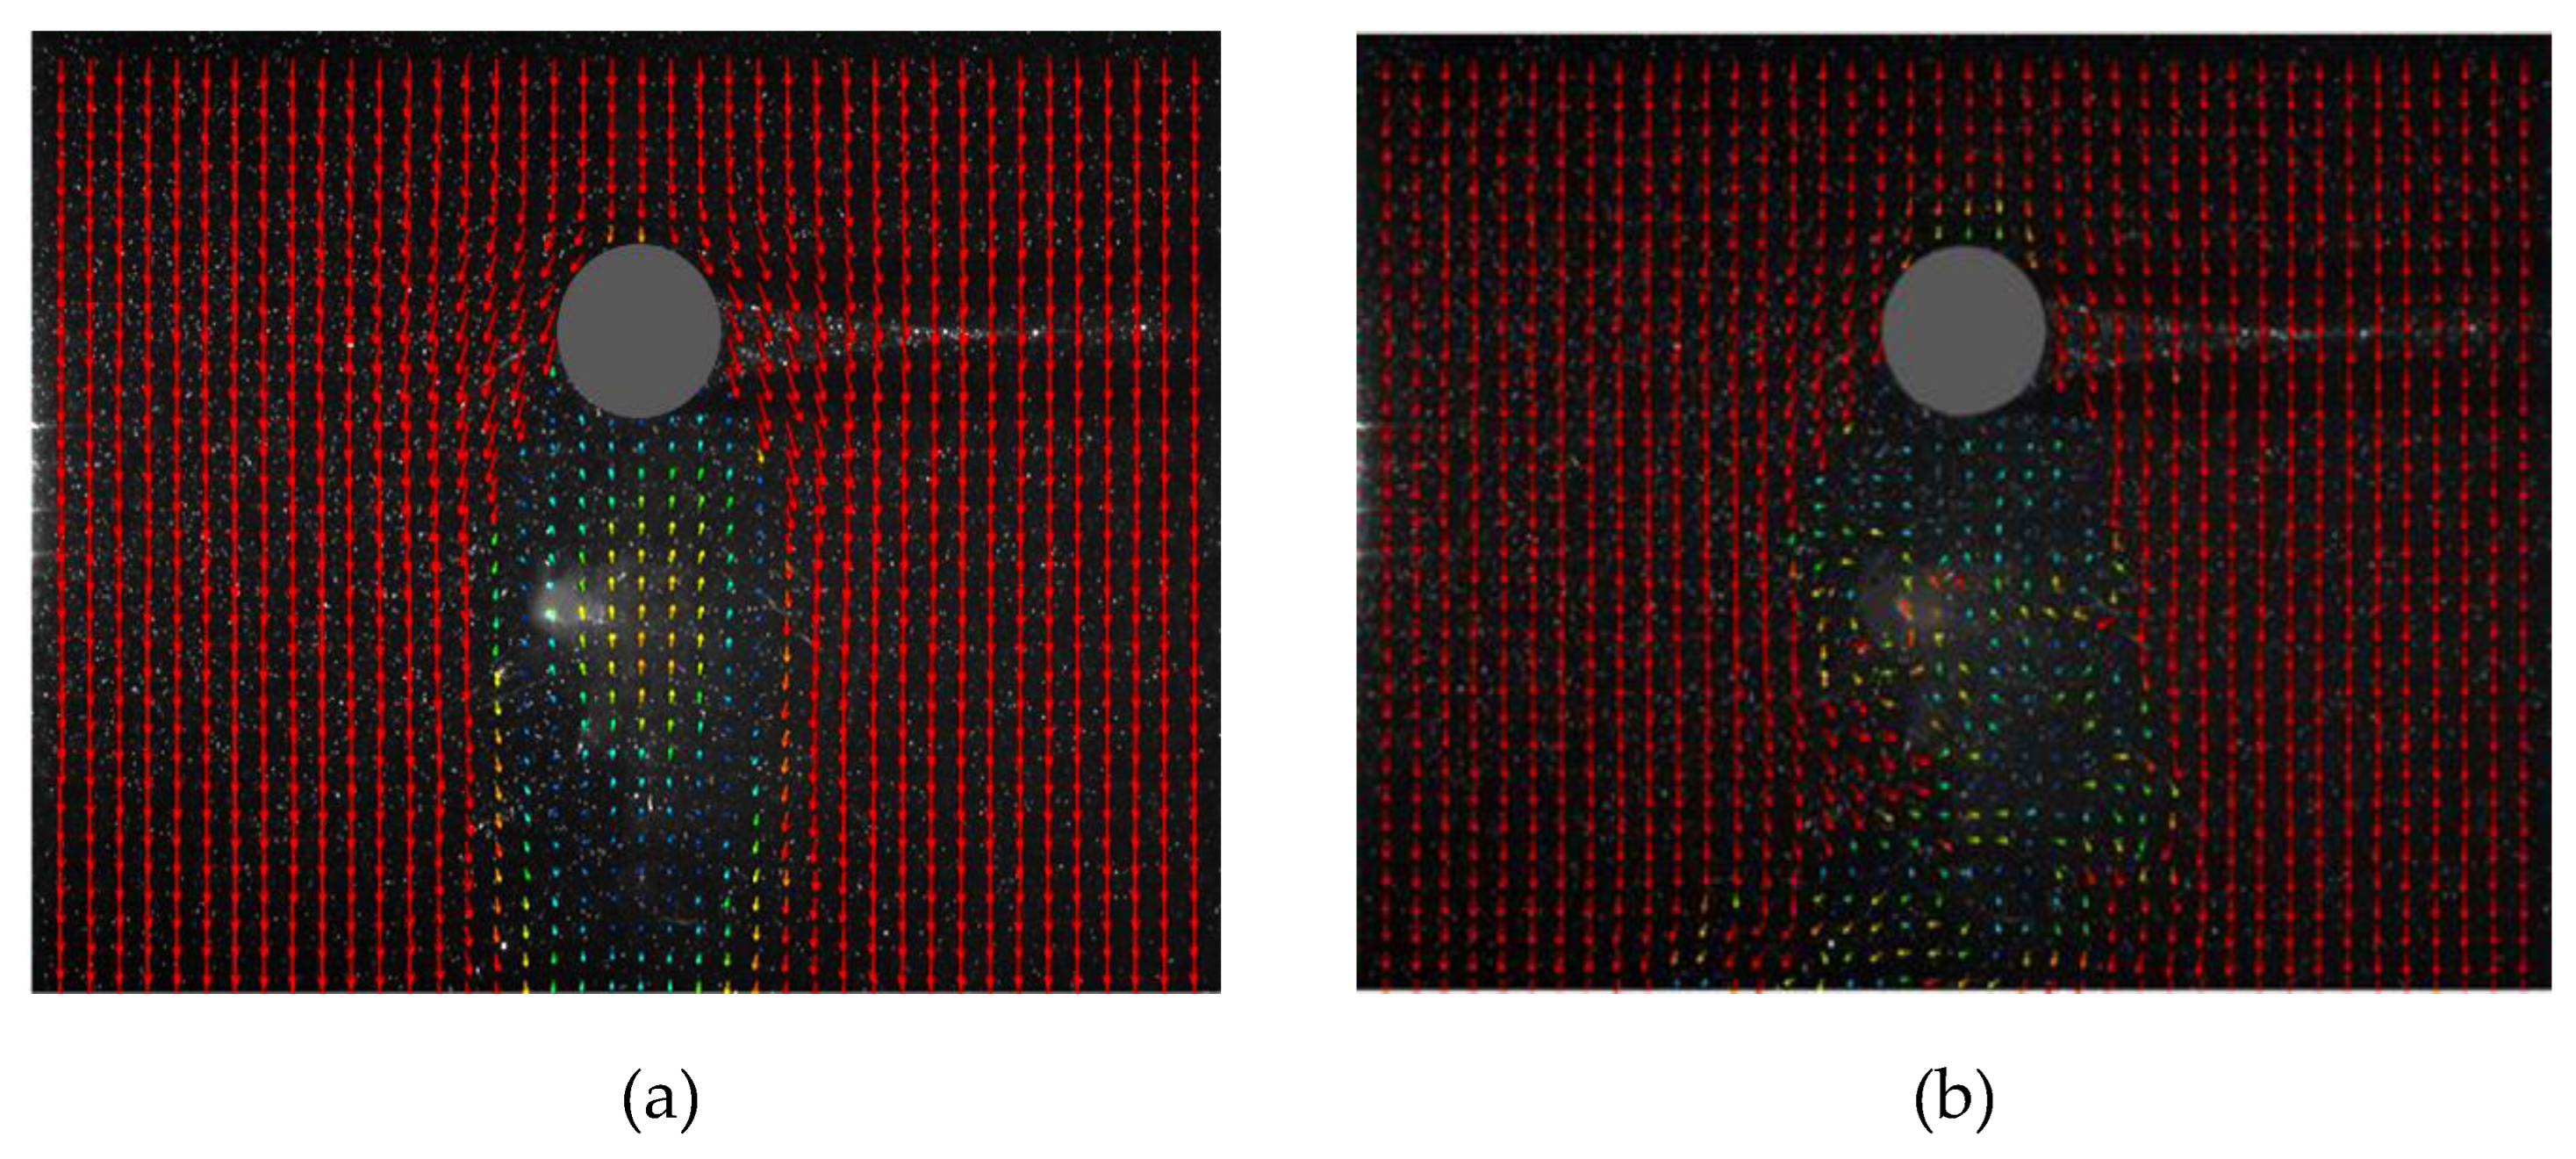
Figure 7, when the cell grid size is 1.0Dp (R1), the calculated flow pattern is a stable, symmetric distribution. This pattern does not exhibit the oscillating wake flow observed in physical model experiments (
Figure 2b). When the cell grid size is 1/9 Dp (R4), the computational calculations are able to clearly reflect the oscillating wake flow downstream of the bridge pier.
The results of the grid-independent analysis demonstrate that when there is no bridge pier in the river or in the region away from the bridge pier, the use of a size and diameter of the bridge pier (Dp) comparable to the grid can accurately reflect the characteristics of the movement of the water flow. In the vicinity of the bridge pier area, it is recommended to adopt a 1/9Dp or a smaller grid size.
3.3. Numerical Simulation Program
In numerical simulation, the number of grid cells has a profound impact on the efficiency and economy of calculation. Consequently, in order to guarantee the precision of the numerical simulation results, it is essential to minimise the number of computational grids. In the context of bridge pier winding flow, it is an effective method to utilise a higher resolution grid for the area in proximity to the bridge pier and subsequently reduce the grid resolution for the area situated beyond the bridge pier.
In Delft3D, two methods are available for local encryption of the mesh. The first method is to utilise suspended mesh technology, specifically DD Boundary. The second method is to employ unstructured mesh, namely Deflt3D Flexible Mesh.
In order to facilitate a comparison of the relative merits of the various methods, three numerical simulation schemes have been designed for the sink model in the study.
Scheme 1 employs a square mesh with a mesh size of 1/9 Dp throughout the numerical simulation computational area. This scheme is designated as the R4 scheme in the mesh-independent analysis.
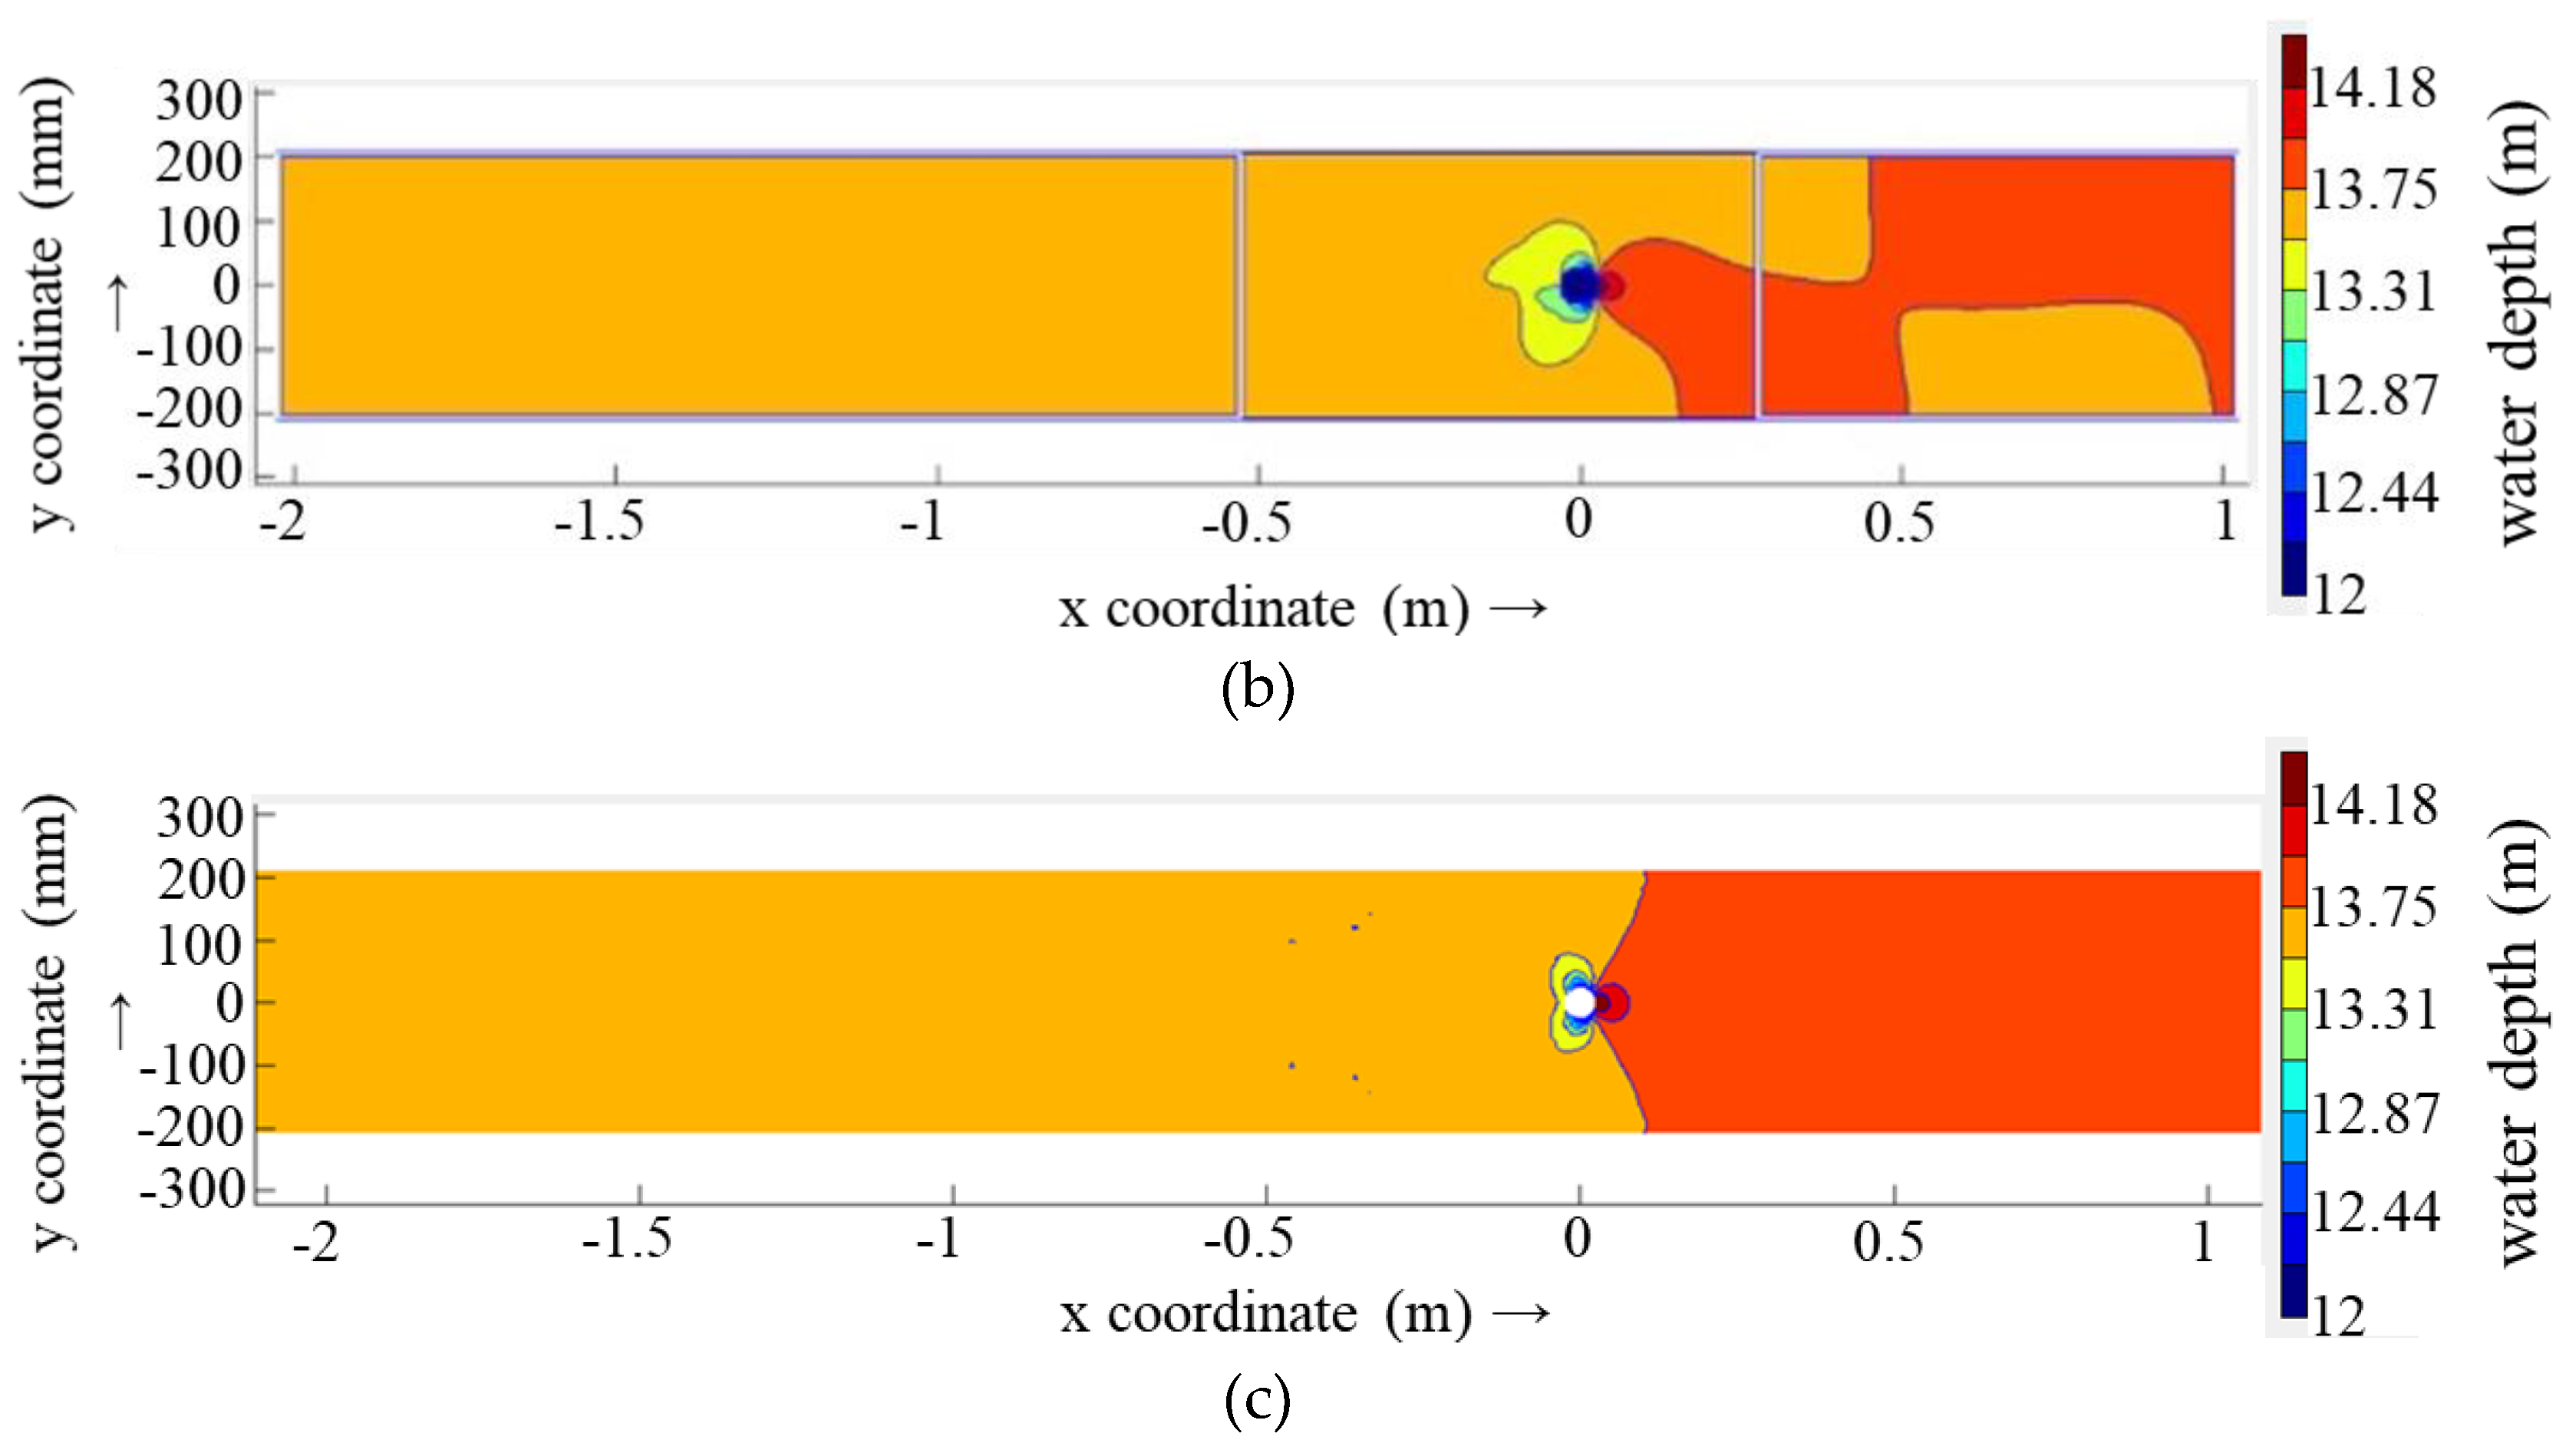
Scheme 2 employs a three-level suspension grid based on the DD Boundary. The first level of the region is situated closest to the pier of the calculation area (pier upstream of 6 Dp and pier downstream of 10 Dp). The cell grid is scaled at 1/9 Dp. The second level of the region is situated in close proximity to the first level of the upstream and downstream region (pier upstream of 6-20 Dp, pier downstream of 10-40 Dp). The cell grid scale is 1/3 Dp. The remaining region for the third level of the calculation area is represented by a cell grid scale of 1/9 Dp. The computational region is defined by a cell grid scale of 1 Dp, with a hanging grid ratio of 1:3 between the regions of all levels. The total number of grid cells is 17846 (
Figure 8).
Scheme 3 employs the non-structural computational grid utilized by the Deflt3D Flexible Mesh method. This grid is triangular in nature and has a minimum cell scale of 0.1 Dp within the range of 10 Dp upstream and 20 Dp downstream of the bridge pier. The remainder of the area utilizes a square grid with a grid scale of 1.0 Dp, resulting in a total of 6716 grid cells (
Figure 9). The Deflt3D Flexible Mesh is capable of more accurately representing the profile of the cylindrical bridge pier.
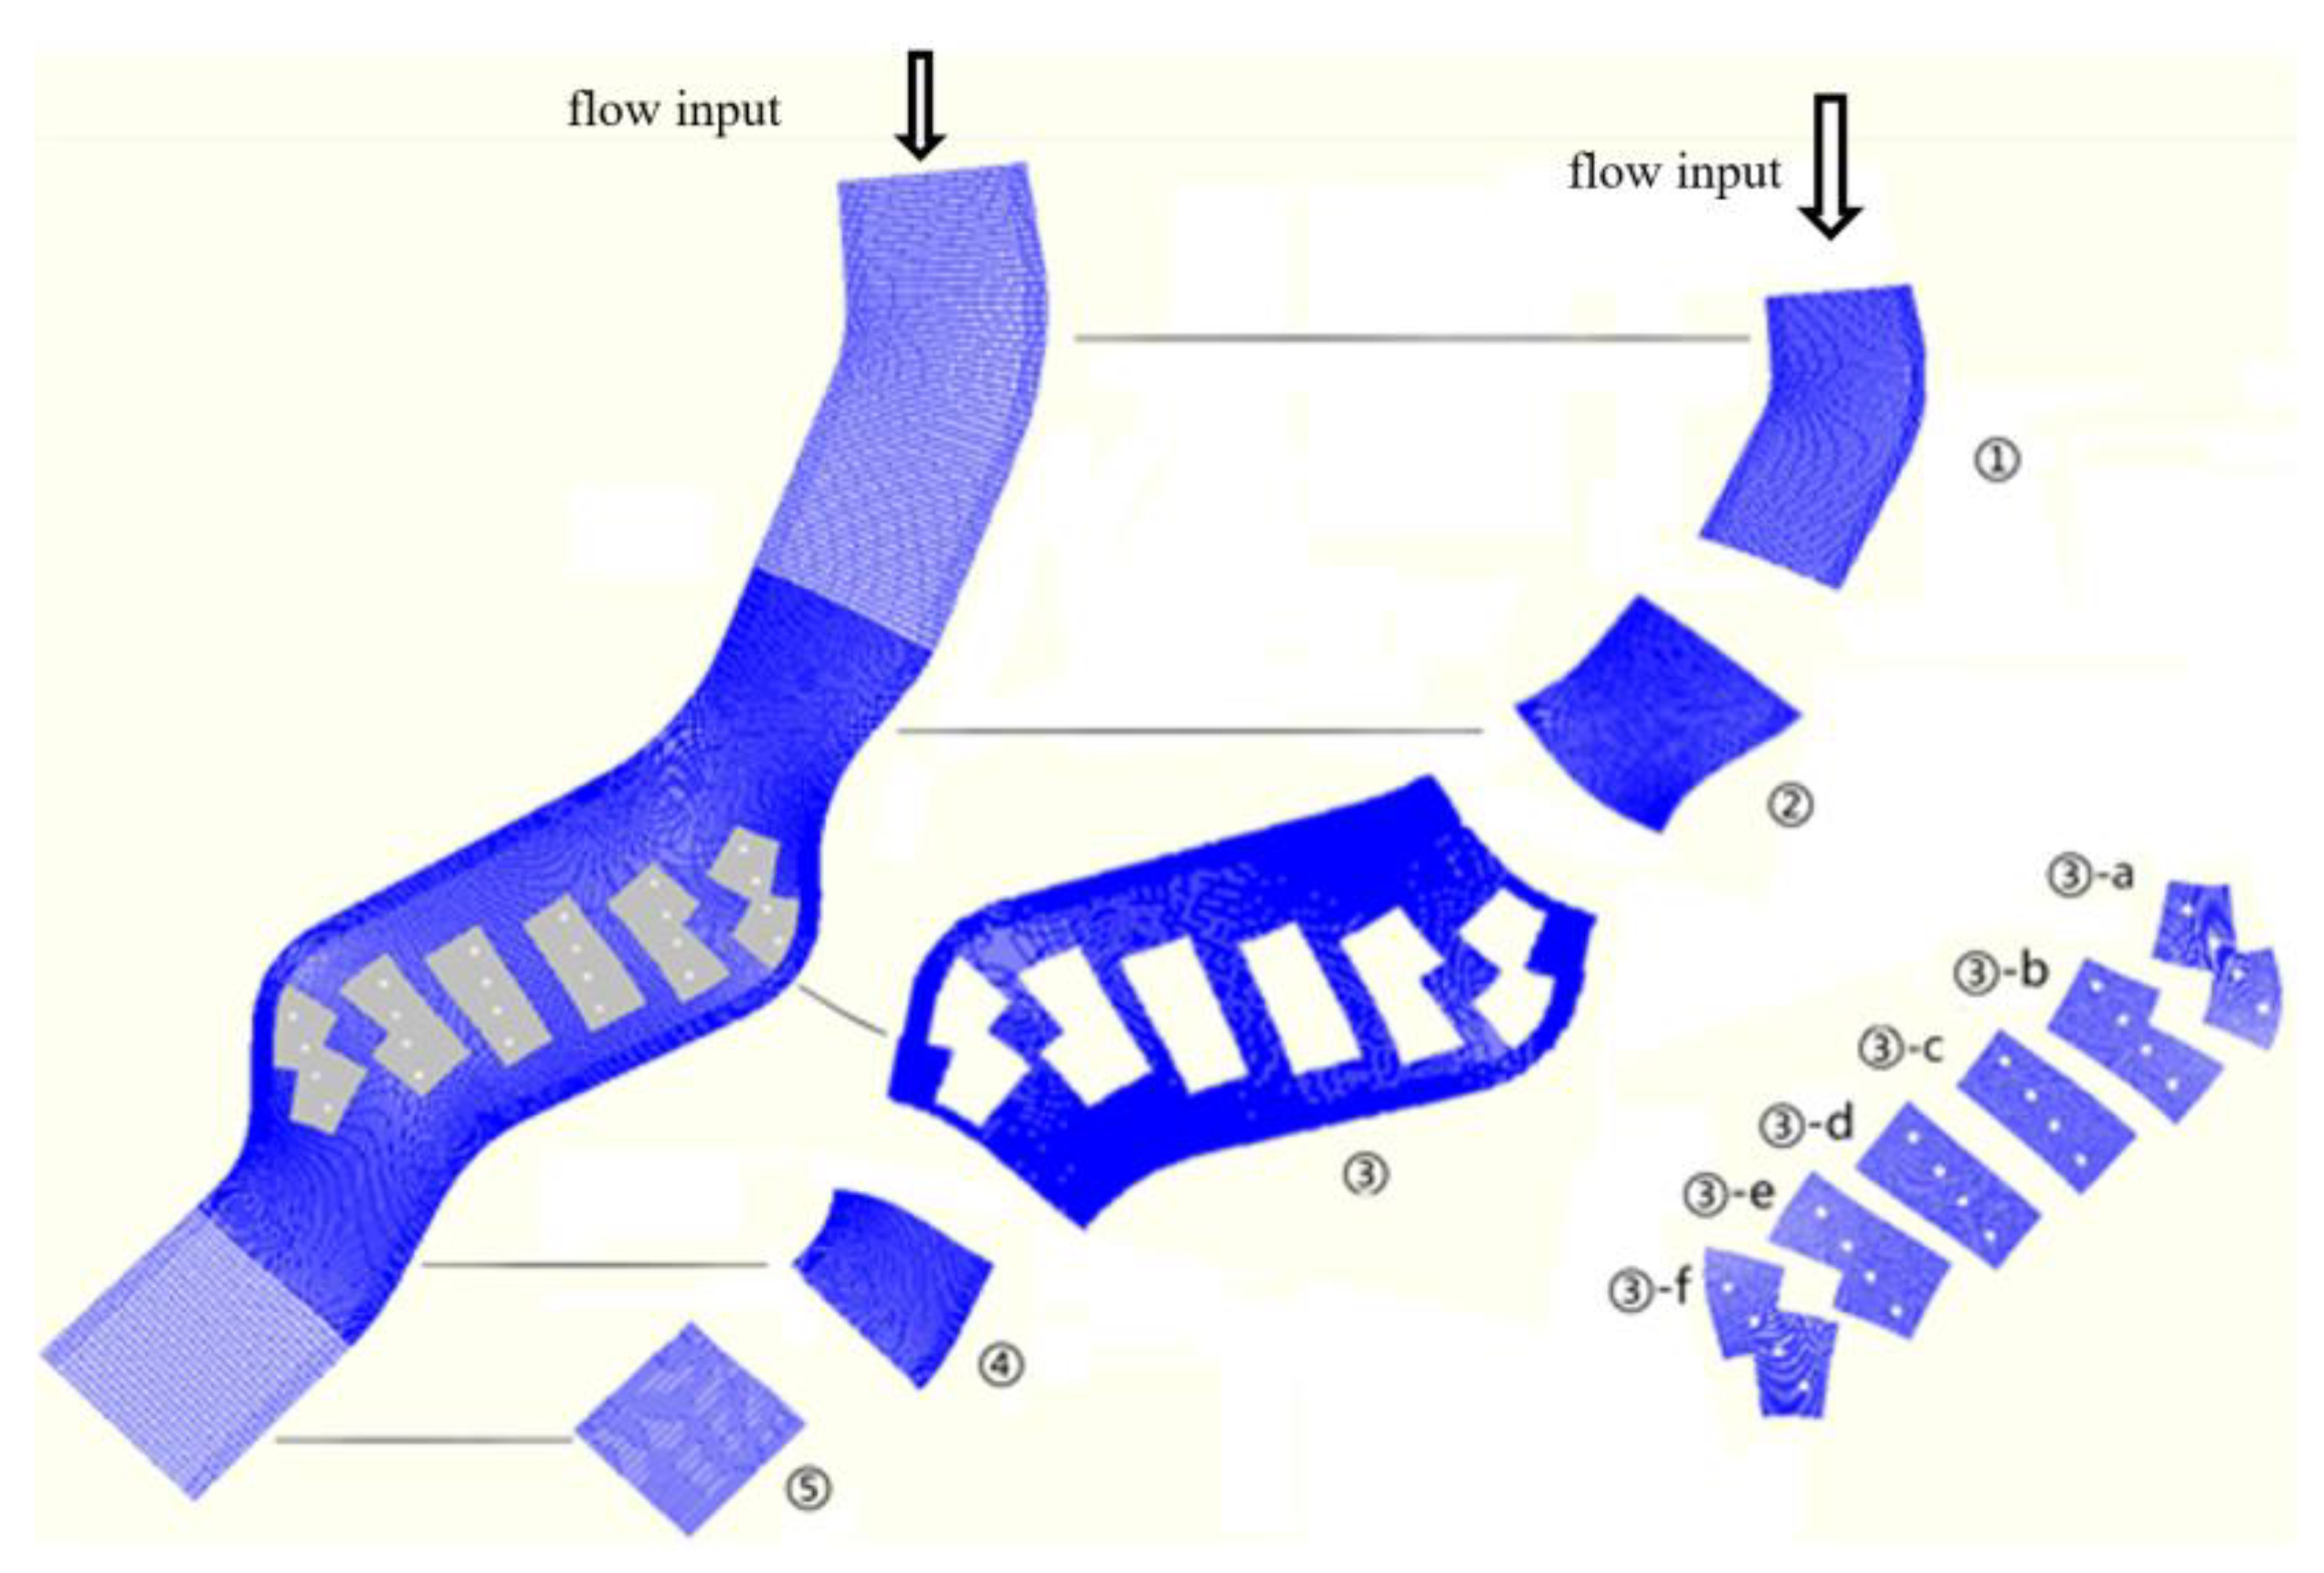
In the case of the bridge project example presented in section 2.3, a suspension mesh with a suspension ratio of 1:3 is employed, with the calculation area divided into three levels. The area where the bridge piers are located is a level 1 region. Each group of four piers constitutes a polygonal partition, resulting in a total of six mutually independent polygonal regions. The grid scale is 0.15 m, which is equivalent to one-ninth of the pier diameter of 1. The diameter of each pier must contain at least nine grid cells, ensuring that the grid scale for the first level of the region is three times that of the second level. The grid scale for the second level of the region is three times that of the third level of the region. One or two regions outside the river are included in the third level of the region, with the grid scale for the second level of the region and the grid scale for the third level of the region being three times that of the Level 2 areas (
Figure 10). The total number of grids is 122,043.
A variety of scenarios were subjected to numerical simulation in the study. In order to ensure the stability of the numerical simulation results, the length of the calculation period for the flume flow was unified to 20 minutes, with a calculation time step of 0.0001 minutes. The length of the calculation period for the bridge project example was 12 hours, with a calculation time step of 0.001 minutes.
5. Conclusions
This study employed the physical model test data to analyse the influence of mesh size on water flow motion, utilising Delft3D. The numerical simulation scheme was optimised, with three schemes, namely mesh encryption in the overall calculation area, suspended mesh technique, and non-structural mesh method, being calculated and compared. The optimised scheme was then applied to an actual bridge project.
(1) This study has demonstrated that the grid resolution has a significant effect on the calculation results when Delft3D is applied to the numerical simulation of bridge pier winding flow. For the area situated at a distance from the bridge pier, a grid size that is comparable to the diameter of the bridge pier (Dp) can be employed in order to accurately reflect the motion of the water flow. In the area close to the bridge pier, the mathematical model is unable to simulate the oscillation of the wake downstream of the bridge pier when the grid size is comparable to the pier diameter Dp. Even the condition that the minimum grid size recommended by the user manual should not be less than 1/5 Dp is still on the conservative side. In order to obtain more optimal calculation results, it is recommended that the grid cell size in the vicinity of the bridge pier be less than or equal to 1/9 Dp.
(2) In the numerical simulation of bridge pier winding flow, the number of grid cells has a profound impact on the efficiency and economy of calculation. In addition to the computational scheme of using high-resolution grids for the entire computational area, Delft3D also allows for the use of suspended grid technology (DD Boundary) and unstructured grid models (Deflt3D Flexible Mesh) to achieve local grid encryption. The numerical simulation results of the three different schemes demonstrate that the suspended mesh technique (DD Boundry) can obtain highly consistent results with the full-area high-resolution mesh, even when the total number of meshes is reduced. Furthermore, the results are in close agreement with those of the physical model test, and the computational time is significantly reduced.
(3) The numerical simulation results of the non-structural mesh (Deflt3D Flexible Mesh) scheme indicate that the total number of computational grid cells is the smallest. However, the results demonstrate completely symmetric flow patterns, which are more consistent with the time-averaged flow patterns of the physical model (
Figure 3.2a). Additionally, they do not capture the oscillating phenomenon of the tail flow behind the bridge pier. Conversely, the computational time consumption is relatively high. Given that the Deflt3D Flexible Mesh technology is a relatively new development from Delft, it may require further investigation and research before it can be fully understood.
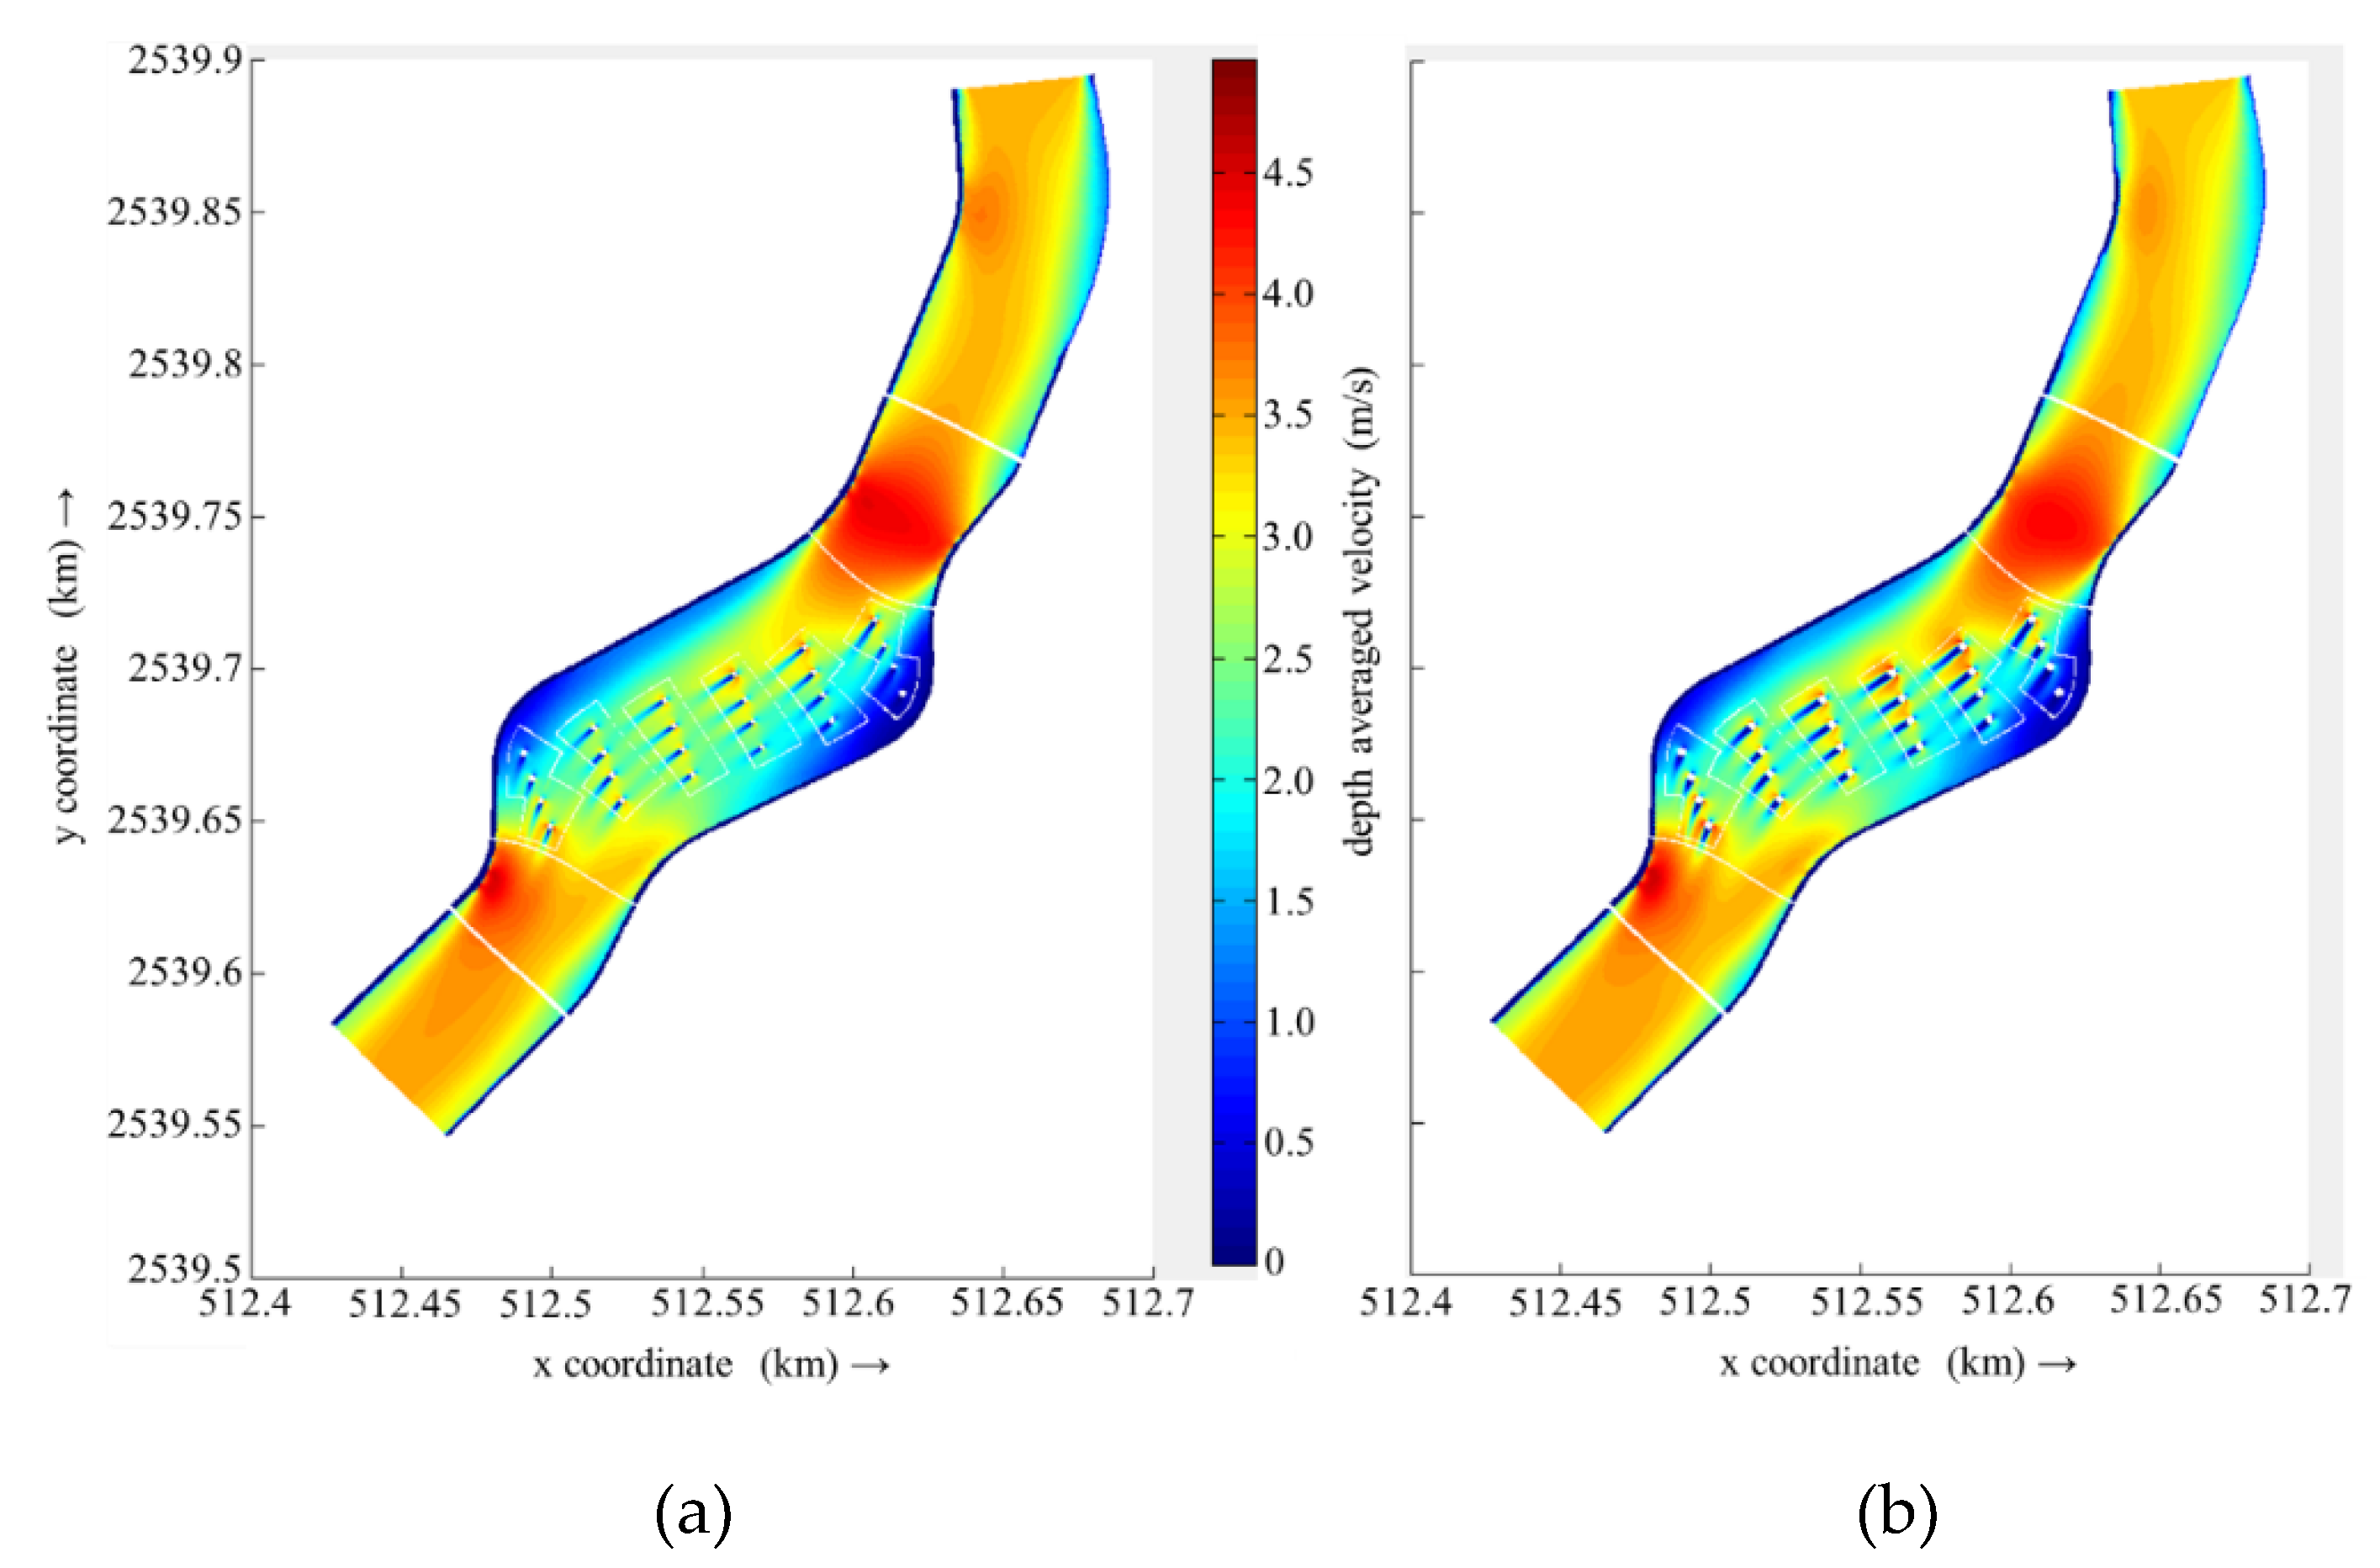
(4) The grid cell size of less than 1/9Dp near the bridge pier, obtained from the flume flow calculation and the suspended mesh technology, is applied to the bridge engineering example. A comparative analysis of the flow pattern of the bridge pier reinforcement scheme is then carried out, which proves the practical value of the scheme in the engineering. The findings of this paper on grid resolution and the suspended grid scheme can be applied not only to Delft3D software, but also have reference significance to other numerical simulation work.

