Introduction
Lithium-ion batteries is widely used as electric storage system in modern applications, mobile or stationary [
1,
2,
3], electronics and micro-electronics [
4,
5,
6], UPS and data centers [
7,
8,
9], or industry [
10]. Lithium-ion batteries exhibits a continuous power of implementation in many areas of modern society [
11] and show promising expectations for the coming future [
11,
12]. Among the many advantages lithium-ion batteries have compared to other types of battery like nickel or lead, the specific power is one of the most interesting since it reduces the size and weight of the battery to supply the required energy [
13,
14]. High specific power redounds in great available energy and autonomy for defined battery size. The autonomy of a battery depends on its capacity and on the discharge rate. Lithium-ion battery capacity is little affected by the discharge rate, although the capacity reduces with the discharge rate increase [
15].
The state of charge of a battery is a critical point in the management of its autonomy; indeed, for a specific capacity the autonomy of a battery depends on the remaining state of charge. In many applications, the accuracy in determining the state of charge conditions the operation of the external load, like in electric vehicles where an inaccurate calculation of the state of charge can cause the battery to deplete earlier than expected, with very negative consequences; therefore, an accurate determination of the SOC is essential [
16,
17].
The determination of the SOC of lithium-ion batteries is the goal of many studies; some base the calculation of the state of charge in thermodynamic considerations [
18], others use adaptive methods and neural networks to evaluate the SOC [
19,
20,
21]. Modelling is also a practical tool in determining the lithium-ion batteries state of charge, especially when using approaching techniques [
22,
23,
24].
In many works Open Circuit Voltage (OCV) of a lithium battery is the key-parameter in calculating the state of charge [
23,
25,
26,
27,
28,
29,
30] since it determines the starting point of the discharge curve for any current rate. The OCV is a characteristic parameter of any battery, and represents the electromotive force, which depends on the structure and configuration of the electrochemical cell. It is quite a constant value, although affected by temperature changes and aging processes [
31,
32].
Many proposed methods to determine the SOC of lithium-ion batteries use the Open Circuit Voltage as a reference [
23,
25,
26,
27,
28,
29,
30,
33]. This value, however, depends on the battery capacity itself [
34], on the aging processes [
35], and on the discharge path [
36]; therefore, the determination of the OCV requires a modelling process which considers all the intervening factors mentioned above [
33,
37,
38,
39,
40,
41].
Since the OCV must be measured offline, the SOC determination of a lithium battery based on the OCV requires a disconnection of the battery during operation. This process does not take long and barely interferes with current battery discharge. Nevertheless, online determination of the battery OCV results more effective and practical. In past times, some works study and analyze the online OCV determination with the intention of remedying the existing gap between online and offline operational conditions, which may lead to inaccuracies in the OCV calculation and on the SOC determination [
25,
42].
The determination of the SOC in lithium batteries based on the OCV, however, is not the only calculation method; alternative solutions arise from the analysis of the evolution of the battery voltage during the discharge, especially if we consider the influence of the discharge rate on the performance of the battery. This paper proposes a new technique to characterize the state of charge in lithium-ion batteries during operation with minimum interference in current operation.
Theoretical Basis
The state of charge of a battery defines the remaining available charge in the battery pack; mathematically:
Or in terms of discharge time:
Q represents the extracted charge from the battery during a specific time t. Sub-indexes m and D account for intermediate and full discharge.
Since the voltage evolution of a lithium battery during the discharge process is linear, we can relate discharge time and battery voltage for an intermediate point as:
V
m and V
o are the battery voltage at intermediate and full charge state, and m is the discharge curve slope.
The time for a complete discharge depends on the battery capacity, C
r, and on the discharge current, I
D:
Battery capacity depends on the discharge rate according to the following expression [
15]:
f
C is the capacity correction factor, and C
n is the nominal capacity of the battery.
The capacity correction factor is a parameter that depends on the discharge rate X as:
Parameters a and b are empiric. For lithium-ion batteries [
15]:
Combining Equations (2) to (6):
This equation provides a practical algorithm to determine the lithium battery state of charge with only measuring the voltage at an intermediate point and the discharge current.
Equation (8), however, is only valid for non-aged batteries, which is not the current situation; aging provokes a reduction in the capacity of delivering charge [
43,
44,
45,
46] due to degradation of the active matter of the battery, increase of internal resistance, secondary electrochemical reactions at the electrode interphase, etc. [
47,
48].
If the reduction in battery capacity is due to depletion of active matter, the discharge curve maintains the slope but reduces the time to reach the collapse point [
49]; if the increase of the internal resistance is the cause of the battery capacity reduction, the discharge curve slope increases, and the time before reaching the collapse time reduces [
50]. In case of combined effects of active matter depletion and internal resistance increase, the battery performance is similar to the case of internal resistance increase only.
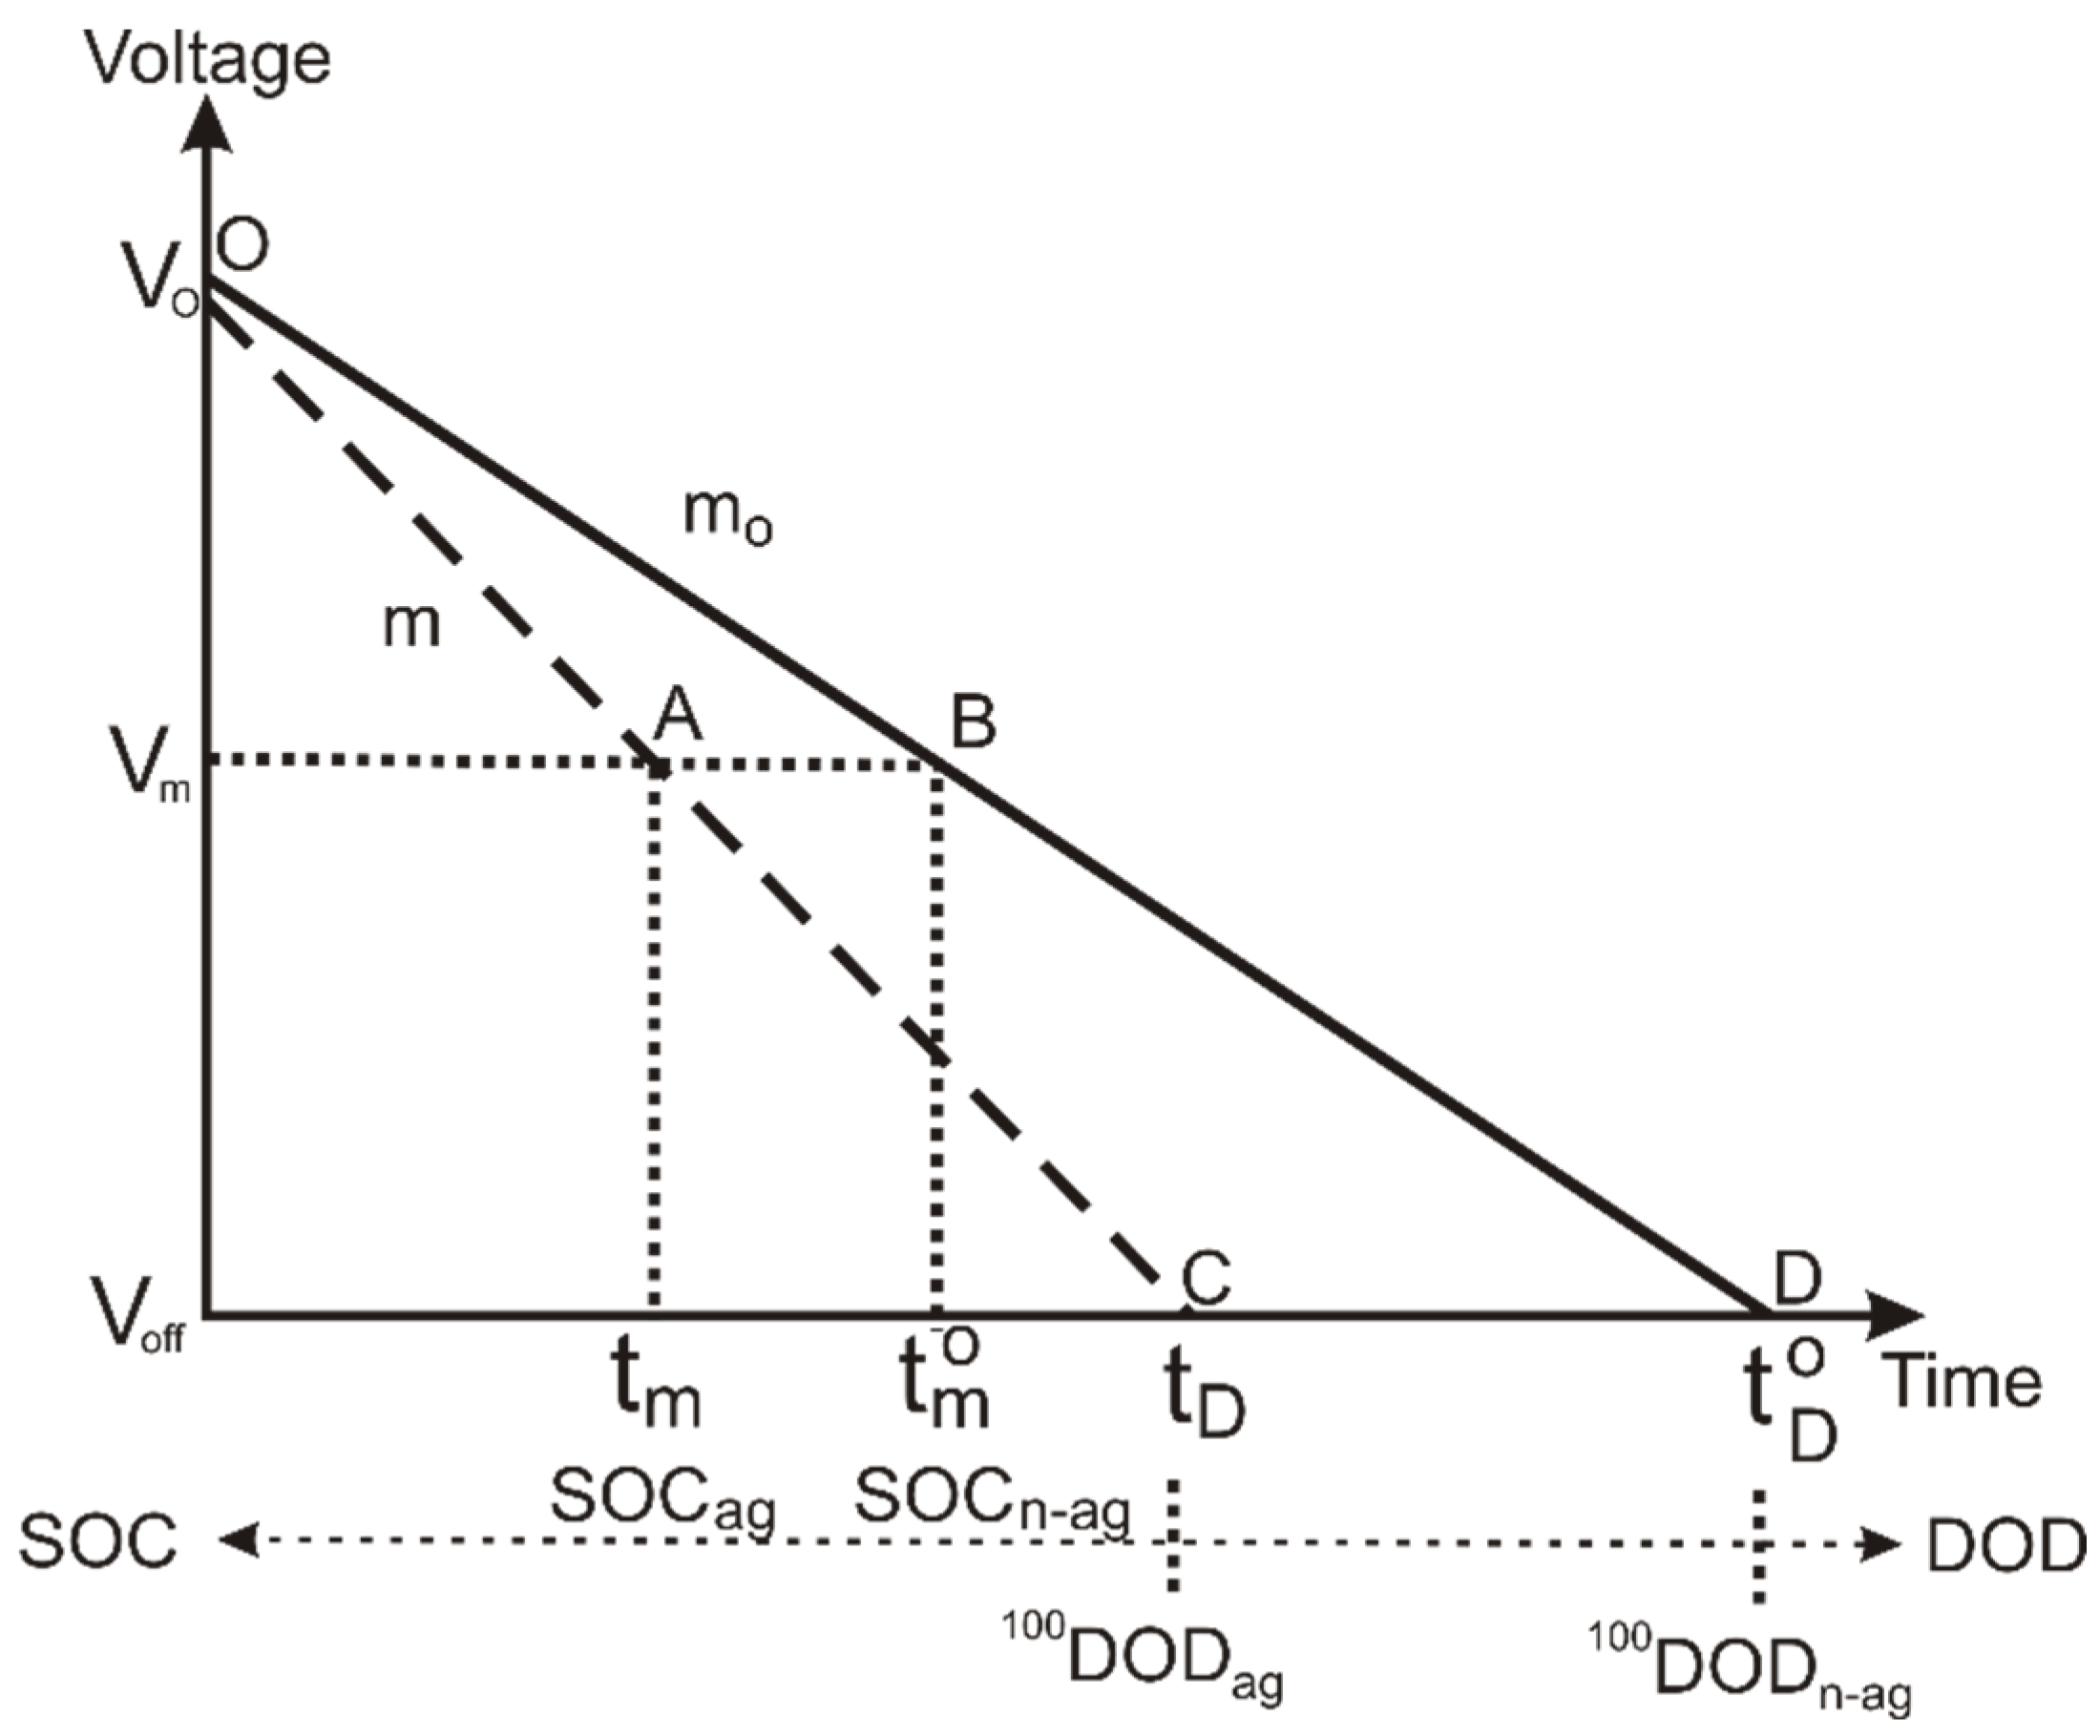
According to the above statements, we can represent the aging effects on the performance of battery discharge curve as a linear evolution of the battery voltage with a higher slope and reduced discharge time. We show the simulation in
Figure 1.
Figure 1 represents the comparative evolution of the lithium-ion battery voltage during a complete discharge for aged and non-aged batteries. The solid line corresponds to the non-aged battery, and the dashed line corresponds to the aged one.
Simulation Process
To analyze the influence of the aging on the state of charge determination, we consider two identical batteries of nominal capacity Cn submitted to a discharge rate X, one completely new (SOH=100) and the other one with some previous cycling (SOH<100).
Although it is not critical, the simulation applies to a complete discharge process until reaching the collapse point to facilitate the comprehension on how the aging modifies the state of charge determination; nevertheless, we can apply the simulation to a partial discharge as well.
Let us suppose we measure a battery voltage, V
m, during operation that corresponds to an intermediate point of the discharge process, thus to a partial discharge of the battery. At this point the battery shows a specific state of charge, which is different for the aged and non-aged battery. We identify these two point as A and B in
Figure 1 and the corresponding state of charge as SOC
ag and SOC
n-ag.
In current conditions, the control system that evaluates the battery state of charge provides SOC
n-ag as the estimated value since it considers the battery like new; however, if the battery is aged, the value is SOC, as shown in
Figure 1. The difference between the two values represents a loss of delivered charge that we must compute to correct the estimated value of the SOC and convert it into the true one.
The state of charge of the battery, point B, is calculated using Equation (2), which for the two batteries result:
Therefore:
Using Equation (3):
Combining Equations (10) and (11):
The expression for the discharge curve slope is:
Replacing in Equation (12):
Applying Equation (4):
Using Equations (5) and (6):
Replacing X in terms of intensity and capacity, and using Equation (13):
where the aging factor, f
ag, represents the nominal capacity ratio of aged to non-aged battery.
The voltages for charged and discharged battery, V
o and V
off, are provided by the battery manufacturer; the operational voltage at the control point, V
m, is measured by the control circuit voltmeter (
Figure 2).
To calculate discharge curve slope, we measure the battery voltage at the initial and final point of a time interval and determine using Equation (11), where tm and tom are the time interval for every battery, aged and non-aged. We make this operation during the battery discharge process; the control unit regulates the current extracted from the battery during the measuring process to avoid changes in the intensity.
Aging Factor
To determine the aging factor, we need to know how many agents intervene in the degradation of the battery, the action time of every one, and the activity depth of each agent. Since this requires a deep knowledge of the battery history, cycling, working temperature, discharge rate, depth of discharge, etc., it is difficult to determine the aging factor accurately. Nevertheless, we can estimate the aging factor considering that the battery current capacity represents the state of health; therefore, we assume that an aged battery has a lower capacity referred to the non-aged one.
Based on the previous statement, we evaluate the aging factor comparing the discharge curve slope of an aged battery and a non-aged one. According to
Figure 1, an aged battery discharges quicker for the same discharge rate; therefore, if we submit the battery to a controlled discharge of known intensity, we can calculate the discharge curve slope simply applying Equation (11). This equation is valid for batteries initially charged, what requires starting the controlled discharge process at a charged battery.
To avoid altering the state of charge of the battery, controlled discharge is short in time, but intensity is high enough to generate a measurable voltage drop with high accuracy. After the test run we process the information, adapting Equation (13) to calculate the slope for every battery in the following form:
and
are the aged and non-aged battery voltage at the end of the test run; t
test is the time interval of the test.
If we extrapolate the voltage evolution of the test until reaching the cut-off point where the battery collapses, we have:
Since the intensity is the same for the two batteries, we obtain the aging factor from the ratio of aged to non-aged battery capacity as:
Or
Equation (21) shows how to determine the aging factor with the only knowledge of the two discharge curve slopes.
Experimental Tests
-
a)
Aging factor
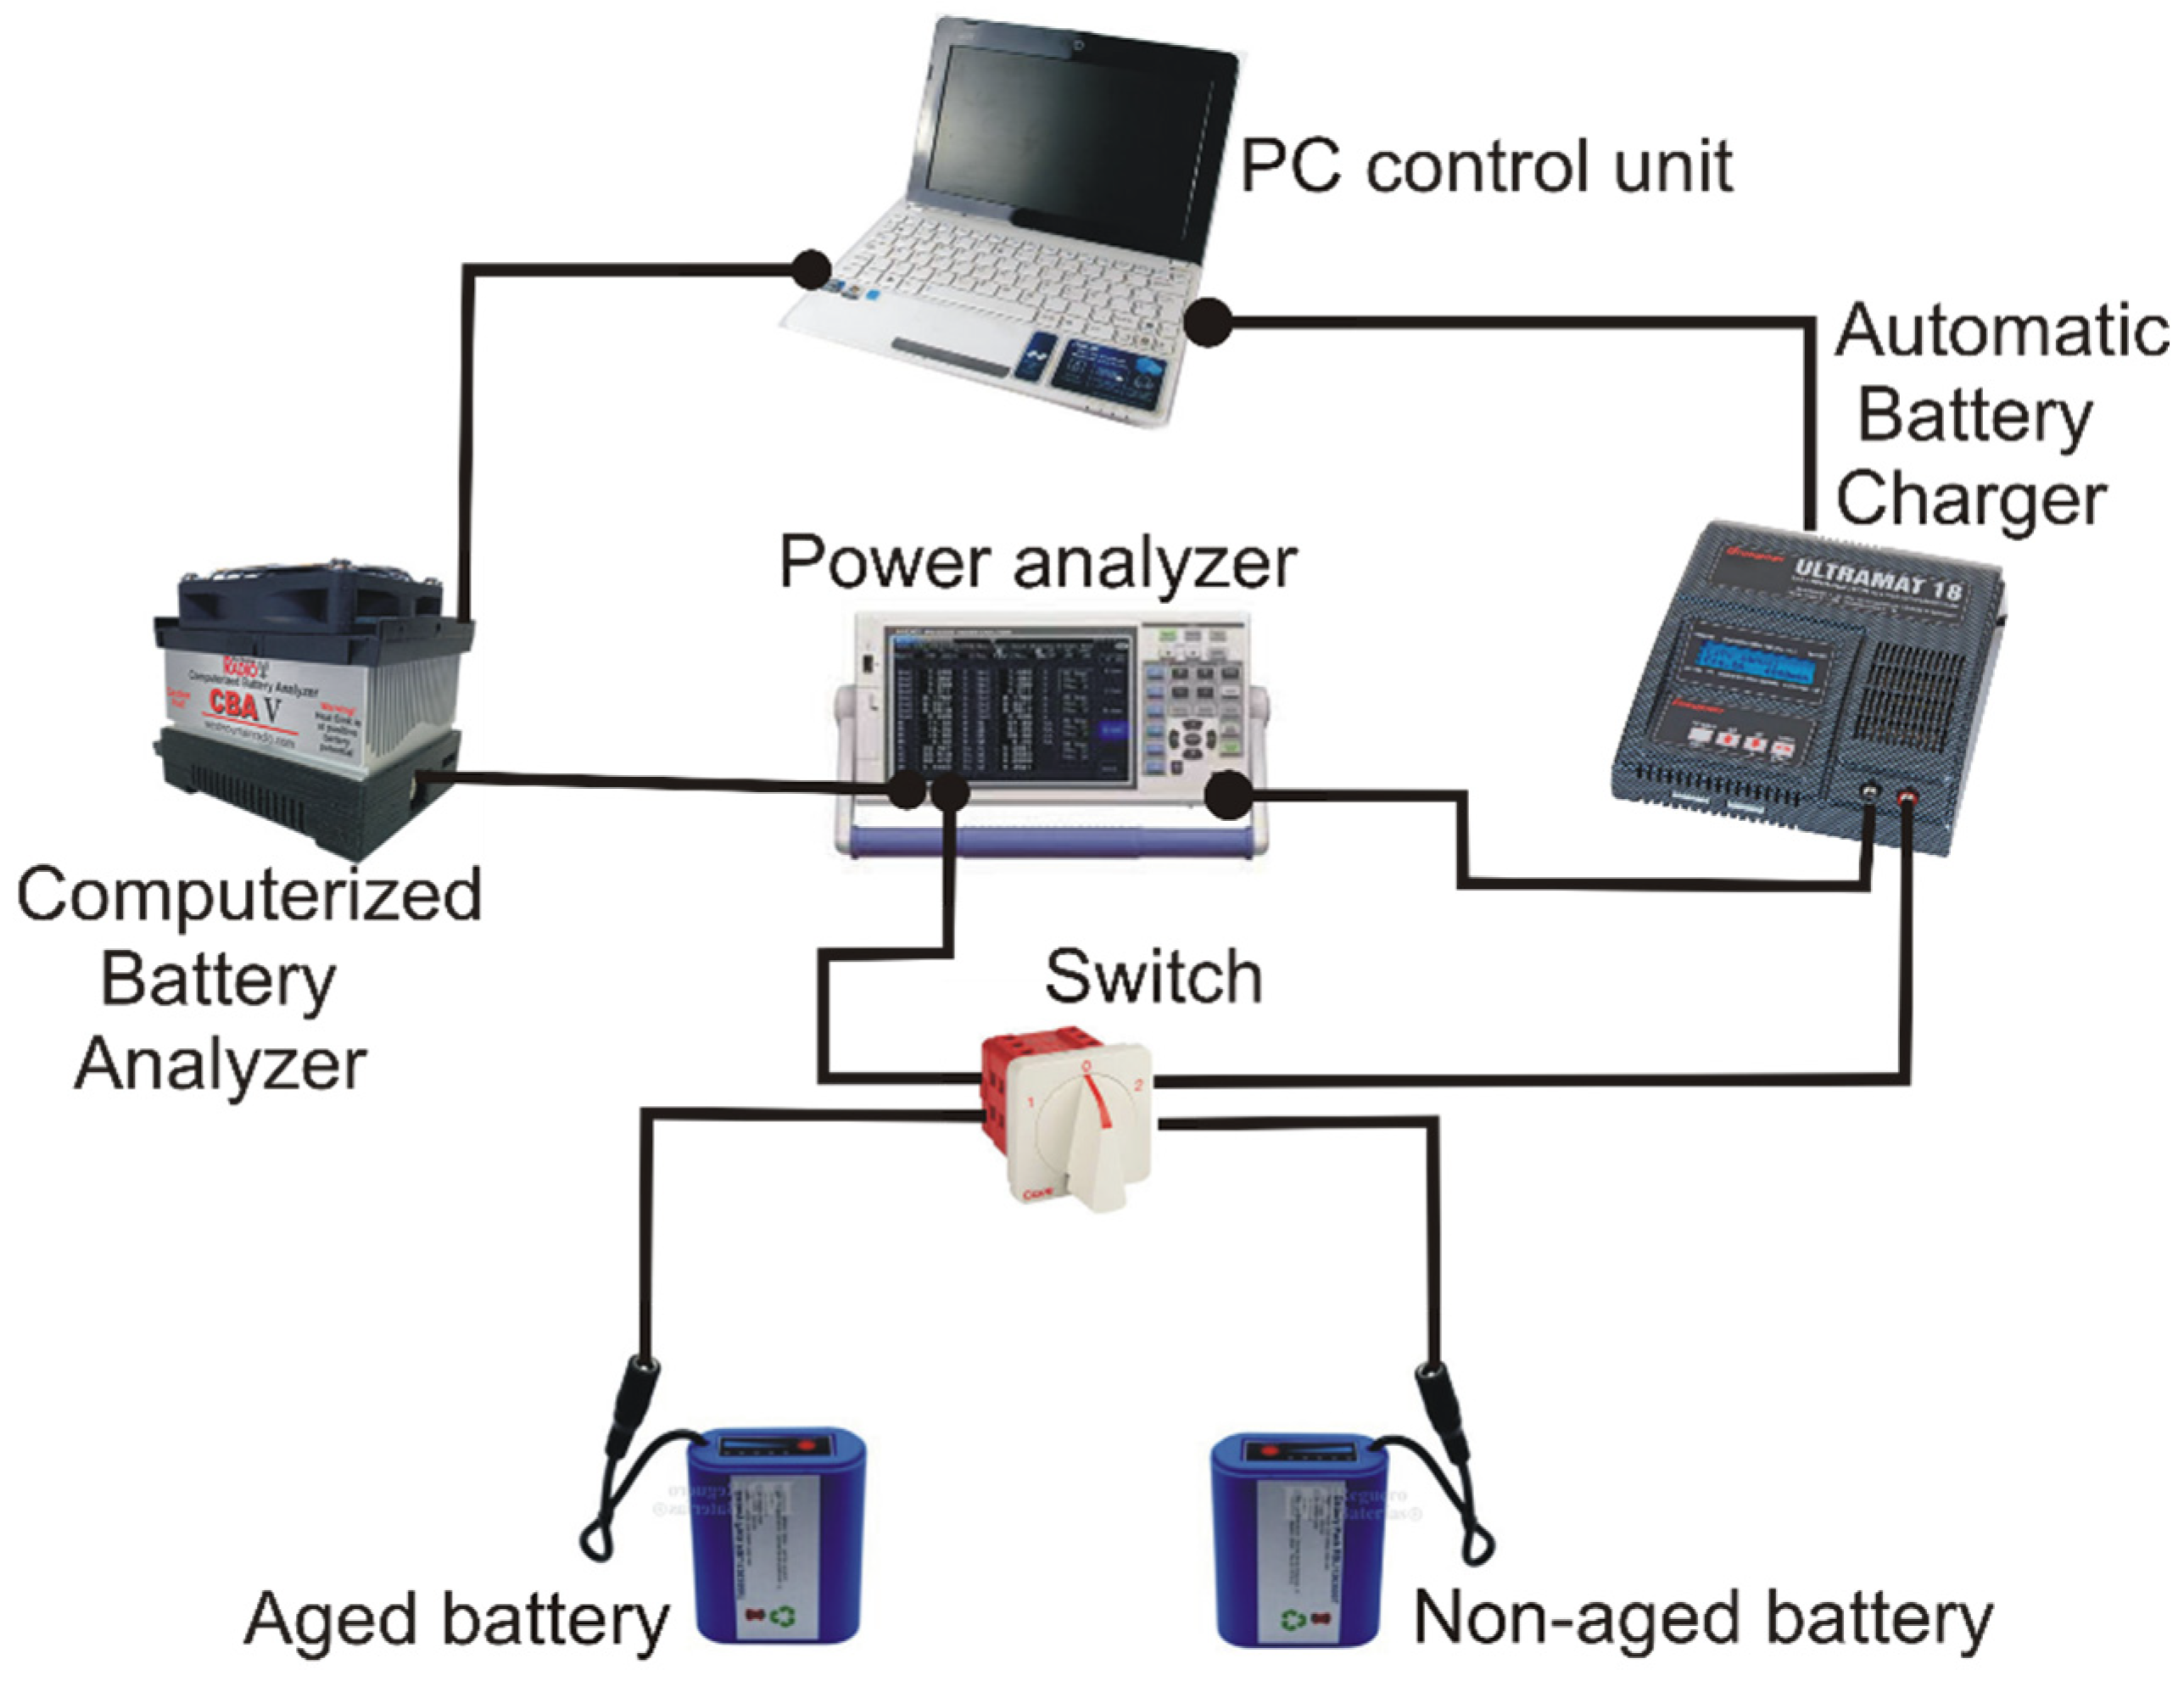
To run the tests, we designed and built a control circuit consisting in a double battery block, one aged and one non-aged, connected to a Computerized Battery Analyzer (CBA), model CBA V from West Mountain Radio manufacturer [
51] for automatic battery discharge. To charge the battery, we use a Robbe Modelsport automatic control charger, model Ultramat 18 from Graupner manufacturer [
52]. The electric circuit uses a power analyzer PCE model PA6000 [
53] to measure the battery voltage and the operating intensity. We use a PC to control the CBA and Ultramat devices; therefore, we regulate the intensity during charge or discharge of the battery. The associated software to CBA and Ultramat unit permits register the values of voltage and intensity continuously; we record the recorded value in the PC hard disk for later analysis.
Figure 2 shows the layout of the testing system.
Test is run at 5 A intensity for 15 s, which means a discharge of 0.02 Ah, less than 1% of the non-aged battery capacity. The corresponding voltage drop was 0.037 V, which matches with expected theoretical value within 95% accuracy.
We calculate the theoretical value of the voltage drop during the test from the expression:
For the discharge time,
toD:
Applying values:
Since the power analyzer has a voltage accuracy of 0.1 mV, the voltage drop at the test run has a precision of 97.3%, which is high enough to validate the test.
Repeating the test for the aged battery, we obtained a voltage drop of 0.045 V; therefore, applying developed equations for the aging factor, it results:
Combining Equations (18) and (26):
Applying values:
To validate the calculation, we run a complete discharge test for the aged battery, obtaining a capacity of 1.978 Ah, which means a deviation of 2% referred to the test value.
Now, applying Equation (21), we obtain the aging factor:
We checked the different parameters using the tests and the complete discharge values to validate the method. We show the results of the comparative analysis in Table 2.
Table 2.
Parameter values for the test and complete discharge process.
Table 2.
Parameter values for the test and complete discharge process.
| |
Equation (5) |
Equation (26) |
Deviation (%) |
| Aged battery capacity (Ah) |
1.978 |
1.940 |
2.0 |
| Non-aged battery capacity (Ah) |
2.361 |
2.365 |
0.2 |
| |
Equation (13) |
Equation (18) |
Deviation (%) |
| Discharge curve slope (aged battery)(V/h) |
10.617 |
10.800 |
1.7 |
| Discharge curve slope (non-aged battery)(V/h) |
8.895 |
8.880 |
0.2 |
| |
Equation (20) |
Equation (21) |
Deviation (%) |
| Aging factor (test) |
0.178 |
0.178 |
0.0 |
| Aging factor (global capacity) |
0.178 |
0.162 |
9.6 |
We notice the high matching in the determination of the battery capacity using any of the two methods, the one derived from the application of previous work [
15] or the alternative proposed in this paper, with an accuracy higher than 98% for the aged battery and almost 100% for the non-aged.
A similar results derives from the analysis of the determination of the discharge curve slope, with almost identical values in the accuracy for the aged battery and the same value for the non-aged one.
Finally, the analysis of the aging factor, which is the goal of the testing method, results in a perfect matching when using the values from the specific discharge test for charged batteries, but differs by near 10% if we use the global discharge process. This deviation shows that the performance does not remain uniform during the entire discharge compared to the initial test, probably due to the non-homogeneous behavior of aged batteries. The result is, however, within acceptable limits, and the influence on the determination of the battery state of charge is limited.
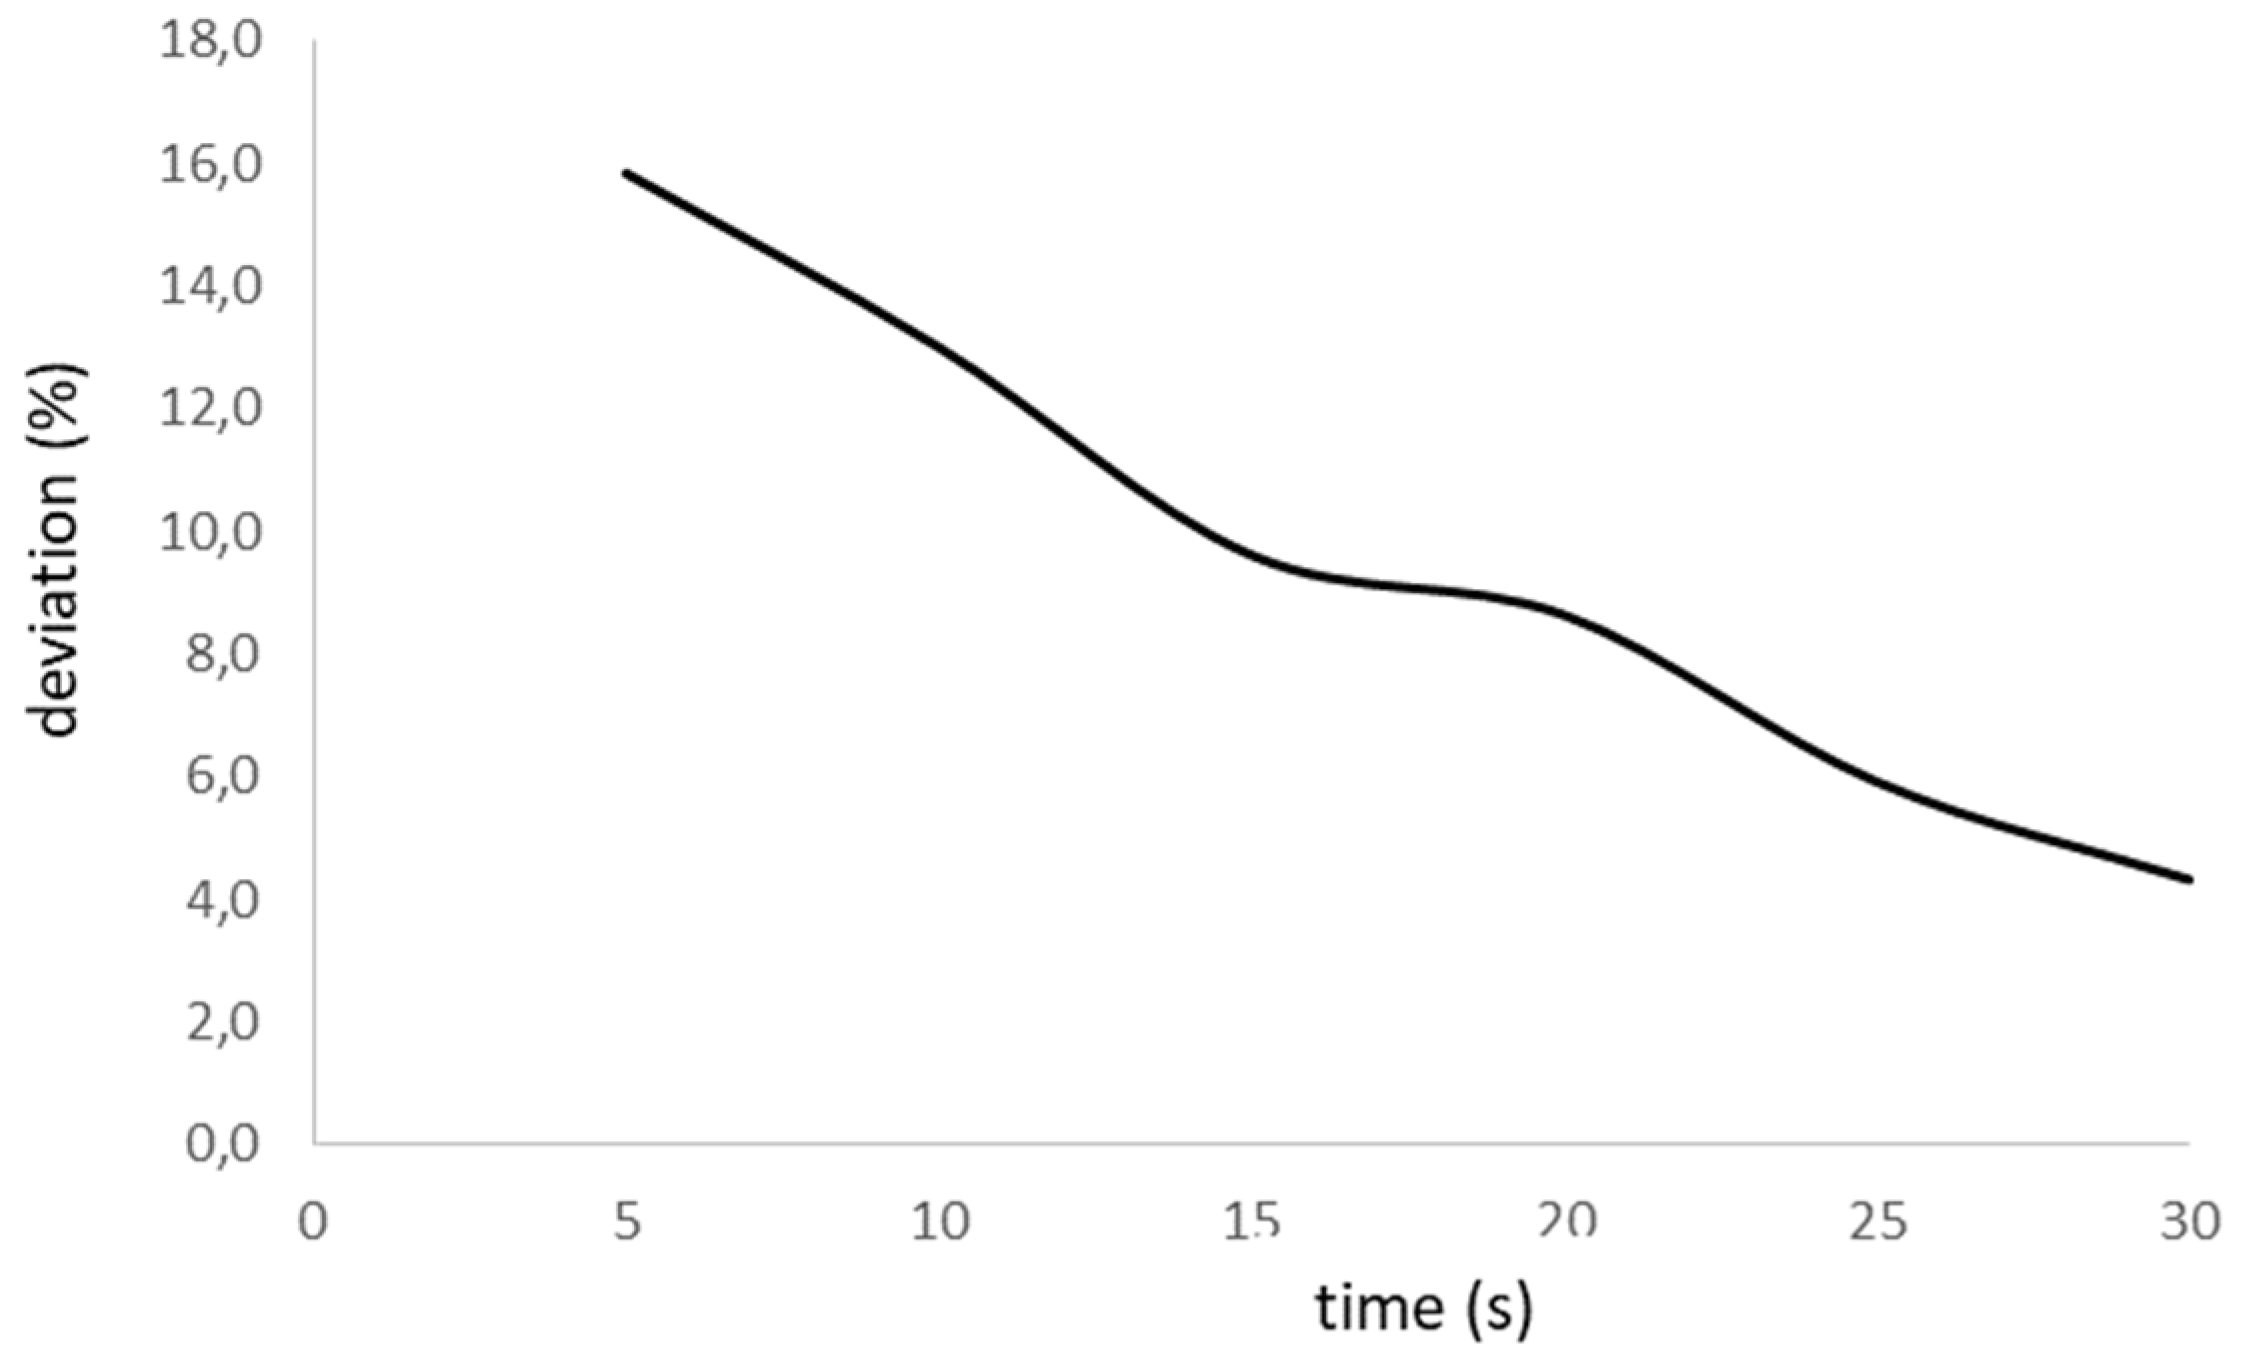
Further tests show that the deviation reduces if the initial test lasts for longer (
Figure 3); however, the extracted current during the test increases resulting in higher interference in the battery performance.
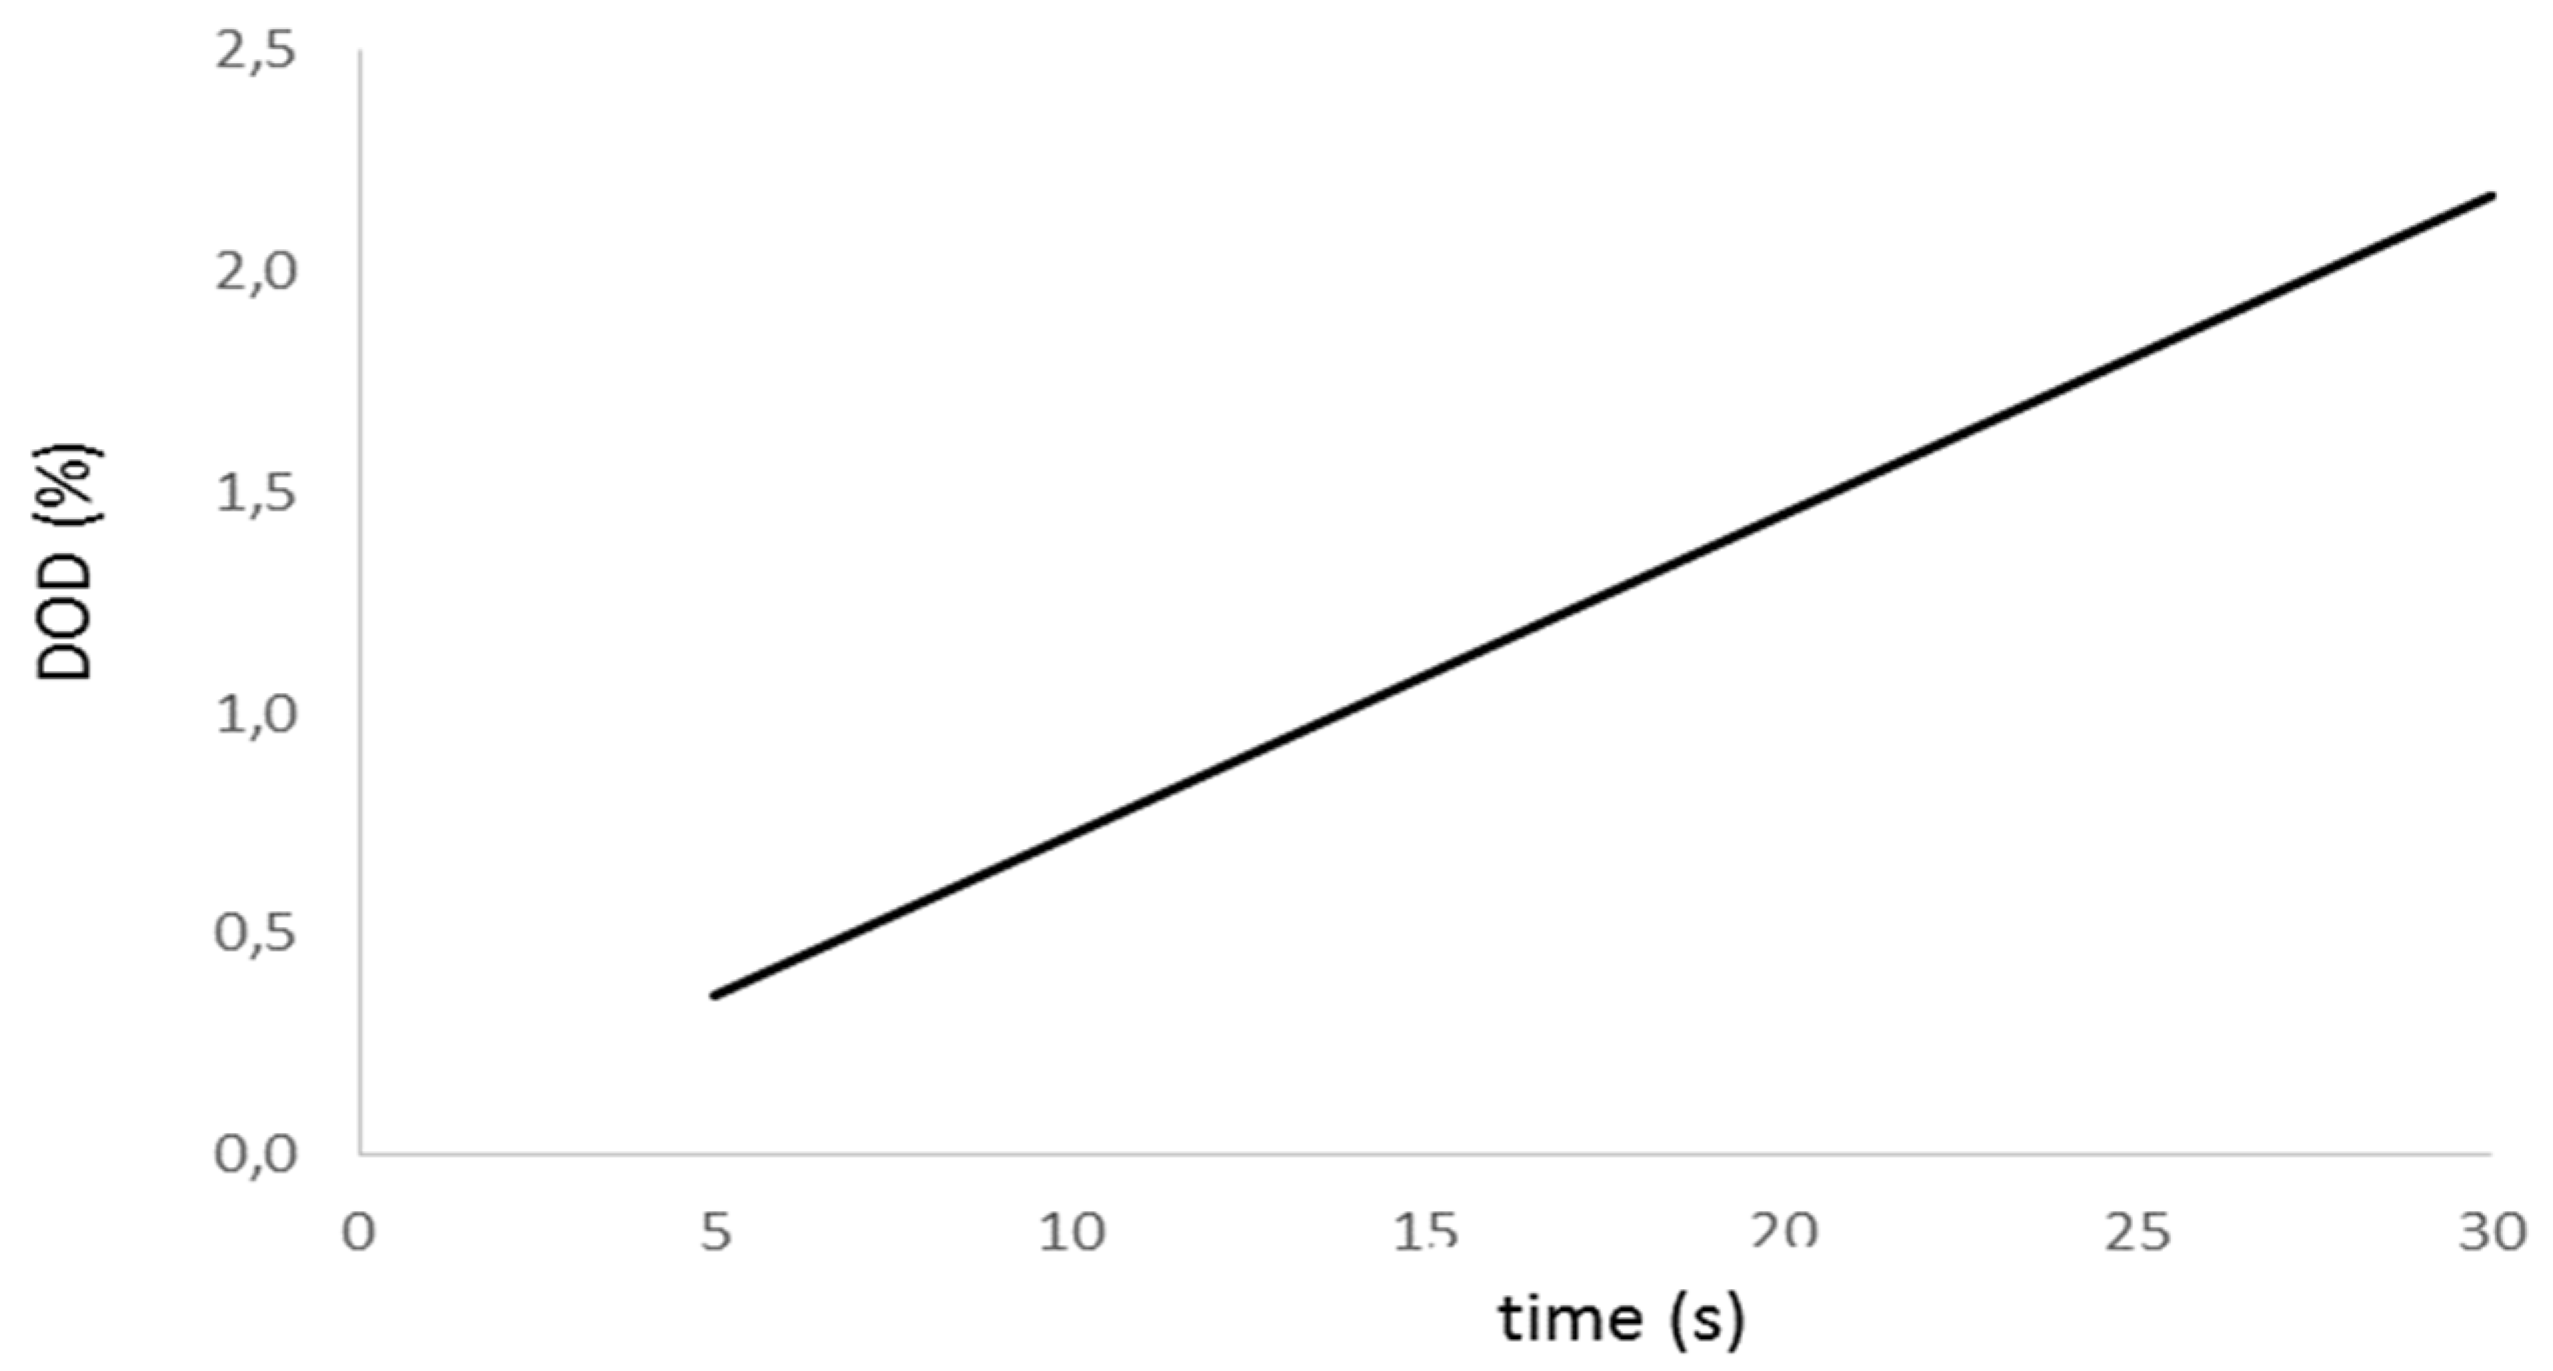
Figure 4 shows the evolution of the battery Depth of Discharge (DOD) associated to the initial test. We realize the DOD exceeds 1% for a test initial interval higher than 15 seconds; therefore, we consider this value as the threshold beyond which the initial discharge is not acceptable. As a result of this consideration, we estimate the aging factor with a minimum accuracy of 9.6%.
The evolution of the deviation with the aging factor adjusts to a right line within 98% of accuracy; the corresponding linear regression is of the type:
This equation allows us to set up the minimum required time for the aging determination test as a function of the depth of discharge caused by the test. Indeed, since we should know the discharge intensity at which the aging test is running,
Itest, and if we set up a maximum value of the DOD for the test,
(DOD)set, we have:
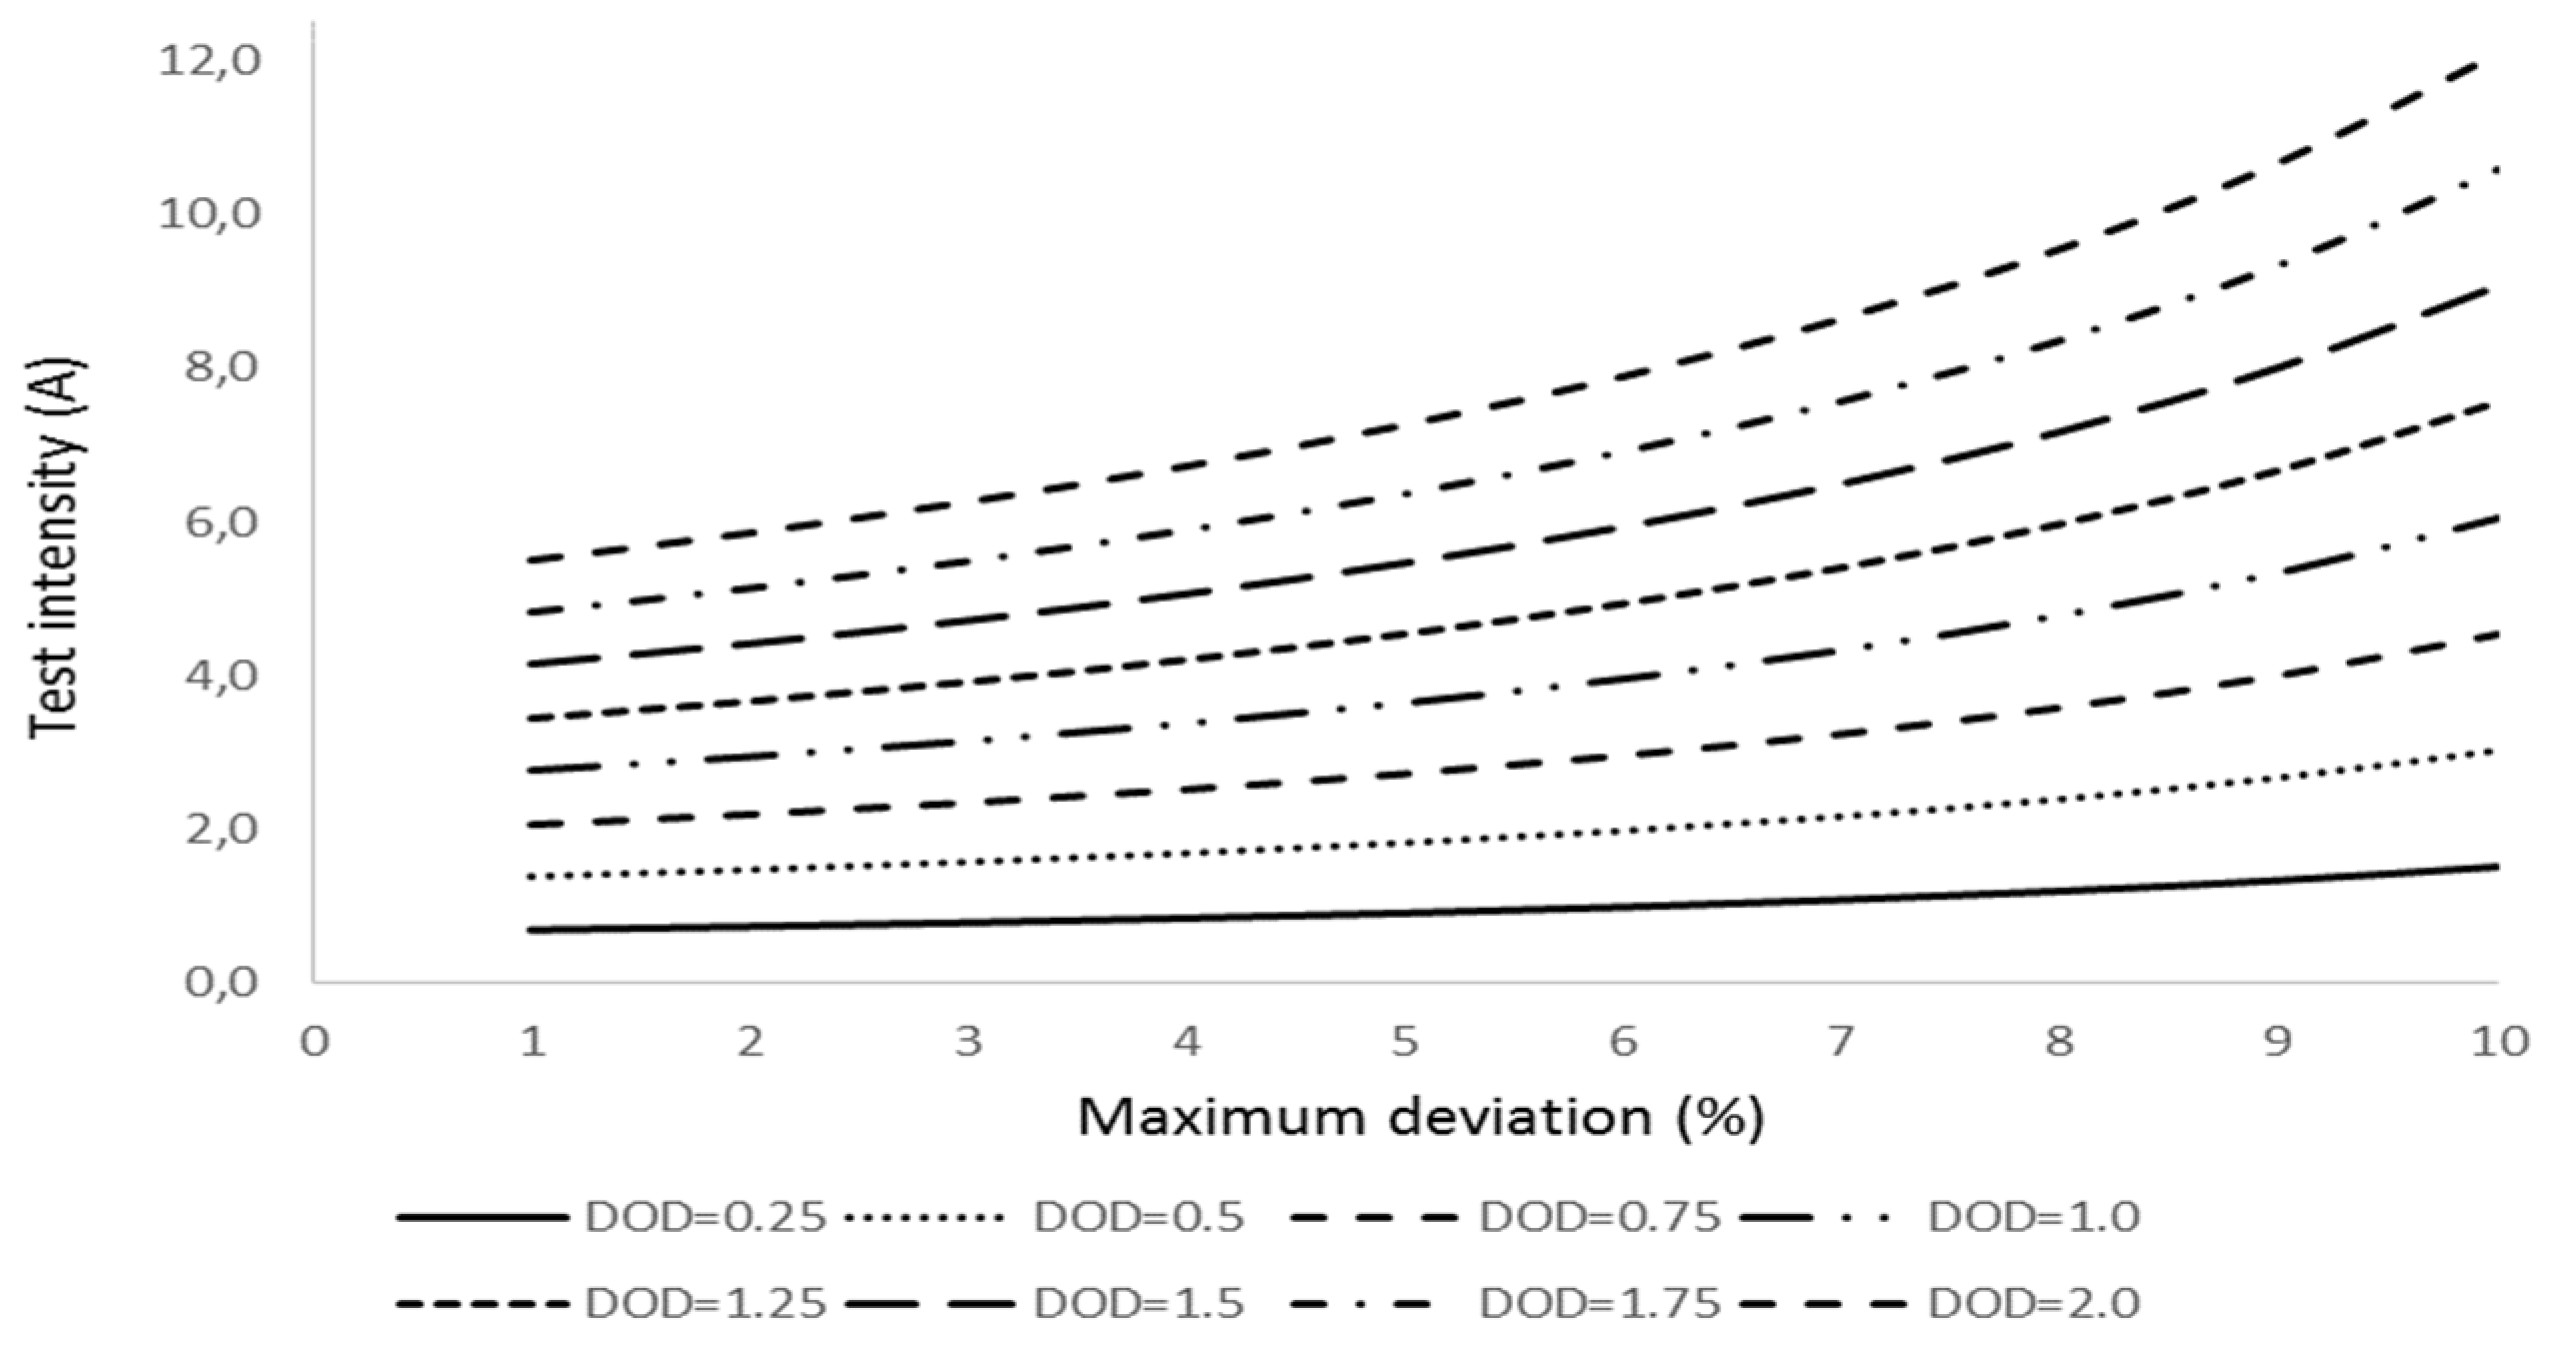
Equation (31) permits to regulate the aging test discharge intensity for the maximum set up value of (DOD) and aging factor deviation, δ.
We obtain moderate values of the initial test intensity if the allowed DOD is low; however, the intensity increases rapidly for intermediate and high values of the DOD.
The maximum test duration expresses as:
Since the DOD related to the aging test refers to the corrected battery capacity due to the discharge rate.
Figure 5 shows the evolution of the test intensity for the different values of DOD and aging factor deviation.
If, for instance, for a battery of 2.5 Ah capacity, we set up a maximum DOD of 1% and a maximum deviation of the aging factor of 5%, checking
Figure 5, we obtain a test intensity of 3.64 A; therefore, applying Equation (32), we have:
That is the duration of the test for the aging factor determination.
-
b)
State of charge
Once the aging factor is determined, we run a group of tests to validate the state of charge determination method, consisting in a controlled discharge process at a constant intensity from 1 A to 5A in 1 A interval. We apply the two discharge groups to aged and non-aged batteries. For the aged batteries, we use three different batteries with an aging factor of 0.178, 0.335, and 0.486; therefore, we can analyze the influence of the aging factor on the determination of the state of charge.
To determine the state of charge, we use two different methods. In the first one we apply the simulation developed in present work (Equation (11)) basing on the battery voltage measurement during discharge at regular intervals of 5 minutes; in the second one we evaluate the charged extracted from the battery at the experimental test applying Equation (1). Since we operate at constant intensity, we calculate the extracted charge,
Qout, using the expression:
where
top is the operating time, and
ID the discharge intensity.
The term
QD in Equation (1) computes for the global discharge time,
tD; therefore, we obtain the experimental value of the state of charge from the following equation:
tm represents the time at which we measure the battery voltage.
We present the results of the state of charge in two paired graphs; one shows the evolution of the SOC during discharge for the different discharge intensity, the other the ratio of experimental to theoretical value, which indicates the accuracy in determining the state of charge using the proposed methodology. Solid line in the SOC evolution figure corresponds to the theoretical calculation using the algorithm of Equation (11), while dashed line accounts for the experimental values.
Figure 6.
State of charge evolution for non-aged battery with discharge time for different discharge intensity (left); theoretical to experimental ratio of the state of charge for the discharge test for different discharge intensity (right).
Figure 6.
State of charge evolution for non-aged battery with discharge time for different discharge intensity (left); theoretical to experimental ratio of the state of charge for the discharge test for different discharge intensity (right).
Figure 7.
State of charge evolution for aged battery (fag=0.178) with discharge time for different discharge intensity (left); theoretical to experimental ratio of the state of charge for the discharge test for different discharge intensity (right).
Figure 7.
State of charge evolution for aged battery (fag=0.178) with discharge time for different discharge intensity (left); theoretical to experimental ratio of the state of charge for the discharge test for different discharge intensity (right).
Figure 8.
State of charge evolution for aged battery (fag=0.335) with discharge time for different discharge intensity (left); theoretical to experimental ratio of the state of charge for the discharge test for different discharge intensity (right).
Figure 8.
State of charge evolution for aged battery (fag=0.335) with discharge time for different discharge intensity (left); theoretical to experimental ratio of the state of charge for the discharge test for different discharge intensity (right).
Figure 9.
State of charge evolution for aged battery (fag=0.486) with discharge time for different discharge intensity (left); theoretical to experimental ratio of the state of charge for the discharge test for different discharge intensity (right).
Figure 9.
State of charge evolution for aged battery (fag=0.486) with discharge time for different discharge intensity (left); theoretical to experimental ratio of the state of charge for the discharge test for different discharge intensity (right).
Analyzing figures from different tests, we realize there is a high agreement between theoretical values and experimental results (graphics on the left) for all the discharge intensities and for the aged and non-aged battery. On the other hand, looking at the graphs on the right, we notice that the accuracy in predicting the state of charge decreases with the intensity increase and the depth of discharge. The effect is more evident as the battery ages. Table 3 summarizes the average accuracy for every discharge rate and battery.
Table 3.
Theoretical to experimental ratio of the state of charge for aged and non-aged lithium batteries.
Table 3.
Theoretical to experimental ratio of the state of charge for aged and non-aged lithium batteries.
| Type of battery |
Discharge intensity (A) |
Parameter |
| |
1 |
2 |
3 |
4 |
5 |
(%) |
| Non-aged |
99.0 |
98.6 |
98.4 |
98.0 |
97.9 |
Average ratio |
| ±1.2 |
±2.0 |
±3.5 |
±4.0 |
±6.9 |
STD |
| Aged |
fa=0.162 |
98.7 |
98.0 |
97.2 |
96.7 |
96.5 |
Average ratio |
| ±2.1 |
±3.4 |
±3.8 |
±4.4 |
±8.7 |
STD |
| fa=0.335 |
95.5 |
95.8 |
95.4 |
94.3 |
92.9 |
Average ratio |
| ±5.0 |
±7.0 |
±9.0 |
±11.2 |
±12.1 |
STD |
| fa=0.486 |
91.2 |
91.8 |
90.1 |
89.5 |
88.4 |
Average ratio |
| ±8.1 |
±9.4 |
±11.1 |
±14.0 |
±14.0 |
STD |
The analysis of results in Table 3 confirms that the determination of the lithium batteries state of charge diminishes its accuracy as the discharge rate and aging increase. Nevertheless, the obtained results are promising since we predict the SOC on average value of 98.4% for non-aged batteries and 97.4%, 94.8% and 90.2% for low, medium and deep aged batteries, respectively.
Statistical analysis of data from Table 3 shows a dispersion factor that increases with aging and discharge rate, in a similar way that the average value of the accuracy in the battery state of charge determination. We realize that for all the cases, the standard deviation (STD) increases as the discharge rate and aging factor does.
Conclusions
A new method to determine the state of charge in lithium-ion batteries is proposed and developed. This method resides bases on the linear evolution of the battery voltage with discharge time.
A capacity correction factor, which depends on the discharge rate, applies to determining the battery current capacity. This correction is critical to enhance the accuracy of the state of charge prediction.
The proposed model considers the aging effects for calculating the battery state of charge. These effects characterize by an aging factor, which modifies the battery state of charge. We propose a method to estimate the aging factor. This method resides on a simulation process, which determines the battery aging with enough accuracy.
We determined the aging factor of the tested batteries within a 90.4% accuracy for a testing process of 15 s; this value improves if the test interval enlarges up to 30 s, where the precision in the determination of the aging factor is around 96%. Longer testing time presents, however, the inconvenience of discharging the battery more than 1% of its total capacity, which represents a significant energy loss.
The developed simulation for the aging factor determination permits the user to calculate the duration of the test provided we set up the maximum value of the battery depth of discharge associated to the test and the accuracy in determining the aging factor.
The proposed method determines the lithium battery state of charge within high accuracy, although depending on the discharge rate and the battery aging. For non-aged batteries, the method determines the state of charge with an average precision higher than 98%; if we used aged batteries, the accuracy depends on the battery age; for a slightly aged battery, with an aging factor of 17.8%, the average accuracy in determining the battery state of charge is 97.4%. However, if the battery ages up to an aging factor 0.486, the average SOC accuracy reduces to 90.2%.
The discharge rate also influences the state of charge determination accuracy; indeed, for low rate discharges, 0.4C, the average value, considering aged and non-aged batteries, is 96.1%, while for medium to high discharge rates, 2C and over, the accuracy in determining the SOC is 93.9%. The high precision in determining the SOC in lithium-ion batteries allows the user to predict the remaining charge, thus, the autonomy of the operating system.
We also developed a statistical analysis on the results of the battery state of charge determination to evaluate their spreading; a high dispersion represents a drawback because of the uncertainty in the current state of charge and, consequently, in the battery autonomy.
The statistical analysis results show that, for non-aged batteries, the average standard deviation is only σ=3.52, representing a low value below an acceptable threshold of σ=5. Low degraded batteries with aging factor below 0.2 show a similar behavior with average standard deviation below the threshold (σ=4.48).
The standard deviation for aged batteries exceeds the setup threshold, with average characteristic values of σ=8.88 and σ=11.32 for the intermediate (fag=0.335) and high (fag=0.485) degraded battery. These results indicate that the state of charge estimation for medium and high degraded lithium batteries suffer from uncertainty.


