Submitted:
16 June 2024
Posted:
18 June 2024
You are already at the latest version
Abstract
Keywords:
1. Introduction
2. Materials and Methods
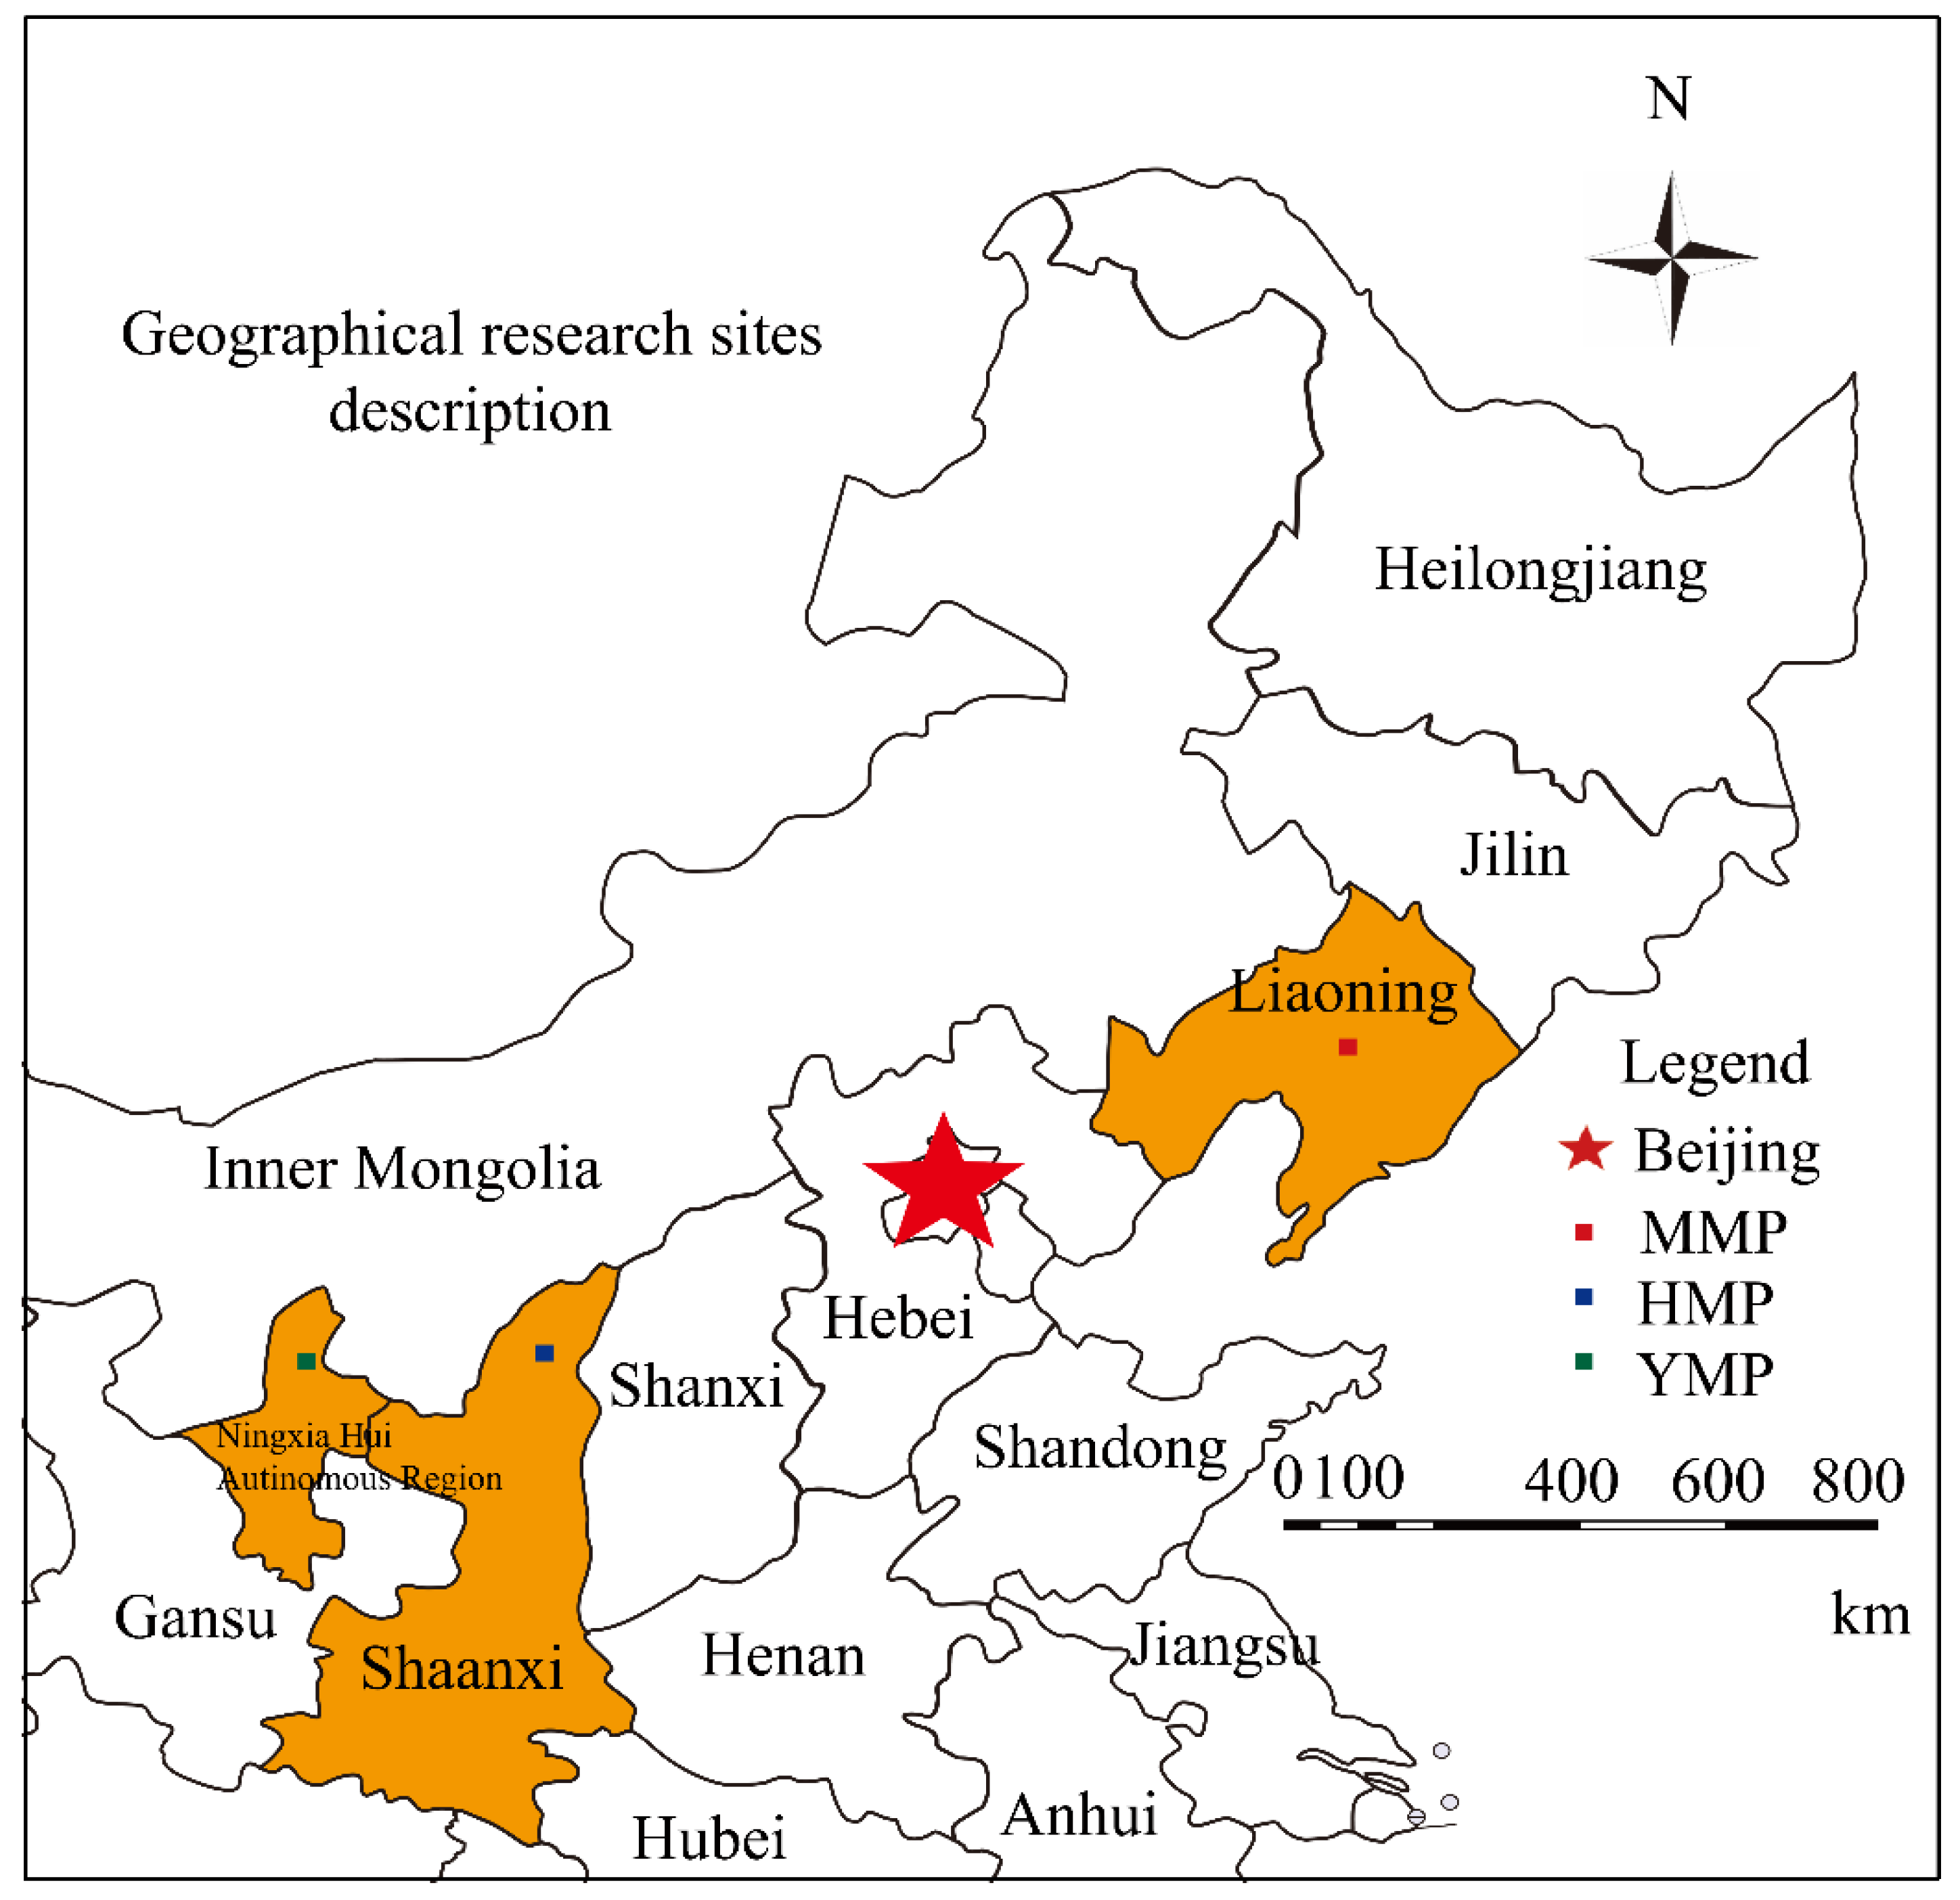
2.1. Study Sites
2.2. Sap Flow and Leaf Area/Sapwood Area
2.3. Leaf and Soil Water Potentials
2.4. Hydraulic Conductance
2.5. Environmental Variables
2.6. Hydraulic Compensation
2.6. Plant Water Transport Regulation: Isohydric / Anisohydric Behaviors
3. Results
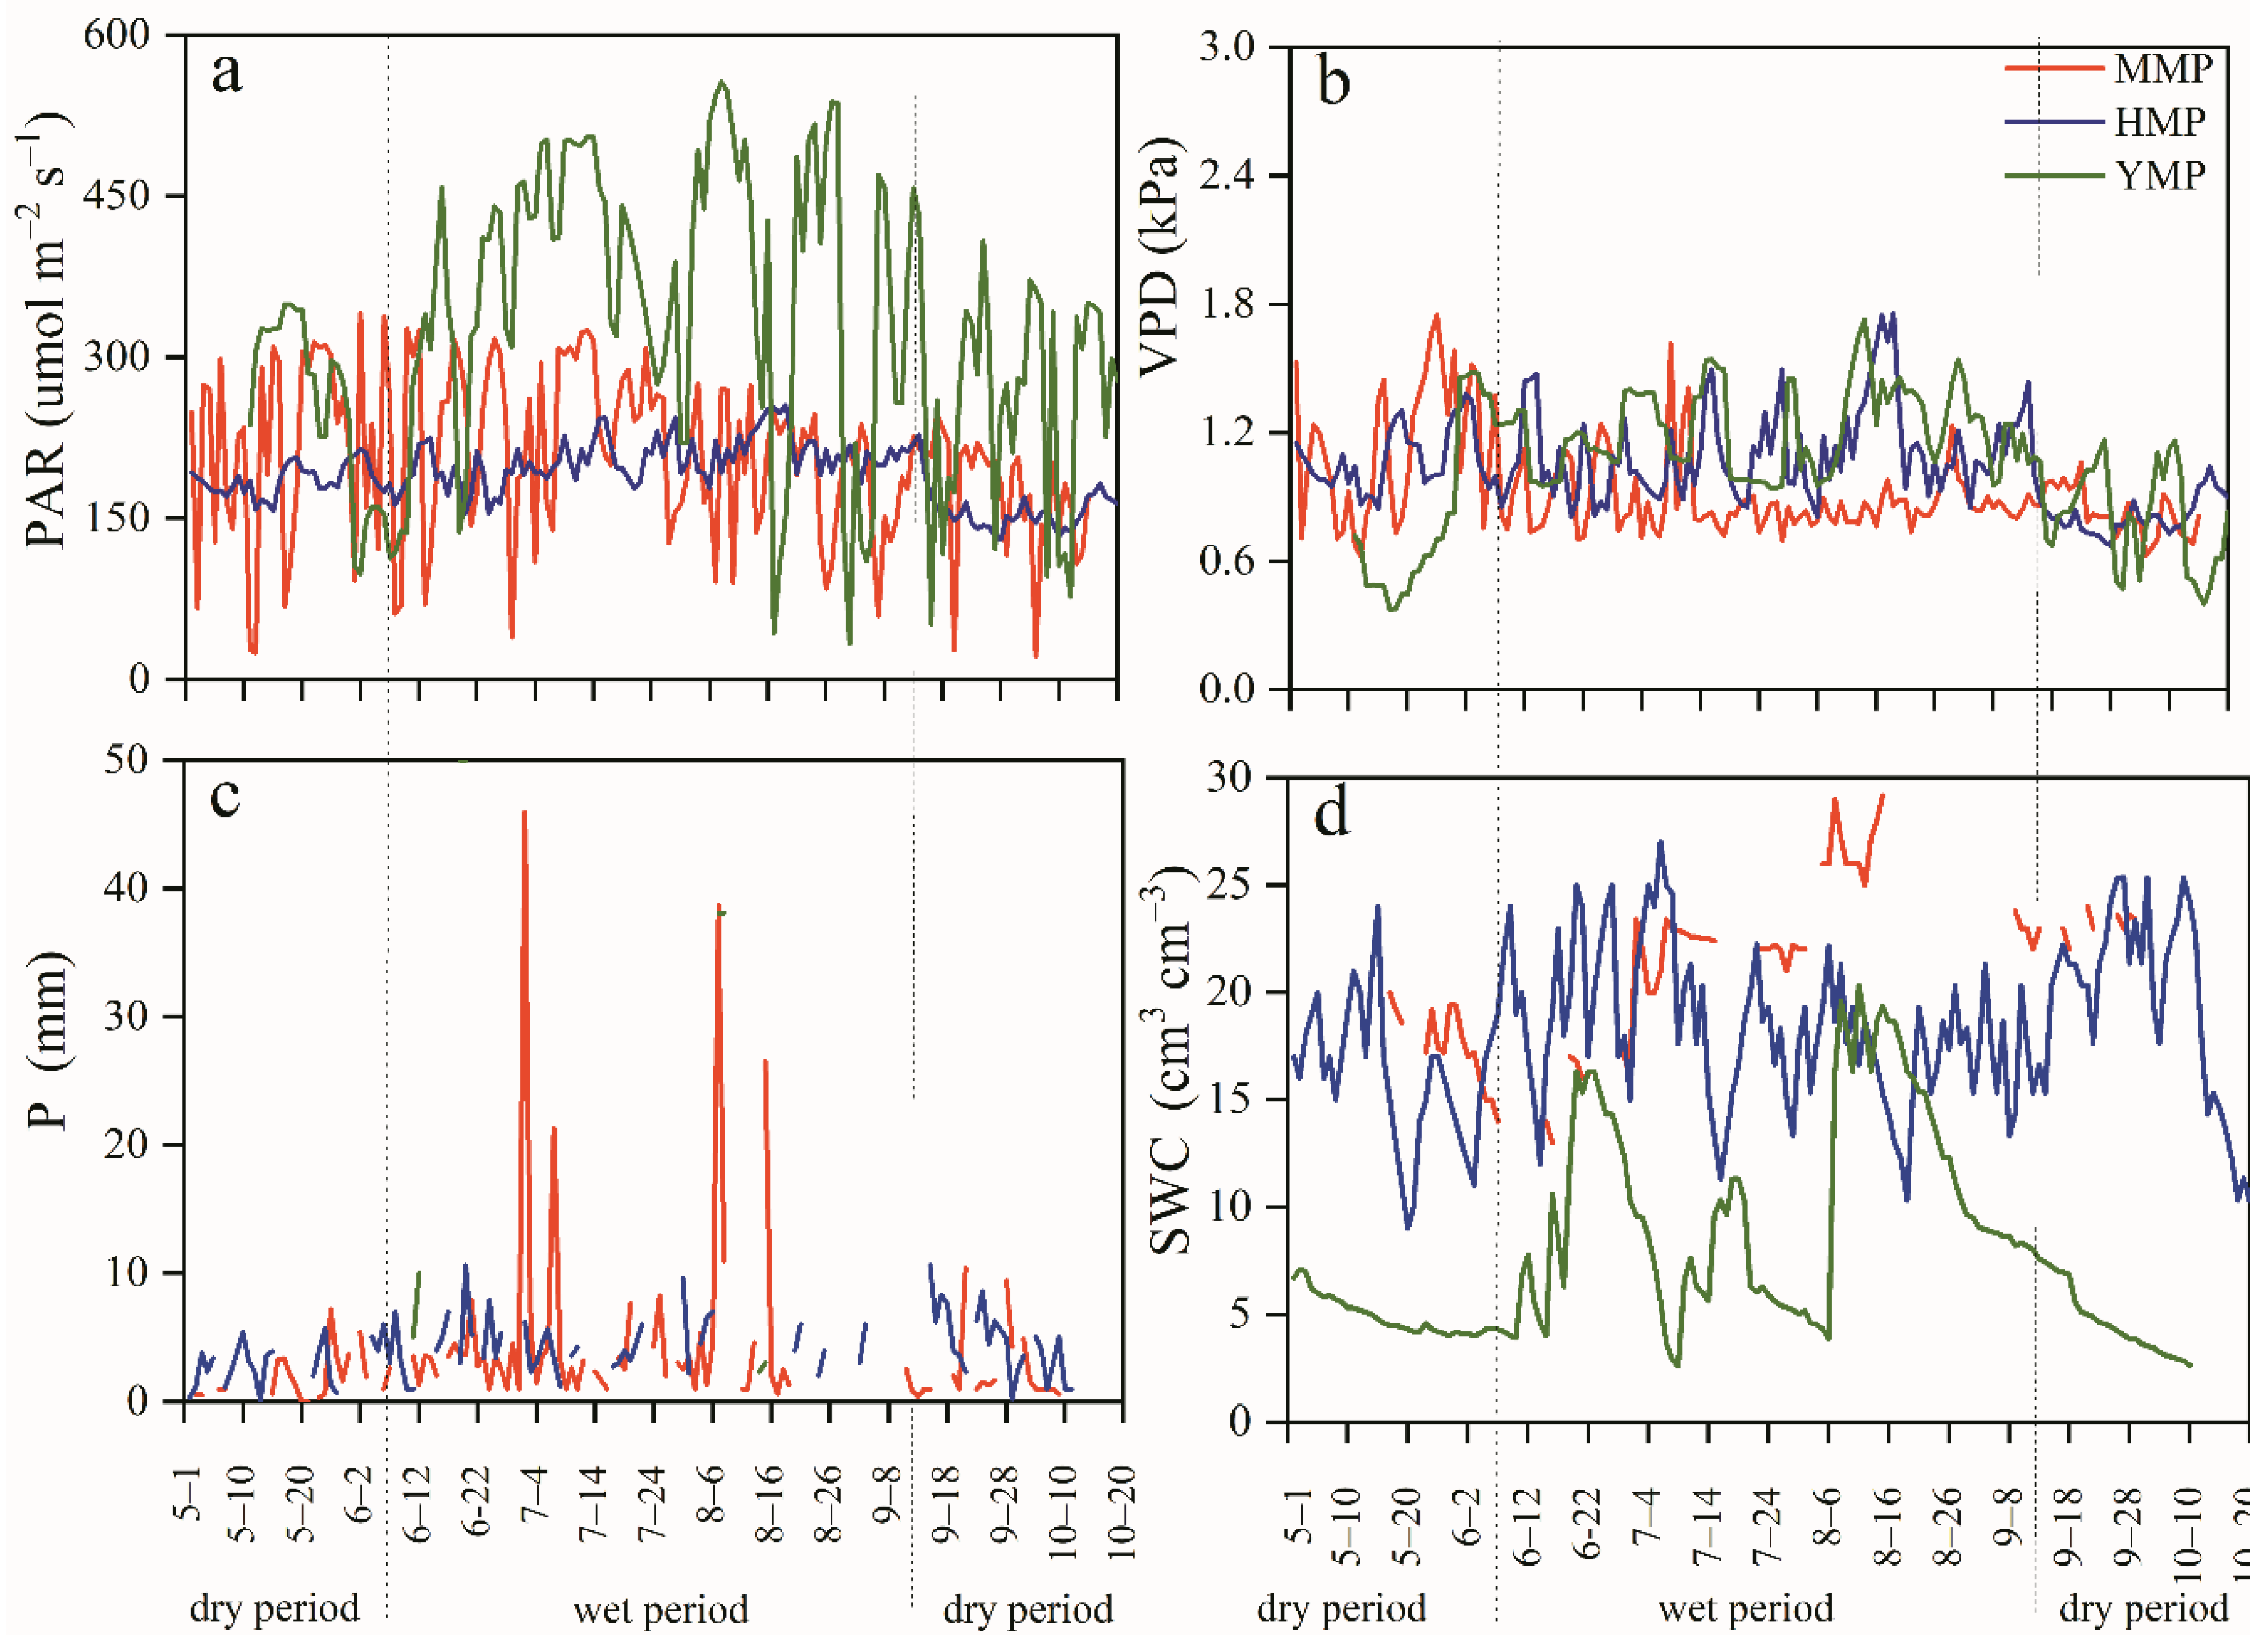
3.1. Atmospheric and Soil Moisture Changes
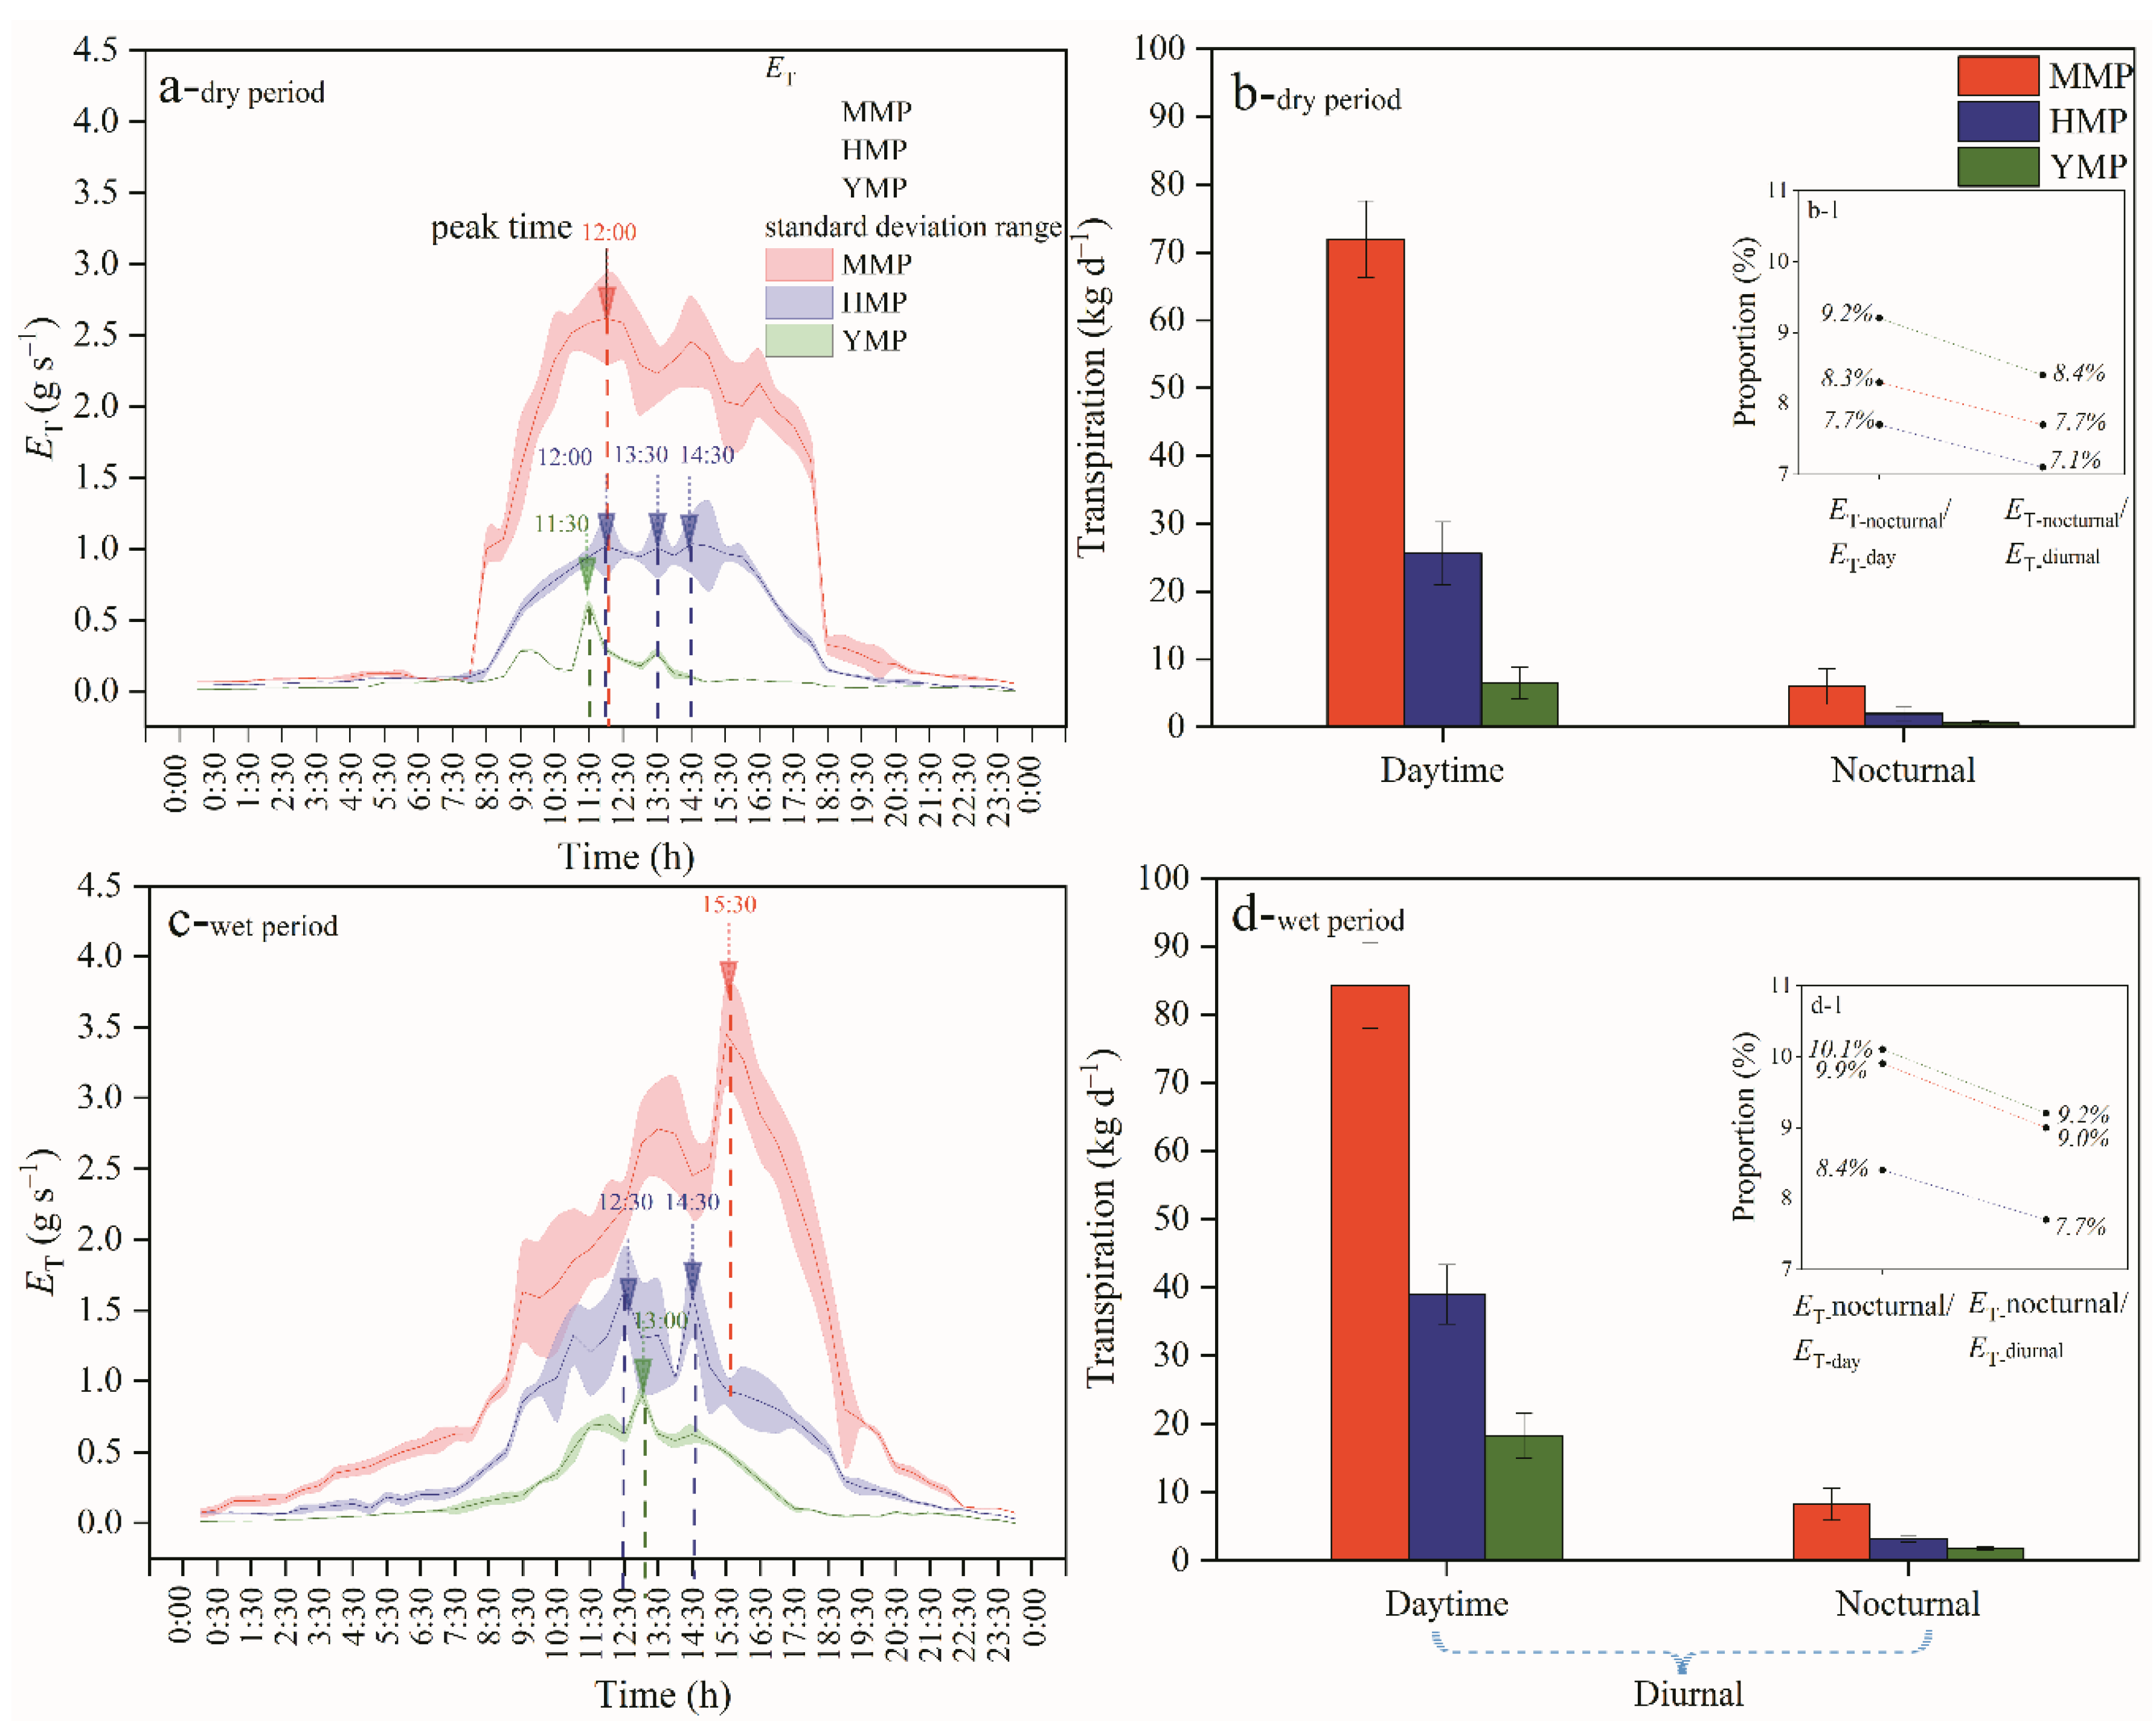
3.2. Tree Water Consumption
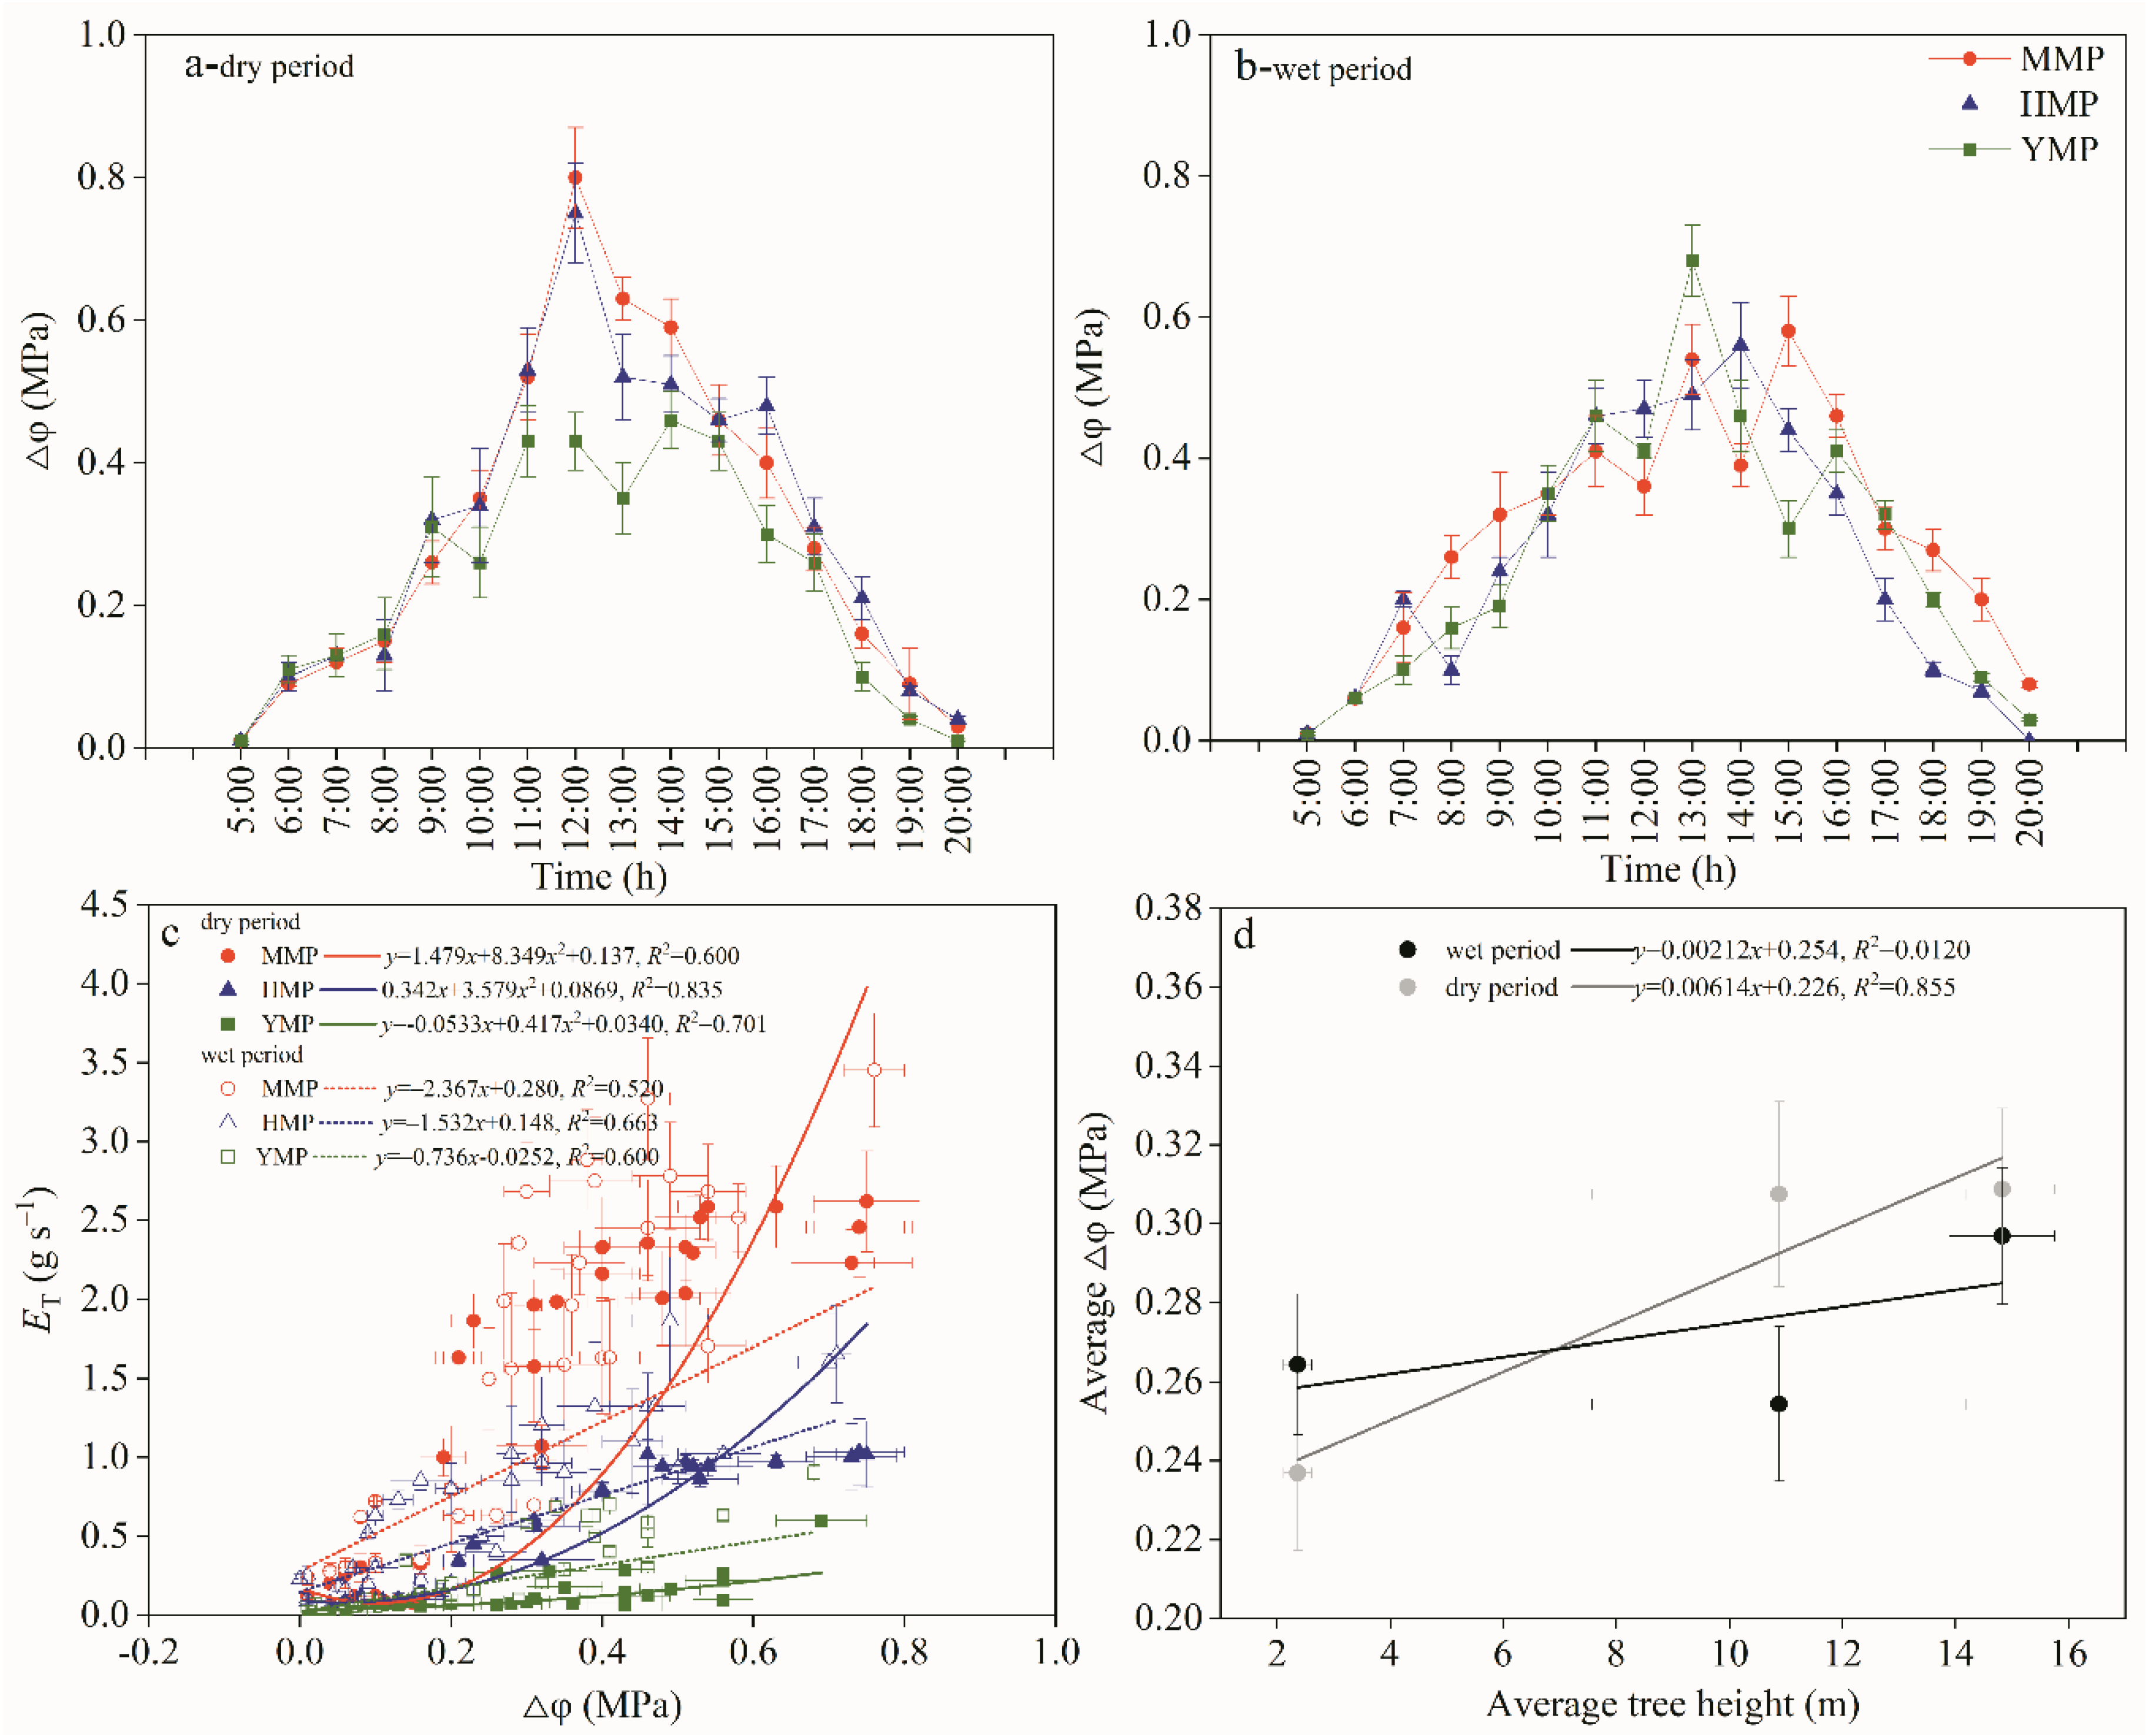
3.3. Relations Between Tree Water Consumption and Soil to Leaf Water Potential Difference
3.4. Whole Tree Hydraulic Conductance Changes
3.5. Hydraulic Compensation
3.6. Water Transport Regulation in Plants
4. Discussion
4.1. Seasonal Transpiration Dynamics
4.2. Hydraulic Compensation Effect
4.3. Quantification the Mechanisms of Plant Water Transport Regulation
5. Conclusions
Author Contributions
Funding
Acknowledgments
Conflicts of Interest
References
- DeKauwe, M.G.; Medlyn, B.E.; Zaehle, S.; Walker, A.P.; Dietze, M.C.; Hickler, T.; Jain, A.K.; Luo, Y. Forest water use and water use efficiency at elevated CO2: a model-data intercomparison at two contrasting temperate forest FACE sites. Global Change Biol. 2013, 19, 1759–1779. [Google Scholar] [CrossRef] [PubMed]
- Gordo, O.; Sanz, J.J. Impact of climate change on plant phenology in Mediterranean ecosystems. Global Change Biol. 2010, 16, 1082–1106. [Google Scholar] [CrossRef]
- Xu, C.; McDowell, N.G.; Sevanto, S.; Fisher, R.A. Our limited ability to predict vegetation dynamics under water stress. New Phytol. 2013, 200, 298–300. [Google Scholar] [CrossRef] [PubMed]
- Huang, J.; Ji, M.; Xie, Y.; Wang, S.; He, Y.; Ran, J. Global semi-arid climate change over last 60 years. Clim. Dynam. 2015, 46, 1131–1150. [Google Scholar] [CrossRef]
- Huang, J.; Yu, H.; Guan, X.; Wang, G.; Guo, R. Accelerated dryland expansion under climate change. Nat. Clim. Change. 2016, 6, 166–171. [Google Scholar] [CrossRef]
- Anderegg, W.R.L.; Kane, J.M.; Anderegg, L.D.L. Consequences of wide spread tree mortality triggered by drought and temperature stress. Nat. Clim. Change. 2013, 3, 30–36. [Google Scholar] [CrossRef]
- Zhao, M.; Running, S.W. Drought-induced reduction in global terrestrial net primary production from 2000 through 2009. Science 2010, 329, 940–943. [Google Scholar] [CrossRef] [PubMed]
- Jones, C.; Lowe, J.; Liddicoat, S.; Betts, R. Committed terrestrial ecosystem changes due to climate change. Nat. Geosci. 2009, 2, 484–487. [Google Scholar] [CrossRef]
- Deng, J.; Yu, Y.; Shao, J.; Lu, S.; Liu, F.; Li, Z.; Shi, X. Rainfall interception using the revised Gash analytical model for Pinus sylvestris var. mongolica in a semi-humid region of NE China. Ecol. Indic. 2022, 143, 109399. [Google Scholar] [CrossRef]
- Zheng, X.; Zhu, J.J.; Yan, Q.L.; Song, L.N. Effects of land use changes on the groundwater table and the decline of Pinus sylvestris var. mongolica plantations in southern Horqin Sandy Land, Northeast China. Agr. Water Manage. 2012, 109, 94–106. [Google Scholar] [CrossRef]
- Deng, J.F.; Ding, G.D.; Gao, G.L.; Wu, B.; Zhang, Y.Q.; Gao, S.; Fan, W.H. The sap flow dynamics and response of Hedysarum scoparium to environmental factors in semiarid Northwestern China. Plos One 2015, 10, e0131683. [Google Scholar] [CrossRef] [PubMed]
- Wu, B.; Ci, L.J. Landscape change and desertification development in the Mu Us Sandy land, Northern China. J. Arid Environ. 2002, 50, 429–444. [Google Scholar] [CrossRef]
- Bo, T.L.; Ma, P.; Zheng, X.J. Numerical study on the effect of semi-buried straw checkerboard sand barriers belt on the wind speed. Aeolian Res. 2015, 16, 101–107. [Google Scholar] [CrossRef]
- Li, X.R.; Ji, R.L.; Chen, Y.W.; Huang, L.; Zhang, P. Association of ant nests with successional stages of biological soil crusts in the Tengger Desert, Northern China. Appl. Soil Ecol. 2011, 47, 59–66. [Google Scholar] [CrossRef]
- Tang, Y.; Li, X. Simulating effects of precipitation and initial planting density on population size of Mongolian pine in the Horqin Sandy Land, China. Agroforest Syst. 2018, 92, 1–9. [Google Scholar] [CrossRef]
- Chen, F.S.; Zeng, D.H.; Zhou, B.; Singh, A.N.; Fan, Z.P. Seasonal variation in soil nitrogen availability under Mongolian pine plantations at the Keerqin Sand Lands, China. J. Arid Environ. 2006, 67, 226–239. [Google Scholar] [CrossRef]
- Deng, J.F.; Yao, J.Q.; Zheng, X.; Gao, G.L. Transpiration and canopy stomatal conductance dynamics of Mongolian pine plantations in semiarid deserts, Northern China. Agr. Water Manage. 2021, 249, 106806. [Google Scholar] [CrossRef]
- Zeng, D.H.; Hu, Y.L.; Chang, S.X.; Fan, Z.P. Land cover change effects on soil chemical and biological properties after planting Mongolian pine (Pinus sylvestris var. mongolica) in sandy lands in Keerqin, northeastern China. Plant Soil. 2009, 317, 121–133. [Google Scholar] [CrossRef]
- Martínez-Vilalta, J.; Cochard, H.; Mencuccini, M.; Sterck, F.; Herrero, A.; Korhonen, J.F.J.; Llorens, P.; Nikinmaa, E.; Nolc, A.; Poyatos, R.; Ripullone, F.; Sass-Klaassen, U.; Zweifel, R. Hydraulic adjustment of Scots pine across Europe. New Phytol. 2009, 184, 353–364. [Google Scholar] [CrossRef]
- Song, L.N.; Zhu, J.J.; Li, M.C.; Zhang, J.X.; Zheng, X.; Wang, K. Canopy transpiration of Pinus sylvestris var. mongolica in a sparse wood grassland in the semiarid sandy region of Northeast China. Agr. Forest Meteorol. 2018, 250–251, 192–201. [Google Scholar] [CrossRef]
- Deng, J. Fitting the revised Gash analytical model of rainfall interception to Mongolian Scots pines in Mu Us Sandy Land, China. Trees Forest. People 2020, 1, 100007. [Google Scholar] [CrossRef]
- Song, L.; Zhu, J.; Li, M.; Zhang, J.; Lv, L. Sources of water used by Pinus sylvestris var. mongolica trees based on stable isotope measurements in a semiarid sandy region of Northeast China. Agr. Water Manage. 2016, 164, 281–290. [Google Scholar] [CrossRef]
- Lenoir, J.; Gegout, J.C.; Marquet, P.A.; Ruffray, P.D.; Brisse, H. A significant upwards hift in plant species optimum elevation during the 20th century. Science 2008, 320, 1768–1771. [Google Scholar] [CrossRef] [PubMed]
- Song, L.N.; Li, M.C.; Zhu, J.J.; Zhang, J.X. Comparisons of radial growth and tree ring cellulose δ13C for Pinus sylvestris var. mongolica in natural and plantation forests on sandy lands. J. Forest Res-Jpn. 2017, 22, 160–168. [Google Scholar] [CrossRef]
- Pockman, W.T.; Sperry, J.S.; O’Leary, J.W. Sustained and significant negative water pressure in xylem. Nature 1995, 378, 715–716. [Google Scholar] [CrossRef] [PubMed]
- McDowell, N.G.; Ryan, M.G.; Zeppel, M.J.B.; Tissue, D.T. Improving our knowledge of drought-induced forest mortality through experiments, observations, and modeling. New Phytol. 2013, 200, 289–293. [Google Scholar] [CrossRef] [PubMed]
- Martínez-Vilalta, J.M.; Poyatos, R.; Aguadé, D.; Retana, J.; Mencuccini, M. A new look at water transport regulation in plants. New Phytol. 2014, 204, 105–115. [Google Scholar] [CrossRef] [PubMed]
- Martínez-Sancho, E.; Dorado-Liñán, I.; Hacke, U.G.; Seidel, H.; Annette, M. Contrasting hydraulic architectures of Scots Pine and Sessile Oak at their southernmost distribution limits. Front. Plant Sci. 2017, 8, 598. [Google Scholar] [CrossRef]
- Martínez-Vilalta, J.; Sala, A.; Piñol, J. The hydraulic architecture of Pinaceae—a review. Plant Ecol. 2004, 171, 3–13. [Google Scholar] [CrossRef]
- Poyatos, R.; Martínez-Vilalta, J.; Cěrmák, J.; Ceulemans, R.; Granier, A.; Irvine, J.; Köstner, B.; Lagergren, F.; Meiresonne, L.; Nadezhdina, N.; Zimmermann, R.; Llorens, P.; Mencuccini, M. Plasticity in hydraulic architecture of Scots pine across Eurasia. Oecologia 2007, 153, 245–259. [Google Scholar] [CrossRef]
- Anderegg, L.D.L.; Hillerislambers, J. Drought stress limits the geographic ranges of two tree species via different physiological mechanisms. Global Change Biol. 2016, 22, 1029–1045. [Google Scholar] [CrossRef]
- Naithani, K.J.; Ewers, B.E.; Pendall, E. Sap flux-scaled transpiration and stomatal conductance response to soil and atmospheric drought in a semi-arid sagebrush ecosystem. J. Hydrol. 2012, 464–465, 176–185. [Google Scholar] [CrossRef]
- Martre, P.; North, G.B.; Nobel, P.S. Hydraulic conductance and mercury-sensitive water transport for roots of Opuntia acanthocarpa in relation to soil drying and rewetting. Plant Physiol. 2001, 126, 352–362. [Google Scholar] [CrossRef]
- Williams, M.; Bond, B.J.; Ryan, M.G. Evaluating different soil and plant hydraulic constraints on tree function using a model and sap flow data from ponderosa pine. Plant, Cell and Environ. 2010, 24, 679–690. [Google Scholar] [CrossRef]
- McDowell, N.G.; Phillips, N.; Lunch, C.; Bond, B.J.; Ryan, M.G. An investigation of hydraulic limitation and compensation in large, old Douglas-fir trees. Tree Physiol. 2002, 22, 763–774. [Google Scholar] [CrossRef] [PubMed]
- Sala, A. Hydraulic compensation in northern Rocky Mountain conifers: does successional position and life history matter? Oecologia 2006, 149, 1–11. [Google Scholar] [CrossRef] [PubMed]
- Leyre, C.; Eustaquio, G.P.; Eduardo, N. Differences in hydraulic architecture between mesic and xeric Pinus pinaster populations at the seedling stage. Tree Physiol. 2012, 32, 1442–1457. [Google Scholar] [CrossRef] [PubMed]
- Wullschleger, S.D.; Wilson, K.B.; Hanson, P.J. Environmental control of whole-plant transpiration, canopy conductance and estimates of the decoupling coefficient for large red maple trees. Agr. Forest Meteorol. 2000, 104, 157–168. [Google Scholar] [CrossRef]
- Oren, R.; Phillips, N.; Ewers, B.E.; Pataki, D.E. Sap-flux-scaled transpiration responses to light, vapor pressure deficit, and leaf area reduction in a flooded Taxodium distichum forest. Tree Physiol. 1999, 19, 337–347. [Google Scholar] [CrossRef]
- Pataki, D.E.; Oren, R.; Phillips, N. Responses of sap flux and stomatal conductance of Pinus taeda L. trees to stepwise reductions in leaf area. J. Exp. Bot. 1998, 49, 871–878. [Google Scholar] [CrossRef]
- Deng, J.; Ma, C.; Yu, H. Different soil particle-size classification systems for calculating volume fractal dimension-A case study of Pinus sylvestris var. Mongolica in Mu Us Sandy Land, China. Appl. Sci-Basel. 2018, 8, 1872. [Google Scholar] [CrossRef]
- Song, L.N.; Zhu, J.J.; Li, M.C.; Zhang, J.X.; Zheng, X.; Wang, K. Canopy transpiration of Pinus sylvestris var. mongolica in a sparse wood grassland in the semiarid sandy region of Northeast China. Agr. Forest Meteorol 2018, 250–251, 192–201. [Google Scholar] [CrossRef]
- Granier, A. A new method of sap flow measurement in tree stems. Ann. Sci. Forest. 1985, 42, 193–200. [Google Scholar] [CrossRef]
- Du, S.; Wang, Y.L.; Kume, T.; Zhang, J.G.; Otsuki, K.; Yamanaka, N.; Liu, G.B. Sapflow characteristics and climatic responses in three forest species in the semiarid Loess Plateau region of China. Agr. Forest Meteorol. 2011, 151, 1–10. [Google Scholar] [CrossRef]
- James, S.A.; Clearwater, M.J.; Meinzer, F.C.; Goldstein, G. Heat dissipation sensors of variable length for the measurement of sap flow in trees with deep sapwood. Tree Physiol. 2002, 22, 277–283. [Google Scholar] [CrossRef] [PubMed]
- Zhu, J.J.; Fan, Z.P.; Zeng, D.H.; Jiang, F.Q.; Matsuzaki, T. Comparison of stand structure and growth between artificial and natural forests of Pinus sylvestiris var. mongolica on sandy land. J. Forestry Res. 2003, 14, 103–111. [Google Scholar] [CrossRef]
- Steinberg, S.L.; Mcfarland, M.J.; Worthington, J.W. Comparison of trunk and branch sap flow with canopy transpiration in Pecan. J. Exp. Bot. 1990, 41, 635–659. [Google Scholar] [CrossRef]
- Comstock, J. Variation in hydraulic architecture and gas exchange in two desert sub-shrubs, Hymenoclea salsola (T. & G.) and Ambrosia dumosa. Oecologia 2000, 125, 1–10. [Google Scholar] [CrossRef]
- Mencuccini, M.; Comstock, J. Variability in hydraulicarchitecture and gas exchange of common bean (Phaseolus vulgaris) cultivars under well–watered conditions: interactionswith leaf size. Aust. J. Plant Physiol. 1999, 26, 115–124. [Google Scholar] [CrossRef]
- Qiu, R.; Kang, S.; Du, T.; Tong, L.; Hao, X.; Chen, R.; Chen, J.; Li, F. Effect of convection on the Penman–Monteith model estimates of transpiration of hot pepper grown in solar greenhouse. Sci. Hortic-Amsterdam. 2013, 160, 163–171. [Google Scholar] [CrossRef]
- Shelburne, V.B.; Hedden, R.L.; Allen, R.M. The effectsof site, stand density, and sapwood permeability on the relationship between leaf area and sapwood area in loblolly pine (Pinus taeda L.). Forest Ecol. Manag. 1993, 58, 193–209. [Google Scholar] [CrossRef]
- Zhang, Z.Z.; Zhao, P.; McCarthy, H.R.; Zhao, X.H.; Niu, J.F.; Zhu, L.W.; Ni, G.Y.; Ouyang, L.; Huang, Y.Q. Influence of the decoupling degree on the estimation of canopy stomatal conductance for two broadleaf tree species. Agr. Forest Meteorol. 2016, 221, 230–241. [Google Scholar] [CrossRef]
- Khamzina, A.; Sommer, R.; Lamers, J.P.A.; Vlek, P.L.G. Transpiration and early growth of tree plantations established on degraded cropland over shallow saline groundwater table in northwest Uzbekistan. Agr. Forest Meteorol. 2009, 149, 1865–1874. [Google Scholar] [CrossRef]
- Whitehead, D.; Hinckley, T.M. Models of water flux through forest stands: critical leaf and stand parameters. Tree Physiol. 1991, 9, 35–57. [Google Scholar] [CrossRef] [PubMed]
- Köstner, B.M.M.; Schulze, E.-D.; Kelliher, F.M.; Hollinger, D.Y.; Byers, J.N.; Hunt, J.E.; McSeveny, T.M.; Meserth, R.; Weir, P.L. Transpiration and canopy conductance in a pristine broad-leaved forest of Nothofagus: an analysis of xylem sap flow and eddy correlation measurements. Oecologia 1992, 91, 350–359. [Google Scholar] [CrossRef]
- Jarvis, P.G.; McNaughton, K.G. Stomatal control of transpiration: scaling up from leaf to region. Adv. Ecol. Res. 1986, 15, 1–49. [Google Scholar] [CrossRef]
- Hochberg, U.; Rockwell, F.E.; Holbrook, N.M.; Cochard, H. Iso/Anisohydry: A plant-environment interaction rather than a simple hydraulic trait. Trends Plant Sci. 2018, 23, 112–120. [Google Scholar] [CrossRef]
- O'Grady, A.P.; Eamus, D.; Hutley, L.B. Transpiration increases during the dry season: patterns of tree water use in eucalypt open-forests of northern Australia. Tree Physiol. 1999, 19, 591–597. [Google Scholar] [CrossRef] [PubMed]
- Myers, B.A.; Duff, G.A.; Eamus, D.; Fordyce, I.R.; A, O.G.; Williams, R.J. Seasonal variation in water relations of trees of differing leaf phenology in a wet--dry tropical savanna near Darwin, northern Australia. Aust. J. Bot. 1997, 45, 225–240. [Google Scholar] [CrossRef]
- Prior, L.D.; Eamus, D.; Duff, G.A. Seasonal and diurnal patterns of carbon assimilation, stomatal conductance and leaf water potential in Eucalyptus tetrodonta saplings in a wet-dry savanna in northern Australia. Aust. J. Bot. 1997, 45, 241–258. [Google Scholar] [CrossRef]
- Cook, P.G.; Hatton, T.J.; Pidsley, D.; Herczeg, A.L.; Held, A.A.; O’Grady, A.; Eamus, D. Water balance of a tropical woodland ecosysytem, northern Australia: a combination of micrometeorological, soil physical and groundwater chemical approaches. J. Hydrol. 1998, 210, 161–177. [Google Scholar] [CrossRef]
- Liu, X.; Zhang, B.; Zhuang, J.Y.; Han, C.; Zhai, L.; Zhao, W.Z.; Zhang, J.C. The relationship between sap flow density and environmental factors in the Yangtze River Delta region of China. Forests 2017, 8, 74. [Google Scholar] [CrossRef]
- Song, L.; Zhu, J.; Zheng, X.; Wang, K.; Lü, L.; Zhang, X.; Hao, G. Transpiration and canopy conductance dynamics of Pinus sylvestris var. mongolica in its natural range and in an introduced region in the sandy plains of Northern China. Agr. Forest Meteorol. 2020, 281, 107830. [Google Scholar] [CrossRef]
- Urban, J.; Rubtsov, A.V.; Urban, A.V.; Shashkin, A.V.; Benkova, V.E. Canopy transpiration of a Larix sibirica and Pinus sylvestris forest in Central Siberia. Agr. Forest Meteorol. 2019, 271, 64–72. [Google Scholar] [CrossRef]
- Pataki, D.E.; Oren, R.; Smith, A.W. Sap flux of co-occurring species in a western subalpine forest during seasonal soil drought. Ecology 2000, 81, 2557–2566. [Google Scholar] [CrossRef]
- Granier, A.; Huc, R.; Barigah, S.T. Transpiration of natural rainforest and its dependence on climatic factors. Agr. Forest Meteorol. 1996, 78, 19–29. [Google Scholar] [CrossRef]
- Moore, G.W.; Cleverly, J.R.; Owens, M.K. Nocturnal transpiration in riparian Tamarix thickets authenticated by sap flux, eddy covariance and leaf gas exchange measurements. Tree Physiol. 2008, 28, 521–528. [Google Scholar] [CrossRef] [PubMed]
- Sellin, A.; Lubenets, K. Variation of transpiration within a canopy of silver birch: effect of canopy position and daily versus nightly water loss. Ecohydrology 2010, 3, 467–477. [Google Scholar] [CrossRef]
- Pataki, D.E.; Oren, R. Species differences in stomatal control of water loss at the canopy scale in amature bottom land deciduous forest. Adv. Water Resour. 2003, 26, 1267–1278. [Google Scholar] [CrossRef]
- Liu, B.; Zhao, W.Z.; Jin, B.W. The response of sap flow in desert shrubs to environmental variables in an arid region of China. Ecohydrology 2011, 4, 448–457. [Google Scholar] [CrossRef]
- Brown, H.R. The theory of the rise of sap in trees: some historical and conceptual remarks. Phys. Perspect. 2013, 15, 320–358. [Google Scholar] [CrossRef]
- Lu, P.; Biron, P.; Granier, A.; Cochard, H. Water relations of adult Norway spruce (Picea abies (L) Karst) under soil drought in the Vosges mountains: water potential, stomatal conductance and transpiration. Ann. Forest Sci. 1996, 53, 113–121. [Google Scholar] [CrossRef]
- Sperry, J.S. Hydraulic constraints on plant gas exchange. Agr. Forest Meteorol. 2000, 104, 13–23. [Google Scholar] [CrossRef]
- Loustau, D.; Berbigier, P.; Roumagnac, P.; Arruda-Pacheco, C.; David, J.S.; Ferreira, M.I.; Pereira, J.S.; Tavares, R. Transpiration of a 64 year old maritime pine stand in Portugal. 1. Seasonal course of water flux through maritime pine. Oecologia 1996, 107, 33–42. [Google Scholar] [CrossRef] [PubMed]
- Martínez-Vilalta, J.; Prat, E.; Oliveras, I.; Piñol, J. Hydraulic properties of roots and stems of nine woody species. Oecologia 2002, 133, 19–29. [Google Scholar] [CrossRef]
- Peguero-Pina, J.J.; Sancho-Knapik, D.; Cochard, H.; Barredo, G.; Villarroya, D.; Gil-Pelegrín, E. Hydraulic traits limit the distribution range of two closely related Mediterranean firs, Abies alba Mill. and Abies pinsapo Boiss. Tree Physiol. 2011, 31, 1067–1075. [Google Scholar] [CrossRef] [PubMed]
- Brodribb, T.J.; Holbrook, N.M.; Zwieniecki, M.A.; Palma, B. Leaf hydraulic capacity in ferns, conifers and angiosperms: impacts on photosynthetic maxima. New Phytol. 2005, 165, 839–846. [Google Scholar] [CrossRef]
- Tsuda, M.; Tyree, M.T. Plant hydraulic conductance measured by the high pressure flow meter in crop plants. J. Exp. Bot. 2000, 51, 823–828. [Google Scholar] [CrossRef]
- Tyree, M.T.; Ewers, F.W. The hydraulic architecture of trees and other woody plants. New Phytol. 1991, 119, 345–360. [Google Scholar] [CrossRef]
- Vilagrosa, A.; Bellot, J.; Vallejo, R.; Gil-Pelegrín, E. Cavitation, stomatal conductance, and leaf dieback in seedlings of two co-occurring Mediterranean shrubs during an intense drought. J. Am. Coll. Surgeons. 2003, 54, 2015–2024. [Google Scholar] [CrossRef]
- Martínez-Vilalta, J.; Garcia-Forner, N. Water potential regulation, stomatal behaviour and hydraulic transport under drought: deconstructing the iso/anisohydric concept. Plant Cell and Environ. 2017, 40, 962–976. [Google Scholar] [CrossRef] [PubMed]
- Ryan, M.G.; Yoder, B.J. Hydraulic limits to tree height and tree growth. Bioscience 1997, 47, 235–242. [Google Scholar] [CrossRef]
- Liu, H.; Williams, A.P.; Allen, C.D.; Guo, D.; Wu, X.; Anenkhonov, O.A.; Liang, E.; Sandanov, D.; Yin, Y.; Qi, Z.; Badmaeva, N.K. Rapid warming accelerates tree growth decline in semi-arid forests of Inner Asia. Global Change Biol. 2013, 19, 2500–2510. [Google Scholar] [CrossRef]
- McDowell, N.; Pockman, W.T.; Allen, C.D.; Breshears, D.D.; Cobb, N.; Kolb, T.; Plaut, J.; Sperry, J.; West, A.; Williams, D.G.; Yepez, E.A. Mechanisms of plant survival and mortality during drought: why do some plants survive while others succumb to drought? New Phytol. 2008, 178, 719–739. [Google Scholar] [CrossRef] [PubMed]
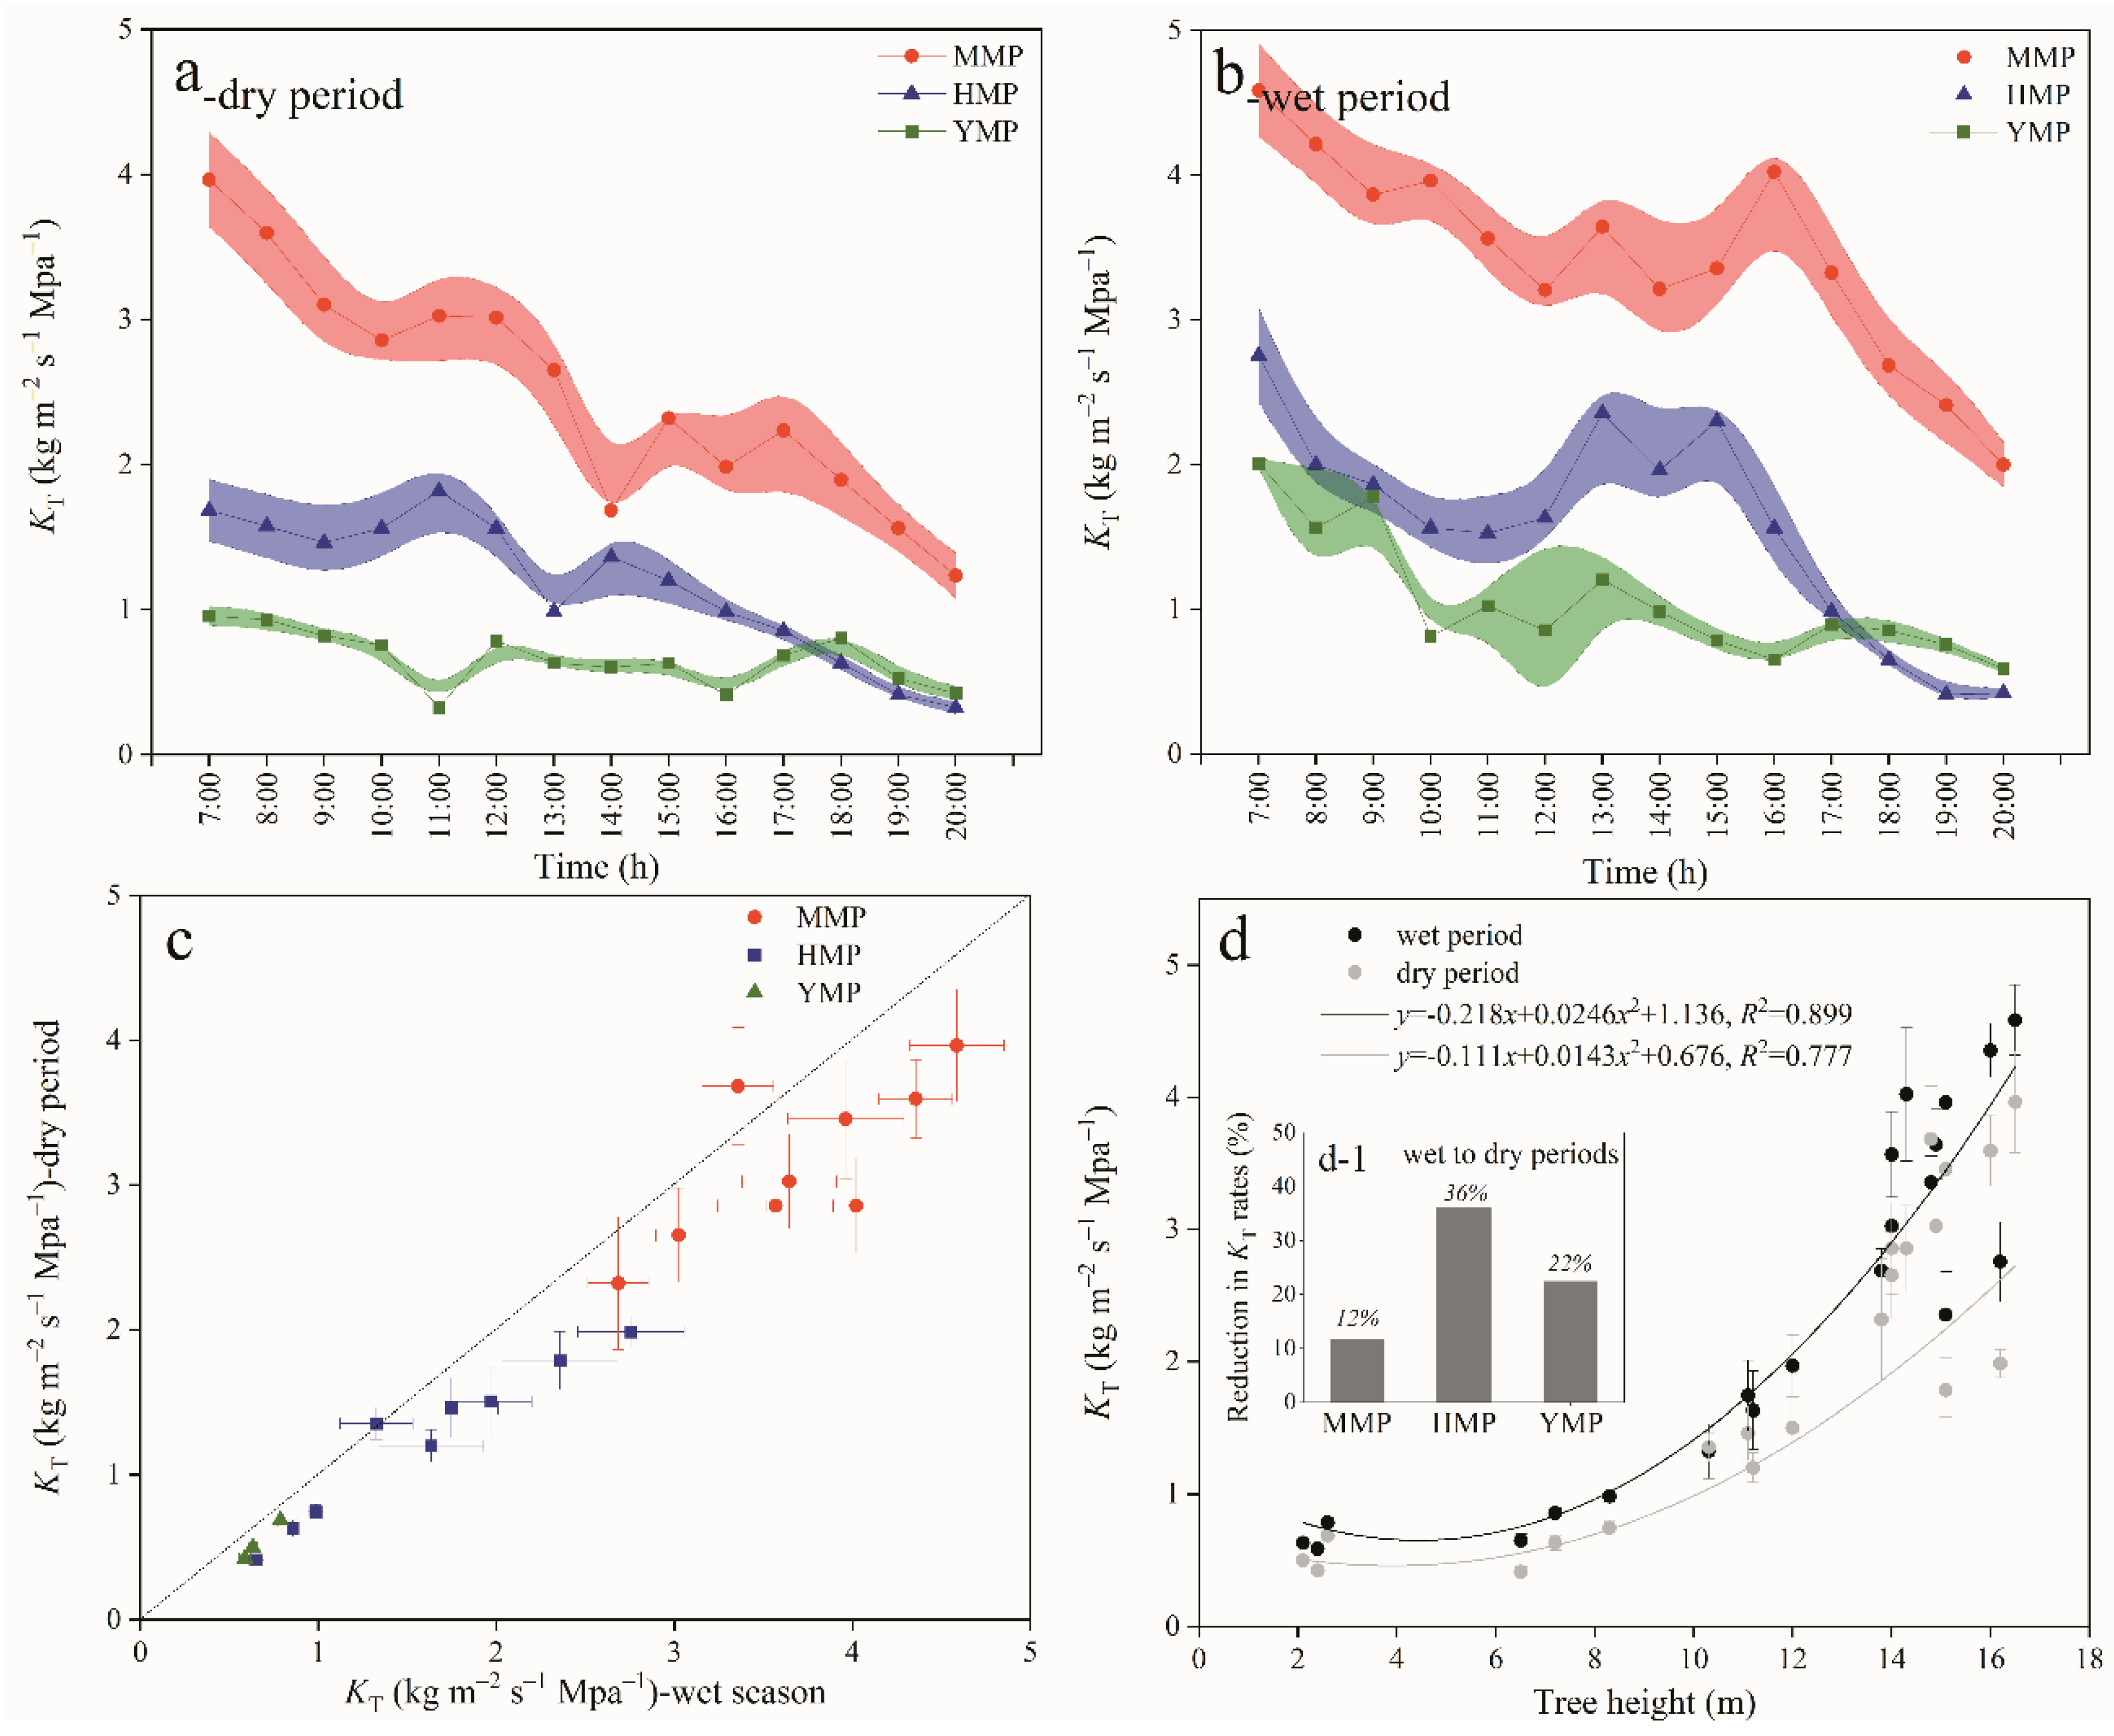
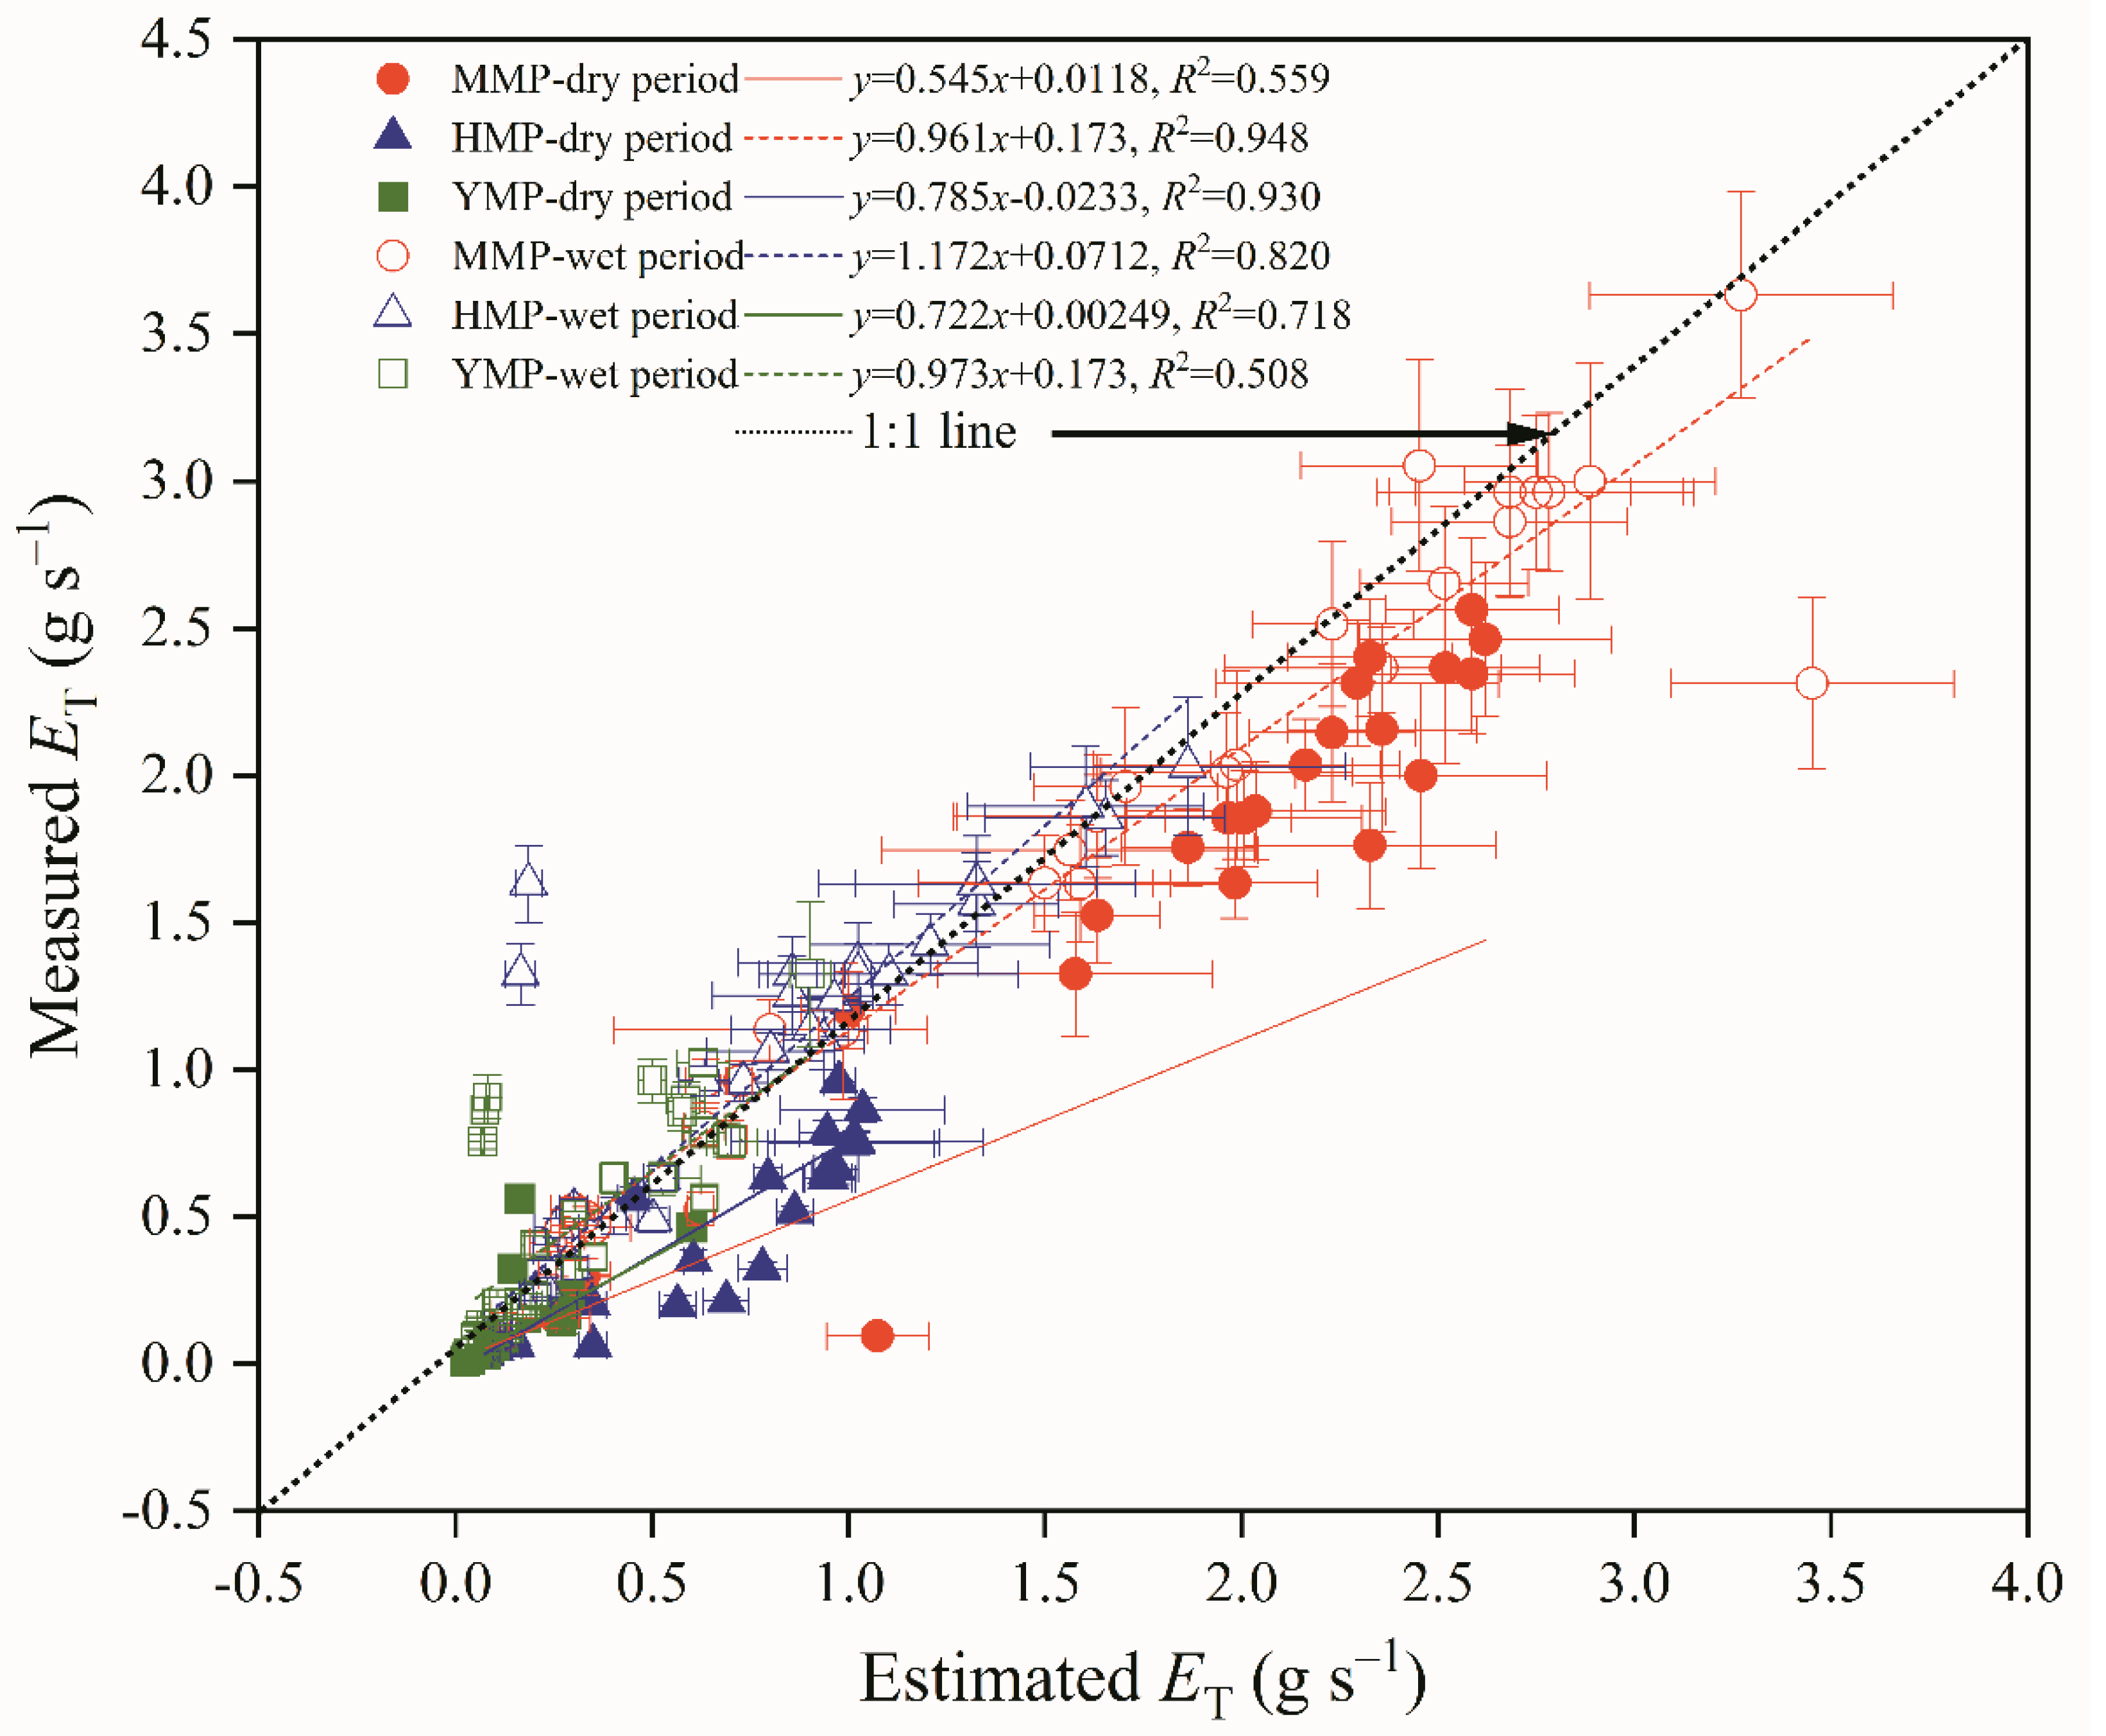
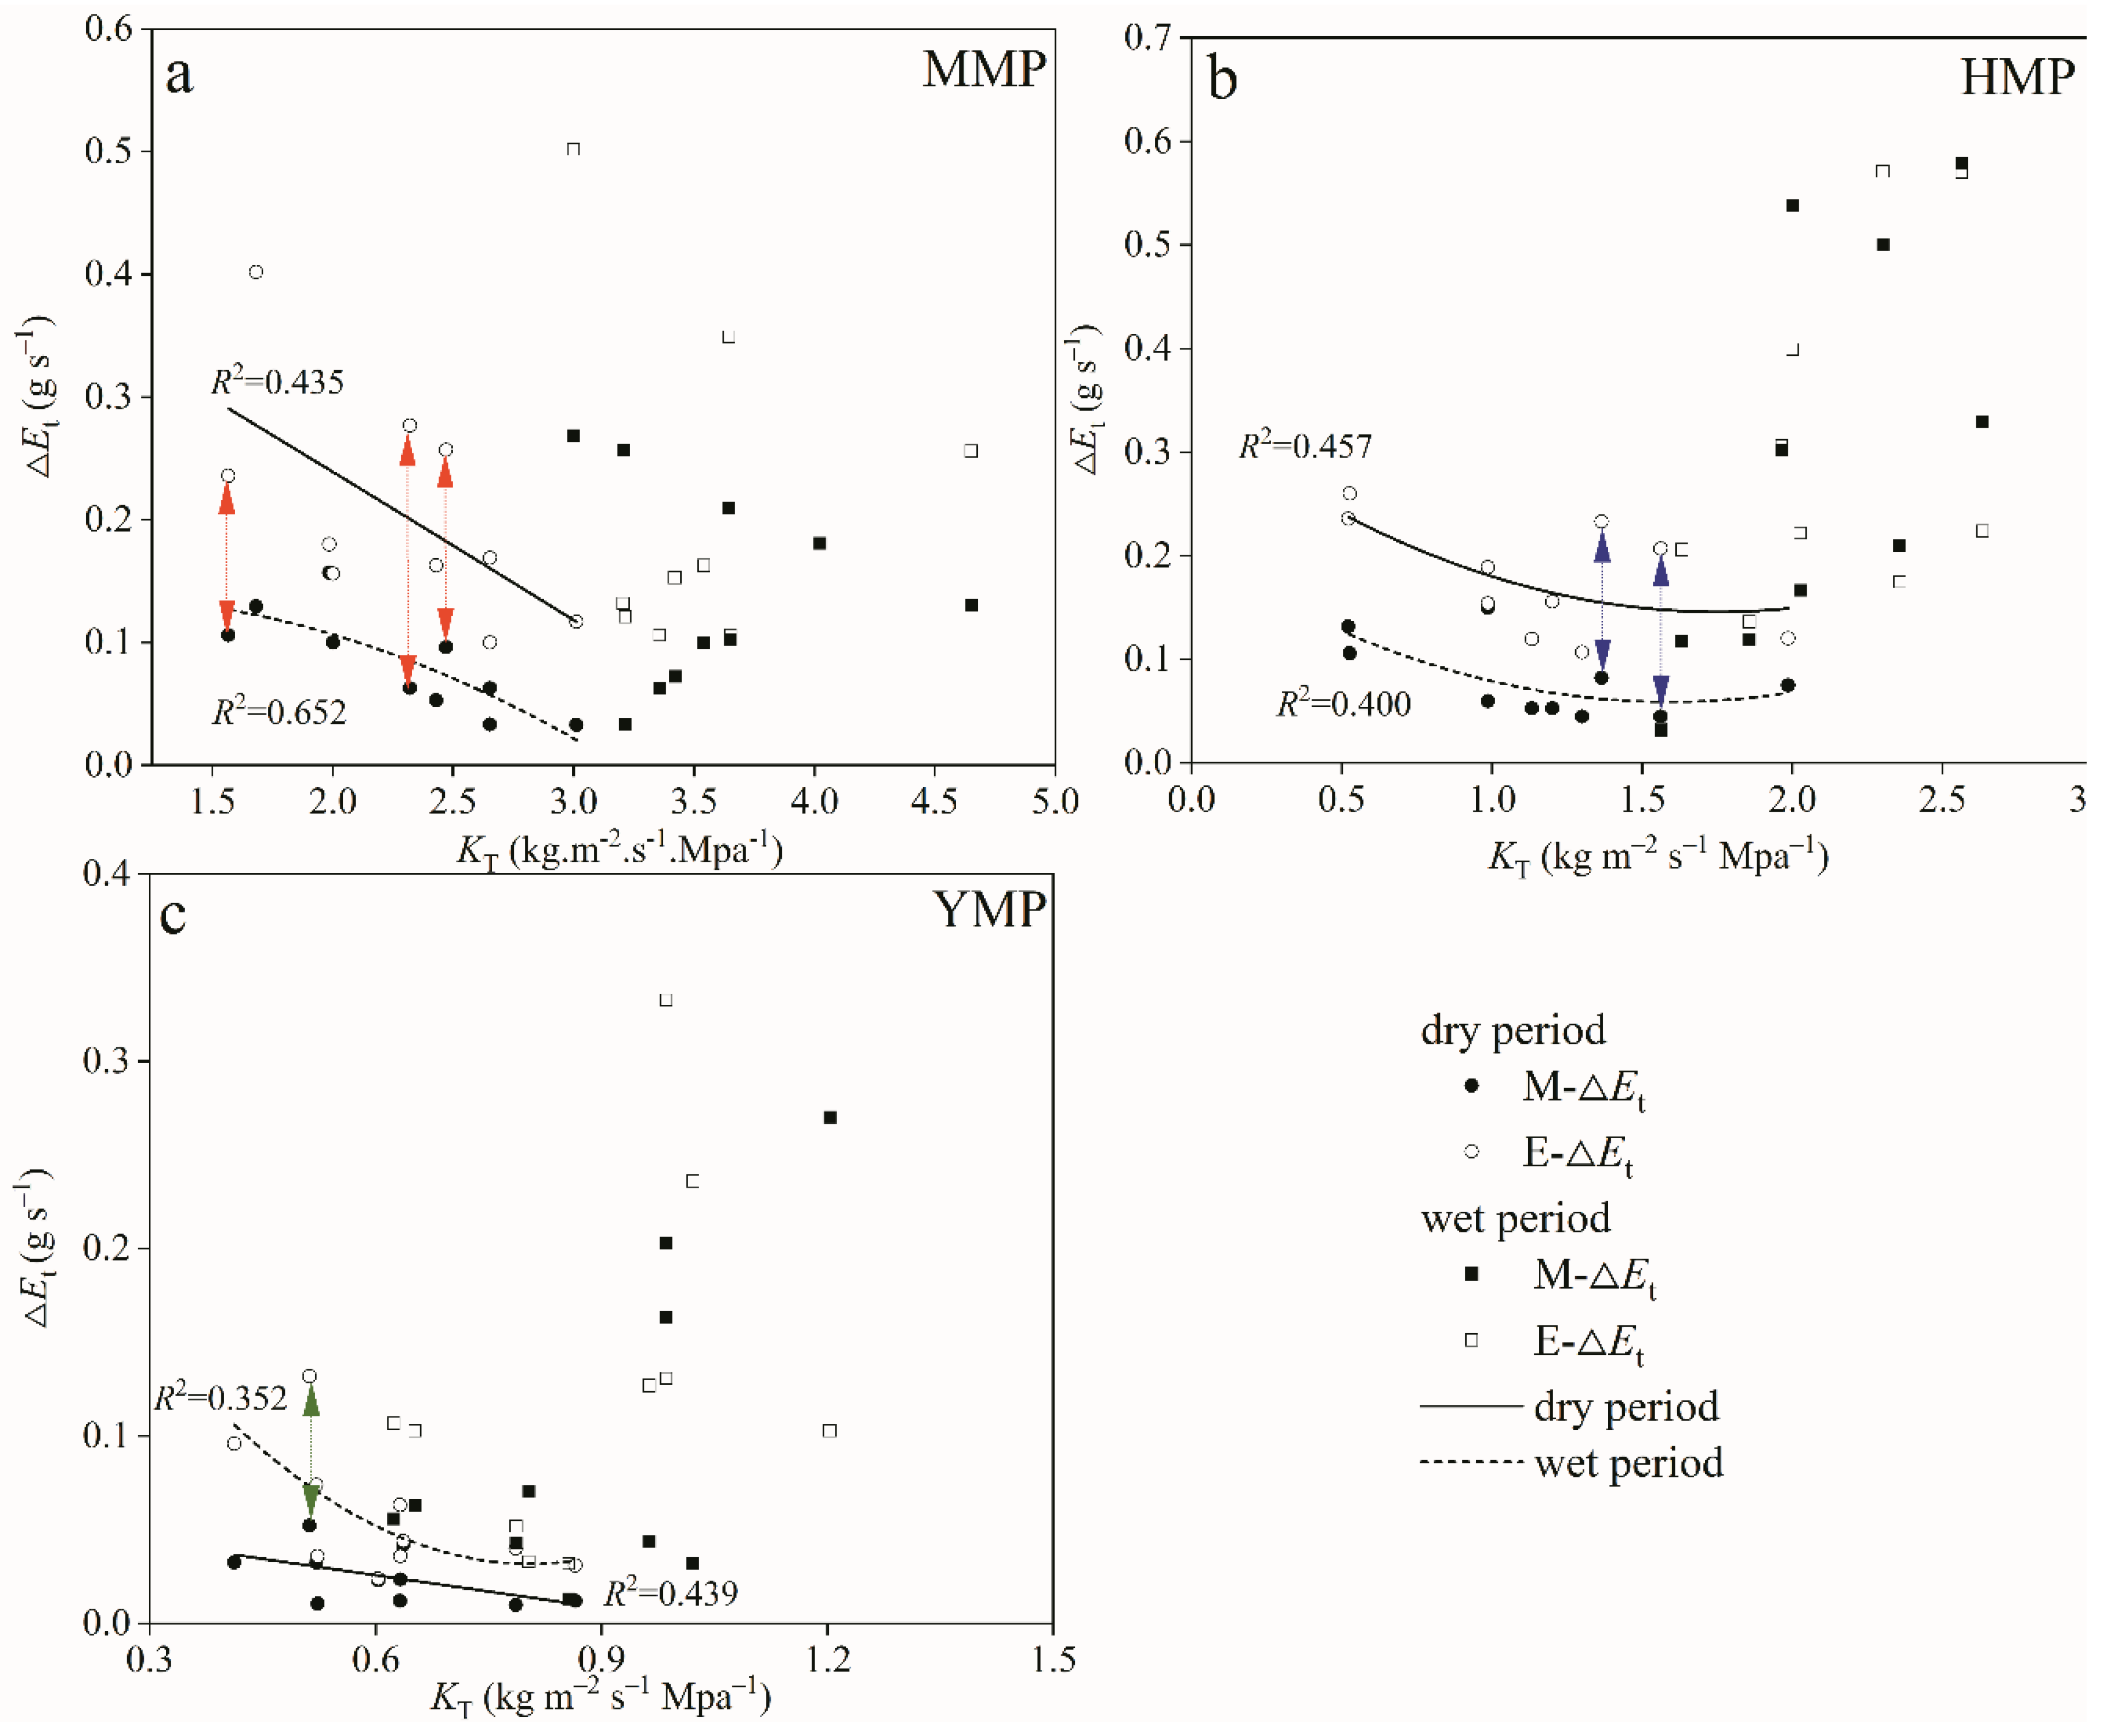
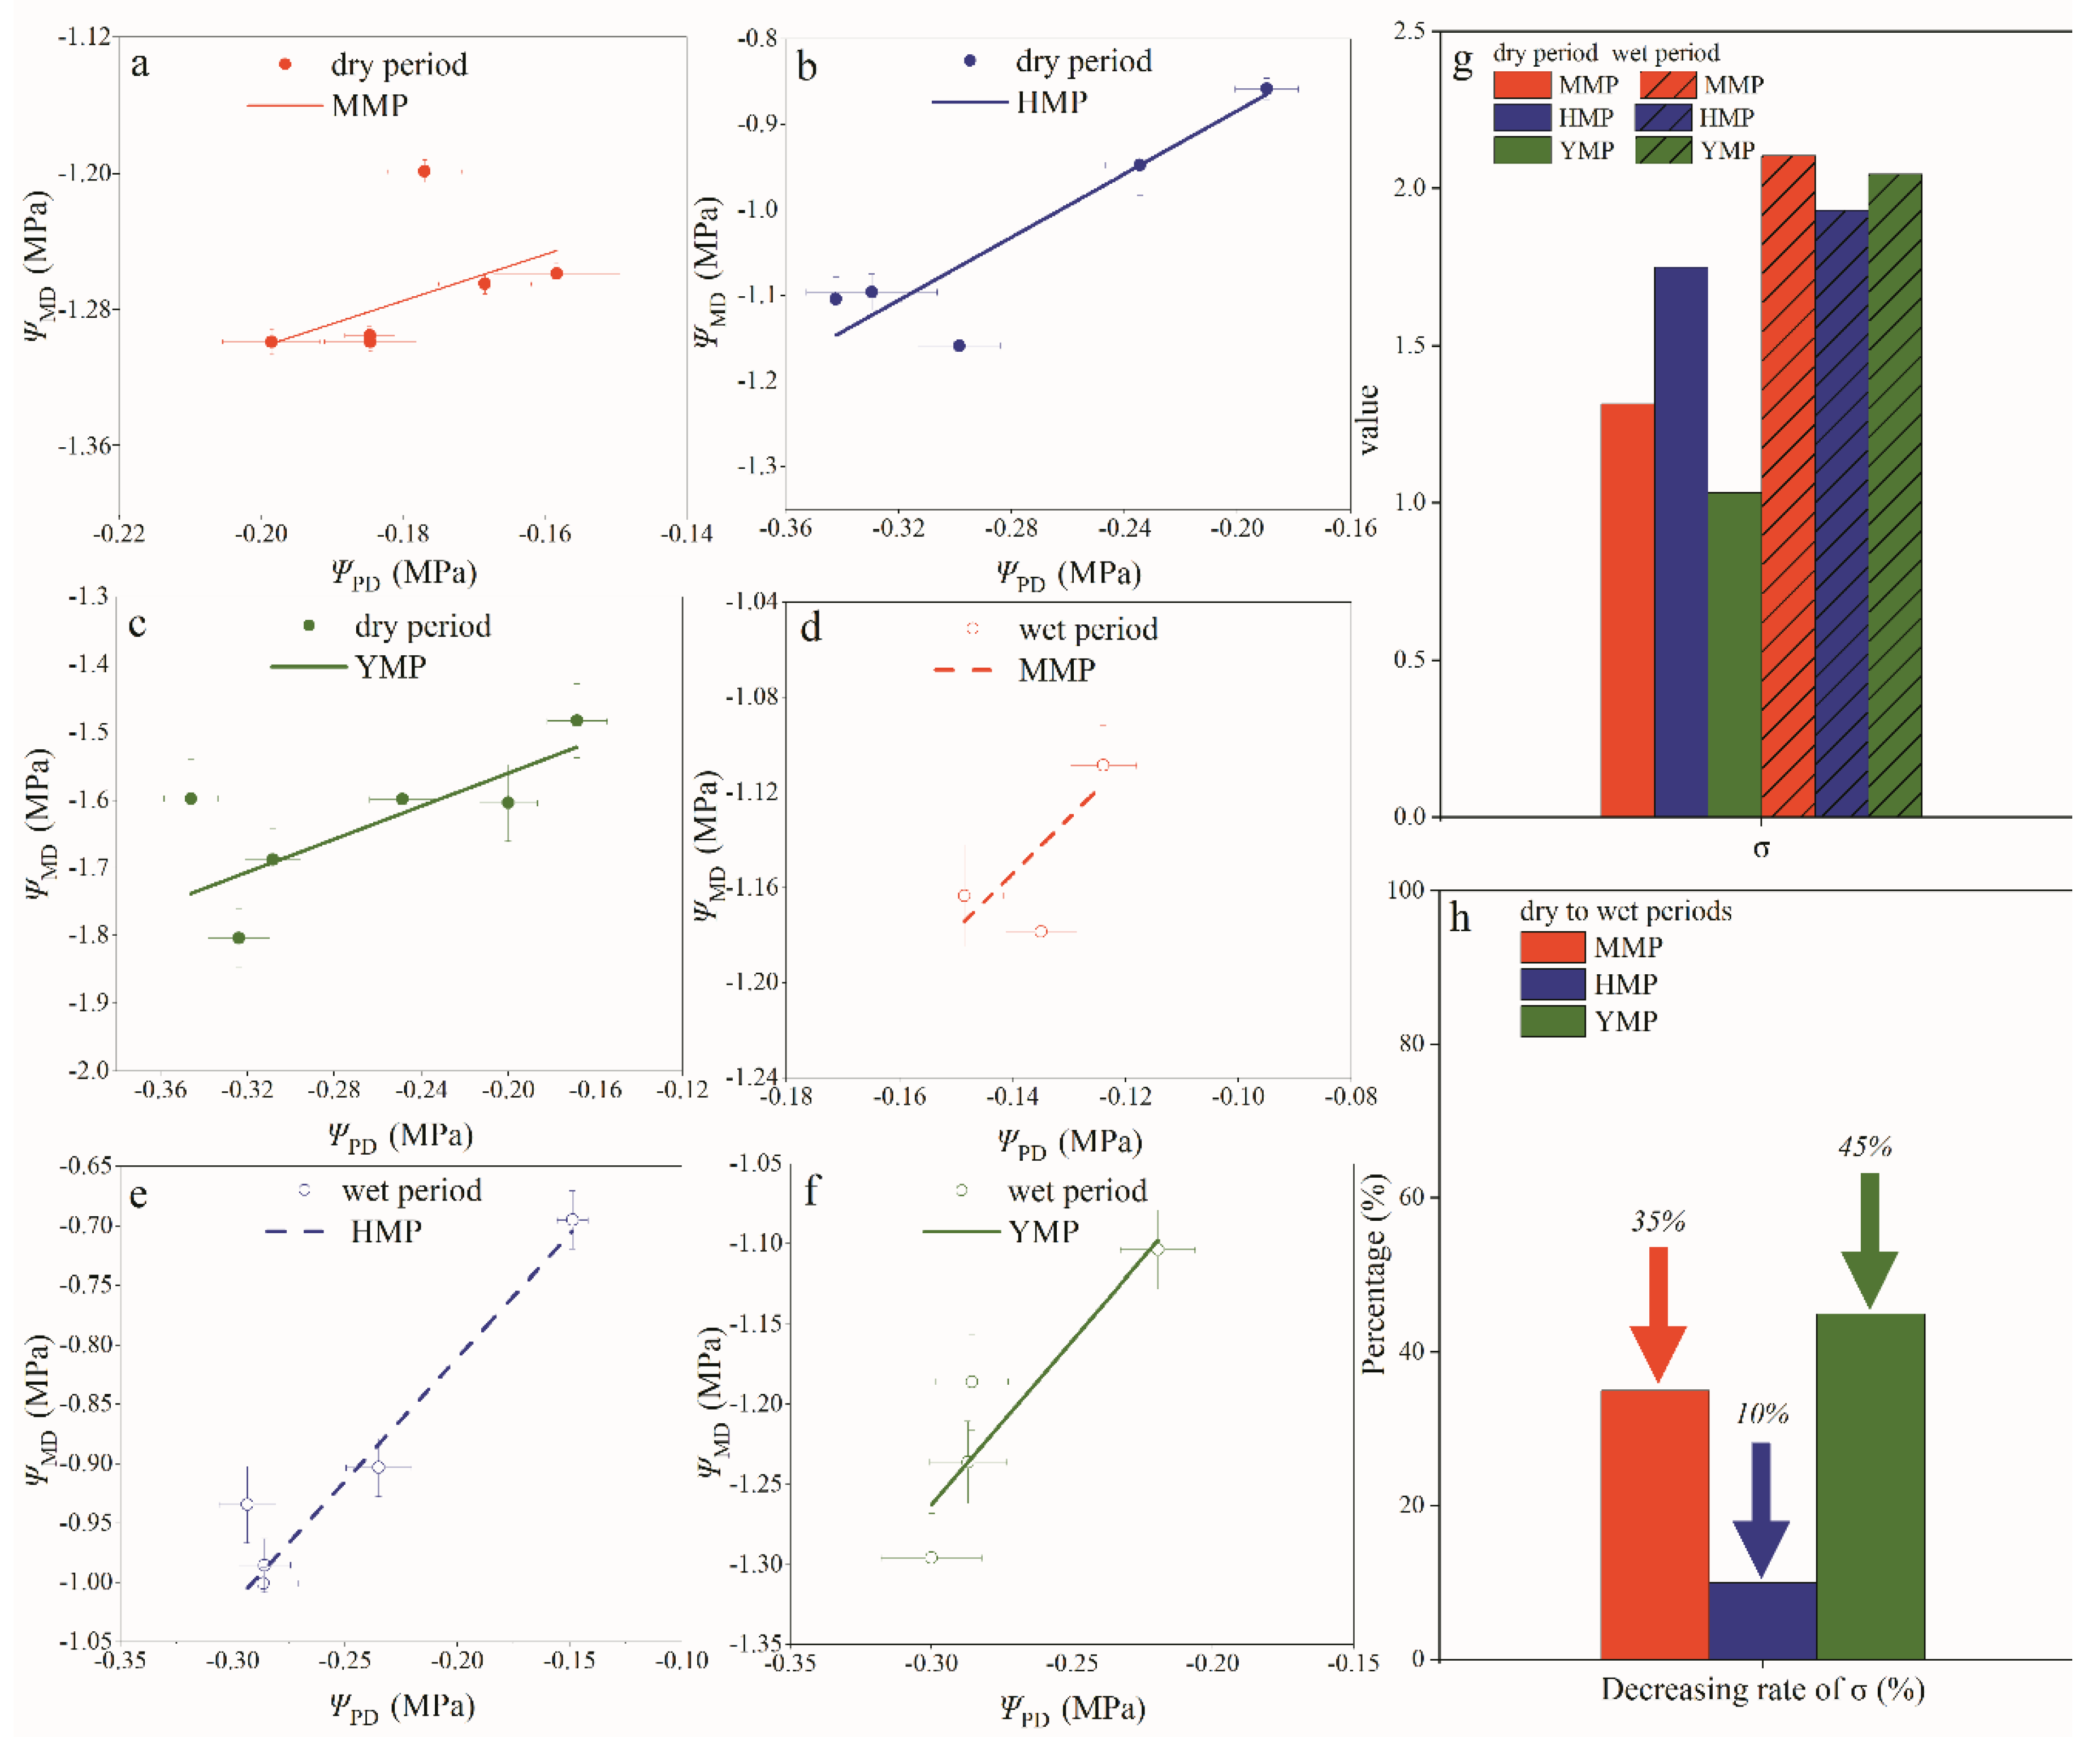
| Tree number | Height (m) | DBH (cm) | Height under branch (m) | Crown diameter (m) | SA (cm2) |
|---|---|---|---|---|---|
| Max (MMP) | 16.5 | 33.0 | 7.1 | 3.8 × 3.8 | 460.3 |
| Mean (MMP) | 14.8 | 30.9 | 6.4 | 3.2 × 3.2 | 410.6 |
| Min (MMP) | 13.8 | 26.0 | 5.8 | 2.6 × 2.7 | 375.3 |
| Max (HMP) | 16.2 | 28 | 1.7 | 2.6 × 2.8 | 380.6 |
| Mean (HMP) | 10.9 | 18.7 | 1.5 | 1.7 × 2.0 | 215.6 |
| Min (HMP) | 6.5 | 10 | 1.3 | 1.1 × 14 | 67.2 |
| Max (YMP) | 2.6 | 2.8 | 0.4 | 1.0 × 1.0 | 11.3 |
| Mean (YMP) | 2.4 | 2.8 | 0.3 | 1.0 × 1.0 | 10.1 |
| Min (YMP) | 2.1 | 2.7 | 0.3 | 0.9 × 1.0 | 9.5 |
| Season | Linear regression equation | R2 | Sig. | |
|---|---|---|---|---|
| MMP | dry | ET = 0.132PAR + 117.167VPD − 83.299 | 0.847 | 0.000 |
| wet | ET = 0.243PAR + 68.615VPD − 39.984 | 0.886 | 0.000 | |
| HMP | dry | ET = 0.106PAR + 0.946VPD − 3.268 | 0.871 | 0.000 |
| wet | ET = 0.127PAR + 2.134VPD − 3.323 | 0.963 | 0.000 | |
| YMP | dry | ET = 4.795PAR + 0.00420VPD − 2.744 | 0.789 | 0.000 |
| wet | ET = 0.00737PAR + 10.071VPD − 9.384 | 0.810 | 0.000 | |
Disclaimer/Publisher’s Note: The statements, opinions and data contained in all publications are solely those of the individual author(s) and contributor(s) and not of MDPI and/or the editor(s). MDPI and/or the editor(s) disclaim responsibility for any injury to people or property resulting from any ideas, methods, instructions or products referred to in the content. |
© 2024 by the authors. Licensee MDPI, Basel, Switzerland. This article is an open access article distributed under the terms and conditions of the Creative Commons Attribution (CC BY) license (http://creativecommons.org/licenses/by/4.0/).


