Preprint
Article

Post-synthetically treated ERI and SSZ-13 zeolites modified with copper as catalysts for NH3-SCR-DeNOx

Altmetrics

Downloads

112

Views

95

Comments

0

A peer-reviewed article of this preprint also exists.

Submitted:

18 June 2024

Posted:

20 June 2024

You are already at the latest version

Alerts
Abstract
ERI and SSZ-13 were subjected to post-synthetic treatments (depending on the zeolite topology) to create micro-/mesoporous materials. The results of NH3-SCR-DeNOx show that the applied treatments improved the catalytic activity of the Cu-containing ERI-based materials; however, the NO conversion does not vary for the different materials treated with NaOH or NaOH/HNO3. For the micro-/mesoporous Cu-containing SSZ-13, a lower NO conversion in NH3-SCR-DeNOx is observed. Thus, our findings challenge the current paradigm of enhanced activity of micro-/mesoporous catalysts in NH3-SCR-DeNOx. The modification of the supports results in the presence of different amounts and kinds of copper species (especially isolated Cu2+ and aggregated Cu species) in the case of ERI- and SSZ-13-based samples. The present copper species further differentiate the formation of reactive reaction intermediates. Our studies approved that besides the -2,2-peroxo dicopper(II) complexes (verified by in situ DR UV-Vis spectroscopy), also copper nitrates (evidenced by in situ FT-IR spectroscopy) act as reactive intermediates in these catalytic systems.
Keywords: 
Subject: Chemistry and Materials Science  -   Chemical Engineering

1. Introduction

The selective catalytic reduction of nitrogen oxides with ammonia (NH3-SCR-DeNOx) is widely applied as an emission control process to eliminate NOx from diesel engines as well as power plants. So far, many catalysts have been investigated in NH3-SCR-DeNOx, including vanadium pentoxide-based catalysts, transition metal-exchanged zeolites (e.g., Cu-Y or Cu-SSZ-13), or hybrid catalysts (e.g., Ce-Zn mixed oxides with Fe-ZSM-5 or Zn-Ti mixed oxides with Cu-SSZ-13, etc.) [1,2,3]. Furthermore, besides catalysts based on SSZ-13 or ZSM-5, Cu-containing ERI revealed enhanced catalytic properties in NH3-SCR-DeNOx. For example, Zhu et al. [4] proved that their fast-synthesized Cu-containing ERI achieved a catalytic activity comparable to the commercial Cu-SSZ-13. Moreover, Sultana et al. [5] reported that Cu-ERI catalysts showed similar catalytic activity to Cu-ZSM-5, although with higher resistance against decane poisoning. Some researchers claimed that the activity and N2 selectivity in both NH3-SCR-DeNOx and the selective catalytic oxidation of ammonia (NH3-SCO) have been enhanced for the micro-/mesoporous materials (e.g., Cu-ZSM-5, Cu-SAPO-34, Fe-ZSM-5) [6,7,8]. For example, Oord et al. [9] and Wu et al. [10] applied the post-synthetic modification of SSZ-13 with an aqueous solution of NaOH. They both found that the catalytic activity and N2 selectivity can be improvead for Cu-SSZ-13 (with the support treated with 0.1 M solution). Otherwise, the post-synthetic modification above 0.1 M led to a drop in the catalytic properties of the materials. On the other hand, Jabłońska et al. found that the mesopores introduced into Cu-containing zeolite ZSM-5 [11] or Y [12] catalysts do not play any direct role in the activity of the NH3-SCR-DeNOx. Although Tekla et al. [13] introduced mesoporosity in erionite using both acid and alkali leaching treatments, such materials have not been investigated in NH3-SCR-DeNOxor NH3-SCO. Given the discrepancies mentioned above, further studies of micro-/mesoporous materials are required to understand the relationship between mesoporosity, catalytic activity, and N2 selectivity in NH3-SCR-DeNOx. Thus, ERI and SSZ-13 zeolites were subjected to different post-synthetic treatments, depending on the zeolite topology, including treatment with NaOH or sequential treatment with HNO3, followed by treatment with NaOH. The structure, texture, elemental analysis, and acidic properties of the copper-containing zeolites were characterized by X-ray diffraction (XRD), solid-state nuclear magnetic resonance (NMR), N2 sorption, inductively coupled plasma optical emission spectroscopy (ICP-OES), and temperature-programmed desorption of NH3 (NH3-TPD). The nature of copper species was investigated by temperature-programmed reduction of H2 (H2-TPR), as well as diffuse reflectance UV-Vis (DR UV-Vis), extended X-ray absorption fine structure (EXAFS), and electron paramagnetic resonance (EPR) spectroscopy. The activity and N2 selectivity were evaluated via NH3-SCR-DeNOx (4 NH3 + 4 NO + O2 → 4 N2 + 6 H2O) and NH3-SCO (4 NH3 + 3 O2 → 2 N2 + 6 H2O) for Cu-form of conventional zeolites and post-synthetically treated SSZ-13 and especially ERI for the first time in literature. Furthermore, the reaction pathways were investigated through in situ Fourier-transform infrared (FT-IR) and DR UV-Vis spectroscopy and temperature-programed studies with 18O2 isotope over both zeolite topologies to deepen our understanding of the reactive reaction intermediates and thus, maximize their potential in industrial applications.

2. Experimental

2.1. Catalyst preparation

The commercial zeolites ERI (Clariant, n(Si)/n(Al) = 3.5) and SSZ-13 (Clariant, n(Si)/n(Al) = 6.5) were post-synthetically modified, according to previously reported protocols optimized for any specific zeotype [9,11,12,13]. Table 1 summarizes the applied modifications. Briefly, 1 g of calcined zeolite (550 °C for 4 h in static air, 1 °C min-[1]) per 100 ml an aqueous solution of HNO3 (65 wt.-%, Merck) or NaOH (≥ 97 wt.-%, Merck) was stirred for 0.5-2 h at 65 °C under reflux. After treatment, the solution was cooled down in a water bath, and subsequently, the sample was thoroughly washed with distilled water. After drying, the resulting materials were transformed into their protonic form by three-fold ion exchange with an aqueous solution (0.5 M) of ammonium nitrate (> 99 wt.-%, Merck) at 60 °C for 1 h. After filtration, washing, and drying, they were calcined at 550 °C for 4 h in static air (heating rate of 1 °C min-1).
Subsequently, the materials were subjected to ion exchange in an aqueous solution of (0.05 M) copper acetate (Cu(OOCCH3)2, ≥ 98 wt.-%, Alfa Aesar) for 24 h at room temperature. After the ion exchange, the resulting product was separated through filtration and then extensively washed. The obtained materials were subsequently dried at room temperature. Finally, the solids were calcined at 550 °C for 4 h in static air (heating rate of 1 °C min-1).

2.2. Catalyst characterization, Catalytic experiments, and In situ investigations

The physico-chemical characterization of the ERI- and SSZ-13-based samples, as well as their copper-containing forms, were investigated by applying XRD, NMR, N2 sorption, ICP-OES, NH3-TPD, H2-TPR, DR UV-Vis, X-ray absorption spectroscopy (XAS), EPR, and temperature-programmed isotopic exchange (TPIE) techniques. Subsequently, the associated catalytic activity and N2 selectivity were investigated over Cu-containing ERI and SSZ-13 samples for NH3-SCR-DeNOxand NH3-SCO, including in situ FT-IR and DR UV-Vis. The details of the experimental procedures can be found in the Supplementary Info.

3. Results and Discussion

3.1. Structural and textural properties

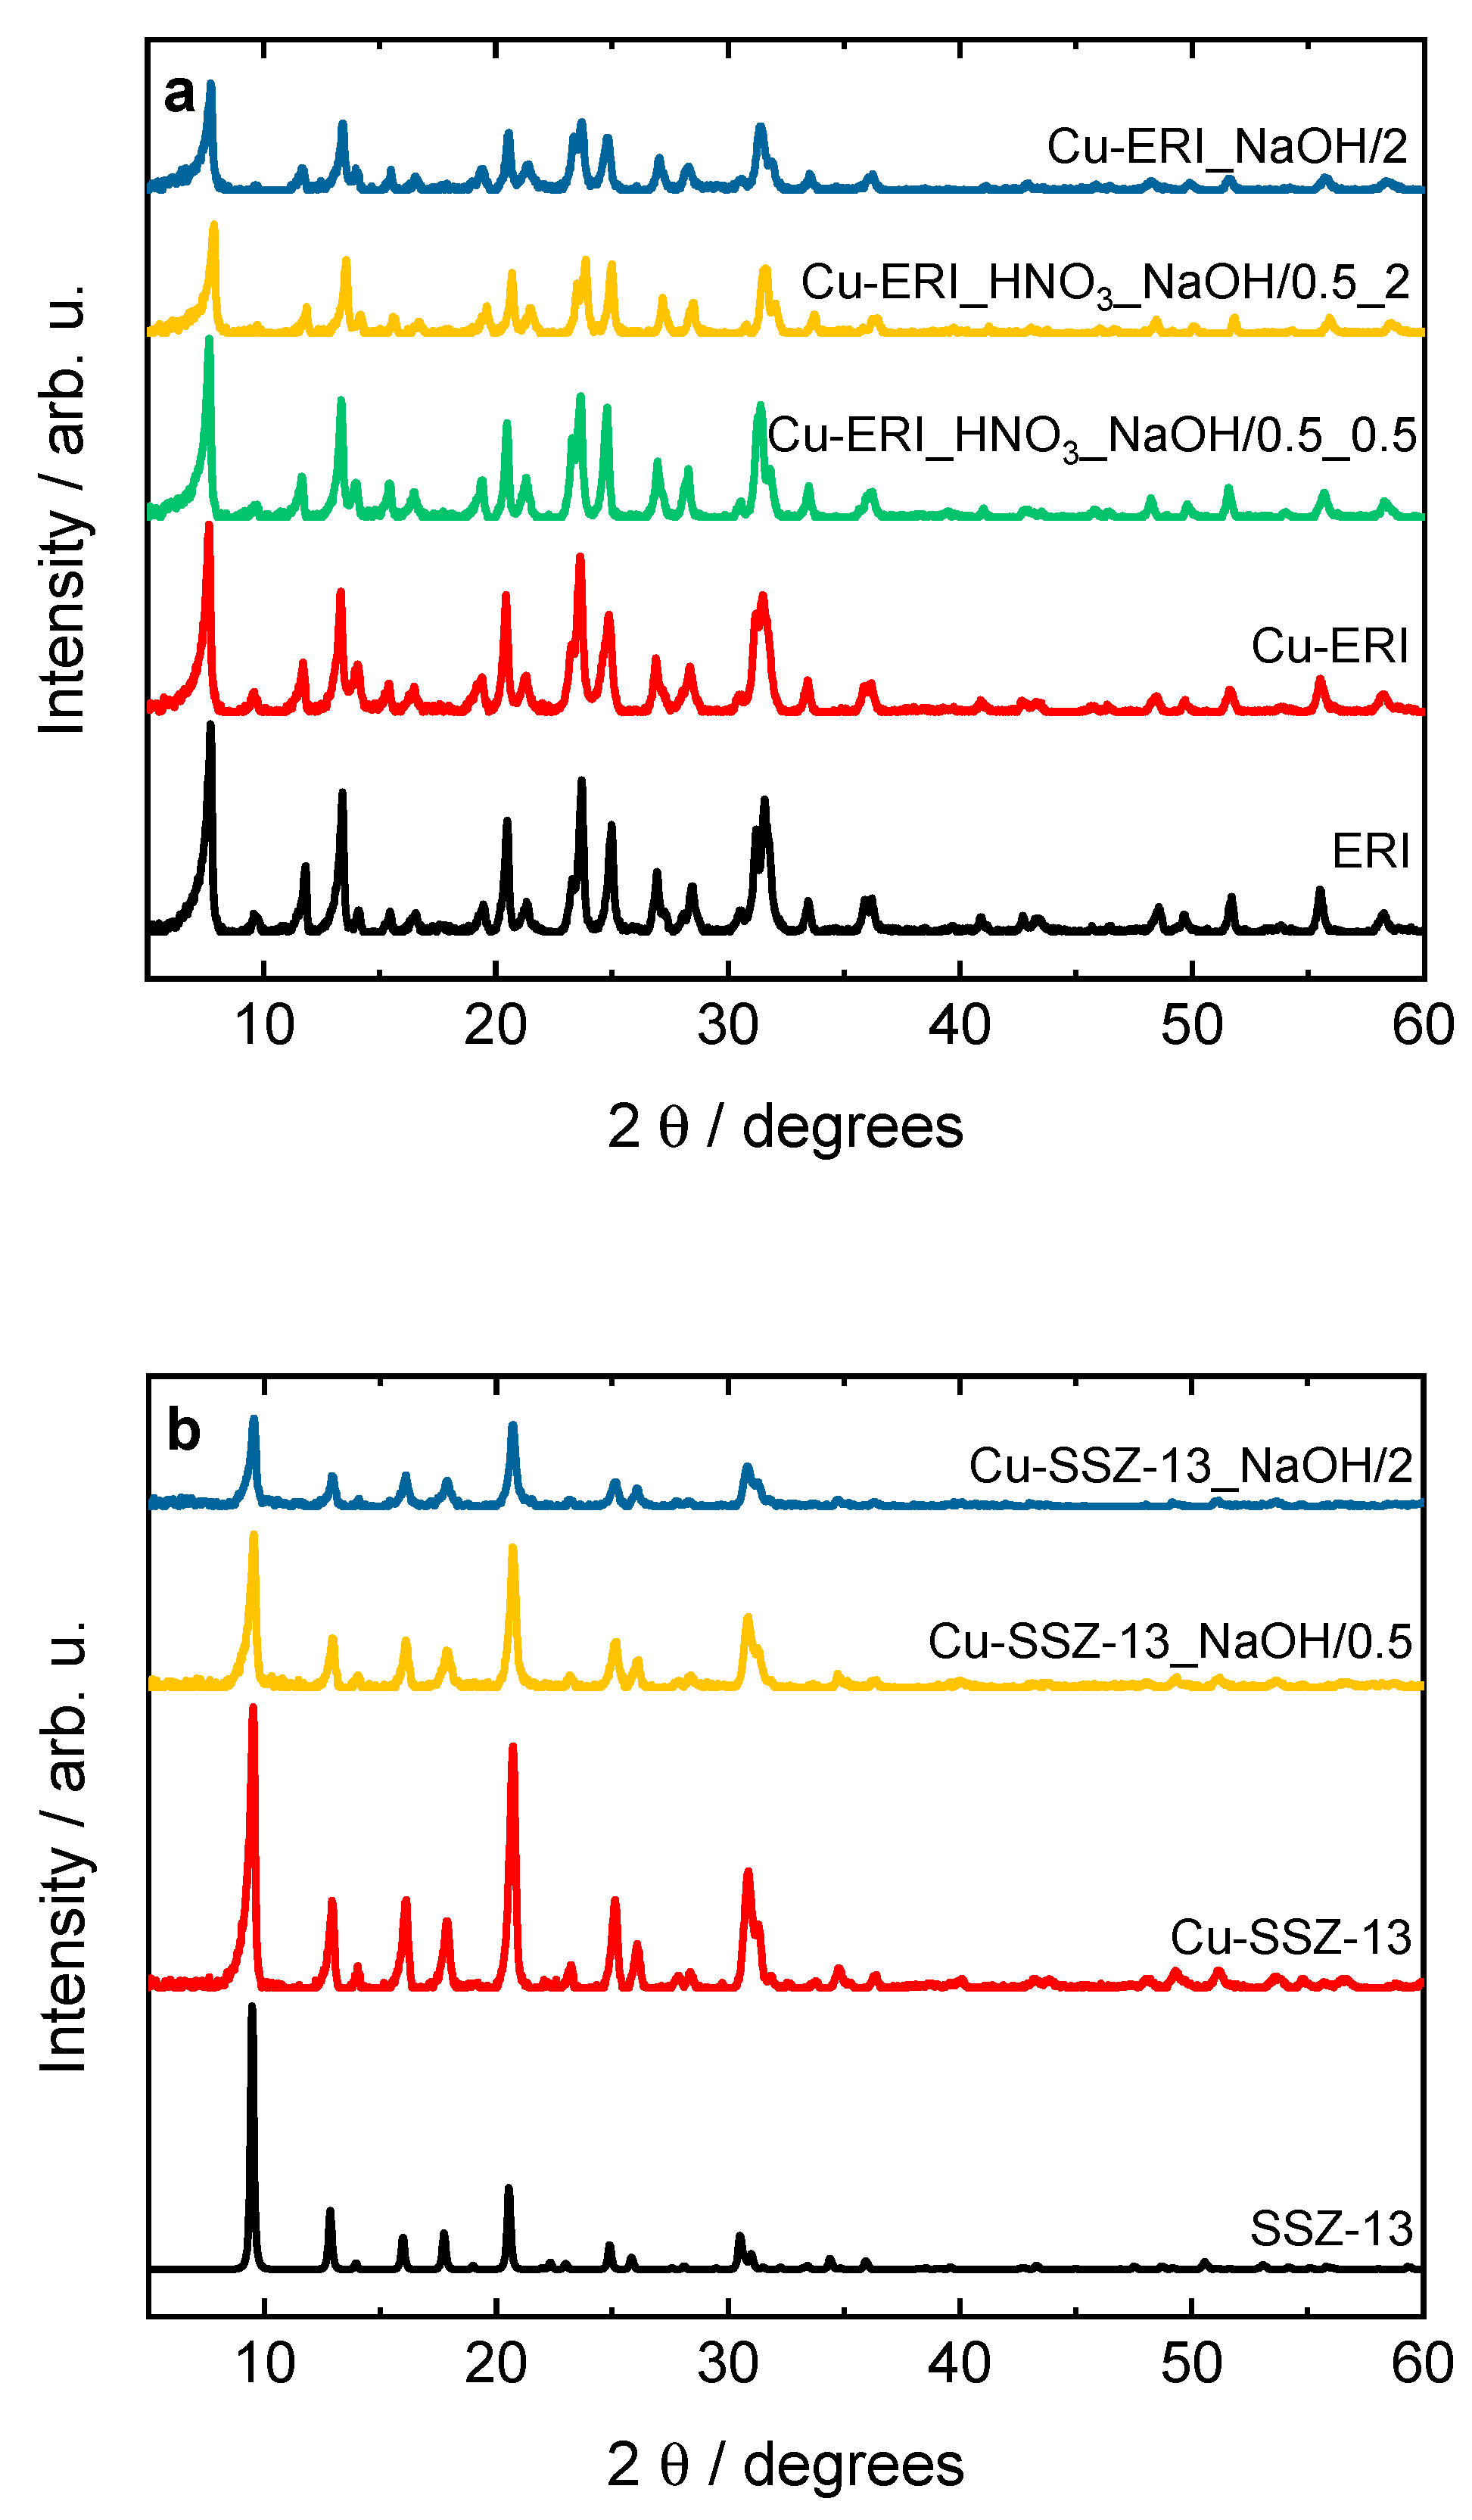
Figure 1 shows the XRD patterns of the parent ERI and SSZ-13, as well as their Cu-containing forms. The XRD patterns of the commercial calcined zeolites are typical for pure erionite (ERI topology) and SSZ-13 (CHA) structure, as reported before [9,11,13]. The structure of the zeolites is preserved after post-synthetic treatment (Figure S1) as well as after ion-exchange and subsequent calcination. Furthermore, no peaks at 2θ = 35.6 ° and 38.7 ° corresponding to copper phases [14] are detected in the diffractograms of the Cu-containing samples, indicating crystal sizes of copper species below the XRD analysis detection limit.
Table 2 lists the elemental analysis determined by ICP-OES. The measured n(Si)/n(Al) ratio of the parent zeolites (i.e., ERI: 3.4, SSZ-13: 6.0) is close to the one reported by the supplier (i.e., ERI: 3.5, SSZ-13: 6.5). However, after post-synthetic treatment, the n(Si)/n(Al) ratios decrease in the series of ERI- and SSZ-13-based materials. E.g., for Cu-ERI_HNO3_NaOH/0.5_0.5 and Cu-ERI_HNO3_NaOH/0.5_2, the time during the alkali leaching has a more substantial influence on the n(Si)/n(Al) ratios than the application of an acid leaching before the alkali one. For the SSZ-13-based samples, n(Si)/n(Al) ratios are reduced by ca. 40 % after the alkali treatments, although treatment time (i.e., 0.5 or 2 h) does not influence the decrease in silica content. Overall, the post-synthetic treatments of both ERI- and SSZ-13-based samples can extract Si species from the framework and Al species to a lesser degree. In addition, the Cu weight loading does not significantly vary for the post-treated ERI or SSZ-13 samples.
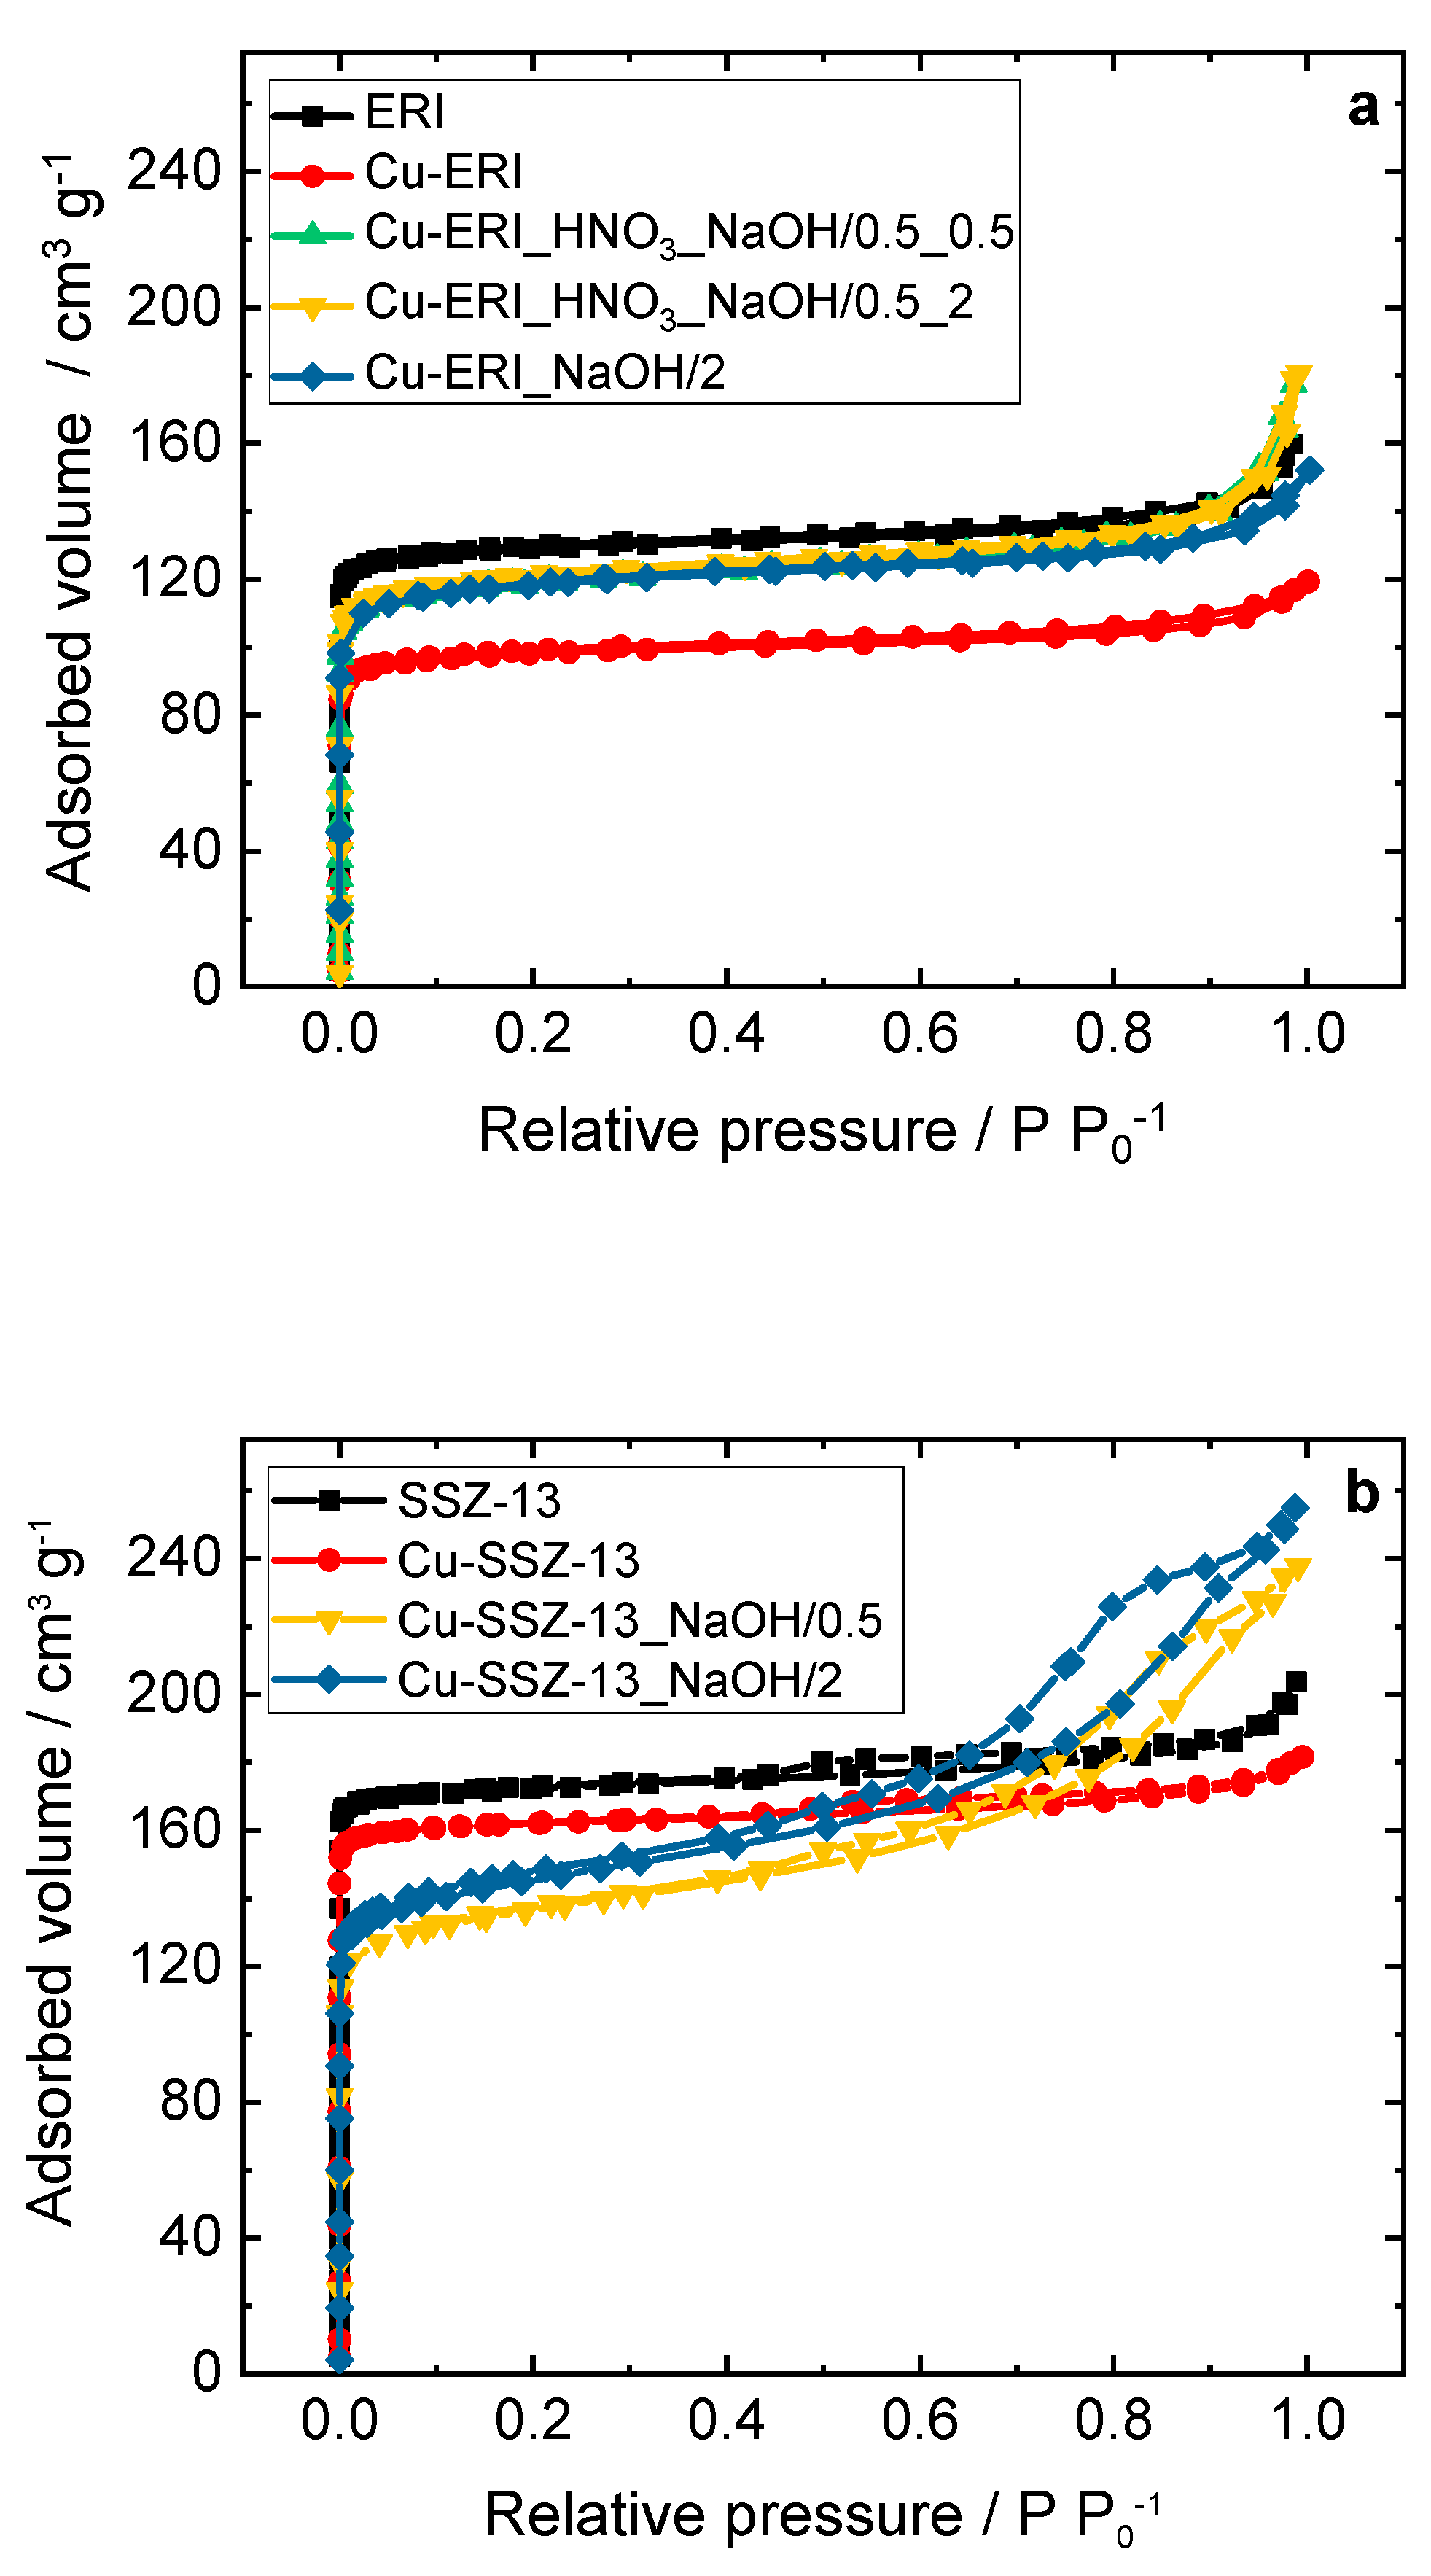
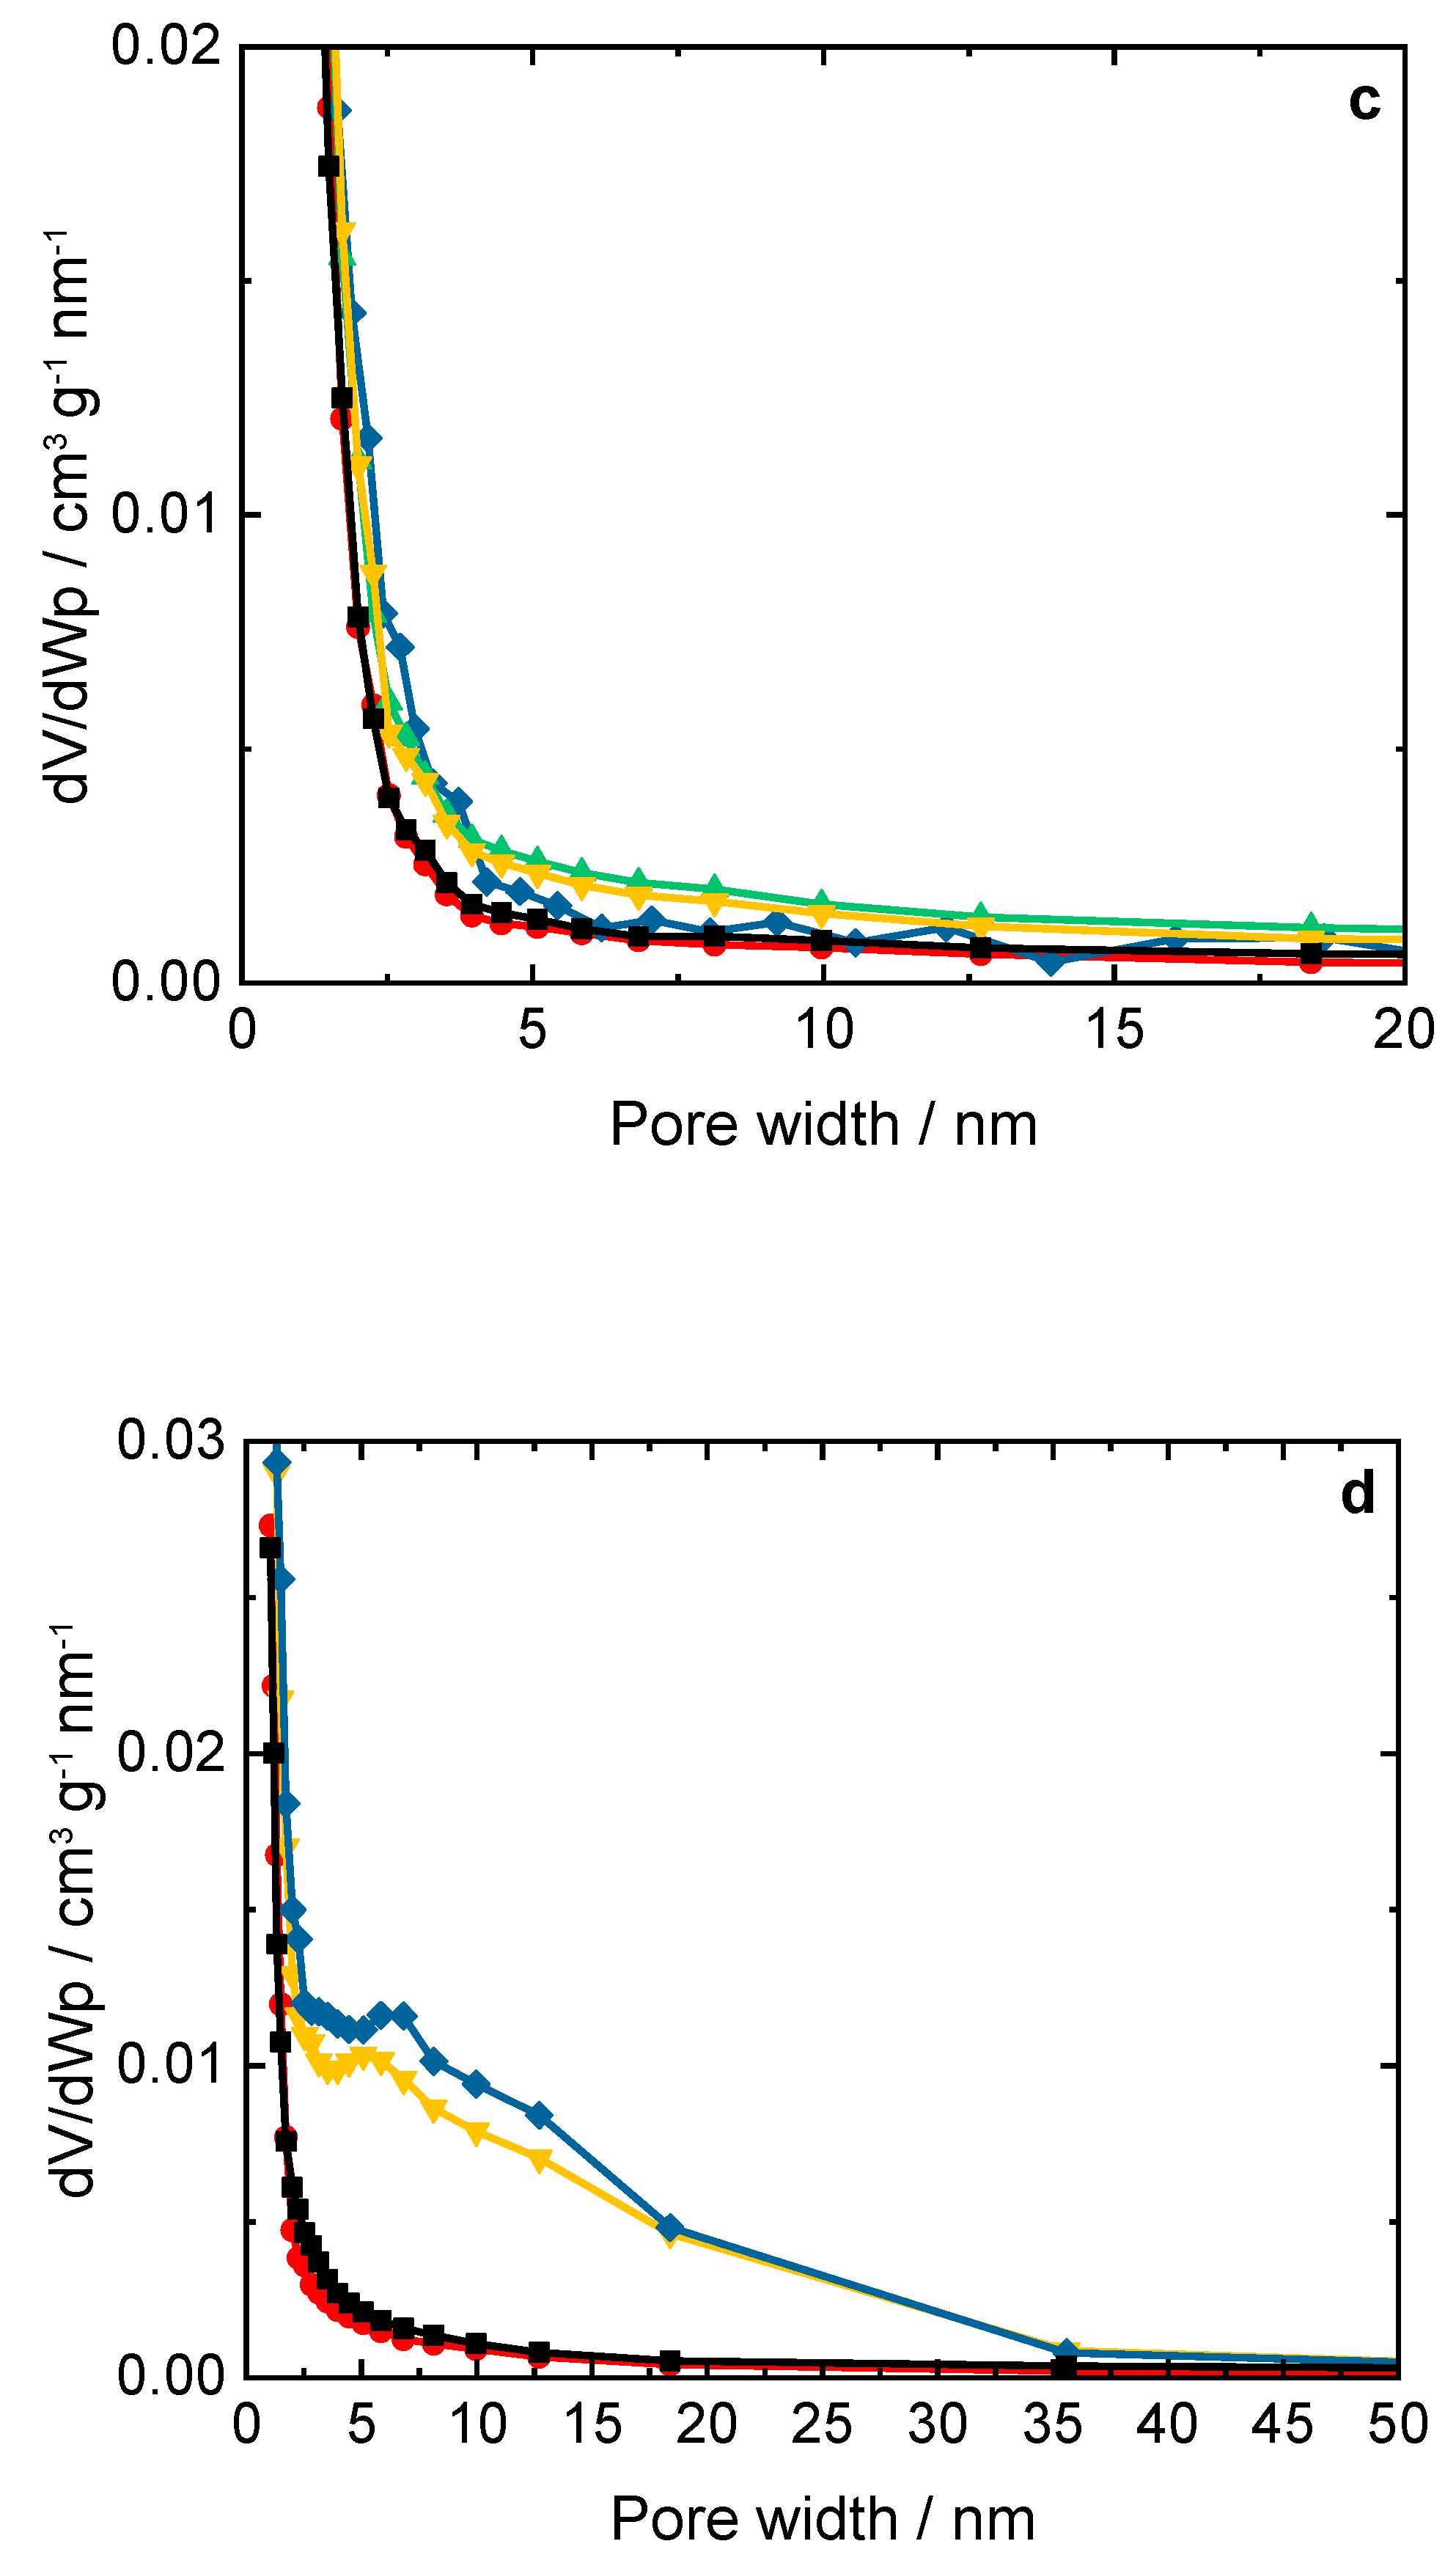
Figure 2 and Figure S2 show the N2 sorption isotherms of the parent ERI and SSZ-13 samples and their Cu-containing forms, while Table 3 and Table S1 gather the results of the textural properties of the parent and post-modified form of ERI and SSZ-13 samples. The isotherms of the Cu-containing ERI-based samples (Figure 2a) can be categorized as type I isotherm [15], while the samples based on post-modified ERI show a higher adsorbed volume of nitrogen, especially at p p0-1 > 0.8. These samples also present higher values of mesopore volume than Cu-ERI (increase from 0.04 cm3 g-1 to 0.05-0.10 cm3 g-1, Table 3). The BJH pore width distribution (Figure 2c) shows mesopores in the broad range of up to 10 nm for both Cu-ERI_HNO3_NaOH/0.5_0.5 and Cu-ERI_HNO3_NaOH/0.5_2. The results align with the data reported by Tekla et al. [13] (on which the preparation steps were based), where minor changes in the type of adsorption isotherm or pore width distribution profile were found between the different treatments of ERI-based samples. Cu-SSZ-13 also shows type I isotherm. However, after the post-synthetic treatments of the support, the isotherms of the related Cu-containing samples become a mixture of type I and type IV, with an H4 hysteresis loop, which is a typical trait of mesoporous materials [15] (Figure 2b). The adsorbed volume increases in the region of medium relative pressure, which could be related to the rise in mesopore volume of these samples (increase from 0.03 cm3 g-1 to 0.23-0.26 cm3 g-1, Table 3). Furthermore, the pore width distribution results (Figure 2d) show an increase in mesopores up to 35 nm independent of the treatment time of the SSZ-13 sample. In line with the studies of Sommer et al. [16] and Oord et al. [9], we also observed a decrease in the specific surface area for post-modified Cu-containing SSZ-13 than on other topologies, i.e., ERI [13]. Such changes in the specific surface area arise due to the impact of the demetallation on the parent ERI and SSZ-13 samples.
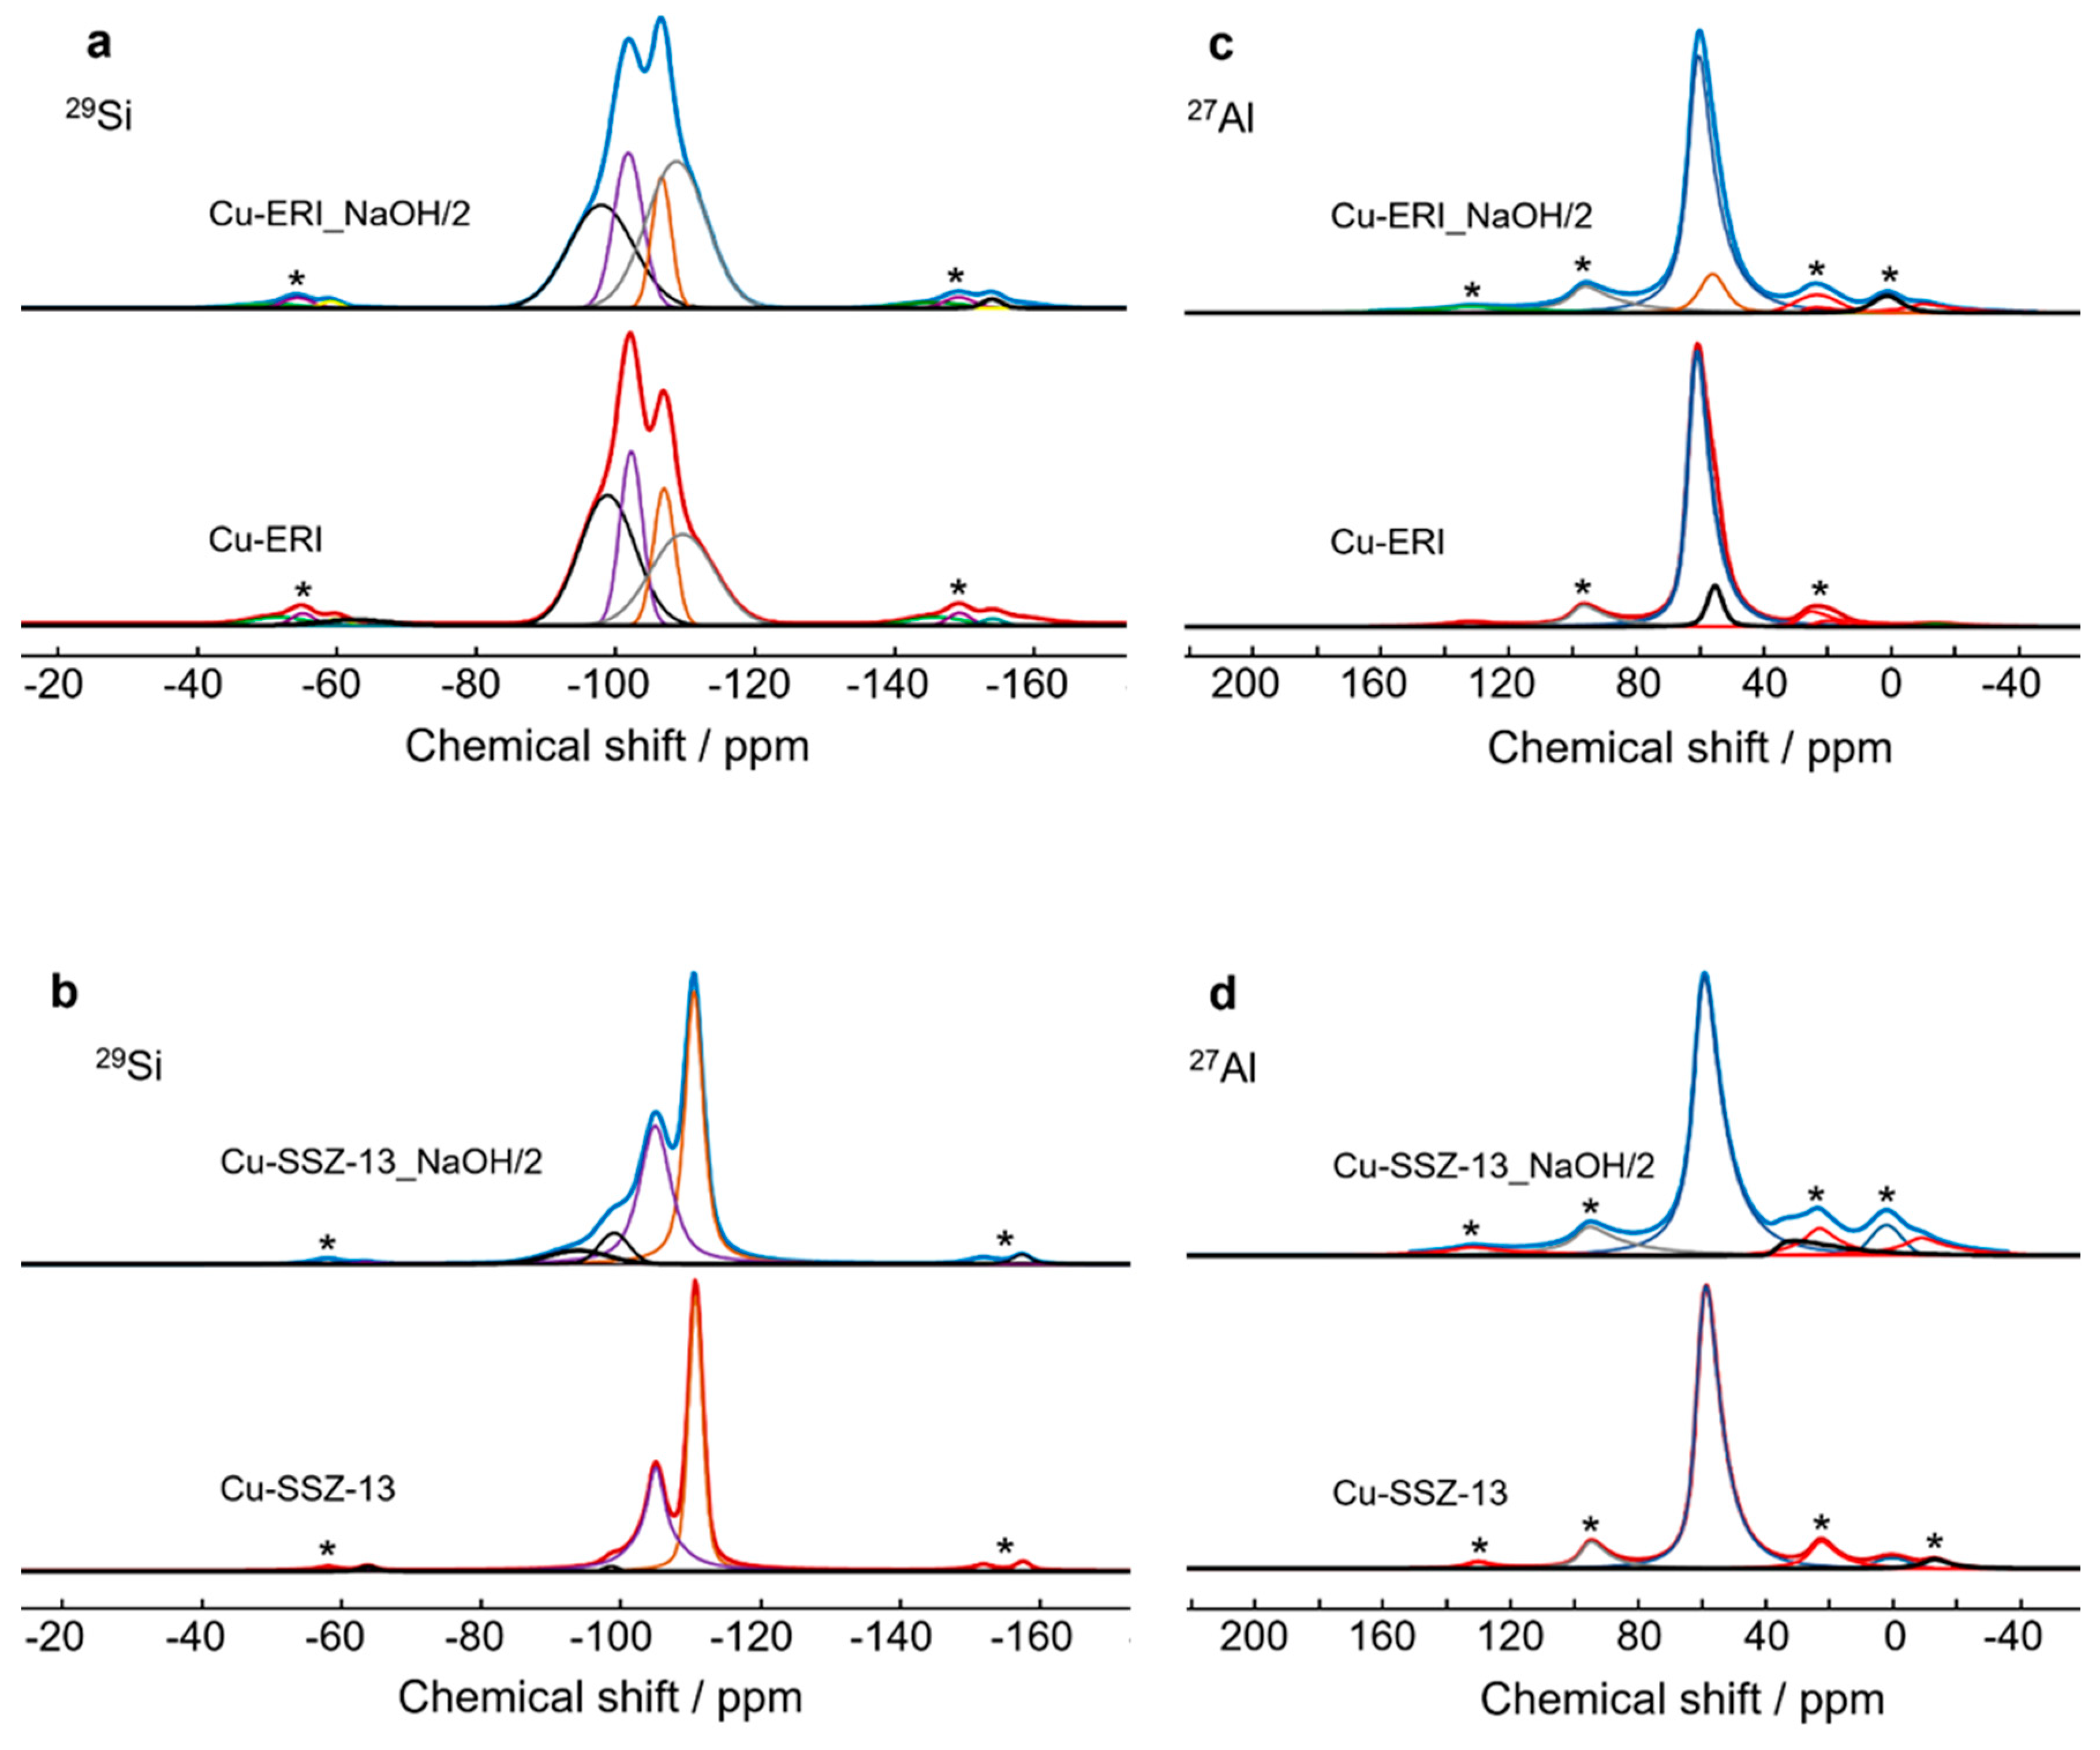
As the physico-chemical characterization revealed no significant contrast between the applied various post-modified ERI- and SSZ-13-based samples, we narrowed our studies to the deeper investigation of the copper form of leached ERI and SSZ-13 (under an aqueous solution of 0.2 M NaOH for 2 h). In order to investigate the influence of the post-synthetic treatment on the coordination of Si and Al atoms, we applied [29]Si and [27]Al solid-state NMR (Figure 3 and Figure S3a, Tables S2 and S3). Regarding Cu-ERI, four types of Si coordination are detected (Figure 3a), with the main coordination structure for Si(2Si,2Al) and Si(1Si,3Al) [17,18], encompassing 36.7 % of the spectra’s area (Figure S3). In Cu-ERI_NaOH/2, the main coordination structure changes to Si(4Si,0Al), indicating substantial removal of Al species. Moreover, aluminum in tetrahedral form (AlIV) is observed as the main Al coordination for all the Cu-containing ERI samples represented by the peak at about 62 ppm in the [27]Al NMR spectra (Figure 3c), together with a minor single of five-coordinated aluminum. The signal near 0 ppm present in Cu-ERI_NaOH/2 relates to the presence of extra-framework six-coordinated aluminum. For Cu-SSZ-13, mainly Si(3Si,1Al) and Si(4Si,0Al) appeared [19] (Figure 3b), while for Cu-SSZ-13_NaOH/2, two other signals appear at about -94 ppm and -99 ppm related to Si(1Si,3Al) and Si(2Si,2Al), indicating substantial removal of Si species in this sample (Figure S3a). The [27]Al NMR spectra (Figure 3d) of both Cu-containing SSZ-13 samples show the characteristic signal of tetrahedral aluminum species at about 60 ppm together with a small amount of six-coordinated aluminum [20], while additionally for Cu_SSZ-13_NaOH/2, the presence of a signal near 37 ppm indicates the formation of a site with five-coordinated aluminum. Furthermore, the presence of these AlVI forms in both Cu-ERI_NaOH/2 and Cu-SSZ-13_NaOH/2 contributes to the Lewis acidity. A schematic diagram of the coordination environment of Si and Al is shown in Figure S3b.
Figure S4 shows the desorption NH3-TPD profiles of Cu-containing ERI and SSZ-13 samples. According to the literature indications (e.g., [21,22]), the NH3 desorption peak around 300 °C is characteristic of NH3 adsorbed on the Lewis acid sites (L-NH3), while the desorption peak centered at 440 °C is assigned to NH3 adsorbed as NH4+ on Brønsted sites (B-NH4+). Thus, our results reveal that the post-synthetic treatment of ERI and SSZ-13 zeolites effectively facilitates the formation of Lewis acid sites. Additionally, for Cu-ERI_NaOH/2, the peak maximum decreases toward lower temperatures, indicating their weaker strength.

3.2. Nature of copper and oxygen species

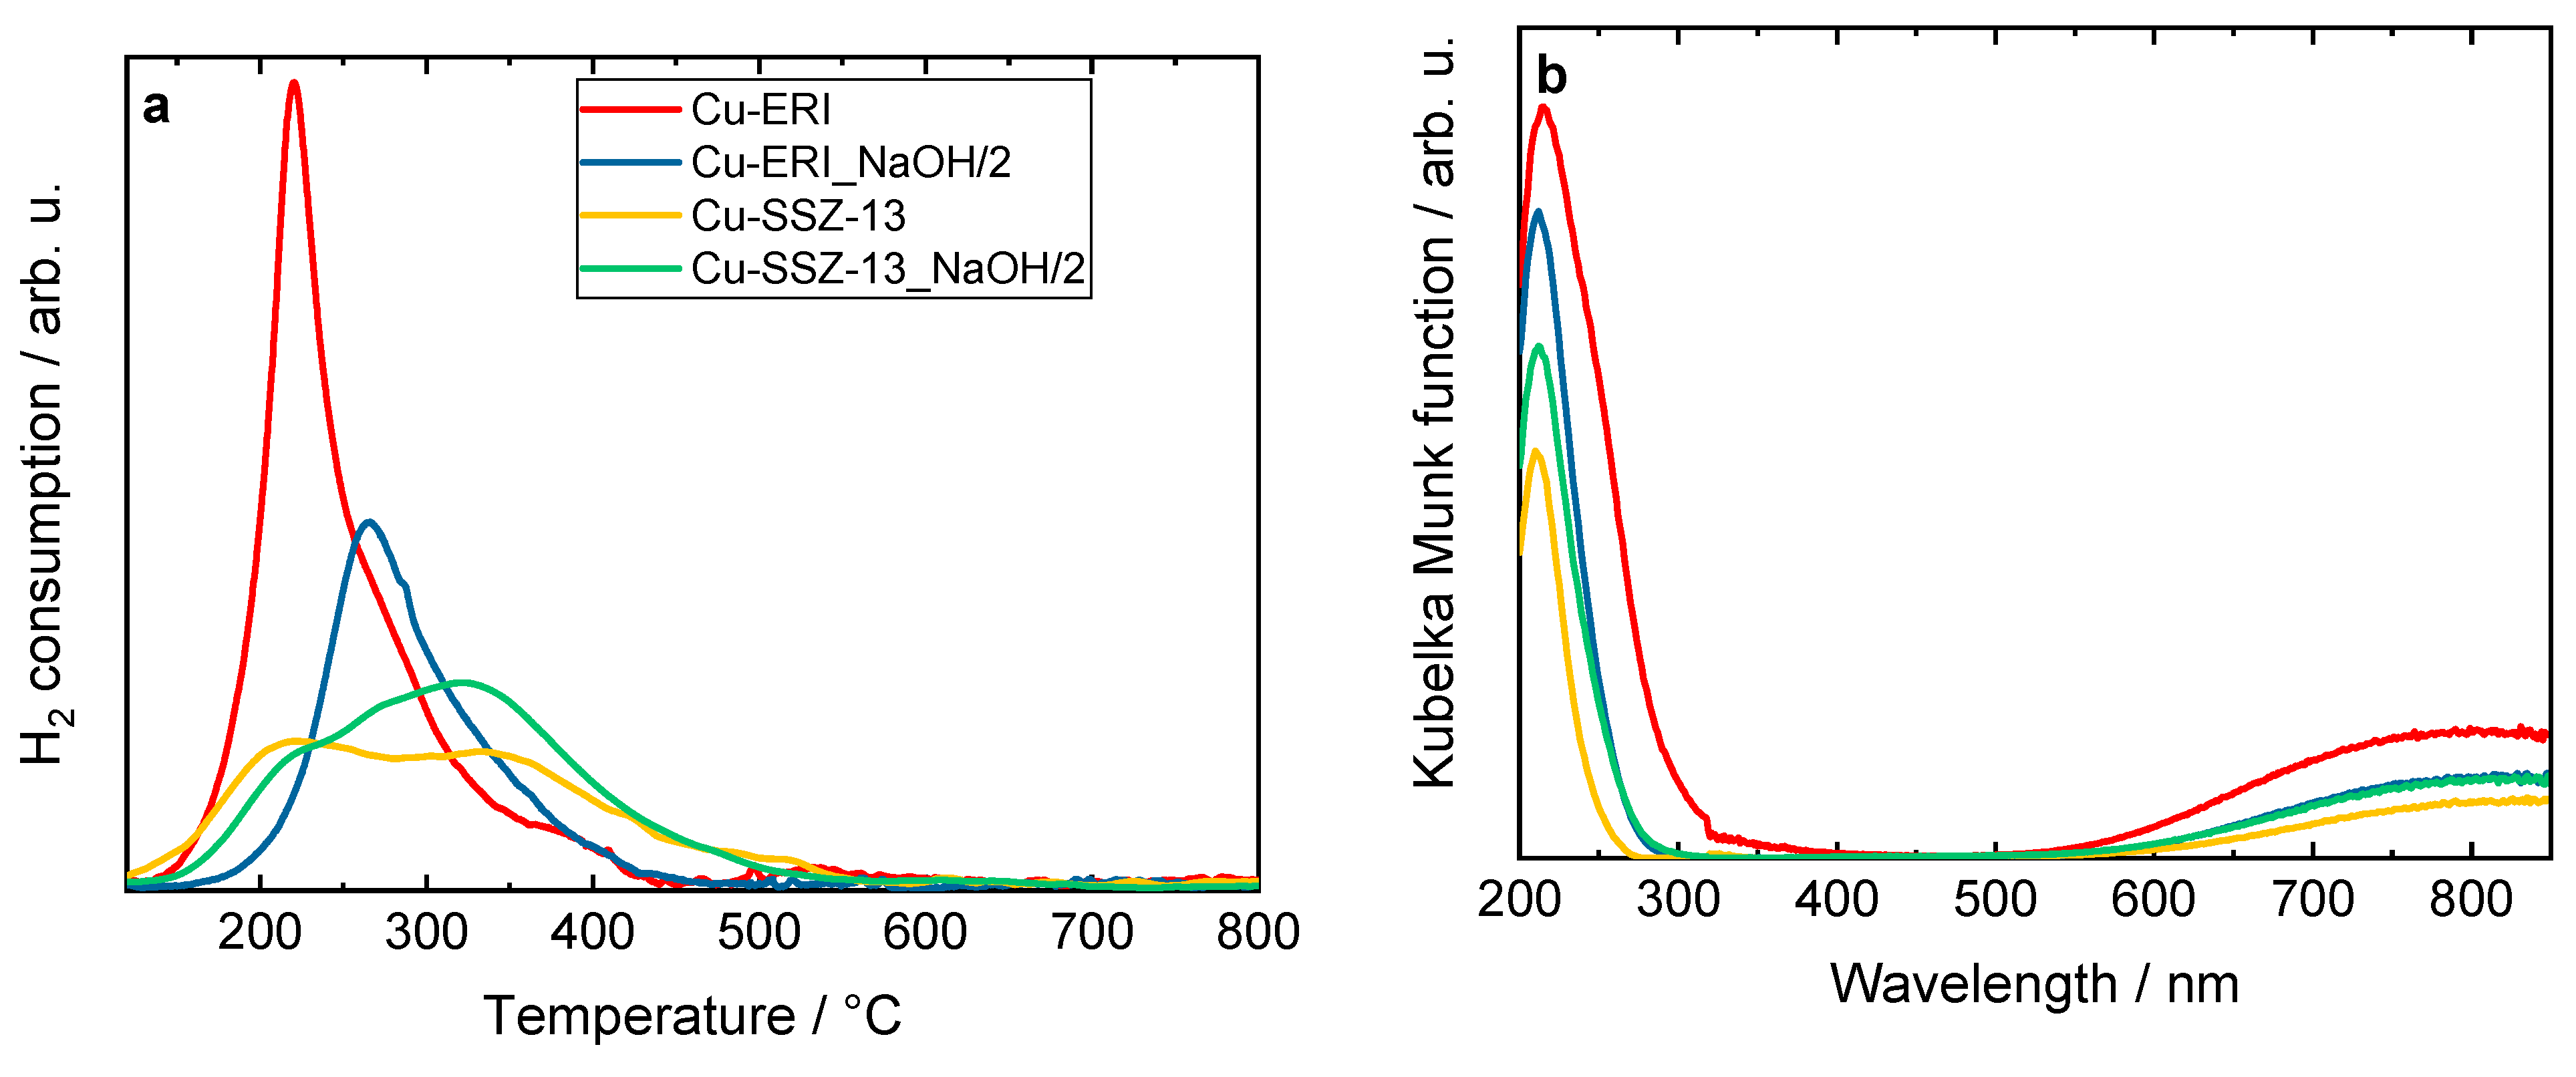
The reducibility of the materials was investigated via H2-TPR measurements. Figure 4 shows the H2-TPR profiles of Cu-containing ERI and SSZ-13 samples. For Cu-ERI, we can distinguish one peak centered at ca. 215 °C with a broad shoulder between 250 and 300 °C. For Cu-ERI_NaOH/2, this reduction peak is shifted to a temperature higher by about 50 °C. According to the literature indications (e.g., [23,24]), the first peak is associated with the reduction of Cu2+ species into Cu+ and the second one with the reduction of Cu+ species into Cu0. However, in the case of Cu-ERI, the first peak could also be related to the reduction of aggregated forms of copper species that are more accessible for H2 reduction (Figure S5a, Table S4). This statement is supported by the relatively high loading of copper in this sample (ICP-OES analysis, Table 2). Thus, both aggregated copper and isolated Cu2+ species are expected to be present in Cu-ERI. Otherwise, regarding the Cu-SSZ-13 sample, [Cu(OH)]+ (paired with Al located in eight-membered rings (8MRs)) and isolated Cu2+ (paired with two Al in six-membered rings (6MRs)) are reported as the main species present in this material. The [Cu(OH)]+ species in the 8MRs are more accessible to H2 molecules than those in the 6MRs, which explains their higher reducibility compared to the other species [25]. Furthermore, the lower H2 consumption of the first peak in Cu-SSZ-13_NaOH/2, coupled with the lower Cu species content compared to Cu-SSZ-13 (Table 2), indicates a lower amount of [Cu(OH)]+ species in this sample (Figure S5b, Table S4).
The DR UV-Vis profiles of the Cu-containing zeolites (Figure 4b) also vary depending on the zeolite topology or its post-synthetic modification. According to the literature [24,26,27], the oxygen-to-metal charge transfer between the lattice oxygen in the zeolite framework and the Cu2+ and Cu+ species appears around 200-260 nm. The bands in the 260-600 nm range proved the presence of the CuO species and [Cu-O-Cu]2+ species. The absorption in the range 600-850 nm is related to the d-d transitions of Cu2+ ions in pseudo-octahedral coordination (e.g., Cu(H2O)62+). The higher copper content could explain the presence of aggregated copper species visible in Cu-ERI compared to the other materials.
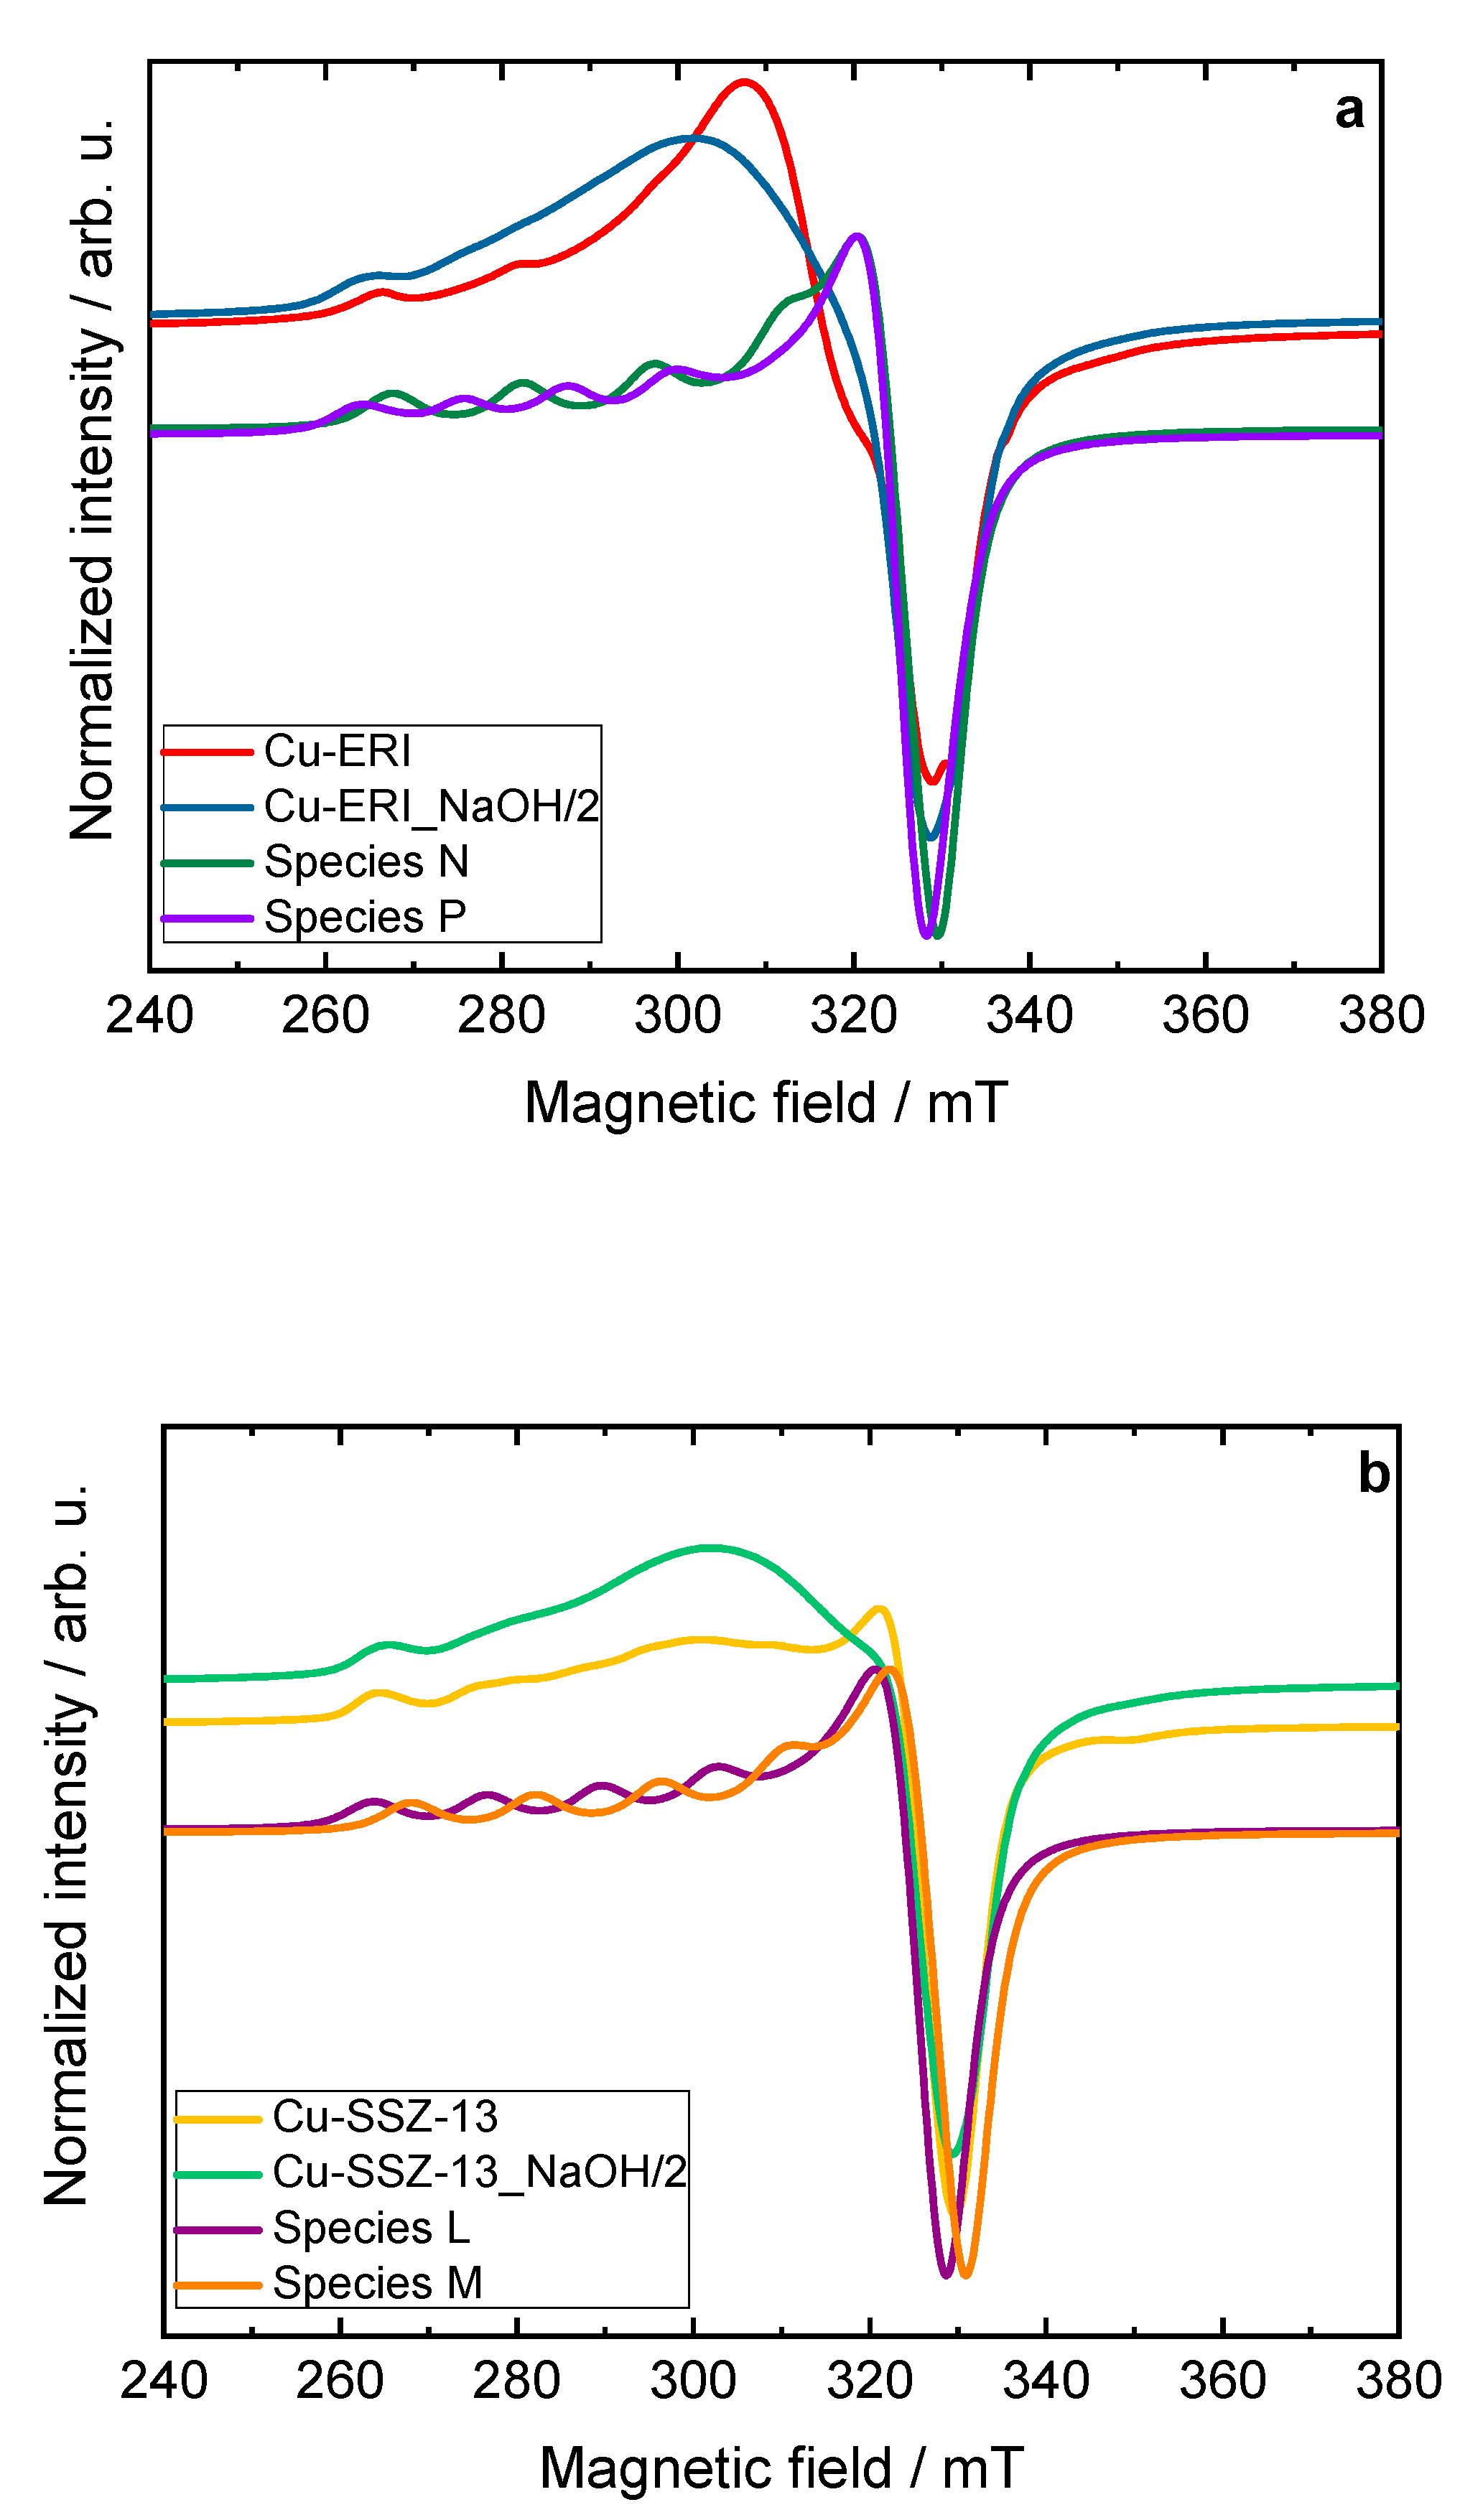
Figure S6 depicts the EPR spectra of hydrated Cu-containing zeolites, which can be interpreted as axially symmetric Cu2+ EPR signals with the characteristic hyperfine splitting pattern (I = 3/2) that slightly resolved at the parallel component (B = 240-300 mT) whereas the perpendicular component is not resolved. By performing spectral simulation, the hydrated spectra are characterized as anisotropic species (species K) with the spin Hamiltonian parameters of gzz = 2.380 and Azz = 460 MHz. However, in the case of the Cu-ERI and Cu-ERI_NaOH/2 samples, the presence of broader peaks at the parallel position of the EPR spectra indicates a higher degree of gzz- and Azz-strains for Cu2+ complexes, thus translated into higher site heterogeneity [29]. Figure 5a,b shows the analysis of the dehydrated Cu-containing zeolites, while the identified species can be classified according to Table S5. Table S6 is provided to give the contribution of several species to describe the experimental spectra. Based on the simulated spin Hamiltonian parameter of each experimental spectra, the assignment of the species can be deduced by comparing that parameter to the ones that are associated with fully hydrated Cu2+, partially dehydrated Cu2+, and fully dehydrated Cu2+ according to previous EPR studies of Cu-containing ERI and SSZ-13 [29,30,31,32,33]. The species K parameters match a fully hydrated Cu2+ (six-coordinated Cu2+ species with water ligand [Cu(H2O)6]2+). Species L corresponds to isolated Cu2+ species located at the 6MRs of the CHA structure. In addition, species M can be assigned likewise to the isolated Cu2+ species. Species O corresponds to four-coordinated square-planar-like structures, while species N is assigned to five-coordinated-square pyramid-like structures. Lastly, species P is related to isolated Cu2+ species that are suggested to have an octahedrally-distorted geometry. In the case of the Cu-containing SSZ-13 samples, the spectral simulations can be derived from two different species. Species L is the dominant species, contributing 60 % to the signal with the parameters gzz = 2.38 and Azz = 420 MHz, while the rest is attributed to species M, which can be observed with the parameters gzz = 2.33 and Azz = 450 MHz. For the Cu-containing ERI samples, species P and species N (gzz = 2.28 and Azz = 545 MHz) contribute to the spectra. Although the dominant species in the Cu-ERI case is species P (90 %) whereas, for Cu-ERI_NaOH/2, the dominant species is species N (60 %). It can be concluded by the EPR data that the post-synthetic modifications conducted for ERI- and SSZ-13-based samples tend to inflict a higher strain effect, which implies a relatively higher heterogeneity of Cu2+ species distribution in the Cu-ERI_NaOH/2 and Cu-SSZ_NaOH/2 samples if compared to Cu-ERI and Cu-SSZ-13, respectively.
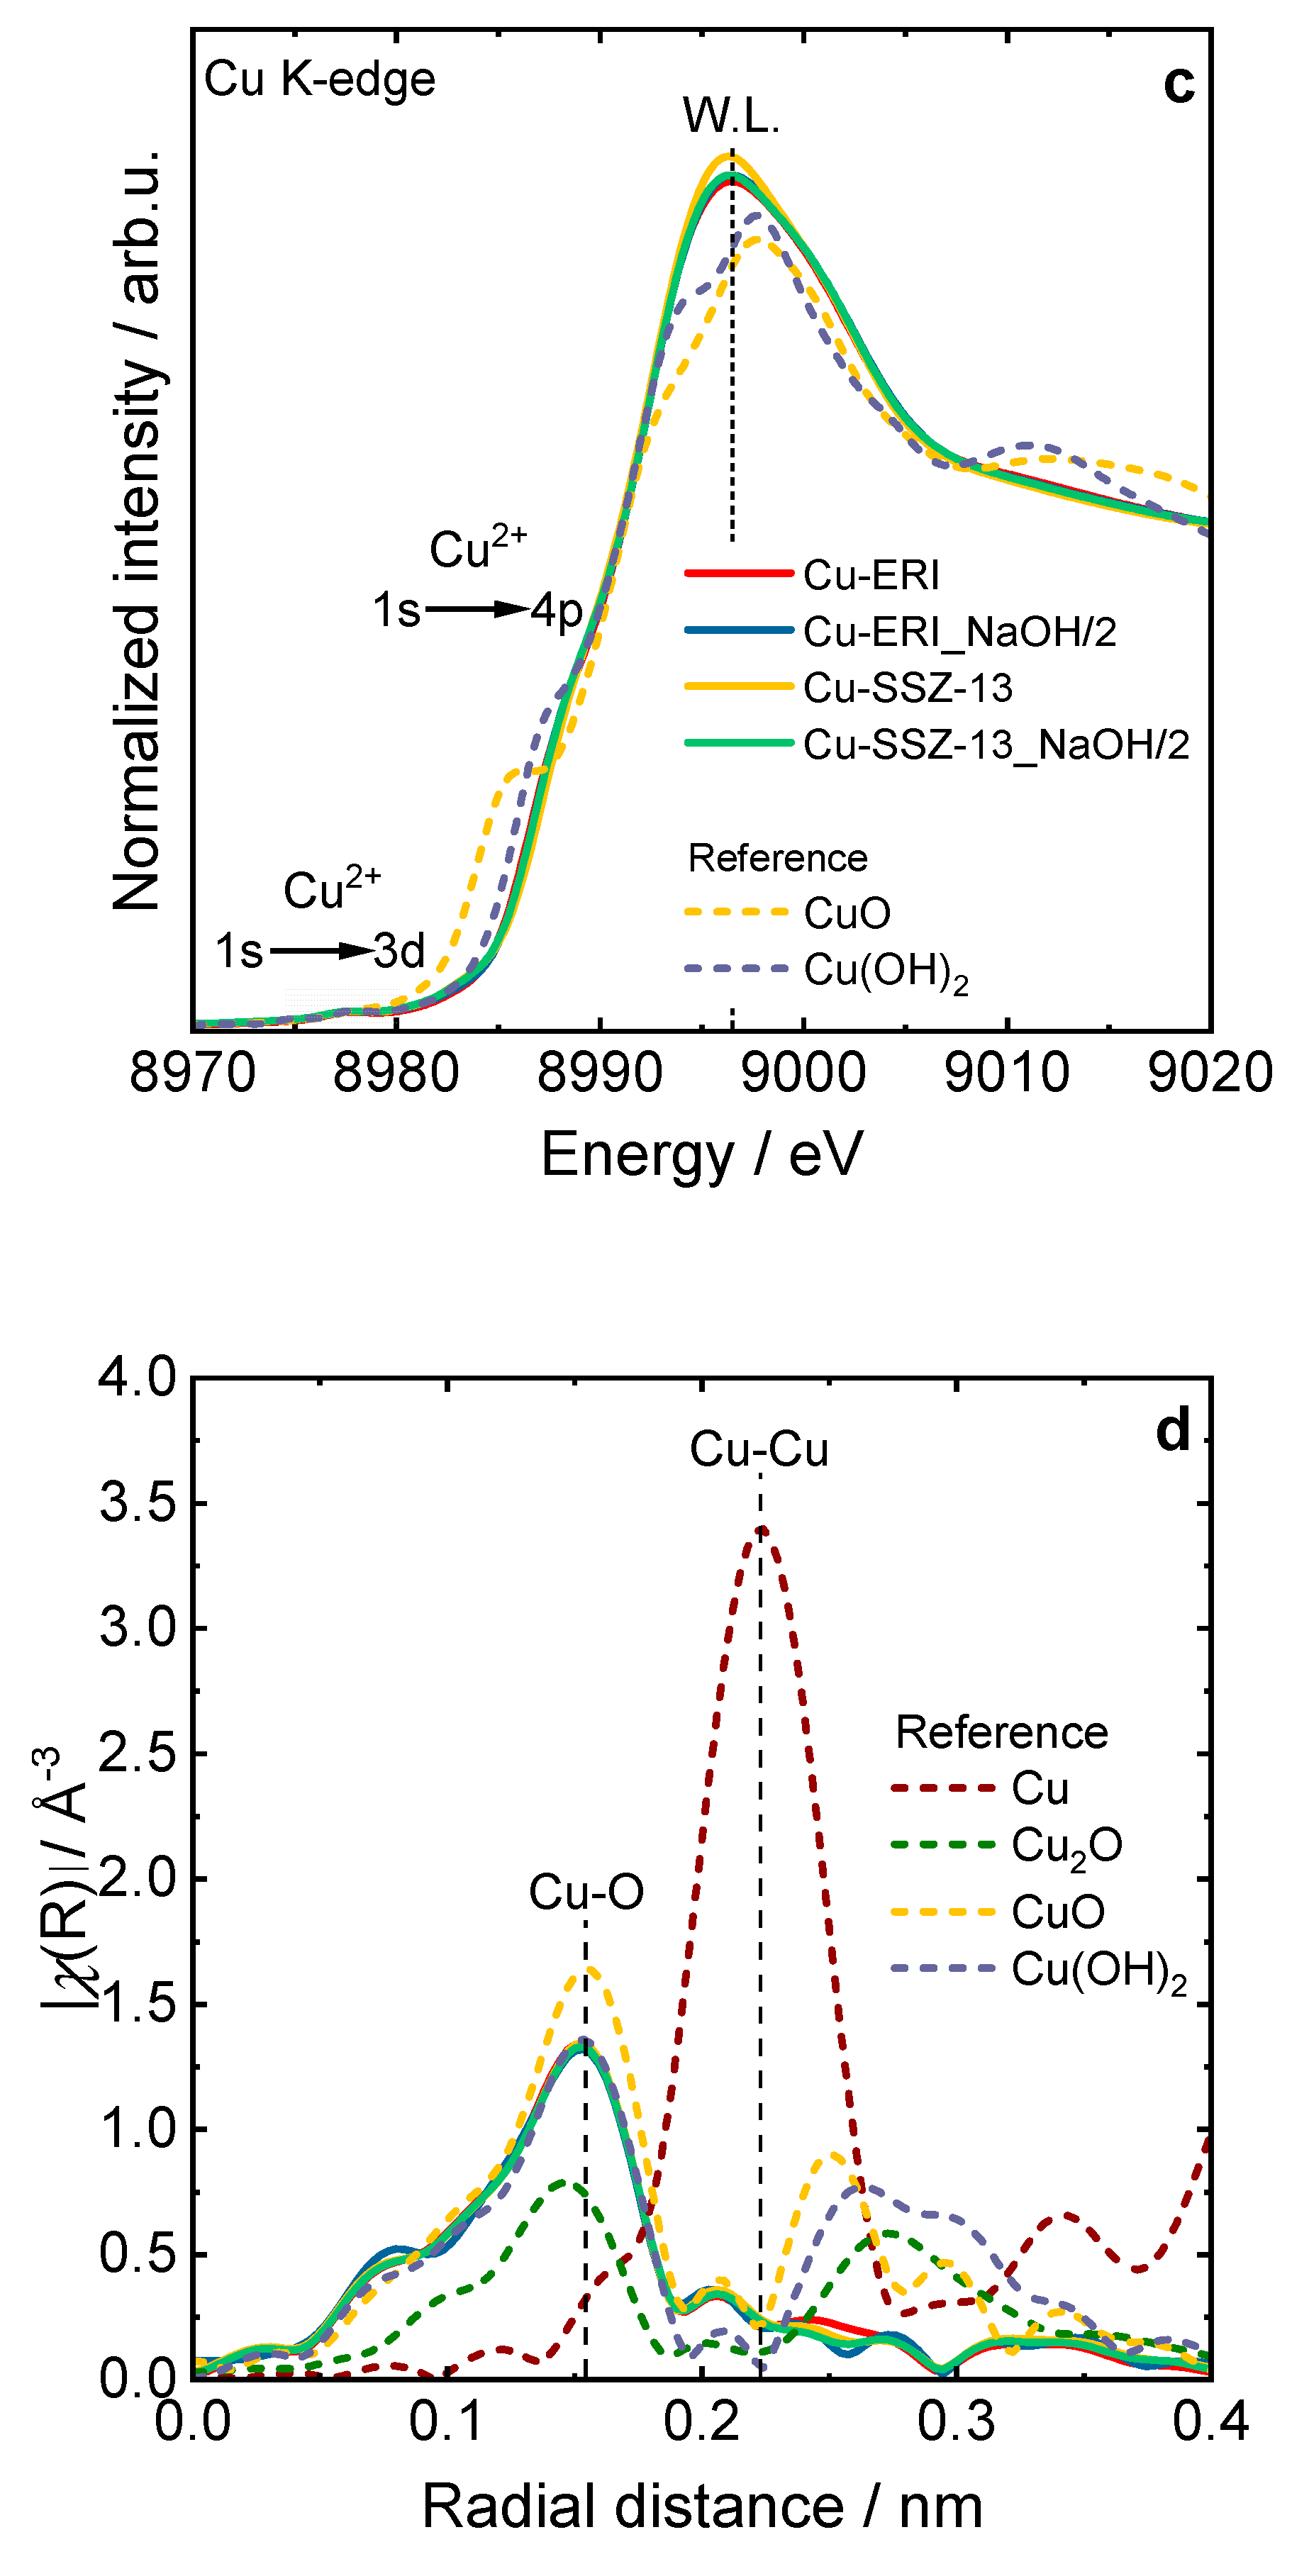
The shape and position of the XANES spectra revealed a Cu2+ oxidation state in all Cu-containing zeolite samples (Figure 5c and Figure S7). Namely, a weak pre-edge feature located at 8977.3-8977.5 eV and attributed to the 1s → 3d quadrupole-allowed transition is not observed in Cu0 and Cu+ species. Additionally, the position of the rising edge at about 8987.0 eV, corresponding to dipole-allowed 1s → 4p transitions, and the presence of a high-intensity white line at ca. 8996.4 eV, is characteristic of Cu2+ species in a highly coordinated form, with a combination of water, framework oxygen, and OH groups in a coordination sphere [34,35].
The corresponding Fourier-transform (FT) of extended X-ray absorption fine structure (EXAFS) spectra for Cu-containing zeolite samples and reference samples are presented in Figure 5d. As shown, the spectra of Cu species in zeolites correspond most with the structure of cupric hydroxide. The spectra of all synthesized samples exhibit an intense peak at 0.15 nm in R-space, associated with backscattering from the oxygen atoms bonded directly to copper atoms (Cu-O distances in the first coordination shell). Typically, features above 0.2 nm arise from Cu-Cu scattering (e.g., 0.22 nm in metallic Cu) and the second shell Cu-O single scattering. The low-intensity second-shell peak at 0.205 nm, observed in all zeolite samples, is attributed to the [Cu(H2O)6]2+ [36,37]. Nevertheless, the FT EXAFS spectra did not show a defined higher coordination shell (the absence of the distinct Cu-Cu contribution above 0.255 nm). This suggests the lack of long-range ordering of the copper sites in the studied zeolite samples [34].
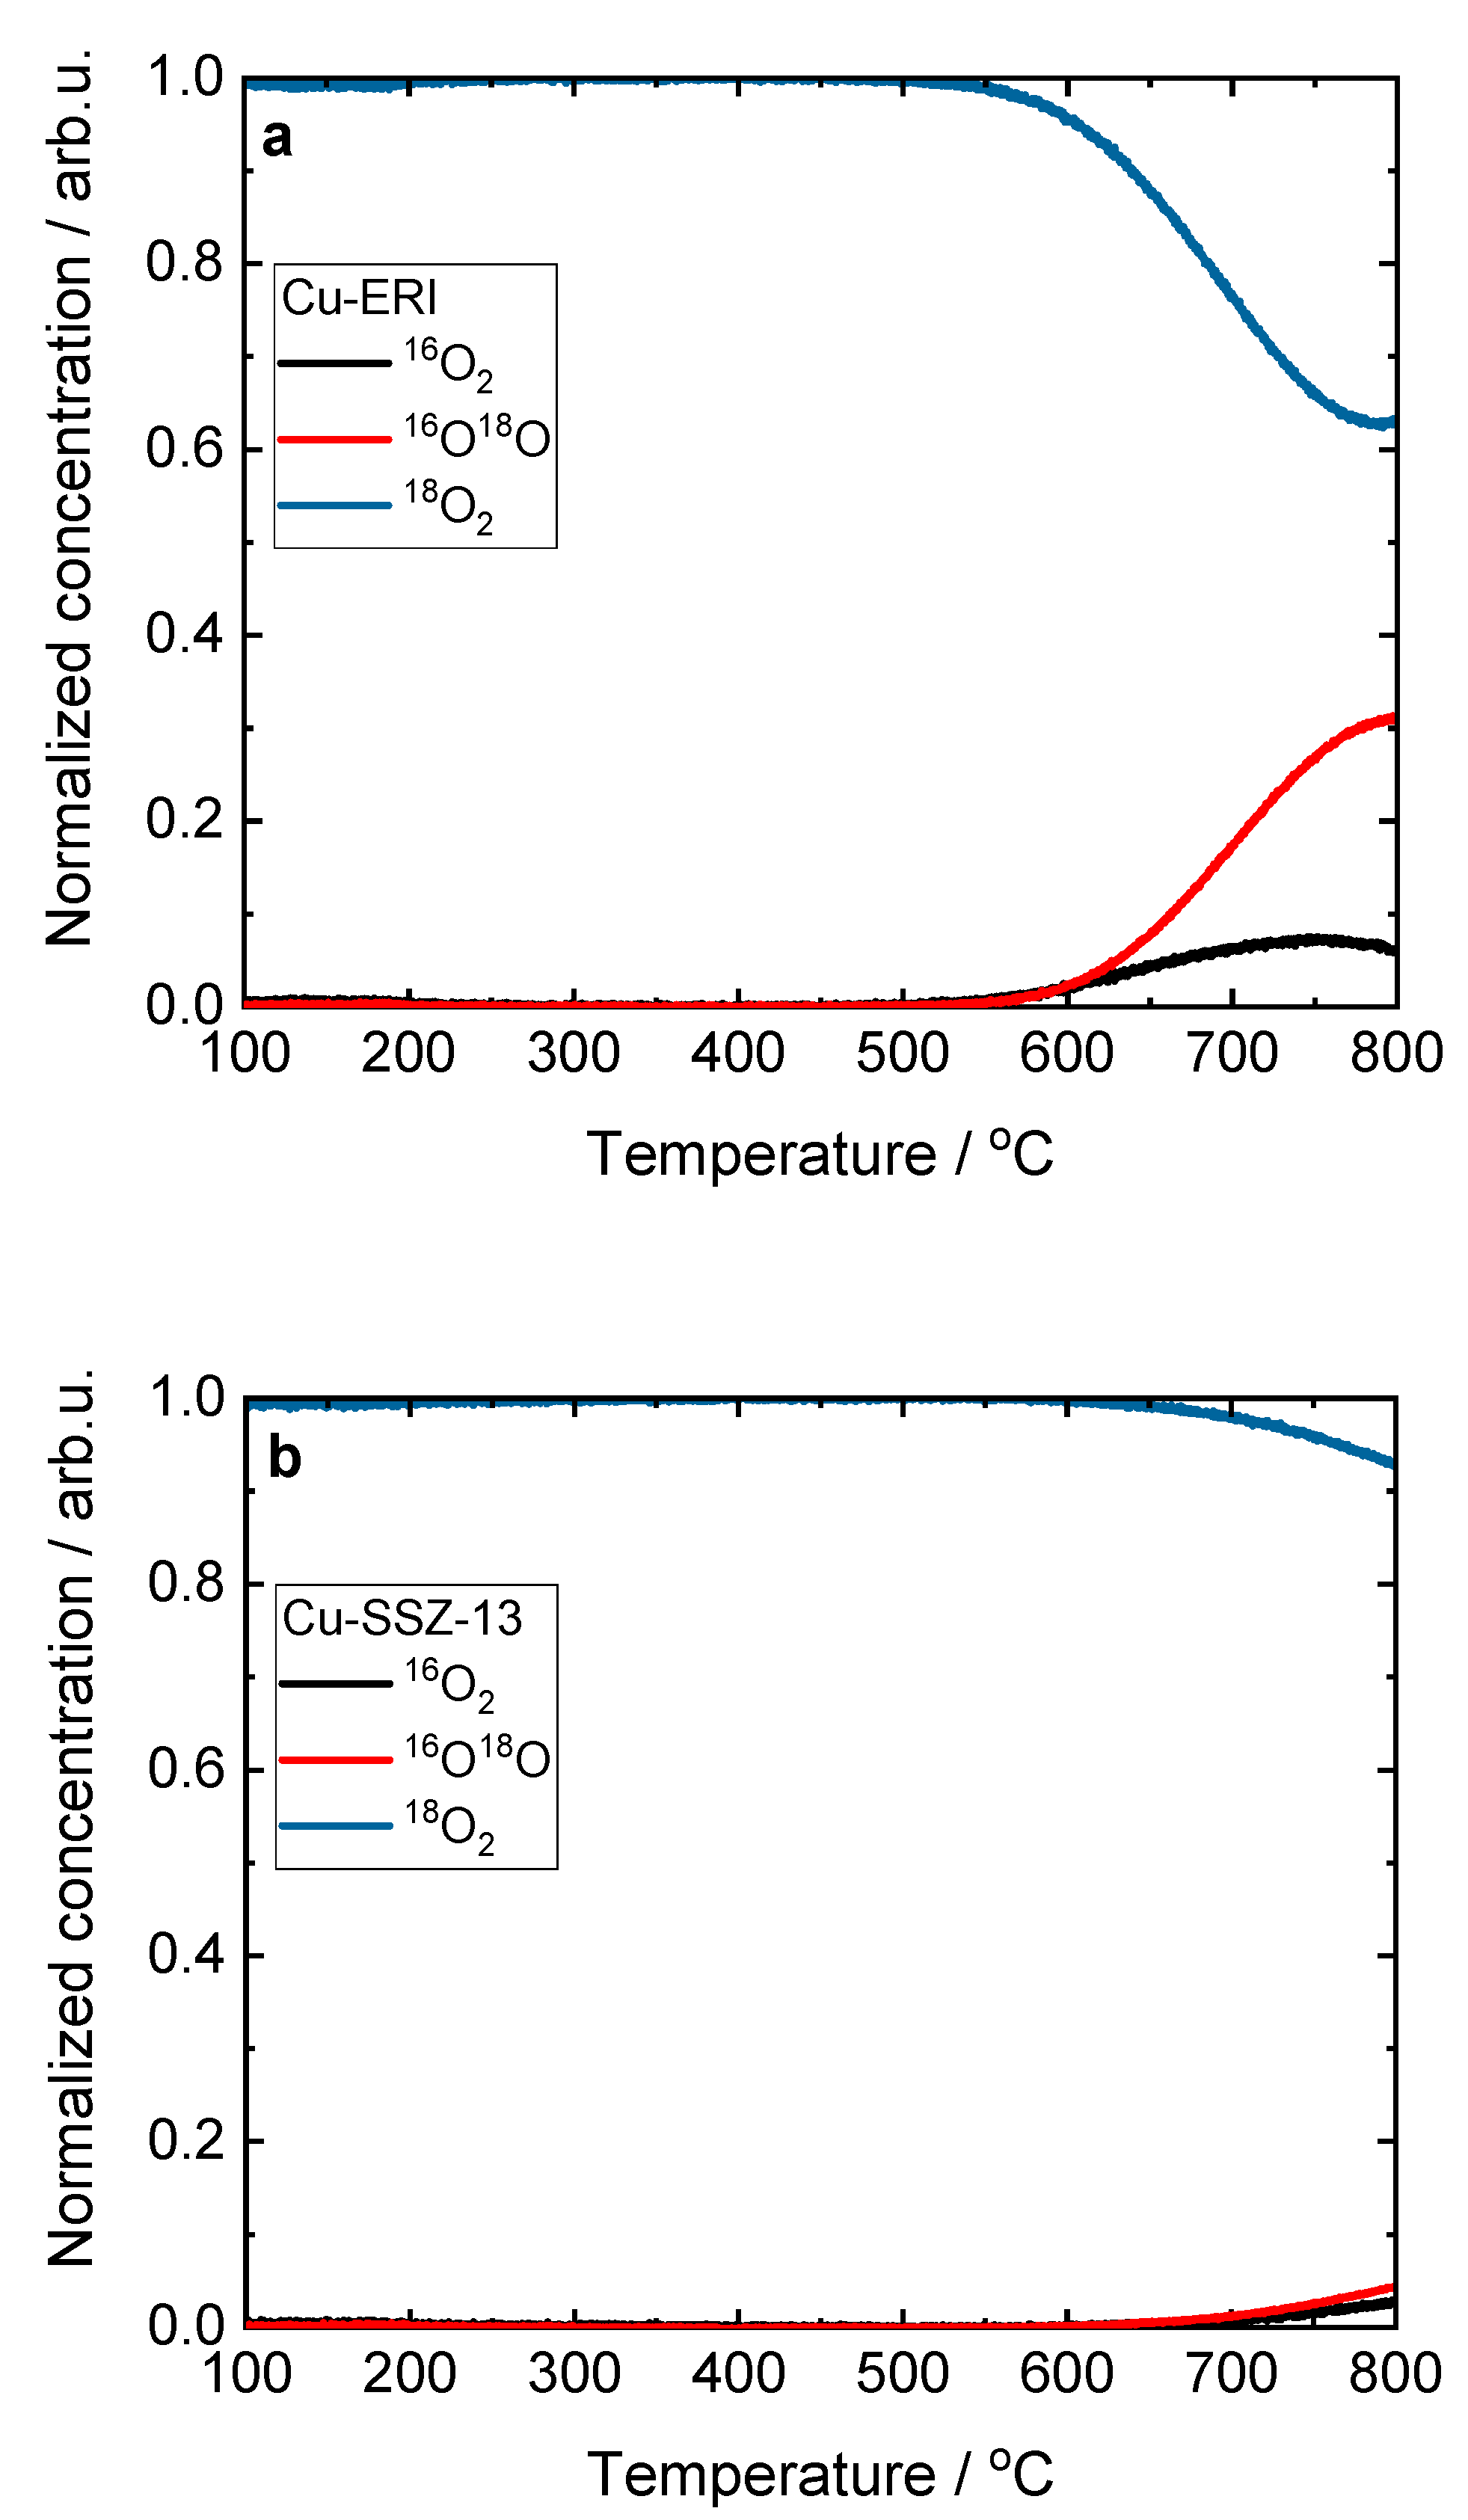
It should be noted that there are no significant differences in the XANES and FT EXAFS spectra profiles between all Cu-containing zeolite samples. The collected data confirm the formation of hydrated Cu2+ sites in zeolites, as reported previously in the broad literature on XAS studies of the untreated hydrated Cu sites in metal-exchanged zeolites (e.g., [34,36,37]). Recent studies suggest a dynamic equilibrium between Cu2+ sites six-, five- and even four-coordinated to O atoms from H2O molecules [38,39]. Figure 7 and Figure S8 present the results of the temperature-programmed isotopic exchange (TPIE) studies carried out over Cu-containing ERI and SSZ-13 samples. However, among the evaluated samples only for Cu-ERI, the TPIE results show that oxygen from the lattice of metal oxide catalysts is exchanged with oxygen (18O2) from the gas phase. These results confirm that oxygen mobility is not decisive in the NH3-SCR-DeNOx(Figure 8).

3.3. Catalytic investigations

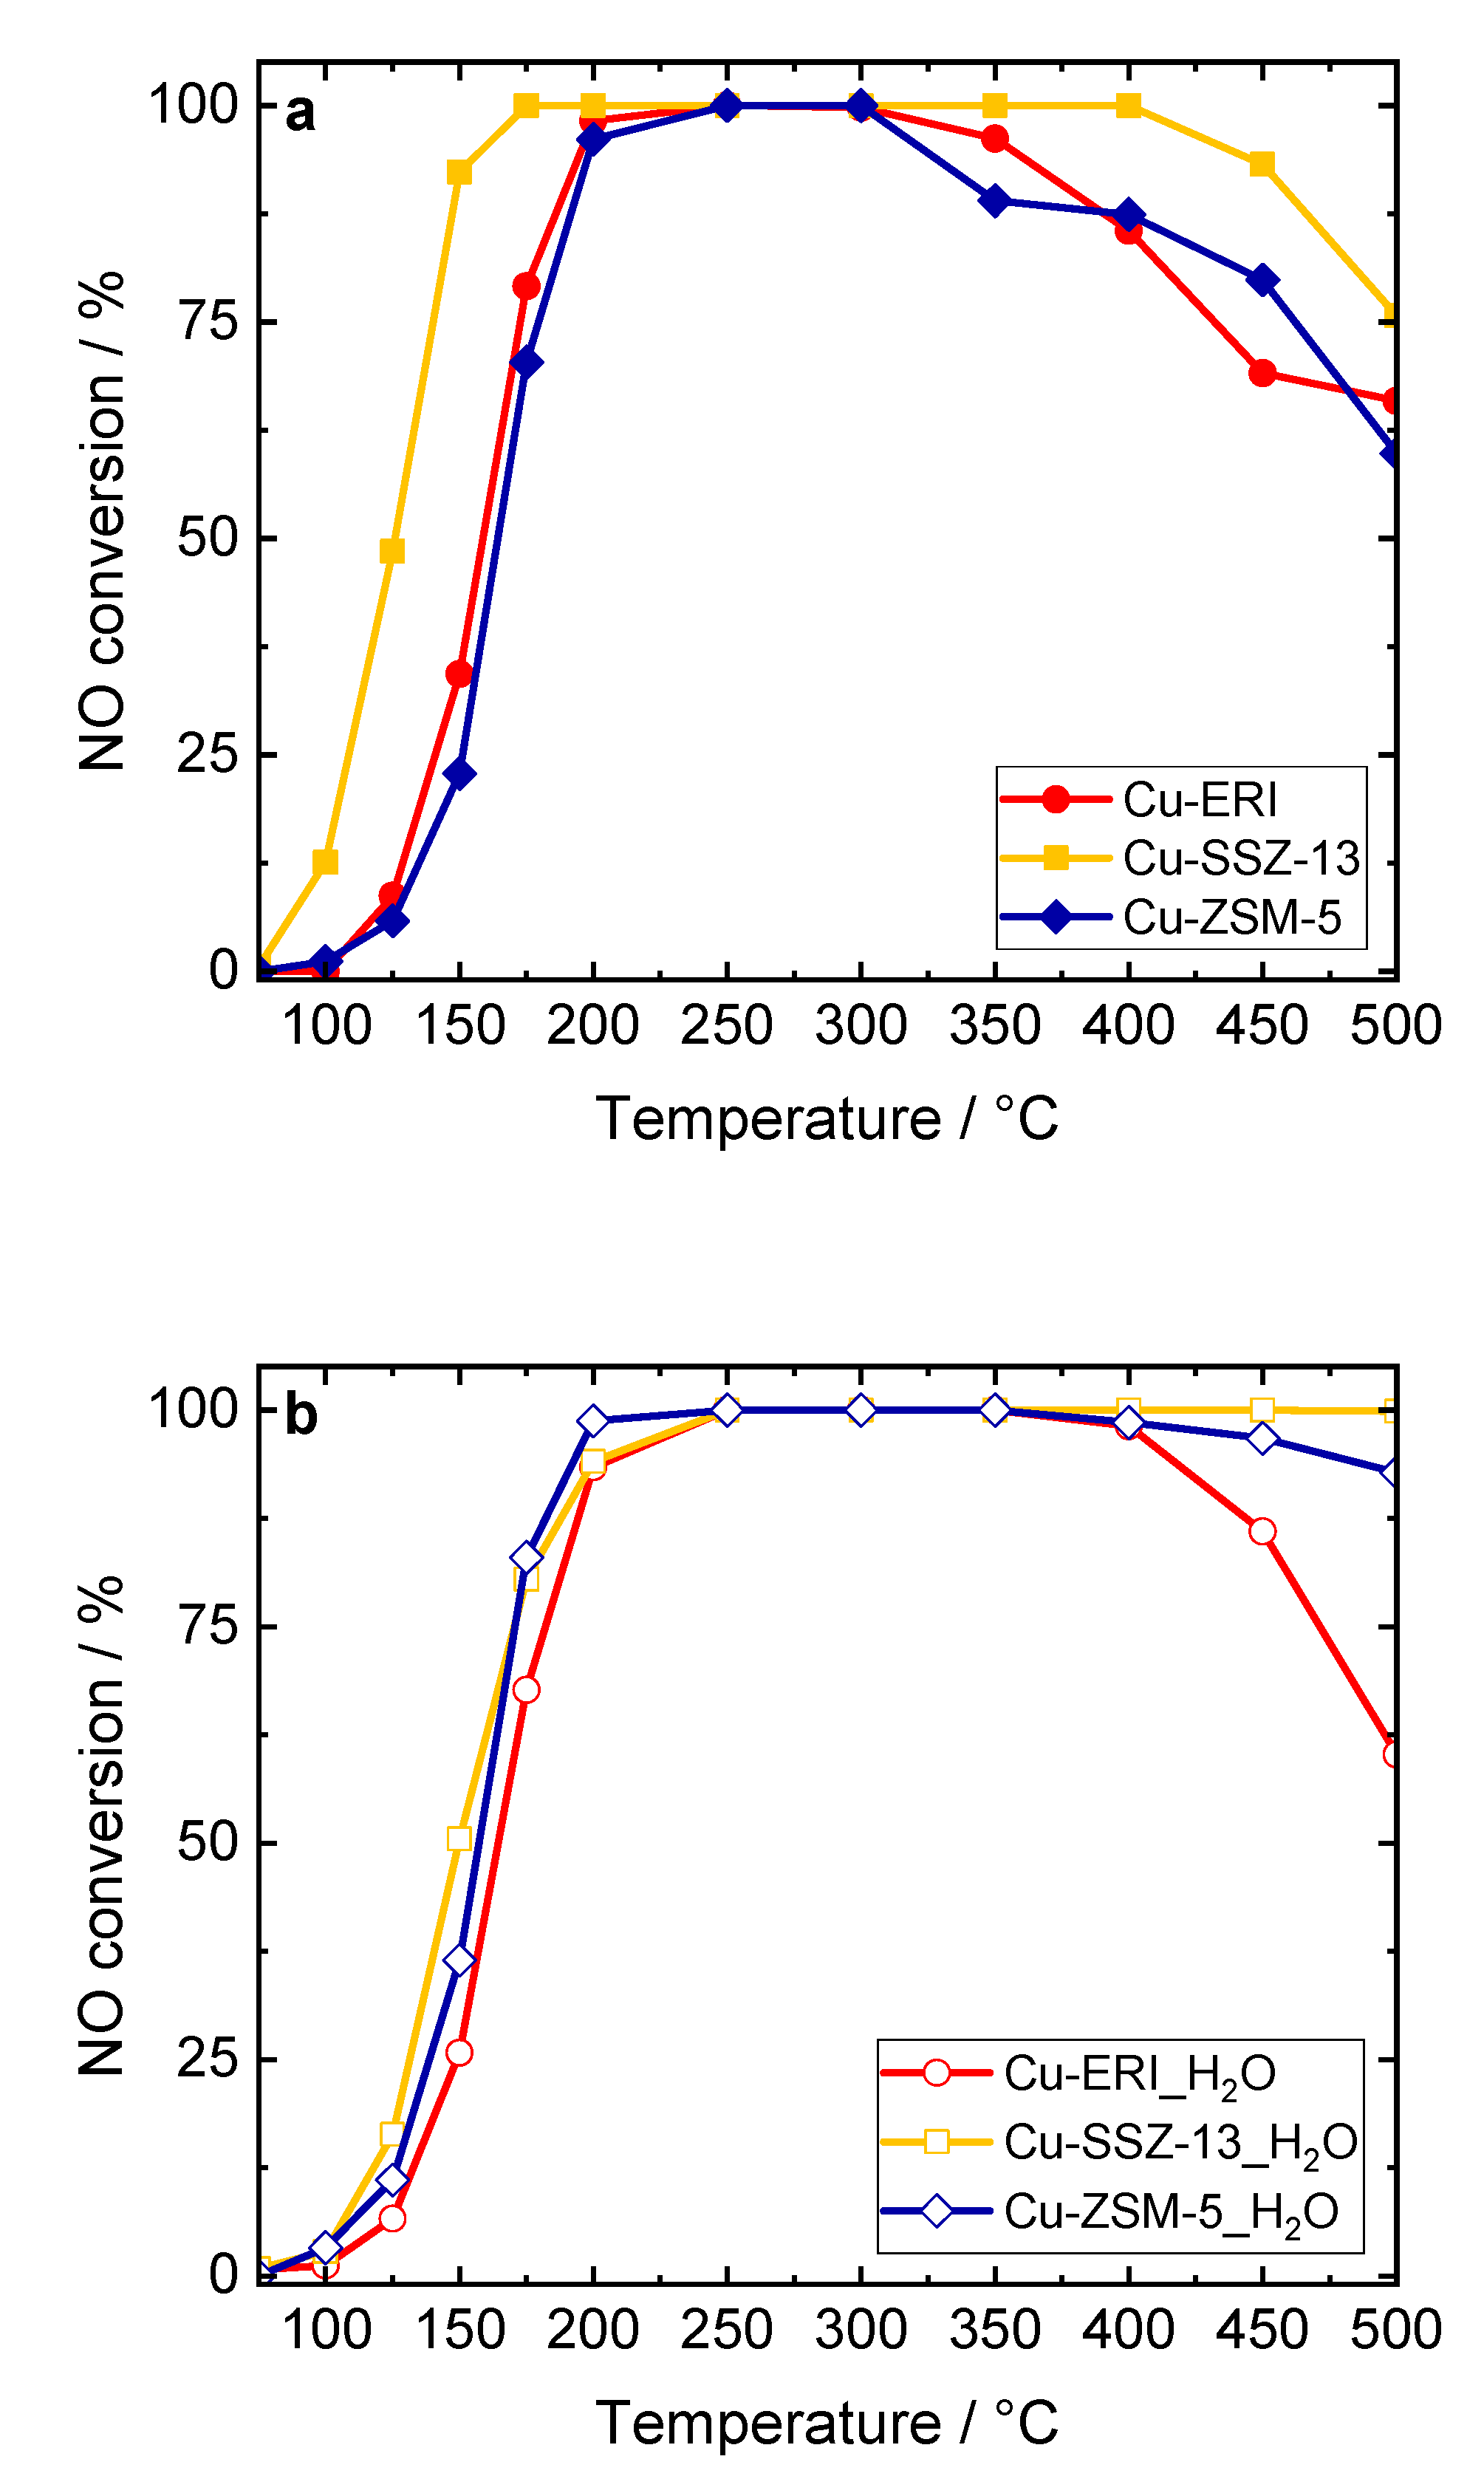
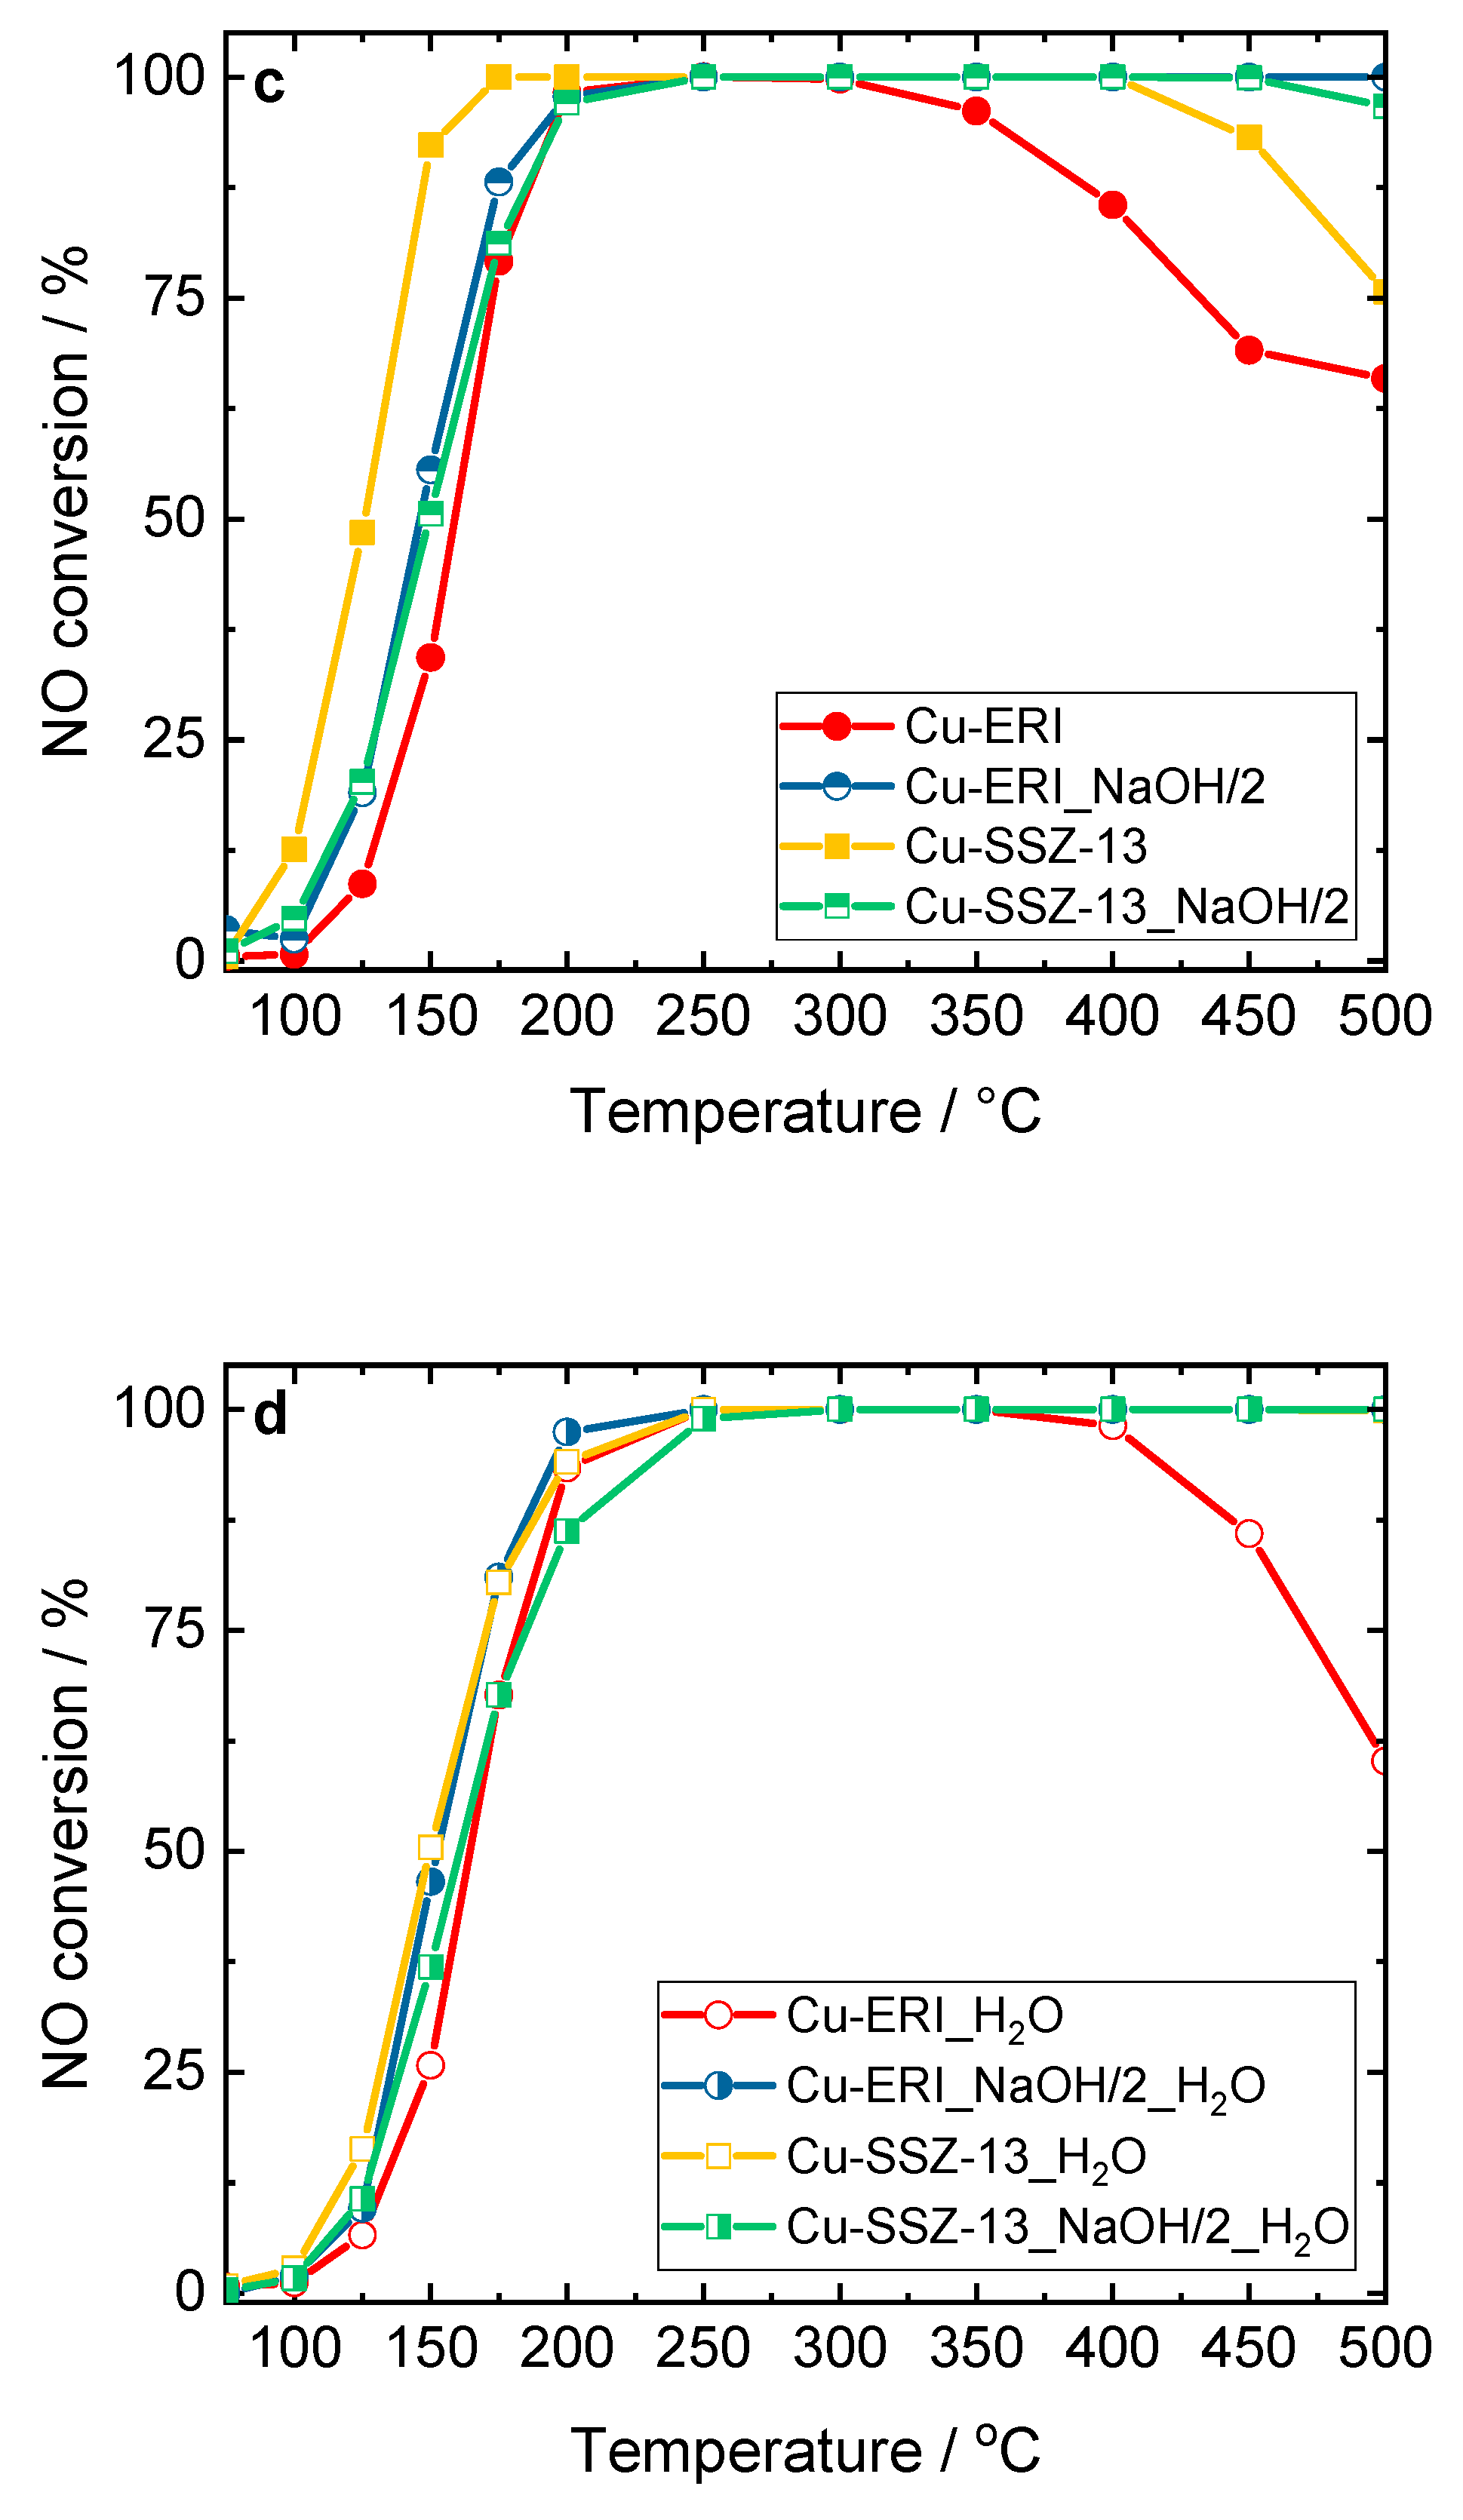
Figure 8 and Figure S9-S10 represent the results of the catalytic experiments for standard NH3-SCR-DeNOx, thus involving the reduction of NO with ammonia in the presence of excess oxygen with N2 and water vapor formation. Among different topologies applied, the highest NO conversion (without H2O and in its presence in the feed) was achieved over Cu-containing SSZ-13 rather than Cu-ERI or Cu-ZSM-5 (Figure 8a,b). Cu-ZSM-5 was investigated for comparison and was fully characterized in our previous studies [11]. Similarly, other authors reported transition-metal containing SSZ-13 to be more active than other zeolite-based catalysts (e.g., Wang et al. [23] or Kwak et al. [40]). Furthermore, the catalytic activity in NH3-SCR-DeNOx varied depending on the applied post-synthetic modification of zeolites. For example, Cu-ERI_HNO3_NaOH/0.5_0.5 and both Cu-ERI_NaOH/2 and Cu-ERI_HNO3_NaOH/0.5_2 reach complete conversion up to 400-500 °C (Figure S9a). Furthermore, Cu-ERI_NaOH/2 reaches the highest NO conversion (between 250-500 °C) in the presence of 5 vol.-% H2O. A significantly higher amount of aggregated copper species in Cu-ERI led to a drop in conversion above 350-400 °C due to the side reaction of NH3 oxidation (NH3-SCO). Indeed, our separate studies of ammonia oxidation revealed enhanced NH3 conversion over Cu-ERI (Figure S10b). Furthermore, the lower NH3 conversion over Cu-ERI_NaOH/2 compared to Cu-ERI is supported by H2-TPR data, which reveals a lower amount of aggregated copper species in the first material. Only N2 was identified among all N-containing products in the NH3-SCR-DeNOx and NH3-SCO over applied ERI-based catalysts.
In the Cu-containing SSZ-13-based catalysts, Cu-SSZ-13 shows higher NO conversion below 200 °C due to a higher content of highly reducible [Cu(OH)]+ species in this sample compared to the other samples. However, above 400 °C, the NO conversion decreases significantly compared to the other materials, again due to the side reaction of NH3 oxidation (Figure S10b). Again, N2 was the only detected product in NH3-SCR-DeNOx and NH3-SCO over this series of samples. According to several reports (e.g., [9,10,41]), SSZ-13 is predominantly treated with an aqueous solution of 0.1 M NaOH (as an optimum solution between 0.05-0.3 M). Studies by Oord et al. [9] and further by Wu et al. [10] proved Cu-containing SSZ-13 with such post-modified support to be the most active catalysts. Thus, to better compare our samples with the reported ones, we repeated the same post-synthetic modification of SSZ-13 and preparation method of the catalyst as reported above [9,10], i.e., post-synthetic modification of SSZ-13 in a 0.1 M aqueous solution of NaOH. However, in our case, the activity of the respective catalyst was lower compared to Cu-SSZ-13 (Figure S10a). Still, it should be noted that the n(Si)/n(Al) ratio (12 and 17.8 versus 6 in our case), and thus the Cu species content (1.1 and 2.55 versus 3.3 wt.-% of Cu in our case) as well as the related Cu species distribution, varied among our materials and the ones in the above-reported literature. For these reasons, the comparison is not straightforward. Thus, our following studies will constitute an investigation of micro-/mesoporous SSZ-13 with different n(Si)/n(Al) ratios.
In the case of chabazite-based catalysts, possessing a small cage aperture of 0.38 nm, the development of the mesopores is frequently assigned to the overcoming of diffusion limitations (caused by the presence of micropores) and to enhanced accessibility of the catalytically active centers. The determined activation energies, the Thiele modulus, and the effectiveness factor, allow for a more direct assessment of the presence of diffusion limitations in the mesoporous zeolite-based catalysts compared to conventional reference materials. The reported activation energies of the Cu-containing ERI and SSZ-13 samples are 53 and 70-80 kJ mol-1, respectively [4,42,43]. Interestingly, Zhang et al. [41] investigated core-shell structured catalysts composed of an ordered mesoporous aluminosilicate (MAS) shell and a mesopore-containing Cu-SSZ-13 (prepared using the NaOH solution) core. In comparison with conventional Cu-SSZ-13, the meso-CuSSZ-13@MAS catalyst showed enhanced NOx conversion due to an increase in the amount of isolated Cu2+ ions (based on H2-TPR and NH3-TPD analyses) and fewer pore diffusion limitations (based on the activation energy calculations). They reported that the introduction of mesoporosity in the system resulted in a higher activation energy than the conventional Cu-SSZ-13, which indicated a reduction in the pore diffusion limitations. In our case, we found 75 and 92 kJ mol-1 for Cu-ERI and Cu-ERI_NaOH/2, as well as 77 and 70 kJ mol-1 for Cu-SSZ-13 and Cu-SSZ-13_NaOH/2 for NH3-SCR-DeNOx without H2O in the feed. However, the role of formed mesopores in overcoming diffusion limitations in NH3-SCR-DeNOxand NH3-SCO is not excluded.

4. In situ spectroscopic studies

When exposed to molecules with strong basicity (e.g., NH3, H2O), isolated Cu species are pulled away from their original position and migrate within the zeolite cages [44]. This reaction-driven dynamic Cu motion reflects the low-temperature NH3-SCR-DeNOx and can be monitored by In situ FT-IR and In situ DR UV Vis spectroscopy.
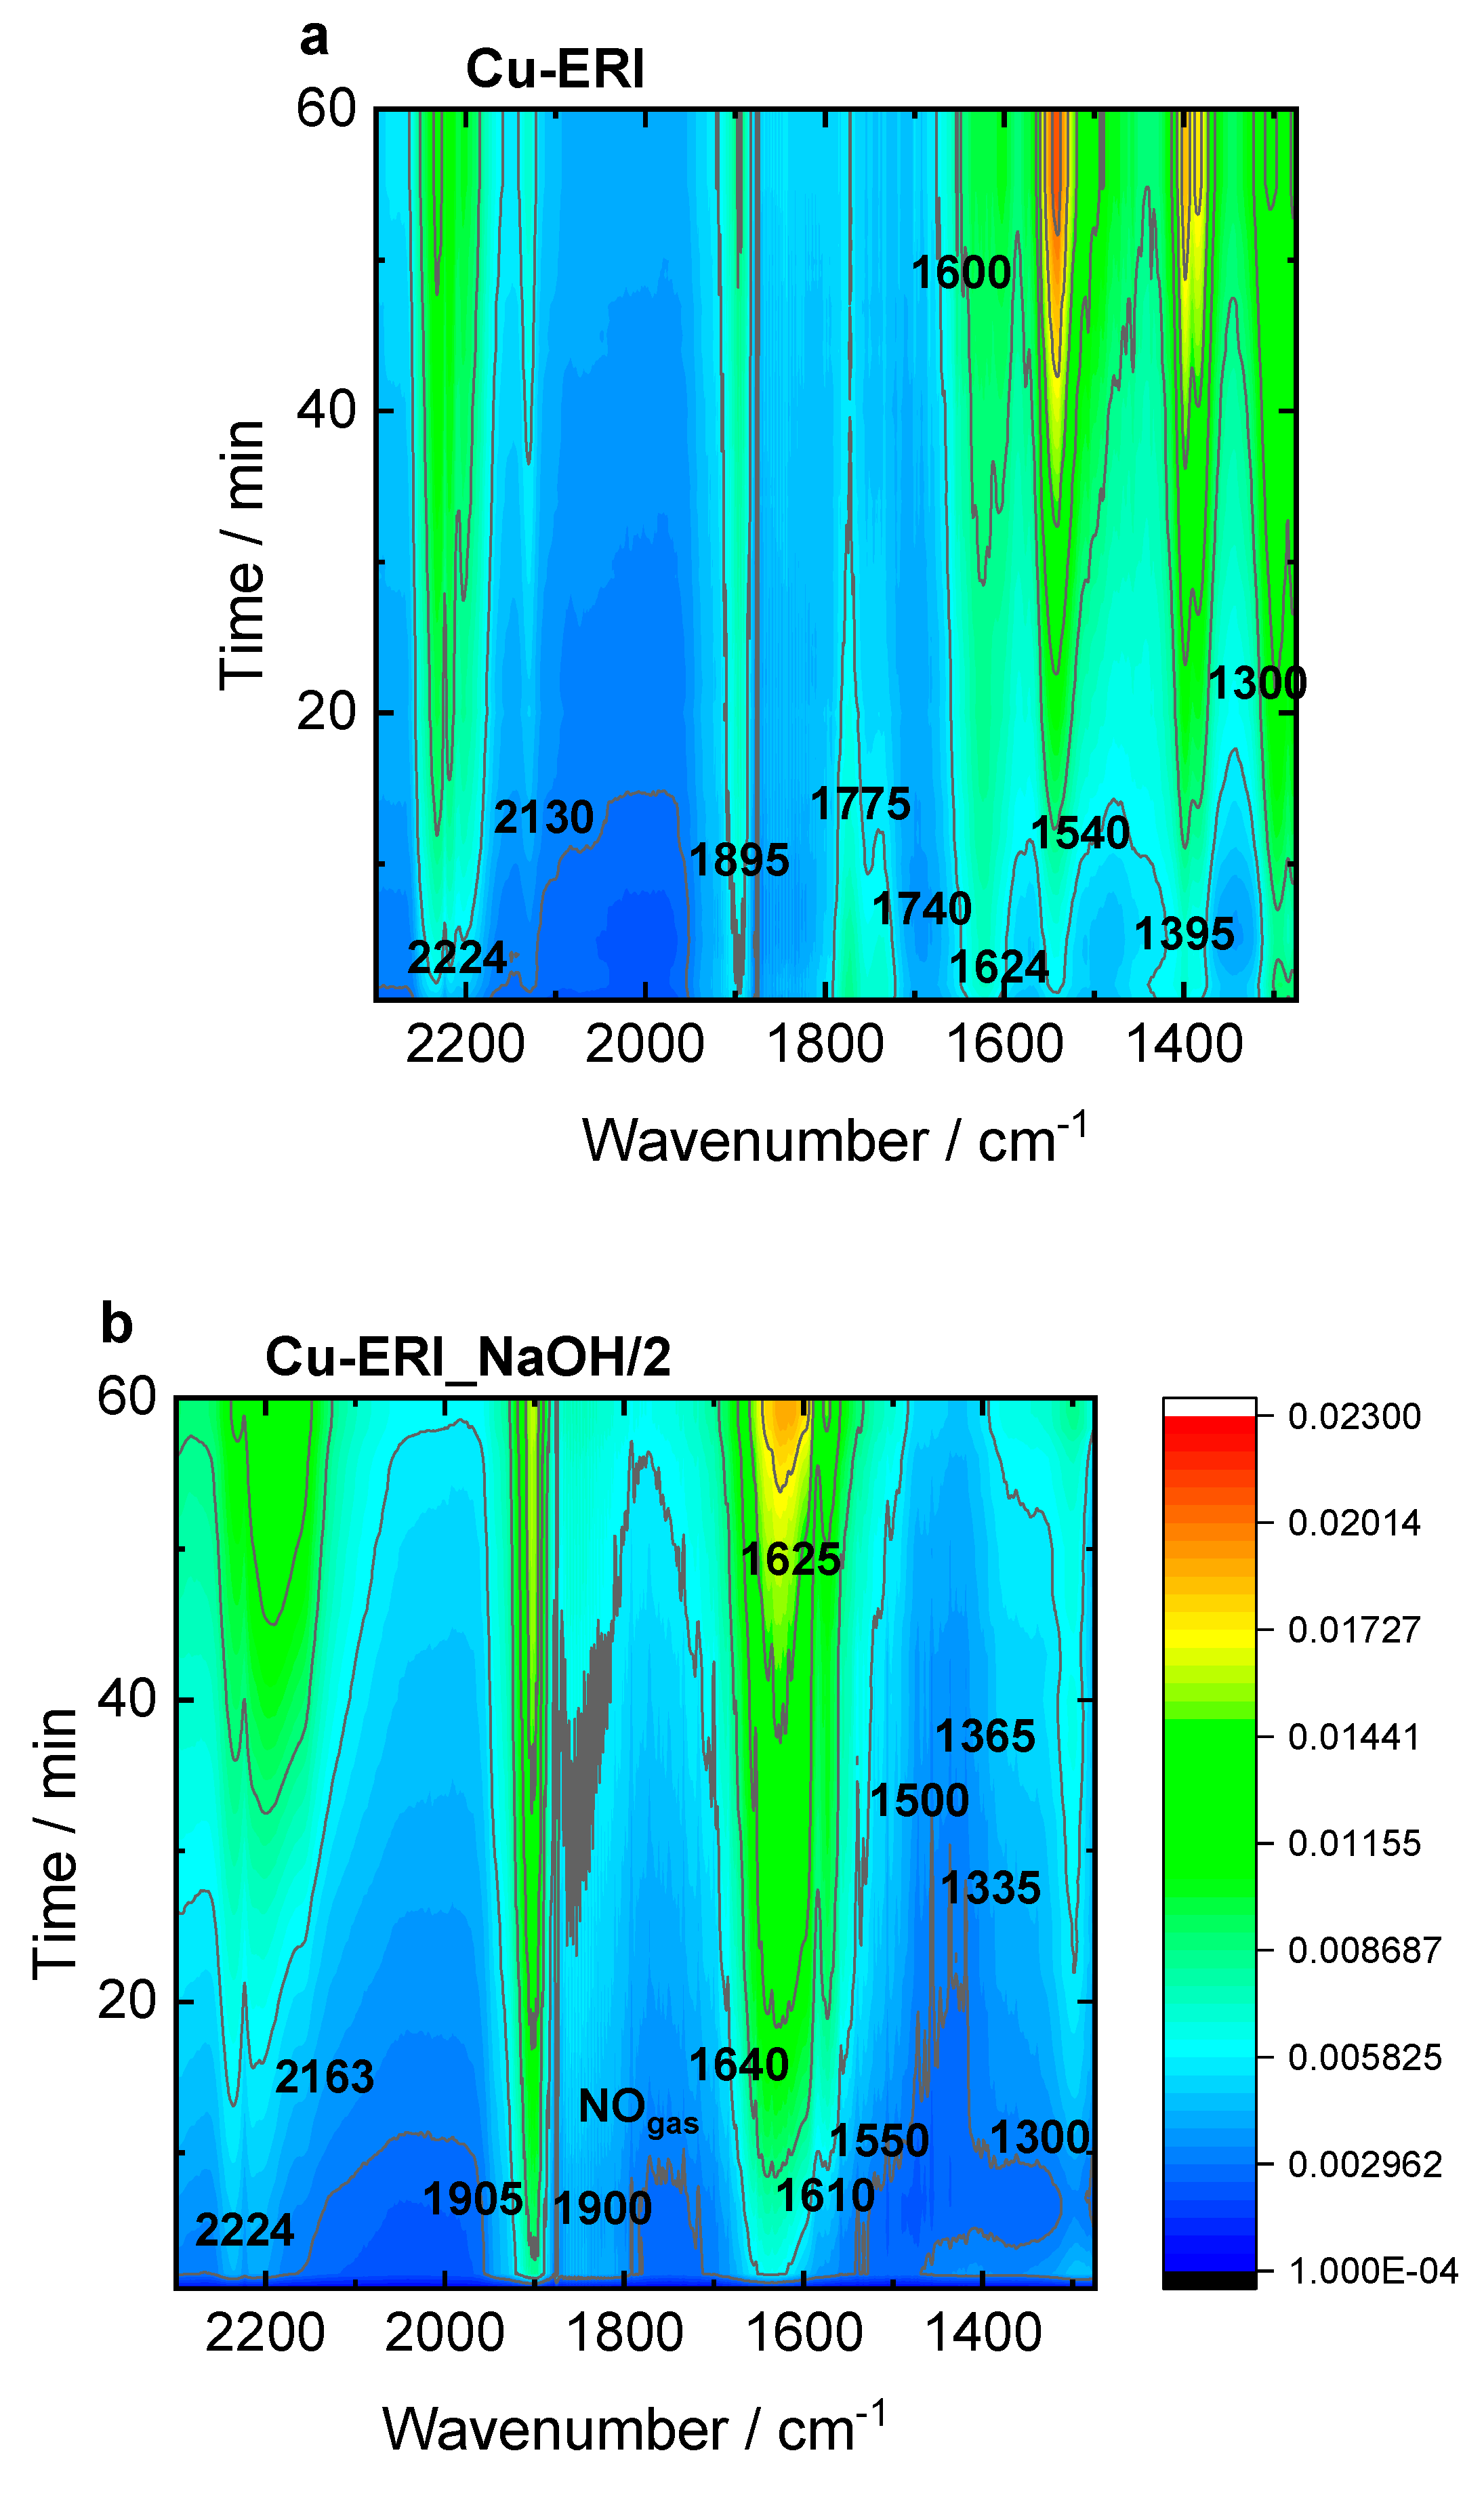
Figure 9 and Figure S11 present the top-down projection of In situ FT-IR spectra collected for the Cu-containing ERI and SSZ-13 catalysts contacted with reactants for 1 h at 125 °C. In Cu-ERI (Figure 9a), the bands of the Cu2+(NO) mononitrosyl (1895 cm-1), N2O (2224 cm-1) appeared immediately when the NO3-/NO2- bands (located at 1300, 1395, 1540, and 1600 cm-1) accompanied by the formation of NO+ ions (2130 cm-1) started to dominate the spectrum in later SCR reaction course. The band at 1624 cm-1 can be attributed to ammonia molecules in a coordination sphere of Cu2+ ions consumed in favor of the production of nitrates/nitrites. The Cu+(NO) species are identified by the 1775 and 1740 cm-1 bands. Overall, the most dominant species detected for Cu-ERI, also in the presence of water vapor, are the nitrates (located at 1395 and 1540 cm-1). The different positions of the Cu2+(NO) mononitrosyls (1900 and 1905 cm-1) formed on the surface of the Cu-ERI_NaOH/2 sample (Figure 9b) than for Cu-ERI indicates the different nature of Cu2+ ions ruled by both their different location in zeolite framework and the alteration of the ligand in copper coordination sphere induced by water presence. Nitrates (located at 1300 and 1550 cm-1) appeared also to a limited extent on the surface of Cu-ERI_NaOH/2 than of Cu-ERI. The presence of water vapor in the reaction mixture (Figure S11a,b) influences the SCR reaction what is detected as a decrease in the nitrate concentration (the lack of the bands at 1540 and 1395 cm-1) in favour of water formation (1625 cm-1). We also observed the NH4+ species (1425 cm-1), but their amount not being affected during the whole reaction course, points to them serving as spectator species under these reaction conditions, still, however serving as a reservoir of adsorbed NH3 at higher temperature SCR stage [45].
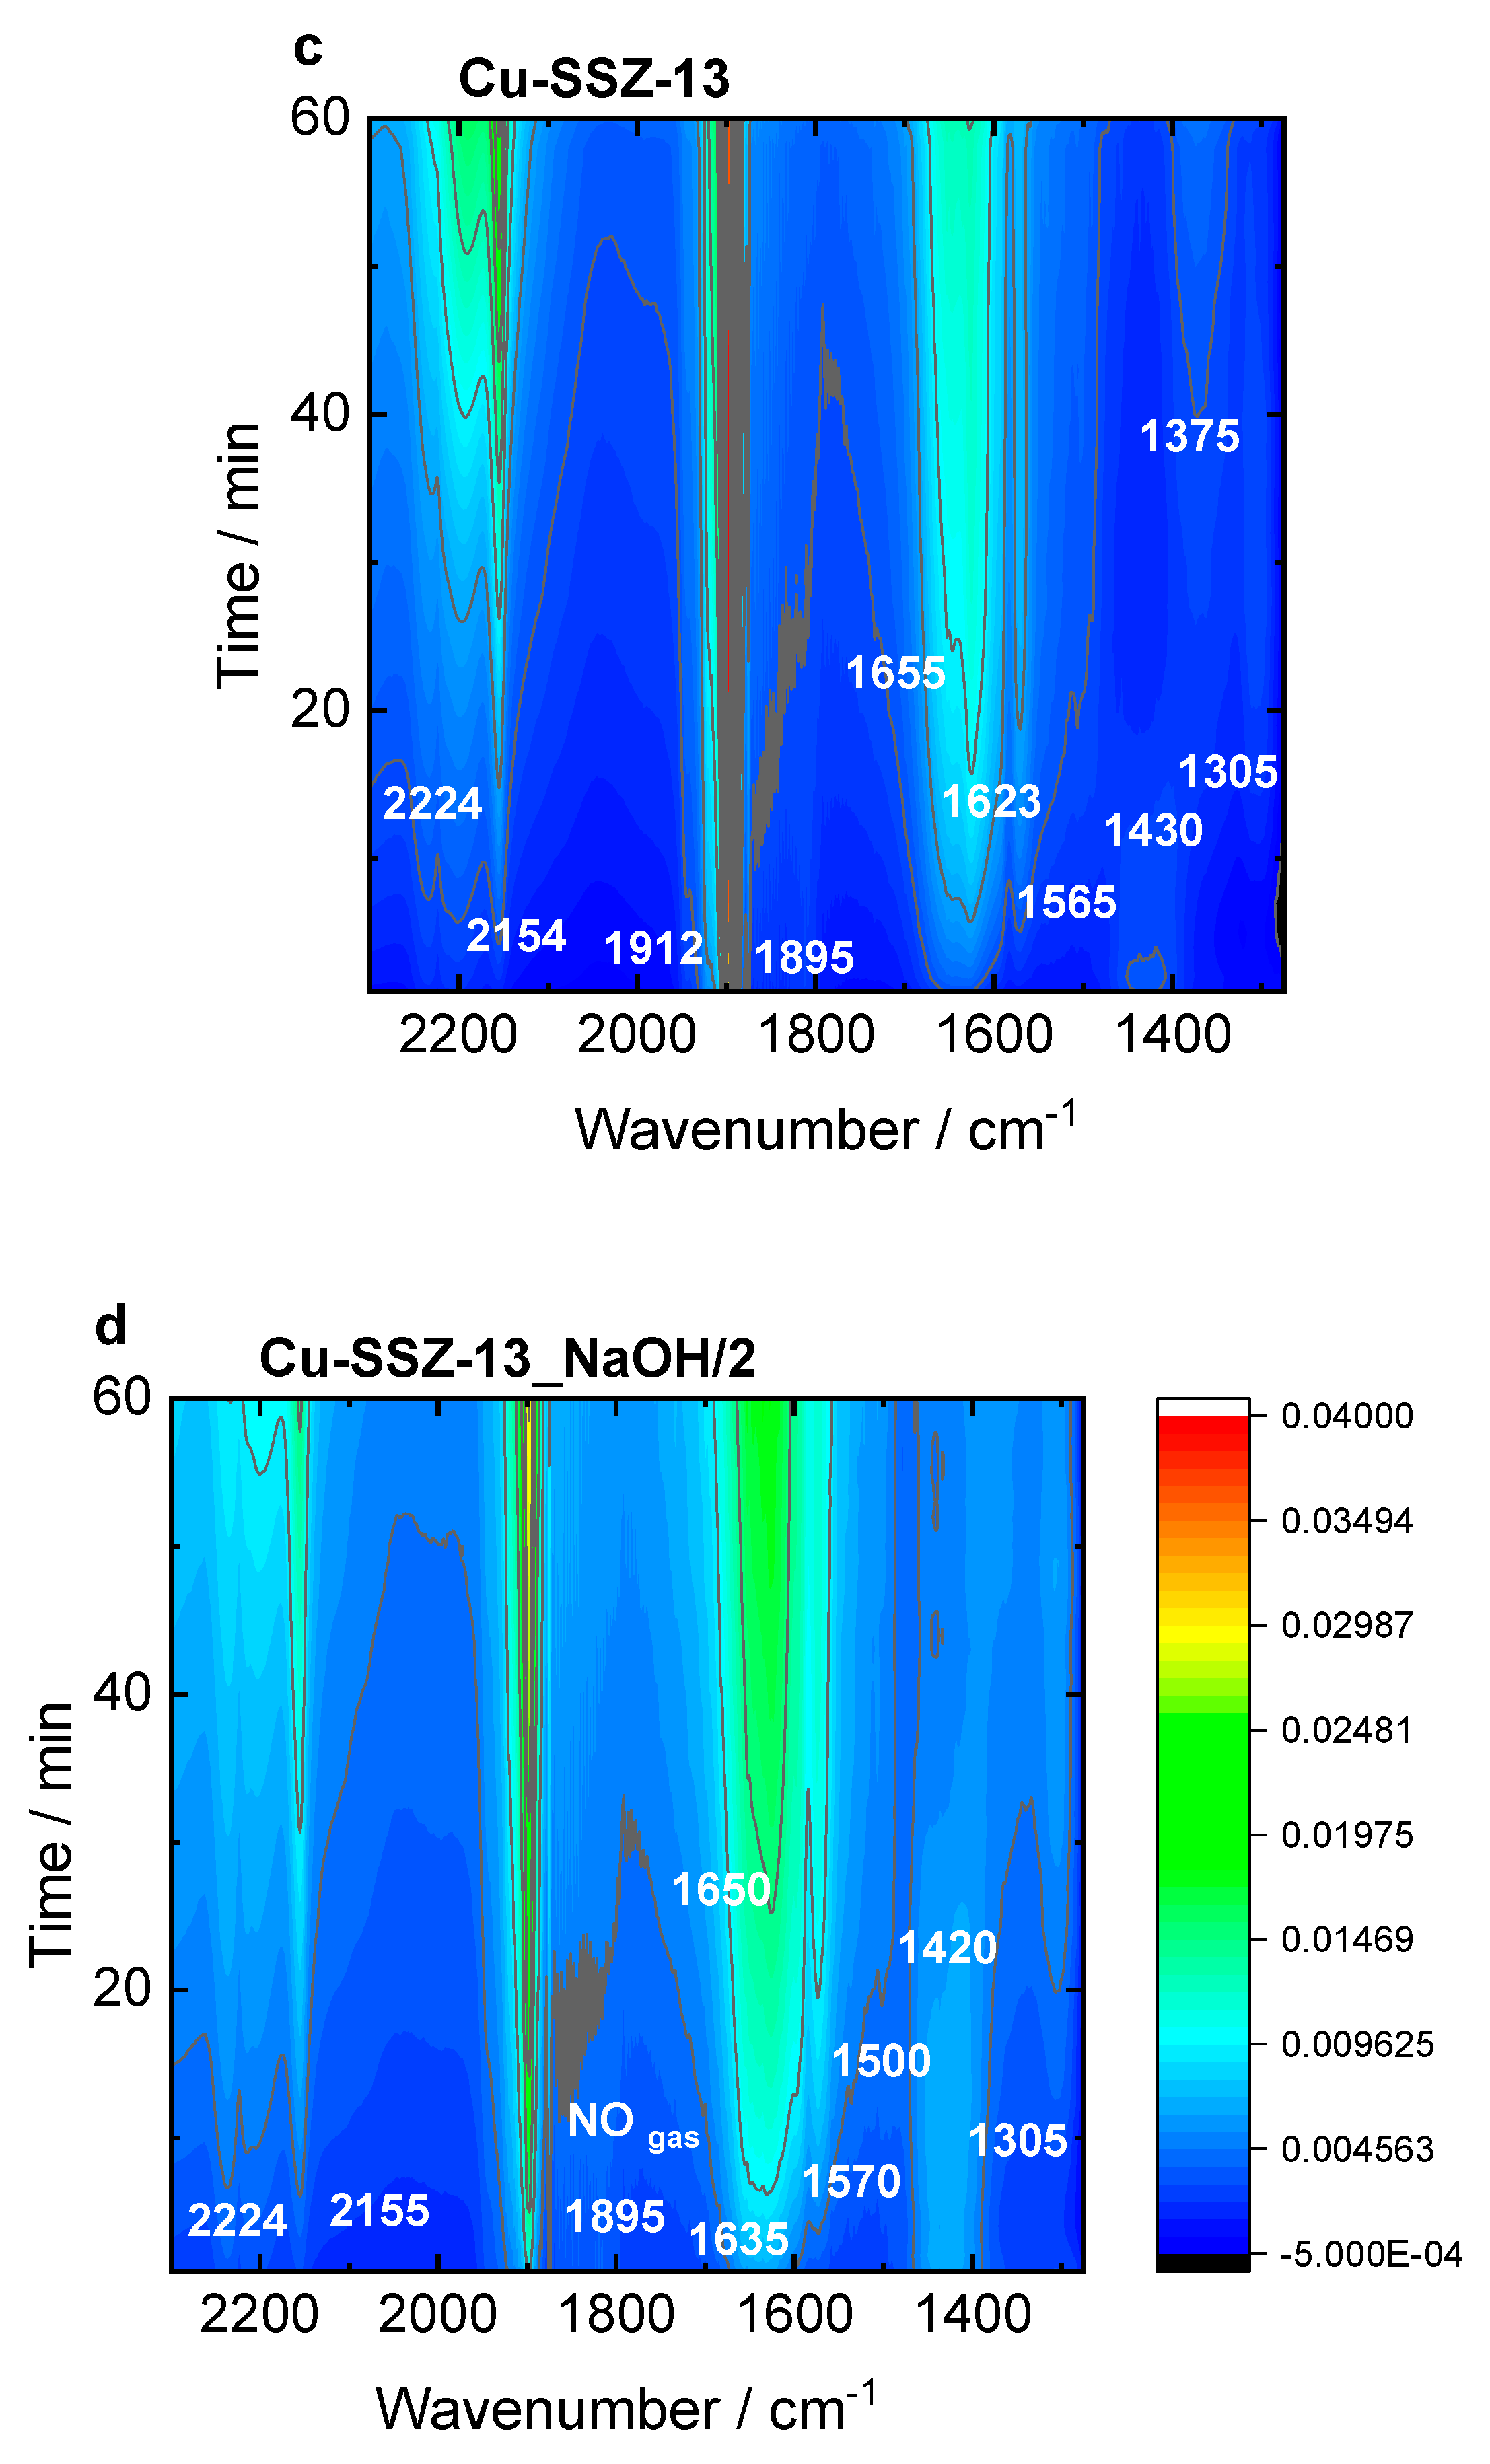
The Cu-SSZ-13 catalyst (Figure 9b) is dominated by the Cu2+(NO) mononitrosyls (1895 and 1912 cm-1), N2O (2224 cm-1), and amine Cu2+ adducts (1623 cm-1). The latter are converted in water (1655 cm-1) and NO3-/NO2- species (1375 and 1565 cm-1), which is accompanied by the formation of NO+ ions (2130 cm-1). This weak intensity of nitrates, compared to Cu-ERI, could be indicative of a higher activity of the CHA-based catalysts. Still, the presence of water vapor in the feed results mainly in a decrease in the nitrate and Cu2+(NO) mononitrosyls (Figure S11c). Regarding the Cu-SSZ-13_NaOH/2 sample (Figure 9d), the water (1650 cm-1), Cu2+(NO) mononitrosyl (1895 cm-1), and nitrates (1500 and 1570 cm-1) starts to be the dominant species. The appearance of NH4+ species is also detected (1410 cm-1). They are formed at the first reaction period and then disappear with the depletion of the Cu2+-NH3 (1635 cm-1) and nitrates (1570 and 1500 cm-1), indicating their intermediating role in the SCR process. The introduction of water in the gas mixture (Figure S11d) results in changes in the position of the mononitrosyl band (1900 cm-1), as previously detected for the Cu-containing ERI samples. A high number of NO3-/NO2- species (1575, 1520, 1350, 1310 cm-1) is also confirmed. The results suggest the importance of the interplay between the copper sitting at different locations and various hydrothermal stability; thus, NH3-SCR-DeNOxactivity is forced by the zeolite framework type.
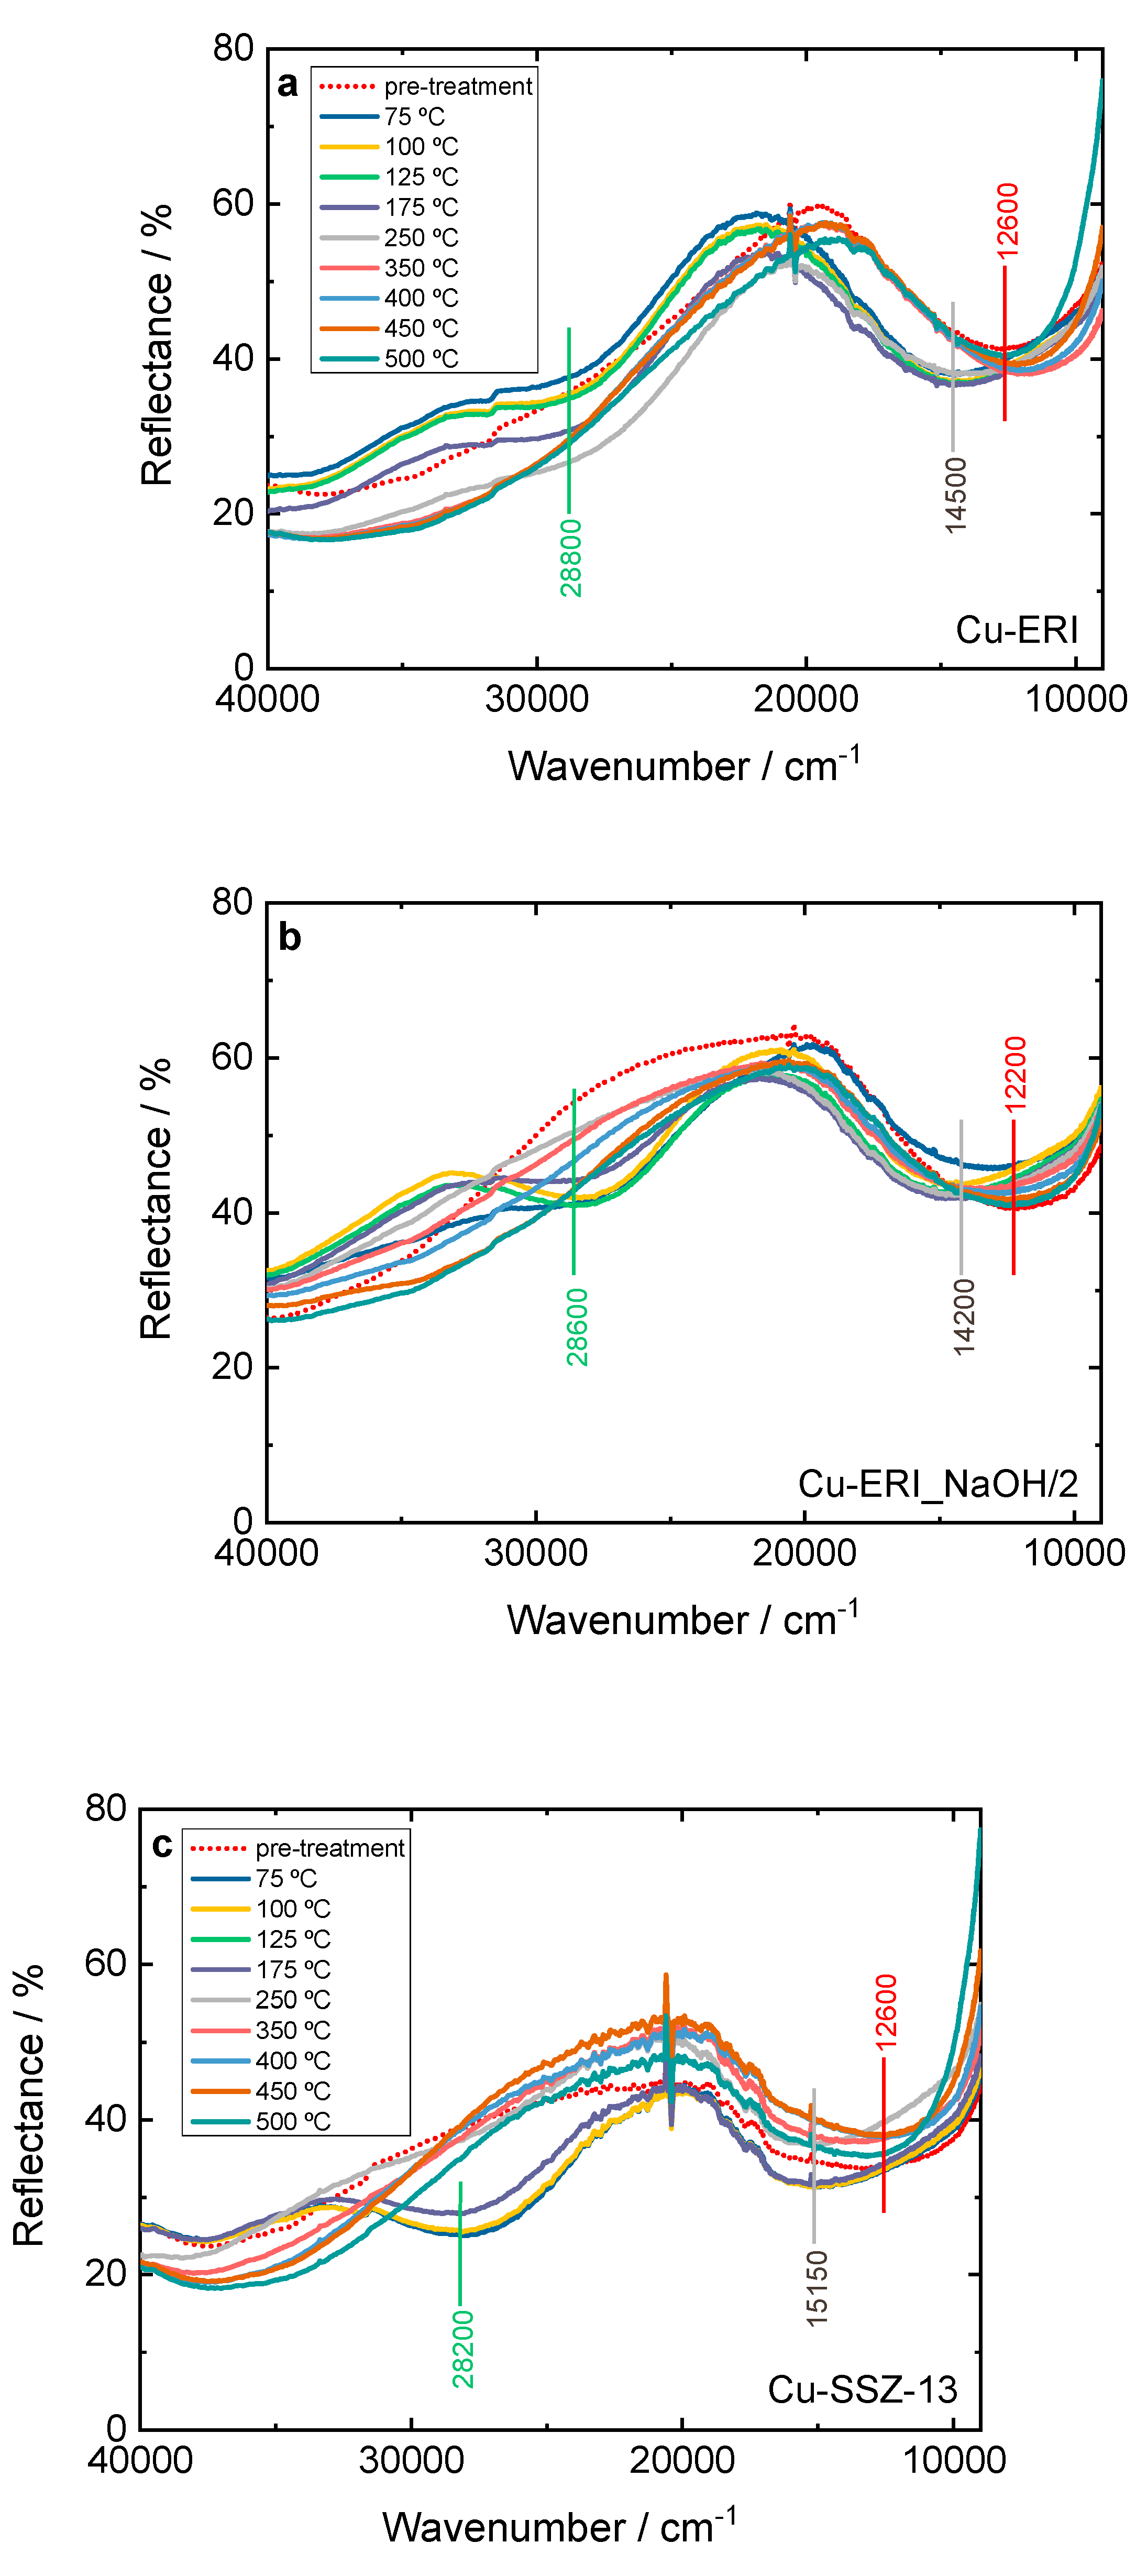
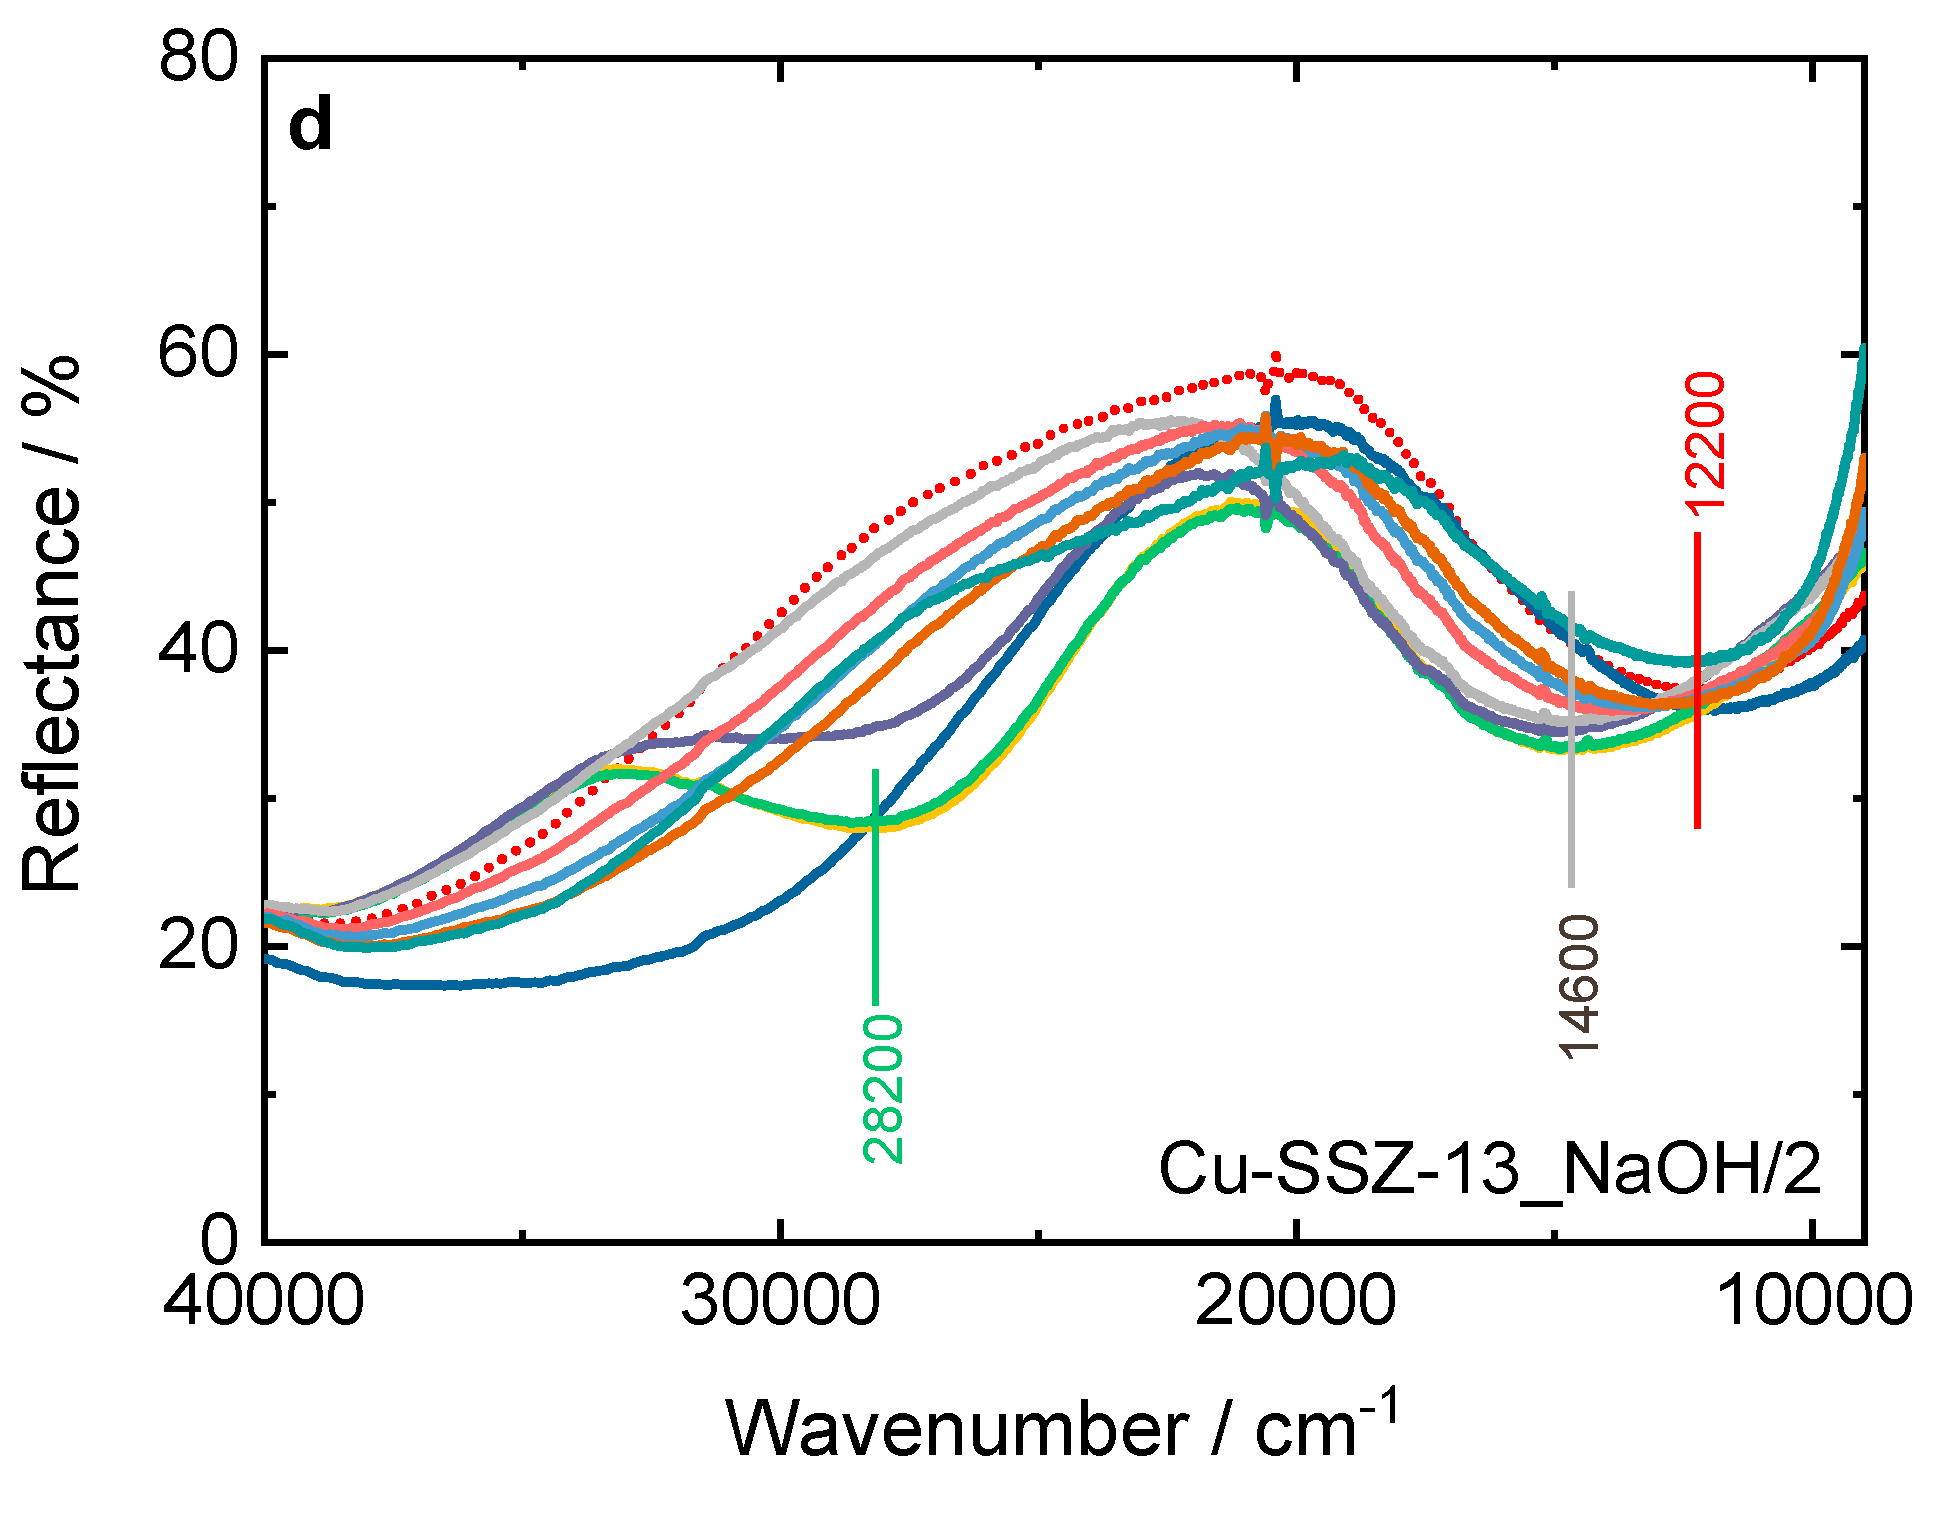
Furthermore, the NH3-SCR-DeNOx over the Cu-containing ERI and SSZ-13 samples was investigated via In situ DR UV-Vis (Figure 10 and Figure S12). The bands previously mentioned related to the oxygen-to-metal charge transfer and d-d transition of Cu2+ are visible. However, after the catalysts come into contact with the reaction gases, the d-d transition band experiences a shift to higher wavenumber values from 12200-12600 cm-1 to 14200-15300 cm-1. This reflects the interaction of NH3 with copper species. Thus, the d-d transition band no longer belongs to isolated Cu2+ but to the copper present in amine complexes (e.g., [CuII(NH3)4]+) [46]. In a further course of the reaction, a new band also appears at 28200-28800 cm-1, which is assigned to the [CuII2(NH3)4O2]2+ intermediates with a side on μ-η22-peroxo diammino dicopper(II) structure [46,47]. In the spectra of Cu-containing ERI (Figure 10a,b), the [CuII2(NH3)4O2]2+ can be clearly visible below 250 °C. For Cu-ERI_NaOH/2, already at 75 °C a slight band at 28600 cm-1 is present, but the band related to the d-d transition does not shift to higher wavenumbers. The intensity of the strong band at 28600 cm-1 increases between 100-125 °C, while at the same time, the d-d transition band shifts to higher wavenumbers (i.e., indicating the presence of diamino dicopper species over this sample). Above 125 °C, the band at 28600 cm-1 decreases in intensity until its disappearance at 250 °C. At progressively higher temperatures, the d-d transition signal returns to the wavenumber values previous to starting the reaction. The difference between 20000 and 30000 cm-1 in the activation spectra of Cu-ERI and Cu-ERI_NaOH/2 (arising due to the different nature of copper species in these samples), explains why the band at ca. 28600 cm-1 is more pronounced in Cu-ERI_NaOH/2 than in the other sample.
For Cu-SSZ-13 (Figure 10c), as the reaction mixture comes into contact with the sample already at 75 °C, a strong band appears at 28200 cm-1, and the d-d transition band shifts. At 250 °C, this band disappears, and the d-d transition band returns to its original position. On the contrary, for Cu-SSZ-13-NaOH/2, the bands related to the diamino dicopper complex become visible above 75 °C. Indeed, below 250 °C, Cu-SSZ-13 is more active than Cu-SSZ-13_NaOH/2 for NH3-SCR-DeNOx (Figure 8). The formation of the [CuI(NH3)2]+ intermediate can be hampered from Cu2+ pairs coordinated with two Al sites [47], which are the main species present in the Cu-SSZ-13_NaOH/2 sample. Above 250 °C, the solvation shell of ammonia around copper cations is not stable [48], indicating that a different reaction mechanism is dominant at high temperatures [25,49,50].
Furthermore, we investigated the influence of 5 vol.-% H2O on forming the reaction intermediates. However, both Cu-containing ERI samples exhibit a similar behavior in the absence of water (Figure 12a,b). This aligns with the results of catalytic studies (Figure S9b), which do not show any significant differences in NO conversion among these samples. Regarding the Cu-containing SSZ-13 samples under wet conditions (Figure S12c,d), the band at 28800 cm-1 recedes slowly below 250 °C, which could indicate that the reduction of the complex is slower than in the absence of water. At high temperatures (> 350 °C), the vertical asymptote present at low wavenumber range is caused by spurious black-body radiation emitted by the heating device.
The Cu-ERI_NaOH/2 and Cu-SSZ-13_NaOH/2 samples were also investigated for NH3 oxidation. The spectra recorded for both samples (Figure S13) are characteristic of the conventional activation of Cu-containing zeolites under an O2 atmosphere [46]. No appearance of the band related to the diammino dicopper intermediates was found. In contrast, the structure of the d-d transition band is less resolved which is unrelated to the reaction. Indeed, NO molecules are necessary to activate the copper ammine complexes that precede the diammino dicopper complex (e.g., [51]).

5. Conclusions

The post-synthetic modifications applied to the ERI and SSZ-13 zeolites have influenced both the physico-chemical properties and the activity of the corresponding catalysts. The modification of ERI zeolite (with an aqueous solution of 0.2 M NaOH for 2 h) led to enhanced activity up to 500 °C of Cu-ERI_NaOH/2 compared to Cu-ERI. Otherwise, the micro-/mesoporous Cu-SSZ-13_NaOH/2 exhibits a lower catalytic activity than the conventional Cu-SSZ-13. Characterization methods such as H2-TPR have given insight into how the zeolite modifications affected the copper species present in the samples. In the case of the Cu-containing ERI catalysts, the basic leaching prevented the formation of aggregated copper species, which are active for the NH3-SCO. For Cu-containing SSZ-13, the amount of Cu2+ coordinated with one Al site, [Cu(OH)]+ is reduced for post-modified zeolite-based sample, thus reducing the material's catalytic activity. In situ FT-IR provides evidence for the formation of copper nitrates, while In situ DR UV-Vis revealed the formation of μ-η22-peroxo dicopper(II) intermediates. The enhanced activity of Cu-SSZ-13 is correlated with the more significant reduction of Cu nitrates and its superior ability to generate Cu dimer species in the reaction. The reduction of Cu dimer species is hampered in the presence of H2O in the feed, resulting in the lower low-temperature activity of Cu-containing SSZ-13 samples.

Supplementary Materials

The following supporting information can be downloaded at the website of this paper posted on Preprints.org.

Author Contributions

Alejandro Mollá Robles: Investigation, Data curation, Software, Writing - original draft, Writing - review & editing. Gabriel Deplano: Investigation, Data curation. Kinga Góra-Marek: Investigation, Data curation, Writing - review & editing. Marek Rotko: Investigation, Data curation. Anna Wach: Investigation, Data curation, Writing - review & editing. Muhammad Fernadi Lukman: Investigation, Data curation, Writing - review & editing. Marko Bertmer: Investigation, Data curation. Matteo Signorile: Investigation, Data curation. Silvia Bordiga: Review. Andreas Pöppl: Review. Roger Gläser: Review. Magdalena Jabłońska: Conceptualization, Methodology, Investigation, Data curation, Data management, Writing - original draft, Writing - review & editing, Supervision, Visualization, Project management.

Acknowledgments

M.J. acknowledges a DFG Research Grant JA 2998/2-1. M.F.L. acknowledges a DFG Research Grant of GRK:2721. K.G.M. acknowledges the Grant No. 2021/41/B/ST4/00048 from the National Science Centre, Poland. G.D., M.S. and S.B. acknowledge support from the Project CH4.0 under the MUR program "Dipartimenti di Eccellenza 2023-2027" (CUP: D13C22003520001).

References

  1. Wang, J.; Zhao, H.; Haller, G.; Li, Y. Appl. Catal. B Environ., 2017, 202, 346–354. [CrossRef]
  2. Salazar, M.; Hoffmann, S.; Tillmann, L.; Singer, V.; Becker, R.; Grünert, W. Appl. Catal. B Environ., 2017, 218, 793–802. [CrossRef]
  3. Shi, Z.; Peng, Q.; Jiaqiang, E.; Xie, B.; Wei, J.; Yin, R.; Fu, G. Fuel. 2023; 331, 125885. [Google Scholar]
  4. Zhu, J.; Liu, Z.; Xu, L.; Ohnishi, T.; Yanaba, Y.; Ogura, M.; Wakihara, T.; Okubo, T. J. J. Catal., 2020, 391, 346–356. [CrossRef]
  5. Sultana, A.; Nanba, T.; Sasaki, M.; Haneda, M.; Suzuki, K.; Hamada, H. Catal. Today, 2011, 164, 495–499. [CrossRef]
  6. Liu, J.; Yu, F.; Liu, J.; Cui, L.; Zhao, Z.; Wei, Y.; Sun, Q. J. J. Environ. Sci., 2016, 48, 45–58. [CrossRef] [PubMed]
  7. Rutkowska, M.; Pacia, I.; Basąg, S.; Kowalczyk, A.; Piwowarska, Z.; Duda, M.; Tarach, K.A.; Góra-Marek, K.; Michalik, M.; Díaz, U.; Chmielarz, L. Microporous Mesoporous Mater, 2017, 246, 193–206. [CrossRef]
  8. Góra-Marek, K.; Brylewska, K.; Tarach, K.A.; Rutkowska, M.; Jabłońska, M.; Choi, M.; Chmielarz, L. Appl. Catal. B Environ., 2015, 179, 589–598. [CrossRef]
  9. Oord, R.; Have, I.C.T.; Arends, J.M.; Hendriks, F.C.; Schmidt, J.; Lezcano-Gonzalez, I.; Weckhuysen, B.M. Catal. Sci. & Technol., 2017, 7, 3851–3862.
  10. Wu, G.; Liu, S.; Chen, Z.; Yu, Q.; Chu, Y.; Xiao, H.; Peng, H.; Fang, D.; Deng, S.; Chen, Y. J. J. Taiwan Inst. Chem. Eng., 2022, 134, 104355. [CrossRef]
  11. Jabłońska, M.; Góra-Marek, K.; Grilc, M.; Bruzzese, P.C.; Poppitz, D.; Pyra, K.; Liebau, M.; Pöppl, A.; Likozar, B.; Gläser, R. Catalysts. 2021; 11, 842. [Google Scholar]
  12. Suharbiansah, R.S.R.; Pyra, K.; Liebau, M.; Poppitz, D.; Góra-Marek, K.; Gläser, R.; Jabłońska, M. Microporous Mesoporous Mater, 2022, 334, 111793.
  13. Tekla, J.; Lakiss, L.; Valchev, V.; Tarach, K.A.; Jabłońska, M.; Girman, V.; Szymocha, A.; Kowalczyk, A.; Góra-Marek, K.; Gilson, J.-P. Microporous Mesoporous Mater, 2020, 299, 110088.
  14. Akgul, F.A.; Akgul, G.; Yildirim, N.; Unalan, H.E.; Turan, R. Mater. Chem. Phys., 2014, 147, 987–995. [CrossRef]
  15. Thommes, M.; Kaneko, K.; Neimark, A.V.; Olivier, J.P.; Rodriguez-Reinoso, F.; Rouquerol, J.; Sing, K.S.W. Pure Appl. Chem. 2015, 87, 1051–1069. [CrossRef]
  16. Sommer, L.; Mores, D.; Svelle, S.; Stöcker, M.; Weckhuysen, B.M.; Olsbye, U. Microporous Mesoporous Mater, 2010, 132, 384–394. [CrossRef]
  17. Lillerud, K.P. Zeolites, 1987,; 7, 14–17.
  18. Occelli, M.L.; Ritz, G.P.; Iyer, P.S.; Walker, R.D.; Gerstein, B.C. Zeolites, 1989; 9, 104–110.
  19. Lusardi, M.; Chen, T.T.; Kale, M.; Kang, J.H.; Neurock, M.; Davis, M.E. ACS Catal, 2019, 10, 842–851.
  20. Bing, L.; Liu, J.; Yi, K.; Li, F.; Han, D.; Wang, F.; Wang, G. RSC Adv, 2020, 10, 3566–3571.
  21. R. Villamaina, S. Liu, I. Nova, E. Tronconi, M. P. Ruggeri, J. Collier, A. York and D. Thompsett. ACS Catal., 2019, 9, 8916–8927.
  22. Hu, W.; Selleri, T.; Gramigni, F.; Fenes, E.; Rout, K.R.; Liu, S.; Nova, I.; Chen, D.; Gao, X.; Tronconi, E. AngewChemie Int. Ed., 2021, 60, 7197–7204. [CrossRef]
  23. Wang, H.; Xu, R.; Jin, Y.; Zhang, R. , Catal. Today, 2019, 295–307.
  24. Jabłońska, M.; Góra-Marek, K.; Bruzzese, P.C.; Palčić, A.; Pyra, K.; Tarach, K.; Bertmer, M.; Poppitz, D.; Pöppl, A.; Gläser, R. ChemCatChem, 2022, e202200627.
  25. Jabłońska, M. RSC Adv, 2022, 12, 25240–25261.
  26. Suharbiansah, R.S.R.; Lukman, M.F.; Nannuzzi, C.; Wach, A.; Góra-Marek, K.; Liebau, M.; Palčić, A.; Pöppl, A.; Berlier, G.; Bordiga, S. and others. Catal. Sci. & Technol.
  27. M. Jabłońska; Góra-Marek, K.; Lukman, M.F.; Tarach, K.; Bertmer, M.; Denecke, R.; Poppitz, D.; Marcinowski, K.; Pöppl, A.; Gläser, R. Catal. Sci. & Technol., 2022, 12, 6660–6675.
  28. Xia, Y.; He, Z.; Su, J.; Hu, K. J. JMater. Sci. Mater. Electron., 2019, 30, 9843–9854. [CrossRef]
  29. Godiksen, A.; Vennestrøm, P.N.R.; Rasmussen, S.B.; Mossin, S. TopCatal., 2017, 60, 13–29.
  30. Stoll, S.; Schweiger, A. J. JMagn. Reson., 2006, 178, 42–55. [CrossRef] [PubMed]
  31. Zamadics, M.; Kevan, L. J. JPhys. Chem., 1992, 96, 8989–8993. [CrossRef]
  32. Fernández, E.; Moreno-González, M.; Moliner, M.; Blasco, T.; Boronat, M.; Corma, A. TopCatal., 2018, 61, 810–832.
  33. Larsen, S.C.; Aylor, A.; Bell, A.T.; Reimer, J.A. J. JPhys. Chem., 1994, 98, 11533–11540. [CrossRef]
  34. Alayon, E.M.C.; Nachtegaal, M.; Bodi, A.; van Bokhoven, J.A. ACS Catal, 2014, 4, 16–22.
  35. Martini, A.; Alladio, E.; Borfecchia, E. TopCatal., 2018, 61, 1396–1407.
  36. Wang, H.; Jia, J.; Liu, S.; Chen, H.; Wei, Y.; Wang, Z.; Zheng, L.; Wang, Z.; Zhang, R. EnvironSci. \& Technol., 2021, 55, 5422–5434.
  37. Borfecchia, E.; Lomachenko, K.A.; Giordanino, F.; Falsig, H.; Beato, P.; Soldatov, A.V.; Bordiga, S.; Lamberti, C. ChemSci., 2015, 6, 548–563.
  38. I. Persson;Lundberg, D.; Bajno, E.G.; Klementiev, K.; Just, J.; Clauss, K.G.V.S. Inorg. Chem., 2020, 59, 9538–9550.
  39. Chillemi, G.; Pace, E.; D’Abramo, M.; Benfatto, M. J. JPhys. Chem. A, 2016, 120, 3958–3965. [CrossRef] [PubMed]
  40. Kwak, J.H.; Tran, D.; Burton, S.D.; Szanyi, J.; Lee, J.H.; Peden, C.H.F. J. JCatal., 2012, 287, 203–209. [CrossRef]
  41. Zhang, T.; Qiu, F.; Li, J. ApplCatal. B Environ., 2016, 195, 48–58. [CrossRef]
  42. Olsson, L.; Sjövall, H.; Blint, R.J. ApplCatal. B Environ., 2008, 81, 203–217. [CrossRef]
  43. F. Gao; Washton, N.M.; Wang, Y.; Kollár, M.; Szanyi, J.; Peden, C.H.F. J. Catal., 2015, 331, 25–38.
  44. Signorile, M.; Borfecchia, E.; Bordiga, S.; Berlier, G. ChemSci., 2022, 13, 10238–10250.
  45. Fedyna, M.; Mozgawa, B.; Zasada, F.; Góra-Marek, K.; Gryboś, J.; Piskorz, W.; Yin, C.; Zhao, Z.; Pietrzyk, P.; Sojka, Z. ApplCatal. B Environ., 2023, 325, 122309. [CrossRef]
  46. Oda, A.; Shionoya, H.; Hotta, Y.; Takewaki, T.; Sawabe, K.; Satsuma, A. ACS Catal, 2020, 10, 12333–12339.
  47. Negri, C.; Selleri, T.; Borfecchia, E.; Martini, A.; Lomachenko, K.A.; Janssens, T.V.W.; Cutini, M.; Bordiga, S.; Berlier, G. J. Am. JAm. Chem. Soc., 2020, 142, 15884–15896. [CrossRef]
  48. Paolucci, C.; Khurana, I.; Parekh, A.A.; Li, S.; Shih, A.J.; Li, H.; Di Iorio, J.R.; Albarracin-Caballero, J.D.; Yezerets, A.; Miller, J.T. and others. Science (80-. )., 2017, 357, 898–903. [Google Scholar] [CrossRef] [PubMed]
  49. Gao, F.; Walter, E.D.; Kollar, M.; Wang, Y.; Szanyi, J.; Peden, C.H.F. J. J. Catal., 2014, 319, 1–14. [CrossRef]
  50. Jabłońska, M. MolCatal., 2022, 518, 112111.
  51. Tarach, K.A.; Jabłońska, M.; Pyra, K.; Liebau, M.; Reiprich, B.; Gläser, R.; Góra-Marek, K. ApplCatal. B Environ., 2021, 284, 119752. [CrossRef]
Figure 1. XRD patterns of a) ERI, b) SSZ-13 samples and their Cu-containing forms (sample labels as in Table 2).
Preprints 109639 g001
Figure 2. a,b) N2 sorption isotherms collected at -196 °C and c,d) BJH pore width distribution of ERI, SSZ-13 samples, and their Cu-containing forms; a,c) and b,d) sample labels are identical.
Preprints 109639 g002aPreprints 109639 g002b
Figure 3. a, b) 29Si and c,d) 27Al NMR spectra of Cu-containing ERI and Cu-containing SSZ-13 samples; * indicates spinning sidebands.
Preprints 109639 g003
Figure 4. a) H2-TPR profiles and b) DR UV-Vis spectra of Cu-containing ERI and SSZ-13 samples, a) and b) sample labels are identical.
Preprints 109639 g004
Figure 5. Experimental and simulated CW-EPR spectra of dehydrated a) Cu-containing ERI and b) SSZ-13 samples at X-band, including the spectral simulation that adds the contribution of their respective species, c) XANES spectra, and d) EXAFS Fourier transforms of the Cu-containing zeolite samples compared with copper references, c) and d) sample labels are identical.
Preprints 109639 g005aPreprints 109639 g005b
Figure 7. Results of the TPIE experiment obtained for a) Cu-ERI and b) Cu-SSZ-13.
Preprints 109639 g007
Figure 8. NO conversion of the Cu-containing ERI, SSZ-13, and ZSM-5 samples: a,c) without H2O in the feed, and b,d) in the presence of H2O in the feed. Reaction conditions: mK = 0.1 g, c(NO) = 0.05 vol.-%, c(NH3) = 0.0575 vol.-%, c(O2) = 4 vol.-%, (c(H2O) = 5 vol.-% when used), He balance, FTOT = 120 ml min-1, GHSV = 30,000 h-1.
Preprints 109639 g008aPreprints 109639 g008b
Figure 9. In situ FT-IR spectra of a,b) Cu-containing ERI and c,d) Cu-containing SSZ-13 samples, recorded during NH3-SCR-DeNOx at 125 °C. Reaction conditions: mK = 0.1 g, c(NO) = 0.1 vol.-%, c(NH3) = 0.1 vol.-%, c(O2)= 10 vol.-%, He balance, FTOT = 120 ml min-1.
Preprints 109639 g009aPreprints 109639 g009b
Figure 10. In situ DR UV-Vis DR spectrum of a,b) Cu-containing ERI and c,d) Cu-containing SSZ-13 samples during NH3-SCR-DeNOx at different temperatures. Reaction conditions: mK = 0.1 g, c(NO) = 0.1 vol.-%, c(NH3) = 0.1 vol.-%, c(O2) = 10 vol.-%, He balance, FTOT = 120 ml min-1; a,b) and c,d) sample labels are identical.
Preprints 109639 g010aPreprints 109639 g010b
Table 1. Sample labels and treatment conditions.
Sample Applied treatment
ERI_HNO3_NaOH/0.5_0.5 0.3 M HNO3 at 65 °C for 0.5 h followed by 0.2 M NaOH at 65 °C for 0.5 h
ERI_HNO3_NaOH/0.5_2 0.3 M HNO3 at 65 °C for 0.5 h followed by 0.2 M NaOH at 65 °C for 2 h
ERI_NaOH/2 0.2 M NaOH at 65 °C for 2 h
SSZ-13_NaOH/0.5 0.2 M NaOH at 65 °C for 0.5 h
SSZ-13_NaOH/2 0.2 M NaOH at 65 °C for 2 h
Table 2. The elemental analysis results of ERI, SSZ-13 samples and their Cu-containing forms (ωi: mass fractions).
Sample ωAl / wt.-% ωSi / wt.-% ωCu / wt.-% n(Si)/n(Al) n(Cu)/n(Al)
ERI 8.8 31.5 - 3.4 -
Cu-ERI 8.2 29.9 6.1 3.5 0.3
Cu-ERI_NaOH/2 7.9 23.7 3.7 2.9 0.2
Cu-ERI_HNO3_NaOH/0.5_0.5 7.7 25.5 3.4 3.2 0.2
Cu-ERI_HNO3_NaOH/0.5_2 7.6 21.5 3.1 2.7 0.2
SSZ-13 6.1 38.3 - 6.0 -
Cu-SSZ-13 5.8 36.2 4 6.0 0.3
Cu-SSZ-13_NaOH/0.5 6.6 24.6 3 3.6 0.2
Cu-SSZ-13_NaOH/2 6.7 24.2 3.3 3.5 0.2
Table 3. The results of the textural properties of ERI, SSZ-13, and their Cu-containing forms: specific surface area (As(BET)), micropore pore volume (V(MIC)), mesopore pore volume (V(MES)), total pore volume (VTOT) and average pore width (dWp).
Sample As(BET) / m2 g-1 V(MIC) / cm3 g-1 V(MES) / cm3 g-1 V(TOT) / cm3 g-1 dWp
/ nm
ERI 525 0.19 0.04 0.24 2.7
Cu-ERI 396 0.14 0.04 0.18 2.6
Cu-ERI_HNO3_NaOH/0.5_0.5 466 0.17 0.10 0.27 3.9
Cu-ERI_HNO3_NaOH/0.5_2 479 0.17 0.09 0.28 4.0
Cu-ERI_NaOH/2 467 0.18 0.05 0.23 2.7
SSZ-13 716 0.26 0.06 0.32 4.0
Cu-SSZ-13 672 0.25 0.03 0.28 3.2
Cu-SSZ-13_NaOH/0.5 526 0.14 0.23 0.37 4.9
Cu-SSZ-13_NaOH/2 560 0.13 0.26 0.39 4.8
Disclaimer/Publisher’s Note: The statements, opinions and data contained in all publications are solely those of the individual author(s) and contributor(s) and not of MDPI and/or the editor(s). MDPI and/or the editor(s) disclaim responsibility for any injury to people or property resulting from any ideas, methods, instructions or products referred to in the content.
Copyright: This open access article is published under a Creative Commons CC BY 4.0 license, which permit the free download, distribution, and reuse, provided that the author and preprint are cited in any reuse.
Prerpints.org logo

Preprints.org is a free preprint server supported by MDPI in Basel, Switzerland.

Subscribe

© 2024 MDPI (Basel, Switzerland) unless otherwise stated