1. Introduction
Ultra-High Performance Concrete (UHPC) is a unique type of concrete that has been studied worldwide for the last two decades. It stands out due to its particular characteristics, such as a compressive strength of over 120MPa, the absence of coarse aggregate, a high amount of fine materials, and plasticizing additives that improve the rheology of the cement matrix. UHPC with fiber additions, also known as Ultra-High Performance Fiber Reinforced Concrete (UHPFRC), has notable characteristics such as increased tensile strength and post-cracking ductile behavior.
The global recognition of UHPC is evident from the fact that several international standards have already been published and enforced for its production and structural use. These standards not only deal with the material's properties but also provide design procedures.
Table 1 provides an overview of some of these standards and the countries where they have been published, further highlighting UHPC's global reach.
2. Materials and Experimental Program
This study aims to characterize UHPC based on its compressive strength, modulus of elasticity, and tensile strength.
Figure 1 depicts the research steps.
During the initial stages of the experiment, a survey of the existing literature was conducted, followed by mechanical tests to determine the compressive strength and modulus of elasticity of the materials under investigation. The Central Composite Rotational Design (CCRD) was then used to plan and conduct compression tests to determine the optimized composition for investigating UHPC tensile strength with steel and PVA fibers.
This optimized composition was then used to mold cylindrical and prismatic specimens for bending tensile strength tests while monitoring the materials' compressive strength and modulus of elasticity.
Table 2 summarizes the sizes and quantities of the specimens used and the tests carried out, including their respective ages.
2.1. Materials Characterization
The production of UHPC requires a more stringent selection of materials to achieve the desired physical and mechanical characteristics [
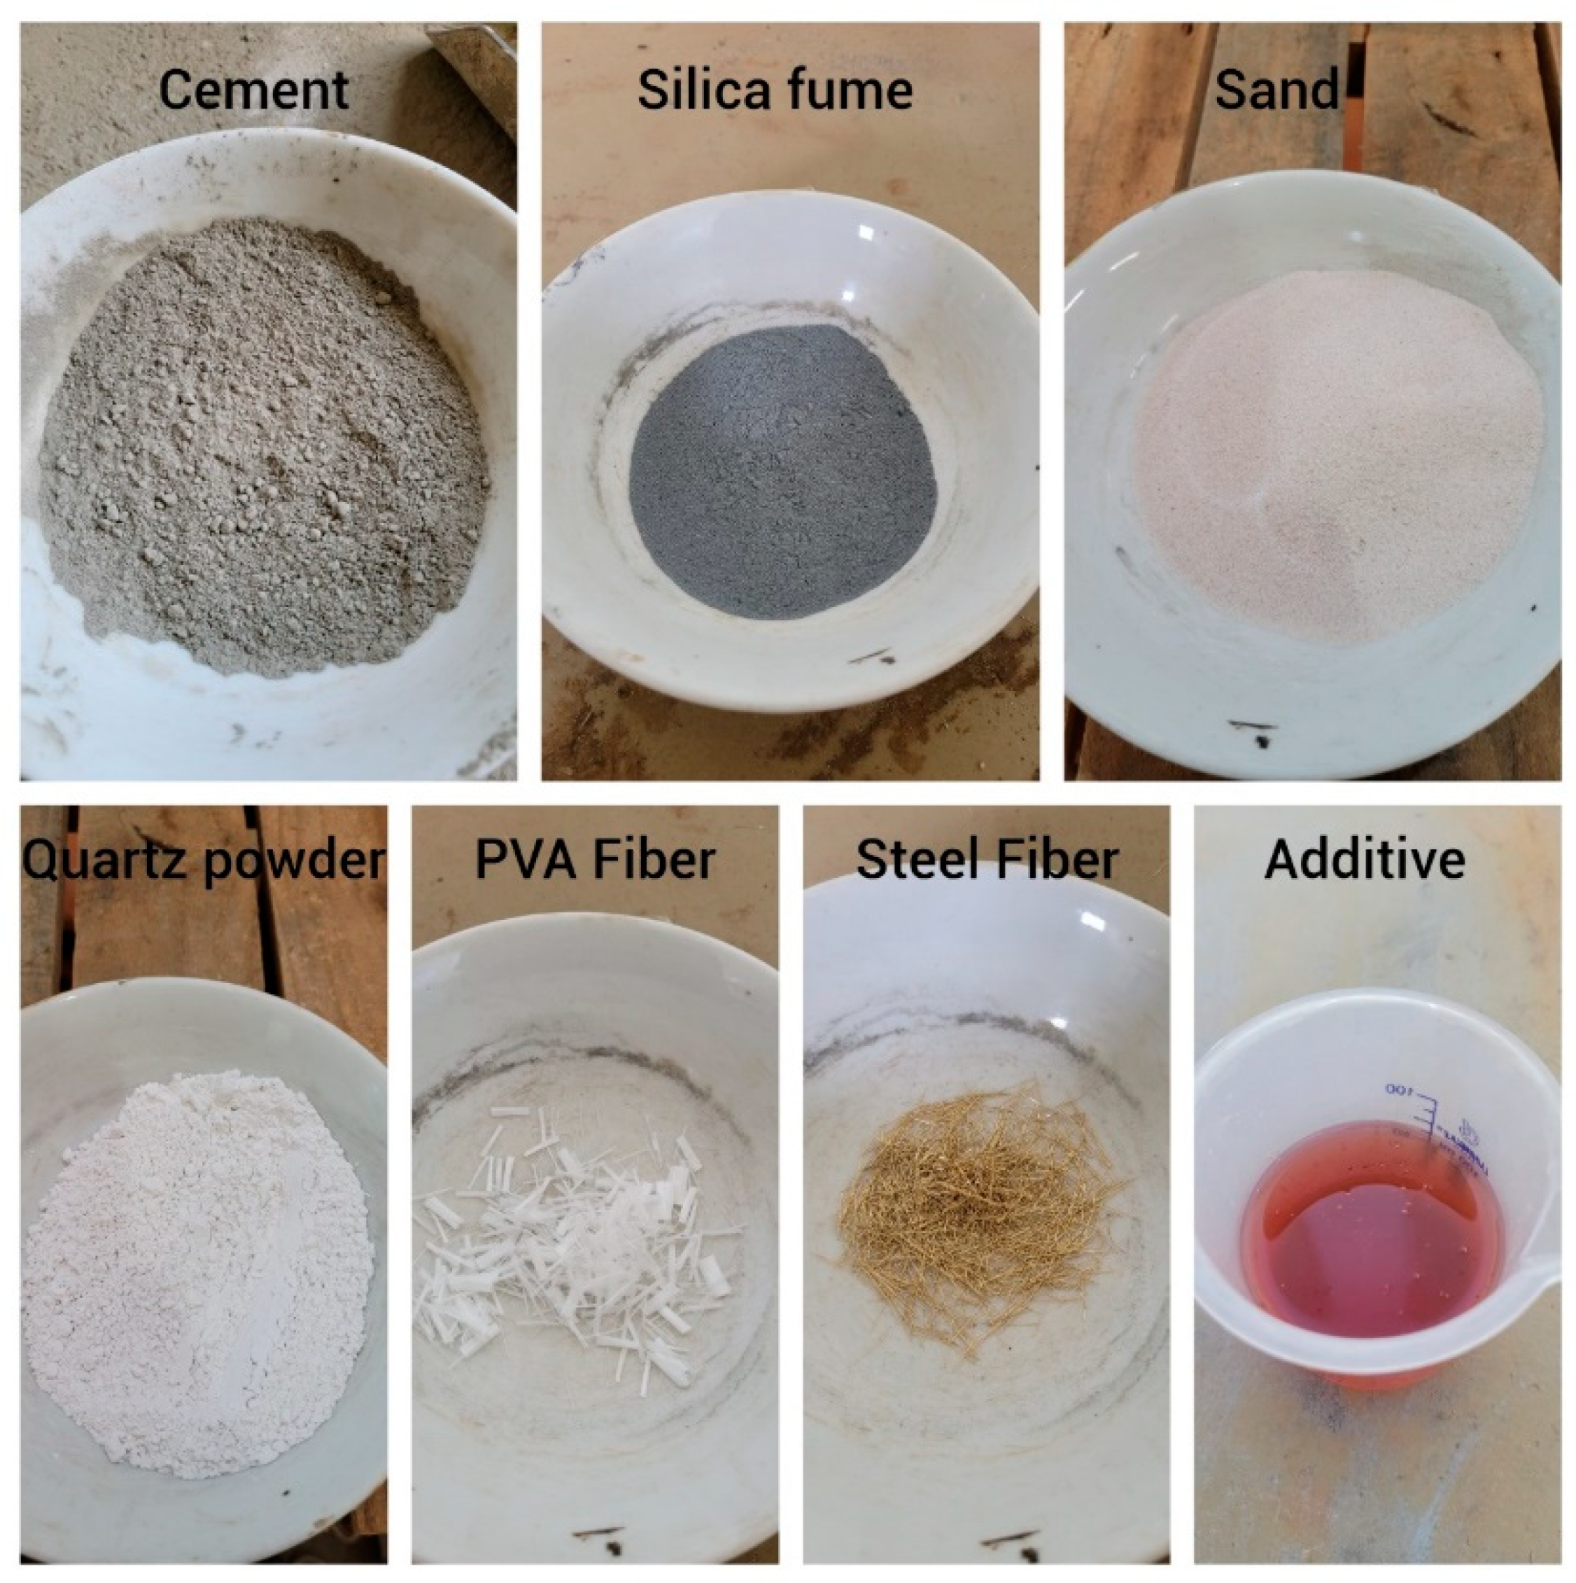
17]. This research used fine quartz sand (with a maximum diameter of 0.516mm) and quartz powder (with a maximum diameter of 0.052mm). Silica fume in powder format was used as a mineral addition. Polycarboxylate ether additives (superplasticizers) were used to keep the water-to-cement (w/c) ratio low. The cement used was CPV-ARI type.
The steel fibers used were 13mm long and 0.2mm in diameter, with a specific mass of 7.85g/m3, tensile strength of 2160MPa, and elastic modulus of 210GPa. Similarly, the PVA fibers used in this research were 12mm long and 0.04mm in diameter, with a specific mass of 1.30g/m3, tensile strength of 1600MPa, and elastic modulus of 41GPa. The materials of mixing proportion are presented in
Figure 2.
2.2. Mixing Proportion
The proportion used in this research was adapted from [
18], which used the material composition from Vigneshwari, Arunhachalam, and Angayarkanni (2018) [
19] as a base reference in proportion 1: 1.1: 0.1: 0.194: 0.19: 0.04: (cement: sand: quartz powder: silica: w/c: additive).
The material studied was an ultra-high strength concrete reinforced with a mix of steel fibers and PVA. The dosage was aimed at achieving a compressive strength greater than 120MPa. The choice of this value was based on the industry standards and the desired performance of the concrete in real-world applications. However, using PVA fiber can reduce the resistance of UHPC, as explained in [
17]. Thus, the amount of PVA fiber used in this research was considered small. The PVA fiber content varied from 0% to 0.38%, and the steel fiber content varied from 1% to 2%. This variation was defined using the CCRD with factorial 22 to analyze the influence of the variation in addition to fiber contents on the compressive strength and tensile strength in bending.
Equation 1 indicates the amount of sample required for an adequate analysis with developments of tools such as surface and results curve.
Where:
n = sample size;
k = amount of independent variables;
p = amount of central points
The analysis utilized three central points and two independent variables: the steel and PVA fiber percentage in the composition. The minimum sample size required for analyzing the response surface in the Statistica 10 software was n = 11.
In
Table 3, it is possible to verify the distribution of these coded variables.
2.3. Mixing and Molding Process
The first mix was created by following Sumitomo's study (2022) [
18], where he adapted the process used by Hiremath and Yaragal (2017) [
20]. This process was named Mixing Process 1. For the final mix, the process was modified and named Mixing Process 2.
In the production, the amount of water and additives were divided into four equal parts, which were then incorporated into the fine materials. These fine materials were divided into different parts. Mixing Process 1 involved the following steps with each mixing time:
1st) 50% cement + 100% silica fume + 50% water (5 minutes)
2nd) 25% cement + 50% sand +50% additive +25% water (5 minutes)
3rd) 25% cement (5 minutes)
4th) 50% sand + 100% quartz powder + 50% additive + 25% water (5 minutes)
5th) 100% fibers (5 minutes)
Manual compaction was carried out after mixing and molding the 7.5cm x 15cm specimens. This process involved three stages, each with ten compactions, to remove any air bubbles in the concrete. The process was completed with ten gentle taps on the bottom of the specimen, ensuring that the UHPC was free of bubbles.
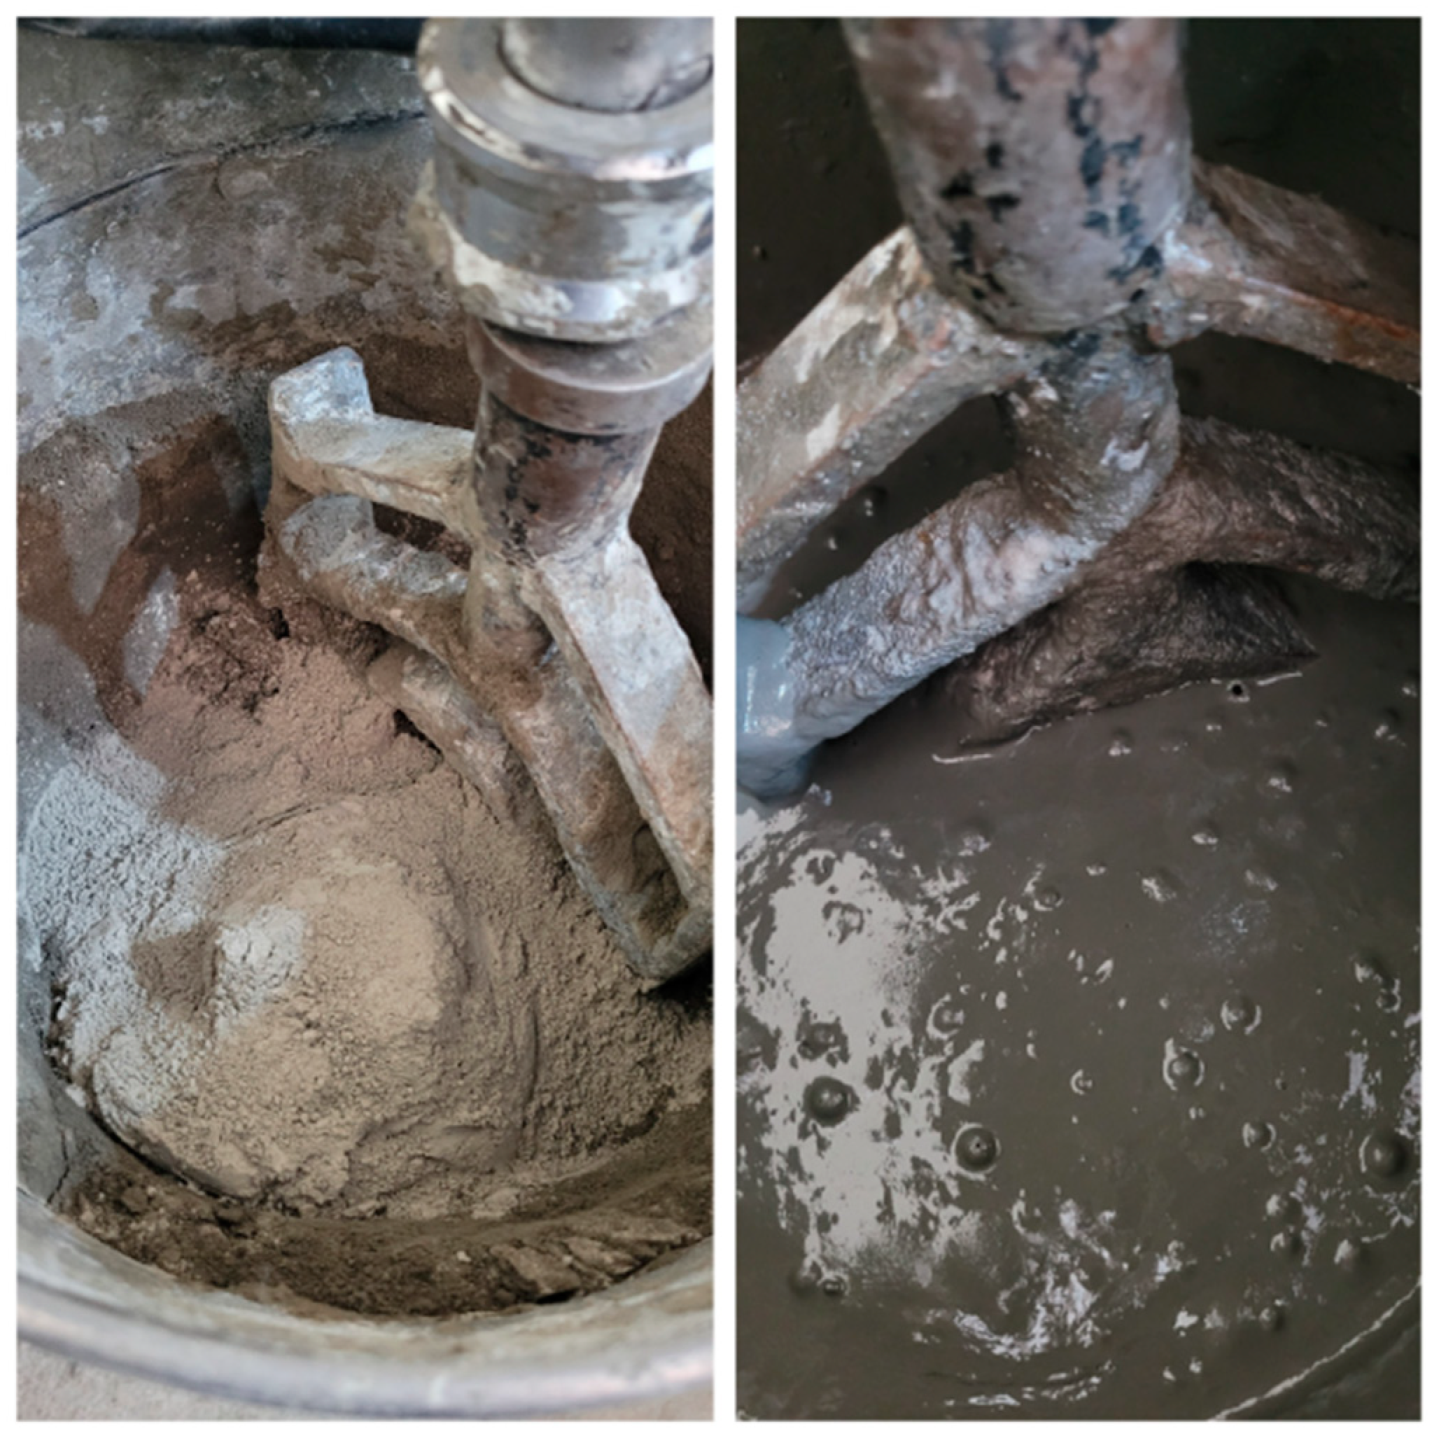
Figure 3 shows the steps involved in producing UHPC using the mixer.
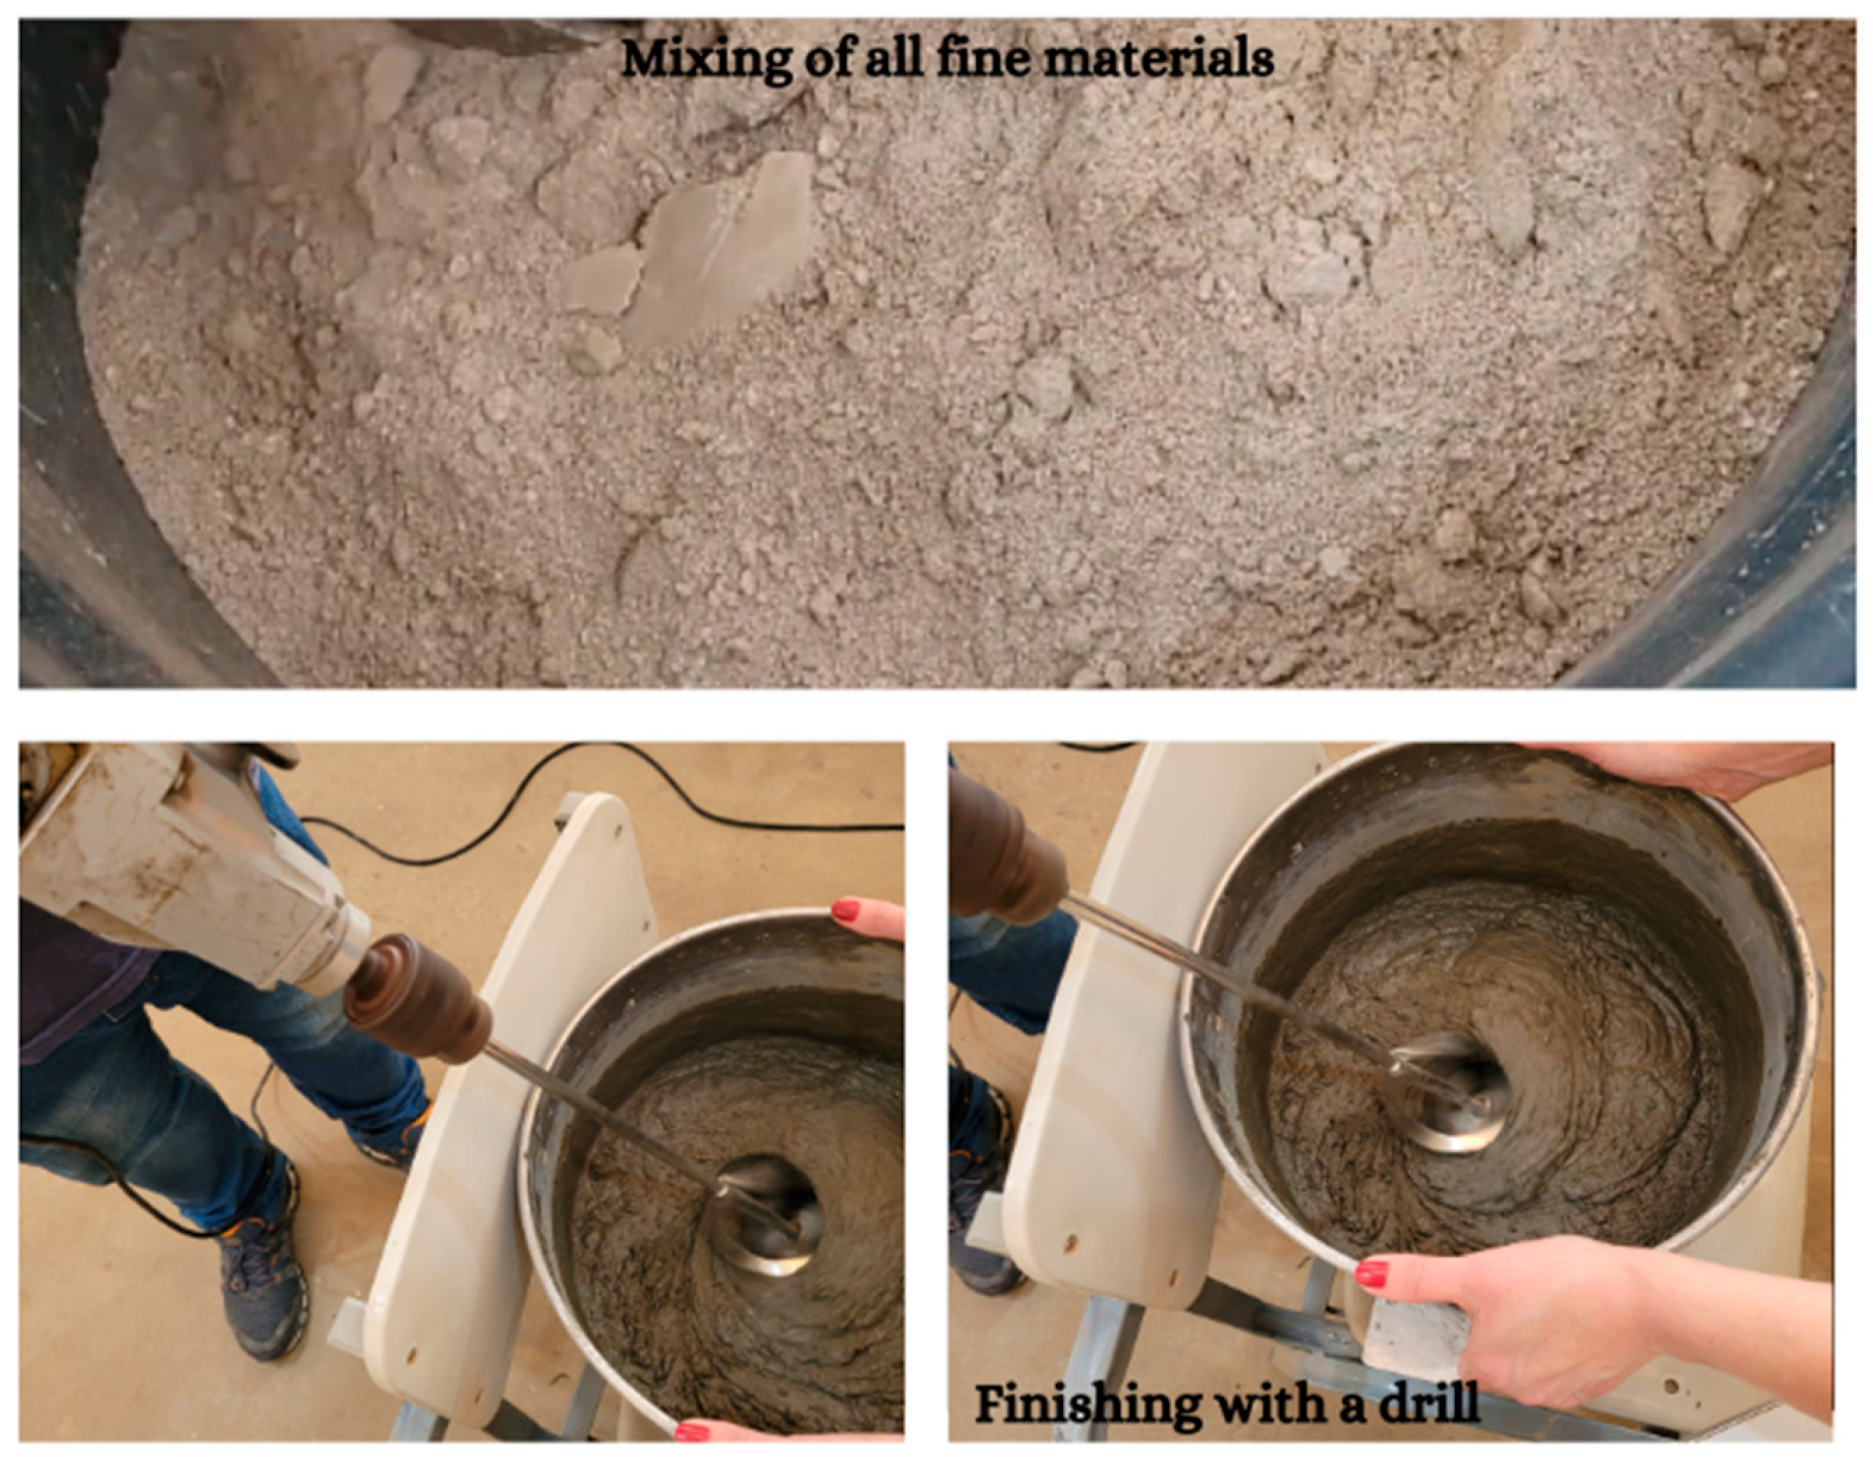
A new process adaptation was introduced, significantly improving the production of the last mixes and achieving a better rheology. This process was called Mixing Process 2. The fine materials were combined in a bucket using a beater attached to a drill. The mixture was then transferred to a three-stage mixer. Mixing Process 2 involved the following steps with each mixing time:
1/3 of fine materials (sand, cement, quartz powder, and silica fume) + 50% water + 50% additive (5 minutes);
1/3 of fine materials (sand, cement, quartz powder, and silica fume) + 25% water + 25% additive (5 minutes);
1/3 of fine materials (sand, cement, quartz powder, and silica fume) + 25% water + 25% additive (5 minutes);
100% fibers (3minutes);
use of a drill with a beater (2 minutes).
The entire process, from the initial mixing to the final molding of the cylindrical specimens, took approximately 50 minutes. Mixing Process 2 consisted of 20 minutes of mixing time in the mixer and the final stage with the drill, while Mixing Process 1 took a little over half an hour. It resulted in a longer UHPC flowable time while molding the specimens due to reduced mixing time. However, no change in concrete strength was observed due to the change in the mixing procedure.
Figure 4 depicts mixing fine materials in the bucket and finishing with the drill and mixer.
Due to the large volume of concrete, three castings were used to mold the prismatic specimens, following the second procedure described previously.
Six prismatic specimens with dimensions of 10x10x40cm were used for the 3- and 4-point bending tensile strength tests. Three specimens were used in the 4-point bending test, and the remaining three were used in the 3-point test. The tests were conducted with deformation control, following the Recommended Practice of Jacintho et al. (2022) [
16] and the French standard NF P18 470 (2016) [
8].
3. Results and Discussions
3.1. Compression Strength Tests Results
Table 4 presents the compressive strength results for the 11 mixes at 7 and 28 days, even as the elasticity modulus at 28 days, as the content fiber. On average, the resistance of UHPC at 7 days is 72% of that at 28 days.
3.2. Elasticity Modulus
As the compressive strength, the experimental results of the elasticity modulus at 28 days are presented in
Table 4.
Experimental results were compared to the estimated values provided by national and international standards for conventional and high-strength concrete. Additionally, the recommendations presented in Graybeal (2019) [
21] and Sritharan (2003) [
22] were compared, as these are specific to UHPC. The applied standards include NBR 6118:2023 [
23] (Class I and Class II), ACI 318 [
24], FIB Model Code [
25], and Eurocode 2 [
26]. The equations used to estimate the modules are presented in
Table 5.
To estimate the elasticity modulus values according to scientific articles and standards, the characteristic compressive strengths (f_ck as per NBR 6118:2023[
23] and f_c' as per ACI 318[
24]) were initially calculated, as shown in
Table 6.
The resulting theoretical values are presented in
Table 7.
3.2. CCRD Analysis
The experimental data were entered into the Statistica 10 software for a more in-depth analysis of which factors influenced the compressive strength and elastic modulus. The response evaluated the use of two types of fibers and whether the results had an acceptable dispersion. Constructing the response surfaces of the CCRD was possible.
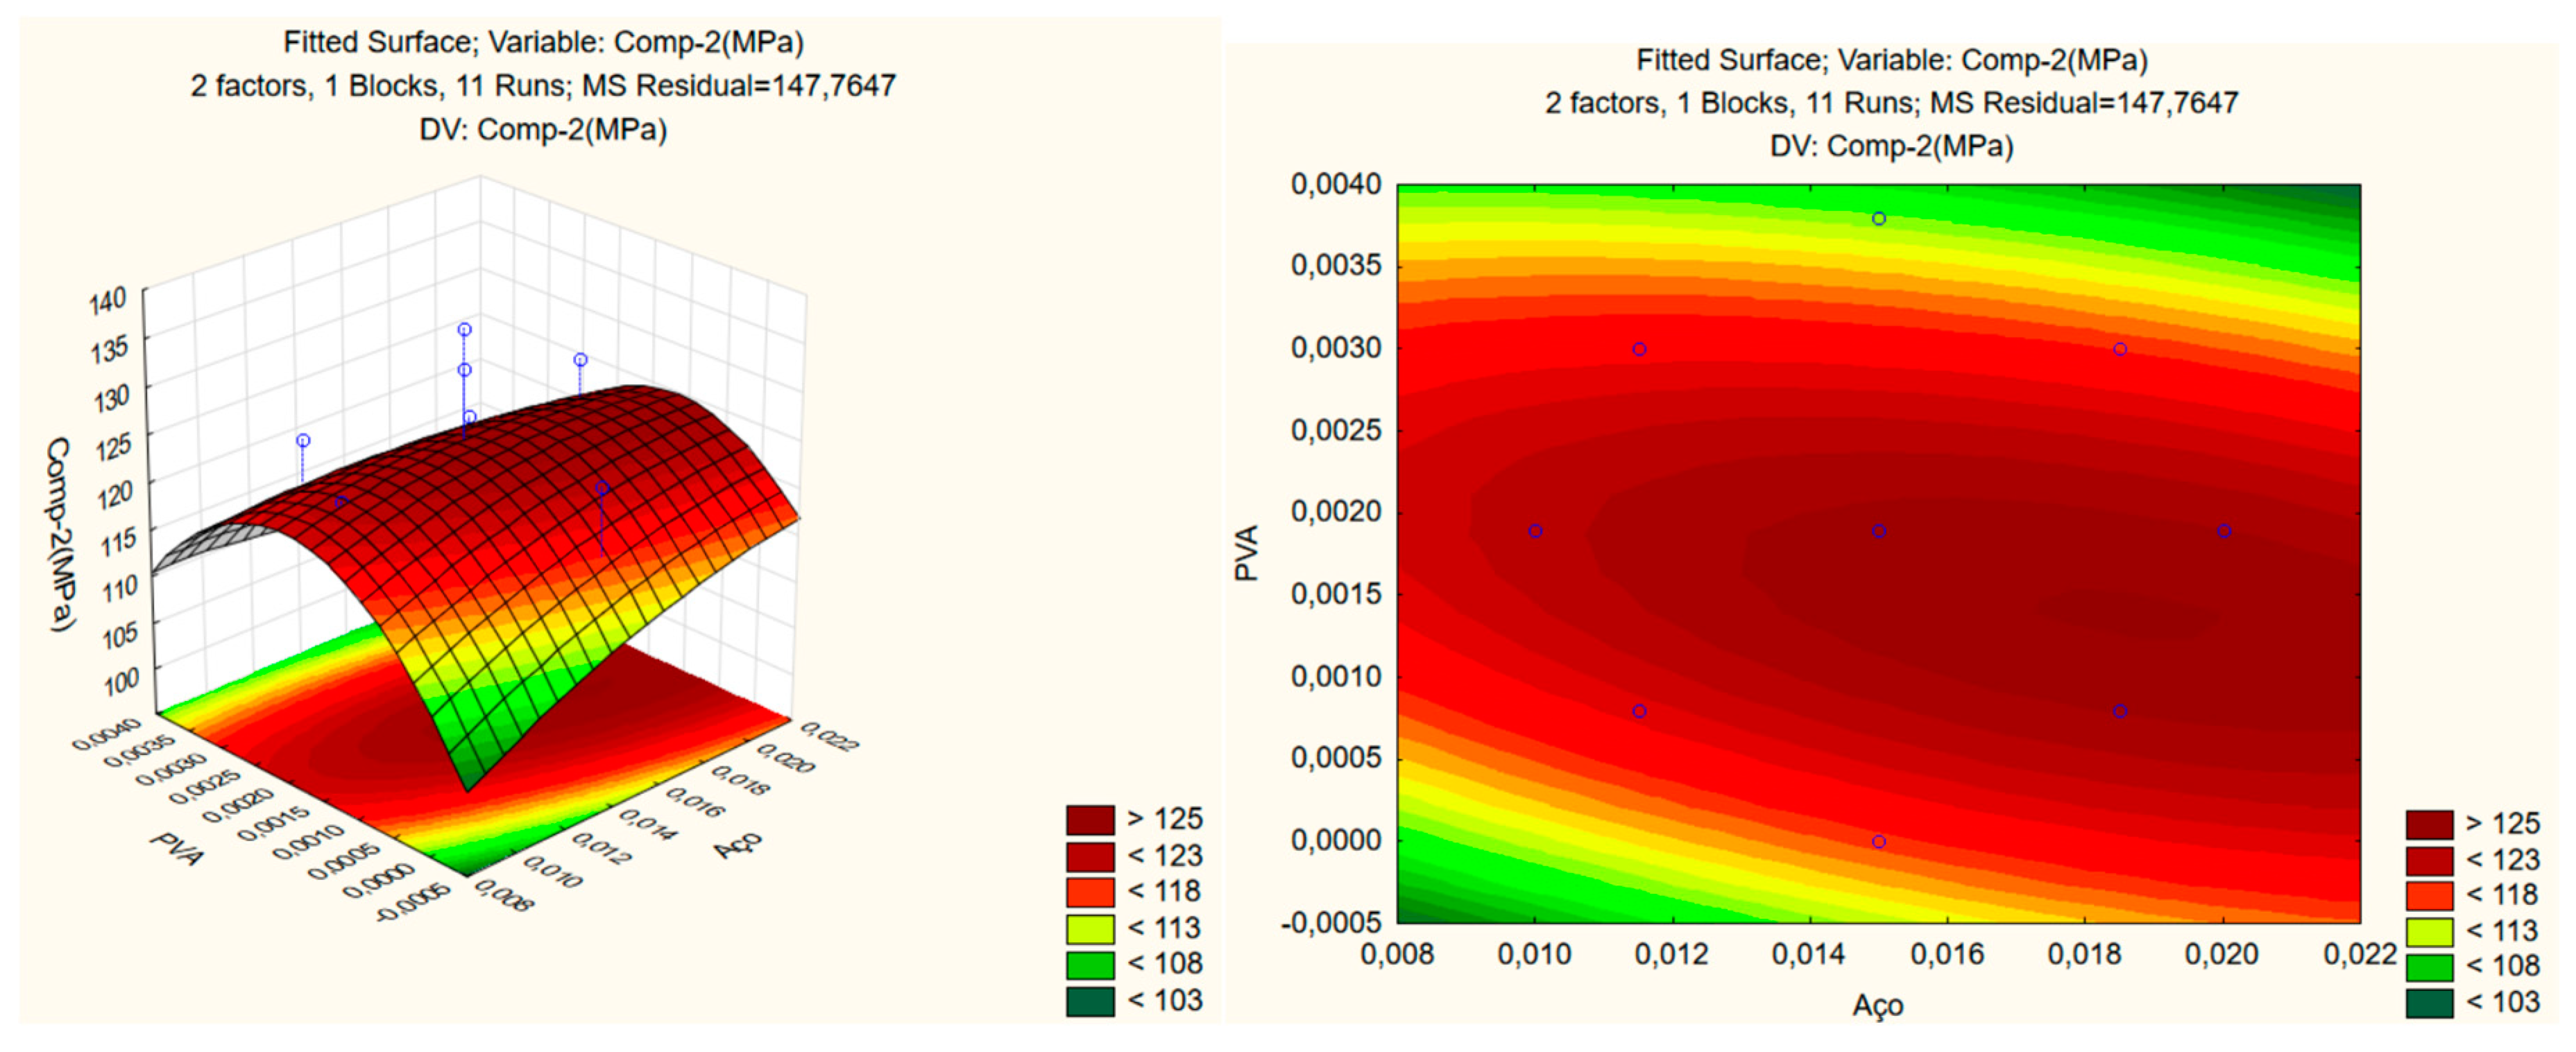
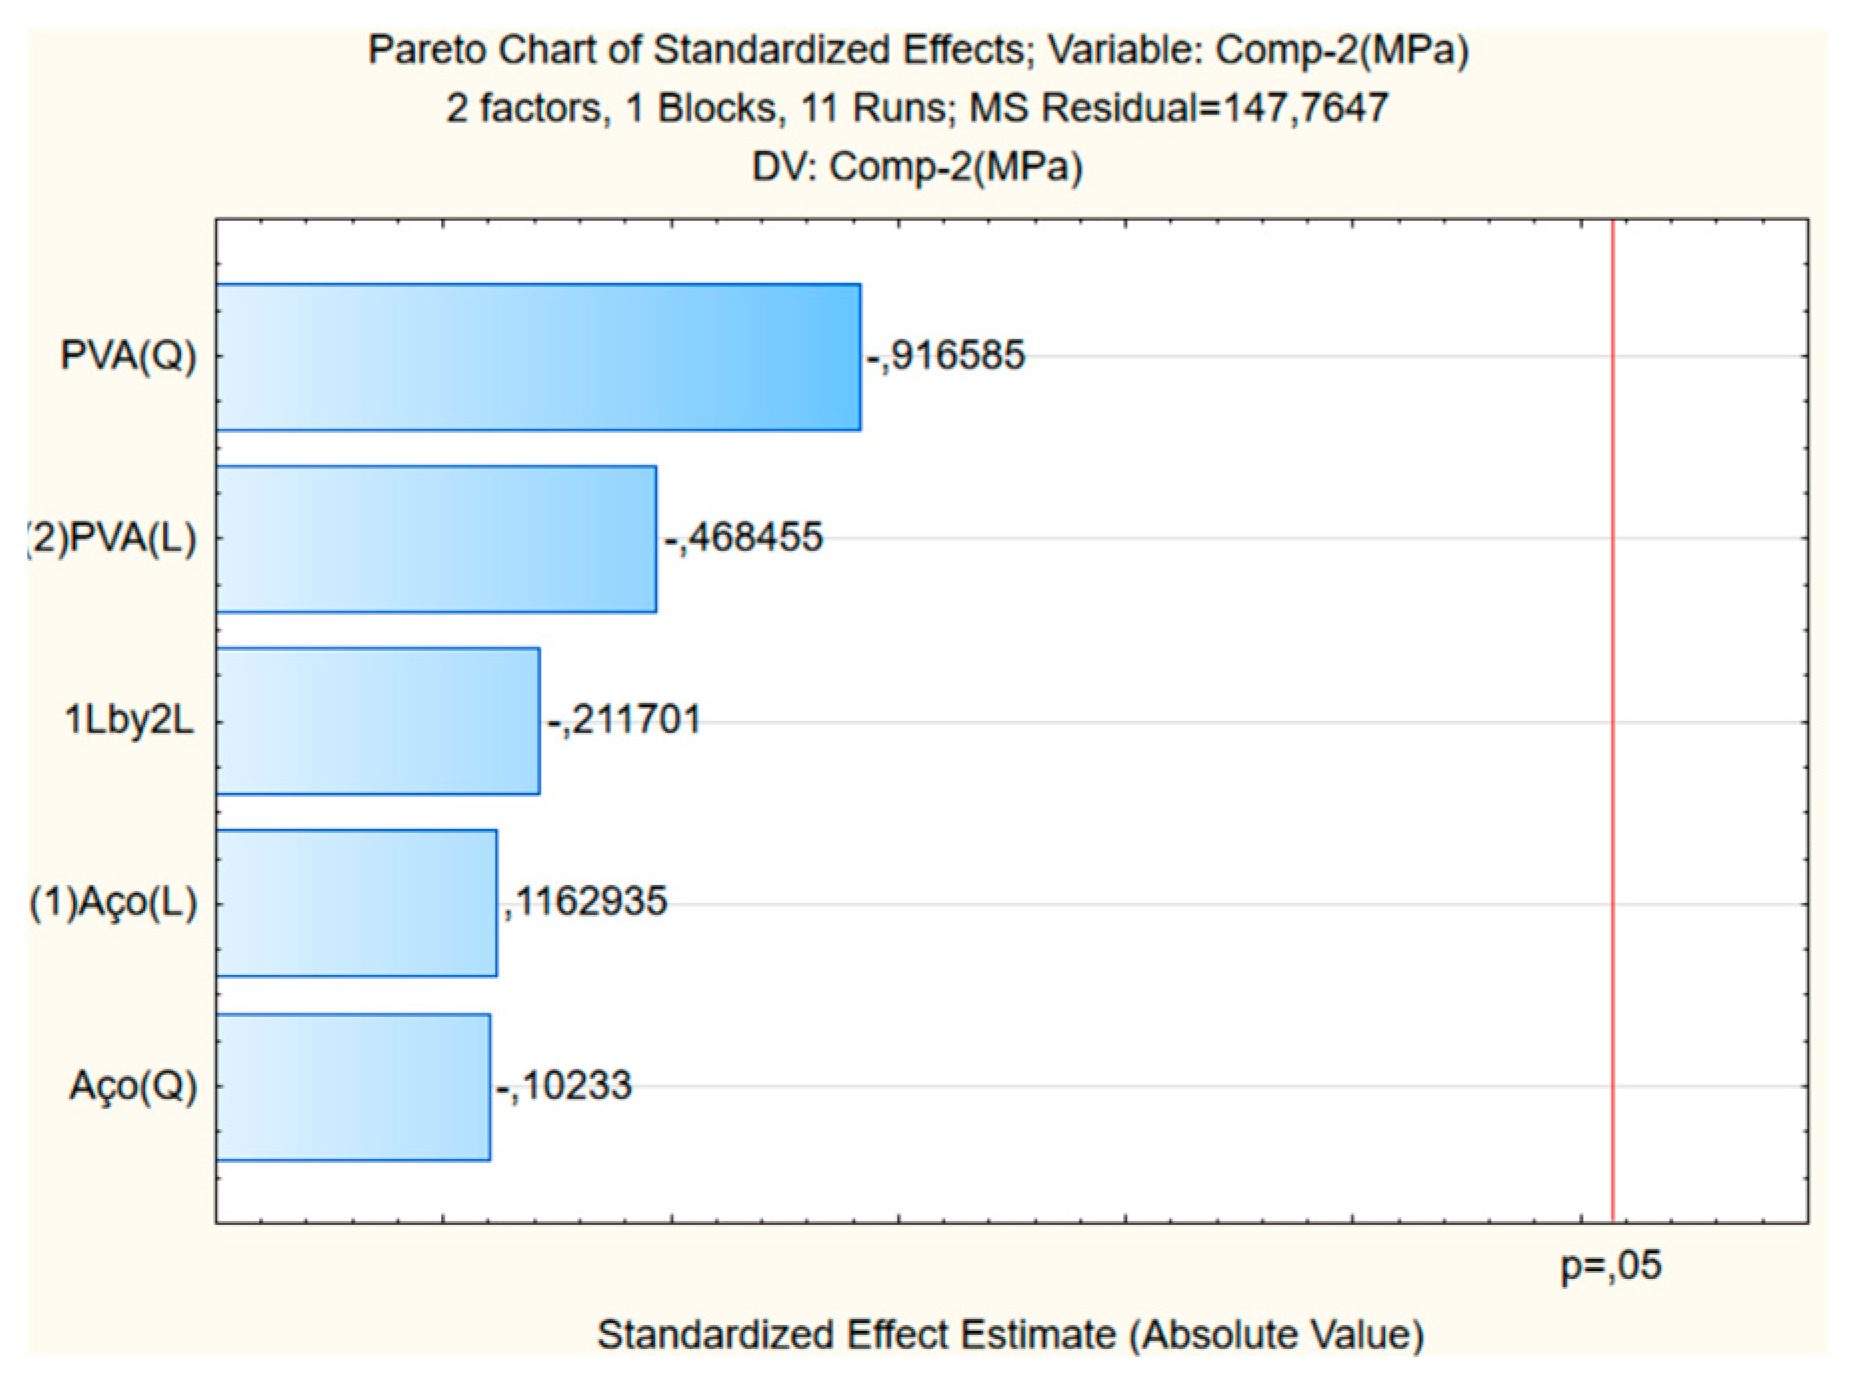
Figure 5 presents the CCRD response for compressive strength and the influence of variables on the surface's construction, which is given through Pareto analysis.
As compressive strength,
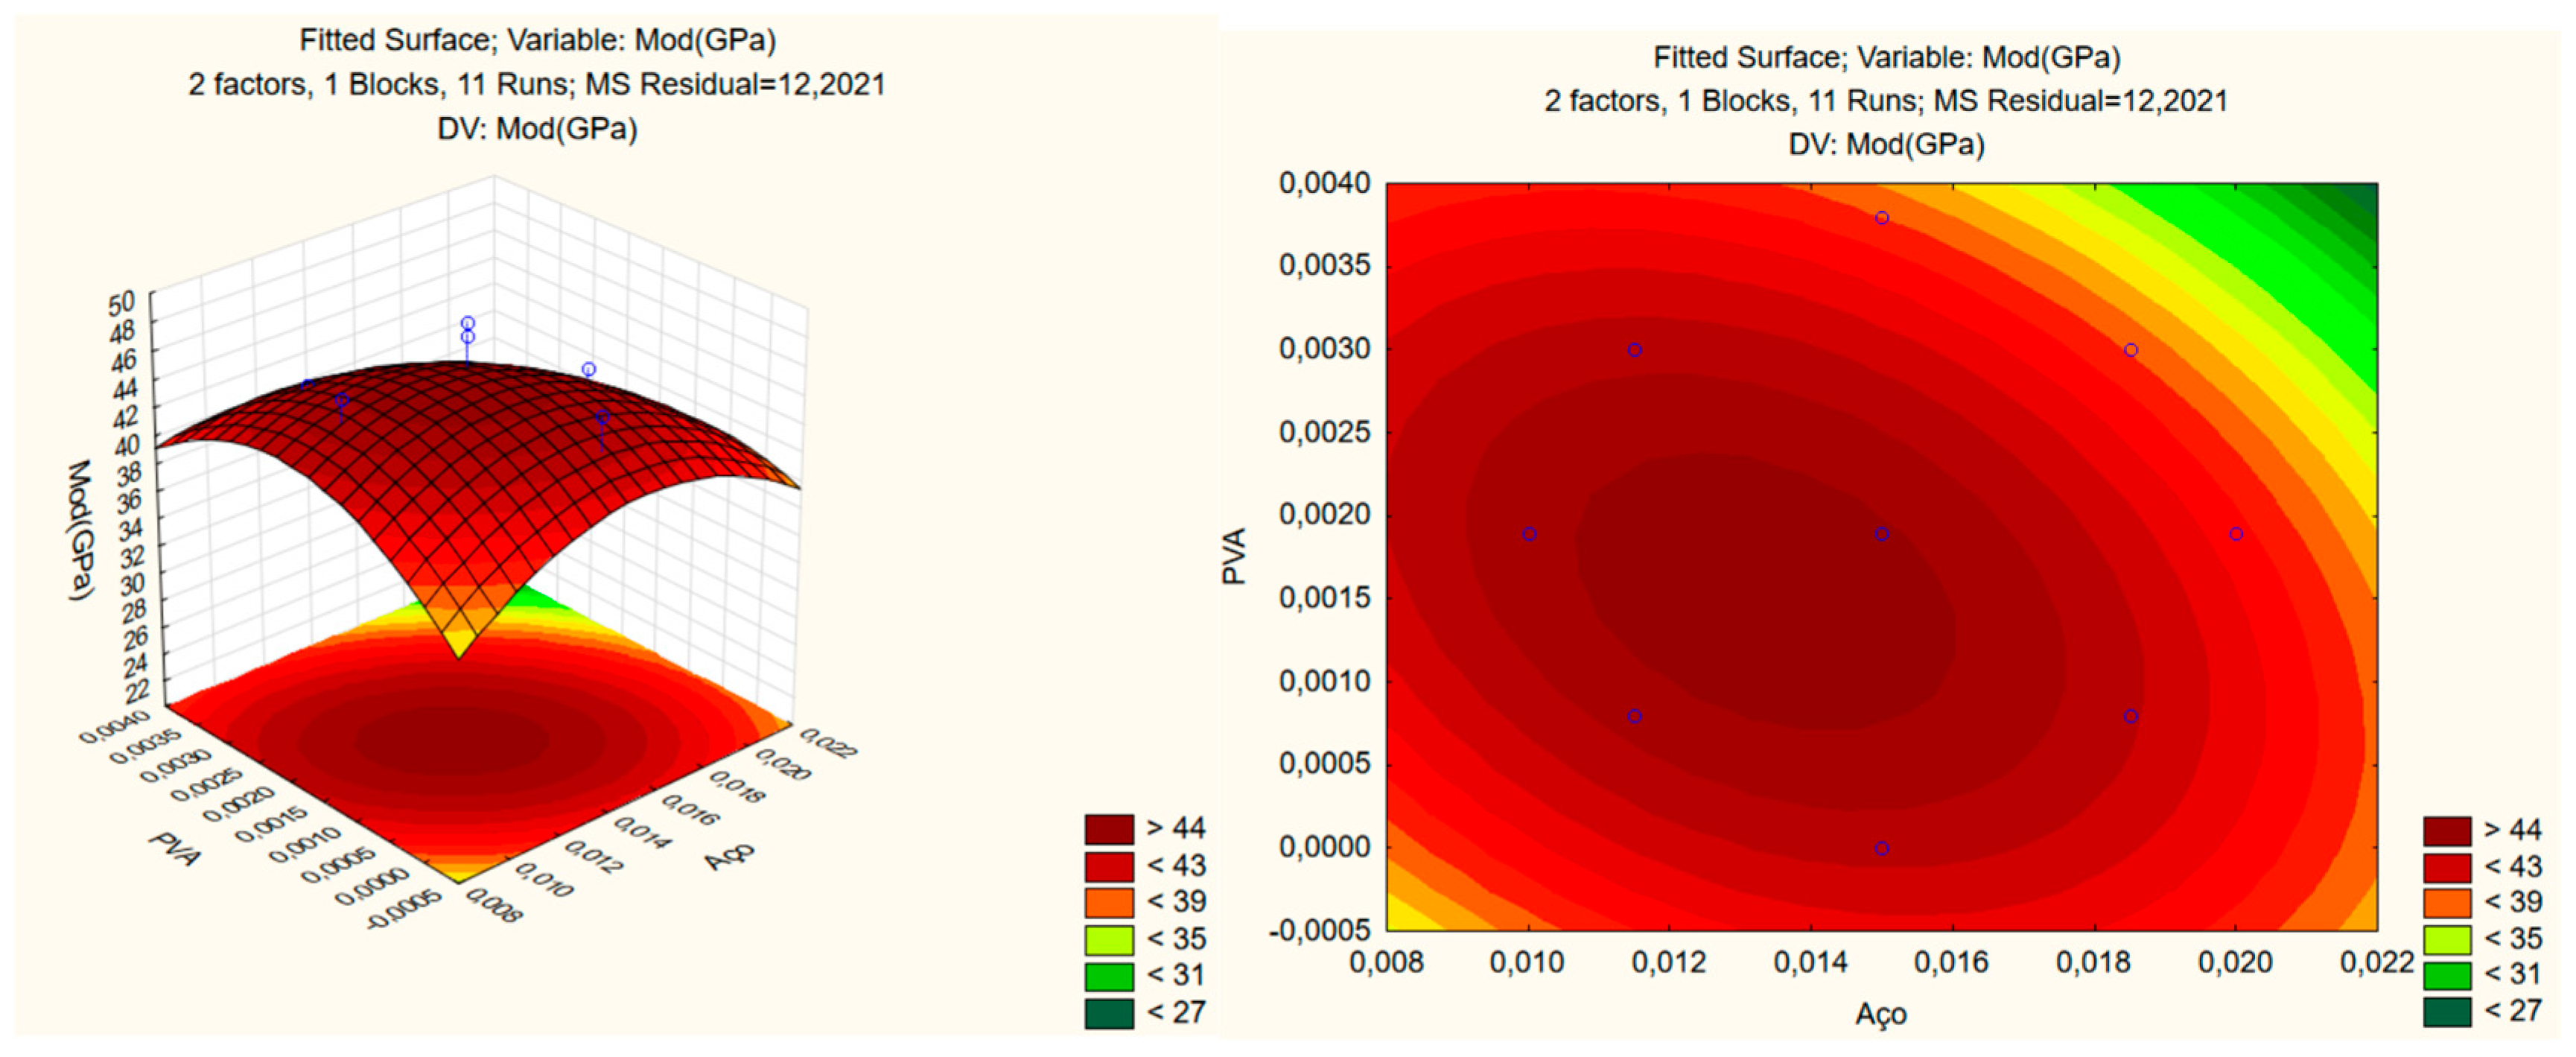
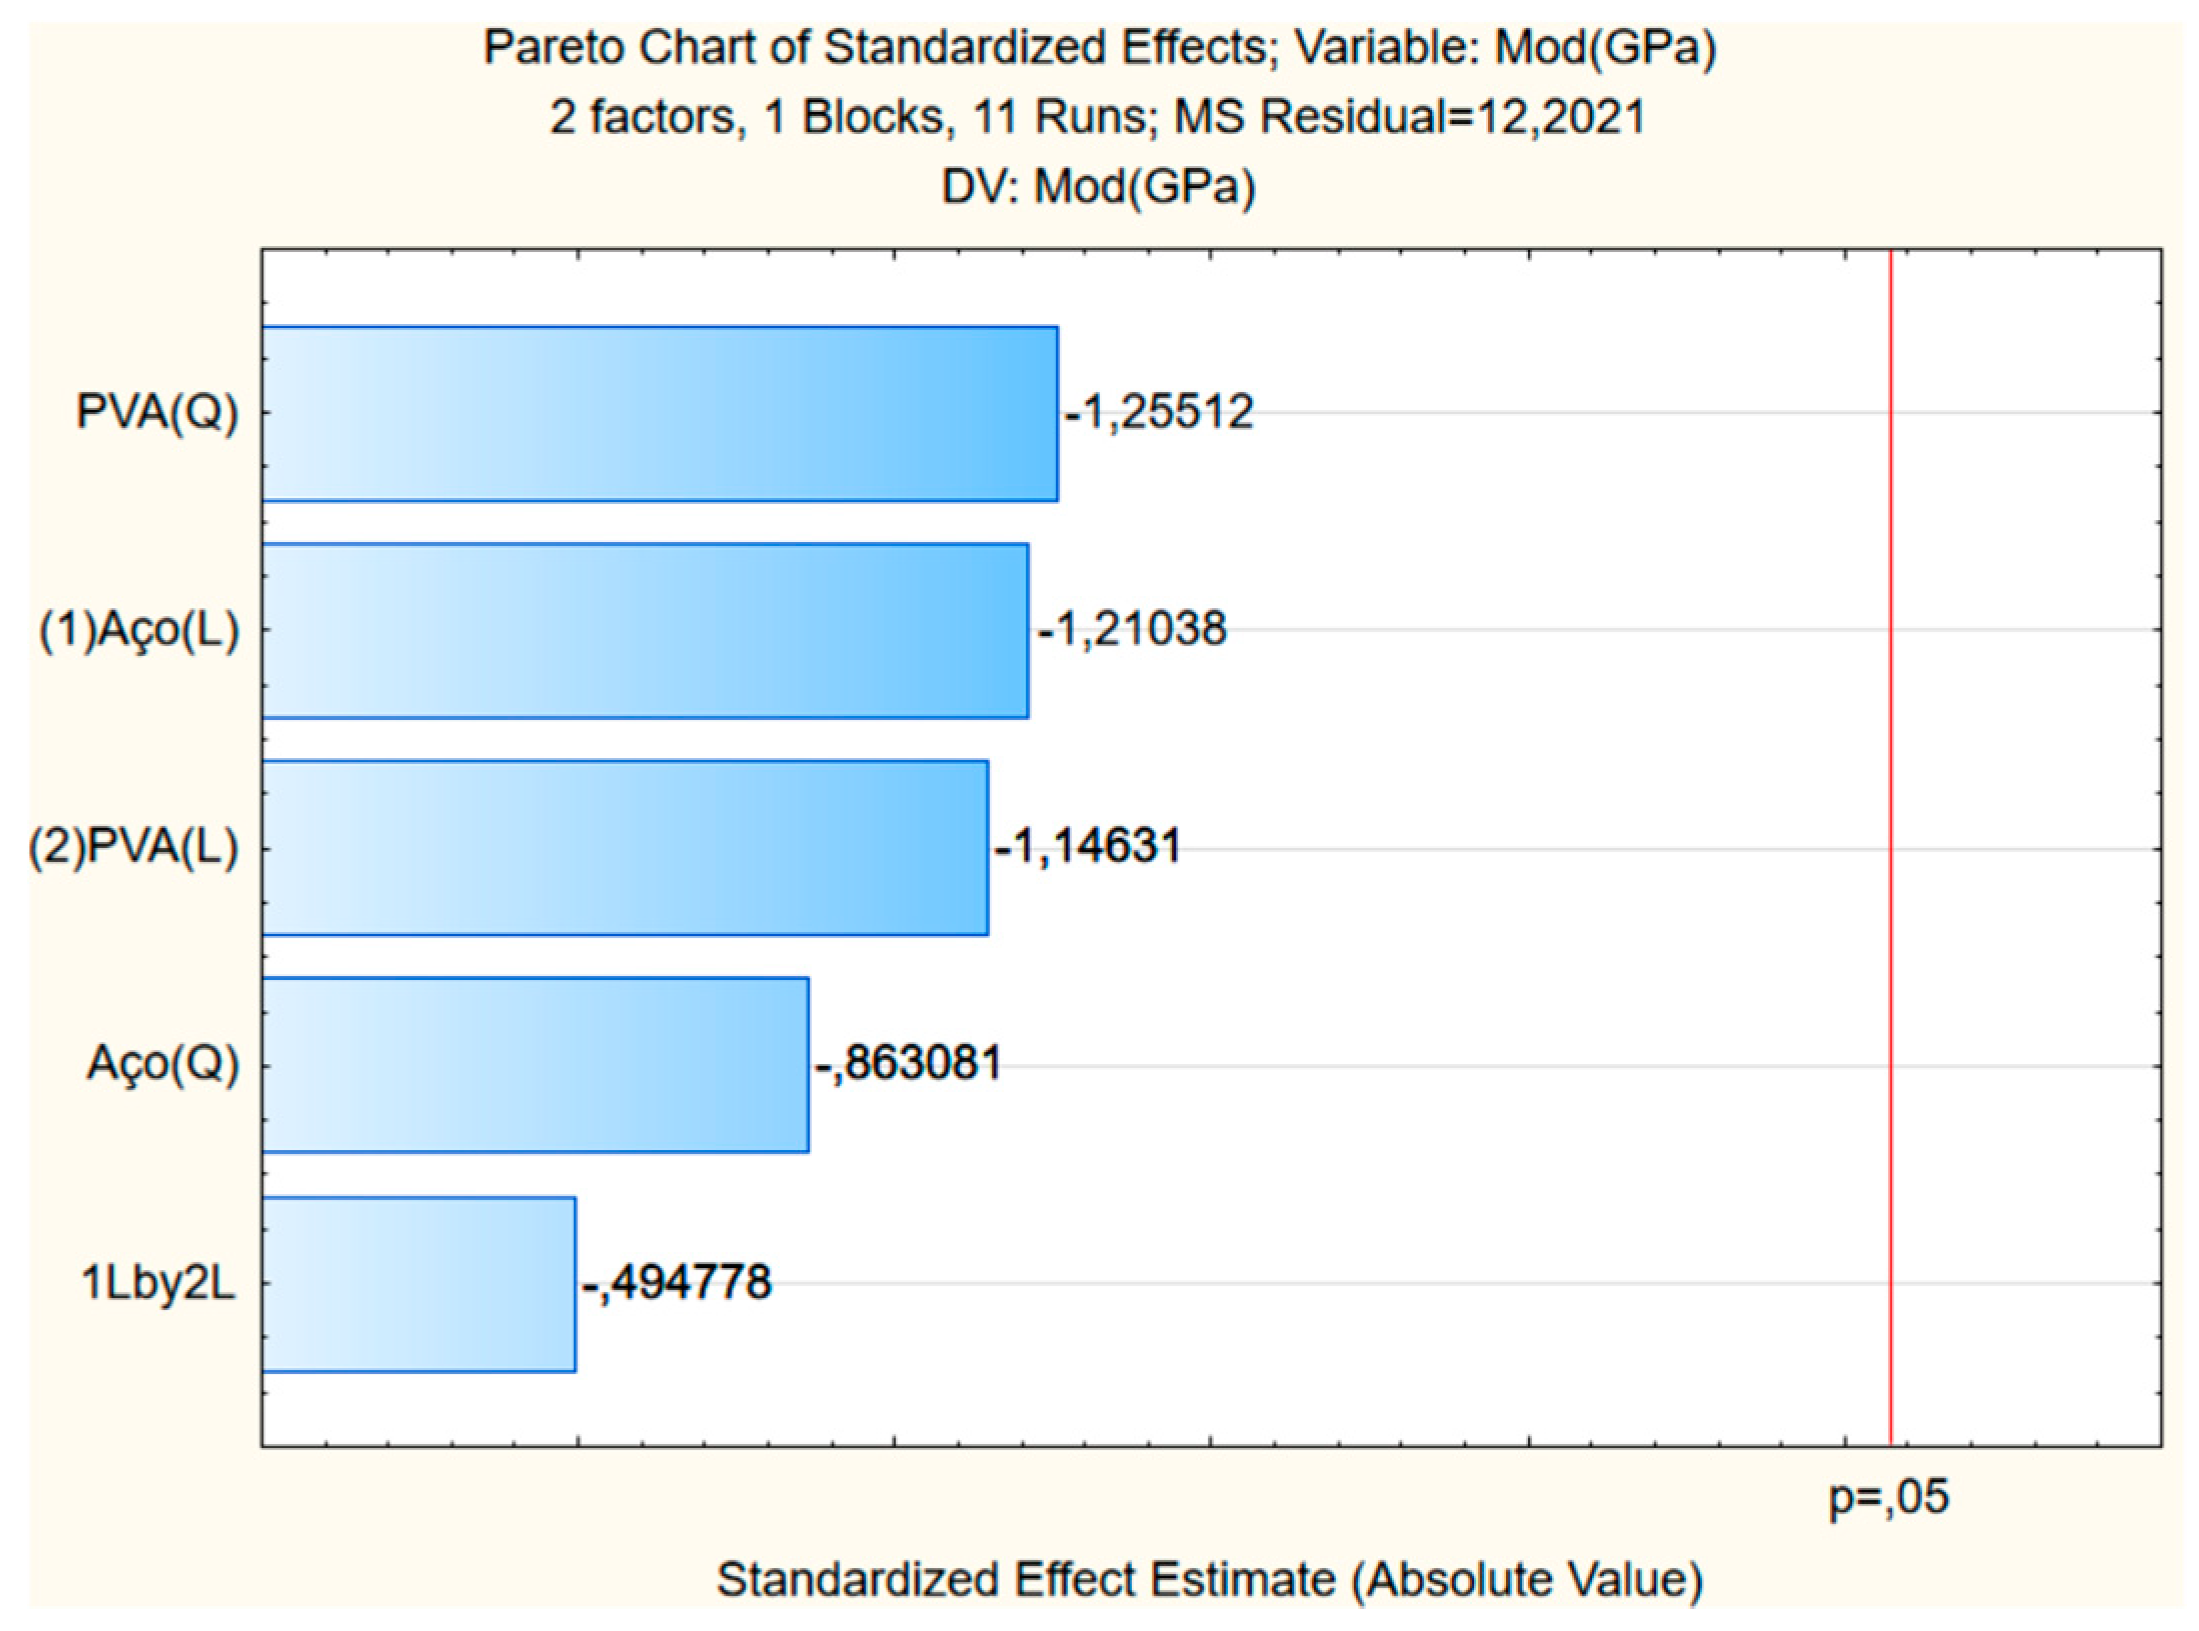
Figure 7 depicts the impact of steel and PVA fibers on the elastic modulus of UHPC. The Pareto analysis highlights the influence of variables on surface construction.
Table 8 presents the ANOVA results for the compressive strength and modulus of elasticity of eleven UHPC mixes, as analyzed by Statistica 10 software.
The Pareto chart and the ANOVA analysis concluded that the variation in steel and PVA fibers used in this research did not significantly influence the compressive strength and elasticity modulus.
3.3. Elasticity Modulus Prediction Analysis
Equation 2 was utilized to compare the estimated values of elasticity modulus obtained from approximations with the experimental average values. The results are presented in
Table 9, which shows the proximity or distance of these estimates by standards and articles from the experimental results. This methodology was done similarly to the study in Jacintho et al. (2020) [
26], providing a better understanding of the relationship between the estimates and experimental values.
As expected, the Class I concrete equation NBR 6118:2023 [
23] resulted in an average discrepancy of about 28% from experimental values. For Class II concretes (with high compressive strength), the elasticity modulus values obtained through experiments were, on average, 14% lower than those estimated using the NBR 6118:2023 equation [
23]. This difference is lower than the values estimated with the equation for Class I concrete.
The experimental elasticity modulus values were approximately 11% lower than those estimated with the equations of ACI 318(2014) [
24], Model Code (2010) [
25], and Eurocode 2(2010) [
26] (for high-strength concrete), which is slightly lower than NBR 6118:2023 [
23] Class II.
The equations proposed by Graybeal (2019) [
21] and Sritharan (2003) [
22] for estimating the elasticity modulus of UHPCs provided results that were closest to the experimental values and also in favor of safety. These results highlight the unique behavior of this material, and all its parameters must be obtained through experimental results or specific approximations.
3.4. Tensile Strength
In this research, the tensile strength of UHPC was studied by defining a mix with the appropriate amount of optimized steel and PVA fibers. This is because the steel and PVA fibers are imported materials, and to do flexural tests to study the tensile strength, it is necessary to use a concrete volume bigger than compressive strength. So, experimental planning in compressive tests was used to find an optimized mix of content fibers.
The quantity was determined using Statistica 10 software, which was used to construct the response surface for compressive strength. The fiber contents have been optimized to 1.86% steel and 0.14% PVA fibers. With this mixture, the expected compressive strength is 125.0813 MPa. At 28 days, the experimental compressive strength was 132.01MPa, and the elasticity modulus was 45.22GPa.
According to Jacintho et al. (2022) [
16], to determine the tensile strength in the elastic phase, the mean curve generated by the Origin Lab software was utilized from the 4-point bending test curves, as shown in
Figure 9.
One specimen's result was discarded due to issues during the test. Equations 3 and 4 were used to determine flexural and elastic tensile strength, respectively.
Table 10 presents the equations' parameters and the final results.
With k = 0.08 (NF P18 470, 2016) [
8]
The yield point was obtained from the graph generated using the average response of two prismatic specimens in a 4-point bending test.
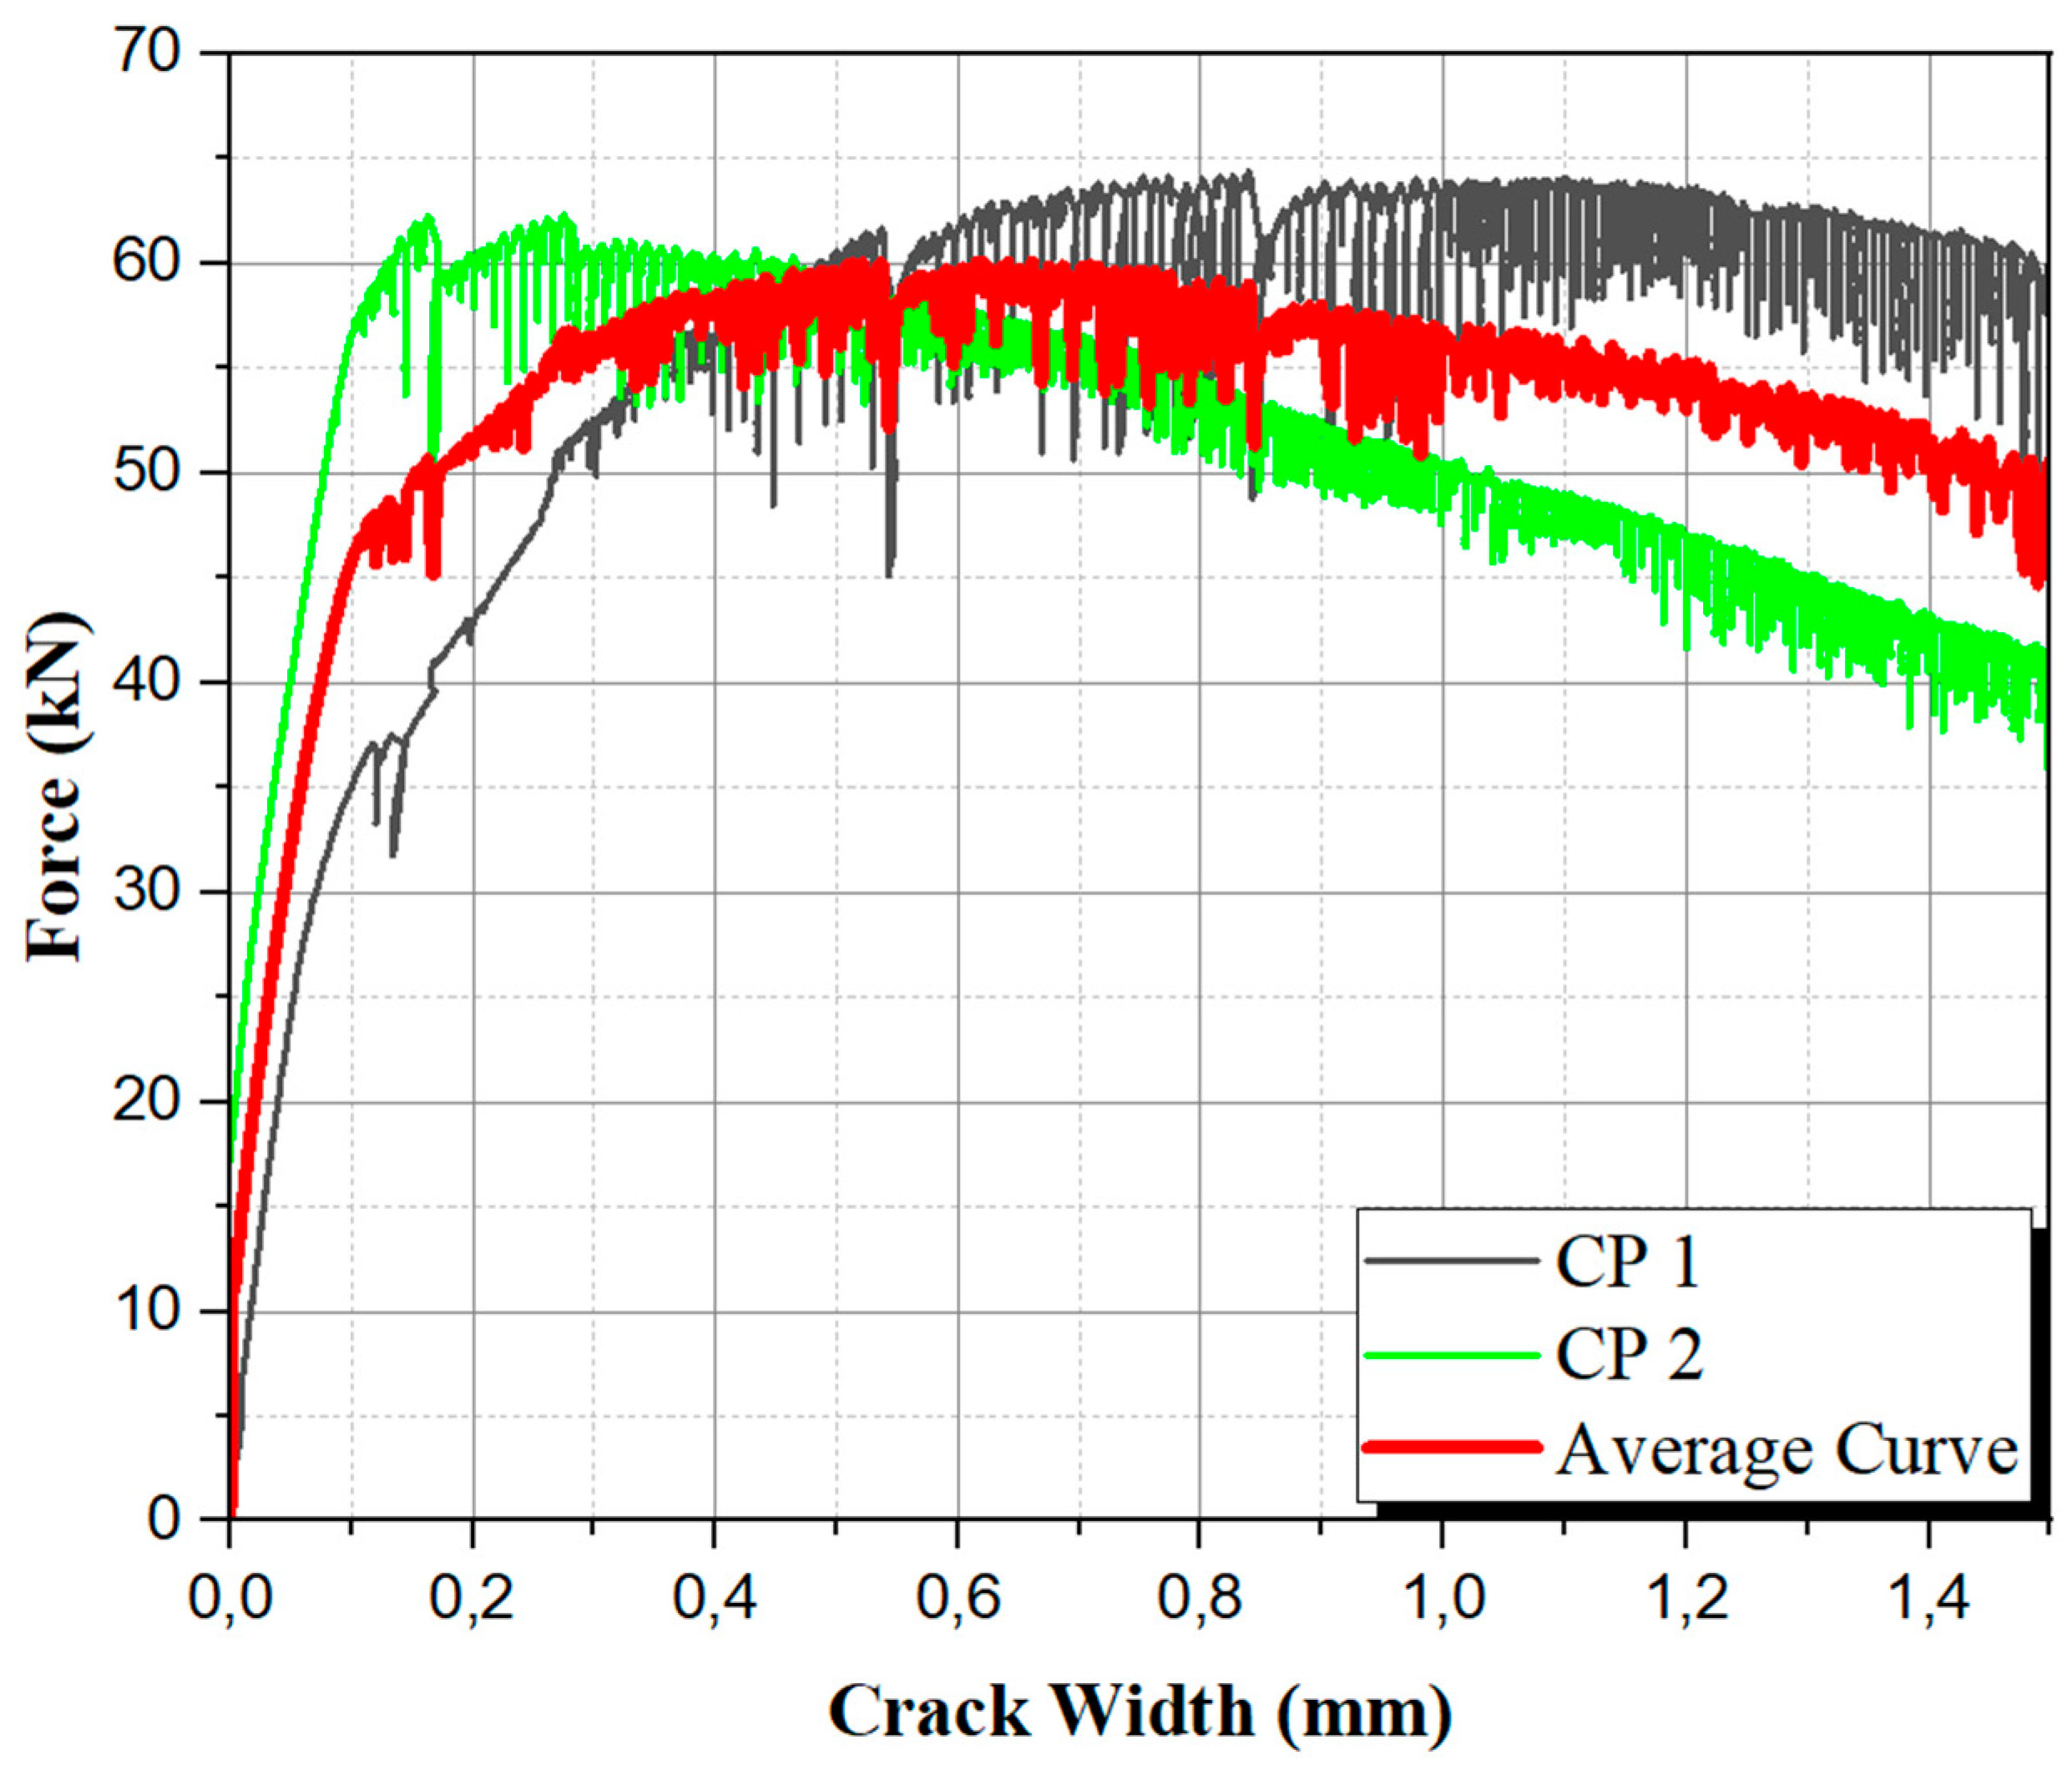
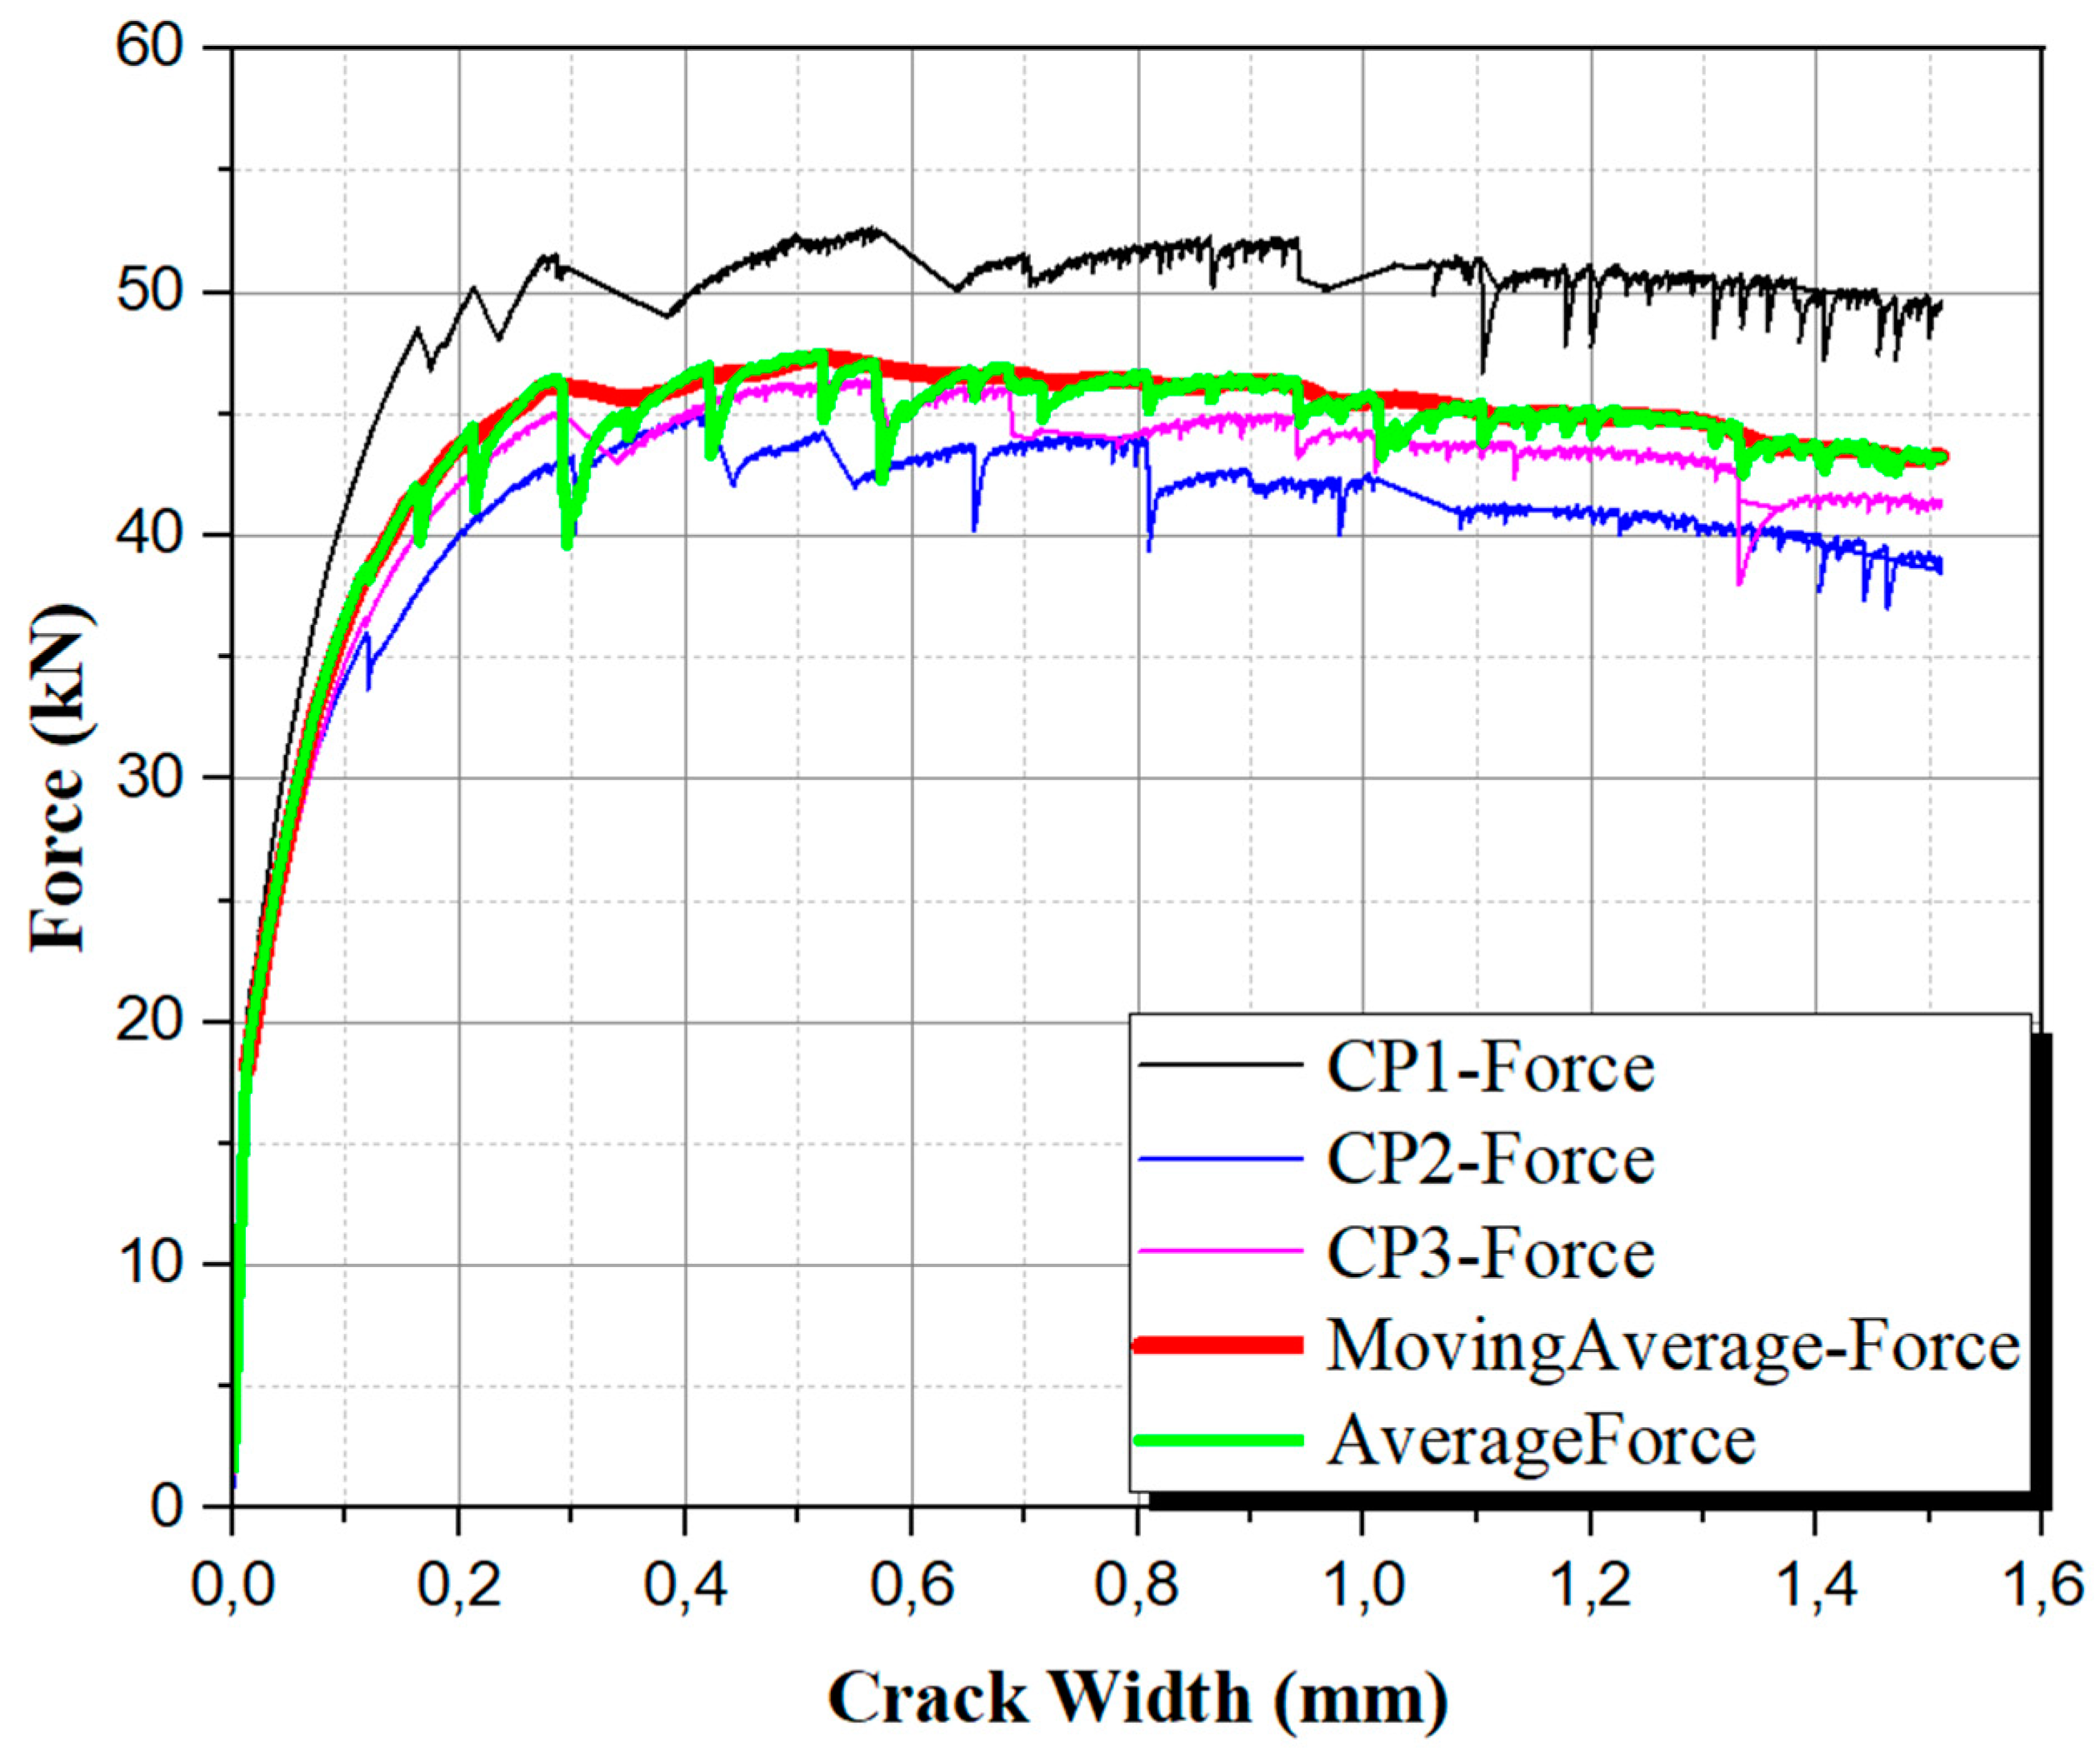
Figure 10 presents the curves generated in the 3-point bending tensile strength test, with the average curve generated in the Origin Lab 2023 software. The "x" axis deformation is the crack opening measured during the test. Also included in the graph is the curve that was created using the moving average of the data. It is based on the recommendations of the French standard NF P18 470(2016)[
8] and Jacintho et al. (2022)[
16]. The moving average was calculated in Excel, and the graph was created using the Origin Lab software.
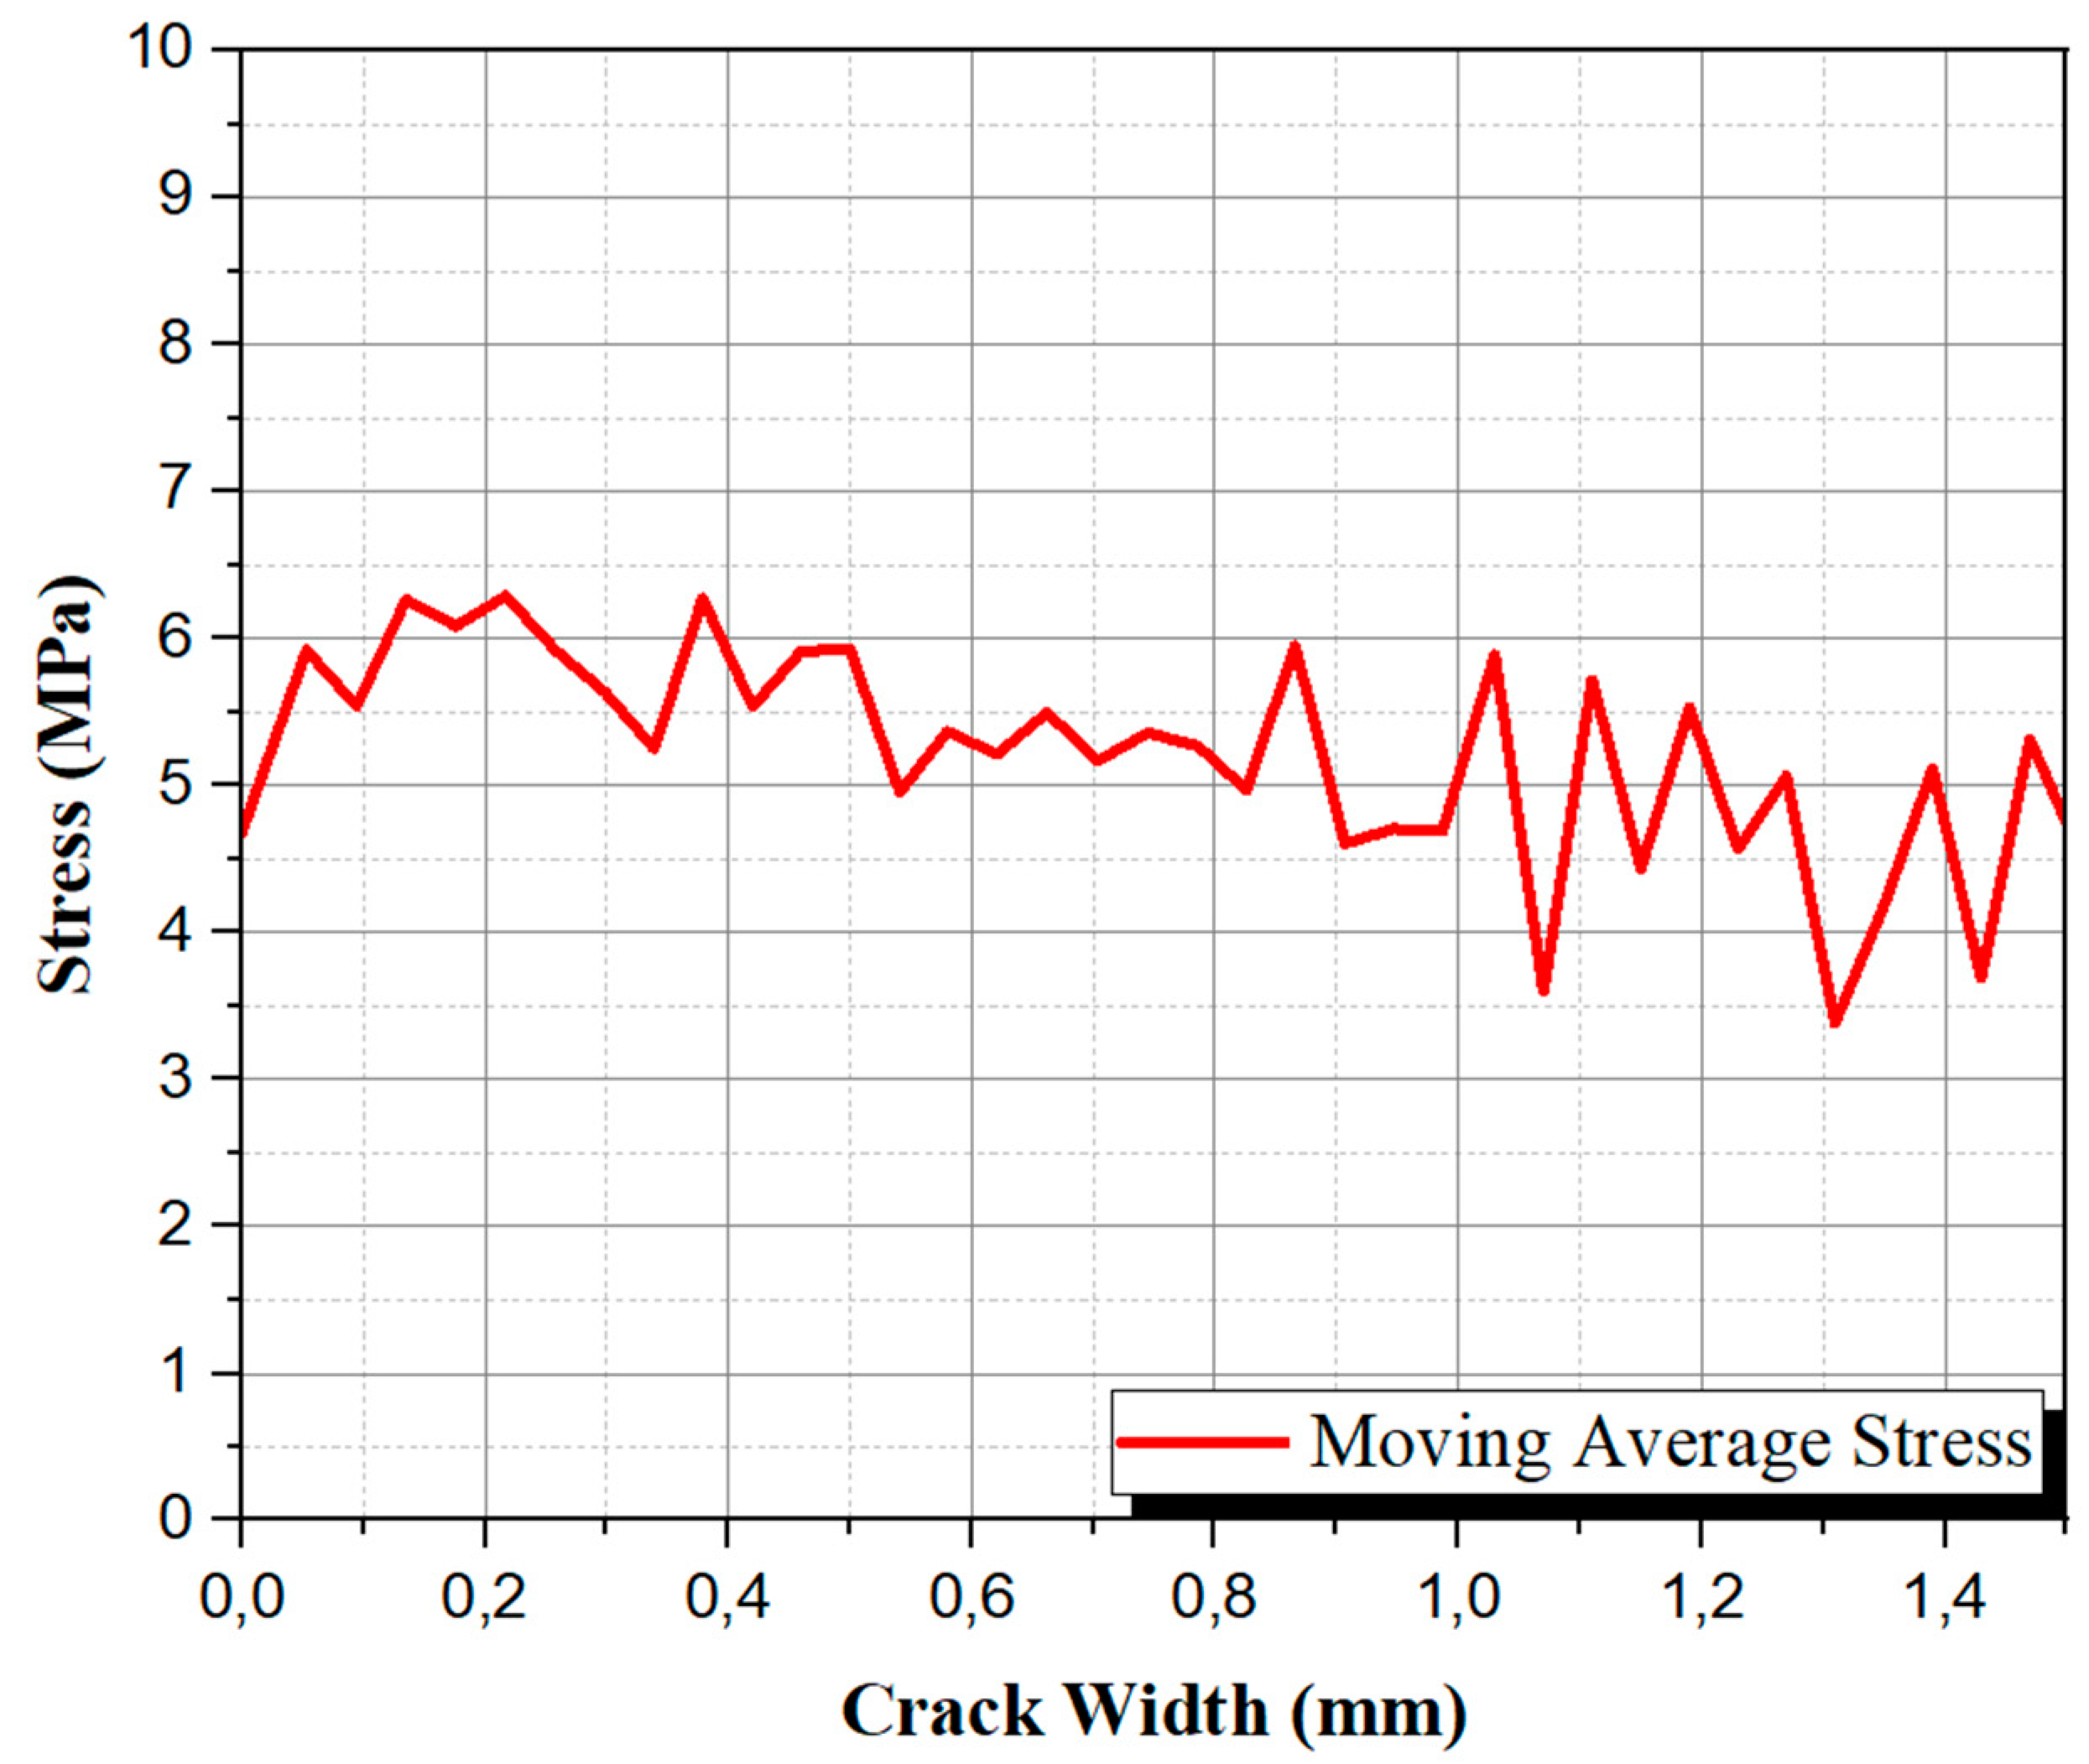
An inverse analysis of the Flexural Strength vs Crack Opening data was performed to determine the material's tensile behavior using the moving average curve. It was done using the Maple 2023 software, following the equations prescribed in the French standard NF P18 470 (2016)[
8]. The final result is presented in
Figure 11, which was created using the Origin Lab 2023 software.
The peak tensile strength point (f
ctf), obtained by inverse analysis, was 6.27MPa. According to NF P18 710 [
9], if the ratio of f
ctf divided by 1.25 is lower than f
ct,el, the material is classified as T1, which indicates a softening behavior. For this optimized concrete, the f
ctf divided by 1.25 is 5.02MPa, which is lower than 9.32MPa, and thus, it is classified as T1 and exhibits a softening behavior. It occurred despite adding 1.86% steel fibers and 0.14% PVA fibers.
4. CONCLUSIONS
The study investigated the mechanical behavior of UHPC with steel and PVA fibers. The researchers added varying amounts of steel fibers, between 1% and 2%, and PVA fibers ranging from 0% to 0.38% while keeping the base mix of UHPC constant.
The highest average compressive strength values were observed in mix T7, which had a steel fiber content of 1.50% and PVA fibers of 0.19%. In this mix, the highest value in an individual specimen was 146.33 MPa, with an average compressive strength of 135.86 MPa.
In addition, the study verified the elastic modulus of the different UHPC mixes. Mix T6 had the highest value, 48.24 GPa. In conjunction with the mixes T5 and T7, which had the same amount of fibers, 1.5% steel, and 0.19% PVA, were the three central points of the CCRD.
The researchers conducted a CCRD analysis using the Statistica 10 software. They found that varying the quantity of fibers (PVA and steel) did not significantly affect the compressive strength and elastic modulus within the range of fiber quantities used in this research.
The elastic modulus values estimated by the standards were compared with the experimental values. The equations of NBR 6118:2023[
23] for Class I and Class II concretes produced values farthest from the experimental values. The estimated values from ACI 318(2014)[
24], Model Code (2010) [
25], and Eurocode 2(2010) [
26] were higher than the experimental values by about 20%, being slightly lower than NBR 6118:2023 [
23] Class II. The equations proposed by Graybeal (2019) [
21] and Sritharan (2003) [
22] were more in favor of safety as they produced values closer to the experimental values. Both equations were developed specifically for UHPCs.
The 4-point bending test showed that the elastic tensile strength (f
ct,el) of 9.32MPa was within the expected range for UHPC. The minimum strength for UHPC is 7MPa, according to the Jacintho, et.al.(2022) [
16]. On the other hand, the 3-point bending test, using the inverse analysis, showed that the f
ctf was lower than the f
ct,el. It means that the concrete produced is classified as T1 (softening), according to French standards NF P18-470(2016) [
8] and NF P18-710(2016) [
9].
Author Contributions
For research articles with several authors, a short paragraph specifying their individual contributions must be provided. The following statements should be used “Conceptualization, X.X. and Y.Y.; methodology, X.X.; software, X.X.; validation, X.X., Y.Y. and Z.Z.; formal analysis, X.X.; investigation, X.X.; resources, X.X.; data curation, X.X.; writing—original draft preparation, X.X.; writing—review and editing, X.X.; visualization, X.X.; supervision, X.X.; project administration, X.X.; funding acquisition, Y.Y. All authors have read and agreed to the published version of the manuscript.” Please turn to the CRediT taxonomy for the term explanation. Authorship must be limited to those who have contributed substantially to the work reported. Writing – Original Draft, Data curation, Validation, Supervision, Project Administration, Methodology, Formal analysis, Ana Elisabete P. G. A. Jacintho; Conceptualization, Methodology, Formal analysis, André Mendes dos Santos; Original draft, Writing, Formal analysis, Gilvan Bezerra Santos Jr; Conceptualization, Methodology, Grazielle Gomes Barbante; Formal analyses, Lia Lorena Pimentel; Formal analyses, Nádia Cazarim Silva Forti.
Funding
Financial support – Process FAPESP 2022/11156-0 e CAPES Master scholarship.
Acknowledgments
The authors would like to thank the companies Evolution Engineering, MC Bauchemie, RC Beneficiamento de Minérios, Belgo Bekaert Arames, Kuraray, and Tecnosil for their assistance in testing and donating materials.
Conflicts of Interest
The authors declare no conflicts of interest.
References
- FEDERAL HIGHWAY ADMINISTRATION – FHWA-HRT 06-103 – Material Property Characterization of Ultra-High Performance Concrete. 2006.
- JAPAN SOCIETY OF CIVIL ENGINEERING – JSCE – Recommendations for Design and Construction of High Performance Fiber Reinforced Cement Composites with Multiple Fine Cracks (HPFRCC). 2008.
- FEDERAL HIGHWAY ADMINISTRATION – FHWA-HRT-10-079 – Finite Element Analysis of UHPC:Structural Performance of an AASHTO Type II Girder – 2010.
- FEDERAL HIGHWAY ADMINISTRATION – FHWA-HRT-11-038 – Ultra-High Performance Concrete. 2011.
- FEDERAL HIGHWAY ADMINISTRATION – FHWA-HRT 13-060 – Ultra-High Performance Concrete: A State-of-the-Art Report for the Bridge Community. 2013.
- FEDERAL HIGHWAY ADMINISTRATION – FHWA-HRT-13-100 – 2013.
- KOREA INSTITUTE OF CONSTRUCTION TECHNOLOGY (KICT). Design Guidelines for K-UHPC. Korea, 2014.
- ASSOCIATION FRANÇAISE DE NORMALISATION. NF P18-470 – Concrete – Ultra-high performance fiber-reinforced concrete – Specifications, performance, production and conformity. 2016.
- ASSOCIATION FRANÇAISE DE NORMALISATION. NF P18-710 – Design of concrete structures: specific rules for Ultra-High-Performance Fiber-Reinforced Concrete (UHPFRC). 2016.
- FEDERAL HIGHWAY ADMINISTRATION – FHWA-HRT-17-096 – Field Testing of an Ultra-High Performance Concrete Overlay – 2017.
- FEDERAL HIGHWAY ADMINISTRATION – FHWA-HRT-17-097 – Ultra-High Performance Concrete for Bridge Deck Overlays – 2018.
- FEDERAL HIGHWAY ADMINISTRATION – FHWA-HRT-17-036 – FHWA Research and Technology Evaluation – 2018.
- AMERICAN CONCRETE INSTITUTE COMMITTEE ACI PRC 239-18. Ultra High Performance Concrete: An Emerging Technology Report. (ACI PRC 239-18), 2018.
- FEDERAL HIGHWAY ADMINISTRATION – FHWA-HIF-19-011 – Precast Concrete Pavement Implementation by U.S. Highway Agencies – 2019.
- FEDERAL HIGHWAY ADMINISTRATION – FHWA-HRT-21-095 – TechBrief: Electrical Resistivity Testing to Rapidly Assess the Durability of UHPC-Class Materials – 2022.
- JACINTHO, Ana Elisabete P. G. A.; ARAÚJO, Daniel L.; PIMENTEL, Lia L.; CARNIO, Marco A.; MONTE, Renata; CHRIST, Roberto. Estruturas de Concreto de Ultra Alto Desempenho (UHPC). Prática Recomendada. Comitê Técnico 303 – IBRACON/ABECE. GT5. 1ª Edição. 2022.
- SANTOS JR, Gilvan B.. Design of an UHPC with local materials: procedures, properties and modelling parameters. PhD thesis of UFSCar. 2023.
- SUMITOMO, Guilherme S.. Estudo do comportamento mecânico do UHPFRC produzido com fibras de aço e de PVA submetidos a elevadas temperaturas, Dissertação de Mestrado. PUC-Campinas. 2022.
- VIGNESHWARI, M.; ARUNACHALAM, K.; ANGAYARKANNI, A.. Replacement of silica fume with thermally treated rice husk ash in Reactive Powder Concrete. Journal of Cleaner Production, v. 188, p. 264–277, jul. 2018. [CrossRef]
- HIREMATH, P. N.; YARAGAL, S. C.. Influence of mixing method, speed and duration on the fresh and hardened properties of Reactive Powder Concrete. Construction and Building Materials, v. 141, p. 271–288, jun. 2017. [CrossRef]
- GRAYBEAL, Benjamin A.; EL-HELOU, Rafic G.. Development of an AASHTO Guide Specification for UHPC", International Interactive Symposium on Ultra-High Performance Concrete, 2(1), 2019. [CrossRef]
- SRITHARAN, Sri; BRISTOW, B. J.; PERRY, V. H.. Characterizing an ultra high performance material for bridge applications under extreme loads, 3rd International Symposium on High Performance Concrete, Orlando, Florida, 2003.
- ASSOCIAÇÃO BRASILEIRA DE NORMAS TÉCNICAS. NBR 6118: Projeto de estruturas de concreto — Procedimento. Rio de Janeiro. 2023.
- AMERICAN CONCRETE INSTITUTE COMMITTEE ACI 318-14. Building code requirements for structural concrete and commentary. (ACI 318-14), 2014.
- FIB (THE INTERNATIONAL FEDERATION FOR STRUCTURAL CONCRETE). FIB Model Code for Concrete Structures 2010.
- EUROPEAN COMMITTEE FOR STANDARDIZATION (CEN) – Eurocode 2 – Design of concrete structures – Concrete bridges – Design and detailing rules. EN 1992-2 – 2005.
- JACINTHO, Ana Elisabete P. G. A.; CAVALIERE, Ivanny S. G.; PIMENTEL, Lia Lorena; FORTI, Nádia C. S.. Modulus and Strength of Concretes with Alternative Materials. Materials, v. 13, p. 4378, 2020. [CrossRef]
Figure 1.
Methodology Scheme.
Figure 1.
Methodology Scheme.
Figure 2.
UHPC component materials.
Figure 2.
UHPC component materials.
Figure 3.
UHPC Mixing Process 1.
Figure 3.
UHPC Mixing Process 1.
Figure 4.
UHPC Mixing Process 2.
Figure 4.
UHPC Mixing Process 2.
Figure 5.
Response surface of compression strength.
Figure 5.
Response surface of compression strength.
Figure 6.
Pareto for compression strength.
Figure 6.
Pareto for compression strength.
Figure 7.
Response surface of elasticity modulus.
Figure 7.
Response surface of elasticity modulus.
Figure 8.
Pareto of elasticity modulus.
Figure 8.
Pareto of elasticity modulus.
Figure 9.
Experimental curves obtained in the 4-point bending tests.
Figure 9.
Experimental curves obtained in the 4-point bending tests.
Figure 10.
Experimental curves obtained in the 3-point bending tests with the average curve and the moving average curve.
Figure 10.
Experimental curves obtained in the 3-point bending tests with the average curve and the moving average curve.
Figure 11.
Inverse analysis of the 3-point bending test.
Figure 11.
Inverse analysis of the 3-point bending test.
Table 1.
Standards and technical recommendations on UHPC.
Table 1.
Standards and technical recommendations on UHPC.
| Year |
Publication |
Subject |
Country |
| 2006 |
FHWA-HRT 06-103 [1] |
Properties
Characterization |
USA |
| 2008 |
Recommendations for Design and Construction of High
Performance Fiber Reinforced Cement Composites with
MultipleFine Cracks (HPFRCC) [2] |
General
Specification |
Japan |
| 2010 |
FHWA-HRT-10-079 [3] |
Computational Model |
USA |
| 2011 |
FHWA-HRT-11-038 [4] |
General |
USA |
| 2013 |
FHWA-HRT 13-060 [5] |
State of the Art |
USA |
| 2013 |
FHWA-HRT 13-100 [6] |
Mixing |
USA |
| 2014 |
Design Guidelines for K-UHPC [7] |
General |
South
Korea |
| 2016 |
NF P 18 470 [8] |
General |
French |
| 2016 |
NF P 18 710 [9] |
General |
French |
| 2017 |
FHWA-HRT 17-096 [10] |
Bridges
Conservation |
USA |
| 2018 |
FHWA-HRT 17-097 [11] |
Bridges
Conservation |
USA |
| 2018 |
FHWA-HRT-18-036 [12] |
Properties and Performance |
USA |
| 2018 |
ACI PRC-239-18: Ultra-High Performance Concrete:
An Emerging Technology Report [13] |
Properties and Performance |
USA |
| 2019 |
FHWA-HIF-19-011 [14] |
Bridges
Conservation |
USA |
| 2022 |
FHWA-HRT-21-095 [15] |
Properties and Performance |
USA |
| 2022 |
Prática Recomendada
Concreto De Ultra Alto Desempenho Reforçado Com Fibras (UHPC) [16] |
General |
Brazil |
Table 2.
Number of specimens and UHPC age for each type of test.
Table 2.
Number of specimens and UHPC age for each type of test.
| Test |
Specimen type |
Sample Quantity |
| 7 days |
28 days |
| Compression Strength |
Cylindrical 7.5cm x 15cm |
3 |
4 |
| Elasticity Modulus |
Cylindrical 7.5cm x 15cm |
|
4 |
| Bending Test – 3 points |
Prismatic 10cm x 10cm x 40cm |
|
3 |
| Bending Test – 4 points |
Prismatic 10cm x 10cm x 40cm |
|
3 |
Table 3.
Variables coded according to CCRD with factorial 22.
Table 3.
Variables coded according to CCRD with factorial 22.
| Variables |
Codification |
| -
|
-1 |
0 |
1 |
|
Steel Fibers
(Independent) |
1.0% |
1.15% |
1.5% |
1.85% |
2.0% |
PVA fibers
(Independent) |
0.00% |
0.08% |
0.19% |
0.30% |
0.38% |
Compression Strength
(dependent) |
- |
- |
- |
- |
- |
Elasticity Modulus
(dependent) |
- |
- |
- |
- |
- |
Table 4.
Content fiber, compression strength at 7 days and 28 days and elasticity modulus at 28 days.
Table 4.
Content fiber, compression strength at 7 days and 28 days and elasticity modulus at 28 days.
| Series |
Fibers Content |
7 days Compression
Strength |
28 days Compression
Strength |
28 days Elasticity
Modulus |
Steel
(%) |
PVA
(%) |
Average
Strength
(MPa) |
Standard
Deviation
(MPa) |
Average
Strength
(MPa) |
Standard
Deviation
(MPa) |
Average
Modulus |
Standard
Deviation |
| T1 |
1.00 |
0.19 |
60.94 |
7.37 |
122.94 |
2.50 |
46.14 |
3.04 |
| T2 |
1.15 |
0.08 |
89.36 |
2.43 |
110.13 |
3.33 |
41.44 |
0.71 |
| T3 |
1.15 |
0.38 |
82.89 |
4.70 |
124.21 |
5.57 |
43.63 |
1.16 |
| T4 |
1.50 |
0.00 |
91.83 |
6.71 |
125.54 |
3.47 |
46.08 |
1.62 |
| T5 |
1.50 |
0.19 |
87.15 |
3.88 |
106.00 |
0.69 |
40.90 |
0.64 |
| T6 |
1.50 |
0.19 |
66.99 |
5.74 |
131.67 |
1.60 |
48.24 |
5.15 |
| T7 |
1.50 |
0.19 |
71.00 |
1.54 |
135.86 |
6.98 |
47.27 |
3.68 |
| T8 |
1.50 |
0.30 |
93.77 |
2.12 |
106.29 |
0.99 |
38.23 |
1.31 |
| T9 |
1.85 |
0.08 |
99.63 |
8.23 |
114.88 |
0.37 |
40.33 |
0.97 |
| T10 |
1.85 |
0.38 |
90.25 |
1.83 |
119.94 |
1.03 |
39.06 |
4.33 |
| T11 |
2.00 |
0.19 |
112.67 |
2.74 |
131.04 |
5.16 |
41.70 |
1.10 |
Table 5.
Standards equations for elasticity modulus.
Table 5.
Standards equations for elasticity modulus.
| Equations |
Standard |
Concrete Type |
|
NBR 6118, Strength 20 MPa à 50 MPa. [23] |
Conventional |
|
NBR 6118, Strength 55 MPa à 90 MPa. [23] |
High Strength |
|
Graybeal (2019) [21] |
UHPC |
|
ACI 318 14 [24] |
High Strength |
|
FIB Model Code 2010 [25] |
High Strength |
|
Eurocode 2 (2010) [26] |
High Strength |
|
Sritharan 2003 [22] |
UHPC |
Table 6.
Characteristics values of compression strength (MPa).
Table 6.
Characteristics values of compression strength (MPa).
| |
Average Strength (fcm) |
Standard Deviation |
|
|
| T1 |
122.94 |
3.28 |
117.53 |
107.38 |
| T2 |
110.13 |
3.88 |
103.72 |
95.73 |
| T3 |
124.21 |
6.56 |
113.39 |
108.53 |
| T4 |
125.54 |
4.80 |
117.63 |
109.74 |
| T5 |
106.00 |
1.00 |
104.35 |
91.98 |
| T6 |
131.67 |
2.22 |
128.01 |
115.31 |
| T7 |
135.86 |
9.26 |
120.58 |
119.12 |
| T8 |
106.29 |
1.38 |
104.01 |
92.24 |
| T9 |
114.88 |
0.50 |
114.05 |
100.05 |
| T10 |
119.94 |
1.39 |
117.64 |
104.65 |
| T11 |
128.13 |
7.72 |
115.39 |
112.10 |
Table 7.
Experimental and estimated values of the elasticity modulus.
Table 7.
Experimental and estimated values of the elasticity modulus.
| |
Exp.
Average |
NBR 6118
(2023)
Class I |
NBR 6118
(2023)
Class II |
Graybeal
(2019) |
ACI 318
(2014) |
Model Code
(2010) |
Eurocode 2
(2010) |
Sritharan
(2003) |
| T1 |
46.14 |
60.71 |
50.56 |
42.16 |
49.01 |
49.97 |
49.04 |
43.00 |
| T2 |
41.44 |
57.03 |
48.70 |
39.81 |
46.28 |
48.06 |
47.44 |
40.60 |
| T3 |
43.63 |
59.63 |
50.01 |
42.39 |
49.28 |
49.41 |
49.19 |
43.23 |
| T4 |
46.08 |
60.73 |
50.57 |
42.63 |
49.55 |
49.98 |
49.35 |
43.47 |
| T5 |
40.90 |
57.20 |
48.79 |
39.02 |
45.36 |
48.15 |
46.90 |
39.80 |
| T6 |
48.24 |
63.36 |
51.88 |
43.69 |
50.79 |
51.32 |
50.06 |
44.56 |
| T7 |
47.27 |
61.49 |
50.95 |
44.41 |
51.62 |
50.37 |
50.53 |
45.29 |
| T8 |
38.23 |
57.11 |
48.74 |
39.08 |
45.43 |
48.10 |
46.94 |
39.86 |
| T9 |
40.33 |
59.80 |
50.10 |
40.70 |
47.31 |
49.50 |
48.05 |
41.51 |
| T10 |
39.06 |
60.74 |
50.57 |
41.63 |
48.39 |
49.98 |
48.67 |
42.45 |
| T11 |
41.70 |
60.16 |
50.28 |
43.08 |
50.08 |
49.68 |
49.65 |
43.94 |
Table 8.
ANOVA analysis for compression strength and elasticity modulus.
Table 8.
ANOVA analysis for compression strength and elasticity modulus.
| Factor |
Compression Strength |
Elasticity Modulus |
| F |
p |
F |
p |
| Steel (L) |
0.013524 |
0.911946 |
1.465011 |
0.280225 |
| Steel (Q) |
0.010471 |
0.922472 |
0.744908 |
0.427543 |
| PVA (L) |
0.219450 |
0.659171 |
1.314020 |
0.303548 |
| PVA (Q) |
0.840127 |
0.401408 |
1.575318 |
0.264903 |
Table 9.
Standard vs experimental average of elasticity modulus.
Table 9.
Standard vs experimental average of elasticity modulus.
| |
NBR 6118 (2023)
Class I |
NBR 6118 (2023)
Class II |
Graybeal (2019) – UHPC |
ACI 318 (2014) |
FIB Model Code (2010) |
Eurocode 2 (2010) |
Sritharan (2003) – UHPC |
| T1 |
0.76 |
0.91 |
1.09 |
0.94 |
0.92 |
0.94 |
1.07 |
| T2 |
0.73 |
0.85 |
1.04 |
0.90 |
0.86 |
0.87 |
1.02 |
| T3 |
0.73 |
0.87 |
1.03 |
0.89 |
0.88 |
0.89 |
1.01 |
| T4 |
0.76 |
0.91 |
1.08 |
0.93 |
0.92 |
0.93 |
1.06 |
| T5 |
0.71 |
0.84 |
1.05 |
0.90 |
0.85 |
0.87 |
1.03 |
| T6 |
0.76 |
0.93 |
1.10 |
0.95 |
0.94 |
0.96 |
1.08 |
| T7 |
0.77 |
0.93 |
1.06 |
0.92 |
0.94 |
0.94 |
1.04 |
| T8 |
0.67 |
0.78 |
0.98 |
0.84 |
0.79 |
0.81 |
0.96 |
| T9 |
0.67 |
0.80 |
0.99 |
0.85 |
0.81 |
0.84 |
0.97 |
| T10 |
0.64 |
0.77 |
0.94 |
0.81 |
0.78 |
0.80 |
0.92 |
| T11 |
0.72 |
0.86 |
0.97 |
0.91 |
0.87 |
0.89 |
0.95 |
| Average |
0.72 |
0.86 |
1.03 |
0.89 |
0.87 |
0.89 |
1.01 |
Table 10.
Parameters for tensile strength in the elastic phase ()
Table 10.
Parameters for tensile strength in the elastic phase ()
| Specimen mean size (mm) |
Yield point |
(MPa) |
(MPa) |
| a = 100.215 (width) |
F = 40.67 kN |
13.96 |
9.32 |
| b = 100.105 (depth) |
Displ. = 0.106166 mm |
|
Disclaimer/Publisher’s Note: The statements, opinions and data contained in all publications are solely those of the individual author(s) and contributor(s) and not of MDPI and/or the editor(s). MDPI and/or the editor(s) disclaim responsibility for any injury to people or property resulting from any ideas, methods, instructions or products referred to in the content. |
© 2024 by the authors. Licensee MDPI, Basel, Switzerland. This article is an open access article distributed under the terms and conditions of the Creative Commons Attribution (CC BY) license (http://creativecommons.org/licenses/by/4.0/).

