1. Introduction
The transcription factor in
Bacillus subtilis has been extensively studied for its pivotal role in orchestrating the general stress response [
1]. This alternative sigma factor activates the transcription of a diverse set of genes, enabling the bacterium to adapt to a wide range of environmental stresses, including heat, osmotic stress or nutrient deprivation [
2,
3,
4,
5].
Early studies on SigB primarily focused on its regulation and activation mechanisms. Research by Hecker et al. [
6] highlighted the role of SigB in stress-induced gene expression and identified key components of its regulatory network. SigB itself is regulated by a mechanism involving anti-sigma, anti-anti-sigma factors and additionally by phosphatases that act upstream of the “anti” factors. Under regular (stress-free) growth conditions SigB is inactivated by binding of anti-σ factor, RsbW . When the cell detects stress, the phosphatases RsbP and/or RsbU dephosphorylate RsbV that subsequently binds to RsbW and SigB is released from RsbW. Free SigB is able to form holoenzyme with RNA polymerase, leading to transcription initiation of SigB-dependent genes, including its own operon [
7,
8,
9,
10]. These studies established the foundation for understanding the hierarchical and dynamic nature of SigB regulation.
In recent years, advancements in transcriptomic and computational biology have facilitated more comprehensive analyses of the SigB regulon [
3,
4,
11,
12]. Complementary to experimental techniques, computational simulations have emerged as powerful tools to model and predict the behavior of regulatory networks. For instance, work by Narula et al. [
13] employed mathematical modeling to simulate SigB activation dynamics, providing a quantitative framework to study its regulatory properties. Kinetic analysis of SigB regulon was presented in our previous study [
14].
Despite significant progress, there remains a gap in fully understanding of SigB impact on global protein level. This paper builds on my previous analysis and simulation of the SigB regulatory network performed using transcriptomic data [
15], from this paper I adopted the chemical and mathematical equations and used them in combination with original proteomic time series (PRIDE accession number PXD048690) in order to get the results related to protein expression.
This study aims to build on these foundations by providing a detailed quantitative analysis of the SigB regulatory network at the proteome level through computational simulations. By leveraging advanced computational tools and comprehensive proteomic datasets, I seek to elucidate the dynamic interactions and regulatory mechanisms controlling SigB, thereby enhancing our understanding of bacterial stress response strategies.
2. Materials and Methods
Data Acqusition
A previously published data were used (PRIDE accession number PXD048690). Briefly - The spore fraction of the bacterial culture at time zero was determined using the heat shock method,
B. subtilis culture grew in defined liquid medium. Samples for mass spectrometry were collected at ten-minute intervals (0, 10, 20, 30, 40, 50, 60, 70, 80, 90, 100, 110, 120, 130 min), experiments were run in three biological replicates. A total of 2,191 proteins were identified quality control passed 2,063 unique proteins. The values in each time point for each individual protein were averaged to form time series of protein expression. The resulting time series for individual proteins were smoothed and subsmapled to one minute time interval using B-spline as coded by Jonas Lundgren [
16], and the time series for SigB, RsbW, RsbV, RsbU and RsbP were used in the presented simulations. Their time series are given in supplementary file S1.
3. Results and Discussion
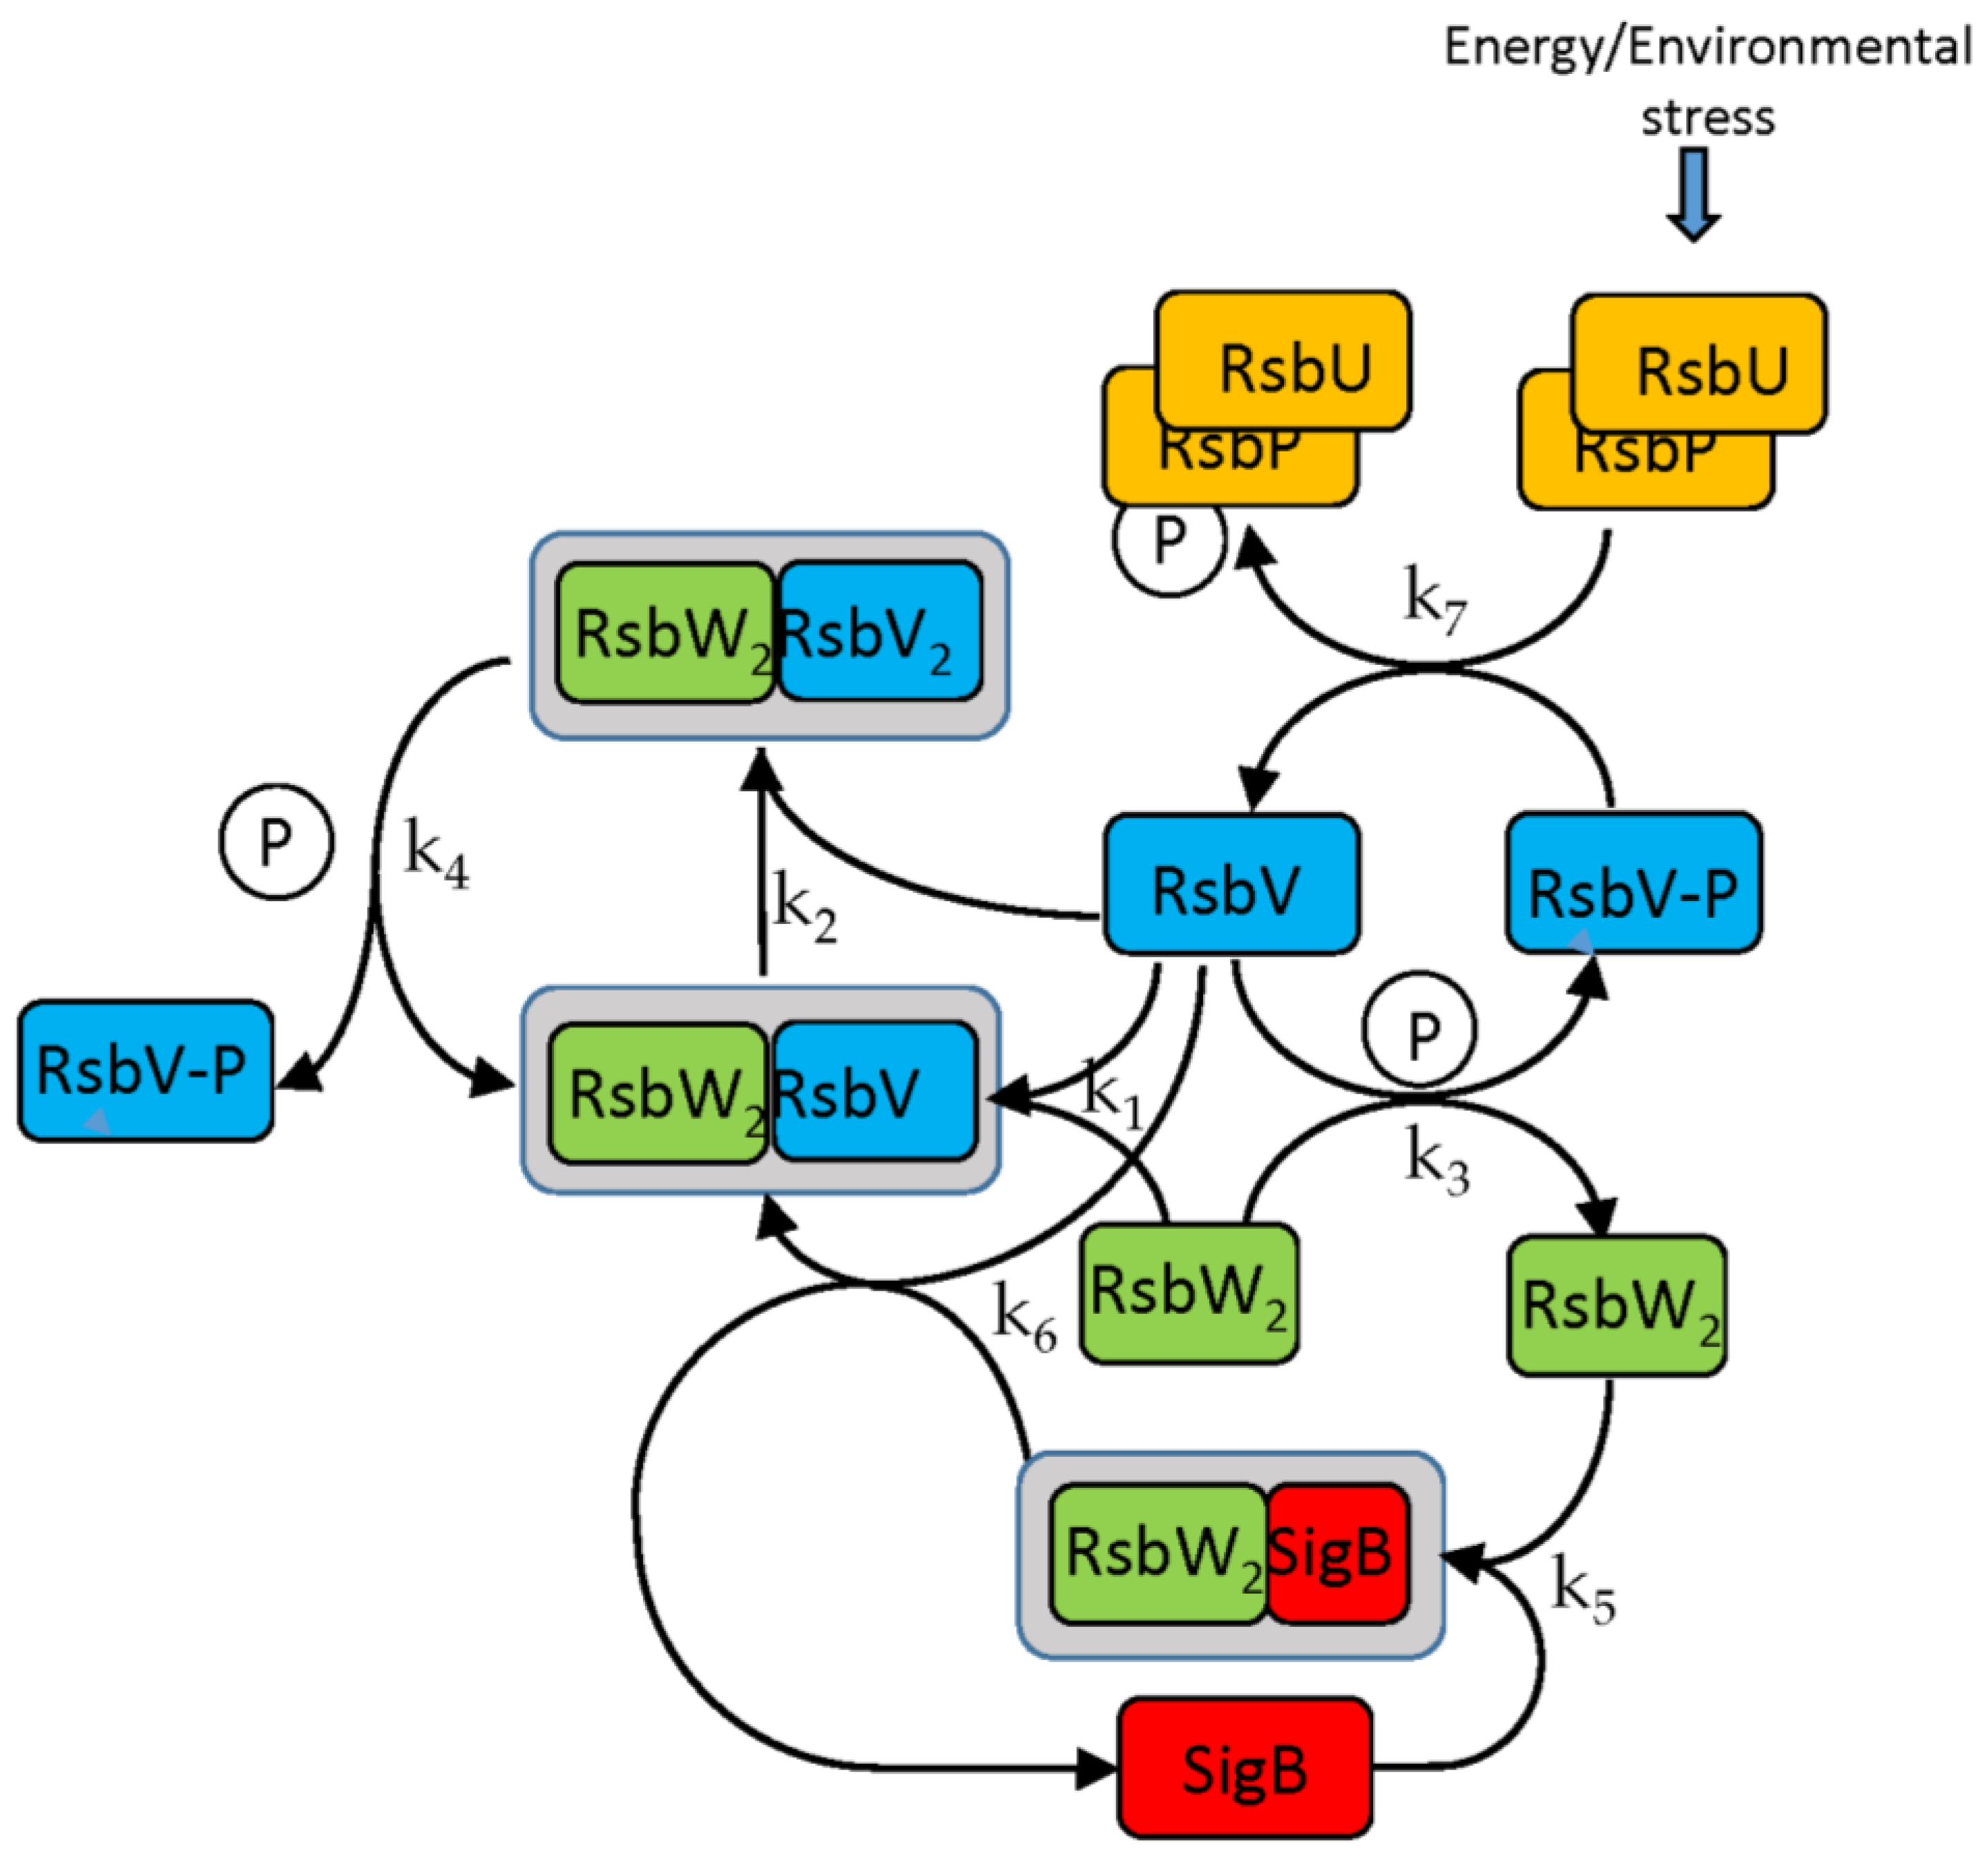
The SigB regulatory network consists of five principal factors: SigB, anti-sigma factor RsbW, anti-anti-sigma factor RsbV and two phosphatases RsbP and RsbU. The regulation starts at anti-anti-sigma factor RsbV which can be dephosphorylated by two phosphatases, RsbP and RsbU. RsbW readily dimerizes to RsbW
2 which is bound by dephosphorylated RsbV to release SigB from its complex with RsbW. RsbW also has a protein kinase activity that phosphorylates and inactivates RsbV (the complete scheme comprises several more chemical reactions and is given by the equations ch1-ch8 and
Figure 1).
3.1. The Model
The SigB network is formally described by a set of biochemical equations (ch1- ch8) [
13] and the model is formed by differential equations a1-a10 [
15] derived from the chemical equations capturing dynamics of the system. The following equations describe interactions among the molecules of the network (the anti-sigma factor RsbW readily dimerizes and acts in the biochemical reactions as a dimer [
17]).
Binding of anti-sigma RsbW
2 and anti-anti-sigma RsbV
Phosphorylation of anti-anti-sigma factor by anti-sigma factor
Binding of sigma factor to anti-sigma factor
Displacement of SigB by RsbV in complex with RsbW
2
Dephosphorylation of anti-anti sigma factor by RsbU RsbP
The measured values of SigB, RsbV and RsbW were considered as composed of the free forms together with the forms bound in the complexes (Eq. a1-a3) as given by the chemical equations above. The measured expression profile includes both synthesis and degradation that, therefore, does not have to be considered separately. In the next equation the following abbreviated notation will be used: V=RsbV, W=RsbW, S=measured total amount of SigB, AS=measured total amount of RsbW, AAS=measured total amount of RsbV. Index f=free form of the factor.
Measured amount of SigB, AS and AAS comprised its free form and the form bound in the complexes.
By differentiating of Eq. a1-a3 and the kinetic equations of ch1-ch8 we get
The constants k
i – k
7are given in
Table 1.
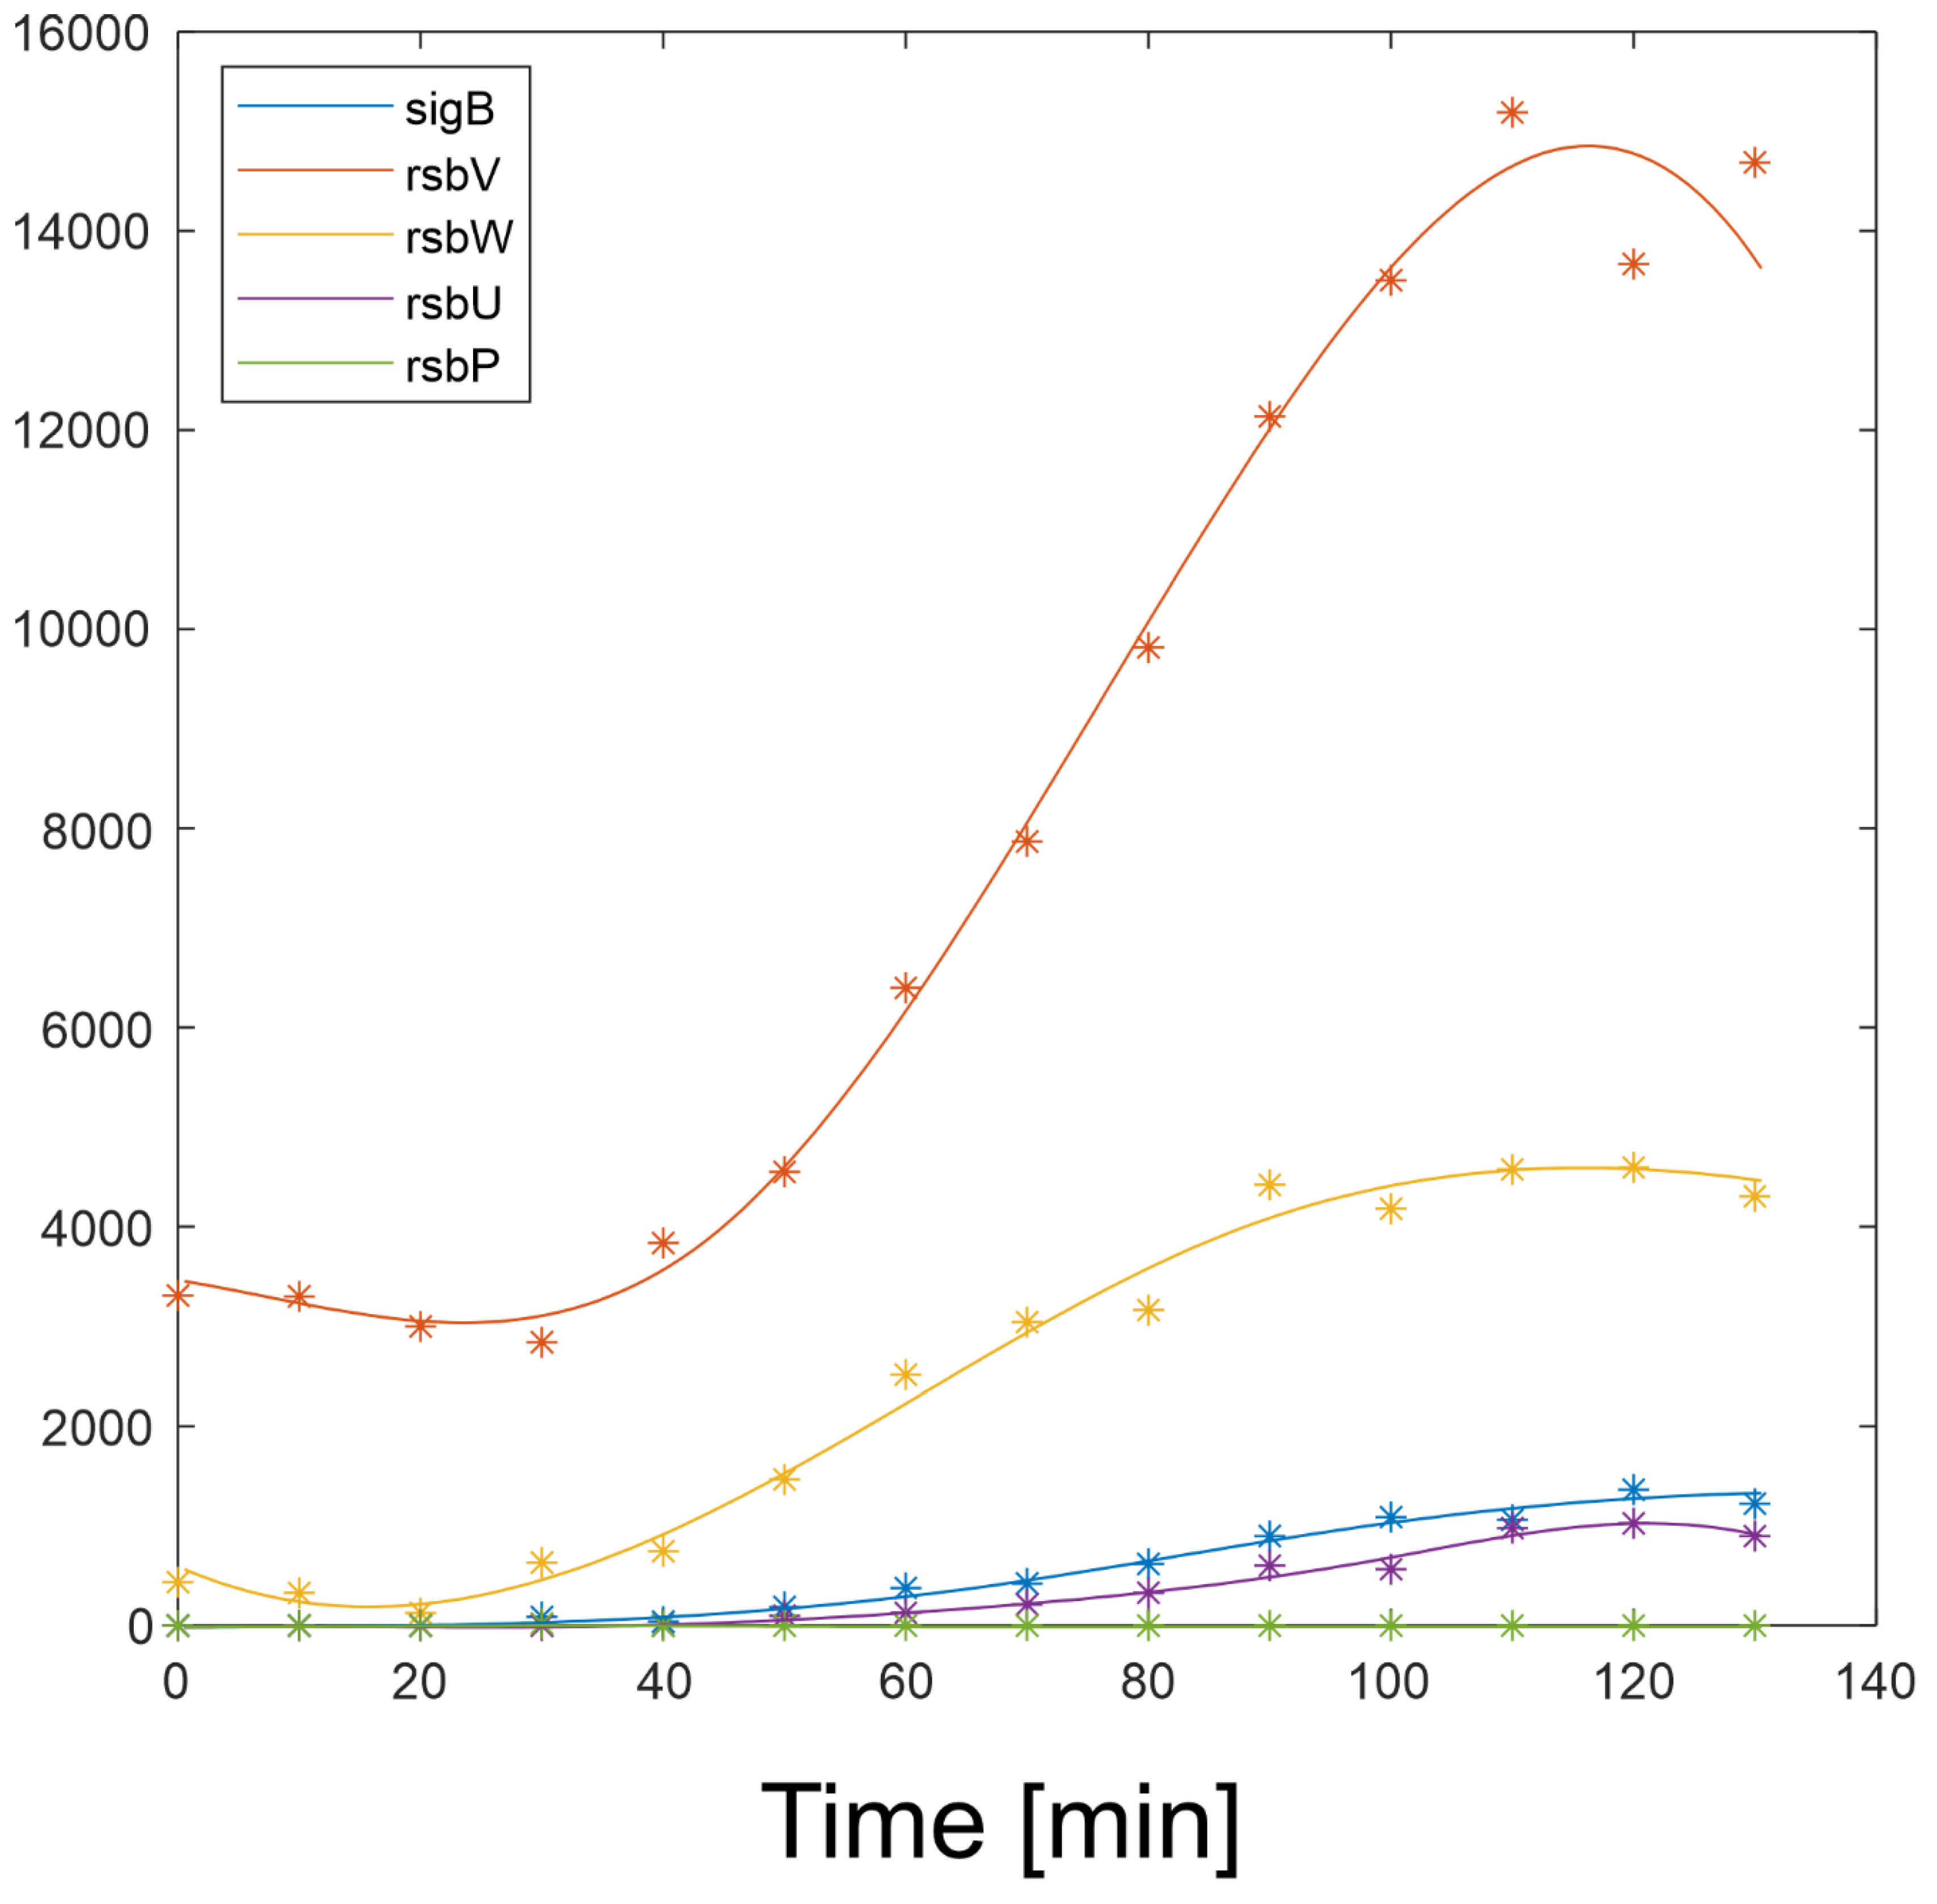
Expression profiles and their derivatives of SigB, RsbW, RsbV (S, AS and AAS), RsbP and RsbU are readily available and their expression profiles are shown in
Figure 2 and are available in Supplementary file 1. The equations a4-a10 were solved numerically in Matlab.
In order to determine the reaction of the network to varying amounts of components of the network and the values of the kinetic constants, the profiles in
Figure 2 were used in the simulations given below.
3.2. Influence of RsbU
In the following paragraphs I tested the influence of the factors controlling the amount of free SigB. As the
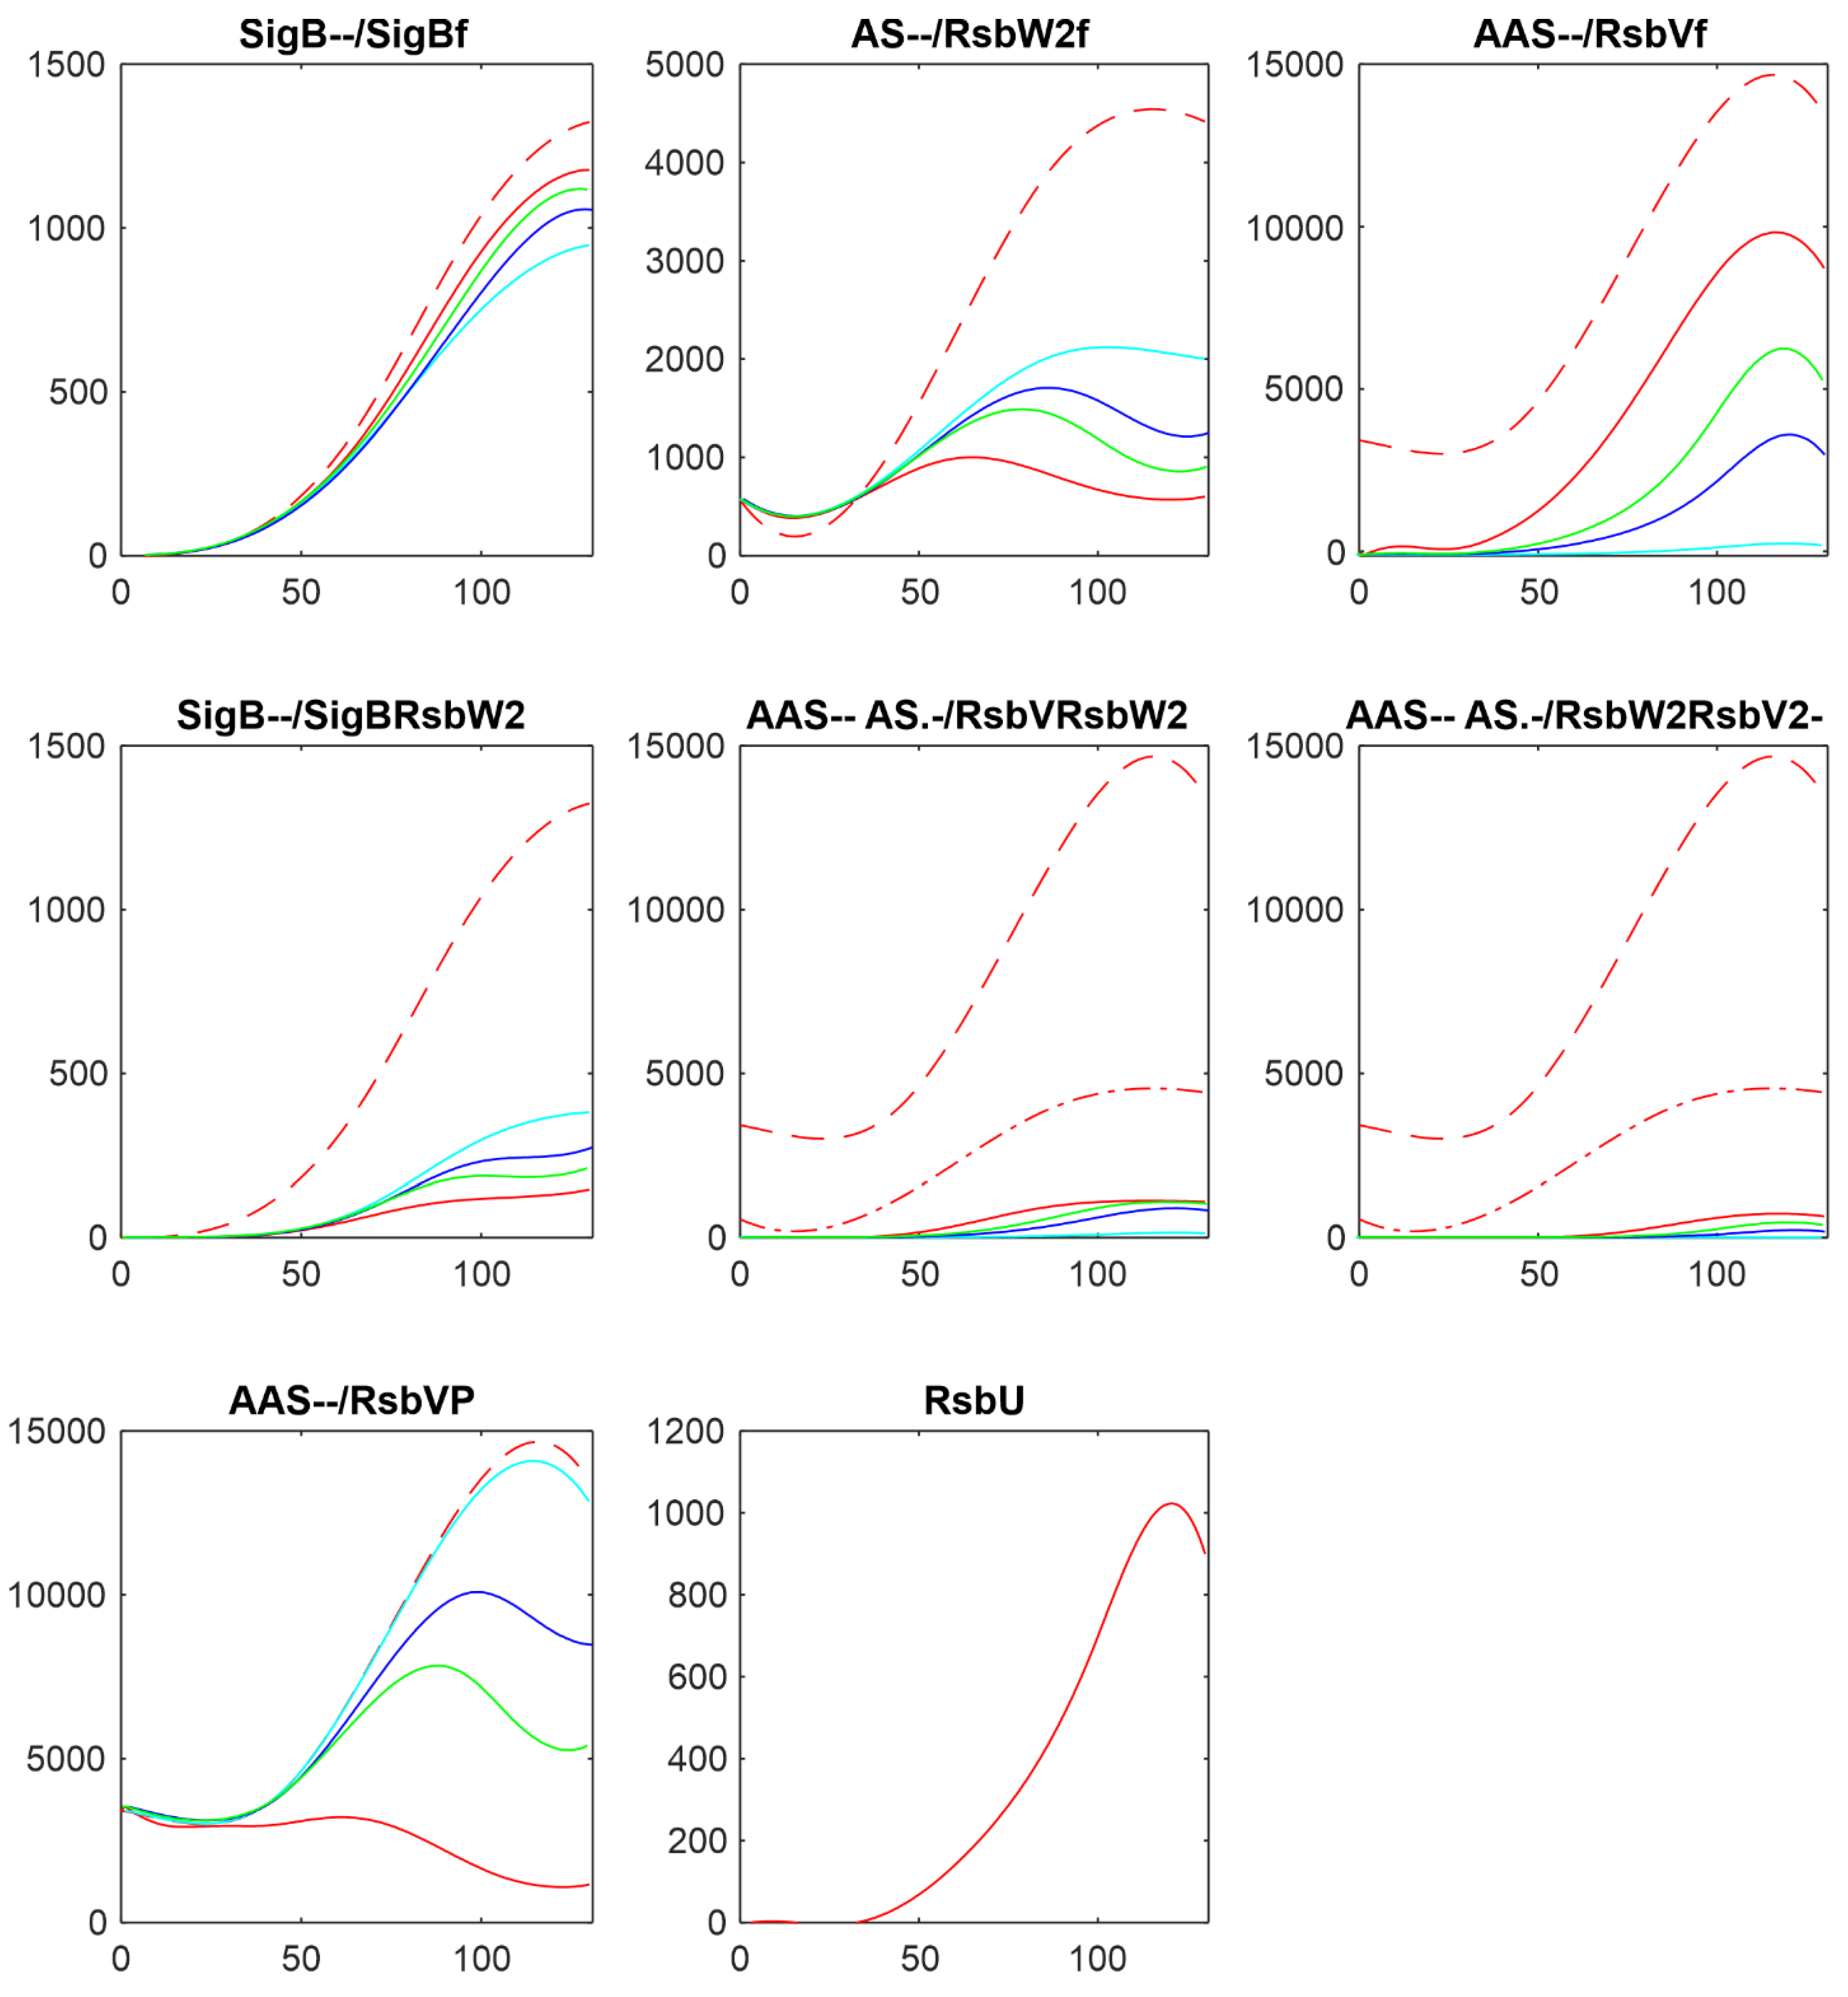
Figure 1 and the references mentioned in the introduction show, the free SigB amount is determined by the activity of phosphatases RsbU and RsbP which dephosphorylate anti-anti-sigma factor RsbV which than binds anti-sigma factor and frees SigB. Therefore at first I tested the influence of the changes in amounts of RsbU. As mentioned above, the amount of RsbP was so low that it did not contribute to the regulation and was not considered in the simulations. Results of the simulation for changing amount of RsbUare shown in
Figure 3.
Figure 2 shows that with the given amount of RsbU almost all RsbV was dephosphorylated. With the decreasing amount of RsbU the amount of phosphorylated RsbV increased and consequently the ant-anti-sigma factor RsbW
2 was freed from its complexes with RsbV, and RsbW
2 could bind more of the sigma factor SigB. As a result, the amount of free SigB decreased. It also can be seen that while RsbU amounts ranged from its maximal value down to almost zero, the resulting amounts of SigB were influenced in a much lower range. This was caused by additional mutual reactions of anti- and anti-anti- factors which did not allow a full block of SigB by RsbW
2 which is partially bound in other complexes or exists in a free form given by the corresponding chemical equations.
3.3. Influence of Anti-Anti-Sigma Factor RsbV
There are two main players influencing free SigB amount: anti-anti-sigma factor RsbV and anti-sigma factor RsbW
2. The influence of RsbV can be studied by altering its amount and/or altering the rate constant of its dephosphorylation k
7+.
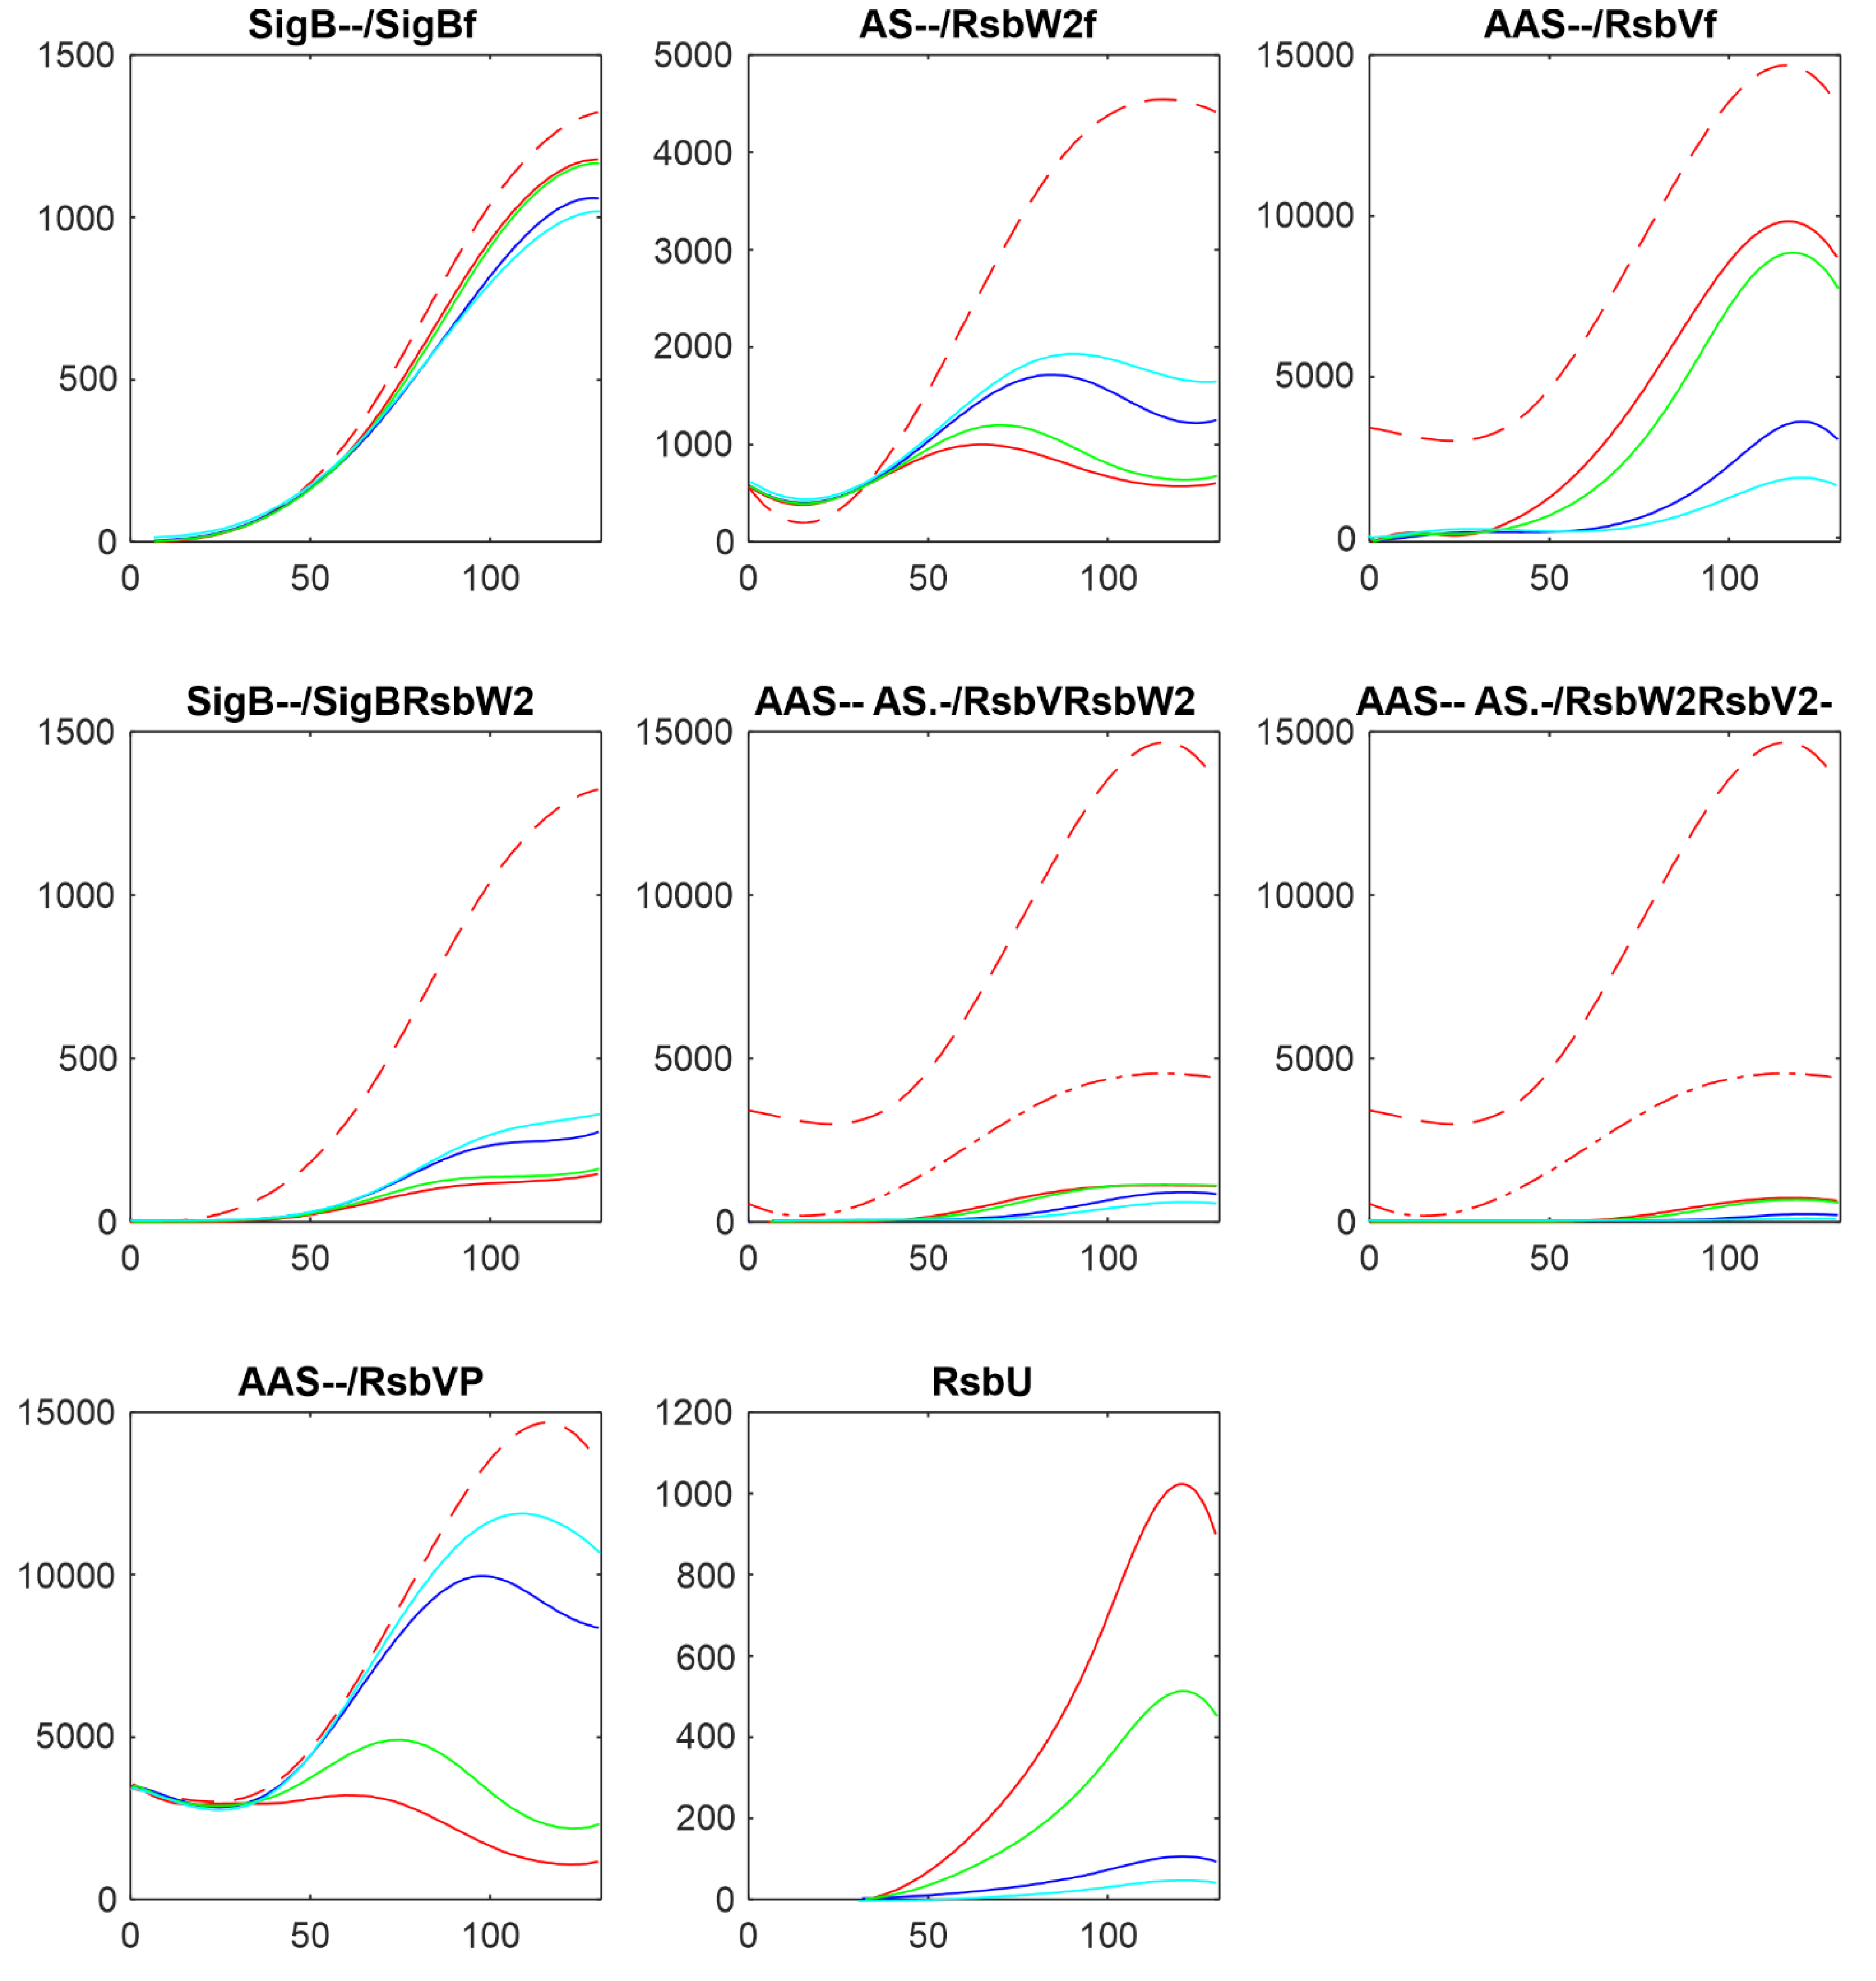
Figure 4 shows the influence of decreasing amount of RsbV by 2,3,and 5 fold.
Figure 4 shows that with decreasing amount of AAS increased the amount of free anti-sigma factor RsbW
2 and the complex of RsbW
2 with SigB. Consequently amount of free SigB decreased. Amounts of free RsbV and RsbW
2 remained relatively high, limiting the range in which the free SigB can be.
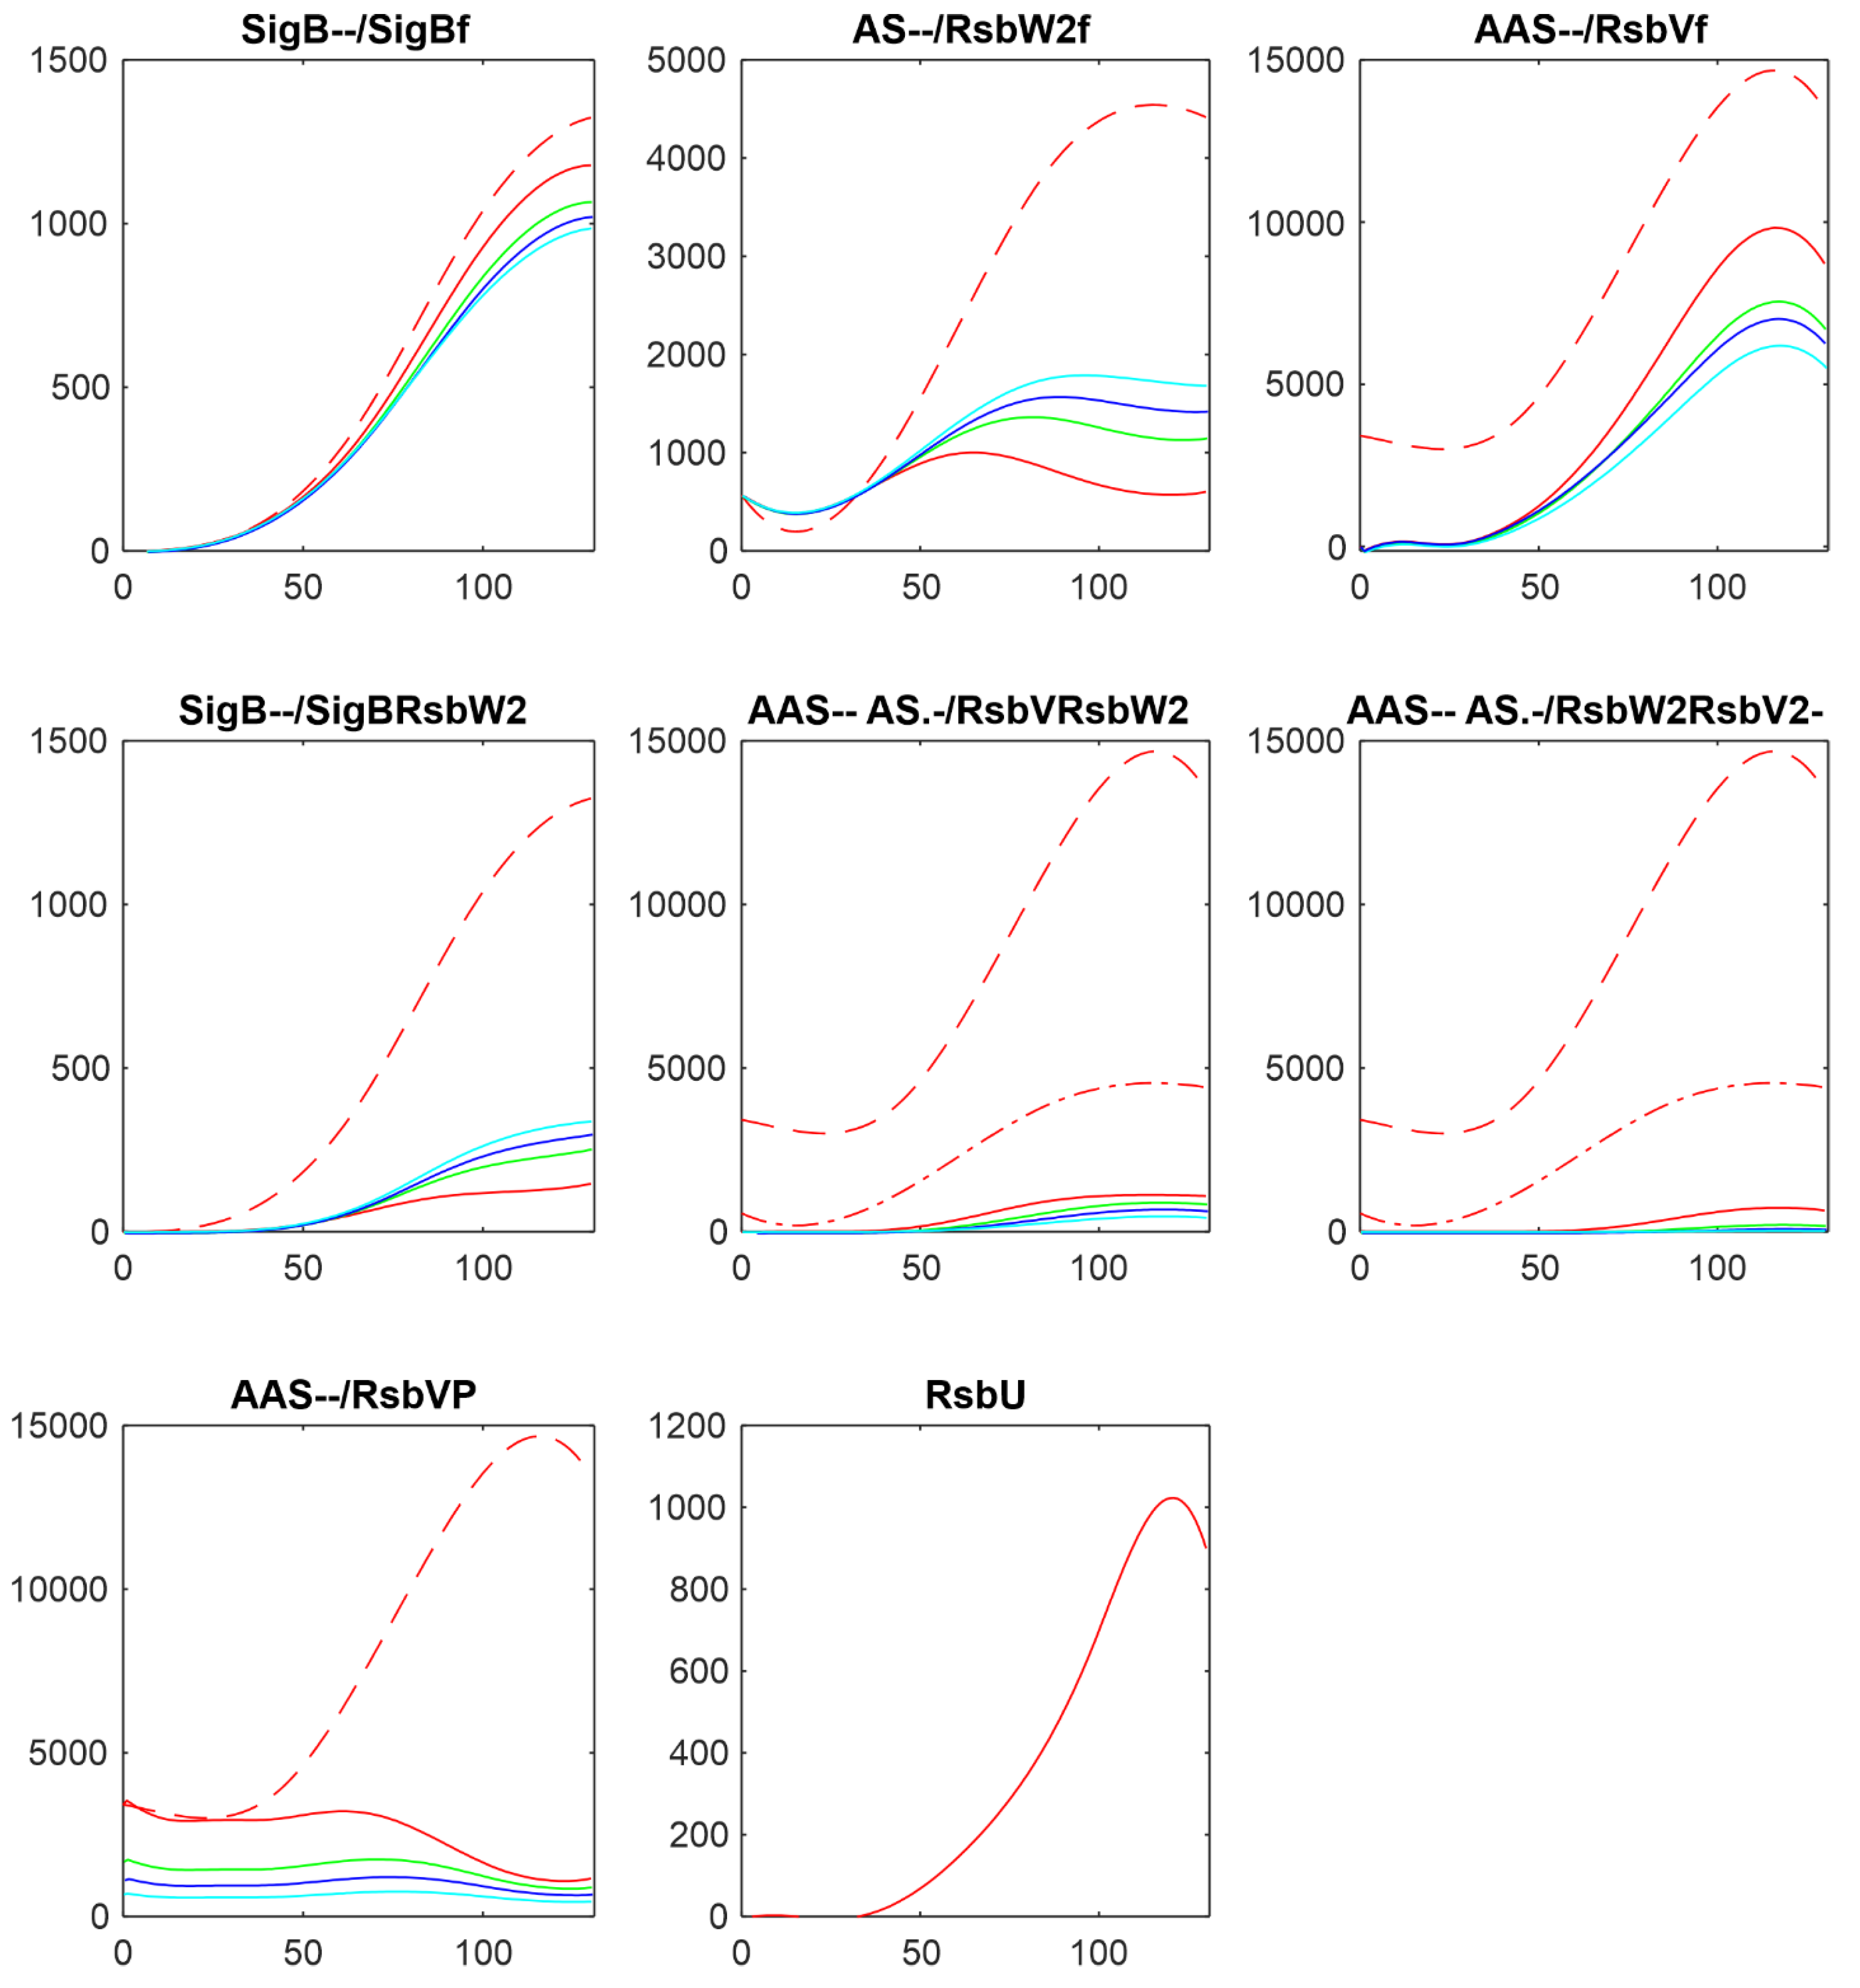
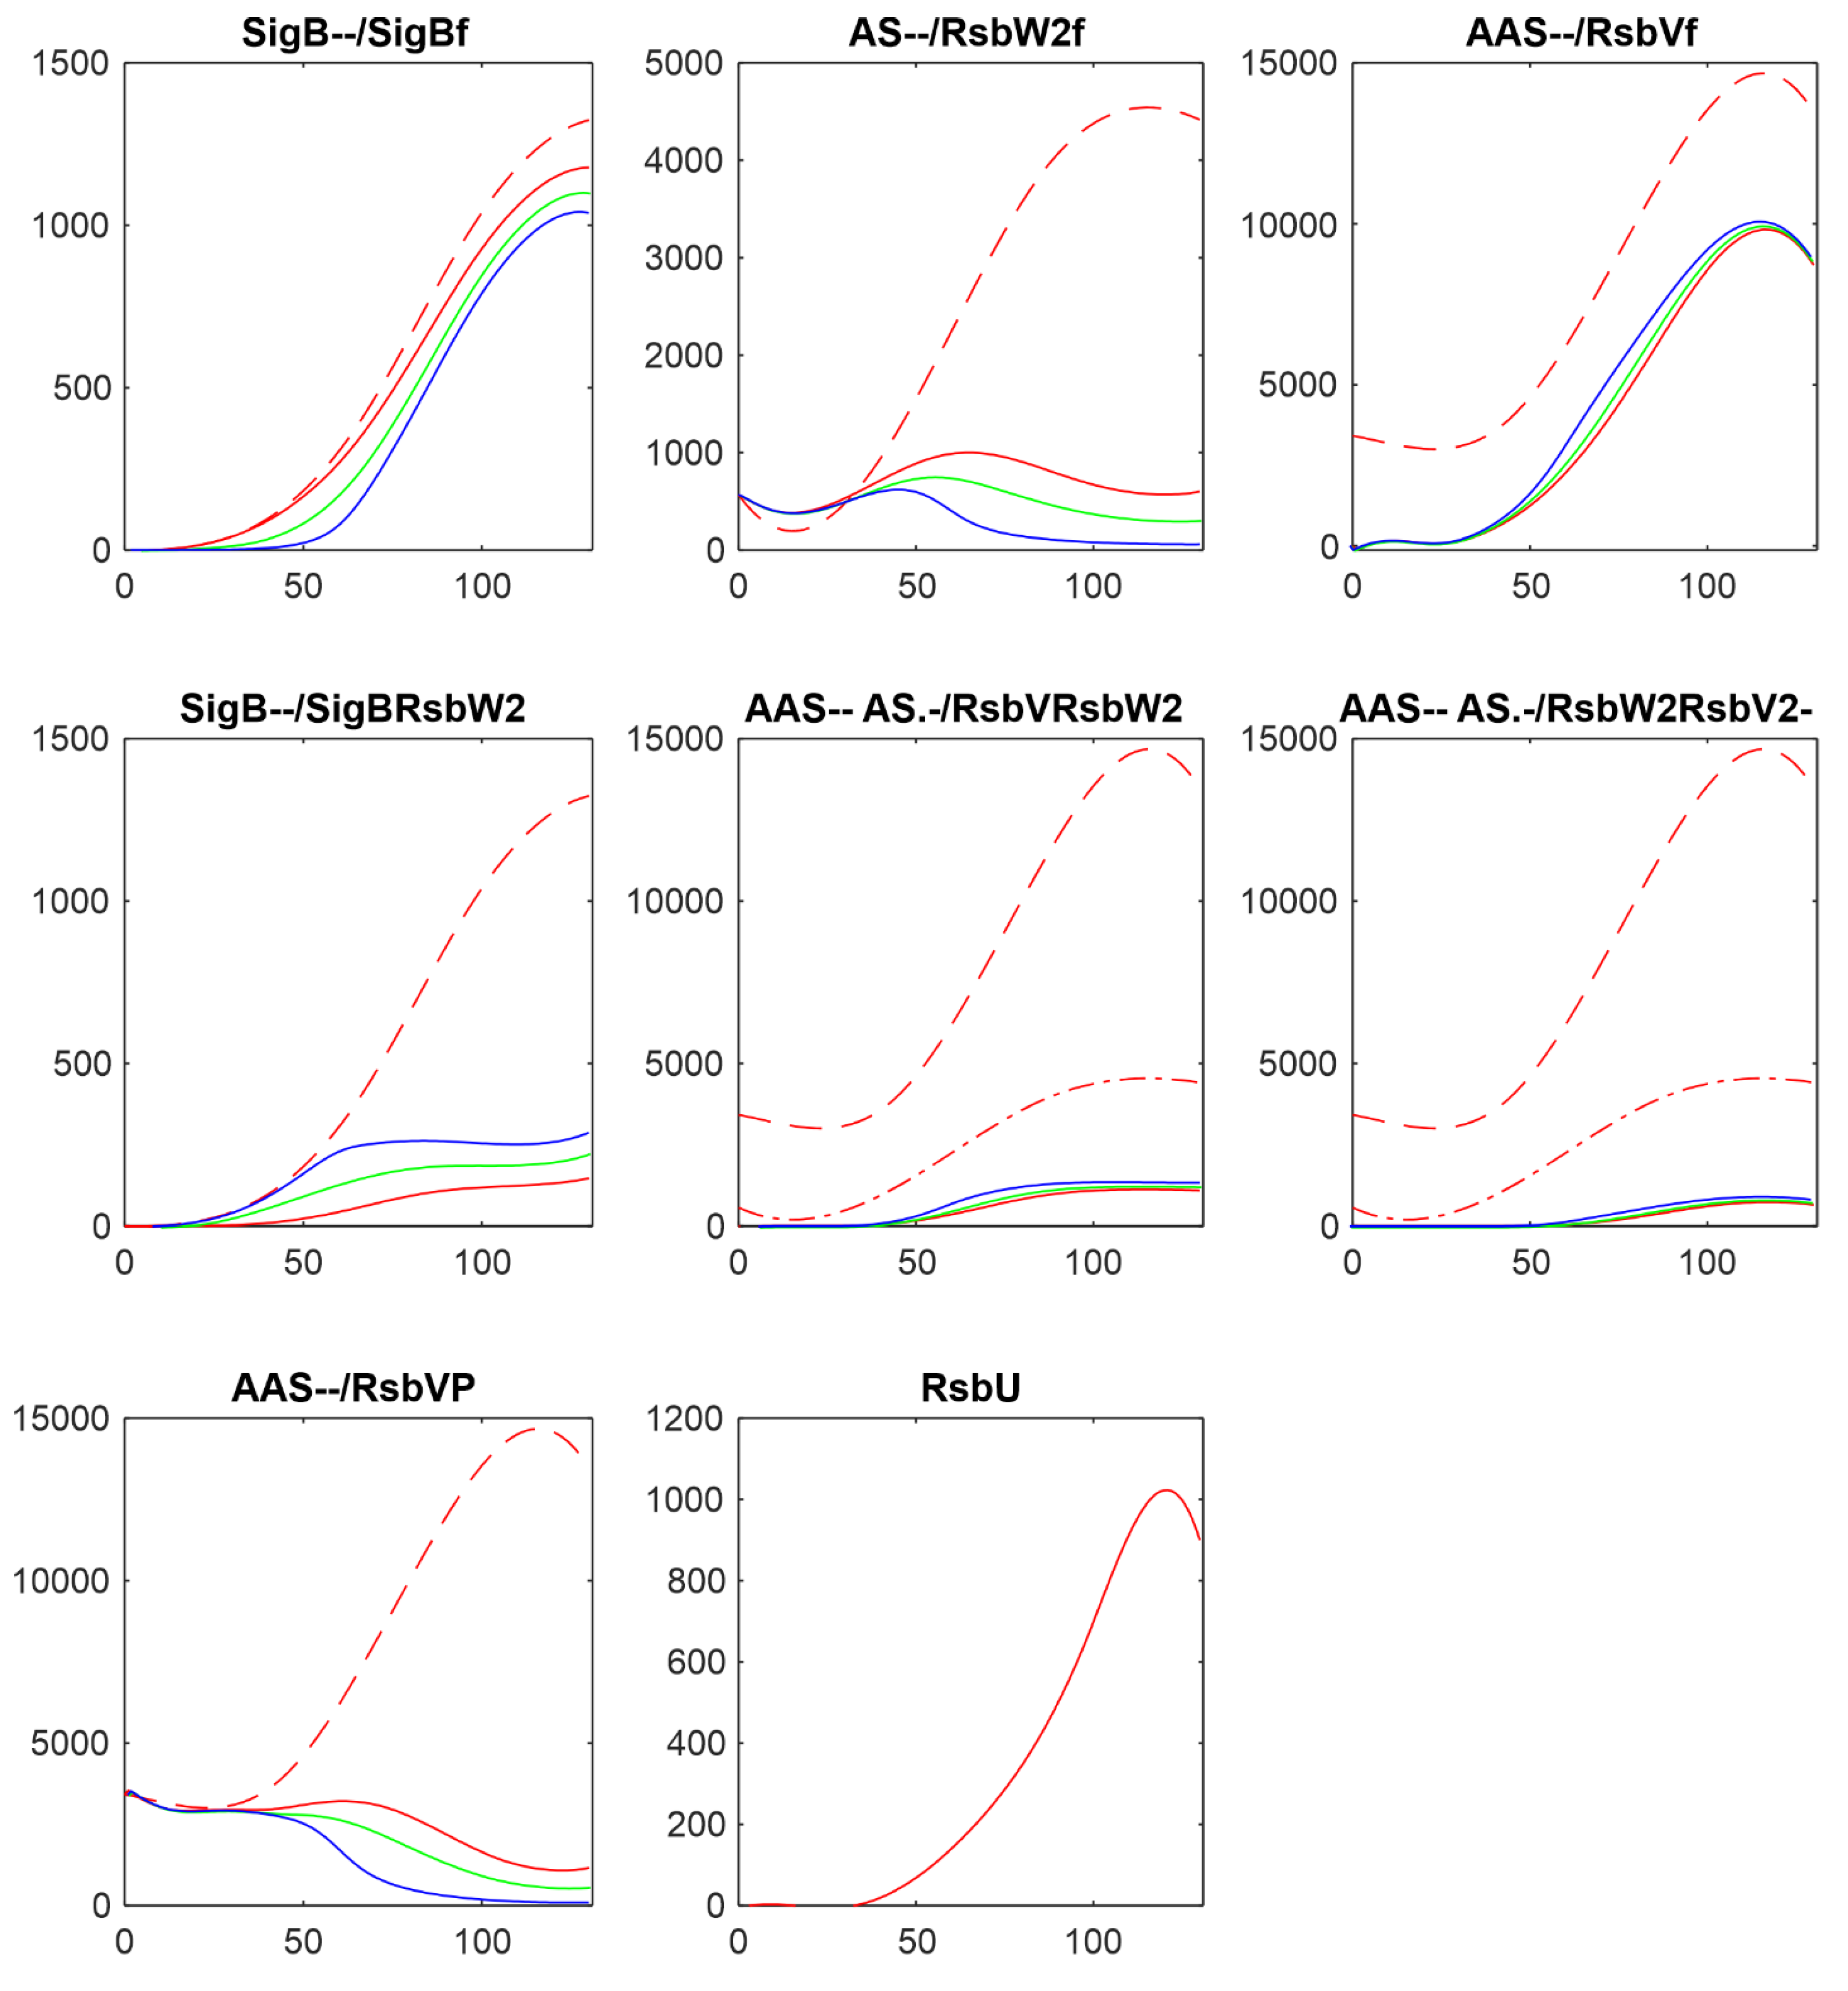
Another way of influencing the amounts of active anti-anti-sigma factor is to alter the rate constant of RsbVP dephosphorylation by RsbU (Eq. ch7). The results are shown in
Figure 5 where the rate constant k
7+ was divided by 5, 10, 100, shifting the reaction in Eq. ch7 against phosphorylation of RsbV.
With the decreasing rate constant k7+ the amount of phosphorylated RsbV increased, the amount of its free form decreased, and the amount of free RsbW2 increased. The increase of RsbW2 means that more of SigB can be bound in the complex with RsbW2 and as a result the amount of free SigB decreased.
Altering amounts of the free anti-anti-sigma factor by changing its amount or changing the rate of its dephosphorylation, changed the amount of free SigB but only in certain limits, which are given by the reactions controlling synthesis of the other complexes.
3.4. Influence of Anti-Sigma Factor RsbW2
Anti-sigma factor RsbW
2 is considered, together with RsbU as the main player as the main player in the controlling the amounts of free SigB. To investigate the reaction of the system on changes in the amount of RsbW
2, I made the simulations multiplicating AS by 2 and 5 and dividing it by 2. Results are shown in
Figure 6.
The decrease/increase in the amount of the anti-sigma factor was reflected in free SigB, as expected, by increase/decrease of the amount of free SigB. The increase of AS led to increase of the amount of the complex SigBRsbW2 and consequent decrease of the amount of free SigB. The effect was large. Increasing amount of ant-sigma factor can attenuate free SigB completely.
3.5. Influence of Rate Constants of the Reaction of SigB with its Anti-Sigma Factor
The last reaction directly influencing the amounts of free SigB is its reaction with anti-sigma factor RsbW
2 given by the equation ch5 with the rate constants k
5+ and k5- which allow to shift the direction of the reaction towards the formation of the complex SigBRsbW
2.
Figure 7 shows how the profiles of the components of the system changed when the reaction was shifted by changing rate constants by multiplication of k
5+ by 10 and 100, while k
5- was divided by the same numbers.
Figure 7 shows that shift of the reaction of SigB with RsbW2 resulted in formation of more of the complex SigBRsbW2 and decrease of the amount of free SigB as expected but in the range lower the one would expect.
3.6. Comparison of Results Obtained from Proteomic and Transcriptomic Datasets
The same analysis as performed here was done with the dataset obtained from a transcriptomic experiment [
15].
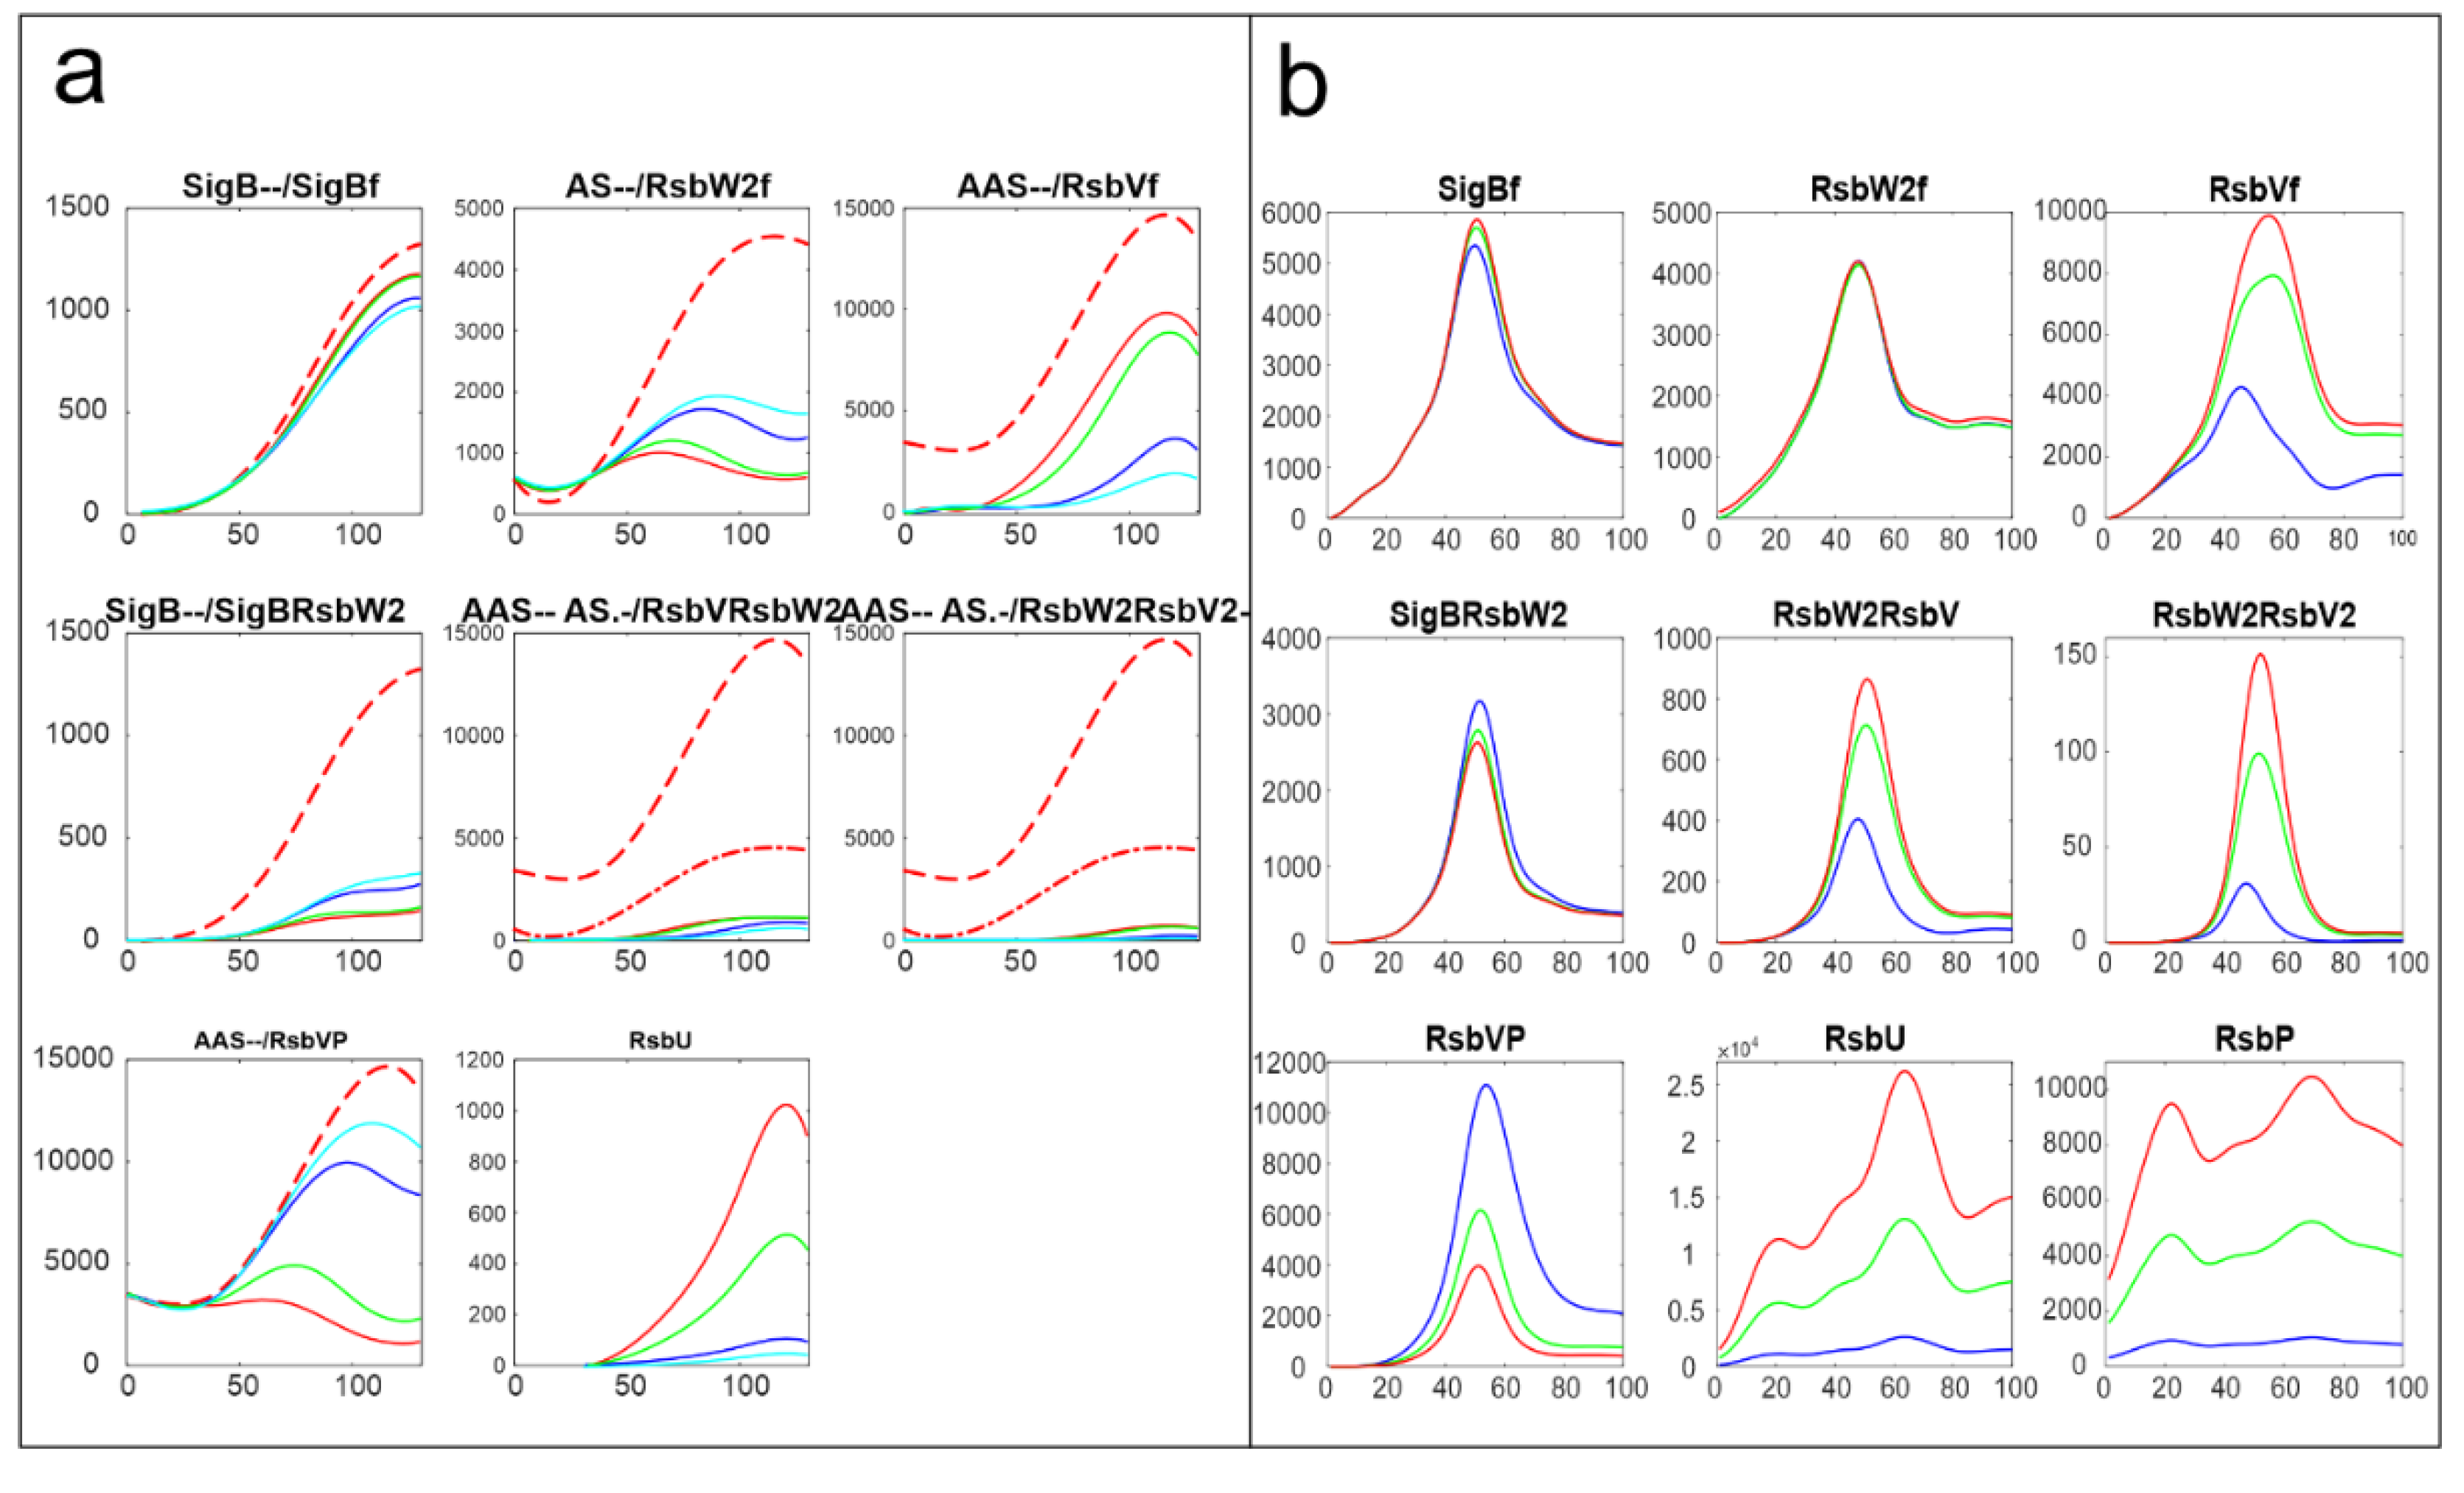
Figure 8 shows comparison of the results of simulation for changes in amounts of phosphatases here RsbU and for the transcriptomic experiment RsbU and RsbP (colors in the figure were organized so that they are the same for the same trend, red-highest, green-middle, blue/cyan – lowest).
Figure 8 shows similar trends the increasing/decreasing amounts of phosphatases are reflected in the same way in both experiments line color order in the graphs of both panels exhibit the same trend. Also the effect on the final amounts on the amounts of free SigB is only limited in comparison with the scale of the changes in the phosphatases. The same trends can be seen for the other simulations as well (data not shown). It shows that the important are the mutual relationship among the molecules and their expression time series of the system, rather than whether they come from proteomic or transcriptomic data.
4. Conclusions
The model not only confirms the experimentally observed behavior of the system what is a trivial requirement for the model to be working, but also allows to see quantitatively how the amounts of each of the components of the network develop over time and during the simulations altering the parameters of the system. The simulations given above show that most important parameters of the system were the activity of the phosphatases, here RsbU, and the activity of the anti-sigma factor. If one wants to control the SigB regulation, most effective way is to overproduce the anti-sigma factor, which can completely stop production of SigB. Influence of the other components of the system are moderate. Another phenomenon was observed during simulation and is related to the initial values used during solution of the differential equations. While the initial values of the proteins SigB, RsbW2, and RsbU were given by the value at time zero, the value of RsbVP must have been set to the AAS at the time point 0. This corresponds to the situation when at the beginning, all of RsbV is phosphorylated. If the initial value for RsbVP is set to lower values, solution of the differential equations creates artifacts. This suggests, that in order for the system to work in reality, the RsbV should also be fully (or at least highly) phosphorylated. This should be proven experimentally.
The same analysis as presented here, was performed with the data coming from microarray experiments monitoring the amounts of mRNA [
15]. Although the two datasets were made differently in different times and different experimental setups, and their time series are not correlated, the results of the simulation give qualitatively the same results. Both show that the influence of the phosphatases are crucial but can influence the amount of free SigB in only a certain range, comparable results can be observed for the other reactions to. This provides quite important conclusion that for the purposes of modeling the important are the mutual relations among the components of the system within one dataset, rather than whether the experiment was conducted on the transcriptome or proteome levels. The models conducted on transcriptome level are often criticized for inconsistency with proteins that actually are the molecules that interact. Results give the same conclusions for both types of experiments.
In summary, the analysis of the SigB regulatory network presented here provides insights into the quantitative principles of regulation of a group of sigma factors to which SigB belongs. It provides a methodology for discovery of quantitative principles for factors whose qualitative aspects have been already established.
Supplementary Materials
The following supporting information can be downloaded at the website of this paper posted on Preprints.org.; Table S1: expression profiles.
Funding
The work was supported institutionally by RVO:61388971, ELIXIR CZ research infrastructure project (MEYS Grant No: LM2023055) including access to computing and storage facilities.
Data Availability Statement
B. subtilis the proteomic data were downloaded from PRIDE accession number PXD048690.
Acknowledgments
This research was funded by ELIXIR CZ research infrastructure project (MEYS Grant No: LM2018131) including access to computing and storage facilities. The work was supported institutionally by RVO:61388971. The author wish to acknowledge Dr. Libor Krásný and Dr. J. Pospisil, for valuable comments during preparation of the manuscript.
Conflicts of Interest
The authors declare no conflict of interest.
References
- Hecker, M.; Pane-Farre, J.; Volker, U. SigB-dependent general stress response in Bacillus subtilis and related gram-positive bacteria. Annu Rev Microbiol 2007, 61, 215–236. [Google Scholar] [CrossRef] [PubMed]
- Eymann, C.; Hecker, M. Induction of sigma(B)-dependent general stress genes by amino acid starvation in a spo0H mutant of Bacillus subtilis. FEMS Microbiol Lett 2001, 199, 221–227. [Google Scholar] [CrossRef] [PubMed]
- Helmann, J.D.; Wu, M.F.; Kobel, P.A.; Gamo, F.J.; Wilson, M.; Morshedi, M.M.; Navre, M.; Paddon, C. Global transcriptional response of Bacillus subtilis to heat shock. J Bacteriol 2001, 183, 7318–7328. [Google Scholar] [CrossRef] [PubMed]
- Petersohn, A.; Brigulla, M.; Haas, S.; Hoheisel, J.D.; Volker, U.; Hecker, M. Global analysis of the general stress response of Bacillus subtilis. J Bacteriol 2001, 183, 5617–5631. [Google Scholar] [CrossRef] [PubMed]
- Reder, A.; Hoper, D.; Gerth, U.; Hecker, M. Contributions of individual sigmaB-dependent general stress genes to oxidative stress resistance of Bacillus subtilis. J Bacteriol 2012, 194, 3601–3610. [Google Scholar] [CrossRef] [PubMed]
- Hecker, M.; Schumann, W.; Volker, U. Heat-shock and general stress response in Bacillus subtilis. Mol Microbiol 1996, 19, 417–428. [Google Scholar] [CrossRef] [PubMed]
- Locke, J.C.; Young, J.W.; Fontes, M.; Hernandez Jimenez, M.J.; Elowitz, M.B. Stochastic pulse regulation in bacterial stress response. Science 2011, 334, 366–369. [Google Scholar] [CrossRef] [PubMed]
- Avila-Perez, M.; van der Steen, J.B.; Kort, R.; Hellingwerf, K.J. Red light activates the sigmaB-mediated general stress response of Bacillus subtilis via the energy branch of the upstream signaling cascade. J Bacteriol 2010, 192, 755–762. [Google Scholar] [CrossRef] [PubMed]
- Dufour, A.; Haldenwang, W.G. Interactions between a Bacillus subtilis anti-sigma factor (RsbW) and its antagonist (RsbV). J Bacteriol 1994, 176, 1813–1820. [Google Scholar] [CrossRef] [PubMed]
- Vijay, K.; Brody, M.S.; Fredlund, E.; Price, C.W. A PP2C phosphatase containing a PAS domain is required to convey signals of energy stress to the sigmaB transcription factor of Bacillus subtilis. Mol Microbiol 2000, 35, 180–188. [Google Scholar] [CrossRef] [PubMed]
- Price, C.W.; Fawcett, P.; Ceremonie, H.; Su, N.; Murphy, C.K.; Youngman, P. Genome-wide analysis of the general stress response in Bacillus subtilis. Mol Microbiol 2001, 41, 757–774. [Google Scholar] [CrossRef] [PubMed]
- Yeak, K.Y.C.; Boekhorst, J.; Wels, M.; Abee, T.; Wells-Bennik, M.H.J. Prediction and validation of novel SigB regulon members in Bacillus subtilis and regulon structure comparison to Bacillales members. BMC Microbiol 2023, 23, 17. [Google Scholar] [CrossRef] [PubMed]
- Narula, J.; Tiwari, A.; Igoshin, O.A. Role of Autoregulation and Relative Synthesis of Operon Partners in Alternative Sigma Factor Networks. PLoS Comput Biol 2016, 12, e1005267. [Google Scholar] [CrossRef] [PubMed]
- Vohradsky, J.; Schwarz, M.; Ramaniuk, O.; Ruiz-Larrabeiti, O.; Vankova Hausnerova, V.; Sanderova, H.; Krasny, L. Kinetic Modeling and Meta-Analysis of the Bacillus subtilis SigB Regulon during Spore Germination and Outgrowth. Microorganisms 2021, 9. [Google Scholar] [CrossRef]
- Vohradsky, J. Quantitative Aspect of Bacillus subtilis sigmaB Regulatory Network-A Computational Simulation. Biology (Basel) 2022, 11. [Google Scholar] [CrossRef]
- Lundgren, J. http://www.mathworks.com/matlabcentral/fileexchange/13812-splinefit, 2010.
- Delumeau, O.; Lewis, R.J.; Yudkin, M.D. Protein-protein interactions that regulate the energy stress activation of sigma(B) in Bacillus subtilis. J Bacteriol 2002, 184, 5583–5589. [Google Scholar] [CrossRef] [PubMed]
|
Disclaimer/Publisher’s Note: The statements, opinions and data contained in all publications are solely those of the individual author(s) and contributor(s) and not of MDPI and/or the editor(s). MDPI and/or the editor(s) disclaim responsibility for any injury to people or property resulting from any ideas, methods, instructions or products referred to in the content. |
© 2024 by the authors. Licensee MDPI, Basel, Switzerland. This article is an open access article distributed under the terms and conditions of the Creative Commons Attribution (CC BY) license (http://creativecommons.org/licenses/by/4.0/).


