1. Introduction
Masonry has been a foundational construction material globally for millennia, contributing significantly to the built environment. Evidenced in some of the most notable historical structures, masonry stands as a testament to the ingenuity and enterprise of ancient cultures throughout history. Masonry has evolved significantly over time, witnessing numerous enhancements in both the constituent materials and the functional role of masonry elements as structural components. Nevertheless, the application of infill panels constructed from traditional Unreinforced Masonry (URM) is constrained in seismic regions due to inadequate ductility. Masonry is a composite material, comprising solid or hollow blocks, mortar or mortar-less joints, grout, and reinforced bars, each exhibiting distinct material properties [
1,
2]. The interfaces between masonry units serve as vulnerable planes due to their limited tensile and shear bond strength in traditional masonry [
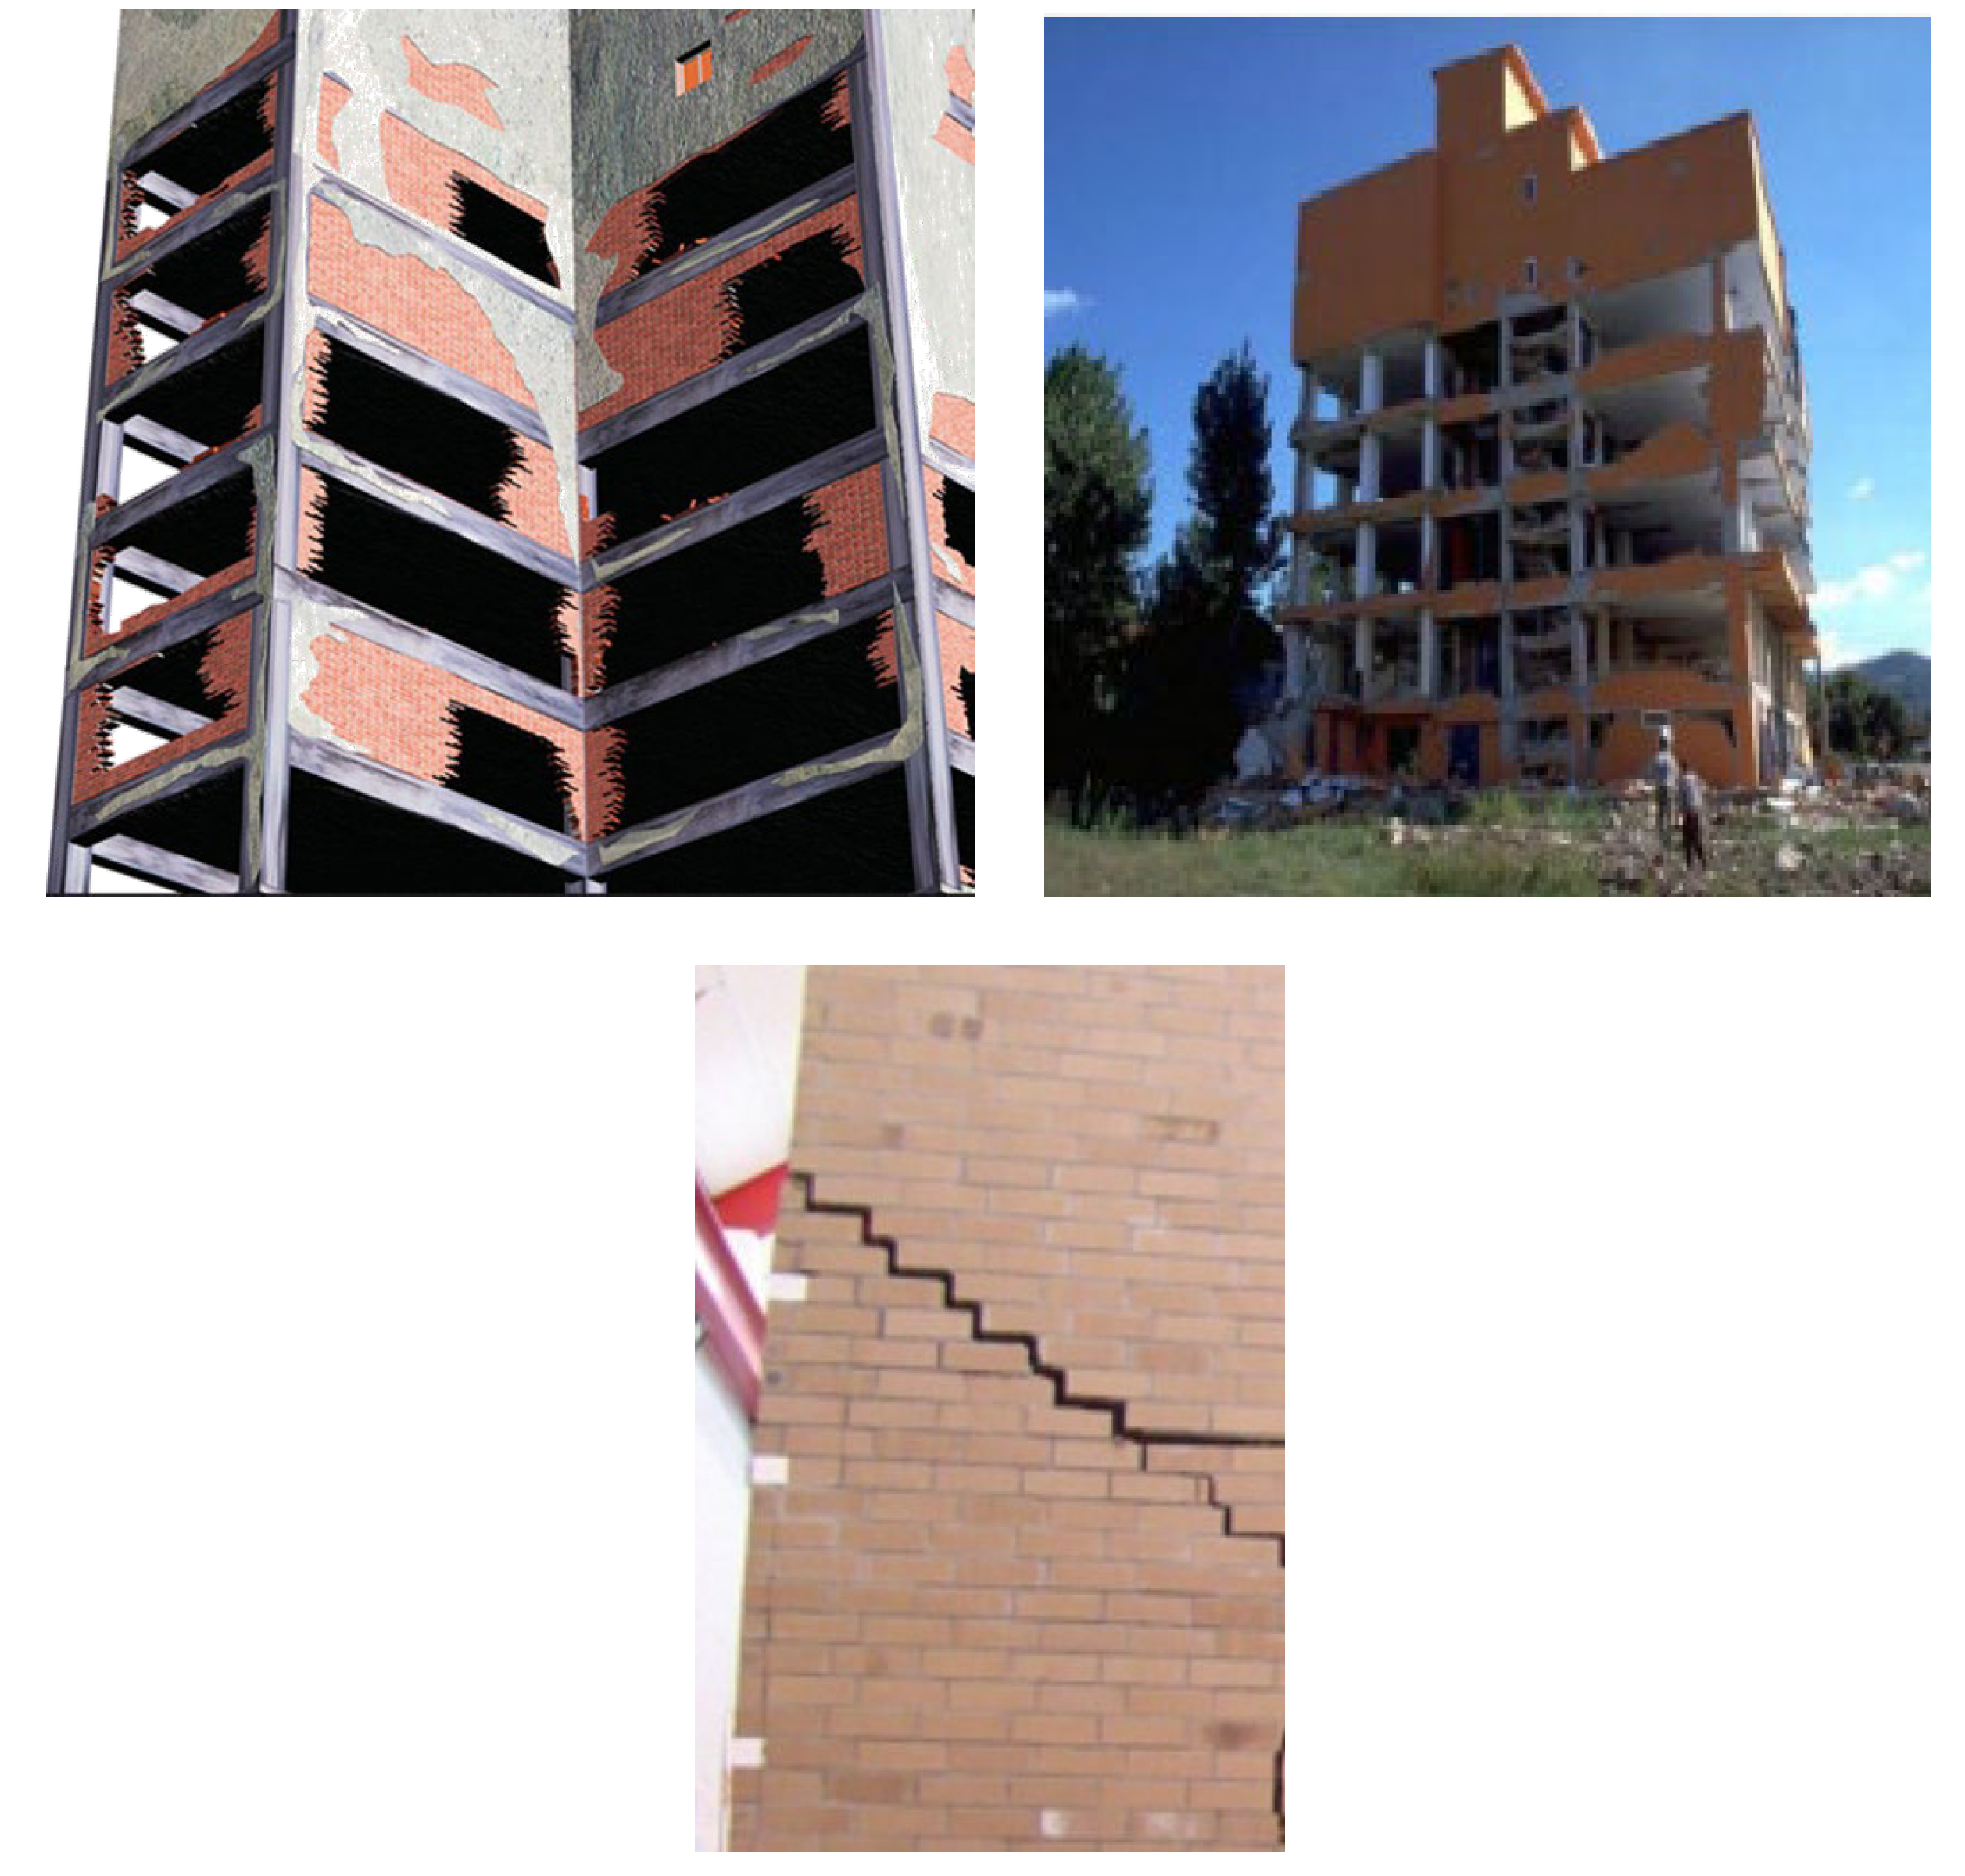
3]. This susceptibility can result in failures, often yielding catastrophic consequences such as loss of life and irreparable damage to structures, as shown in
Figure 1. Damage is observed in traditional masonry structures during earthquakes due to their inefficiency in dissipating the seismic energy introduced [
2]. To enhance the energy dissipation capacity of masonry, certain researchers explore investigations involving mortarless constructions (dry-stacked masonry), while others introduce interlocking mechanisms between brick units (interlocking masonry). Dry-stacked masonry consists of the assembly of bricks or blocks without mortar, resulting in a distinct contact behavior between masonry units compared to traditional masonry with mortar. Noteworthy ancient dry-stack masonry structures, such as the pyramids in Egypt and the ruins in Zimbabwe, continue to exist [
4]. These structures, having withstood numerous seismic events, demonstrate ongoing structural stability and integrity, affirming the resilience of dry-stacked masonry against seismic forces. Madan et al. [
5] and Uzoegbo et al. [
4] conducted research on both in-plane and out-of-plane seismic behavior of masonry walls, culminating in the development of an interlocking block termed Hydraform Interlocking Dry-Stack Block. Their findings suggest that the strength of dry-stack units does not significantly impact the resistance to lateral loads. Instead, the lateral load-bearing capacity of dry-stack masonry is contingent upon the effectiveness of the interlocking mechanism and inter-brick friction within the infill panels.
To enhance the energy dissipation capabilities of framed masonry structures, a novel concept in framed masonry panels, constructed with mortar-less semi-interlocking units, has been developed at the University of Newcastle, Australia [
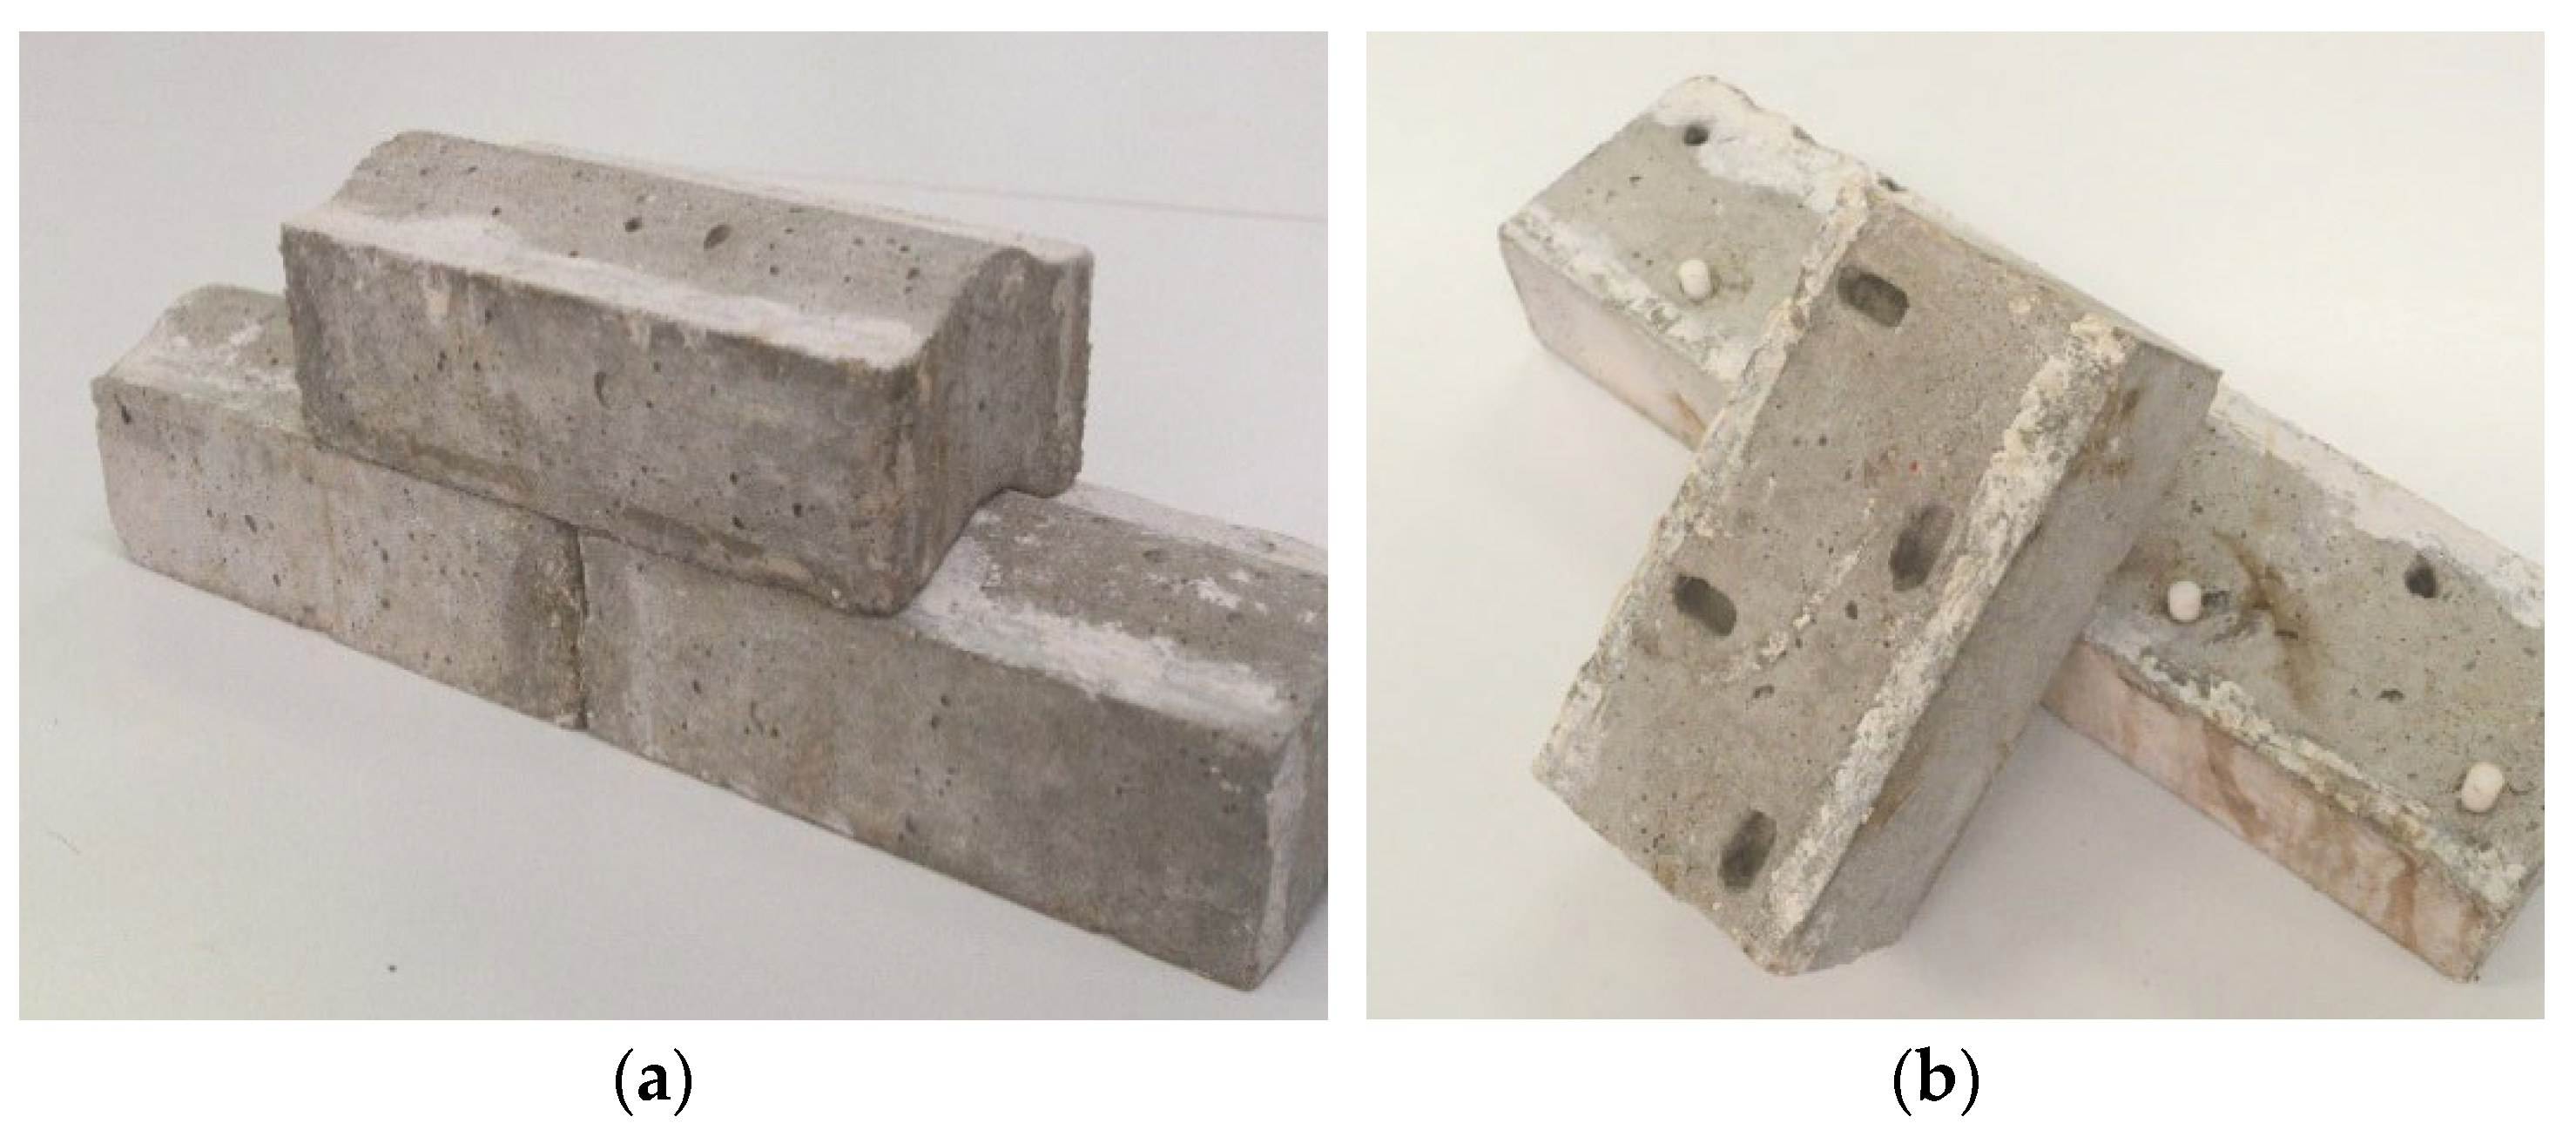
8]. It is referred to as a Semi-Interlocking Masonry (SIM) system, which introduces units in masonry infill panels (SIM panels) designed for relative sliding in-plane while interlocking to prevent relative sliding out-of-plane. As a result, the SIM panel exhibits reduced stiffness and susceptibility to damage, simultaneously amplifying its ability to dissipate seismic energy. Two distinct types of SIM units have been created: topological and mechanical, as illustrated in
Figure 2 [
9]. Topological SIM units leverage the natural contours of the units to facilitate in-plane movement, while mechanical SIM units employ a system of slots and sockets to allow controlled in-plane movement [
10].
The initial design of the SIM system envisioned it as a dry stack, meaning the structure would be assembled solely with blocks, without mortar. However, practical concerns emerged, particularly related to water penetration and thermal properties. Forghani et al. [
11] conducted an investigation into the water penetration and thermal insulation performance of SIM panels using various joint fillers, such as linseed oil-based putty and tape, between the units. Their conclusion highlighted that panels constructed with putty exhibited superior performance in terms of both thermal insulation and resistance to water penetration. Additionally, Hossain et al. [
12] explored the variation of the coefficient of friction of SIM units with different bedding materials, including linseed oil-based putty and tape. Their findings indicated that surfaces treated with putty demonstrated a higher coefficient of friction compared to the other tested surfaces.
A comprehensive assessment of the structural performance of SIM panels was conducted through the testing of six full-scale panels under cyclic in-plane displacement, reaching up to 5% storey drift (100 mm displacement). The analysis focused on evaluating the load-displacement behavior and energy dissipation capacity of the SIM panels. The findings concluded that SIM panels could serve as a viable alternative to URM in-fill panels in seismic regions, given their superior energy dissipation capacity compared to traditional URM [
13]. Therefore, it is imperative to evaluate the viability of the novel panel system in Australia. This study developed an analytical model to evaluate the feasibility of implementing SIM panels as infill components in Australian construction practices. The assessment considered a typical three-story, three-bay structure with 4m x 3m panels subjected to the typical load imposed by Australian Standard AS 1170.4:2007 [
14]. Two distinct analytical models were created—one for the SIM panel with an open gap and another for the SIM panel with a closed gap at the top between the upper edge of the panel and the surrounding frame. The results obtained from the analytical study were then compared with the experimental findings, providing valuable insights into the potential application of SIM panels as a modern-day construction material in seismic regions of Australia.
2. Formulation of Analytical Model
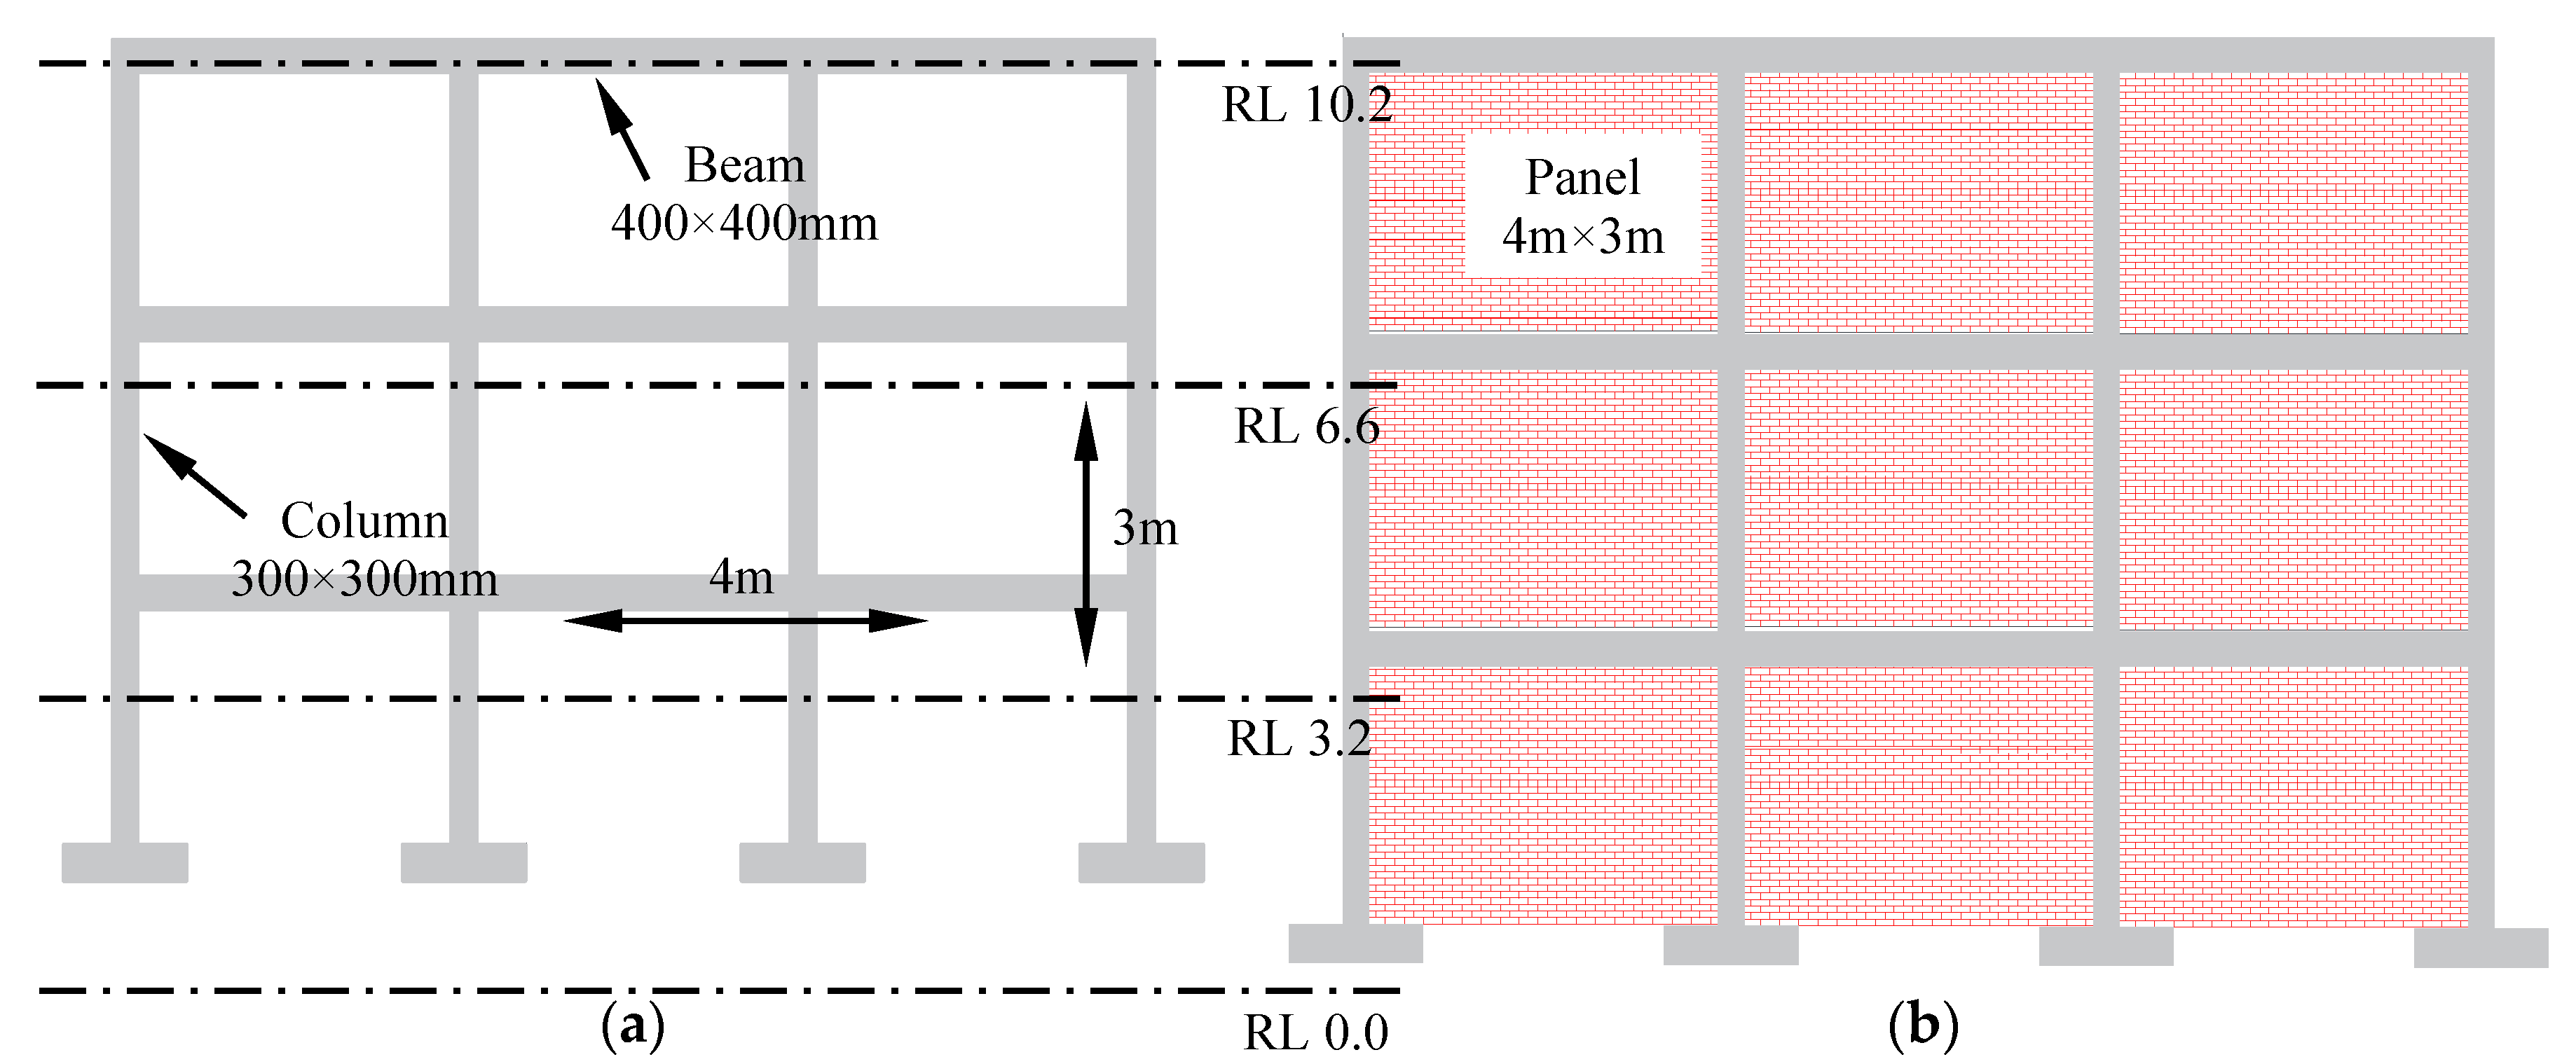
An analytical method has been developed in this study to determine the suitability of SIM panels as a replacement of URM panels. As SIM will be used as an infill panel, it is necessary to quantify the displacement and base shear capacities of the bare frame (no infill), frame with URM panels and frame with SIM panels. The elevation is depicted in
Figure 3, while
Table 1 provides a comprehensive overview of the specific characteristics of both the bare frame and the framed structure with infill panels used in this study to establish a simplified method.
The current study has taken into account the linear elastic behavior of the RC frame along with the nonlinear (frictional sliding) behavior in the SIM panel, as discussed in
Section 2.3. As this comparative study focuses on the behavior of bare frame, traditional masonry, and SIM panels, the interaction of concrete beams and frame remains consistent across all structures. While the study does not specifically address this interaction, the comparative analysis ensures a comprehensive understanding of the infill panel's demands within the broader structural context.
It is important to highlight that the coefficients of friction for SIM panels are based on the topological and mechanical SIM bed joints, with values of 0.75 and 0.72 respectively [
12]. Given the closely aligned coefficient of friction for both SIM units, the analysis in this study focuses solely on panels featuring topological SIM units, as presented in
Table 1. The seismic loading configuration adhered to the standard specifications outlined in the Australian Standard AS1170.4 [
14], specifically following the typical loading configuration for a residential building. Analyzing the structural behavior under seismic forces poses a complex challenge due to the dynamic nature of earthquake loading. The Australian Standard provides various methods for such analyses. In this study, a simplified approach known as the 'equivalent static method' was adopted to assess the behavior of the bare frame, traditional masonry, and SIM panels. This method conceptualizes earthquake loading as a series of static loads applied to each level of the structure. While static analysis is commonly employed in preliminary structural assessments, the equivalent static method is particularly useful for comparative research, as demonstrated in this study.
The base shear (V) of the structure for earthquake actions can be determined using the equivalent static method, as expressed in Equation (1) [
14].
Where
is the probability factor which is a function of design life and importance level of the structure. For this study, assuming a typical design life of 50 years, as commonly adopted in Australia [
16], the probability factor is solely dependent on the importance levels. The consequences of failure corresponding to different importance levels have been adopted from AS 1170.0:2002 [
17]) and are summarized in
Table 2, with the assessment focusing on importance levels 2, 3, and 4 in this study.
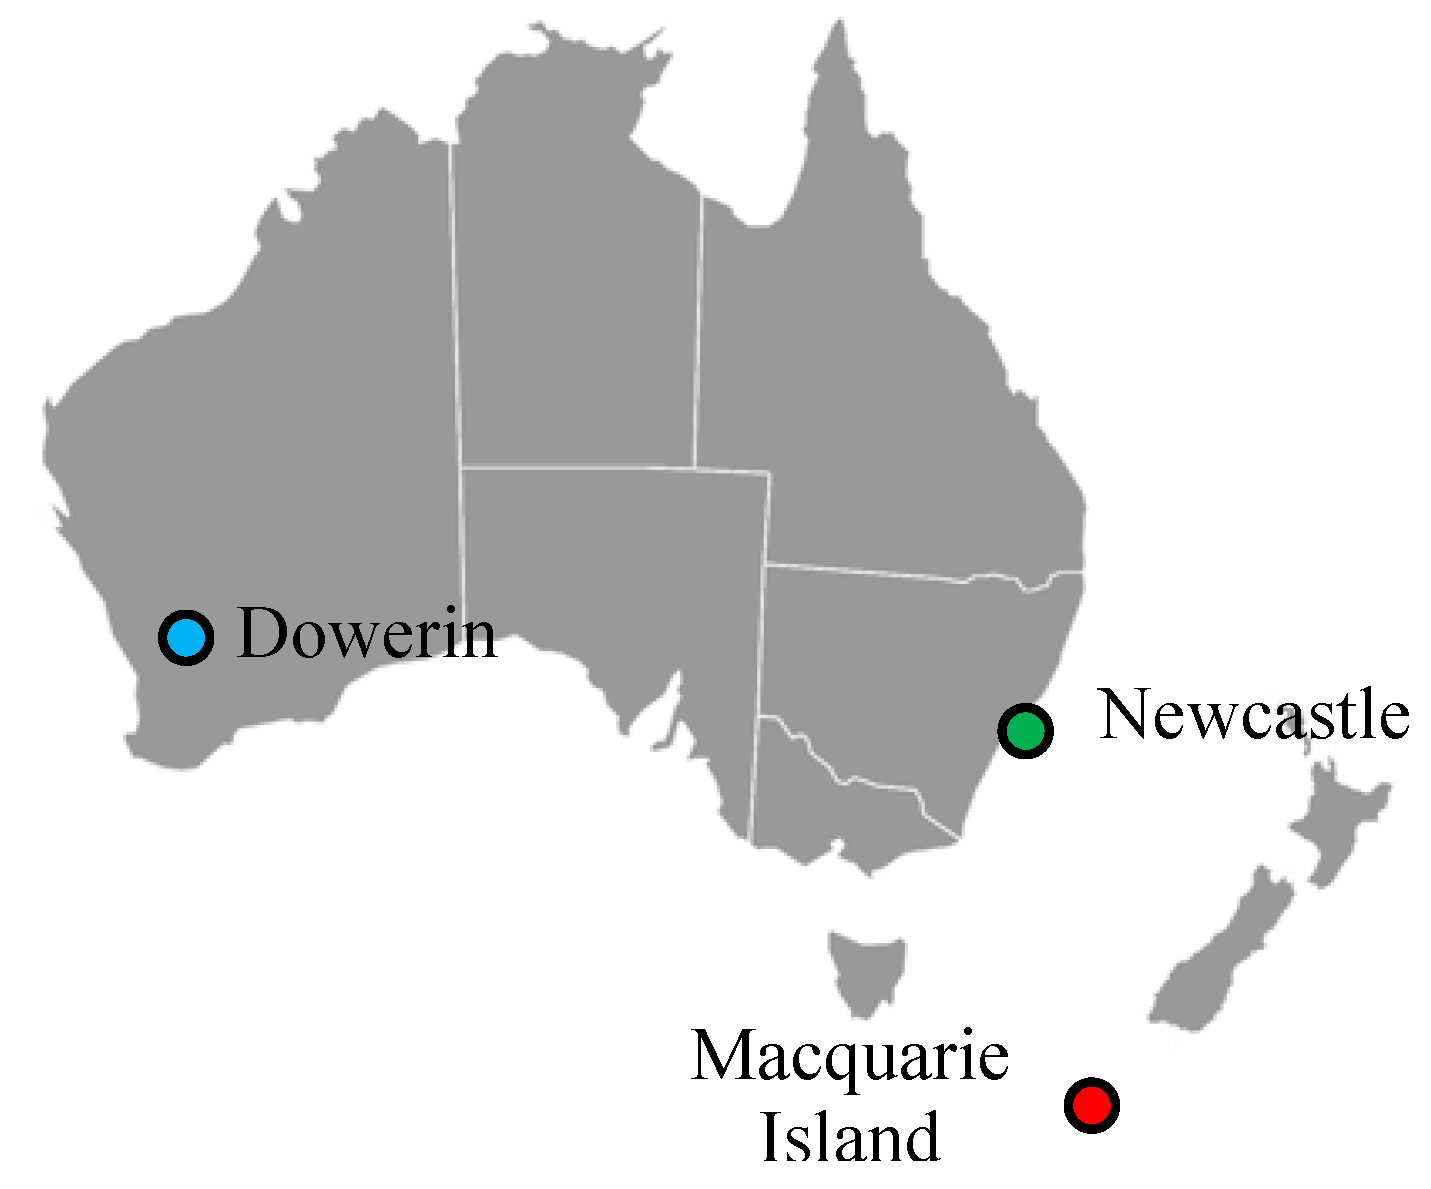
Z is the hazard factor, signifying that the geographic location of the building impacts the magnitude of static loads. Three locations, as shown in
Figure 4 were chosen for this study, categorized as low-risk (Newcastle), medium-risk (Dowerin), and high-risk (Macquarie Island) seismic areas, each associated with distinct hazard design factors (Z).
C
h(T
1) represents the spectral shape factor and is dependent on the fundamental period of the structure and the building’s site class. The fundamental period of the structure (T
1) is determined using the formula T
1 = 1.25k
tk
n0.75, resulting in 0.54 seconds for a braced frame with a building height of 10.2m. This study incorporates two different site sub-soil classes, namely shallow soil C
e and deep or soft soil D
e. The C
h(T
1) value is interpolated to 0.54 according to Australian Standard AS1170.4-2007 based on the specific site sub-soil class [
14].
S
p/µ represents the ratio of the structural performance factor to the structural ductility factor. This factor, as stipulated in AS 1170.4-2007 [
14], is designated as 0.22. The selection of this ratio is contingent upon the material properties and load-resisting mechanisms of the frames, assumed here as a reinforced concrete moment resisting frame.
W
t denotes the seismic weight of the structure, computed as the sum of the weights across all levels. The seismic weight (W
i) at each level is determined using the following Equation (2) [
14]:
The calculated base shear is then distributed at each level using Equation (3) [
14]. Equation (3) outlines a method for determining the lateral force acting on each level of a structure in a seismic analysis. This force is crucial for assessing the structural response to seismic forces and designing buildings to withstand such events.
Where Fi represents the horizontal equivalent static force at the i'th level, hi is the height of the level above the base of the structure, and n is the number of levels in a structure.
In this study, the calculation of equivalent static forces on the structure involved three key criteria: location, importance level, and site class. Utilizing a comprehensive approach, three distinct locations, three importance levels, and two site sub-soil classes across Australasia were selected for the equivalent static analysis. The specific criteria employed for calculating equivalent static forces are detailed in
Table 3. The combination of these criteria resulted in the development and analysis of 18 unique load cases for each structure, as outlined in
Table 4.
A total of 72 load cases for the bare frame, the frame with traditional masonry, and the frame with SIM panels (Type 1 and Type 2, discussed in detail in
Section 2.3) were meticulously analyzed using Strand7, a widely used finite element package for structural analysis in Australia. Strand7 integrates a comprehensive visual environment with robust solvers, providing unparalleled functionality. Users can effortlessly construct structural models (consisting of reinforced, steel, timber members) using an extensive element library, conduct analyses, and review results in real-time through an intuitive interface. Employing linear static analysis for various load cases, the study focused on determining the displacements of the structure based on the results obtained from the Strand7 analysis.
2.1. Modelling strategy of bare frame
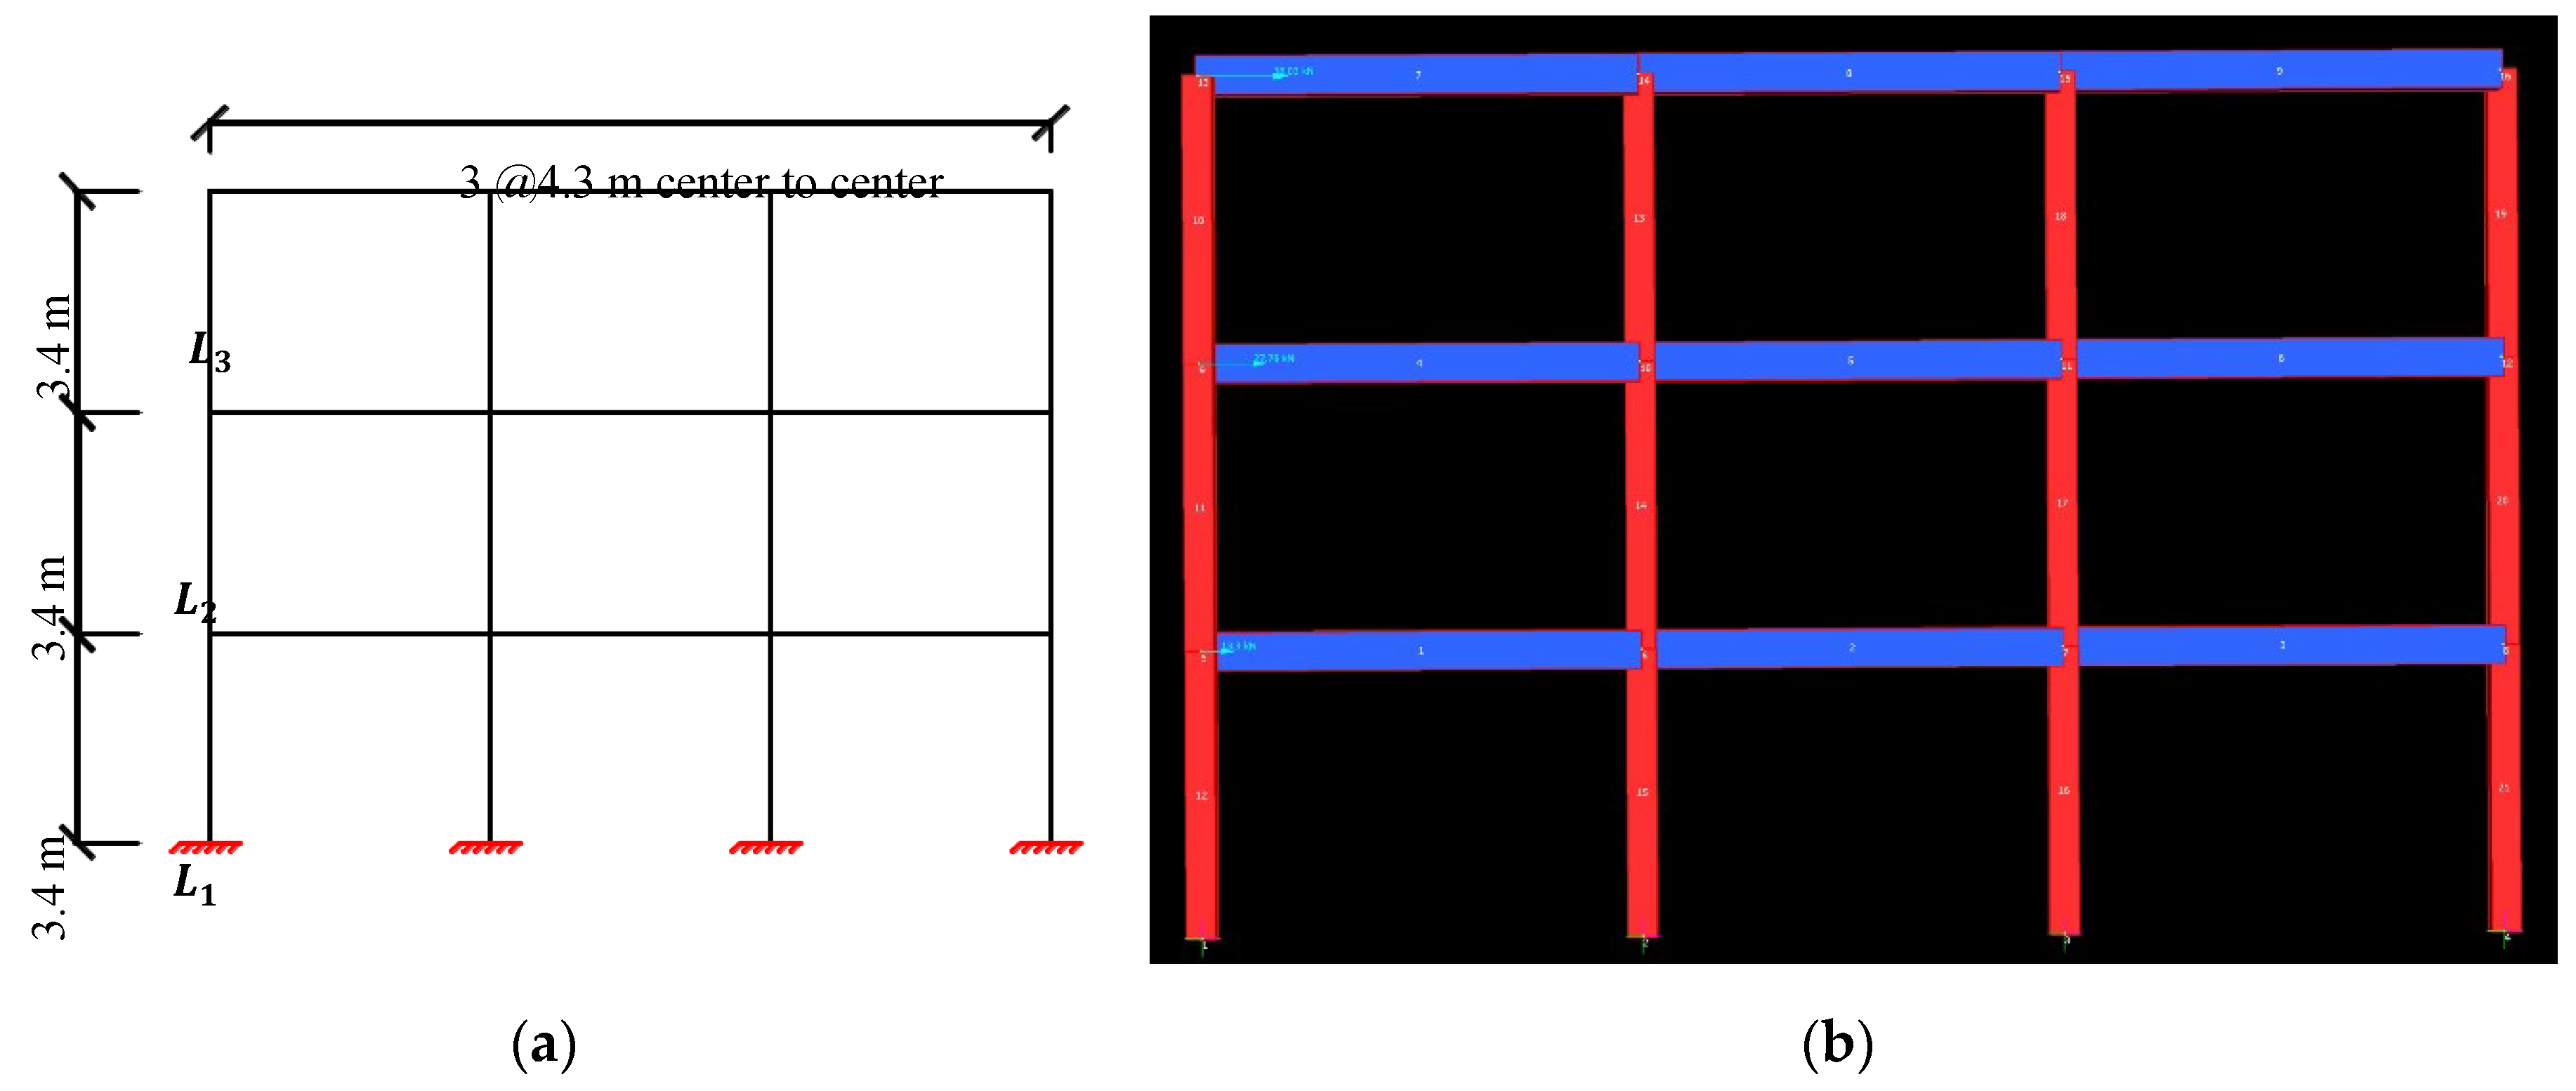
This study involved the analysis of the bare frame for the 18 different load cases using the Strand7. The bare frame was modelled as a reinforced concrete moment-resisting frame.
Figure 5 illustrates the dimensions of the bare frame and outlines the modelling strategy employed in the analysis. The horizontal equivalent static design force at each level for every load case was applied, as depicted in
Figure 5b. The resulting displacement was then obtained through the detailed analysis process.
2.2. Modelling Strategy of Traditional Masonry Panel
In this study, the equivalent compressive strut model was employed to evaluate the impact of a traditional infill masonry panel in comparison with the SIM panel. The initial development of the strut model can be attributed to Polyakov (1960), who formulated the concept based on elastic theory [
19]. Polyakov proposed that the response of traditional infill masonry panels under lateral loads could be effectively analyzed by representing their impact through an equivalent diagonal compressive strut. Various types of strut models are available in the literature, with the most commonly used ones being the Single, Double, and Triple Strut models. Crisafulli (1997) conducted a comprehensive study comparing the impact of the three different types of strut models on the structural response of an infilled frame, utilizing finite element analysis and contrasting the findings with experimental results [
20]. The findings from the study indicated that while the single strut model is the simplest rational representation for analyzing infilled frames, it falls short in describing the local effects of interaction between the frame and the infill panel. Crisafulli suggested that the use of multi-strut models (double and triple strut) can address this limitation without significantly increasing the complexity of the analysis. It was also reported that the single strut model is the most widely used and suitable for large structures.
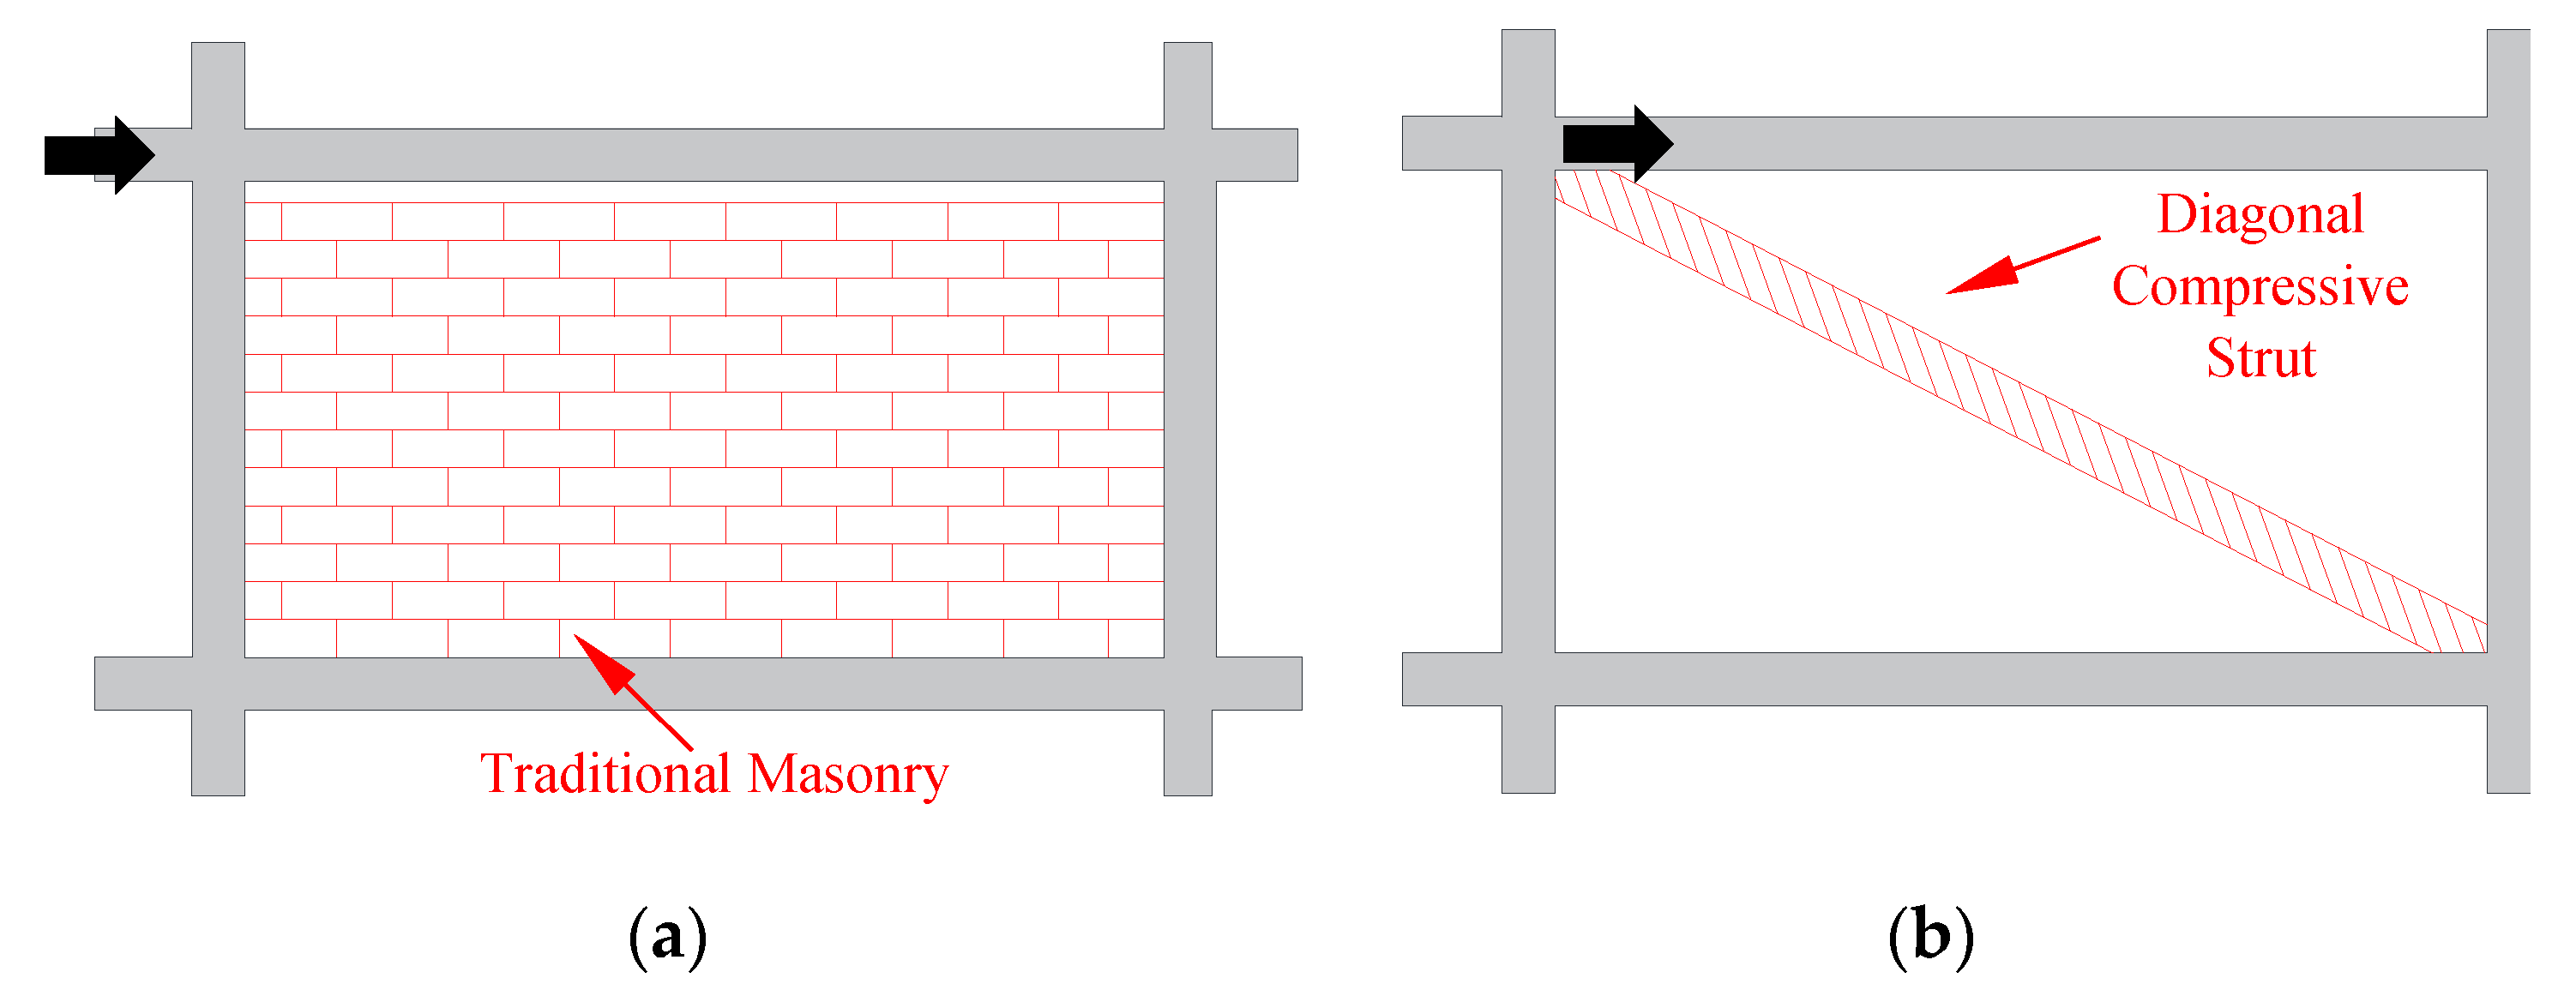
In this study, the single strut model was chosen, as the local effects of panel and frame interaction are not the primary focus. Furthermore, within the context of this investigation, a three-bay, three-storey structure qualifies as a large structure for an equivalent compressive strut model. As previously mentioned, the reinforced concrete frame with a traditional masonry panel can be effectively modeled as an equivalent braced frame featuring an equivalent diagonal compressive strut, as illustrated in
Figure 6.
Various studies in the literature offer methodologies for determining the width of the equivalent diagonal strut. To model SIM panels, trial and error analysis were used as the in-panel capacity of the SIM panels also depends on the displacement. In this study, the selection of an empirical equation to represent the equivalent width of the diagonal compressive strut for the traditional masonry panel is crucial. FEMA273 [
21] recommends the use of the empirical equation proposed by Mainstone and Weeks [
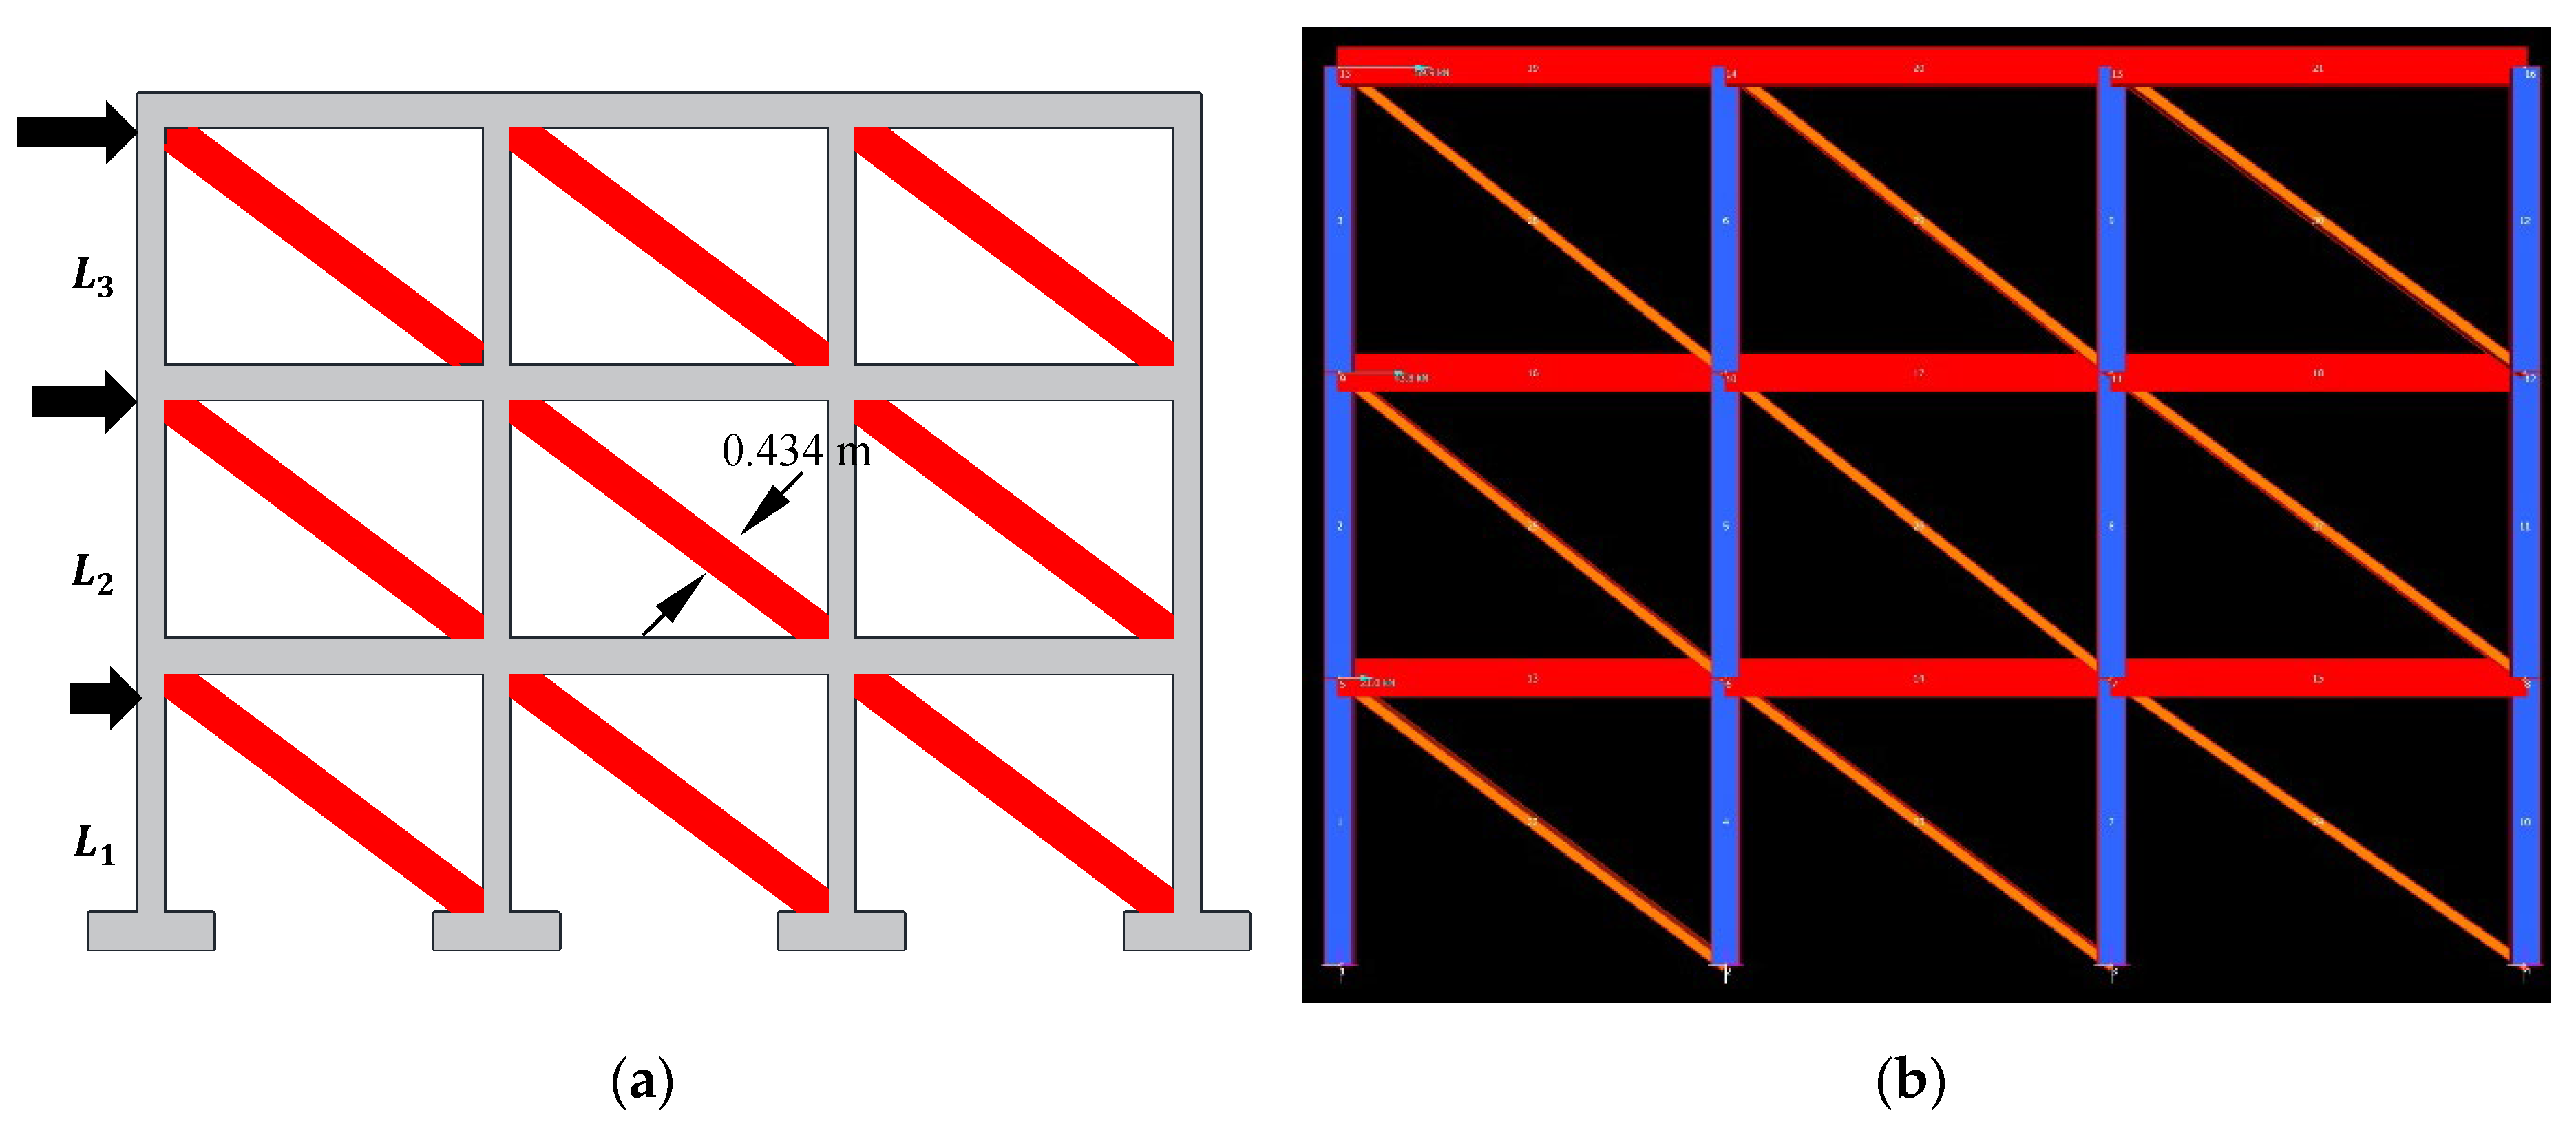
22] for quantifying the strength, stiffness, and deformation capacity of the traditional masonry panel (Equation (4)). For static analysis in Strand7, the equivalent width of the compressive strut was set at 0.434 m for this study. The response of the traditional masonry panel to lateral load is depicted in
Figure 7a, and the corresponding Strand7 model is illustrated in
Figure 7b.
Where Einf, tinf, dinf and Hinf are the modulus of elasticity, thickness, diagonal between two compressed corners and height of the infill respectively, θ is the angle between diagonal of the infill and the horizontal, Ec and Ic are the modulus of elasticity and second moment of inertia of the column respectively.
2.3. Modelling strategy of SIM panel
SIM panels can be constructed in two alternative ways, introducing distinct structural characteristics. It can be built with a gap between the top of the panel and the frame (Type 1: SIM panel with gap) or without any gap between the top of the SIM panel and frame (Type 2: SIM panel without/close gap). The presence or absence of this gap, and its width, significantly influences the structural response of the SIM panel to lateral loads, as indicated by Totoev [
23,
24]. In this study, the modelling strategy for the two types of SIM panels is distinct, and its responses to lateral loads are analyzed separately.
2.3.1. Type 1 SIM Panel with an Open Gap
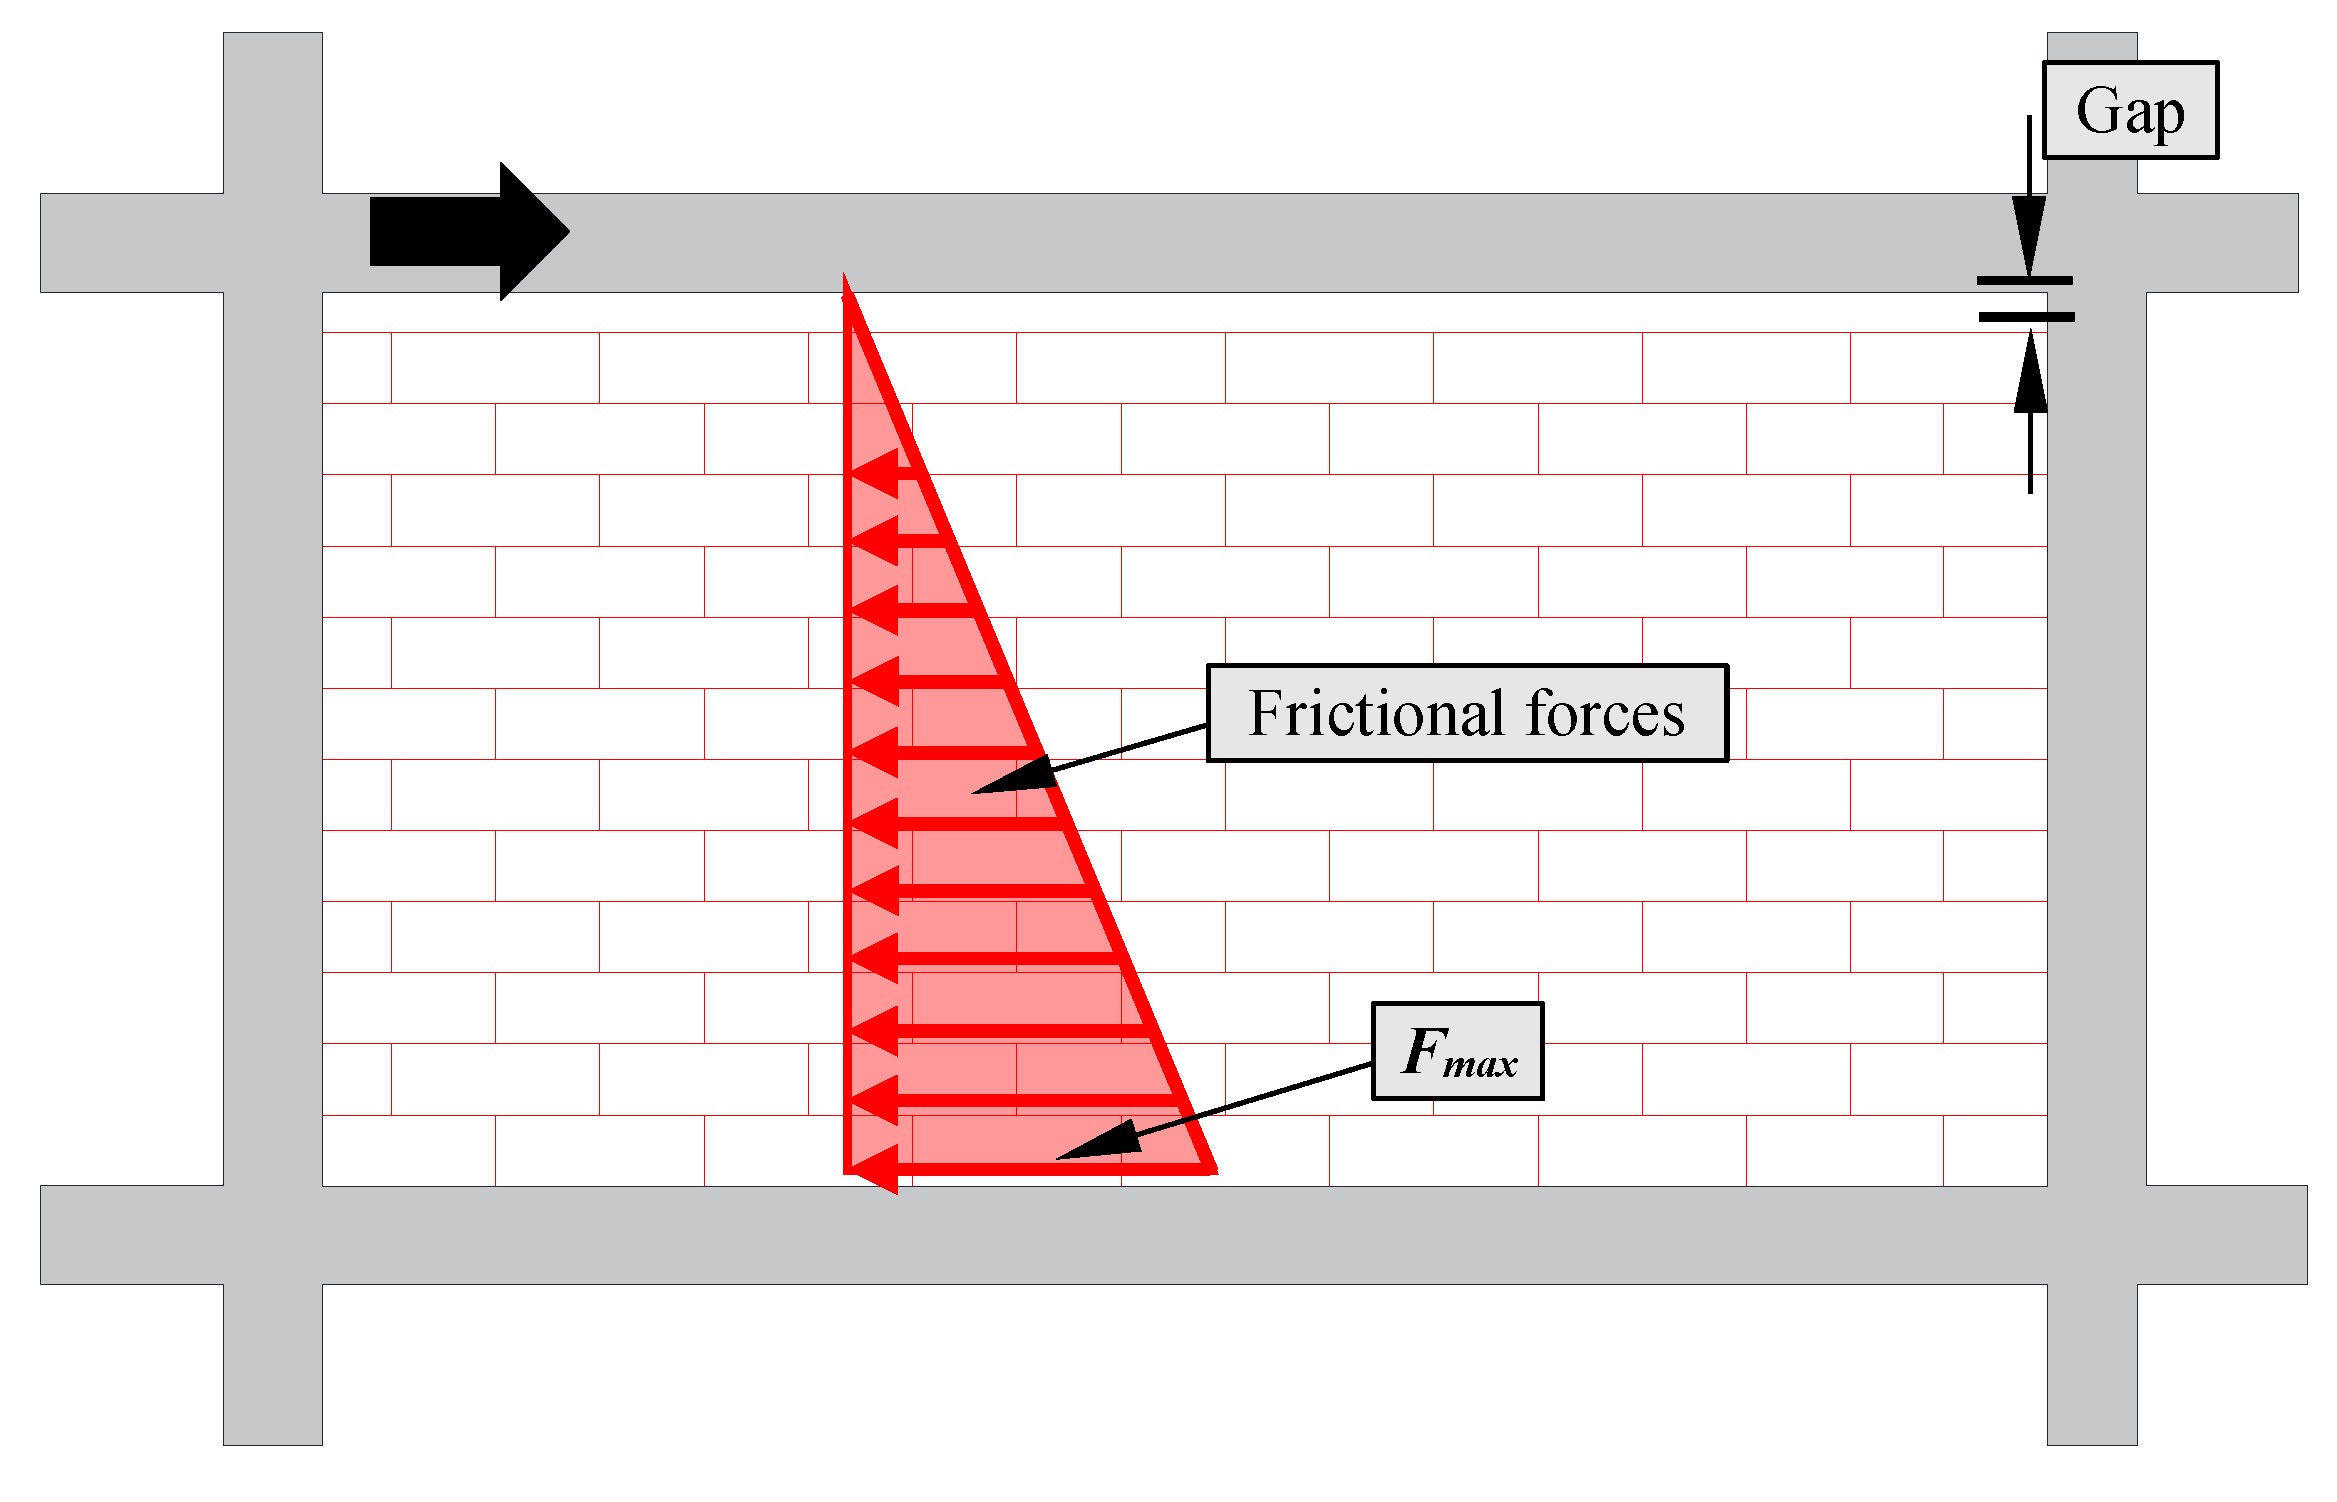
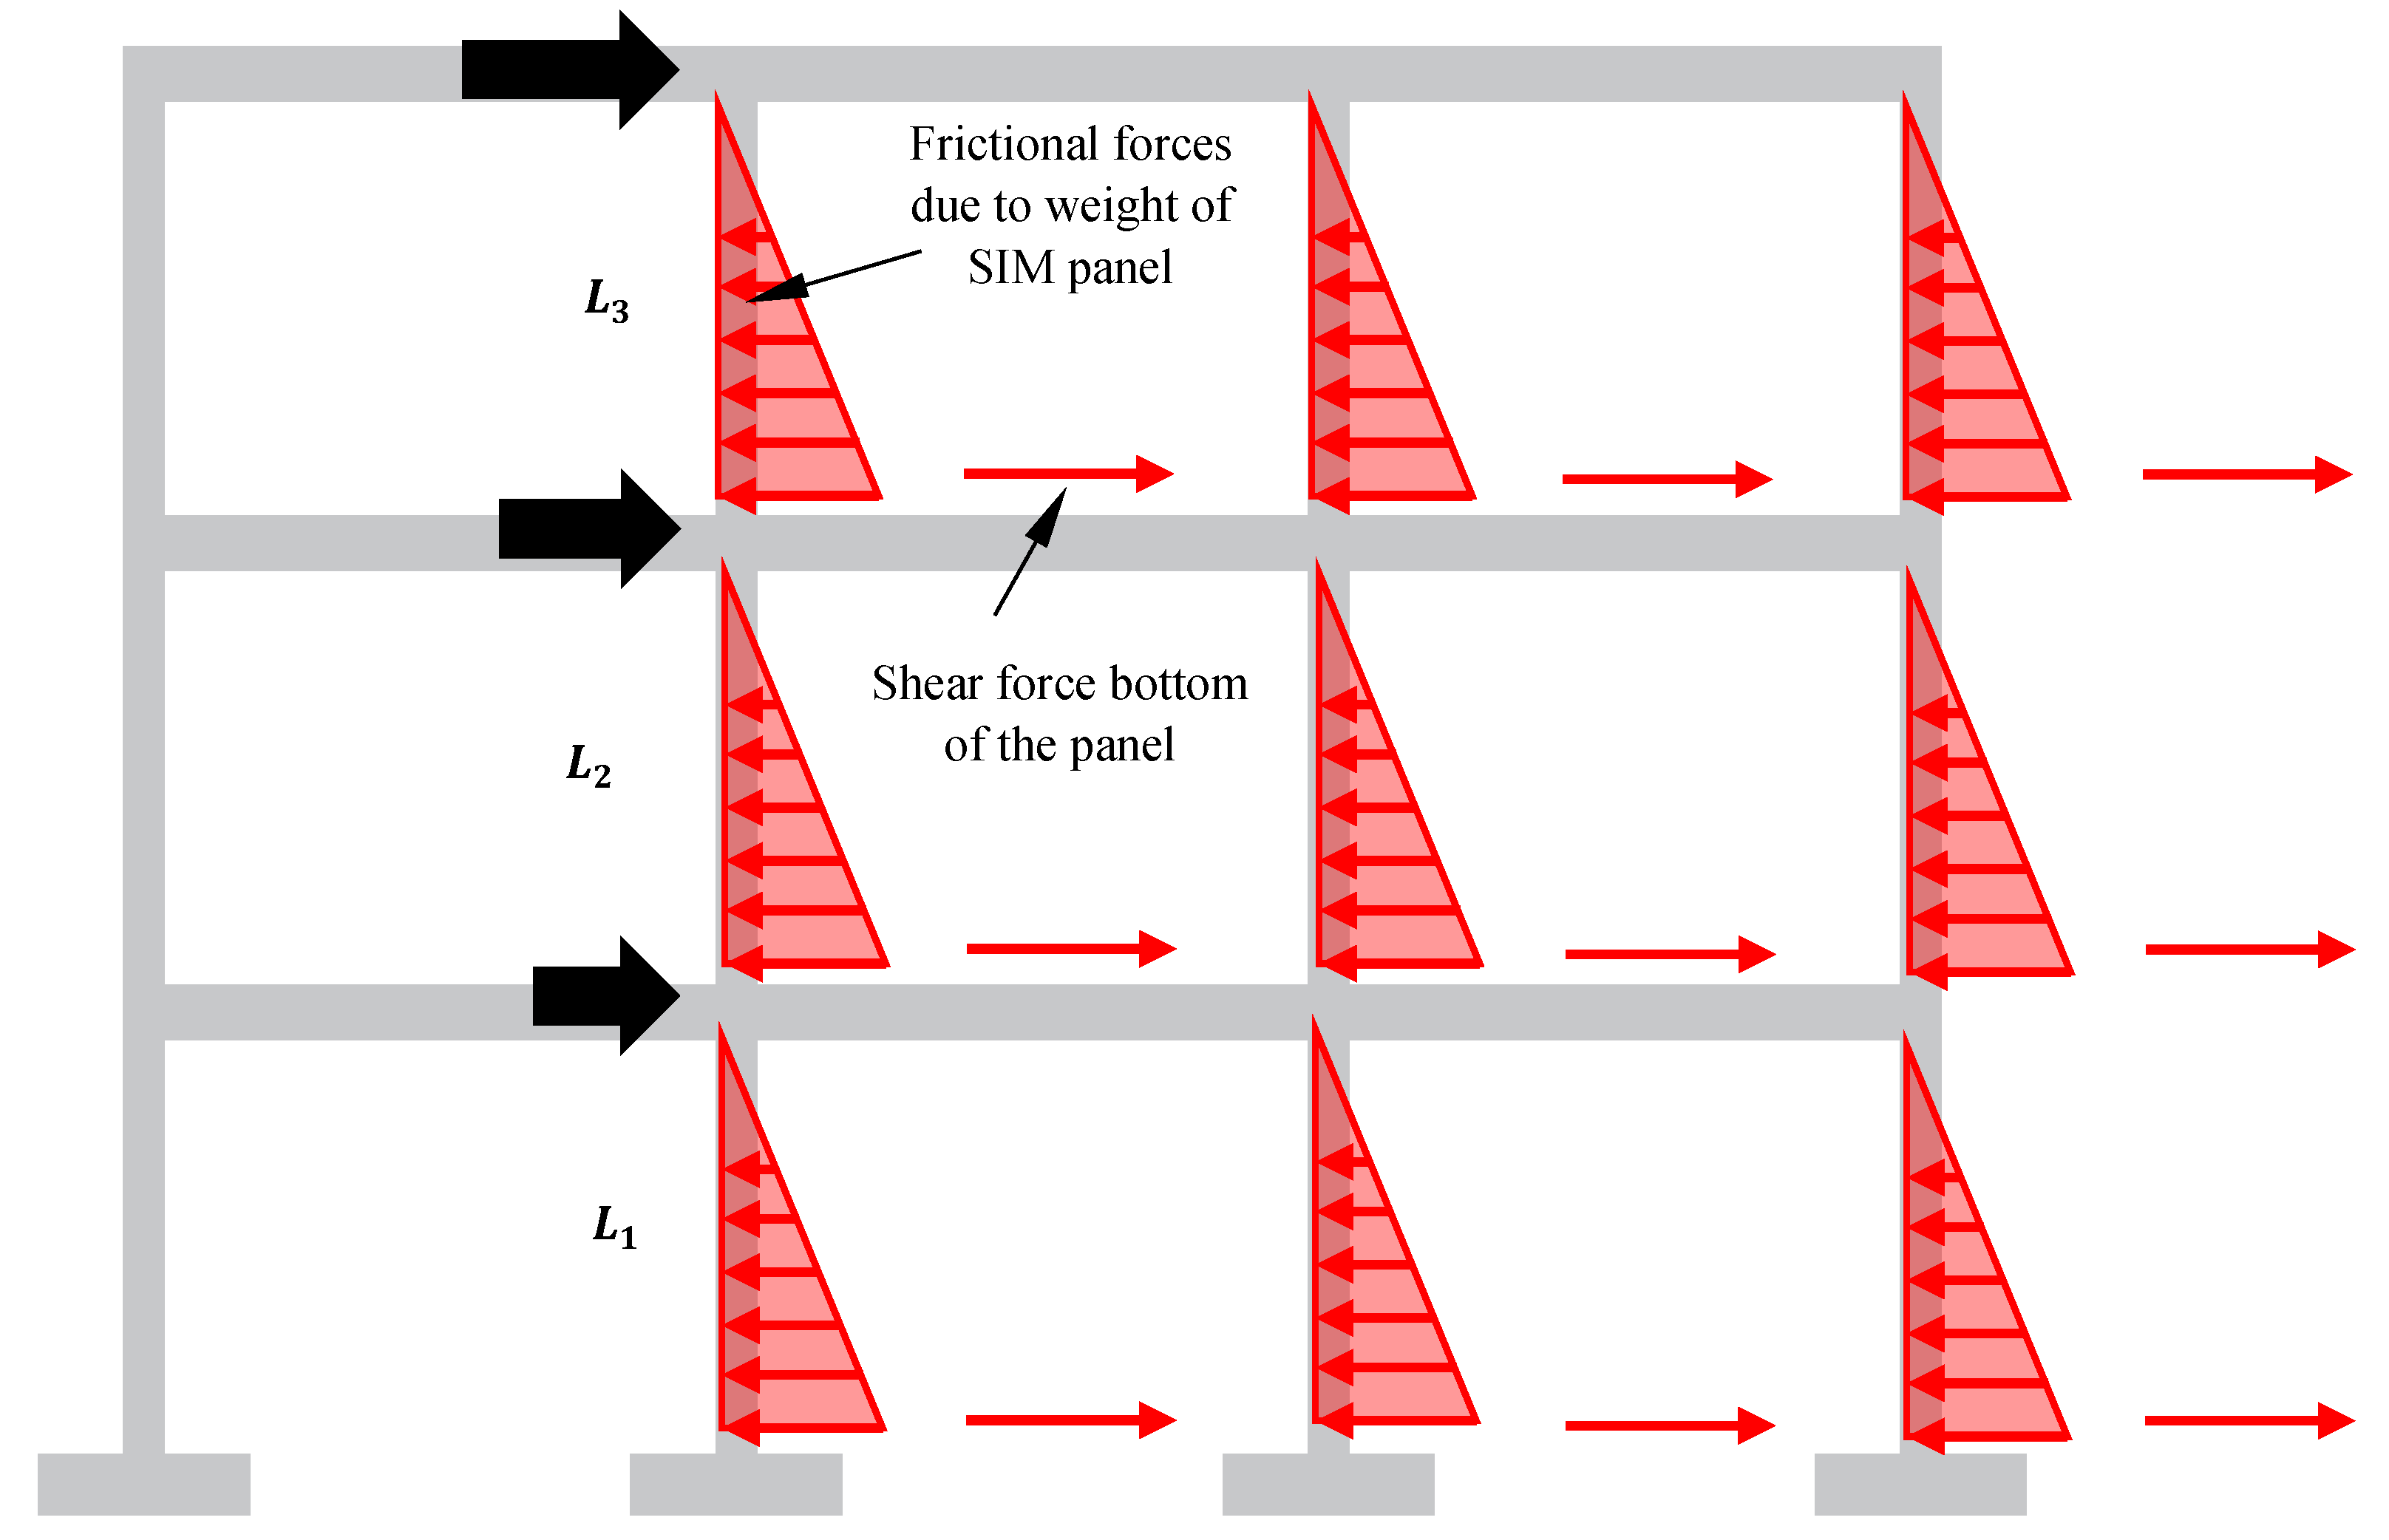
In Type 1 construction, the SIM panel is positioned tightly against the columns, featuring a gap between the top of the panel and the frame, as illustrated in
Figure 8. This configuration implies that the frame interacts with the SIM panel solely through the columns. The gap remains open during a seismic event, and no compressive force on the panel originates from the top of the frame. As the frame experiences lateral loads, frictional forces emerge on the bed joints of the panel due to its self-weight. The distribution of the friction force can be conceptualized as a triangular force, as depicted in
Figure 8.
The maximum theoretical frictional force at the bottom of the panel (F
max) is determined by Equation (5) [
23], with the notations for the equation already outlined in
Table 1.
It is crucial to compare the theoretical F
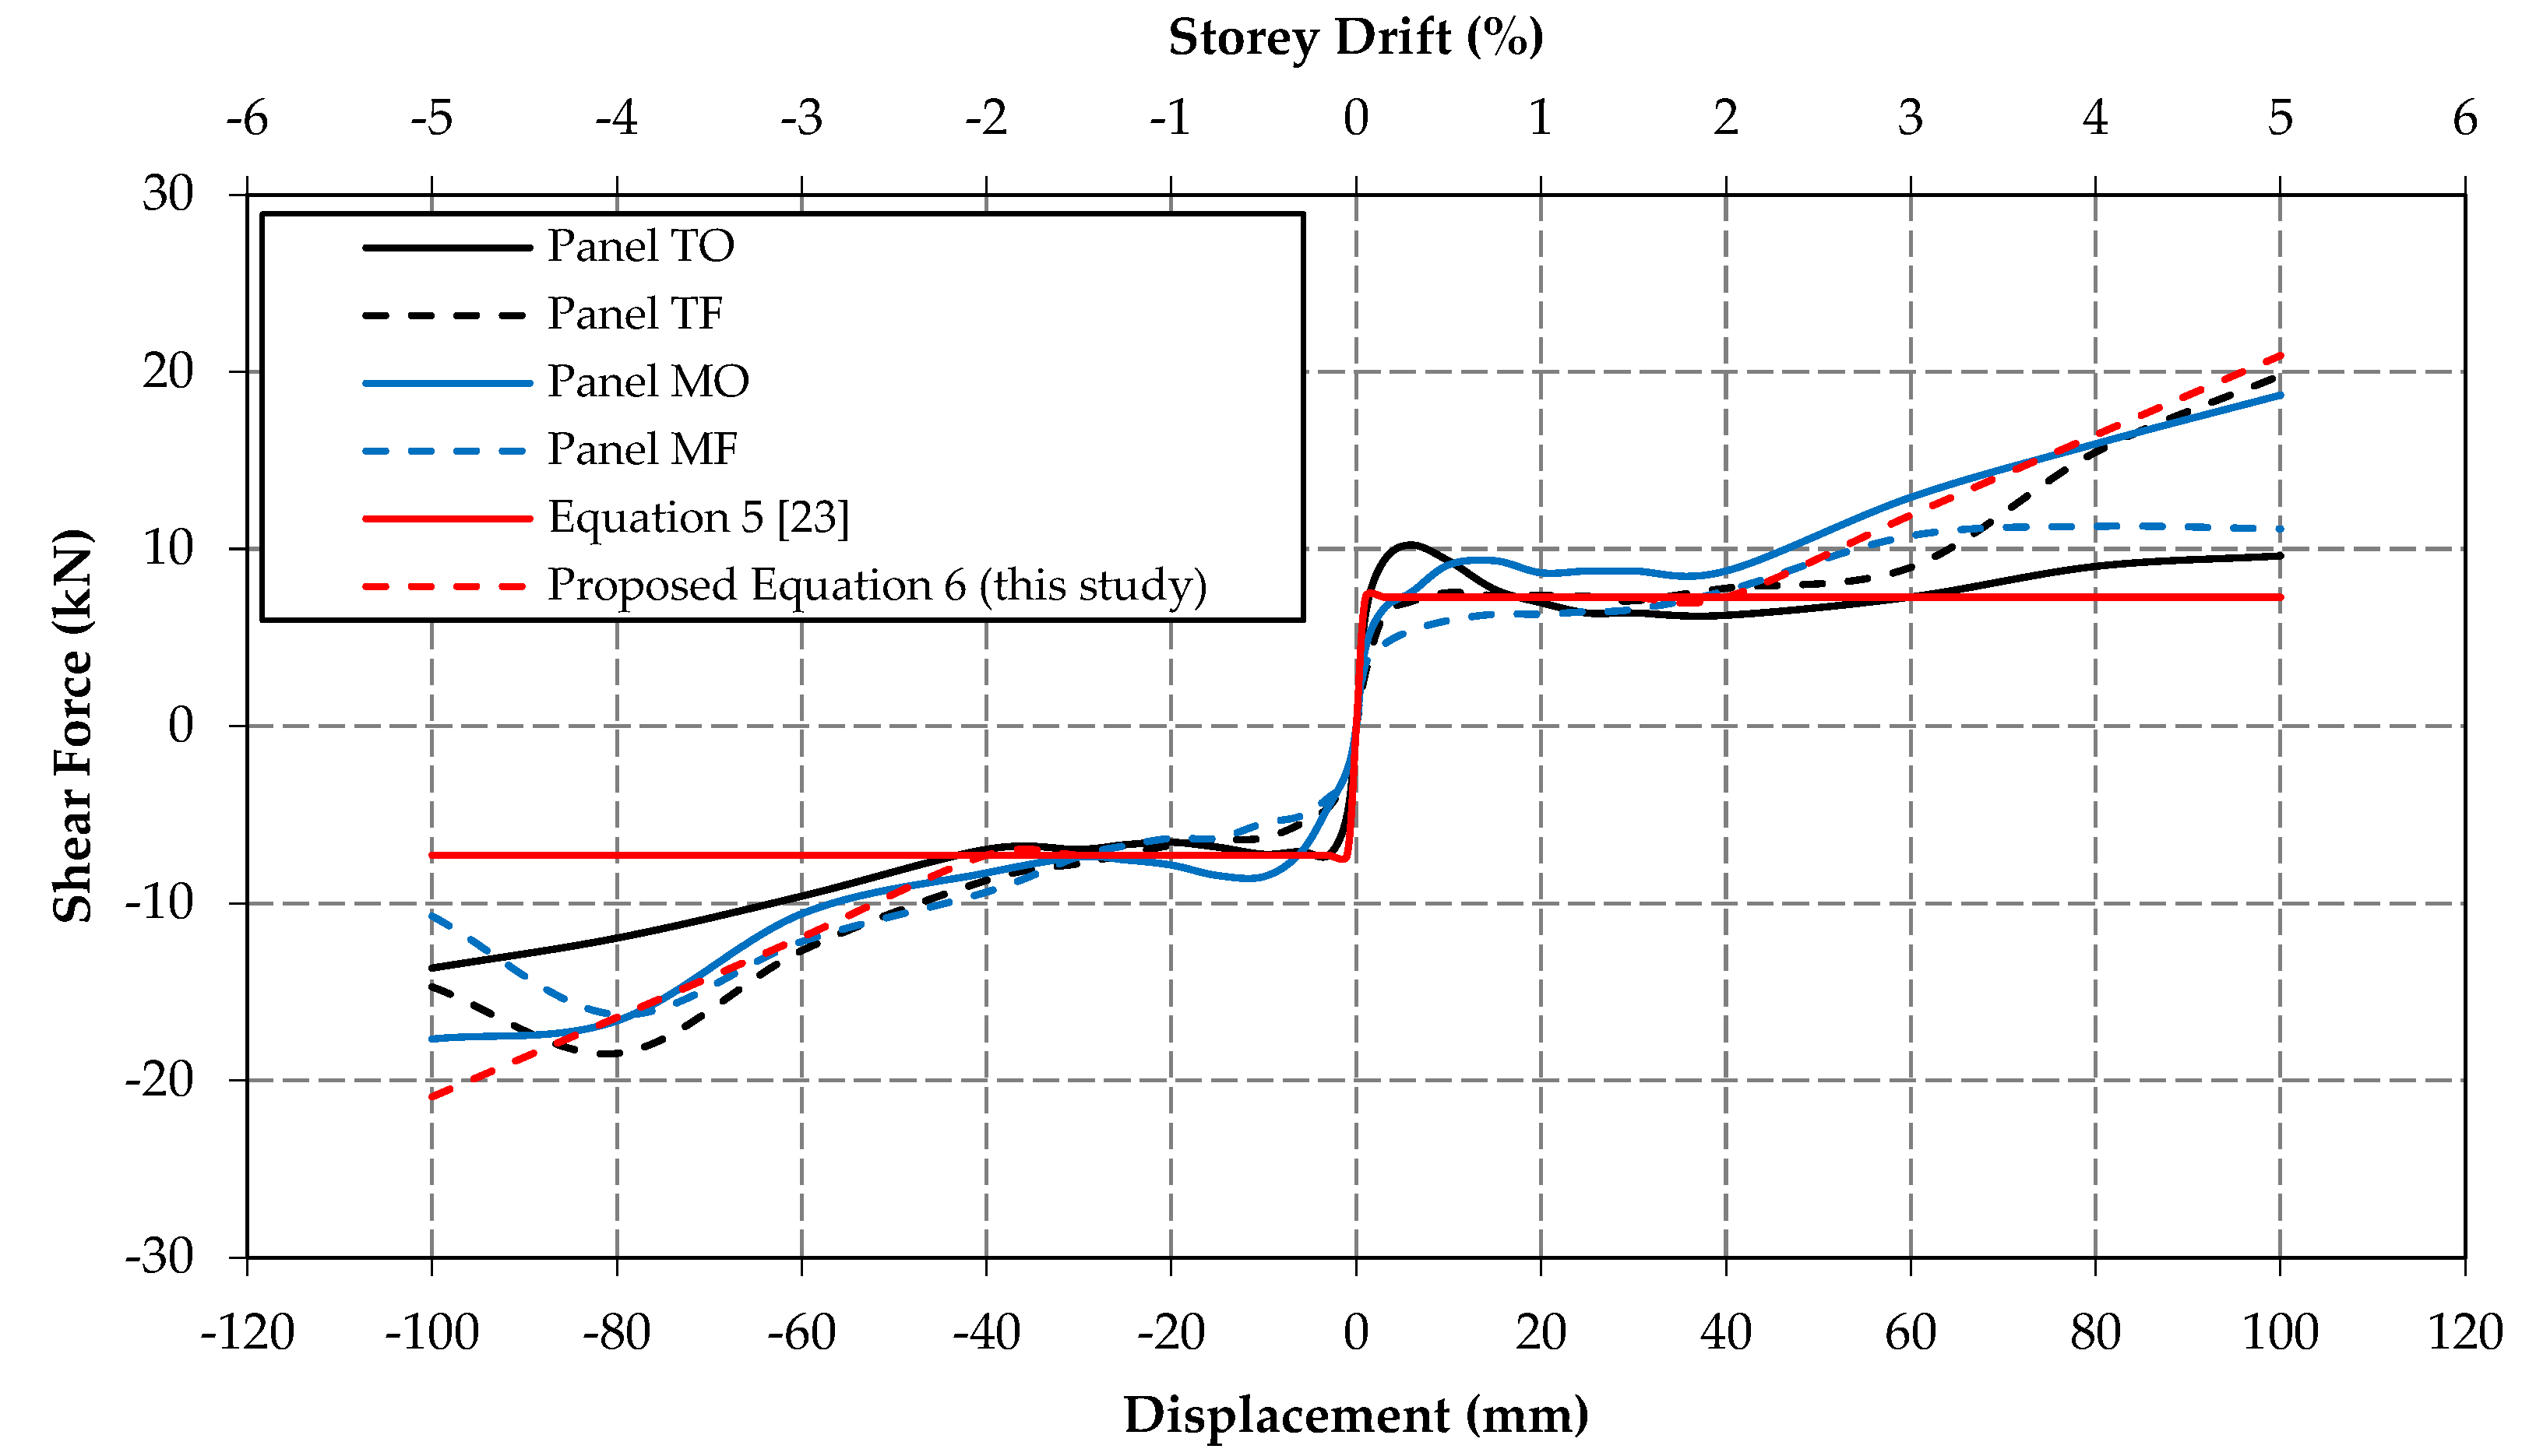
max value with the experimental results. For comparison, panels with an open gap (Panel TO and Panel MO) and panels with foam (Panel TF and Panel MF) are categorized as Type 1 SIM panels with a gap, experimental details can be found [
9,
13]. It is noteworthy that the F
max remains constant, independent of the displacement or storey drift of the panel. For the tested panels, F
max is a constant value of 7.28 kN, resulting in a total frictional force (represents the area of the triangle in
Figure 8) of 7.28 kN for the 2m × 2m experimentally tested panel. The response of the Type 1 SIM panel (SIM panel with a gap) to lateral loads in this study is depicted in
Figure 9.
It is noted that the theoretical value obtained from Equation (5) aligns well with the experimental results of up to 40mm displacement. However, beyond 40mm of in-plane displacement (2% of the storey drift), the behavior of open gap panels becomes similar to that of the Type 2 SIM panel (SIM panel without a gap). This transition occurs because, after 40mm of in-plane displacement (2% of the storey drift), panels with a gap and panels with foam experience an additional lateral load due to the development of extra frictional forces on each SIM bed joint, attributed to the 'Vertical Clamping' of the panel, as detailed in
Section 2.3.2. In this study, the following equation is proposed to model the behavior of SIM panels with a gap (Type 1 SIM panel).
where ∆
t and E
SIM are the in-plane displacement of the panel and modulus of elasticity of SIM panel respectively.
It is essential to highlight that the proposed Equation (6) for the Type 1 SIM panel with a gap cannot account for the shear force resulting from the cracking of the units, as evidenced in
Figure 9 after a displacement of -80mm. Nevertheless, the proposed equation (Equation (6)) demonstrates good correlation with the experimental results. Notably, F
max is calculated as 21.85kN, and the total frictional force is 32.78kN for the 4m × 3m panel. The idealized response of the Type 1 SIM panel, up to 40 mm in-plane displacement, to the lateral load in this study is depicted in
Figure 10.
2.3.2. Type 2 SIM panel without a gap (Close gap)
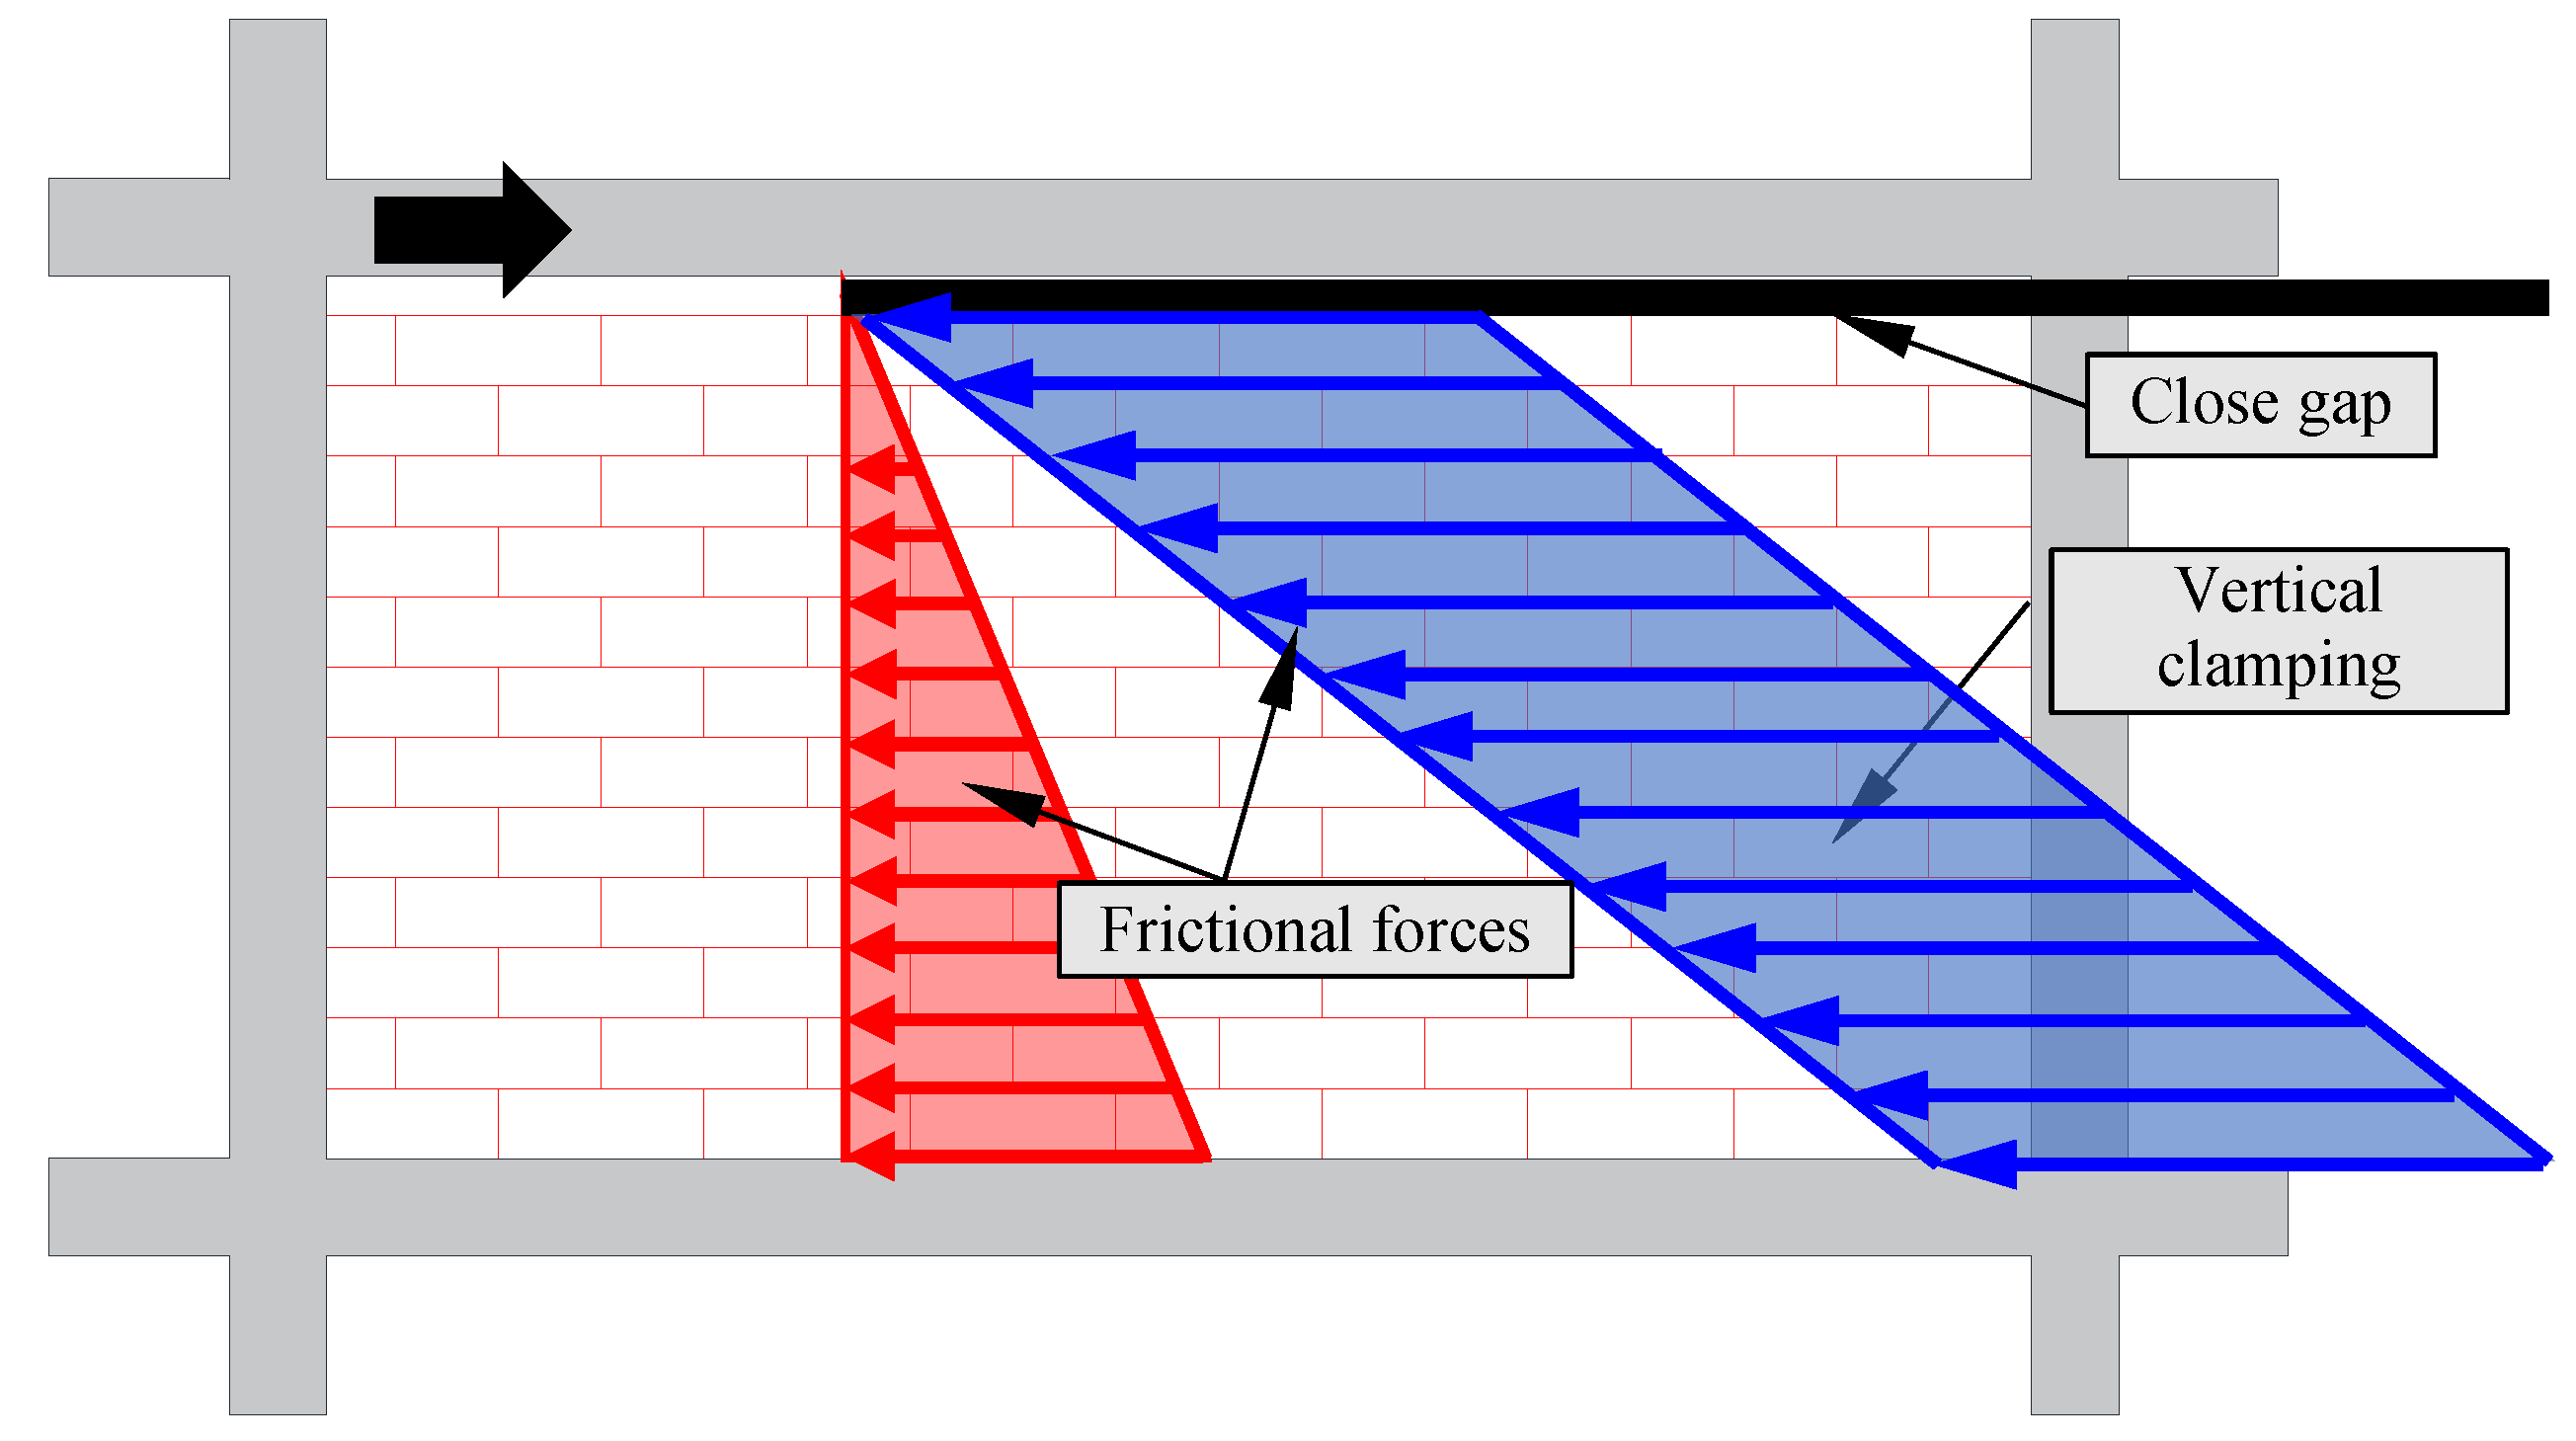
The Type 2 SIM panel is constructed firmly against all sides of the frame without any gap between the top of the panel and the frame, as illustrated in
Figure 11. This design enables the SIM panel to withstand additional lateral loads generated by the development of extra frictional forces on each SIM bed joint, attributed to the 'vertical clamping' of the panel. The response to this additional frictional force is similar to the idealization of an equivalent compressive strut for traditional masonry (refer to
Section 2.2). However, it is crucial to note that the interaction between the frame and panel differs for traditional masonry and SIM, and the equivalent compressive strut model is not applicable to the SIM panel [
23].
The additional frictional force at each SIM bed joint of the panel, denoted as F
C(∆t), due to the vertical clamping effect of the panel, is determined by Equation (7), as recommended by Totoev [
23].
The total frictional forces for the Type 2 SIM panel without a gap can be computed using the following equation, as outlined in Totoev [
23].
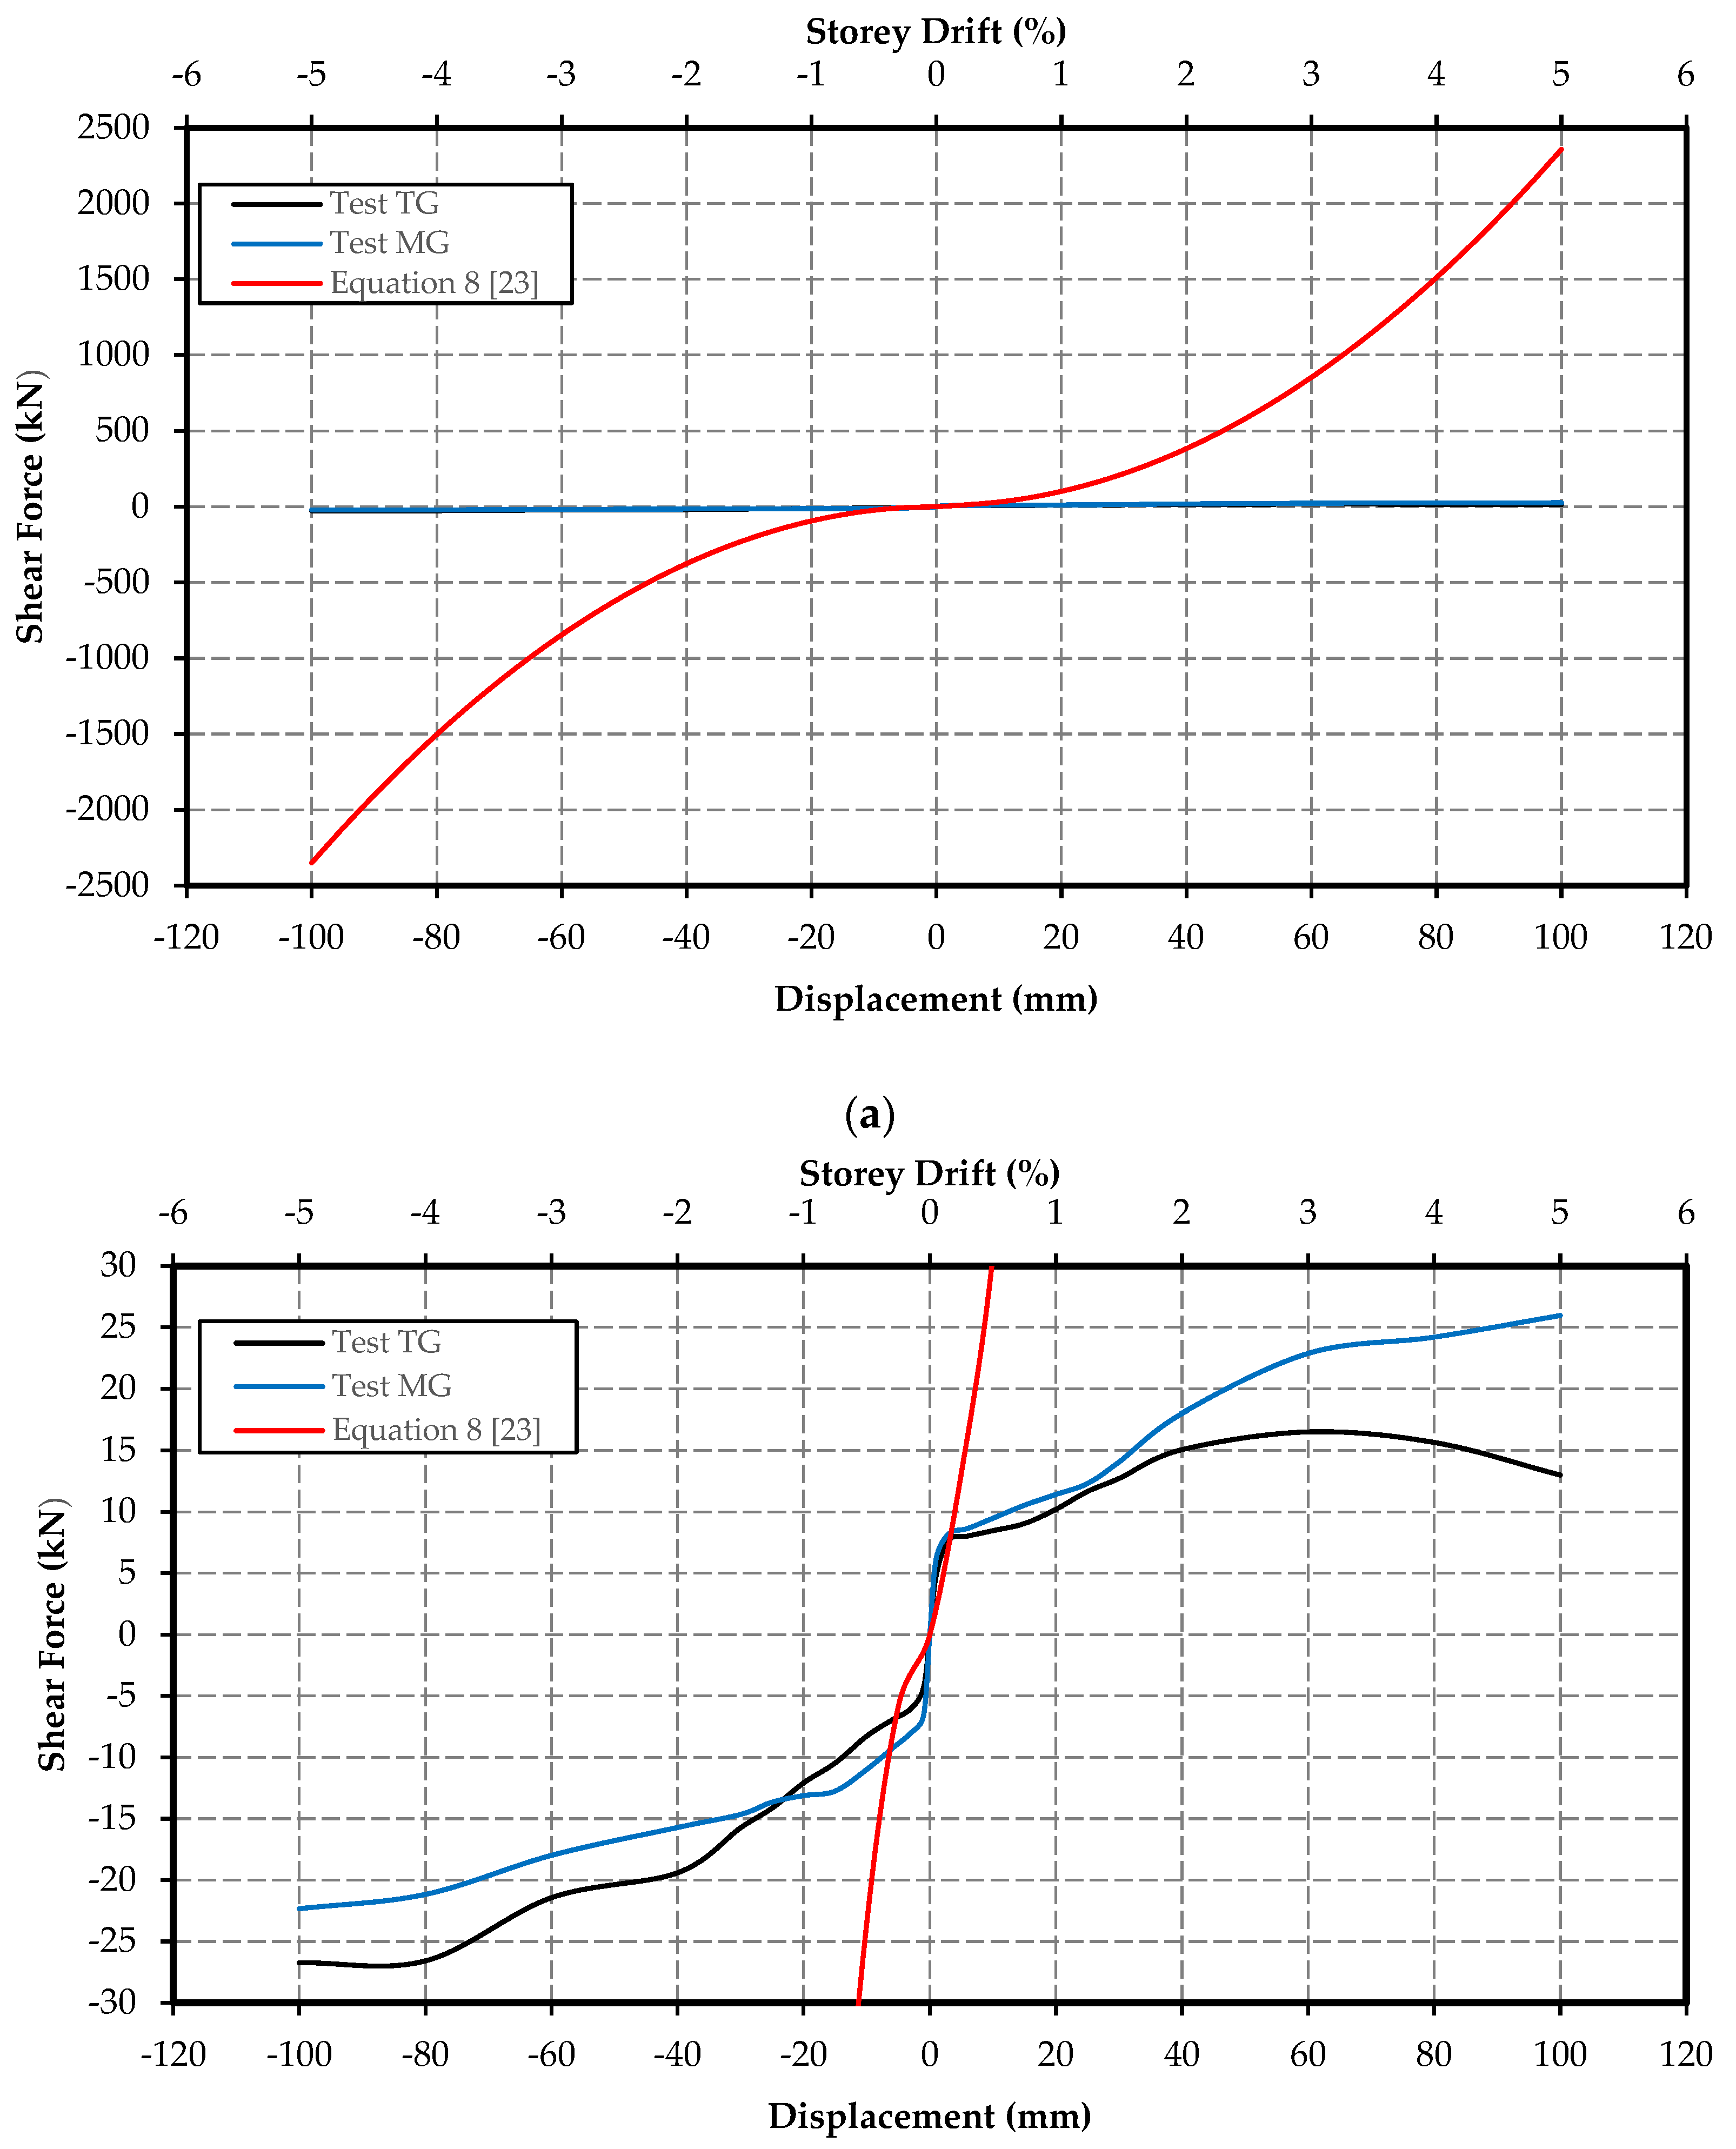
The comparison between the theoretical frictional force and the experimental results is presented in
Figure 12. It is essential to note that the vertical scaling of the graphs in
Figure 12 is not same. The observed discrepancy between the theoretical (based on previously developed equation by Totoev [
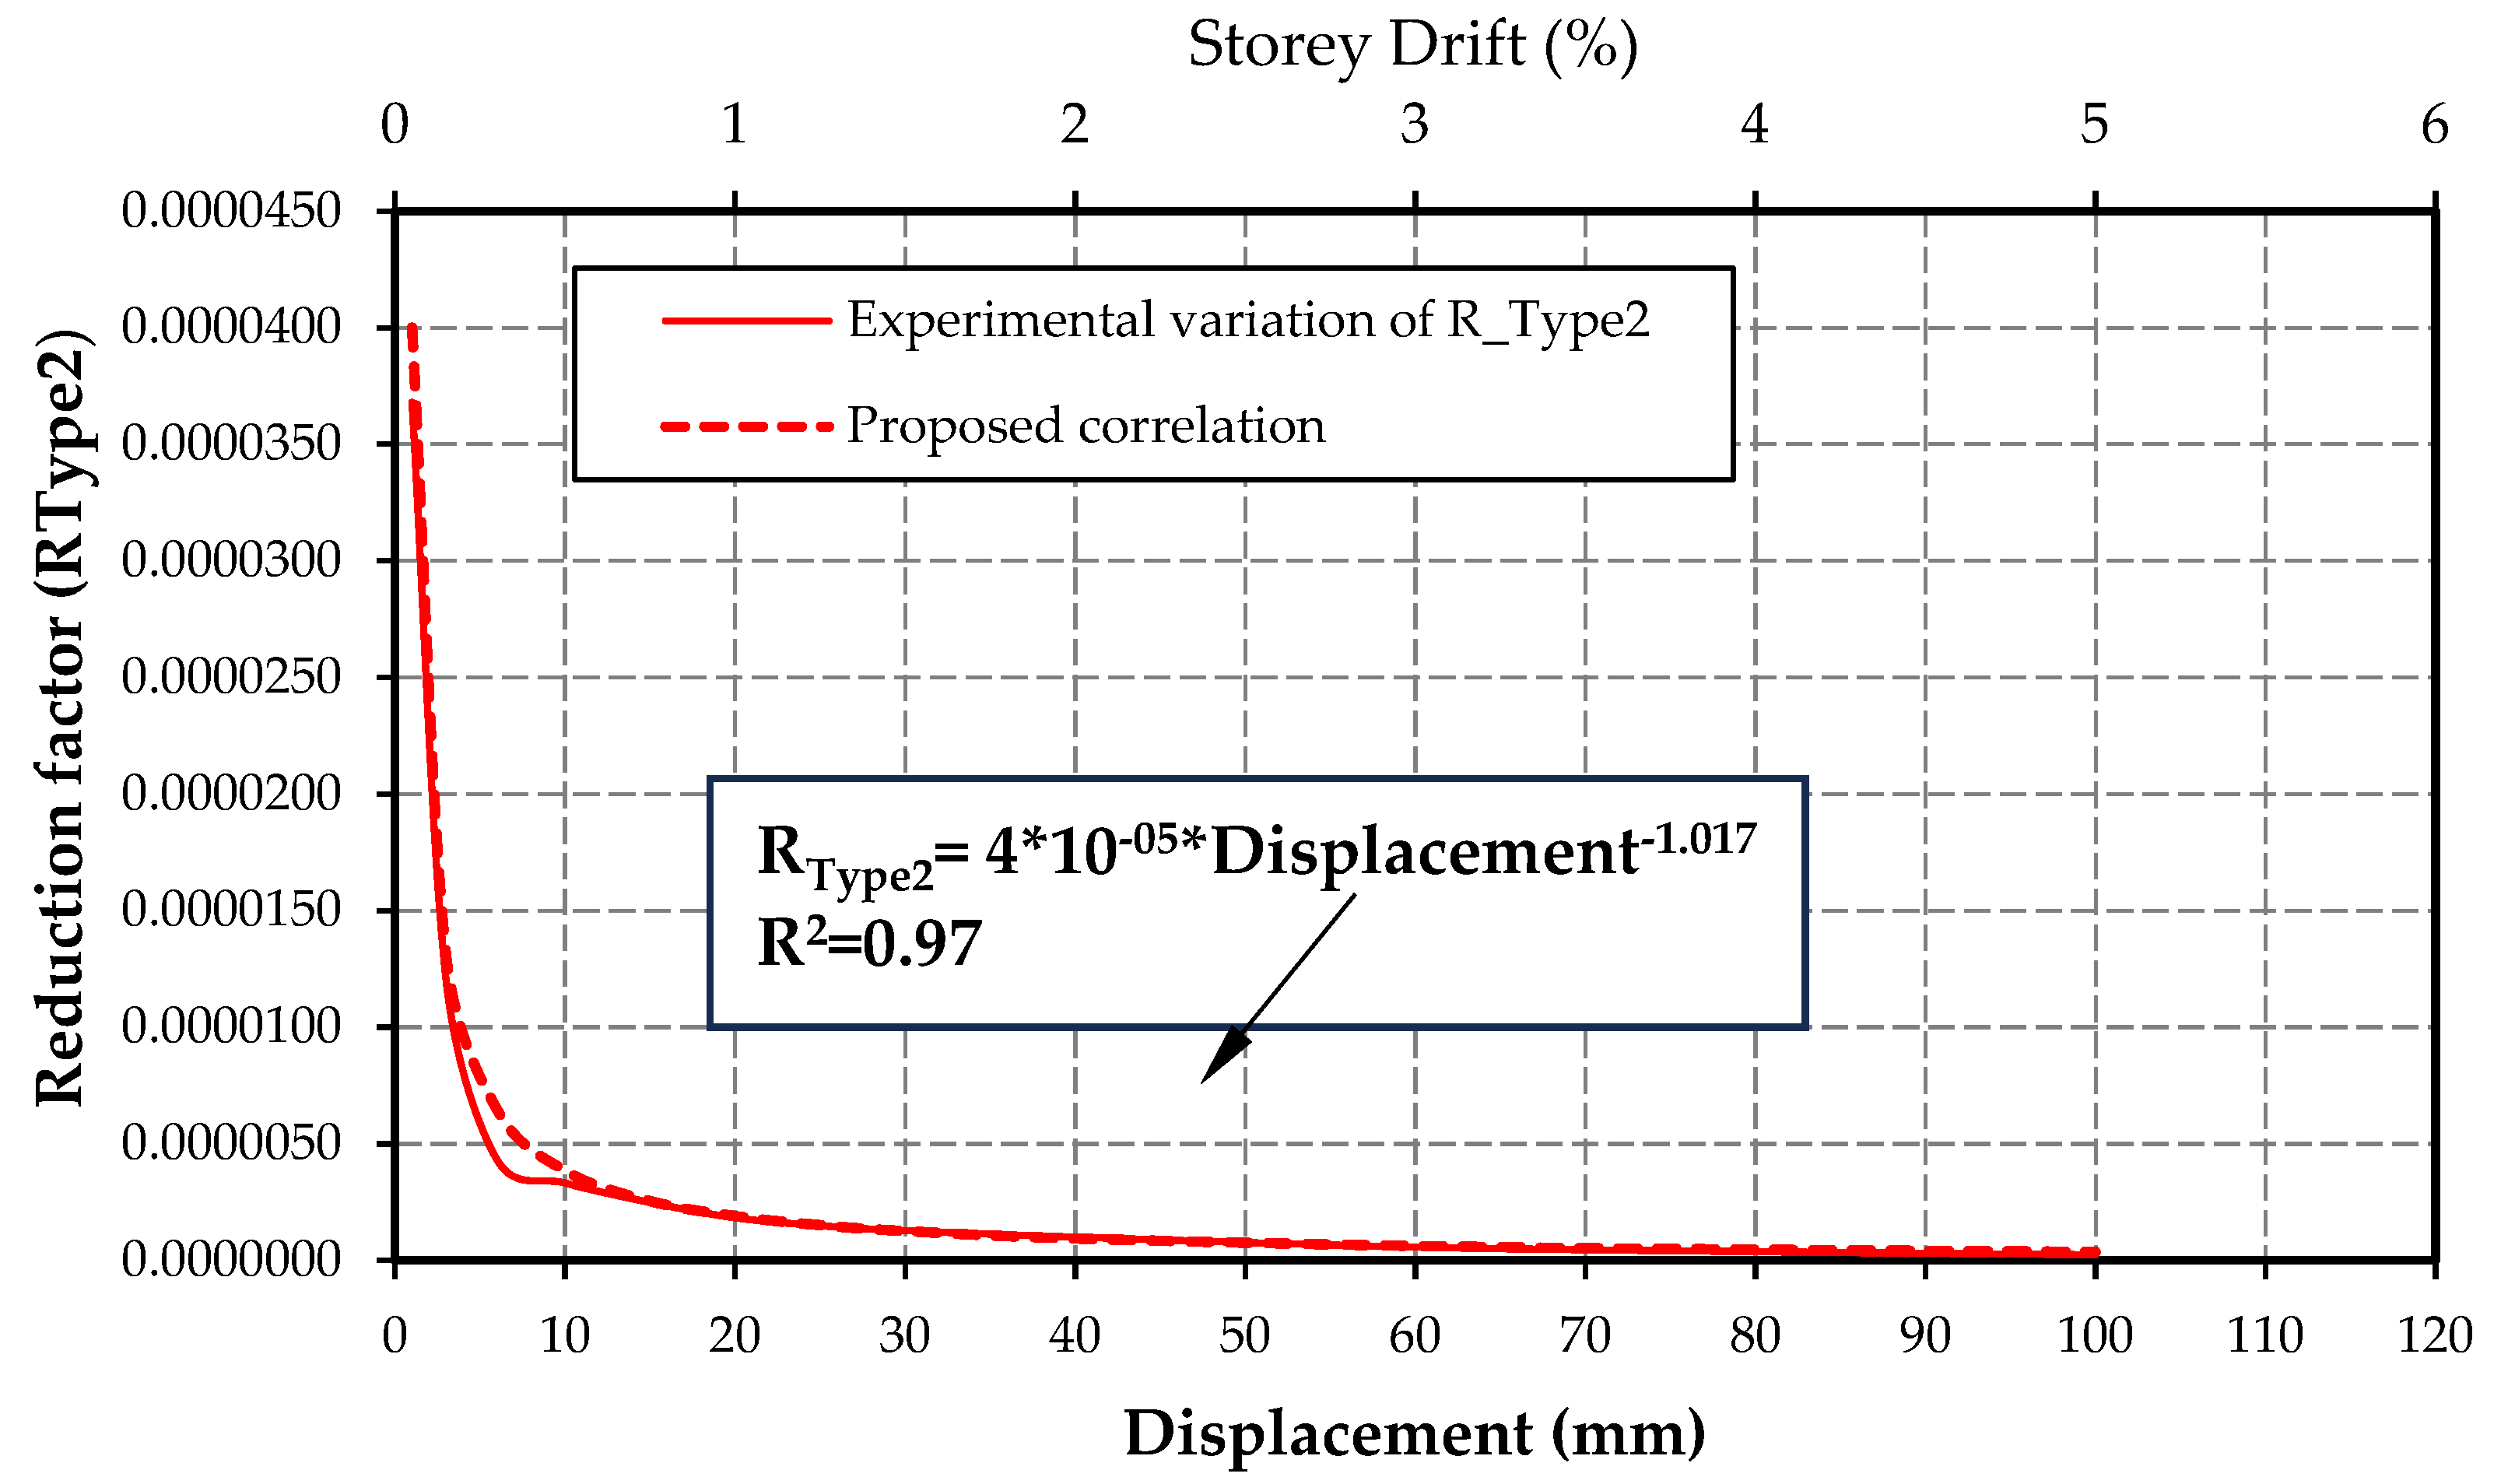
23]) and experimental values is substantial, with the theoretical values often exceeding the experimental ones by more than 100 times. However, a closer alignment is observed for smaller displacements, typically around 1mm. This disparity is attributed to assumptions made during the derivation of Equation (8) and the impact of additional frictional forces due to vertical clamping, which significantly relies on the second-order displacement component. To address this discrepancy, a reduction factor is introduced to better align the theoretical predictions with the experimental results. The proposed equation (Equation (9)) in this study aims to predict the shear force response for the Type 2 SIM panel without a gap.
Where R
Type2 is the reduction factor to match the experimental results. R
Type2 was determined based on the collective variation observed in Panel TO, Panel TF, Panel MO, and Panel MF for both push and pull directions of shear forces. The correlation between the reduction factor and collective variation of in-plane displacement is illustrated in
Figure 13.
The determined value of R
type2 is substituted into Equation (9), and the resulting equation for calculating the total frictional force for the Type 2 SIM panel is presented in Equation (10).
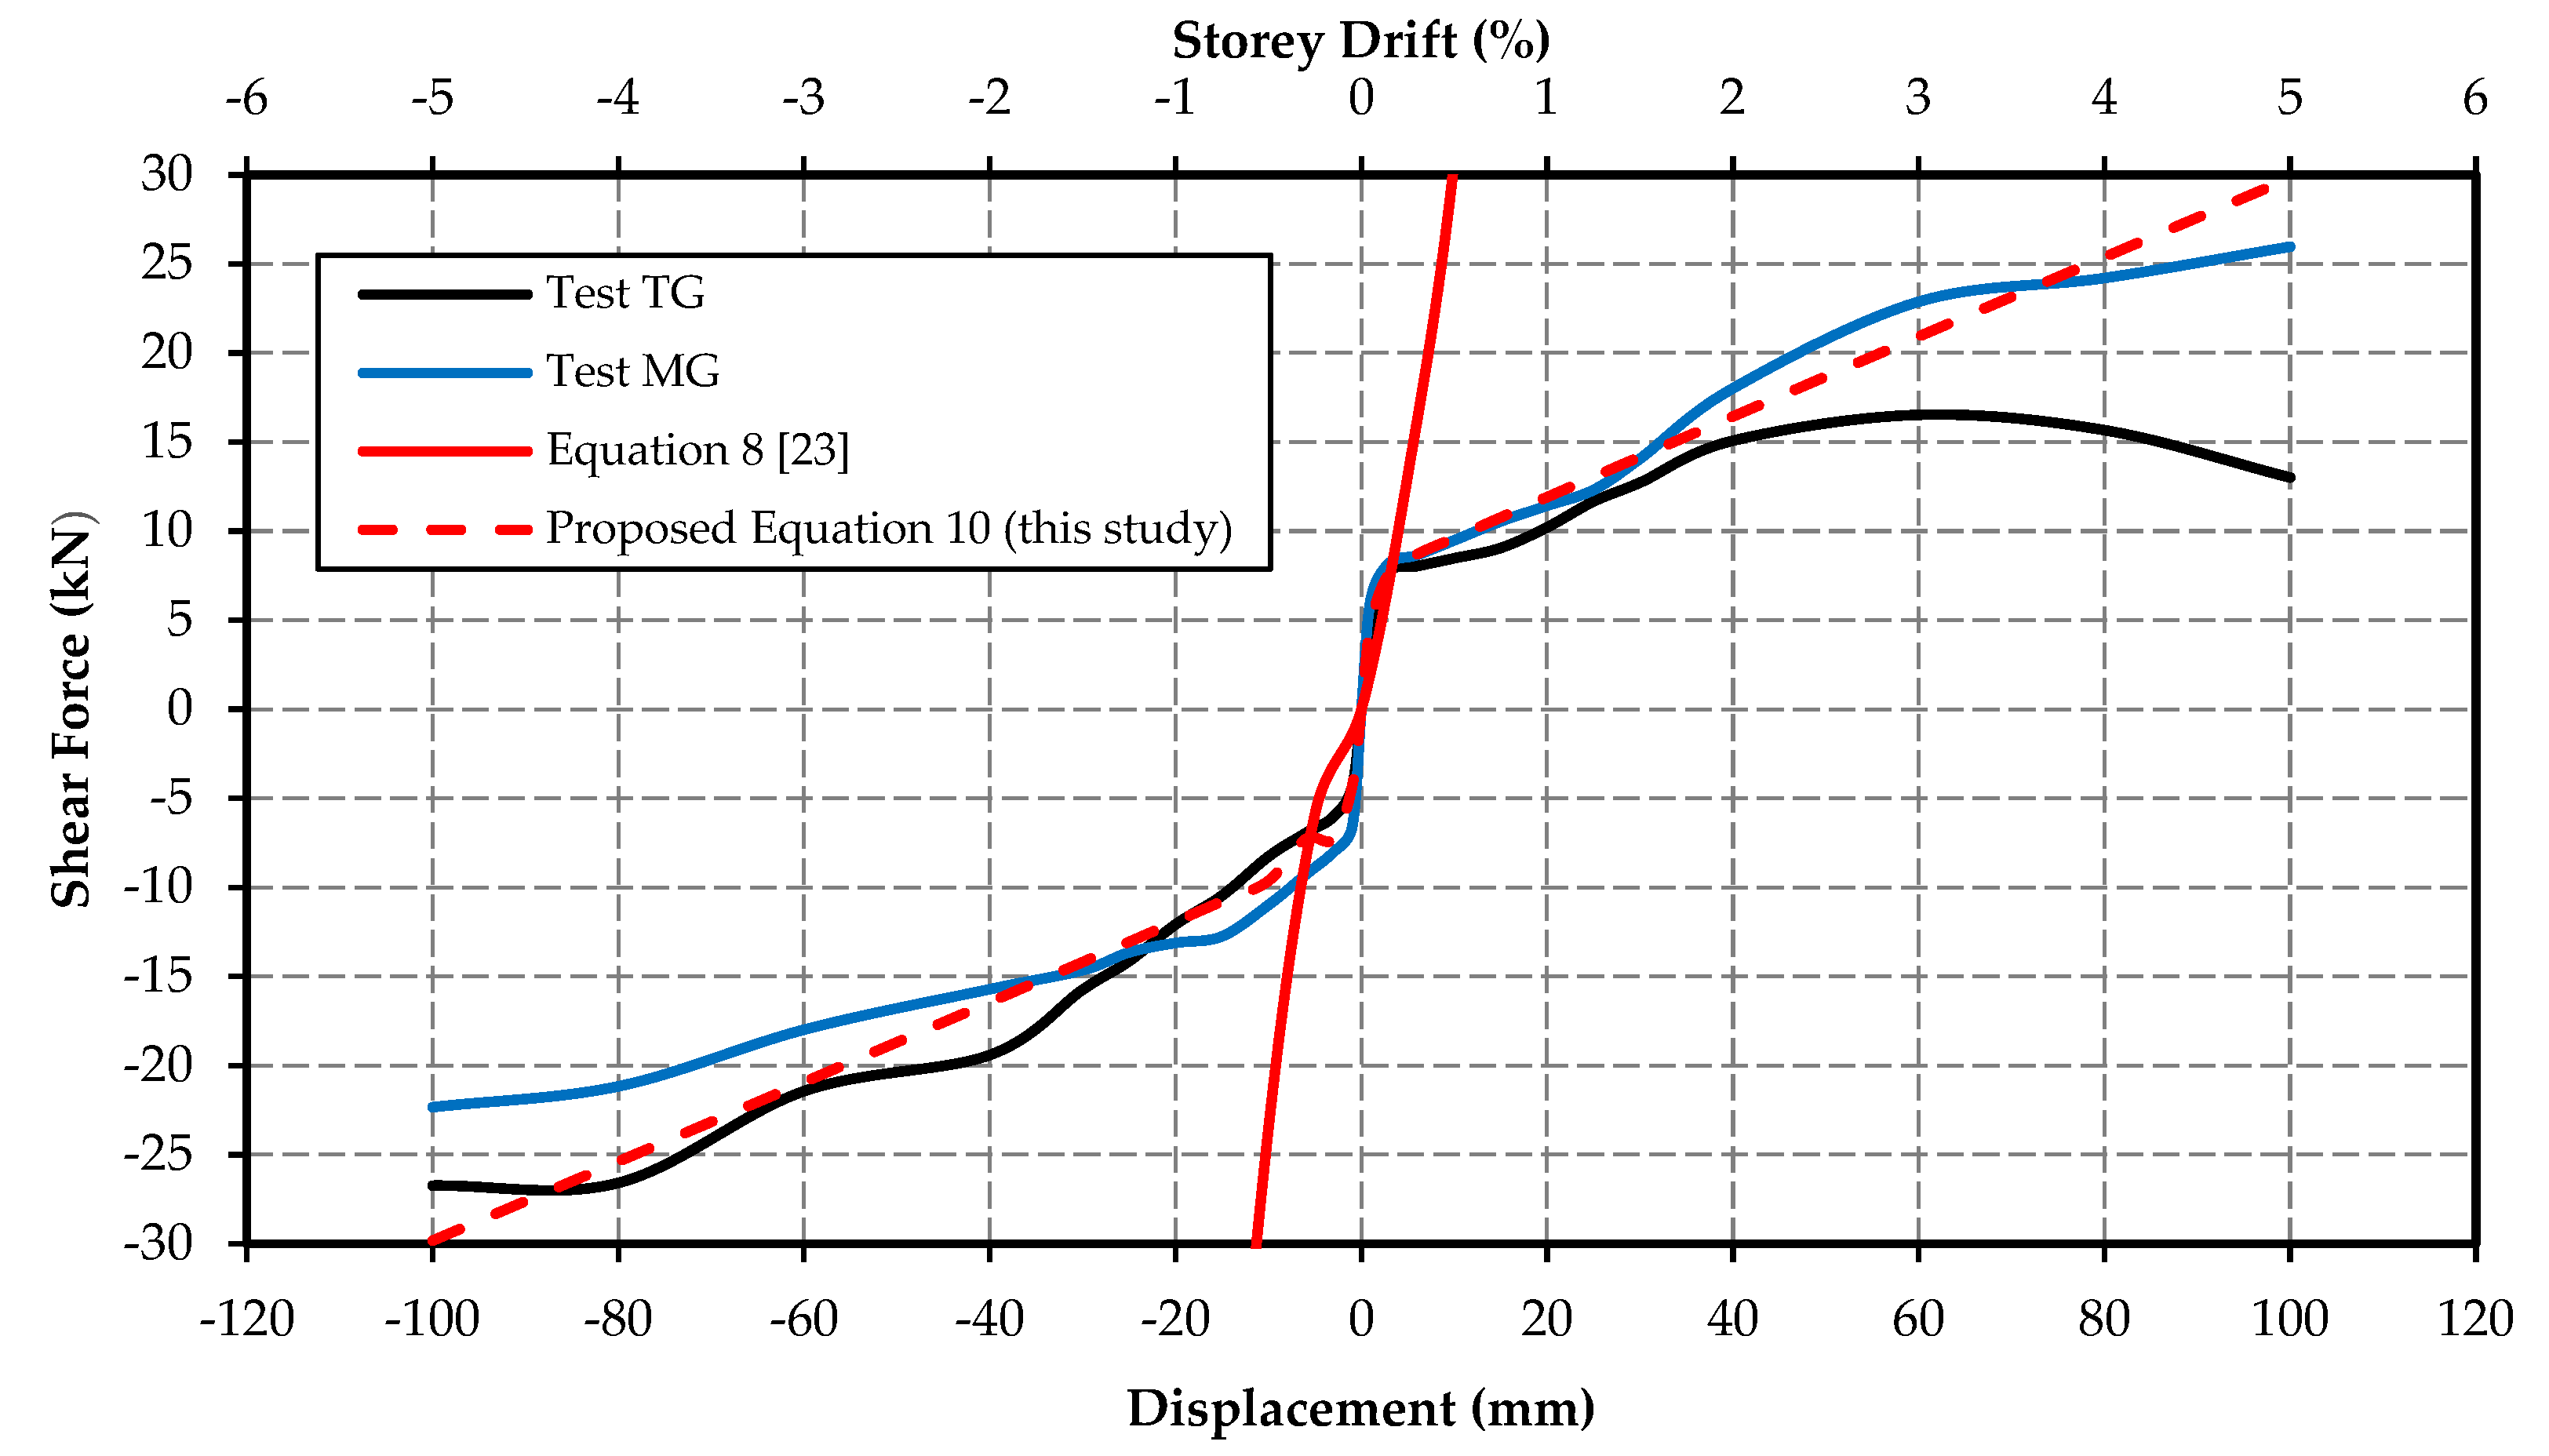
Figure 14 depicts the variation of the proposed theoretical model with the experimental results for the Type 2 SIM panel without a gap.
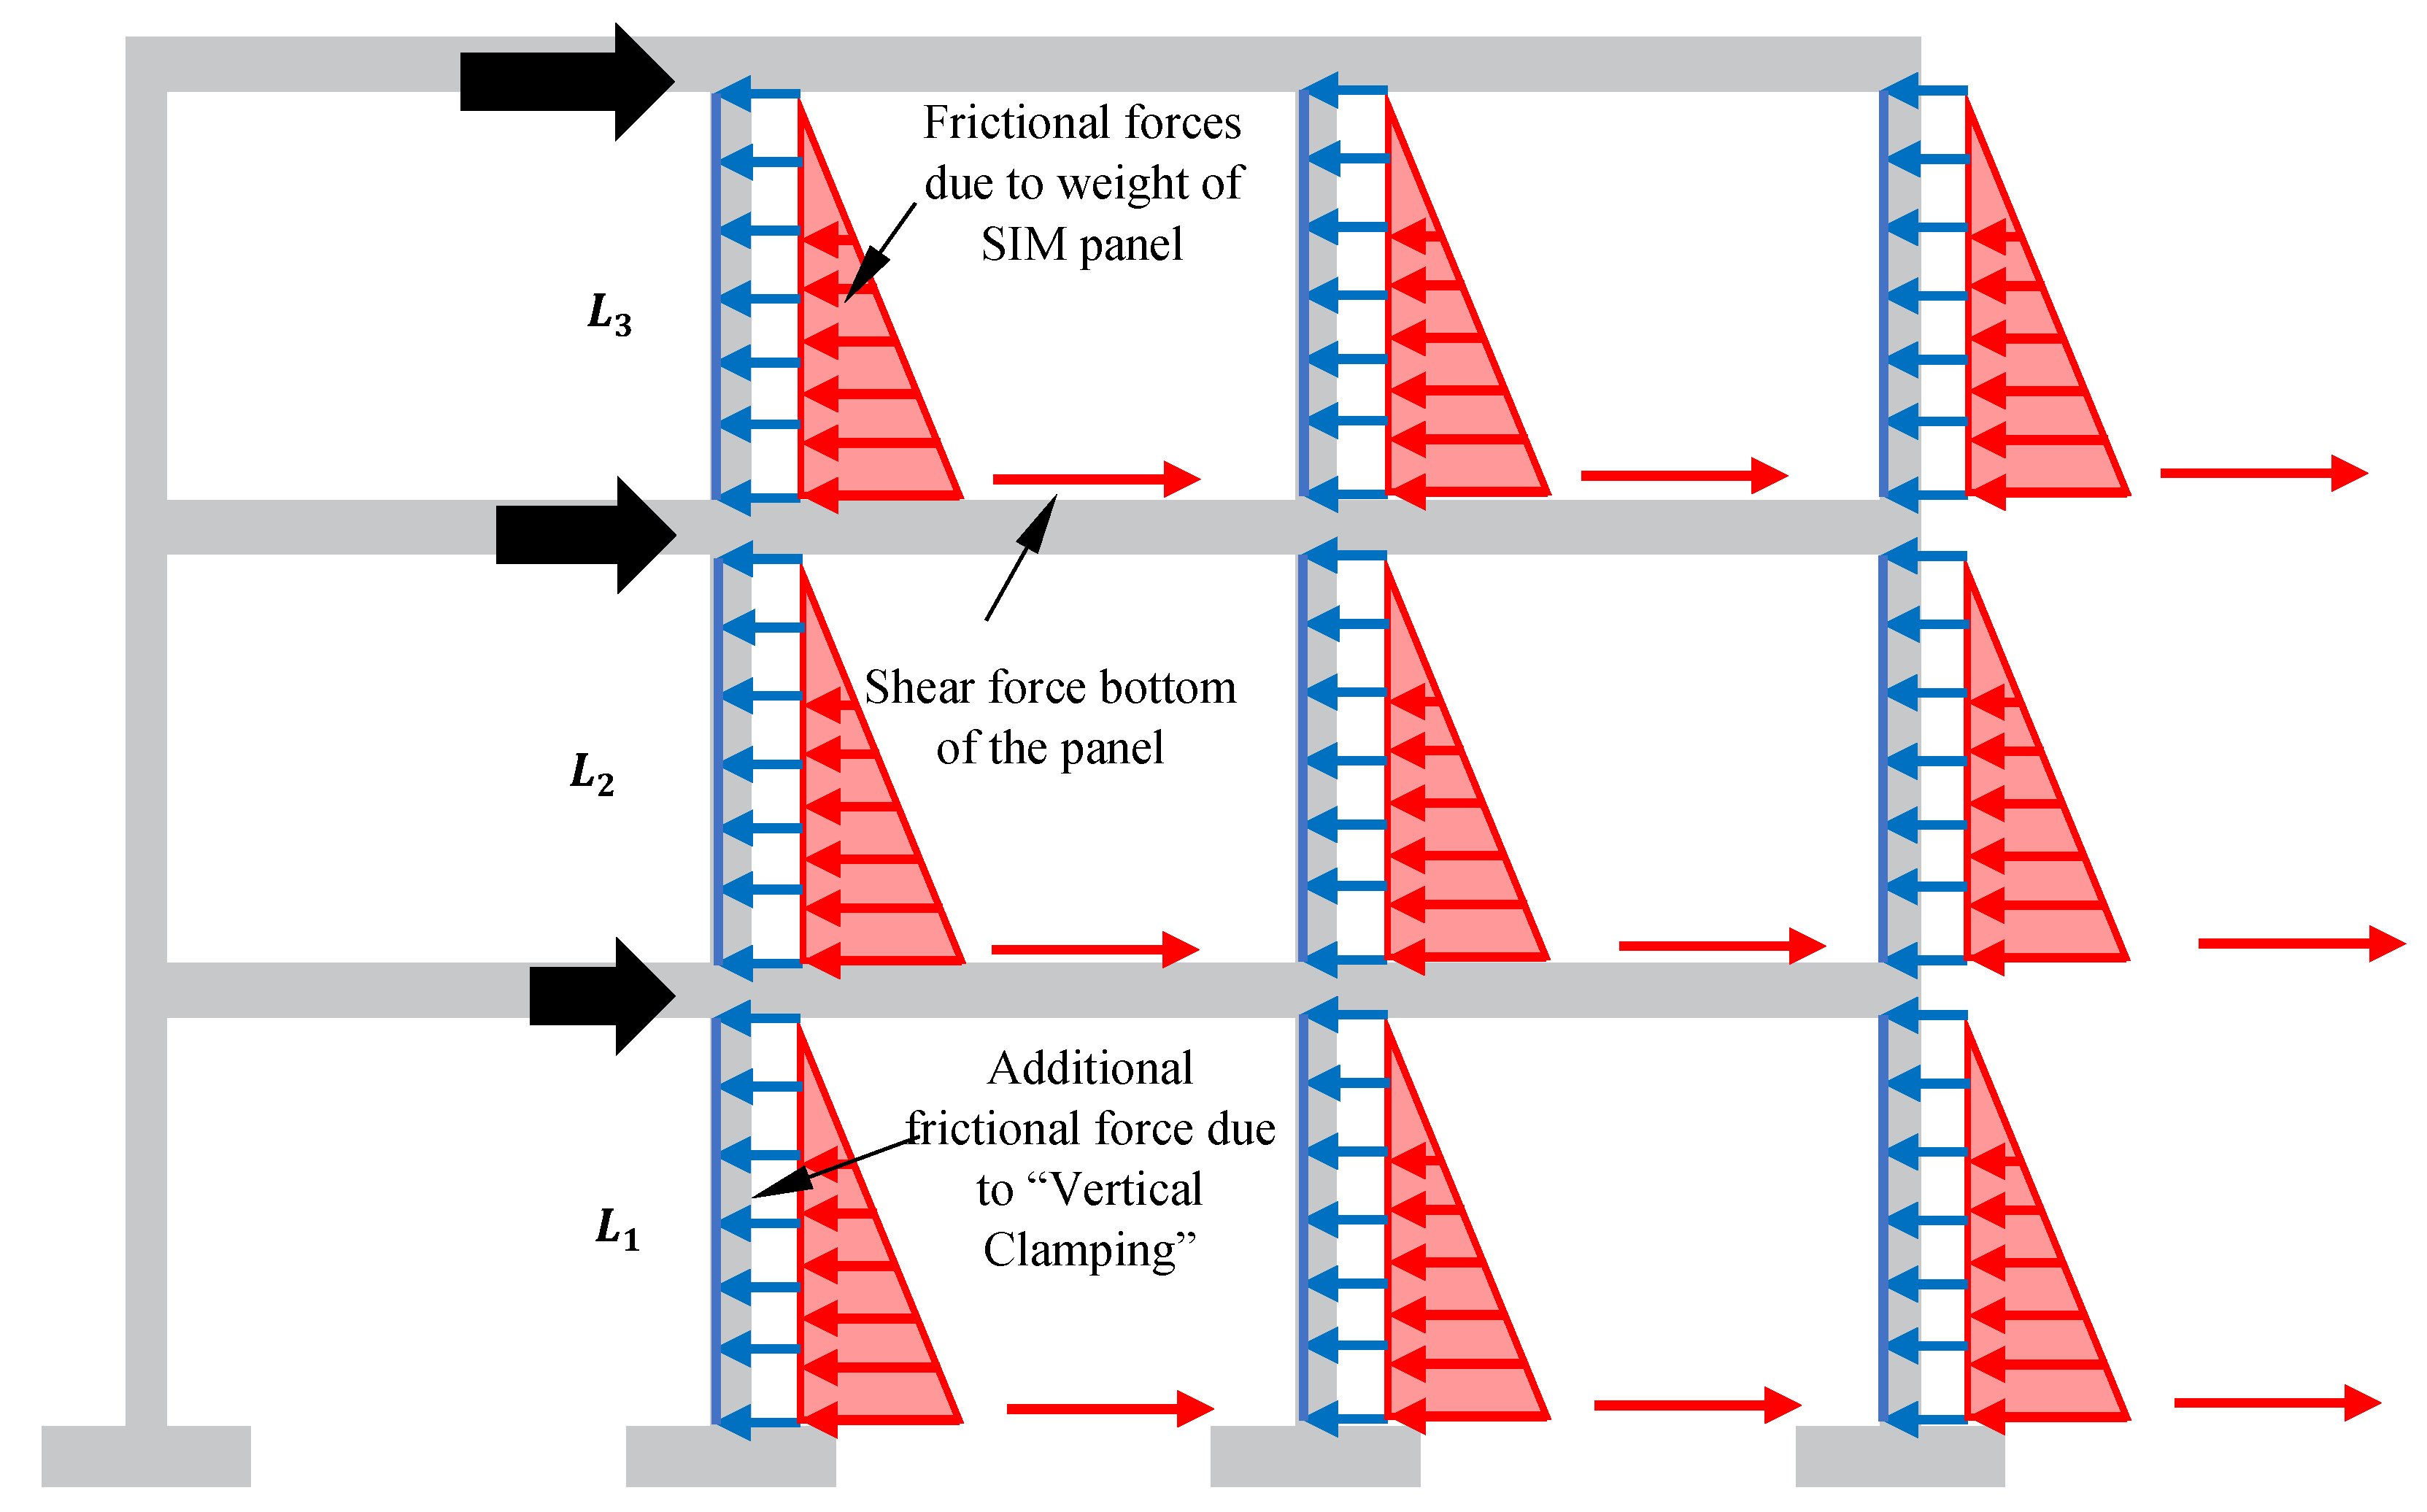
Figure 14 illustrates that the proposed theoretical model cannot predict the drop of shear force due to unit cracking. Furthermore, the additional frictional force due to clamping of the panel is also a function of displacement/storey drift of the structure. To achieve the correct response of the additional frictional force due to clamping of the panel, an iterative process was adopted in static analysis. The iterative method was applied until the assumed roof displacement was within 5% of the roof displacement in the Strand7 model. In this study, the frictional force developed on the bed joint, and the additional frictional force developed due to clamping can be idealized as trapezoidal resistance, as illustrated in
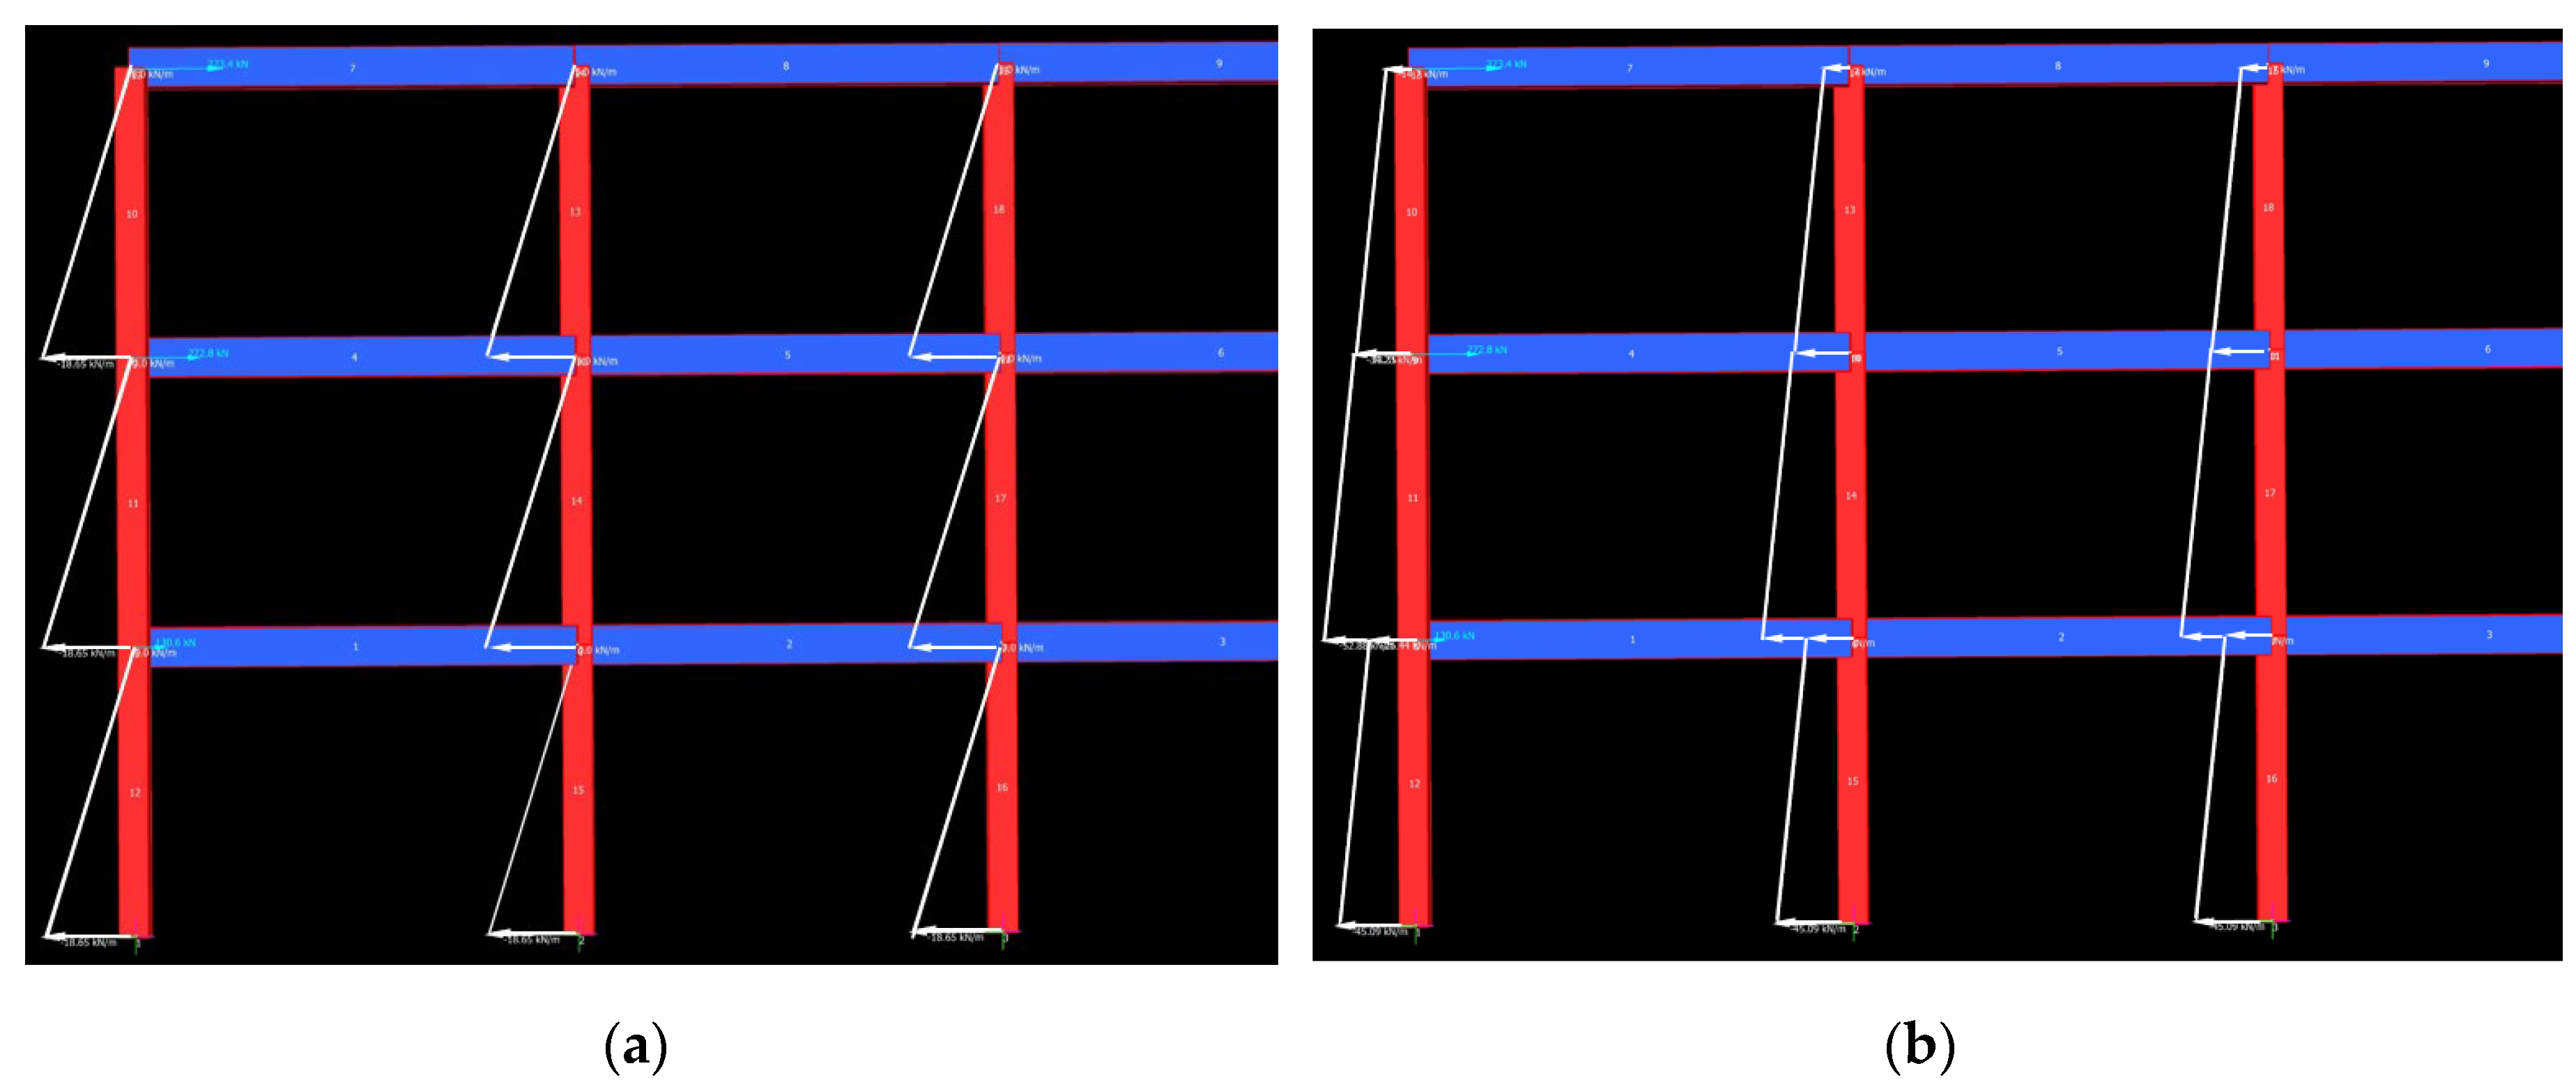
Figure 15. The model used for Type 1 and Type 2 SIM panels in Strand7 is presented in
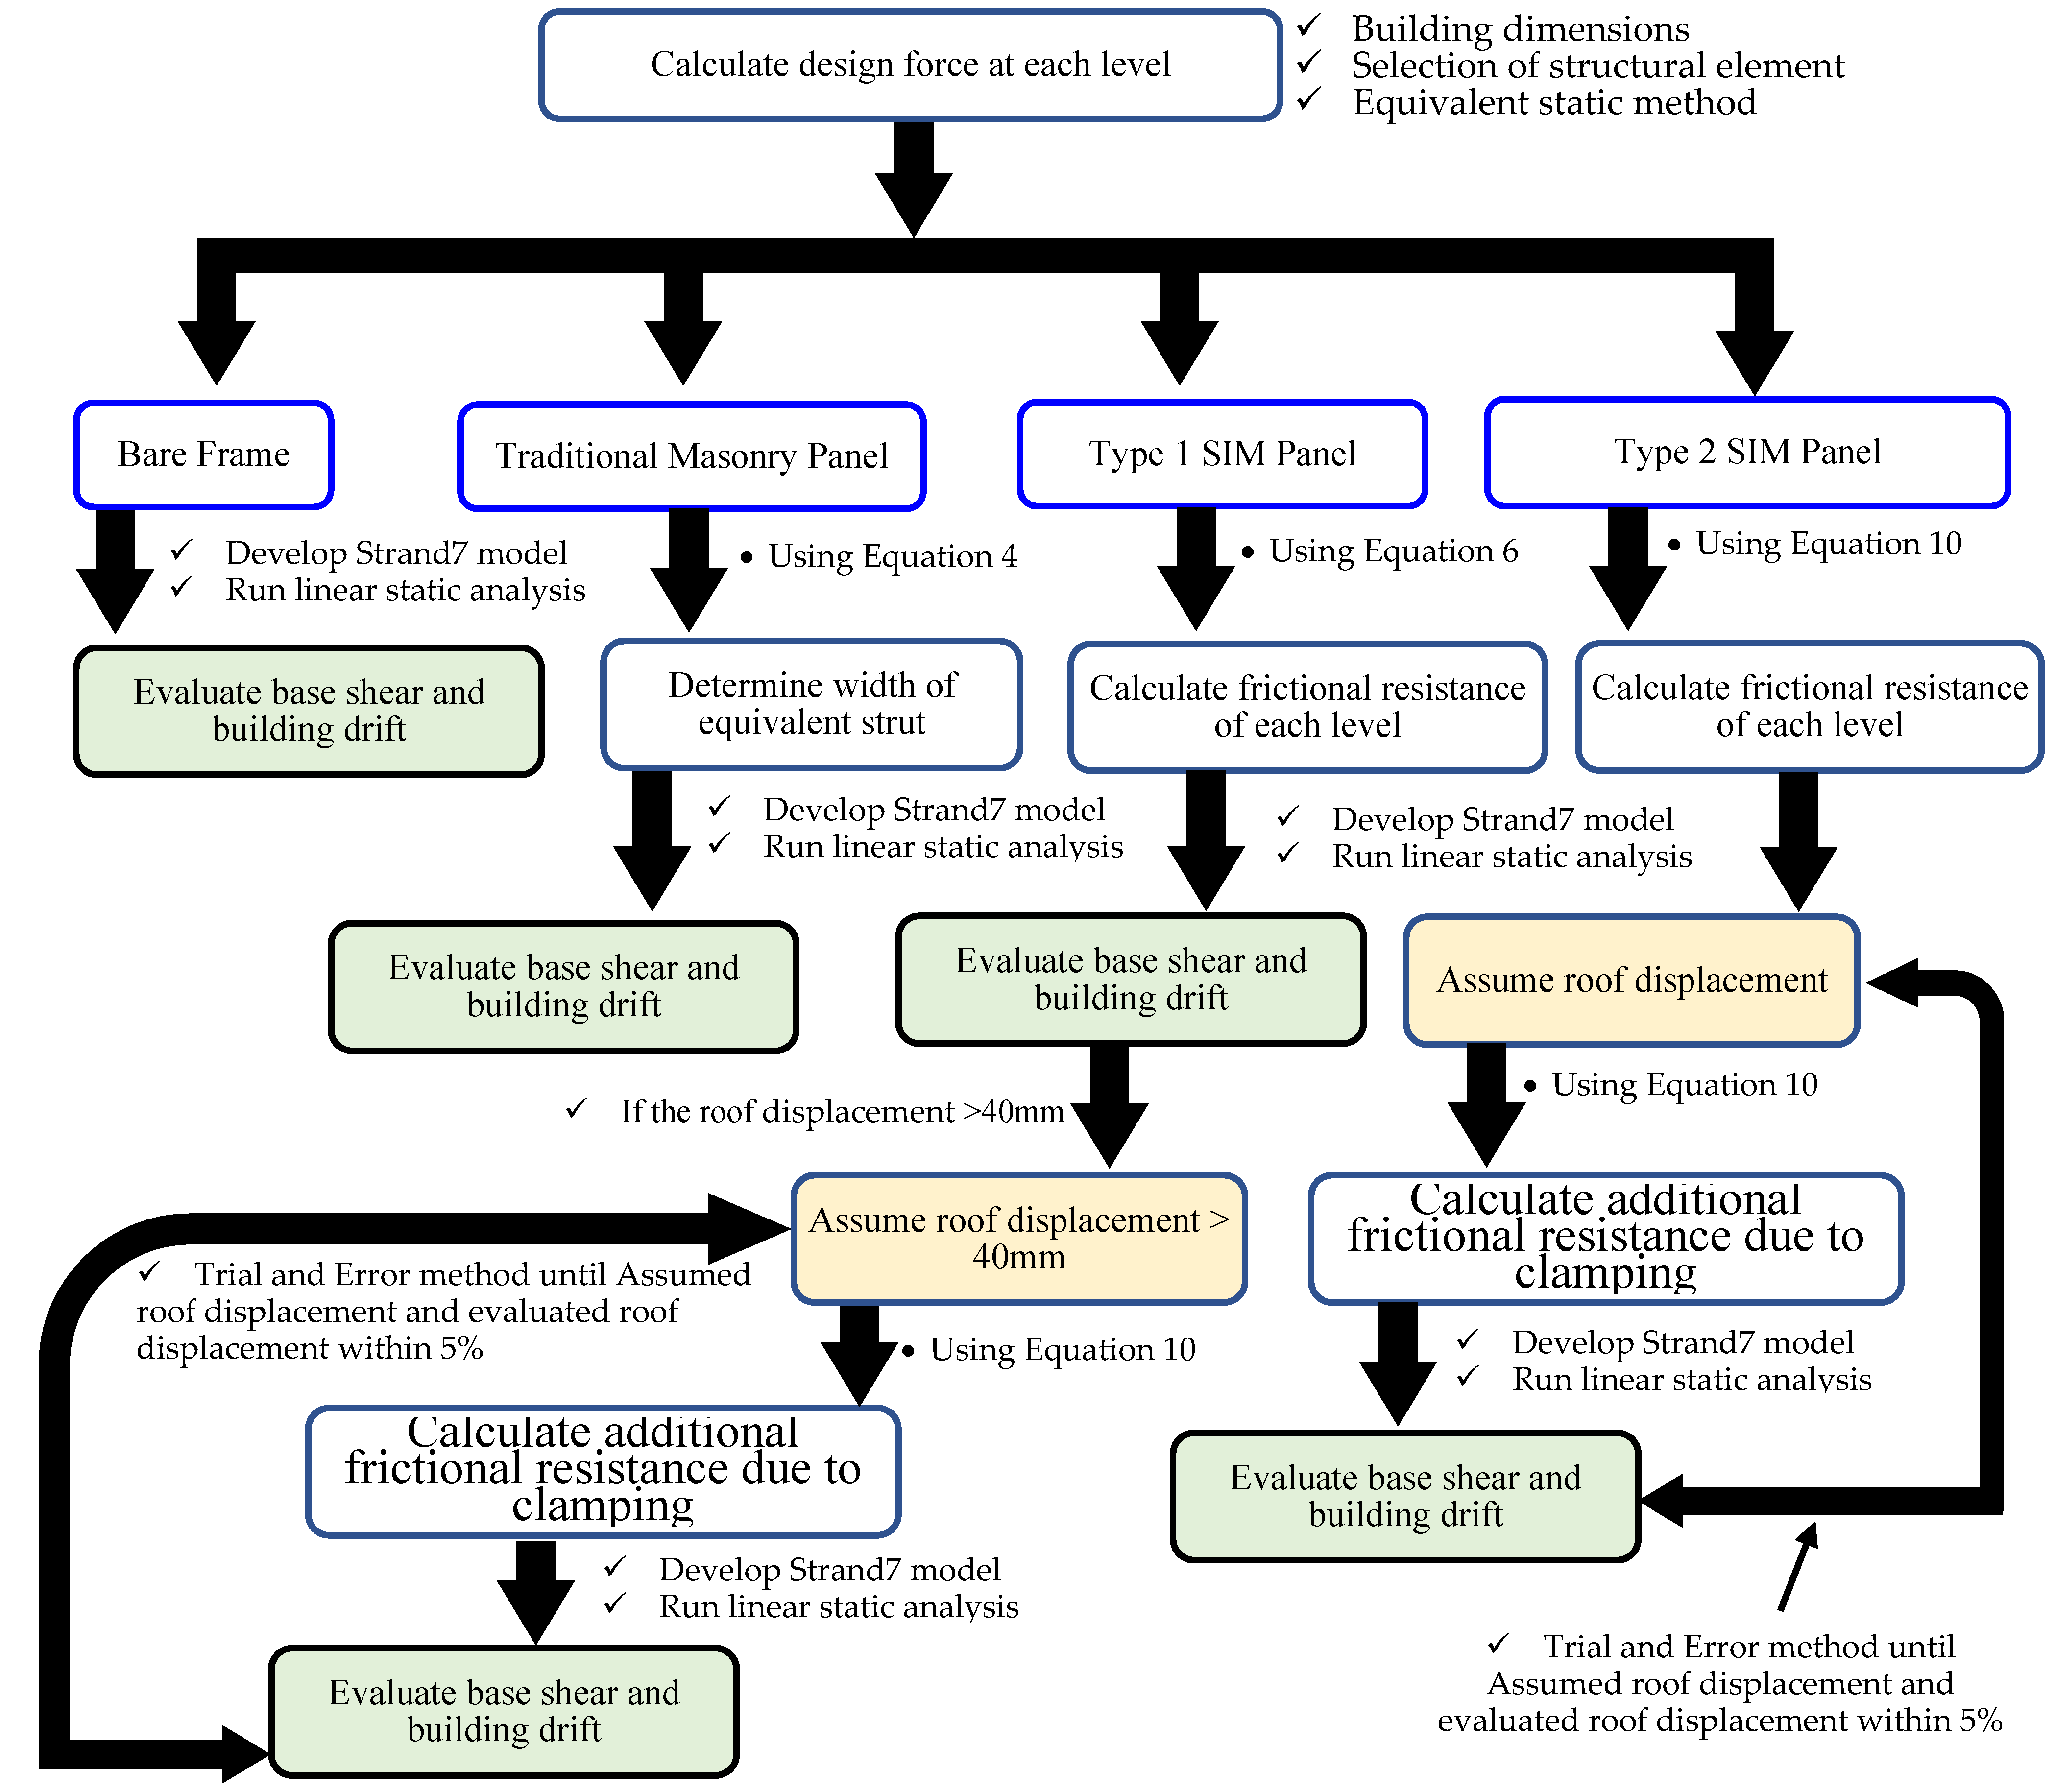
Figure 16. The overall workflow adopted in this study is illustrated in
Figure 17. The presented workflow, incorporating these calculations and analyses, provides a comprehensive understanding of the building's behavior under seismic conditions and is essential for evaluating its seismic performance.
Figure 1.
Typical structural damage in masonry infill panels caused by seismic activities [
6,
7].
Figure 1.
Typical structural damage in masonry infill panels caused by seismic activities [
6,
7].
Figure 2.
Semi-Interlocking Masonry (SIM) unit types: (a) Topological SIM unit; (b) Mechanical SIM unit.
Figure 2.
Semi-Interlocking Masonry (SIM) unit types: (a) Topological SIM unit; (b) Mechanical SIM unit.
Figure 3.
Elevation of models: (a) Bare frame; (b) Masonry panels infill.
Figure 3.
Elevation of models: (a) Bare frame; (b) Masonry panels infill.
Figure 4.
Geographic (Australasia) locations of structure considered in this study.
Figure 4.
Geographic (Australasia) locations of structure considered in this study.
Figure 5.
Modelling of bare frame: (a) Geometry of bare frame; (b) Model of bare frame in Strand7.
Figure 5.
Modelling of bare frame: (a) Geometry of bare frame; (b) Model of bare frame in Strand7.
Figure 6.
Representation of diagonal compressive strut for traditional masonry: (a) Traditional masonry panel; (b) Replacement of traditional panel by equivalent diagonal compressive strut.
Figure 6.
Representation of diagonal compressive strut for traditional masonry: (a) Traditional masonry panel; (b) Replacement of traditional panel by equivalent diagonal compressive strut.
Figure 7.
Modelling of bare frame: (a) Geometry of bare frame; (b) Model of bare frame in Strand7.
Figure 7.
Modelling of bare frame: (a) Geometry of bare frame; (b) Model of bare frame in Strand7.
Figure 8.
Type 1 SIM panels with gap, adopted from Totoev [
23].
Figure 8.
Type 1 SIM panels with gap, adopted from Totoev [
23].
Figure 9.
Comparison of experimental and analytical results for Type 1 SIM panel.
Figure 9.
Comparison of experimental and analytical results for Type 1 SIM panel.
Figure 10.
Idealised lateral load response for Type 1 SIM panel up to 2% storey drift.
Figure 10.
Idealised lateral load response for Type 1 SIM panel up to 2% storey drift.
Figure 11.
Type 2 SIM panels without a gap, adopted from Totoev [
23].
Figure 11.
Type 2 SIM panels without a gap, adopted from Totoev [
23].
Figure 12.
Comparison of theoretical and experimental results for Type 2 SIM panel without gap: (a) Shear force presented up to 3000kN; (b) Shear force presented up to 30kN.
Figure 12.
Comparison of theoretical and experimental results for Type 2 SIM panel without gap: (a) Shear force presented up to 3000kN; (b) Shear force presented up to 30kN.
Figure 13.
Variation of reduction factor for Type 2 SIM panel.
Figure 13.
Variation of reduction factor for Type 2 SIM panel.
Figure 14.
Comparison between the experimental results and the proposed theoretical model.
Figure 14.
Comparison between the experimental results and the proposed theoretical model.
Figure 15.
Idealized lateral load response for Type 2 SIM panel without gap.
Figure 15.
Idealized lateral load response for Type 2 SIM panel without gap.
Figure 16.
Model of SIM panel: (a) Strand7 model of Type 1 SIM panel with gap of up to 40 mm in-plane displacement; (b) Strand7 Model of Type 1 SIM panel for after 40 mm displacement and Type 2 SIM panel without gap.
Figure 16.
Model of SIM panel: (a) Strand7 model of Type 1 SIM panel with gap of up to 40 mm in-plane displacement; (b) Strand7 Model of Type 1 SIM panel for after 40 mm displacement and Type 2 SIM panel without gap.
Figure 17.
Overall workflow for this study.
Figure 17.
Overall workflow for this study.
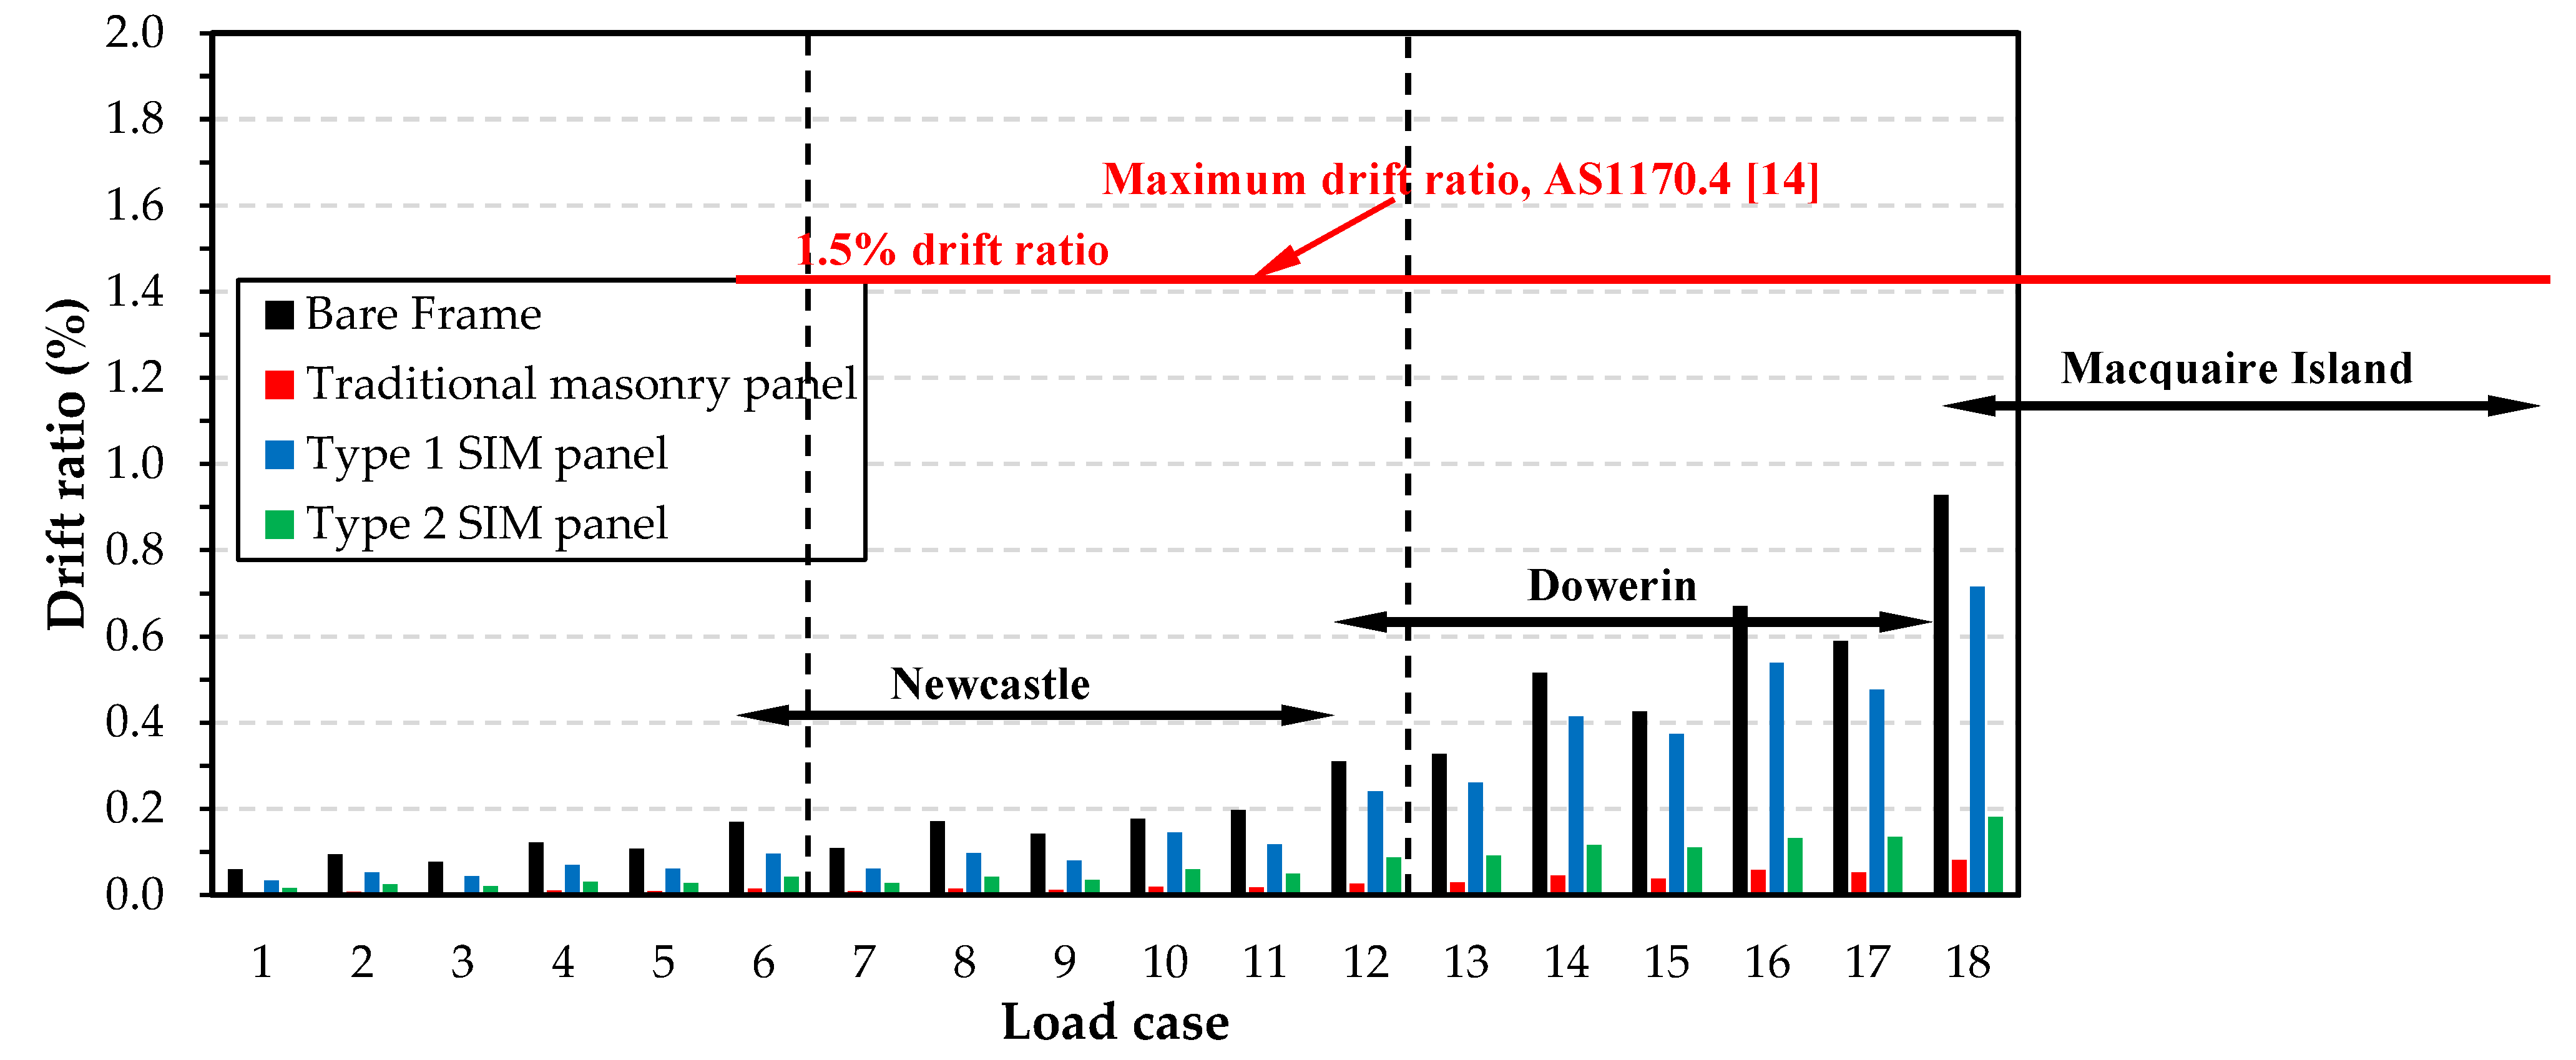
Figure 18.
Variation of drift ratio of different structures for all load cases.
Figure 18.
Variation of drift ratio of different structures for all load cases.
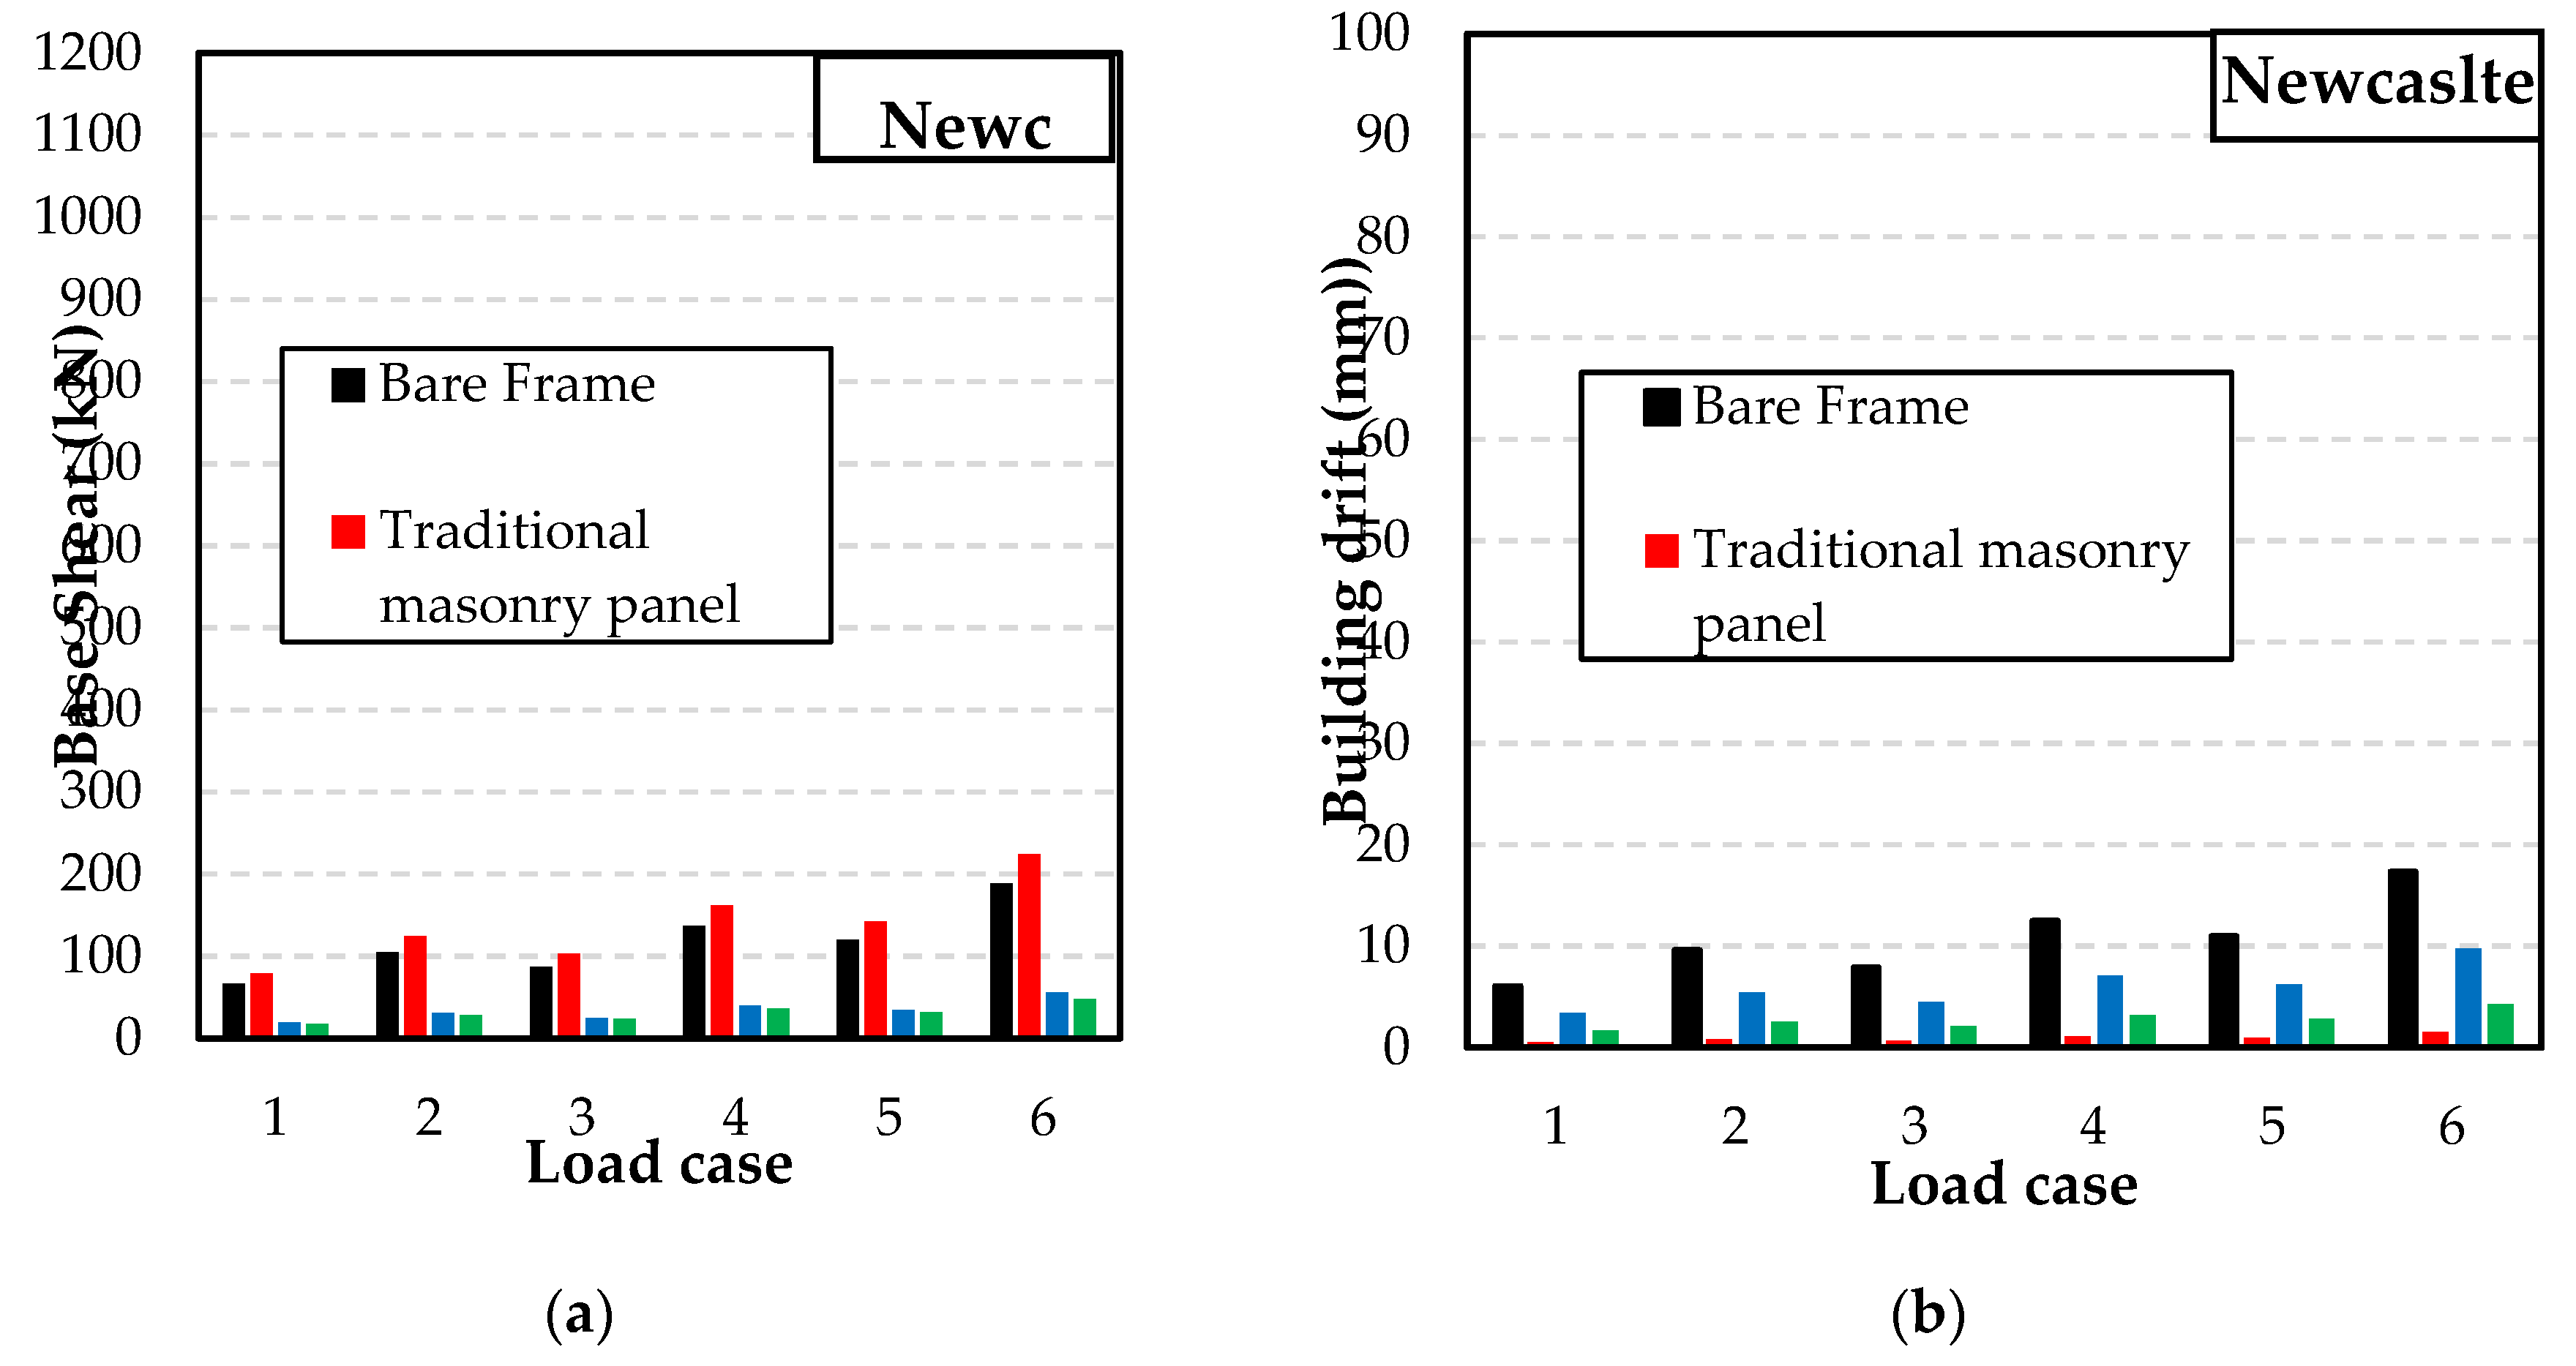
Figure 19.
Variation of shear force and building drift for low risk seismic region: (a) Base shear; (b) Building drift.
Figure 19.
Variation of shear force and building drift for low risk seismic region: (a) Base shear; (b) Building drift.
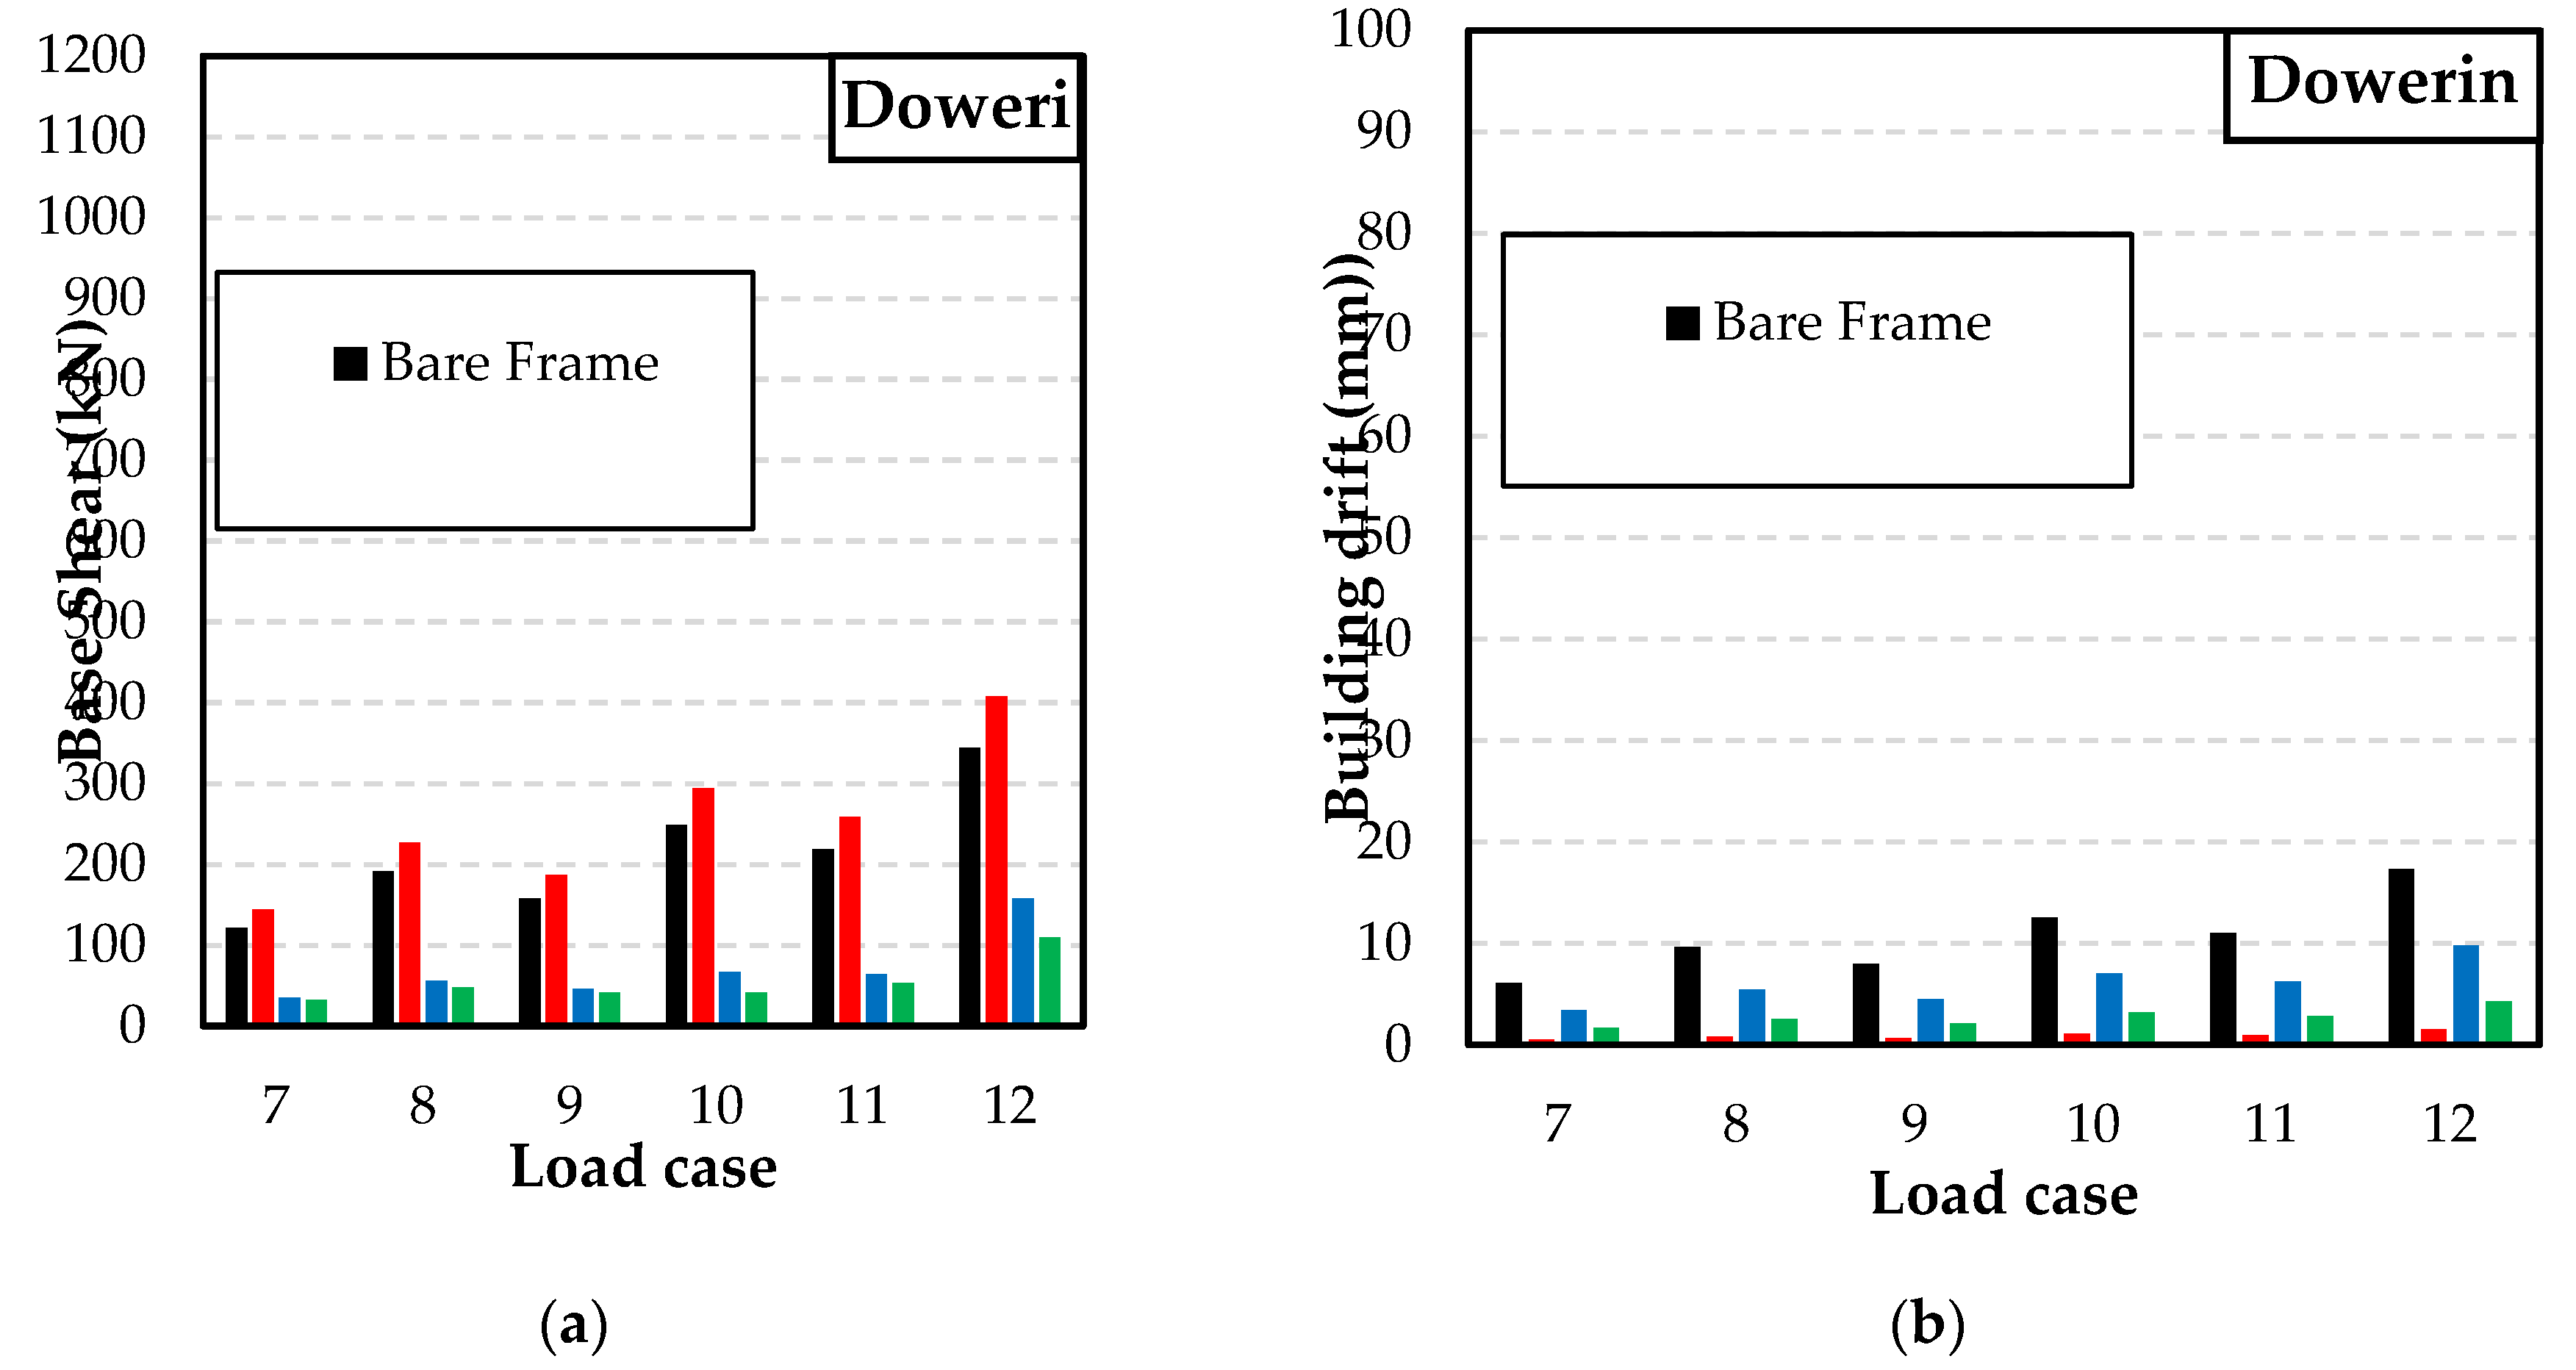
Figure 20.
Variation of shear force and building drift for medium risk seismic region: (a) Base shear; (b) Building drift.
Figure 20.
Variation of shear force and building drift for medium risk seismic region: (a) Base shear; (b) Building drift.
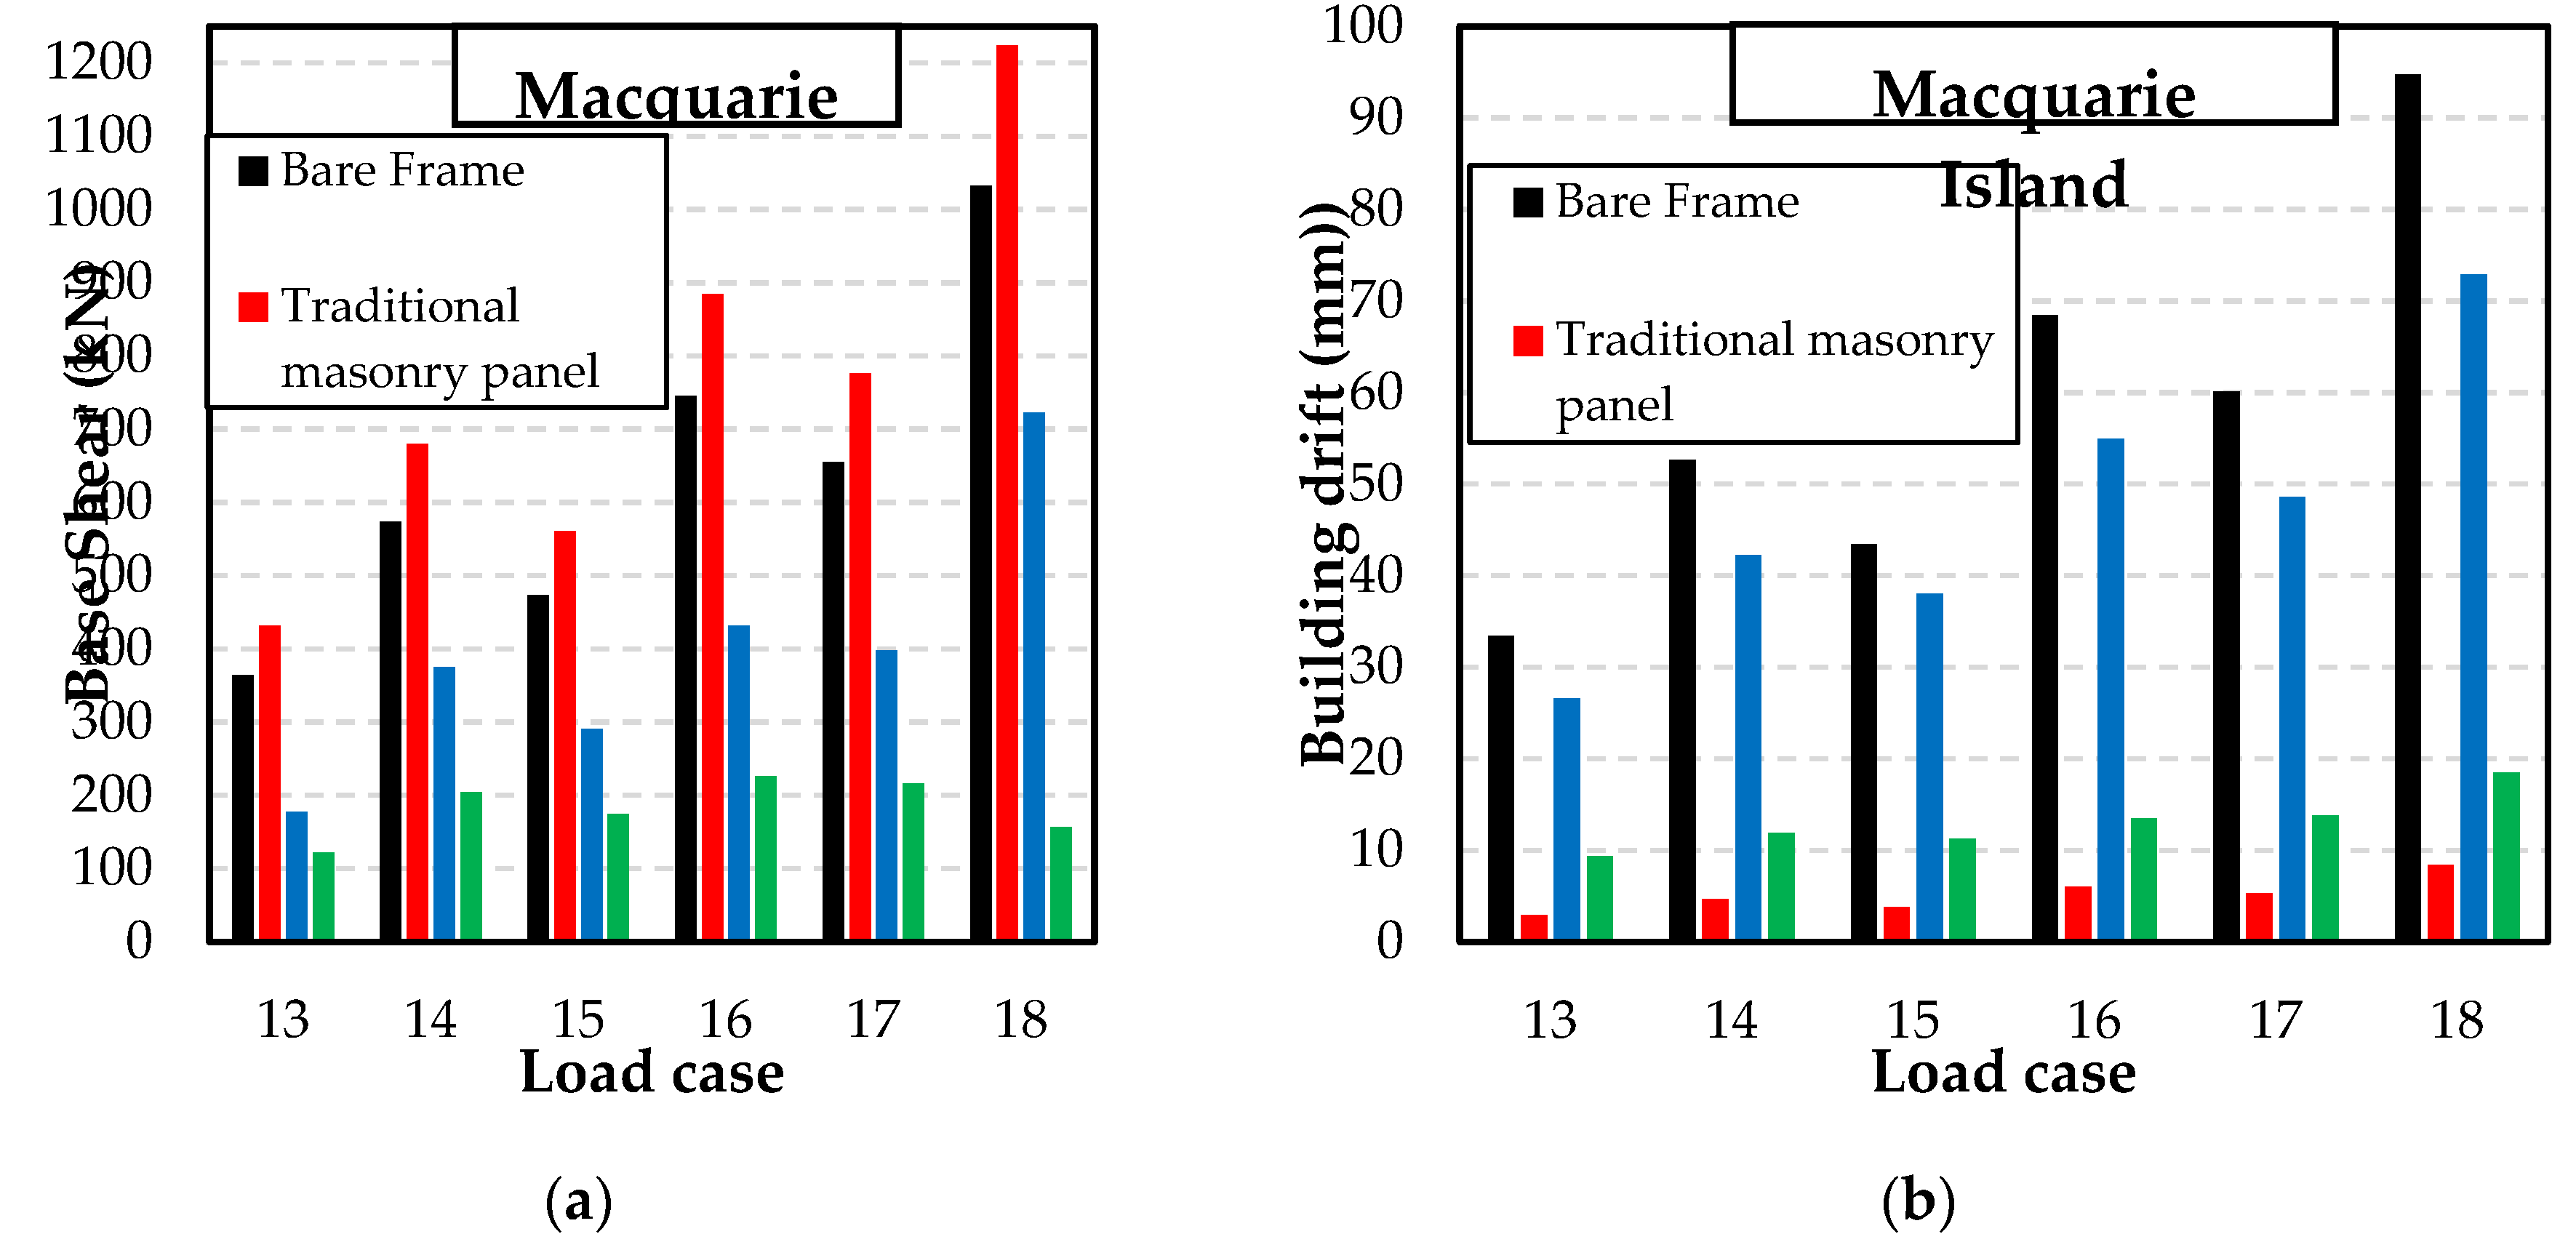
Figure 21.
Variation of shear force and building drift for high risk seismic region: (a) Base shear; (b) Building drift.
Figure 21.
Variation of shear force and building drift for high risk seismic region: (a) Base shear; (b) Building drift.
Table 1.
Key properties of bare frame, masonry panels and loading conditions.
Table 1.
Key properties of bare frame, masonry panels and loading conditions.
| Parameter |
Notation |
Value |
| Panel length |
Lp |
4 m |
| Panel height |
Hp |
3 m |
| Panel thickness |
tp |
0.11 m [15] |
| Density of SIM and masonry panel |
ρSIM |
22.1 kg/m3 [11] |
| Coefficient of friction of SIM units |
μSIM |
0.75 [12] |
| Column width |
bc |
0.3 m |
| Column depth |
dc |
0.3 m |
| Concrete column unit weight |
γc |
24.5 kN/m3 [15] |
| Beam width |
bb |
0.4 m |
| Beam depth |
db |
0.4 m |
| Permanent load |
G |
0.5 kPa [14] |
| Imposed load |
Q |
2 kPa [14] |
| Width of slab |
w |
4 m |
| Earthquake combination factor for live load |
ΨE |
0.3 [14] |
| Design life of structure |
- |
50 years [16] |
| Modulus of elasticity of column |
Ec,
|
32000 MPa [15] |
| Modulus of elasticity of beam |
Eb |
33000 MPa [15] |
| Density of column |
ρc |
2281 kg/m3 [15] |
| Density of beam |
ρb |
2350 kg/m3 [15] |
| Elastic modulus of SIM unit |
ESIM |
26365 MPa [15] |
Table 2.
Consequences of failure corresponding to different importance levels, as adopted from NCC 2022 [
18].
Table 2.
Consequences of failure corresponding to different importance levels, as adopted from NCC 2022 [
18].
| Importance level |
Building Types |
| 1 |
Buildings or structures presenting a low degree of hazard to life and other property in the case of failure |
| 2 |
Buildings or structures not included in Importance Level 1, 3 and 4 |
| 3 |
Buildings or structures that are designed to contain a large number of people |
| 4 |
Buildings or structures that are essential to post-disaster recovery or associated with hazardous facilities |
Table 3.
Criterions employed for determination of equivalent static force.
Table 3.
Criterions employed for determination of equivalent static force.
| Criteria 1 |
Criteria 2 |
Criteria 3 |
| Location |
Hazard design
factor, Z |
Importance
level |
Probability
factor, kp
|
Site
class |
Spectral shape
factor, Ch(T1) |
| Newcastle |
0.11 (Low risk) |
2 |
1 |
Ce
|
2.34 |
| Dowerin |
0.2 (Medium risk) |
3 |
1.3 |
De
|
3.68 |
| Macquarie Island |
0.6 (High risk) |
4 |
1.8 |
- |
- |
Table 4.
Case details for each structure.
Table 4.
Case details for each structure.
| Load case |
Location |
Importance level |
Site class |
| 1 |
Newcastle |
2 |
Ce
|
| 2 |
Newcastle |
2 |
De
|
| 3 |
Newcastle |
3 |
Ce
|
| 4 |
Newcastle |
3 |
De
|
| 5 |
Newcastle |
4 |
Ce
|
| 6 |
Newcastle |
4 |
De
|
| 7 |
Dowerin |
2 |
Ce
|
| 8 |
Dowerin |
2 |
De
|
| 9 |
Dowerin |
3 |
Ce
|
| 10 |
Dowerin |
3 |
De
|
| 11 |
Dowerin |
4 |
Ce
|
| 12 |
Dowerin |
4 |
De
|
| 13 |
Macquarie Island |
2 |
Ce
|
| 14 |
Macquarie Island |
2 |
De
|
| 15 |
Macquarie Island |
3 |
Ce
|
| 16 |
Macquarie Island |
3 |
De
|
| 17 |
Macquarie Island |
4 |
Ce
|
| 18 |
Macquarie Island |
4 |
De
|
Table 5.
Summary of base shear and drift ratio for all 18 load cases.
Table 5.
Summary of base shear and drift ratio for all 18 load cases.
Load
Case |
Bare frame |
Traditional masonry
panel |
Type 1 SIM panel |
Type 2 SIM panel |
| Base Shear (kN) |
Drift
(mm) |
Drift ratio |
Base Shear (kN) |
Drift
(mm) |
Drift ratio |
Base Shear (kN) |
Drift
(mm) |
Drift ratio |
Base Shear (kN) |
Drift
(mm) |
Drift ratio |
| 1 |
66.7 |
6.12 |
0.06% |
79.1 |
0.54 |
0.01% |
19 |
3.45 |
0.03% |
18 |
1.7 |
0.02% |
| 2 |
105.1 |
9.65 |
0.09% |
124.6 |
0.85 |
0.01% |
31 |
5.44 |
0.05% |
28 |
2.5 |
0.02% |
| 3 |
86.8 |
7.96 |
0.08% |
102.8 |
0.7 |
0.01% |
25 |
4.49 |
0.04% |
24 |
2.1 |
0.02% |
| 4 |
136.7 |
12.54 |
0.12% |
162 |
1.11 |
0.01% |
40 |
7.08 |
0.07% |
36 |
3.2 |
0.03% |
| 5 |
120.1 |
11.02 |
0.11% |
142.4 |
0.97 |
0.01% |
35 |
6.23 |
0.06% |
32 |
2.9 |
0.03% |
| 6 |
189.3 |
17.37 |
0.17% |
224.3 |
1.53 |
0.02% |
56 |
9.79 |
0.10% |
48 |
4.3 |
0.04% |
| 7 |
121.4 |
11.14 |
0.11% |
143.8 |
0.98 |
0.01% |
35 |
6.29 |
0.06% |
32 |
2.9 |
0.03% |
| 8 |
191.2 |
17.54 |
0.17% |
226.6 |
1.55 |
0.02% |
56 |
9.9 |
0.10% |
48 |
4.3 |
0.04% |
| 9 |
157.8 |
14.48 |
0.14% |
187 |
1.28 |
0.01% |
46 |
8.25 |
0.08% |
41 |
3.7 |
0.04% |
| 10 |
248.5 |
18.02 |
0.18% |
294.6 |
2.01 |
0.02% |
67 |
14.78 |
0.14% |
41 |
6.1 |
0.06% |
| 11 |
218.4 |
20.04 |
0.20% |
258.9 |
1.77 |
0.02% |
64 |
11.96 |
0.12% |
53 |
5.1 |
0.05% |
| 12 |
344.1 |
31.57 |
0.31% |
407.9 |
2.79 |
0.03% |
158 |
24.47 |
0.24% |
110 |
8.9 |
0.09% |
| 13 |
364.1 |
33.4 |
0.33% |
431.5 |
2.95 |
0.03% |
178 |
26.56 |
0.26% |
122 |
9.4 |
0.09% |
| 14 |
573.5 |
52.62 |
0.52% |
679.8 |
4.65 |
0.05% |
375 |
42.23 |
0.41% |
204 |
11.9 |
0.12% |
| 15 |
473.3 |
43.43 |
0.43% |
561 |
3.84 |
0.04% |
291 |
38.05 |
0.37% |
175 |
11.3 |
0.11% |
| 16 |
745.5 |
68.41 |
0.67% |
883.7 |
6.04 |
0.06% |
432 |
54.96 |
0.54% |
226 |
13.5 |
0.13% |
| 17 |
655.3 |
60.12 |
0.59% |
776.7 |
5.31 |
0.05% |
394 |
48.62 |
0.48% |
216 |
13.8 |
0.14% |
| 18 |
1032.3 |
94.72 |
0.93% |
1223.6 |
8.37 |
0.08% |
723 |
72.89 |
0.71% |
157 |
18.5 |
0.18% |
Table 6.
Contribution of SIM panels to resisting the lateral load in Strand7 analysis.
Table 6.
Contribution of SIM panels to resisting the lateral load in Strand7 analysis.
| Load case |
Location |
Frictional capacity of the SIM panels (Type 1 and Type 2) |
| Level 3 (L3) panel |
Level 2 (L2) panel |
Level 1 (L1) panel |
| 1 |
Newcastle |
12% |
22% |
27% |
| 2 |
Newcastle |
19% |
34% |
42% |
| 3 |
Newcastle |
15% |
28% |
36% |
| 4 |
Newcastle |
23% |
44% |
59% |
| 5 |
Newcastle |
19% |
39% |
56% |
| 6 |
Newcastle |
31% |
61% |
82% |
| 7 |
Dowerin |
18% |
39% |
54% |
| 8 |
Dowerin |
32% |
62% |
85% |
| 9 |
Dowerin |
23% |
51% |
65% |
| 10 |
Dowerin |
33% |
79% |
FULL |
| 11 |
Dowerin |
37% |
71% |
94% |
| 12 |
Dowerin |
52% |
FULL |
FULL |
| 13 |
Macquarie Island |
58% |
FULL |
FULL |
| 14 |
Macquarie Island |
92% |
FULL |
FULL |
| 15 |
Macquarie Island |
77% |
FULL |
FULL |
| 16 |
Macquarie Island |
FULL |
FULL |
FULL |
| 17 |
Macquarie Island |
FULL |
FULL |
FULL |
| 18 |
Macquarie Island |
FULL |
FULL |
FULL |
