Submitted:
19 June 2024
Posted:
19 June 2024
You are already at the latest version
Abstract

Keywords:
1. Introduction
2. Materials and Methods
2.1. Materials
2.2. Synthesis of ZnO Loaded Activated Carbon (ZnO@GAC)
2.3. Characterization
2.4. Photocatalytic Degradation Test
2.5. Batch Adsorption Test
2.6. Stability Test
3. Results and Discussion
3.1. Characterization
3.1.1. XRD Analysis
3.1.2. BET Measurement
3.1.3. SEM/EDX Analysis
3.1.4. TGA/DTG Analysis
3.2. Photocatalytic Performance
3.3. Stability Test and TOC Removal
3.4. Adsorptive Performance
3.5. Plausible Photocatalytic Degradation Mechanism
Conclusion
Author Contributions
References
- Nasr, R. A., Ali, E. A., 2022. Polyethersulfone/gelatin nano-membranes for the Rhodamine B dye removal and textile industry effluents treatment under cost effective condition, Journal of Environmental Chemical Engineering, 10, 107250.
- Valadez-Renteria, E., Oliva, J., Rodriguez-Gonzalez, V., 2022. A sustainable and green chlorophyll/TiO2:W composite supported on recycled plastic bottle caps for the complete removal of Rhodamine B contaminant from drinking water, Journal of Environmental Management, 315, 115204.
- Alivio, R. K. O., Go, A. W., Angkawijaya, A. E., Santoso, S. P., Gunarto, C., Soetaredjo, F. E., 2023. Extractives-free sugarcane bagasse as adsorbent for the removal of Rhodamine B (Basic Violet 10) with high capacity and reusability, Journal of Industrial and Engineering Chemistry, 124, 175-200.
- Mustafa, F. S., Aziz, K. H. H., 2023. Heterogeneous catalytic activation of persulfate for the removal of rhodamine B and diclofenac pollutants from water using iron-impregnated biochar derived from the waste of black seed pomace, Process Safety and Environmental Protection, 170, 436-448.
- Adegoke, K. A., Adegoke, O. R., Araoye, A. O., Ogunmodede, J., Agboola, O. S., Bello, O. S., 2022. Engineered raw, carbonaceous, and modified biomass-based adsorbents for Rhodamine B dye removal from water and wastewater, Bioresource Technology Reports, 18, 101082.
- Ray, U., Banerjee, D., Das, D., Sarkar, S., Chattopadhyay, K. K., 2022. Photo-induced catalytic removal of rhodamine-B by aligned silicon nanowires developed through metal assisted chemical etching, Materials Characterization, 188, 111906.
- Nam, S-N., Kim, S., Her, N., Choong, C. E., Jang, M., Park, C. M., Heo, J., Yoon, Y., 2022. Performance assessment and optimization of forward osmosis–low pressure ultrafiltration hybrid system using machine learning for rhodamine B removal, Desalination, 543, 116102.
- Gharbani, P., Mehrizad, A., 2022. Preparation and characterization of graphitic carbon nitrides/polyvinylidene fluoride adsorptive membrane modified with chitosan for Rhodamine B dye removal from water: Adsorption isotherms, kinetics and thermodynamics, Carbohydrate Polymers, 277, 118860.
- Vigneshwaran, S., Park, C. M., Meenakshi, S., 2021. Designed fabrication of sulfide-rich bi-metallic-assembled MXene layered sheets with dramatically enhanced photocatalytic performance for Rhodamine B removal, Separation and Purification Technology, 258, 118003.
- Kong, H., Li, H., Wang, H., Li, S., Lu, B., Zhao, J., Cai, Q., 2023. Fe-Mo-O doping g-C3N4 exfoliated composite for removal of rhodamine B by advanced oxidation and photocatalysis, Applied Surface Science, 610, 155544.
- Amalina, F., Razak, A. S. A., Krishnan, S., Zularisam, A. W., Nasrullah, M., 2022. A review of eco-sustainable techniques for the removal of Rhodamine B dye utilizing biomass residue adsorbents, Physics and Chemistry of the Earth, Parts A/B/C, 128, 103267.
- Chen, Z., Yu, S., Liu, J., Zhang, Y., Wang, Y., Yu, J., Yuan, M., Zhang, P., Liu, W., Zhang, J., 2023. C, F co-doping Ag/TiO2 with UV-light photocatalytic performance toward degrading Rhodamine B, Environmental Research, 232, 116311.
- Liang, Z., Cheng, H., Zhang, X., Mao, Q., 2023. Two polyoxometalates based on (P2Mo5) catalysts: synthesis, characterization, and photocatalytic degradation of RhB, Journal of Molecular Liquids, 377, 121483.
- Olawale, O., Obayomi, K.S., Dahunsi, S.O., Folarin, O., 2020. Bioremediation of artificially contaminated soil with petroleum using animal waste: Cow and poultry dung, Cogent Engineering, 7, 1721409.
- Liu, X., Guo, Y., Zhang, C., Huang, X., Ma, K., Zhang, Y., 2022. Preparation of graphene oxide/4A molecular sieve composite and evaluation of adsorption performance for Rhodamine B, Separation and Purification Technology, 286, 120400.
- Lu, J., Gu, S., Li, H., Wang, Y., Guo, M., Zhou, G., 2023. Review on multi-dimensional assembled S-scheme heterojunction photocatalysts, Journal of Materials Science & Technology, 160, 214-239.
- Haounati, R., Ighnih, H., Malekshah, R. E., Alahiane, S., Alakhras, F., Alabbad, E., Alghamdi, H., Ouachtak, H., Addi, A. A., Jada, A., 2023. Exploring ZnO/Montmorillonite photocatalysts for the removal of hazardous RhB Dye: A combined study using molecular dynamics simulations and experiments, Materialstoday Communications, 35, 105915.
- Noukelag, S. K., Razanamahandry, L. C., Ntwampe, S. K. O., Arendse, C. J., Maaza, M., 2021. Industrial dye removal using bio-synthesized Ag-doped ZnO nanoparticles, Environmental Nanotechnology, Monitoring & Management, 16, 100463.
- Asjadi, F., Yaghoobi, M., 2023. Characterization and dye removal capacity of green hydrothermal synthesized ZnO nanoparticles, Ceramics International, 48, 27027-27038.
- Sun, H., Lee, S-Y., Park, S-J., 2023. Bimetallic CuPd alloy nanoparticles decorated ZnO nanosheets with enhanced photocatalytic degradation of methyl orange dye, Journal of Colloid and Interface Science, 629, 87-96.
- Deepika, R., Sethuraman, M. G., 2023. Pd-ZnO nanoparticles decorated acid activated montmorillonite for the efficient removal of cationic dyes from water, Journal of Molecular Structure, 1278,134910.
- Bazazi, S., Jodeyri, S., Hosseini, S. P., Arsalani, N., Rashidzadeh, B., Fathalipour, S., Seidi, F., Hashemi, E., 2023. Ball mill-hydrothermal method for one-step synthesis of zinc oxide/carbon quantum dot (ZnO-CQD) nanocomposites as photocatalyst for degradation of organic pollutants, Journal of Photochemistry and Photobiology A: Chemistry, 445,115096.
- Kohzadi, S., Maleki, A., Bundschuh, M., Vahabzadeh, Z., Johari, S. A., Rezaee, R., Shahmoradi, B., Marzban, N., Amini, N., 2023. Doping zinc oxide (ZnO) nanoparticles with molybdenum boosts photocatalytic degradation of Rhodamine b (RhB): Particle characterization, degradation kinetics and aquatic toxicity testing, Journal of Molecular Liquids, 385, 122412.
- Fu, Q., Wang, X., Cai, Q., Xie, Z., Zhang, L., Su, P., 2022. Constructing BiOCl/ZnO heterojunction from Bi-MOF for efficient photocatalytic degradation performance, Inorganic Chemistry Communications, 140,109445.
- Zhang, X., Liu, Q., Zhu, S., Yu, M., 2022. Green and facile fabrication of nano-ZnO coated cellulose/starch/activated carbon hydrogel for enhanced dyes adsorption and antibacterial activity, Materialstoday communications, 33 ,104355.
- Packialakshmi, J. S., Albeshr, M. F., Alrefaei, A. F., Zhang, F., Liu, X., Selvankumar, T., Mythili, R., 2023. Development of ZnO/SnO2/rGO hybrid nanocomposites for effective photocatalytic degradation of toxic dye pollutants from aquatic ecosystems, Environmental Research, 225, 115602.
- Machrouhi, A., Khiar, H., Elhalil, A., Sadiq, M., Abdennouri, M., Barka, N., 2023. Synthesis, characterization, and photocatalytic degradation of anionic dyes using a novel ZnO/activated carbon composite, Watershed Ecology and the Environment, 5, 80-87.
- Kusworo, T. D., Azizah, D. A., Kumoro, A. C., Kurniawan, T. A., Othman, M. H. D., 2023. Fabrication, characterization, and application of PSf/Ni@ZnO amalgamated membrane for photocatalytic degradation of dyeing wastewater from batik industry, Materialstoday Chemistry, 30, 101493.
- Oluwasogo, D. A., Varangane, S., Prabhu, Y. T., Abraham, B. M., Perupogu, V., Pal, U., 2023. Biosynthetic modulation of carbon-doped ZnO for rapid photocatalytic endocrine disruptive remediation and hydrogen evolution, Journal of Cleaner Production 394, 136393.
- Karimi, F., Altuner, E. E., Gulbagca, F., Tiri, R. N. E., Sen, F., Javadi, A., Dragoi, E. N., 2023. Facile bio-fabrication of ZnO@AC nanoparticles from chitosan: Characterization, hydrogen generation, and photocatalytic properties, 2023. Environmental Research, 216, 114668.
- Ahlawat, W., Dilbaghi, N., Kumar, R., Singhal, N. K., Kaushik, A., Kumar, S., 2023. Adsorption of harmful dyes and antimicrobial studies utilizing recyclable ZnO, its composites with conventionally used activated carbon, and waste orange peel as a greener approach, Journal of Environmental Chemical Engineering, 11,110268.
- Obayomi, K.S., Lau, S.Y., Danquah, M.K., Chiong, T., Rahman, M.M., 2023. Recent advance in graphene derived materials for biomedical waste treatment. Water Process Engineering, 51, 103440.
- Yu, F., Tian, F., Zou, H., Ye, Z., Peng, C., Huang, J., Zheng, Y., Zhang, Y., Yang, Y., Wei, X., Gao, B., ZnO/biochar nanocomposites via solvent free ball milling for enhanced adsorption and photocatalytic degradation of methylene blue, Journal of Hazardous Materials, 415, 125511.
- Zheng, S-M., Li, B., Yuan, Z-H., Yang, J-C, E., Zhang, J., Zhong, L-B., Zheng, Y-M. 2023. Zinc oxide nanosheet decorated self-supporting hierarchical porous wood carbon electrode for efficient capacitive deionization defluorination, Separation and Purification Technology, 317, 123830.
- Monfared-Hajishirkiaee, R., Ehtesabi, H., Najafinobar, S., Masoumian, Z., 2023. Multifunctional chitosan/carbon dots/sodium alginate/zinc oxide double-layer sponge hydrogel with high antibacterial, mechanical, and hemostatic properties, OpenNano, 12, 100162.
- Bouali, W., Erk, N., Özalp, O., Soylak, M., 2023. Construction of a novel sensor based on activated nanodiamonds, zinc oxide, and silver nanoparticles for the determination of a selective inhibitor of cyclic guanosine monophosphate in real biological and food samples, Diamond and Related Materials, 137, 110172.
- Huong, L. M., Cong, C. Q., Dat, N. M., Hai, N. D., Nam, N. T. H., An, H., Tai, L. T., Dat, T. D., Dat, N. T., Phong, M. T., Hieu, N. H., 2023. Green synthesis of carbon-doped zinc oxide using Garcinia mangostana peel extract: Characterization, photocatalytic degradation, and hydrogen peroxide production, Journal of Cleaner Production, 392, 136269.
- Zhang, X., Jiang, C., Li, H., Gan, X., Shi, W., Liu, Y., Yan, X., Zhao, X., Liu, B., 2023. Rational design of activated graphitic carbon spheres with optimized ion and electron transfer channels for zinc-ion hybrid capacitors, Journal of Colloid and Interface Science, 651, 211-220.
- Kim, S-H., Kim, D-S., Moradi, H., Chang, Y-Y., Yang, J-K., 2023. Highly porous biobased graphene-like carbon adsorbent for dye removal: Preparation, adsorption mechanisms and optimization, Journal of Environmental Chemical Engineering, 11(2),109278.
- Rio, M., Escarabajal, J. C. G., Palomino, G. T., Cabello, C. P., 2023. Zinc/Iron mixed-metal MOF-74 derived magnetic carbon nanorods for the enhanced removal of organic pollutants from water, Chemical Engineering Journal, 428, 131147.
- Jawad, A. H., Saber, S. E. M., Abdulhameed, A. S., Reghioua, A., ALOthman, Z. A., Wilson, L. D., 2022. Mesoporous activated carbon from mangosteen (Garcinia mangostana) peels by H3PO4 assisted microwave: Optimization, characterization, and adsorption mechanism for methylene blue dye removal, Diamond and Related Materials, 129, 109389.
- Obayomi, K. S, Oluwadiya, A. E., Lau, S. Y., Dada, A. O., Akubuo-Casmir, D., Adelani-Akande, T. A., Bari, A.S.M. F., Temidayo, S. O., Rahman, M. M., 2021. Biosynthesis of Tithonia diversifolia leaf mediated Zinc Oxide Nanoparticles loaded with flamboyant pods (Delonix regia) for the treatment of Methylene Blue Wastewater, Arabian Journal of Chemistry, 14, 103363.
- Vasiraja, N., Prabhahar, R. S. S., Joshua, A., 2023. Preparation and Physio–Chemical characterisation of activated carbon derived from prosopis juliflora stem for the removal of methylene blue dye and heavy metal containing textile industry effluent, Journal of Cleaner Production, 397,136579.
- Gan, J. S., Li, X. B., Arif, U., Ali, F., Ali, A., Raziq, F., Ali, N., Yang, Y., Wang, Z., 2023. Development and characterization of silver modified novel graphitic-carbon nitride (Ag-ZnO/C3N4) coupled with metal oxide photocatalysts for accelerated degradation of dye-based emerging pollutants, Surfaces and Interfaces, 39, 102938.
- Wang, X., Qian, Y., Chen, H., Li, X., Zhang, A., Li, X., Chen, C., He, Y., Xue, G., 2023. Achieving multi-cycle regeneration of activated carbon and Cr(VI) removal over a wide pH range by hydrothermal converting quinonimine dye into difunctional pyrrolic-N: Implication for carbon capture in printing and dyeing wastewater treatment, Chemical Engineering Journal, 459, 141646.
- Dada, A. O, Inyinbor, A. A., Tokula, B. E., Bayode, A. A., Obayomi, K. S., Ajanaku, C. O., Adekola, F.A., Ajanaku, K.O. and Ujjwal Pal, 2024. Zinc oxide decorated plantain peel activated carbon for adsorption of cationic malachite green dye: mechanistic, kinetics and thermodynamics modeling. Environmental Research, 252, 119046.
- Song, Y., Lu, J., Li, M., Yan, Y., Liu, N., Kang, H., Wang, Y., Wang, R., 2023. A covalent organic skeleton based on pyridinyl benzene embedded into BiVO4 sites for visible-driven photocatalytic degradation of Rhodamine B, Journal of Photochemistry and Photobiology A: Chemistry, 445 ,115046.
- Gupta, V., Singh, S., 2023. Corona-poling enhanced photocatalytic degradation of methyl-violet and rhodamine B pollutants using ferroelectric nanoparticles, Chemistry of Inorganic Materials, 1, 100008.
- Lin, Z., Dong, C., Mu, W., Han, X., 2023. Degradation of Rhodamine B in the photocatalytic reactor containing TiO2 nanotube arrays coupled with nanobubbles, Advanced Sensor and Energy Materials, 2, 100054.
- Cabello-Guzmán, G., Seguel, M., Fernández, L., Caro, C., Suarez, C., Matus, M., Cifuentes, C., Bustos, F., Ariz, K., 2023. A photochemical approach to the synthesis of ZnO/CuO films and their application to the photocatalytic degradation of rhodamines (Rh-B and Rh-6G) under UV–Vis light irradiation, Inorganic Chemistry Communications, 152,110695.
- Phongamwong, T., Barrabés, N., Donphai, W., Witoon, T., Rupprechter , G., Chareonpanich, M., 2023. Chlorophyll-modified Au25(SR)18-functionalized TiO2 for photocatalytic degradation of rhodamine, Applied Catalysis B: Environmental, 325, 122336.
- Obayomi, K. S., Lau, S. Y., Danquah, M. K., Zhang, J., Chiong, T., Meunier, L., Gray, S. R., Rahman, M. M., 2023. Green Synthesis of Graphene-Oxide Based Nanocomposites for Efficient Removal of Methylene Blue Dye from Wastewater, Desalination, 564, 116749.
- Mardiroosi, A., Mahjoub, A. R., Khavar, A. H. C., Boukherroub, R., Sillanpää, M., Kaur, P., 2023. Effects of functionalized magnetic graphene oxide on the visible-light-induced photocatalytic activity of perovskite-type MTiO3 (M= Zn and Mn) for the degradation of Rhodamine B., Journal of Molecular Structure, 1284, 135298.
- Ma, J., Zhao, B., Shao, N., Jiang, P., Yang, H., Li, B., 2023. Rational design of a novel magnetically recoverable and environment-friendly Z-scheme SnFe2O4/Bi2WO6 heterojunction with enhanced photocatalytic performance for rhodamine B degradation and toxicity elimination, Materialstoday Chemistry, 30, 101538.
- Santana, R. W. R., Lima, A. E. B., Souza, L. C. K., Santos, E. C. S., Santos, C. C., Menezes, A. S., Sharma, S. K., Cavalcante, L. S., Maia da Costa, M. E. H., Sales, T. O., Jacinto, C., Luz Jr., G. E., Almeida, M. A. P., 2023. BiOBr/ZnWO4 heterostructures: An important key player for enhanced photocatalytic degradation of rhodamine B dye and antibiotic ciprofloxacin, Journal of Physics and Chemistry of Solids, 173, 111093.
- Ragupathy, S., Priyadharsan, A., AlSalhi, M. S., Devanesan, S., Guganathan, L., Santhamoorthy, M., Kim, S. C., 2022. Effect of doping and loading Parameters on photocatalytic degradation of brilliant green using Sn doped ZnO loaded CSAC, Environmental Research, 210, 112833.
- Zhang, L., Li, X., Chen, S., Guan, J., Guo, Y., Yu, W., 2023. 3D chitosan/GO/ZnO hydrogel with enhanced photocorrosion-resistance and adsorption for efficient removal of typical water-soluble pollutants, Catalysis Communications, 176, 106627.
- Xu, D., Ma, H., 2021. Degradation of rhodamine B in water by ultrasound-assisted TiO2 photocatalysis, Journal of Cleaner Production, 313, 127758.
- Cadenbach, T., Benitez, M. J., Tirado, S. A., Ochoa-Herrera, V., Debut, A., Vizuete, K., 2021. Adsorption enhanced photocatalytic degradation of Rhodamine B using GdxBi1-xFeO3@SBA-15 (x= 0, 0.05, 0.10, 0.15) nanocomposites under visible light irradiation, Ceramics International, 47, 29139-29148.
- Li, L., Cao, W., Liang, C., Shi, X., Wang, C., 2023. Ultrasound-assisted photocatalytic degradation of RhB by Bi-doped AgNbO3 under internal electric field control, Journal of Alloys and Compounds, 960,170580.
- Ighnih, H., Haounati, R., Malekshah, R. E., Ouachtak, H., Jada, A., Addi, A. A., 2023. Photocatalytic degradation of RhB dye using hybrid nanocomposite BiOCl@Kaol under sunlight irradiation, Journal of Water Process Engineering, 54,103925.
- Najjar, E. H., Kianfar, A. H., Dinari, M., Rezaei, B., Saeidi, S., 2023. Photocatalytic activity of the novel triazine-based magnetic core–shell Cu nanocomposite for degradation of RhB and MB via air oxidation and Cr(VI) reduction, Environmental Nanotechnology, Monitoring & Management, 20, 100820.
- Shao, L., Wan, H., Wang, L., Wang, Y., Liu, N., Wu, Z., Luo, W., Zhan, P., Zhang, L., Huang, J., 2022. Construction of hierarchical porous carbon with mesopores-enriched from sodium lignosulfonate by dual template strategy and their diversified applications for CO2 capture, radioactive iodine adsorption, and RhB removal, Journal of Environmental Chemical Engineering, 10, 108851.
- Sharma, A., Sharma, S., Kumar, N., Diery, W. A., Moujaes, E. A., Tahir, M., Singh, P., 2023. Co+2, Ni+2 and Cu+2 incorporated Bi2O3 nano photocatalysts: Synthesis, DFT analysis of band gap modification, adsorption and photodegradation analysis of rhodamine B and Triclopy, Environmental Research, 233, 15 September 2023, 116478.
- Srinithi, S., Balakumar, V., Chen, T-W., Chen, S-M., Akilarasan, M., Lou, B-S., Yu, J., 2023. In-situ fabrication of TiO2-MWCNT composite for an efficient electron transfer photocatalytic rhodamine B dye degradation under UV–visible light, Diamond and Related Materials, 138, 110245.
- Li, Y., Li, M., Zhu, C., Liu, L., Li, H., Chen, X., 2023. Main factors for photocatalytic degradation of rhodamine B by MoS2 activated PMS, Materials Letters, 341, 134191.
- Alwadai, N., Shakil, M., Inayat, U., Tanveer, M., Ashraf, M., Gillani, S. S. A., Al-Buriahi, M. S., Alrowaili, Z. A., 2023. Unlocking the synergistic potential of peanut shell derived activated carbon-doped TiO2 for highly efficient photocatalytic removal of organic dye under UV-light irradiation, Materials Science and Engineering: B, 296, 116646.
- Wang, S., Li, Y., Wang, X., Zi, G., Zhou, C., Liu, B., Liu, G., Wang, L., Huang. W., 2022. One-step supramolecular preorganization constructed crinkly graphitic carbon nitride nanosheets with enhanced photocatalytic activity, Journal of Materials Science & Technology, 104, 155-162.
- Zeng, Y., Xu, Y., Zhong, D., Mou, J., Yao, H., Zhong, N., 2022. Visible-light responsive photocatalytic fuel cell with double Z-scheme heterojunction PTh/Ag3PO4/BiOI/Ti photoanode for efficient rhodamine B degradation and stable electricity generation, Optical Materials, 134, 113103.
- Jia, J., Xiao, S., Tao, Y., Zhang, H., Chen, S., Wang, H., Bu, M., Sun, J., 2023. Self-organization towards complex meso-helix in the structures of keggin-type polyoxometalate-based metal-organic frameworks for photocatalytic degradation of rhodamine B, Journal of Solid-State Chemistry, 324,124109.
- Chuaicham, C., Rizki, I., N., Sekar, K., Shenoy, S., Srikhaow, A., Trakulmututa, J., Sasaki, K., 2023. Bio-reduced Ag nanoparticle decorated on ZnO for enhancement of photocatalytic reduction of hexavalent chromium and photocatalytic degradation of rhodamine B, Journal of Alloys, and Compounds, 939, 168797.
- Abdo, M. A., Al-Wafi, R., AlHammad, M. S., 2023. Highly efficient visible light driven photocatalytic activity of rare earth cerium doped zinc-manganese ferrite: Rhodamine B degradation and stability assessment, Ceramics International, 49, 29245-29258.
- Alwan, S. H., Salem, K. H., Alshamsi, H. A., 2023. Visible light-driven photocatalytic degradation of Rhodamine B dye onto TiO2/rGO nanocomposites, Materialstoday communications, 33, 104558.
- Nagesh, T., Ramesh, K., Ashok, B., Jyothi, L., Kumar, B. V., Upender, G., 2023. Insights into charge transfer via Z-scheme for Rhodamine B degradation over novel Co3O4/ZnFe2O4 nanocomposites, Optical Materials, 143, 114140.
- Liang, C., Ma, J., Cao, Y., Zhang, T., Yang, C., Wu, Y., Li, H., Xu, H., Hua, Y., Wang, C., 2022. Adsorption of BiOBr microspheres to rhodamine B and its influence on photocatalytic reaction, Chemosphere, 304, 135320.
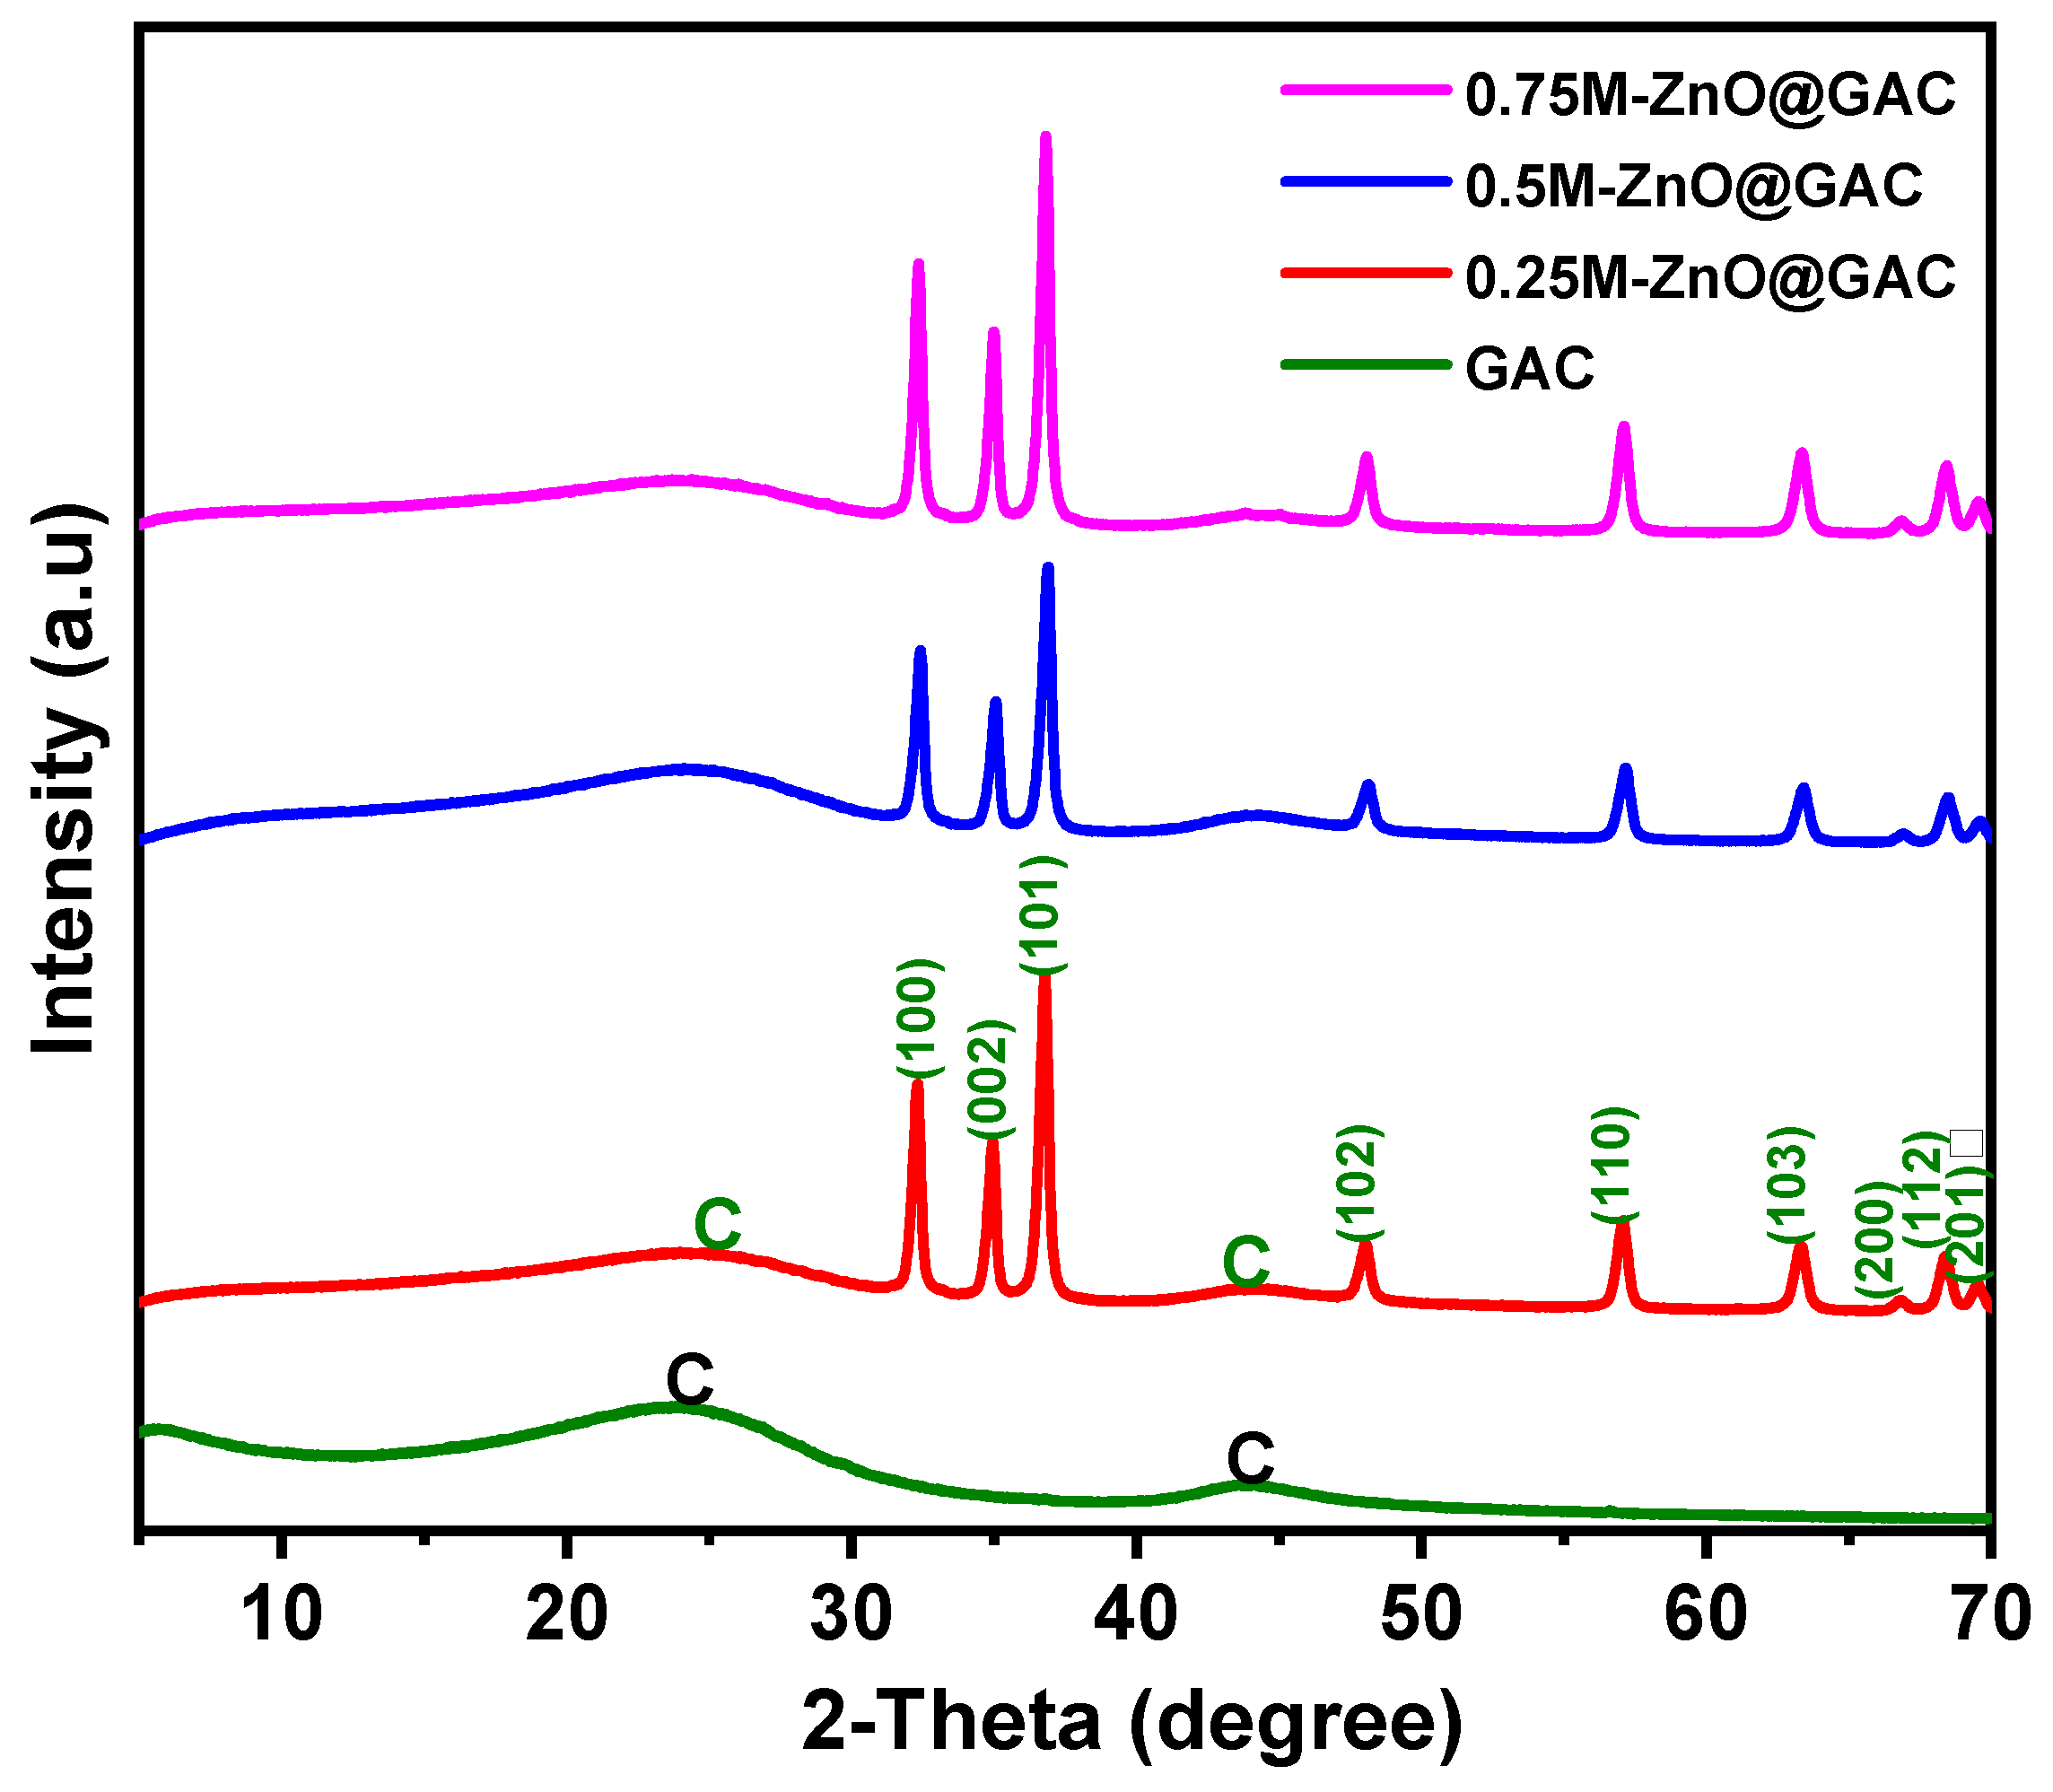
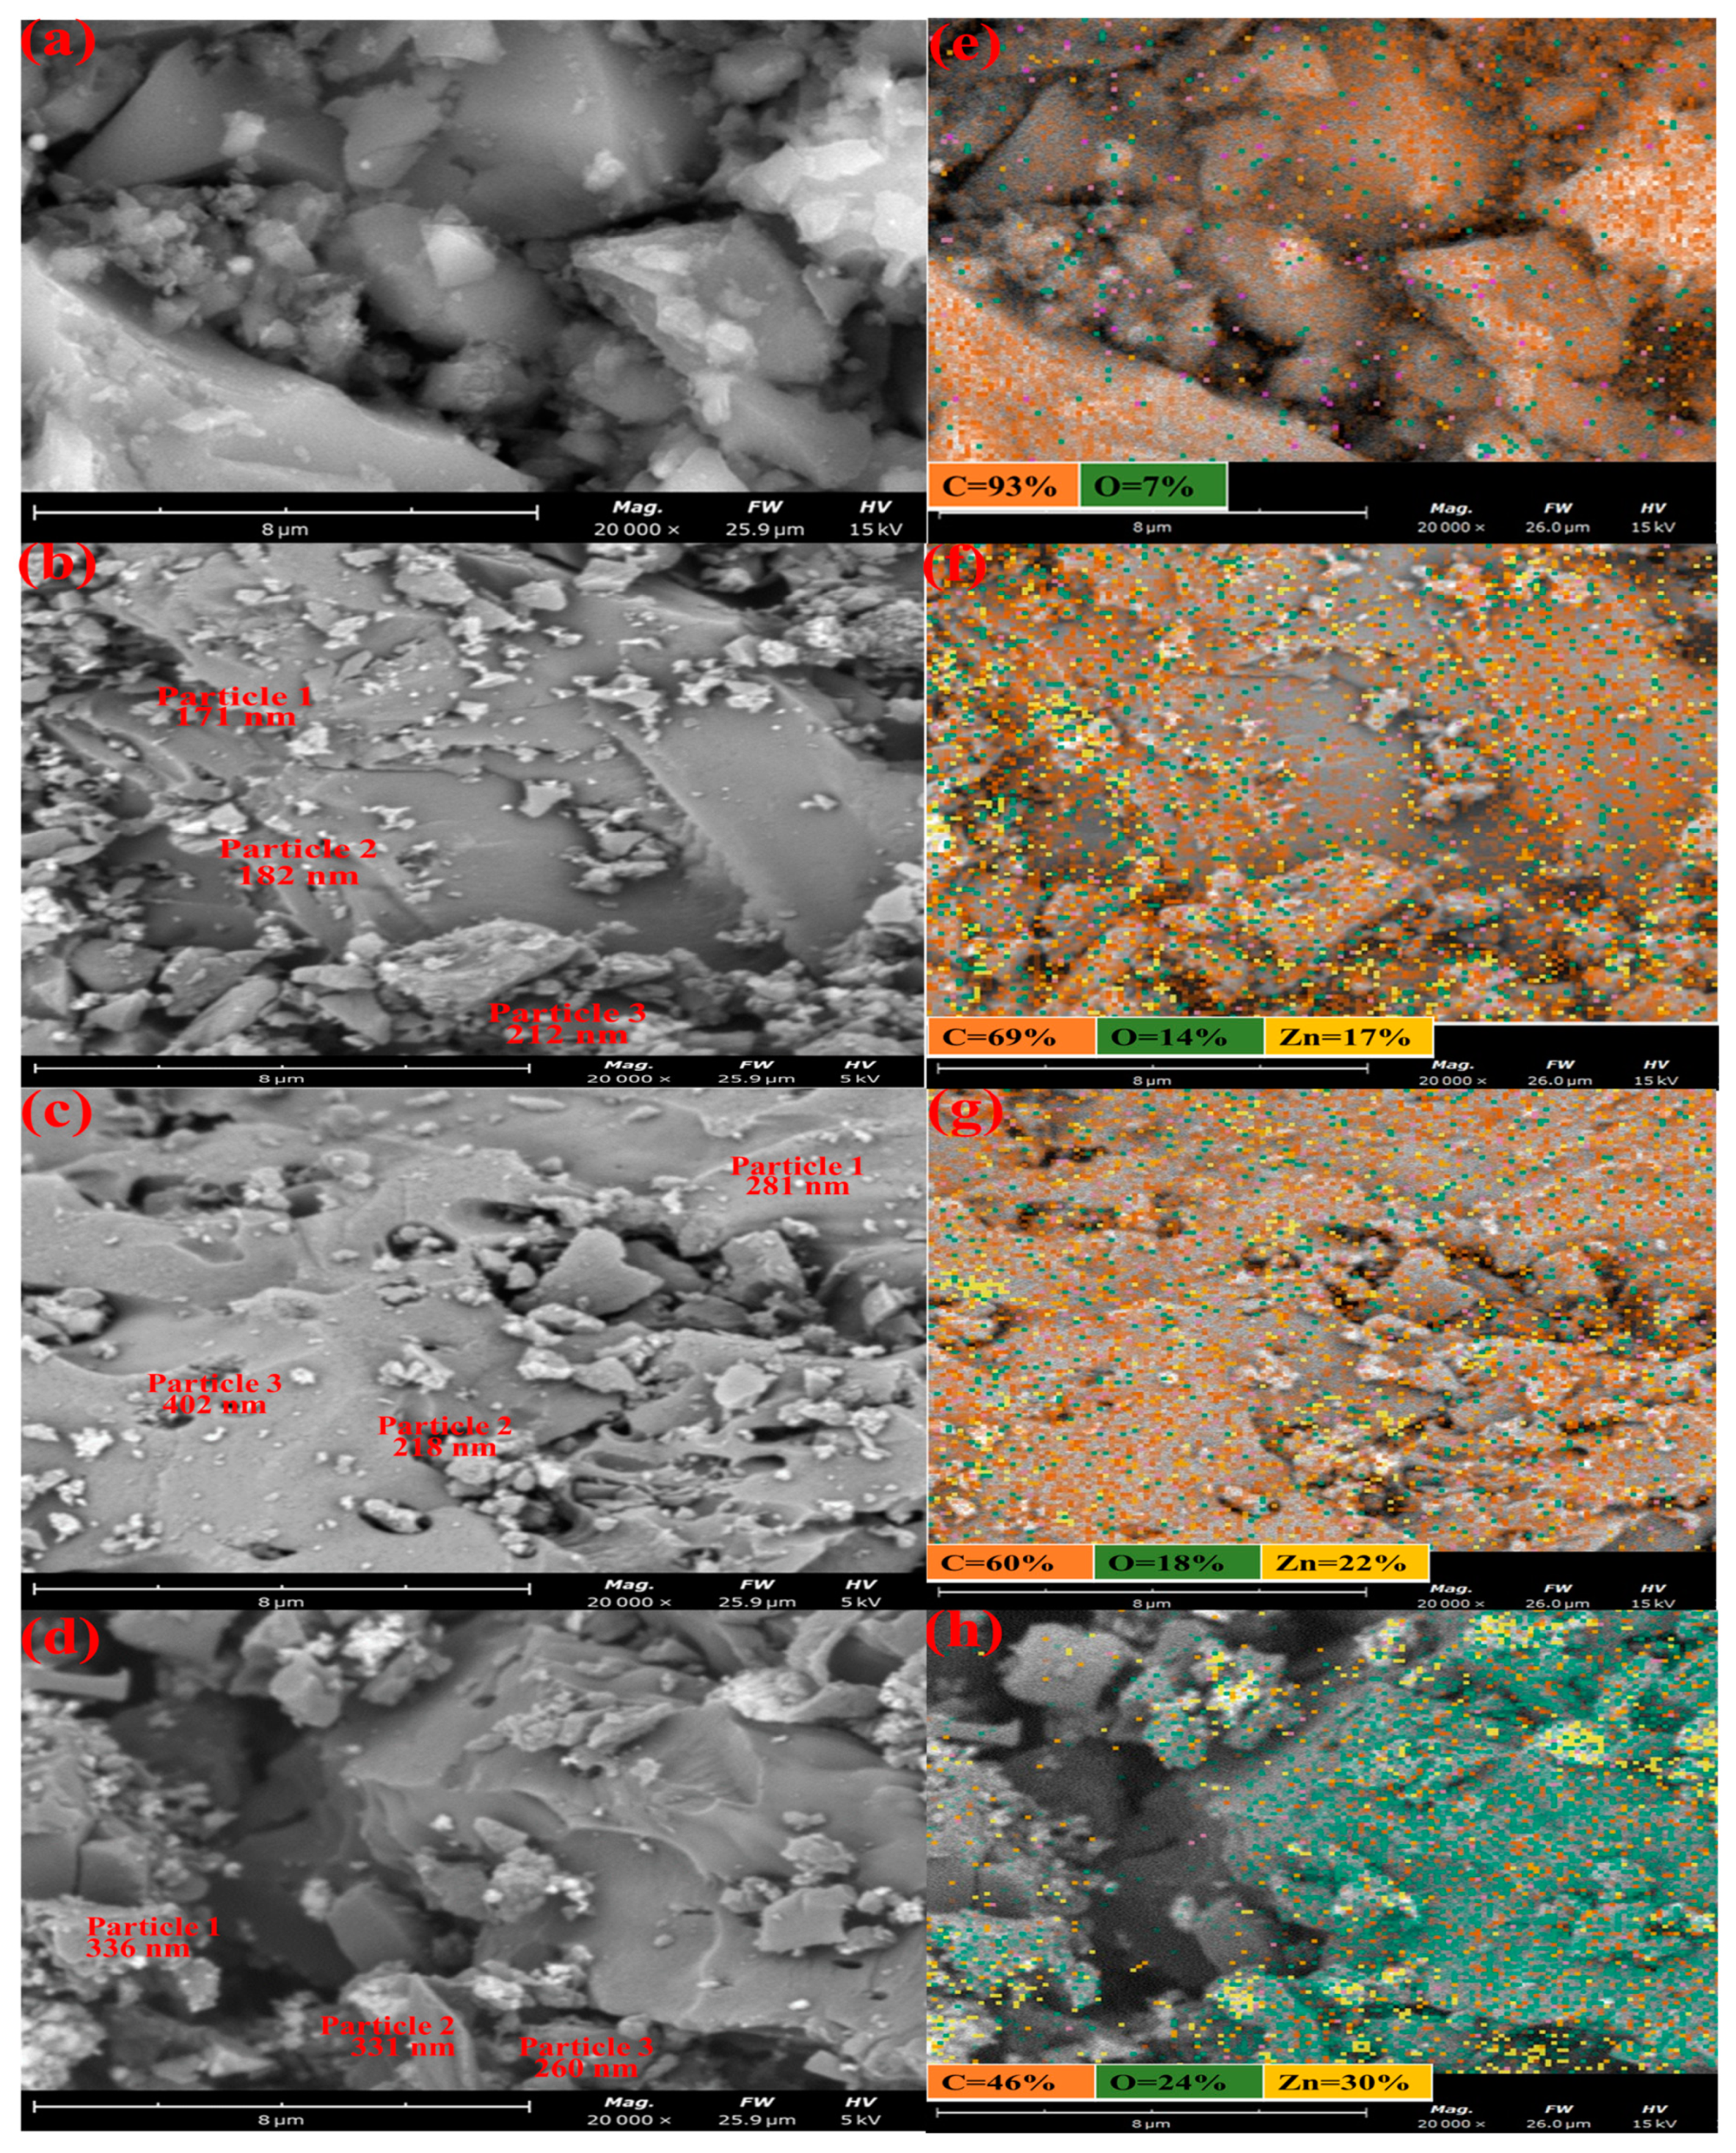
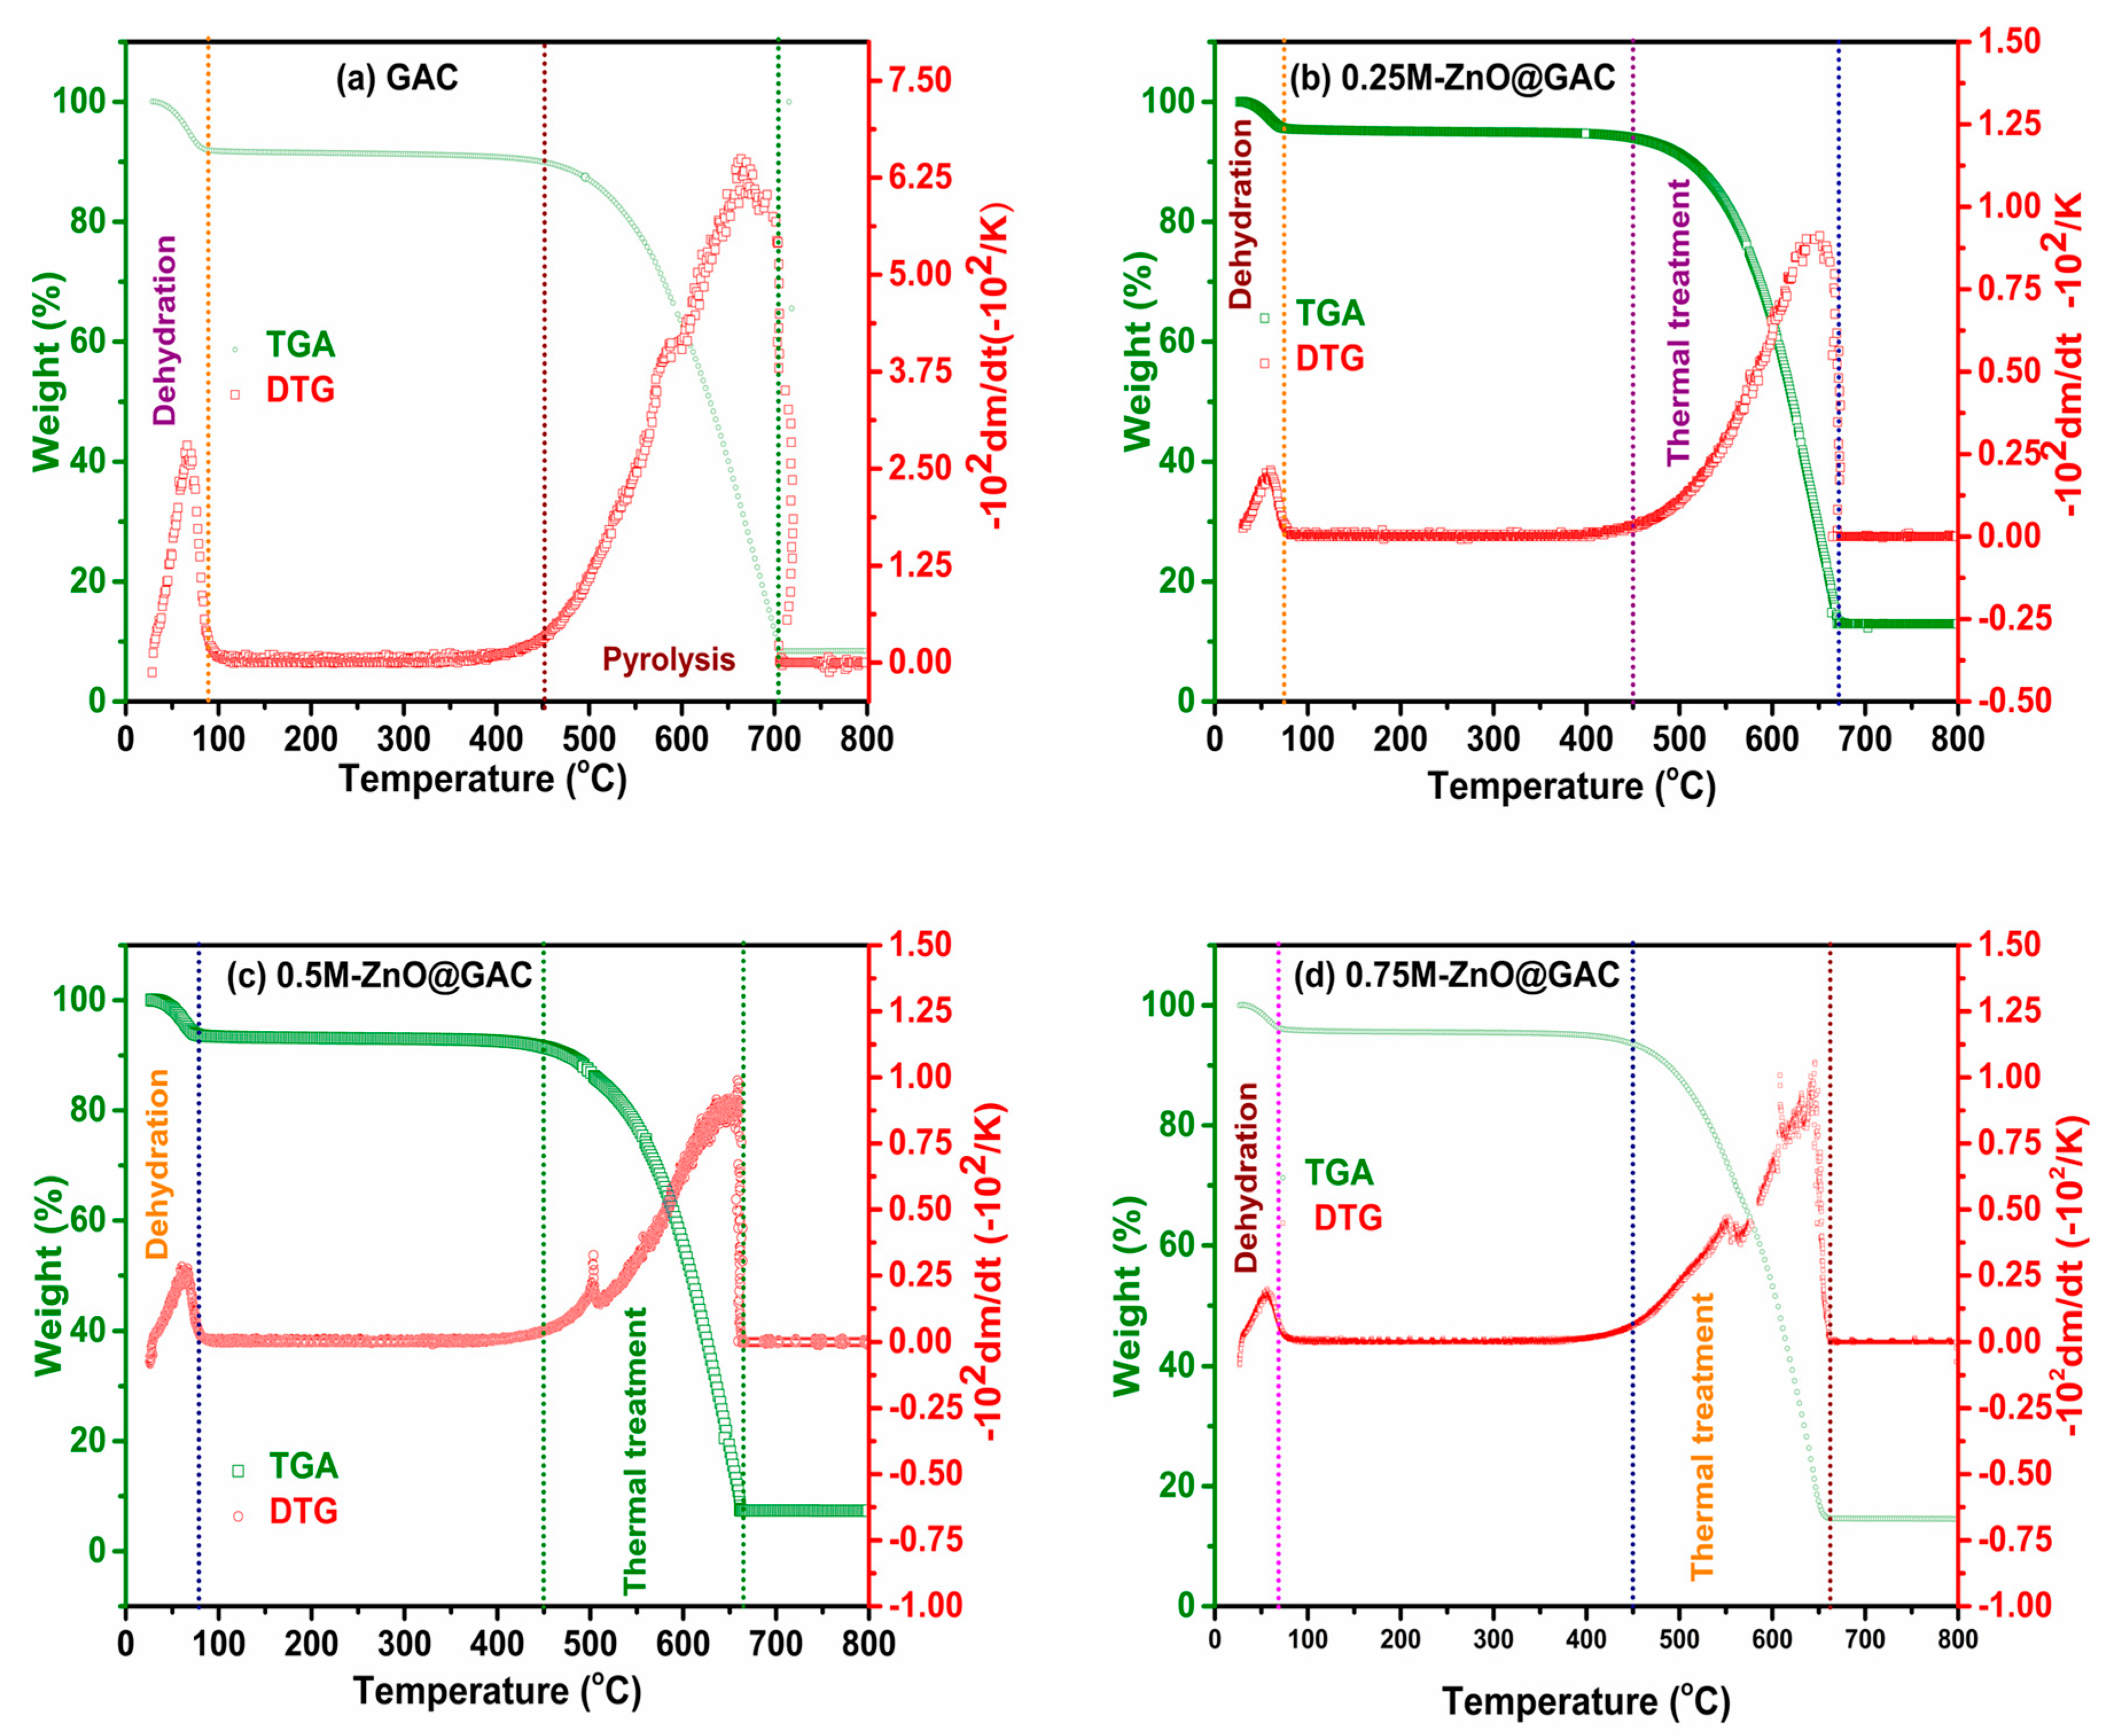
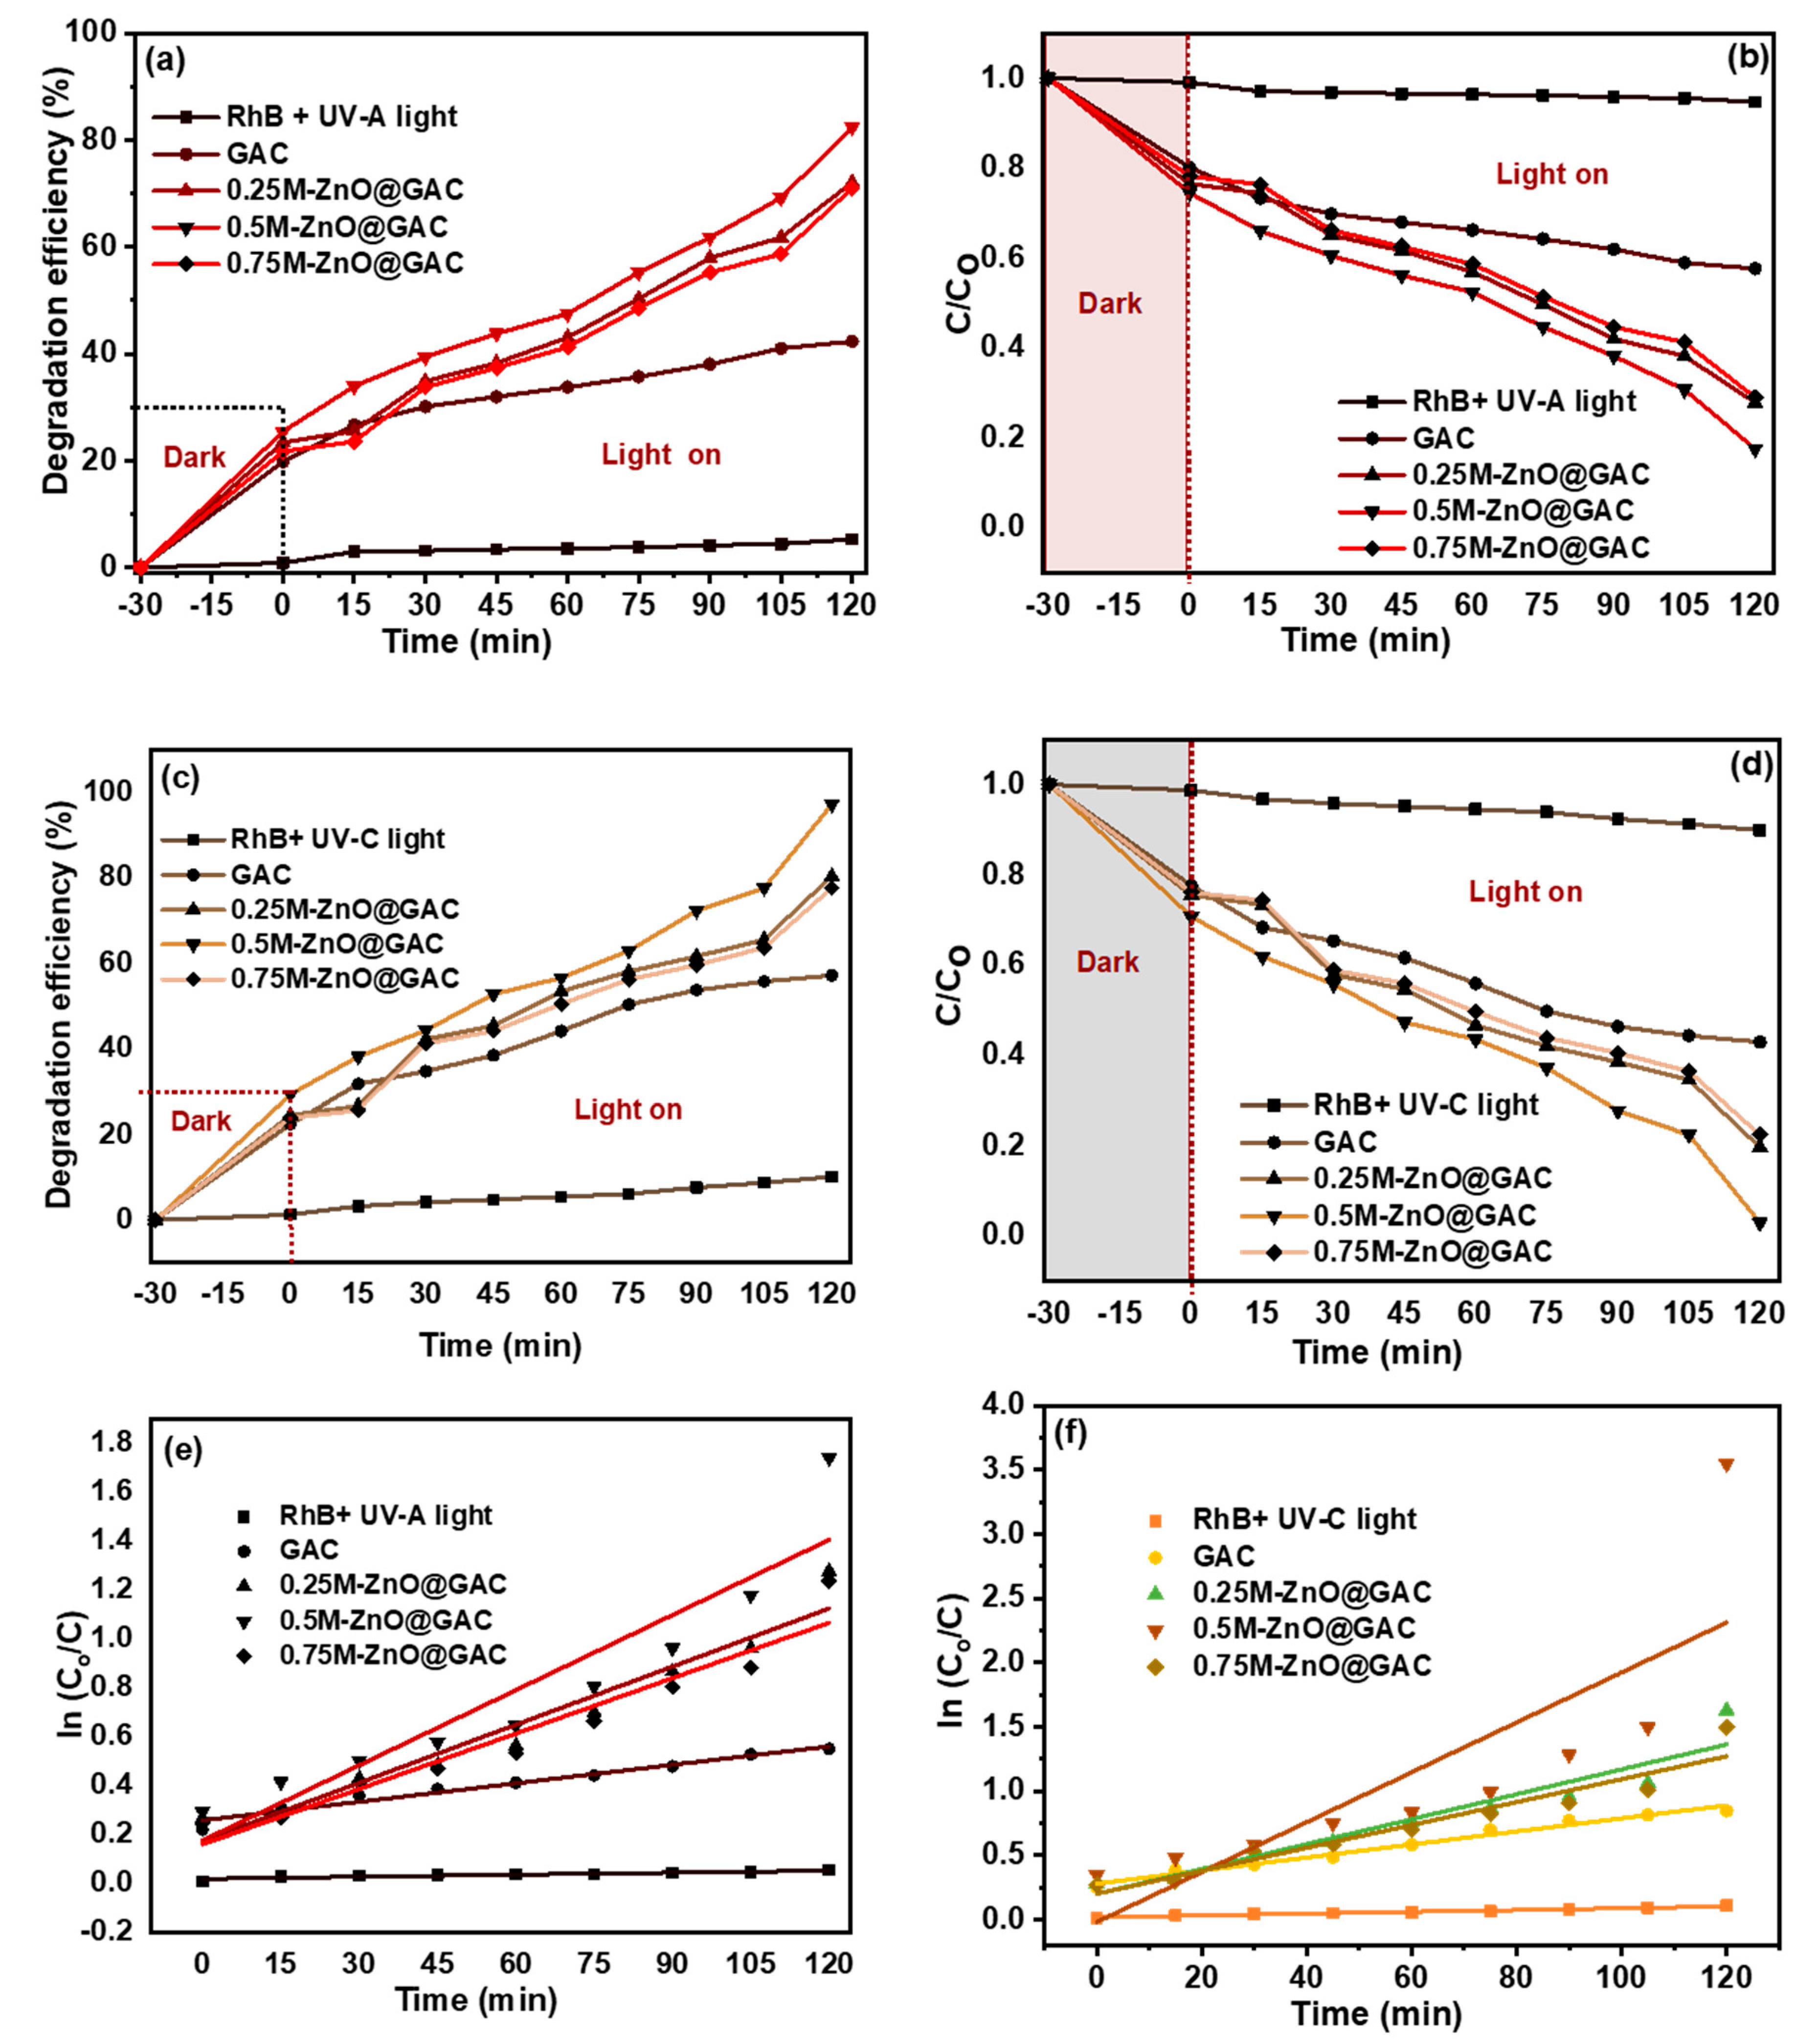
| Properties | Materials | |||
|---|---|---|---|---|
| GAC | 0.25M-ZnO@GAC | 0.5M-ZnO@GAC | 0.75M-ZnO@GAC | |
| SBET (m2/g) | 474 | 450 | 453 | 421 |
| SLang (m2/g) | 707 | 675 | 679 | 632 |
| Smic (m2/g) | 325 | 288 | 298 | 245 |
| Smic/SBET (%) | 68.57 | 64.0 | 65.78 | 58.19 |
| Sext (m2/g) | 149 | 162 | 155 | 176 |
| Sext/SBET (%) | 31.43 | 36.0 | 34.22 | 41.81 |
| Vtot (cm3/g) | 0.2683 | 0.2727 | 0.2659 | 0.2620 |
| Vmeso (cm3/g) | 0.1931 | 0.1618 | 0.1670 | 0.1217 |
| Vmic (cm3/g) | 0.0752 | 0.1109 | 0.0989 | 0.1403 |
| Vmeso/Vtot (%) | 71.97 | 59.33 | 62.81 | 46.45 |
| Vmic/Vtot (%) | 28.03 | 40.67 | 37.19 | 53.55 |
| Dp (nm) | 2.26 | 2.42 | 2.35 | 2.49 |
| Sample | Particle 1 | Particle 2 | Particle 3 | ||||||||
|---|---|---|---|---|---|---|---|---|---|---|---|
| Weight (%) | Weight (%) | Weight (%) | |||||||||
| C | O | Zn | C | O | Zn | C | O | Zn | |||
| GAC | 92.6 | 7.2 | - | 92.0 | 9.1 | - | 86.4 | 10.4 | - | ||
| 0.25M-ZnO@GAC | 43.0 | 5.9 | 17.3 | 51.5 | 8.6 | 3.2 | 68.6 | 3.8 | 3.6 | ||
| 0.5M-ZnO@GAC | 23.5 | 15.5 | 12.5 | 47.1 | 7.5 | 15.9 | 42.0 | 7.2 | 8.9 | ||
| 0.75M-ZnO@GAC | 22.7 | 11.6 | 30.6 | 21.8 | 12.2 | 29.2 | 39.5 | 10.0 | 20.2 | ||
| Materials | UV-A light | UV-C light | |||
| PDE (%) | k1 (min-1) | PDE (%) | k1 (min-1) | ||
| RhB | 5.30 | 0.00028 | 10.12 | 0.00071 | |
| GAC | 42.33 | 0.0025 | 57.12 | 0.0051 | |
| 0.25M-ZnO@GAC | 72.09 | 0.0079 | 80.37 | 0.097 | |
| 0.5M-ZnO@GAC | 82.42 | 0.010 | 97.11 | 0.019 | |
| 0.75M-ZnO@GAC | 70.98 | 0.0078 | 78.58 | 0.0089 | |
| Sample | Pseudo-first-order | Pseudo-second-order | ||||
| k1 (min-1) | qe (mg/g) | R2 | k2 (g/(mg.min) | qe (mg/g) | R2 | |
| GAC | 0.010 | 668.70 | 0.992 | 0.0000053 | 490.67 | 0.999 |
| 0.25M-ZnO@GAC | 0.021 | 549.77 | 0.984 | 0.000024 | 459.72 | 0.999 |
| 0.5M-ZnO@GAC | 0.013 | 617.28 | 0.994 | 0.0000086 | 478.91 | 0.999 |
| 0.75M-ZnO@GAC | 0.0085 | 730.55 | 0.990 | 0.0000045 | 449.88 | 0.990 |
| Catalyst | Irradiation time (min) | Light source | PDE (%) | References |
|---|---|---|---|---|
| PTh/Ag3PO4/BiOI/Ti– Cu2O/Cu | 120 | Visible light | 96 | [69] |
| MTiO3@EDFG | 120 | Visible light | 91 | [53] |
| SnFe2O4/Bi2WO6 | 120 | 350-W xenon lamp | 96 | [54] |
| H [K2Ag9(DPT)7 (u-2-O)2(H2O)4][SiW12O40]2 | 300 | UV light radiation | 76 | [70] |
| AgNPs@ZnO | 180 | 500 W Xe lamp | 95 | [71] |
| Zn0.5Mn0.5Ce0.08Fe1.92O4 | 180 | Visible light | 97 | [72] |
| TiO2/rGO (5 %) | 120 | Visible light | 95 | [73] |
| Co3O4/ZnFe2O4 | 240 | UV light | 93 | [74] |
| ZnO: Mo/rGO films | 120 | Sunlight | 68 | [75] |
| MoS2/PMS | 120 | Visible light | 90 | [66] |
| 0.5M-ZnO@GAC | 120 | UV-A light | 82 | This study |
| 0.5M-ZnO@GAC | 120 | UV-C light | 97 | This study |
Disclaimer/Publisher’s Note: The statements, opinions and data contained in all publications are solely those of the individual author(s) and contributor(s) and not of MDPI and/or the editor(s). MDPI and/or the editor(s) disclaim responsibility for any injury to people or property resulting from any ideas, methods, instructions or products referred to in the content. |
© 2024 by the authors. Licensee MDPI, Basel, Switzerland. This article is an open access article distributed under the terms and conditions of the Creative Commons Attribution (CC BY) license (http://creativecommons.org/licenses/by/4.0/).


