
Submitted:
15 October 2024
Posted:
15 October 2024
You are already at the latest version
Abstract
Background: Gait analysis systems are crucial for rehabilitation but are often time-consuming and less accessible in low and middle-income countries like Brazil. GAITWell® was developed to address these challenges with its modular and portable design for automated gait data extraction and analysis. This study evaluates its methodological properties. Methods: GAITWell® uses discrete binary sensors on interconnected plates to collect gait data, analyzed via the DBSCAN algorithm. Each plate measures 44 cm x 37 cm and features an 11 x 7 discrete sensor array with 4 cm spacing. Test-retest reliability was assessed using the intraclass correlation coefficient (ICC), standard error of the mean (SEM), and Bland-Altman plots. Concurrent validity was evaluated by comparing the GAITWell® measurements with those obtained from the Qualisys Pro-Reflex through correlations. Results: Participated 38 healthy young adults, including 18 females (47.4%). The sample had an average age of 33.2 years (SD 13.0) and an average BMI of 26.6 kg/m² (SD 5.4). Correlations between GAITWell® and Qualisys ranged from moderate to very high for most gait variables, except stride length (r = .360, p < .05). ICC2,1 showed moderate to good agreement for most variables, except for double support times, cadence, and base of support. Preliminary analysis suggests that increasing the sensor resolution to 1.2 cm x 1.2 cm could potentially decrease the measurement error from 2 cm to 0.6 cm, representing a theoretical reduction of 70%. Conclusions: While low resolution affected GAITWell® reliability, it remains a promising tool. Future research should focus on enhancing sensor accuracy to improve reliability.
Keywords:
gait analysis
; spatiotemporal variables
; validity
; reliability
; clustering
; discrete sensors
1. Introduction
Gait analysis plays a fundamental role in both scientific research and clinical practice, serving as a compelling method for comprehensively understanding motor disorders and meticulously monitoring the progression of treatments [1,2,3,4]. The identification of abnormal locomotion patterns paves the way for personalized treatments that meet the specific needs of each patient, thus improving prognoses and reducing associated costs, especially in the context of rehabilitation [5]. Recent research underscores a significant increase in clinical gait analysis, with the number of references rising from only eight in 1973 to approximately 10,200 by 2020 [6]. This substantial growth highlights the expanding role of gait analysis in clinical diagnosis, rehabilitation, and biomechanical research. As a vital tool, gait analysis should be widely available and accessible to healthcare professionals across diverse settings to ensure all patients receive the highest standard of care tailored to their unique needs.
Despite the rapid increase in movement analysis facilities worldwide over the past 50 years [6] and the variety of gait analysis systems available—from portable solutions like the GAITRite® system [7] and wearable sensors [8,9] to sophisticated laboratory-based optoelectronic setups [10,11]—access to clinical gait assessment remains limited. Significant barriers to widespread adoption include cost, the time-consuming nature of data collection, processing, and analysis, and the need for specialized personnel. Additionally, in the event of technical issues, the equipment often has to be sent to another country for repairs, which is particularly challenging for low- and middle-income countries that could greatly benefit from these technologies [5,6]. For example, sophisticated laboratory-based optoelectronic systems like Vicon [12] and Qualisys [13,14], utilize multiple cameras and reflective markers to capture high-precision kinematic data. While these setups are considered the gold standard for gait analysis due to their accuracy and detailed motion capture capabilities, they require significant investment in equipment and infrastructure, as well as specialized personnel and time-consuming processes [5]. Wearable sensors, including inertial measurement units (IMUs) and accelerometers [15,16,17], allow for continuous monitoring of gait patterns in real-world environments, giving valuable insights into daily movement and activity levels [18,19,20]. However, despite being simple to use and lower in cost compared to more sophisticated laboratory-based systems, they often require extensive and advanced programming for data analysis [21]. Similarly, insoles, equipped with pressure sensors and often integrated with machine learning algorithms, enable detailed analysis of gait parameters such as plantar pressure distribution and center of mass trajectory [22,23] . While these insoles are cost-effective, portable, and versatile, they may struggle with fine detail accuracy and durability issues under adverse conditions. Regular calibration and maintenance are essential to ensure optimal performance, and external factors like weather and surface unevenness can impact data accuracy [24].
Among these systems, pressure mat systems are highly valued in both clinical and research settings for their ability to provide detailed gait analysis without requiring extensive personnel training, markers, or complex calibration procedures [7,25,26,27]. However, their implementation in low- and middle-income countries faces challenges such as the lack of technical support and infrastructure required for maintenance and calibration. Additionally, environmental factors such as high humidity, temperature variations, and limited access to stable power sources can impact the durability and accuracy of pressure mats. These barriers highlight the need for a more robust, adaptable, and user-friendly mat system that can perform reliably in diverse and resource-constrained settings.
Gait kinematic variables such as gait speed, step length, cadence, and other spatiotemporal parameters are crucial in both clinical and research settings for several reasons. Gait speed, for instance, serves as a fundamental indicator of overall mobility and functional status, making it a vital measure in assessing changes due to aging, neurological conditions, or rehabilitation interventions [28,29]. Step length provides insights into stride dynamics and can reveal asymmetries or compensatory mechanisms in gait patterns, aiding in the diagnosis and treatment planning for musculoskeletal disorders or post-surgical recovery [30,31] . Cadence, the number of steps per minute, correlates with energy expenditure and efficiency, influencing recommendations for physical activity and rehabilitation protocols [32]. These gait variables collectively offer quantitative metrics that enhance the precision of assessments, inform therapeutic strategies, and facilitate objective monitoring of treatment outcomes over time. By comprehensively analyzing these parameters, clinicians and researchers can tailor interventions more effectively, promote functional independence, and improve the quality of life for individuals with mobility impairments.
Recognizing the critical need to enhance accessibility to gait analysis, an interdisciplinary team of professionals at the Bioengineering Laboratory of the Federal University of Minas Gerais (lab-bio), Brazil, has pioneered the development of a portable and modular system named GAITWell®. This innovative system offers comprehensive hardware and software solutions for the automated extraction, processing, and analysis of human gait data. The present study aims to evaluate the methodological properties of the GAITWell® system in spatial and temporal gait analysis. GAITWell® aims to broaden access to precise gait analysis across diverse healthcare settings, a particularly significant advancement for Brazil, where innovative solutions can greatly enhance the availability and effectiveness of gait analysis technologies.
2. Materials and Methods
2.1. Study Design
This methodological study evaluated the reliability and validity of the GAITWell® system. Reliability refers to the consistency and accuracy of the data obtained and how effectively a measuring tool minimizes random error [33,34]. Test-retest reliability was assessed on two visits one week apart. Validity examines how accurately a measurement reflects the concept it is intended to measure. Concurrent validity assesses how well a system’s measurements compare to those of a gold standard system [33,34]. In this study, the spatiotemporal gait parameters measured with the GAITWell® system were compared to those measured by the gold standard Qualisys® Pro-Reflex MCU 240 systems (QUALISYS MEDICAL AB, 411 12 Gothenburg, Sweden). This approach allowed us to examine the consistency and reproducibility of gait parameter measurements over time.
2.2. Participants
Healthy young adult participants without any orthopedic or neurological problems, lower limb deformities, or heart disease that would prevent walking several times on the electronic walkway were invited to take part in the study. Participants were recruited from the university community through flyers, posters, and word of mouth. This study was approved by the Research Ethics Committee of the Federal University of Minas Gerais, Brazil (CAAE – 95186518.0.0000.5149), and all participants provided written consent to participate.
2.3. Measurement Instrument
2.3.1. GAITWell® Gait Analysis System
The GAITWell® system employs modular hardware and C# software, featuring a user-friendly interface designed for ease of use and adaptability to individual needs, while building on concepts from previous systems. Although we have not yet tested the interface with clients, we have adapted it based on existing systems. In the future, we plan to further customize the interface to better meet user needs. It employs discrete sensors that operate at a binary level (activated or deactivated) rather than relying on pressure sensors or retroreflective markers, offering a straightforward and precise method for gait pattern analysis.
The hardware consists of interconnected plates that form the electronic walkway, as depicted in Figure 1a. The GAITWell® system has a total length of 3.08 meters, with a minimum of 1.76 meters required to capture a complete gait cycle. It features a configuration of 7 x 2 plates along its length and 1 x 2 plates across its width, collectively covering the entire gait cycle. Each plate measures 44 cm x 37 cm and contains a set of discrete sensors arranged in an 11 x 7 grid, with a center-to-center spacing of 4 cm. The electronic structure of each plate consists of five layers and two enclosures, as illustrated in Figure 1b. This structure features a rubber surface (1) in contact with the ground, a plate housing the electronic circuit (2), a perforated protection plate (3) to shield the sensors, and a transparent plate (4) to prevent particle or dust infiltration. Additionally, a carpet (5) and two enclosures (6) cover the electronic communication block and connectors. The electronic circuit layer (2) includes microcontrollers, the sensor array, connectors for external power supply and interconnection, as well as a module for communication and data transmission via Bluetooth and USB. In addition, the GAITWell® system software is organized into three main modules: the user interface (GUI), the data acquisition module, and the processing module. The software starts with an authentication screen, which grants access to the GAITWell® Graphical User Interface (GUI), allowing for data management, device connection setup, and result visualization.
The GUI is essential for configuring hardware interfaces, verifying the integrity of connected devices, and performing scans of the electronic walkway and integrated sensors. These scans collect data at a frequency of 1 kHz, with each cycle completing in 1 millisecond, ensuring high precision in monitoring. After connecting the hardware to the software via serial communication and confirming the system’s integrity, real-time gait data collection can be initiated. During the collection, data from individuals are recorded as vectors, including timestamps and corresponding states, which are then transmitted to the backend system. In the backend, the data are stored and prepared for subsequent processing.
Subsequently, this data proceeds to the next stage, referred to as ‘Processing’. In this step, the sensor triggers (events) are identified and transmitted to the computer through serial communication. They then undergo preprocessing and temporal analysis. During this process, the data is transformed into a list of instances of the ‘EventSensor’ class, each associated with a specific timestamp for subsequent analysis. Additionally, the processing involves the application of the Density-Based Spatial Clustering of Applications with Noise (DBSCAN) clustering algorithm to the Cartesian points derived from the sensor readings [35,36]. DBSCAN is crucial for identifying reference points such as foot contact and toe-off [37]. This method identifies clusters of arbitrary shapes and different sizes, separates noise from data, and detects ‘natural’ clusters and their arrangements within the data space, without any prior information about the groups [38,39,40]. DBSCAN was selected after testing K-means due to its popularity and simplicity. However, K-means had difficulty handling the variability and noise in gait data. While it performed reasonably well, it was not ideal for clusters with non-convex shapes, like human footprints, and was sensitive to noise, which affected the accuracy of gait measurements. Therefore, we opted to use DBSCAN instead.
For clustering purposes, DBSCAN distinguishes between three types of points: core points, border points, and noise points [35,36] Core points are located within the densest area of a cluster and are characterized by having a minimum number of points within their Epsilon (Eps) neighborhood, equal to or greater than MinPts. MinPts represents the minimum quantity of points required within the Eps radius to establish a cluster [33,35]. Only core points form new clusters. Border points lie in the neighborhood of at least one core point [36,40,41]. Noise points are points that are neither core nor in the neighborhood of a core object. The DBSCAN estimates the density of points in a dataset by counting the number of points within a circle centered on the estimated points and with radius Epsilon (EPS) [36]. EPS is the maximum distance between two points for them to be considered neighbors in clustering algorithms [36,40,41]. A neighborhood is considered dense if the number of neighboring points is equal to or greater than the MinPts value [36,41].
Thus, the method requires only one input parameter but supports determining an appropriate value for it [37]. For the initial choice of parameters Eps and MinPts, several gait readings were taken from volunteer participants who walked on the GAITWell electronic walkway. The effect of altering these parameters was observed to identify values that could correctly group the footprints [36].
The number of footprints is equal to the number of clusters identified by the DBSCAN clustering algorithm. Furthermore, using the resulting vectors as a basis, the data from each cluster is separated into left and right footprints. This division considers account the direction of walking and the average position of two consecutive footprints in the perpendicular direction to the walking progression. Figure 2a and b illustrates this process, where the first identified footprint is classified as right if it is positioned further to the right when walking in the direction of increasing coordinates of the sensor line, or further to the left when walking in the opposite direction. Subsequent footprints alternate between right and left.
Spatiotemporal variables are calculated from the clustered data (Figure 2c). This includes parameters such as step length, stride length, gait speed, cadence, and gait cycle duration, providing a comprehensive understanding of the individual’s walking pattern. After processing, a detailed analysis of the spatiotemporal variables in the gait and visual representations of the cycle through images are displayed on the ‘Results Screen’ (Figure 3). Additionally, the data, along with their respective date/time stamps, are stored in the database, serving as a customizable history of analyses, accessible through the ‘Management Screen’. Figure 2c illustrates the identification of heel contact and the calculation of step length, stride length, and base of support, while Figure 3 shows the results on the GAITWell® interface.
2.3.2. Simultaneous Integration of GAITWell® and Qualisys System for Gait Data Collection
Spatial-temporal and kinematic gait parameters were simultaneously acquired using the GAITWell® system and the Qualisys Pro-Reflex MCU (Qualisys MEDICAL AB, Gothenburg, Sweden). The Qualisys system, equipped with seven cameras and a 120 Hz sampling rate, was synchronized with two AMTI force plates embedded in a wooden platform. The force plates provide data for determining gait cycle events, such as foot contact on the first plate, toe-off, and subsequent contact on the second plate. Ground reaction force (GRF) data were recorded at 1 kHz and then resampled to 120 Hz. The Qualisys Track Manager 1.6.0.x-QTM software collected the data.
After calibrating the Qualisys system and the force plates, the GAITWell® electronic walkway was placed on the wooden platform, as illustrated in Figure 4a–d. To ensure participants stepped on both the force plates and the GAITWell® plates simultaneously, the GAITWell® walkway—consisting of 4 rows and 2 columns of plates (each 44 cm x 37 cm)—was aligned directly over force plates 1 and 2 (each 51 cm x 51 cm), with an approximate 51 cm gap between them (Figure 4b).
The GAITWell® system was then connected to a laptop via Bluetooth, and a pre-programmed calibration was conducted to ensure proper functionality. To prevent interference with the readings, the force plates were recalibrated (zeroed) after setting up the GAITWell® system. The GAITWell® system collected data at a frequency of 1 kHz, with a 1 ms interval between samples, providing high temporal resolution for gait analysis.
Only strides that included foot contact on the first force plate and subsequent contact on the second force plate were analyzed. These specific strides were visually inspected using the Qualisys system, which integrated camera footage and force plate signals. We specifically compared each individual stride containing force plate data with the corresponding stride data from the GAITWell® system.
2.4. Experimental Setup
Data was collected at the Laboratory of Movement Analysis of the School of Physical Education, Physical Therapy and Occupation Therapy at Federal University of Minas Gerais, Brazil. Participants were instructed to wear shorts and walk barefoot over the gait walkway. After the first visit, participants were invited to attend a second visit one week apart. This aspect of the experiment was designated for evaluating the test-retest reliability of the GAITWell®.
For the kinematic data obtained from the Qualisys system, anatomical markers were used to determine the coordinates of leg and foot. The markers were placed at the lateral and medial condyles, lateral and medial malleoli, heads of the first, second, and fifth metatarsals, and the distal end of the calcaneus [39,40]. In addition, a cluster consisting of a rigid plate attached to a neoprene girdle with four tracking markers were positioned in the medial third of both shanks [39,40]. Clusters of tracking markers were used to capture the motion of the lower limb segments. These markers are essential for accurately developing the biomechanical model, which serves as the foundation for analyzing gait. After attaching the passive markers and cluster, participants were asked to stand still using a comfortable stance for 5 seconds to record the static trial. The static trial is important to define each segment and teach the software the particular dimensions of the participant’s body part.
Next, the participants were instructed to walk over the GAITWell®, which was positioned on top of the force plates, at their comfortable self-selected gait speed. A specific command was issued as follows: “Upon my command ‘go’, walk at a speed as close as possible to your normal gait speed.” Participants were given a practice period to familiarize themselves with the procedures. Participants performed 10 trials. Trials in which the foot correctly contacted the force plate, and all the dynamic markers were visible were used for analysis. On average 5 trials were used for analysis. After each collection, the data were checked for quality and stored for analysis. The average length of stay of each participant was approximately 90 minutes.
2.5. Data Reduction
Kinematic and kinetic data from the Qualisys system were processed using Visual 3D (HAS-Motion, Kingston, ON, Canada). Initially, a biomechanical model was constructed using the passive markers placed on anatomical landmarks described previously. The model was then applied to the dynamic files obtained with the tracking markers to interpret the kinematic data [42]. Heel strike and toe-off events were automatically detected using the vertical ground reaction force from the force plates with a 20 N threshold. These data were integrated to accurately define the gait cycle and generate both spatial and temporal gait parameters. A fourth-order Butterworth low-pass filter was applied to the data, with cut-off frequencies set at 6 Hz for kinematic data and 18 Hz for kinetic data, to reduce noise. Finally, the gait cycle was normalized to 101 data points to facilitate consistent analysis and comparison.
In the GAITWell® system, the kinematic data was processed using the software developed by our group, which fully automates the data collection, processing, and visualization of the gait cycle. Data reduction in the GAITWell® involves a post-clustering process, as described previously, aimed at deriving meaningful spatiotemporal variables characterizing an individual’s gait. The spatiotemporal parameters were calculated as detailed in Box 1.
Box 1. Spatiotemporal parameters calculated with the GAITWell system.
| Gait Cycle Time in seconds was calculated as the average of the right and left cycle times. This metric represents the time interval between the initial contact of the foot and the initial contact of the subsequent foot of the same limb. |
| Stance time in seconds was is determined by subtracting the moment the foot leaves the ground (toe-off) from the moment it first touches the ground (heel strike). |
| Swing time in seconds was determined by subtracting the moment the foot leaves the ground (toe-off) from the moment it touches the ground again (heel strike). |
| The number of steps was determined based on the total number of footfalls (‘n’), with each footfall indicating the transition from one step to another. Subtracting one from the total footfalls accounts for the initial step, which does not have a preceding footfall, resulting in ‘n – 1’ steps. |
| The number of Strides was determined as the number of steps minus one |
| Total walking time in seconds was determined by determining the time interval between the first foot contact and toe-off. |
| Total Distance in meters was determined as the linear distance between the first foot contact and the last foot contact, marked by the time of initial sensor activation, and the last toe-off contact with the device surface, identified by the time the sensor is triggered for the last time. |
| Base of support in meters is determined within the plane perpendicular to the plane of progression. It represents the perpendicular distance between the first foot contact of one foot and the subsequent first contact of the opposite foot. The final value is obtained by averaging the base of support of each step. |
| Step Length in meters is defined as the linear distance in the plane of progression between the left and right heel contacts for left step length, or between the right and left heel contacts for right step length. (Figure 2c). |
| Stride length in meters was determined by the linear distance in the plane of progression between the first heel contact of the foot to the subsequent heel contact of the same foot. |
| Step Time in seconds was determined as the time elapsed between the initial contacts of the right and left footfalls. |
| Cadence was determined by dividing the duration of a 60-second interval by the time it takes to complete a single step. This calculation yields the number of steps taken within one minute, representing the individual’s cadence or step frequency. |
| Gait speed was calculated by dividing stride length by the gait cycle time. |
| Single Support Time was determined by calculating the arithmetic mean of the right and left single support times. It represents the average time interval between the lift-off of the opposite foot and its subsequent contact with the ground during the analyzed gait cycles. |
| Double support time was measured by identifying the two intervals that both feet were in the ground then calculating the mean of these values across the analyzed gait cycles. |
2.6. Statistical Analysis
The sample size was determined considering an acceptable level of reliability of 0.5, with a significance level of 0.05 and a beta of 0.2, which indicated that a minimum of 22 participants would be required [43]. Sample characteristics and spatiotemporal gait parameters were described using measures of central tendency and dispersion. Data from visit 1 was used to determine the concurrent validity of the GAITWell® with the Qualisys system. Pearson’s correlation was conducted, and the correlations coefficients were interpreted as follows: negligible (0.0 to 0.30), low (0.30 to 0.50), moderate (0.50 to 0.70), high (0.70 to 0.90), and very high (0.90 to 1.0) [44]. It is hypothesized that there will be moderate-to-high positive correlations between the spatiotemporal variables obtained from the GAITWell® and the Qualisys system.
To assess the test-retest reliability of the GAITWell® system across two visits, the Intraclass Correlation Coefficient (ICC)2,1 was employed with a two-way random effects model [45]. Interpretation of the ICC was as follows: poor (< 0.50), moderate (0.50 to 0.75), good (0.76 to 0.90), and excellent (> 0.90) [45]. It is hypothesized that the spatiotemporal variables will show good to excellent reliability.
The standard error of the mean (SEM) [46]provides information about the repeatability of the measurement and was calculated using the pooled standard deviation between both visits and the ICC2,1:
We also applied the Bland-Altman plots to visualize the agreement between visits for the variables that did not reach reliability [47]. Bland-Altman plots can be used to evaluate the amount of measurement bias, thus more reliable results will show an average bias closer to zero and narrower 95% limits of agreement [47]. Thus, if the measurement falls inside the limits of agreement, then it would suggest no bias in the measurement. All analyses were conducted at a significance level of 0.05, using statistical software SPSS Statistics for Windows version 29.0 (IBM Corp, Armonk, NY, USA).
3. Results
Participated in the study 38 healthy adults, including 18 (47.4%) females, with a mean age of 33.2 years (SD 13.0) and BMI of 26.6 kg/m² (SD 5.4). Of those, only 29 returned for the second visit, including 15 (50%) females, with a mean age of 33.0 years (SD 13.4) and BMI of 27.3 kg/m² (SD 5.6).
Table 1 describes the mean and standard deviation of the gait variables obtained using the GAITWell® and the Qualisys system during the first visit. Most of the correlations ranged from moderate to very high. Gait speed (r = .971, p < .001) and base of support (r = .914, p < .001) showed the strongest correlations. The only exception was stride length, which had a low but significant correlation with the Qualisys system (r = .360, p < .05).
The mean and standard deviations and the test-retest reliability results of the GAITWell® system are described in Table 2. Reliability of the variables gait speed (ICC2,1=.864, p<.001), stride length (ICC2,1=.818, p=.001), cycle time (ICC2,1=.847, p=.001), left step length (ICC2,1=.764, p=.001), right step time (ICC2,1=.821, p=.001), stance time (ICC2,1=.837, p=.001) and swing time (ICC2,1=.767, p=.001) achieved a good level of agreement. However, moderate reliability was observed for right step length (ICC2,1=.650, p=.004) and left step time (ICC2,1=.691, p=.001). Conversely, double support time ICC2,1=-.344, p=.965), cadence of right (ICC2,1=-.528, p=.859) and left steps ICC2,1=-.091, p=.588), and base of support (ICC2,1=-.639, p=.891) exhibited insufficient reliability, failing to attain statistical significance.
Figure 5 displays the Bland-Altman analysis for the GAITWell® system and the Qualisys system, obtained during visits 1 (V1) and 2 (V2), focusing on variables that did not achieve reliability using the GAITWell® system. Descriptive data from the Qualisys system for V2 is not presented. For the variables cadence and base of support, the GAITWell® system was less consistent and reliable, showing greater variability compared to the Qualisys system, which demonstrated lower variability and more consistent measurements. For the variable double support time, the GAITWell® system had similar bias compared to the Qualisys system but lower limits of agreement.
Discrepancies in Sensor Resolution
Further analysis was conducted due to the lack of reliability observed in some of the gait variables. This analysis explored the benefits of increasing the sensor resolution from 4 cm x 4 cm (Figure 6a) to 1.2 cm x 1.2 cm (Figure 6b) on the reliability of the GAITWell® system. To quantify the potential reduction in error, we considered a scenario where the contact points of the heel and toe were positioned exactly in the middle between two sensors, thereby maximizing measurement error.
Box 2 compares the 4 cm x 4 cm resolution with the proposed 1.2 cm x 1.2 cm resolution. The maximum systematic error occurs when the point of contact is halfway between two sensors; for a 4 cm x 4 cm grid, this distance is 2 cm. The spatial uncertainty, considering the distribution of sensors along the x and y axes, is calculated as 2.83 cm. With a sampling frequency of 1 kHz and an average speed of 0.72 m/s, for example, the temporal uncertainty, when converted to distance, is 0.72cm. The quadratic combination of these uncertainties results in a total error of approximately 2.92 cm. With the adoption of a 1.2 cm resolution, the systematic error decreases to 0.6 cm, reducing the spatial uncertainty and total error, significantly enhancing measurement precision.
Box 2. Sensor resolution comparison.
| Resolution (cm) | Sensor Capture Area (cm²) | Maximum Measurement Error (cm)* |
| 4x4 | 16 | 2 |
| 1.2x1.2 | 1.44 | 0.6 |
| * Maximum Measurement Error: Assuming the contact falls exactly in the center between sensors, the maximum error would be half the distance between sensors. | ||
Figure 7 illustrates the impact of sensor resolution. Reducing the sensor resolution from 4 cm x 4 cm to 1.2 cm x 1.2 cm could potentially decrease the measurement error from 2 cm to 0.6 cm, representing a theoretical reduction of 70% in measurement error = ((2−0.6)/2) × 100 = 70%.
4. Discussion
This study aimed to evaluate the methodological properties of the GAITWell® system, a portable and modular technology designed for measuring gait spatiotemporal parameters in healthy young adults. While the GAITWell® system demonstrated validity by showing significant correlations with the gold standard Qualisys Pro-Reflex system, it exhibited limitations in reliability across several key gait variables. Specifically, reliability issues were noted for double support time, cadence, and base of support. Given the cyclic nature of gait, consistent measurement across all parameters is crucial for comprehensive gait analysis. The observed unreliability in these key variables undermines the system’s ability to accurately assess stability, balance, and symmetry. To fully leverage the GAITWell® system’s potential for clinical and research applications, it is essential to improve the reliability of these measurements. Enhancing the system’s capability to provide consistent and accurate data across all gait parameters will be crucial for effectively evaluating mobility and monitoring rehabilitation progress.
Preliminary results suggest that the lack of reliability may be attributed to the low resolution of the sensors used in the GAITWell® system. Increasing the sensor resolution to 1.2 cm x 1.2 cm is projected to reduce the error in detecting heel contact and toe-off events by approximately 70% (Figure 7). This improvement is vital for capturing subtle variations in gait dynamics, which are essential for accurate spatiotemporal parameter assessment. Unlike continuous measurement technologies used in pressure and force sensors, the GAITWell® employs discrete sensors that operate at binary levels (0 and 1). The current spatial resolution of its 4.0 cm x 4.0 cm sensor array may not sufficiently capture fine movement variations in peripheral areas of the foot. This limitation can impact the accuracy of gait metrics such as double support time, as subtle variations in foot movement may be missed. The resolution of the sensor array affects data acquisition, classification, and processing, thereby influencing the precision of gait measurements.
Despite these improvements, our findings indicate that achieving high reliability remains a challenge even for gold standard systems. Bland-Altman plots (Figure 5) showed that the GAITWell® system generally exhibited minimal bias for double support time, and base of support, suggesting that these measurements are reasonably aligned with reference values. However, discrepancies were noted when comparing this to data from visit 2 with the Qualisys system (not reported here). Specifically, the Qualisys system displayed higher bias and wider limits of agreement for double support time compared to the GAITWell® system. This observation indicates that measurement variability is a broader issue in gait analysis and is not confined to the GAITWell® system alone. Nevertheless, enhancing the reliability of the GAITWell® system remains a primary concern. Improving sensor resolution and addressing the system’s limitations are crucial for ensuring consistent and accurate measurements across all gait parameters. This will be essential for the system’s effectiveness in evaluating mobility and monitoring rehabilitation progress.
Our study aligns with prior research on mat-based gait analysis systems, including early evaluations of the GAITRite system by Menz et al. [7], who noted reliability challenges with base of support and toe-in/toe-out angles despite high Intraclass Correlation Coefficients. Similarly, Cutlip et al. [49] found no agreement in step length between the GAITRite system and a video-based system. Bilney et al. [50] reported a low ICC for double support time when comparing the GAITRite system with a foot insole. Bloemendaal et al. [51] developed a low-cost camera-based system and found good agreement with the GAITRite system for several parameters, but poor agreement for double support time. Although these authors used different reference systems, they observed that variability in detecting heel contact and toe-off events, as well as differences in sensitivity and resolution, can affect spatial measurements. This aligns with our findings and supports our results. These studies collectively illustrate the potential challenges in achieving reliable and accurate gait measurements across different systems and serve as a poignant reminder of the imperative for stringent testing and continual refinement during the nascent stages of system development.
The low correlation observed in stride length (r = .360, p < .05) between the GAITWell® and Qualisys systems can be attributed to differences in their methodologies for detecting foot contact and toe-off events. The GAITWell® system utilizes the DBSCAN clustering algorithm, which effectively extracts information and filters out noise, but it may be affected by sensor resolution issues, as observed in this study, potentially leading to inaccuracies in stride length calculation. In contrast, the Qualisys system captures ground reaction forces (GRF) from the force plates, resulting in more accurate measurements. Thus, discrepancies in stride length measurements may arise from differences in the identification and timing of heel contact and toe-off events. Despite these discrepancies, our study found strong correlations in step lengths: right step length (r = .672, p < .001) and left step length (r = .803, p < .001) were consistently measured by both systems. This indicates that while discrete-sensor-based systems like GAITWell® offer a viable alternative, systems utilizing GRF generally provide more reliable measurements for spatial variables such as stride length and base of support.
Two other limitations in our study merit discussion. Firstly, while we assessed the validity of the GAITWell® system against the Qualisys Pro-Reflex, an established motion track system, it would have been ideal to also evaluate its validity against other widely recognized carpet-based systems such as GAITRite [27] or the Zeno Walkway [26]. Comparative assessments with these systems could provide a more comprehensive understanding of the GAITWell’s® performance across different measurement systems. Secondly, our study focused exclusively on a cohort of healthy young adults. Therefore, generalizability to broader populations, including individuals with disabilities or different age groups, remains uncertain. Future research efforts should prioritize expanding the participant pool to encompass diverse demographic and clinical profiles, thus ensuring the applicability and relevance of the GAITWell® system across a wider spectrum of users.
In conclusion, while the GAITWell® system shows considerable promise for advancing gait analysis in research and clinical practice by capturing a broad range of spatiotemporal gait variables, it currently faces significant challenges with reliability. The system failed to demonstrate consistent reliability across key gait variables, highlighting a critical need for improvement. Preliminary findings suggest that enhancing sensor resolution could address these issues and improve measurement accuracy. Despite these shortcomings, the GAITWell® system’s portable and modular design highlights its potential as a valuable tool for gait analysis in low- and middle-income countries. Its compact size, and user-friendly software, facilitate immediate and effective gait analysis and rehabilitation planning. This makes the GAITWell® system particularly advantageous for use in rehabilitation clinics, senior care homes, and health institutions with limited space and resources. Future work will focus on upgrading the sensors and refining the system to fully realize its potential for improving patient care and advancing research in gait analysis. We are committed to these enhancements to ensure the GAITWell® system’s continued growth and effectiveness in the field.
5. Patents
The GAITWell® technology has been patented under the number BR 202017028502-8, filed on 12/28/2017, and granted on 12/26/2023. The patent covers a device for quantifying the spatiotemporal parameters of human gait, as well as the processes of operating this device and quantifying these parameters using the device.
Author Contributions
W.D.D., I.C.B., I.O.C, and M. S., conceptualization; W.D.D., R.K., I.C.B., and I.O.C, formal analysis; W.D.D., R.K., I.C.B., and I.O.C.; W.D.D., investigation; W.D.D. and R.K., methodology; W.D.D. and R.H, project administration; R.H., resources; W.D.D., 3D Modeling and Design; I.C.B. and I.O.C., software; W.D.D., R.K., I.C.B., and I.O.C, validation; W.D.D. and R.K., writing – original draft; W.D.D., R.K., M.S., F.C., C.B.S.V., and R.H., writing – review and editing.
Funding
W.D.D was funded by the Conselho Nacional de Desenvolvimento Científico e Tecnológico (CNPQ) - Process number 142163/2018-0. All other authors have no financial disclosures to declare.
Institutional Review Board Statement
The study was conducted in accordance with the Ethics Committee of Brazil (COEP) under the number CAAE: 95186518.0.0000.5149. Approval number: 2.836.553, with the approval date being August 22, 2018, for studies involving humans.
Informed Consent Statement
Informed consent was obtained from all subjects involved in the study.
Data Availability Statement
The data supporting the findings of this manuscript are available upon request from the first author via email: wellingtaniadi-as.ufmg@gmail.com.
Acknowledgments
The authors would like to thank the Conselho Nacional de Desenvolvimento Científico e Tecnológico (CNPq) - Process number 142163/2018-0, for their support in this project. This study was financed in part by the Coordenação de Aperfeiçoamento de Pessoal de Nível Superior - Brasil (CAPES) - Finance Code 001. The authors further acknowledge the support of the Pró-Reitoria de Pesquisa (PRPq) and the Pró-Reitoria de Pós-Graduação (PRPG) of the Federal University of Minas Gerais (UFMG).
Conflicts of Interest
The authors declare no conflicts of interest.
References
- Auvinet, B.; Touzard, C.; Montestruc, F.; Delafond, A.; Goeb, V. Gait Disorders in the Elderly and Dual Task Gait Analysis: A New Approach for Identifying Motor Phenotypes. J Neuroeng Rehabil 2017, 14, 1–14. [CrossRef]
- Curuk, E.; Goyal, N.; Aruin, A. S. The Effect of Motor and Cognitive Tasks on Gait in People with Stroke. Journal of Stroke and Cerebrovascular Diseases 2019, 28, 11. [CrossRef]
- Boekesteijn, R. J.; van Gerven, J.; Geurts, A. C. H.; Smulders, K. Objective Gait Assessment in Individuals with Knee Osteoarthritis Using Inertial Sensors: A Systematic Review and Meta-Analysis. Gait Posture 2022, 98, 109–120. [CrossRef]
- Kirkwood, R. N.; Franco, R. de L. L. D.; Furtado, S. C.; Barela, A. M. F.; Deluzio, K. J.; Mancini, M. C. Frontal Plane Motion of the Pelvis and Hip during Gait Stance Discriminates Children with Diplegia Levels I and II of the GMFCS. ISRN pediatrics, 2012, 1–8. [CrossRef]
- Simon, S. R. Quantification of Human Motion: Gait Analysis—Benefits and Limitations to Its Application to Clinical Problems. Journal of biomechanics, 2004, 37, 1869–1880. [CrossRef]
- Stebbins, J.; Harrington, M.; Stewart, C. Clinical Gait Analysis 1973–2023: Evaluating Progress to Guide the Future. Journal of biomechanics, 2023, 160. [CrossRef]
- Menz, H. B.; Latt, M. D.; Tiedemann, A.; Kwan, M. M. S.; Lord, S. R. Reliability of the GAITRite® Walkway System for the Quantification of Temporo-Spatial Parameters of Gait in Young and Older People. Gait and Posture 2004, 20, 20–25. [CrossRef]
- Muro-de-la-Herran, A.; García-Zapirain, B.; Méndez-Zorrilla, A. Gait Analysis Methods: An Overview of Wearable and Non-Wearable Systems, Highlighting Clinical Applications. Sensors 2014, Vol. 14, Pages 3362-3394 2014, 14, 3362–3394. [CrossRef]
- MejiaCruz, Y.; Franco, J.; Hainline, G.; Fritz, S.; Jiang, Z.; Caicedo, J. M.; Davis, B.; Hirth, V. Walking Speed Measurement Technology: A review. Current geriatrics reports, 10, 32–41. [CrossRef]
- Richards, J.G. The Measurement of Human Motion: A Comparison of Commercially Available Systems. Hum Mov Sci 1999, 18, 589–602. [CrossRef]
- Kanko, R. M.; Laende, E.; Selbie, W. S.; Deluzio, K. J. Inter-Session Repeatability of Markerless Motion Capture Gait Kinematics. Journal of biomechanics, 2021, 121. [CrossRef]
- Windolf, M.; Götzen, N.; Morlock, M. Systematic Accuracy and Precision Analysis of Video Motion Capturing Systems—Exemplified on the Vicon-460 System. J Biomech 2008, 41, 2776–2780. [CrossRef]
- Magalhães, C. M. B.; Resende, R. A.; Kirkwood, R. N. Increased Hip Internal Abduction Moment and Reduced Speed Are the Gait Strategies Used by Women with Knee Osteoarthritis. Journal of Electromyography and Kinesiology 2013, 23, 1243–1249. [CrossRef]
- Resende, R. A.; Deluzio, K. J.; Kirkwood, R. N.; Hassan, E. A.; Fonseca, S. T. Increased Unilateral Foot Pronation Affects Lower Limbs and Pelvic Biomechanics during Walking. Gait Posture 2015, 41. [CrossRef]
- Caldas, R.; Mundt, M.; Potthast, W.; Buarque de Lima Neto, F.; Markert, B. A Systematic Review of Gait Analysis Methods Based on Inertial Sensors and Adaptive Algorithms. Gait Posture 2017, 57, 204–210. [CrossRef]
- Díaz, S.; Stephenson, J.B.; Labrador, M.A. Use of Wearable Sensor Technology in Gait, Balance, and Range of Motion Analysis. Applied Sciences, 2020, 10, 234. [CrossRef]
- Chen, S.; Lach, J.; Lo, B.; Yang, G. Z. Toward Pervasive Gait Analysis With Wearable Sensors: A Systematic Review. IEEE journal of biomedical and health informatics, 20(6), 1521–1537. [CrossRef]
- Beauchamp, M.; Kirkwood, R.; Cooper, C.; Brown, M.; Newbold, K. B.; Scott, D.; Beauchamp, M.; Fang, Q.; Gardner, P.; Kuspinar, A.; et al. Monitoring Mobility in Older Adults Using a Global Positioning System (GPS) Smartwatch and Accelerometer: A Validation Study. PLoS One, 2023, 18. [CrossRef]
- de Bruin, E. D.; Hartmann, A.; Uebelhart, D.; Murer, K.; Zijlstra, W. Wearable Systems for Monitoring Mobility-Related Activities in Older People: A Systematic Review. Clin Rehabil 2008, 22, 878–895. [CrossRef]
- Twardzik, E.; Duchowny, K.; Gallagher, A.; Alexander, N.; Strasburg, D.; Colabianchi, N.; Clarke, P. What Features of the Built Environment Matter Most for Mobility? Using Wearable Sensors to Capture Real-Time Outdoor Environment Demand on Gait Performance. Gait & posture, 2019, 68, 437–442. [CrossRef]
- Beyer, K. B.; Weber, K. S.; Cornish, B. F.; Vert, A.; Thai, V.; Godkin, F. E.; McIlroy, W. E.; Van Ooteghem, K. NiMBaLWear Analytics Pipeline for Wearable Sensors: A Modular, Open-Source Platform for Evaluating Multiple Domains of Health and Behaviour. BMC Digital Health, 2024, 2. [CrossRef]
- Nascimento, D. H. A.; Magalhães, F. A.; Sabino, G. S.; Resende, R. A.; Duarte, M. L. M.; Vimieiro, C. B. S. Development of a Human Motion Analysis System Based on Sensorized Insoles and Machine Learning Algorithms for Gait Evaluation. Invetions, 2022, 7, 98. [CrossRef]
- Jacobs, D.; Farid, L.; Ferré, S.; Herraez, K.; Gracies, J.-M.; Hutin, E. Evaluation of the Validity and Reliability of Connected Insoles to Measure Gait Parameters in Healthy Adults. Sensors (Basel), 2021, 21, 6543. [CrossRef]
- Taborri, J.; Palermo, E.; Rossi, S.; Cappa, P. Gait Partitioning Methods: A Systematic Review. Sensors 2016, 16, 66. [CrossRef]
- McDonough, A. L.; Batavia, M.; Chen, F. C.; Kwon, S.; Ziai, J. The Validity and Reliability of the GAITRite System’s Measurements: A Preliminary Evaluation. Arch Phys Med Rehabil, 2001, 82, 419–425. [CrossRef]
- Sabo, A.; Gorodetsky, C.; Fasano, A.; Iaboni, A.; Taati, B. Concurrent Validity of Zeno Instrumented Walkway and Video-Based Gait Features in Adults With Parkinson’s Disease. IEEE J Transl Eng Health Med 2022, 10. [CrossRef]
- Vallabhajosula, S.; Humphrey, S. K.; Cook, A. J.; Freund, J. E. Concurrent Validity of the Zeno Walkway for Measuring Spatiotemporal Gait Parameters in Older Adults. Journal of Geriatric Physical Therapy, 2019, 42, E42–E50. [CrossRef]
- Middleton, A.; Fritz, S. L.; Lusardi, M. Walking Speed: The Functional Vital Sign. J Aging Phys Act, 2015, 23, 314-322. [CrossRef]
- Kirkwood, R. N.; Moreira, B. S.; Mingoti, S. A.; Faria, B. F.; Sampaio, R. F.; Resende, R. A. The Slowing down Phenomenon: What Is the Age of Major Gait Velocity Decline? Maturitas, 2018, 115, 31–36. [CrossRef]
- McAndrew Young, P.M.; Dingwell, J.B. Voluntary Changes in Step Width and Step Length during Human Walking Affect Dynamic Margins of Stability. Gait Posture, 2012, 36, 219–224. [CrossRef]
- Padmanabhan, P.; Rao, K. S.; Gulhar, S.; Cherry-Allen, K. M.; Leech, K. A.; Roemmich, R.T. Persons Post-Stroke Improve Step Length Symmetry by Walking Asymmetrically. J Neuroeng Rehabil, 2020, 17. [CrossRef]
- Slaght, J.; Sénéchal, M.; Hrubeniuk, T. J.; Mayo, A.; Bouchard, D.R. Walking Cadence to Exercise at Moderate Intensity for Adults: A Systematic Review. Journal of Sports Medicine, 2017. [CrossRef]
- Mokkink, L. B.; Terwee, C. B.; Patrick, D. L.; Alonso, J.; Stratford, P. W.; Knol, D. L.; Bouter, L. M.; De Vet, H. C. W. The COSMIN Checklist for Assessing the Methodological Quality of Studies on Measurement Properties of Health Status Measurement Instruments: An International Delphi Study. Quality of Life Research, 2010, 19, 539–549. [CrossRef]
- Mokkink, L. B.; Prinsen, C. A. C.; Bouter, L. M.; de Vet, H. C. W.; Terwee, C. B. The Consensus-Based Standards for the Selection of Health Measurement Instruments (COSMIN) and How to Select an Outcome Measurement Instrument. Braz J Phys Ther 2016, 20, 105–113. [CrossRef]
- Ester, M.; Kriegel, H.; Sander, J.; Xu, X. A Density-Based Algorithm for Discovering Clusters in Large Spatial Databases with Noise. Knowledge Discovery and Data Mining, 1996, 226-23. [CrossRef]
- Starczewski, A.; Goetzen, P.; Er, M. J. A New Method for Automatic Determining of the DBSCAN Parameters. Journal of Artificial Intelligence and Soft Computing Research, 2020, 10, 209–221. [CrossRef]
- Schubert, E.; Sander, J.; Ester, M.; Kriegel, H. P.; Xu, X. DBSCAN revisited, revisited: Why and how you should (still) use DBSCAN. ACM Transactions on Database Systems, 2017, 42, 1-2. [CrossRef]
- Ansari, M. Y.; Ahmad, A.; Khan, S. S.; Bhushan, G.; Mainuddin Spatiotemporal Clustering: A Review. Artif Intell Rev, 2020, 53, 2381–2423. [CrossRef]
- Wang, C.; Ji, M.; Wang, J.; Wen, W.; Li, T.; Sun, Y. An Improved DBSCAN Method for LiDAR Data Segmentation with Automatic Eps Estimation. Sensors, 2019, 19, 172. [CrossRef]
- Tran, T. N.; Drab, K.; Daszykowski, M. Revised DBSCAN Algorithm to Cluster Data with Dense Adjacent Clusters. Chemometrics and Intelligent Laboratory Systems 2013, 120, 92–96. [CrossRef]
- Mahesh Kumar, K.; Rama Mohan Reddy, A. A Fast DBSCAN Clustering Algorithm by Accelerating Neighbor Searching Using Groups Method. Pattern Recognit, 2016, 58, 39–48. [CrossRef]
- Kadaba, M. P.; Ramakrishnan, H. K.; Wootten, M. E. Measurement of Lower Extremity Kinematics during Level Walking. Journal of Orthopaedic Research, 1990, 8, 383–392. [CrossRef]
- Walter, S.D.; Eliasziw, M.; Donner, A. Sample Size and Optimal Designs for Reliability Studies. Stat Med, 1998, 17, 101–110. [CrossRef]
- Akoglu, H. User’s Guide to Correlation Coefficients. Turkish journal of emergency medicine, 2018, 18, 91–93. [CrossRef]
- Koo, T. K.; Li, M. Y. A Guideline of Selecting and Reporting Intraclass Correlation Coefficients for Reliability Research. J Chiropr Med, 2016, 15, 155–163. [CrossRef]
- Weir, J. P. Quantifying test-retest reliability using the intraclass correlation coefficient and the SEM. Journal of strength and conditioning research, 2005, 19, 231–240. [CrossRef]
- Giavarina, D. Understanding Bland Altman analysis. Biochemia Medica, 2015, 25, 141-151. [CrossRef]
- Kirkwood, R. N.; Brandon, S. C. E.; Moreira, B. de S.; Deluzio, K. J. Searching for Stability as We Age: The PCA-Biplot Approach. International Journal of Statistics in Medical Research, 2013, 2, 255–262. [CrossRef]
- Cutlip, R. G.; Mancinelli, C.; Huber, F.; DiPasquale, J. Evaluation of an instrumented walkway for measurement of the kinematic parameters of gait. Gait & Posture, 2000, 12, 134–138. [CrossRef]
- Bilney, B.; Morris, M.; Webster, K. Concurrent related validity of the GAITRite walkway system for quantification of the spatial and temporal parameters of gait. Gait & posture, 2003, 17, 68–74. [CrossRef]
- Van Bloemendaal, M.; Bout, W.; Bus, S. A.; Nollet, F.; Geurts, A. C.; Beelen, A. Validity and reproducibility of the Functional Gait Assessment in persons after stroke. Clinical rehabilitation, 2019, 33, 94–103. [CrossRef]
Figure 1.
In (a), an image of the electronic device. In (b), the five layers forming the modular hardware structure (refer to the text for explanation).
Figure 1.
In (a), an image of the electronic device. In (b), the five layers forming the modular hardware structure (refer to the text for explanation).
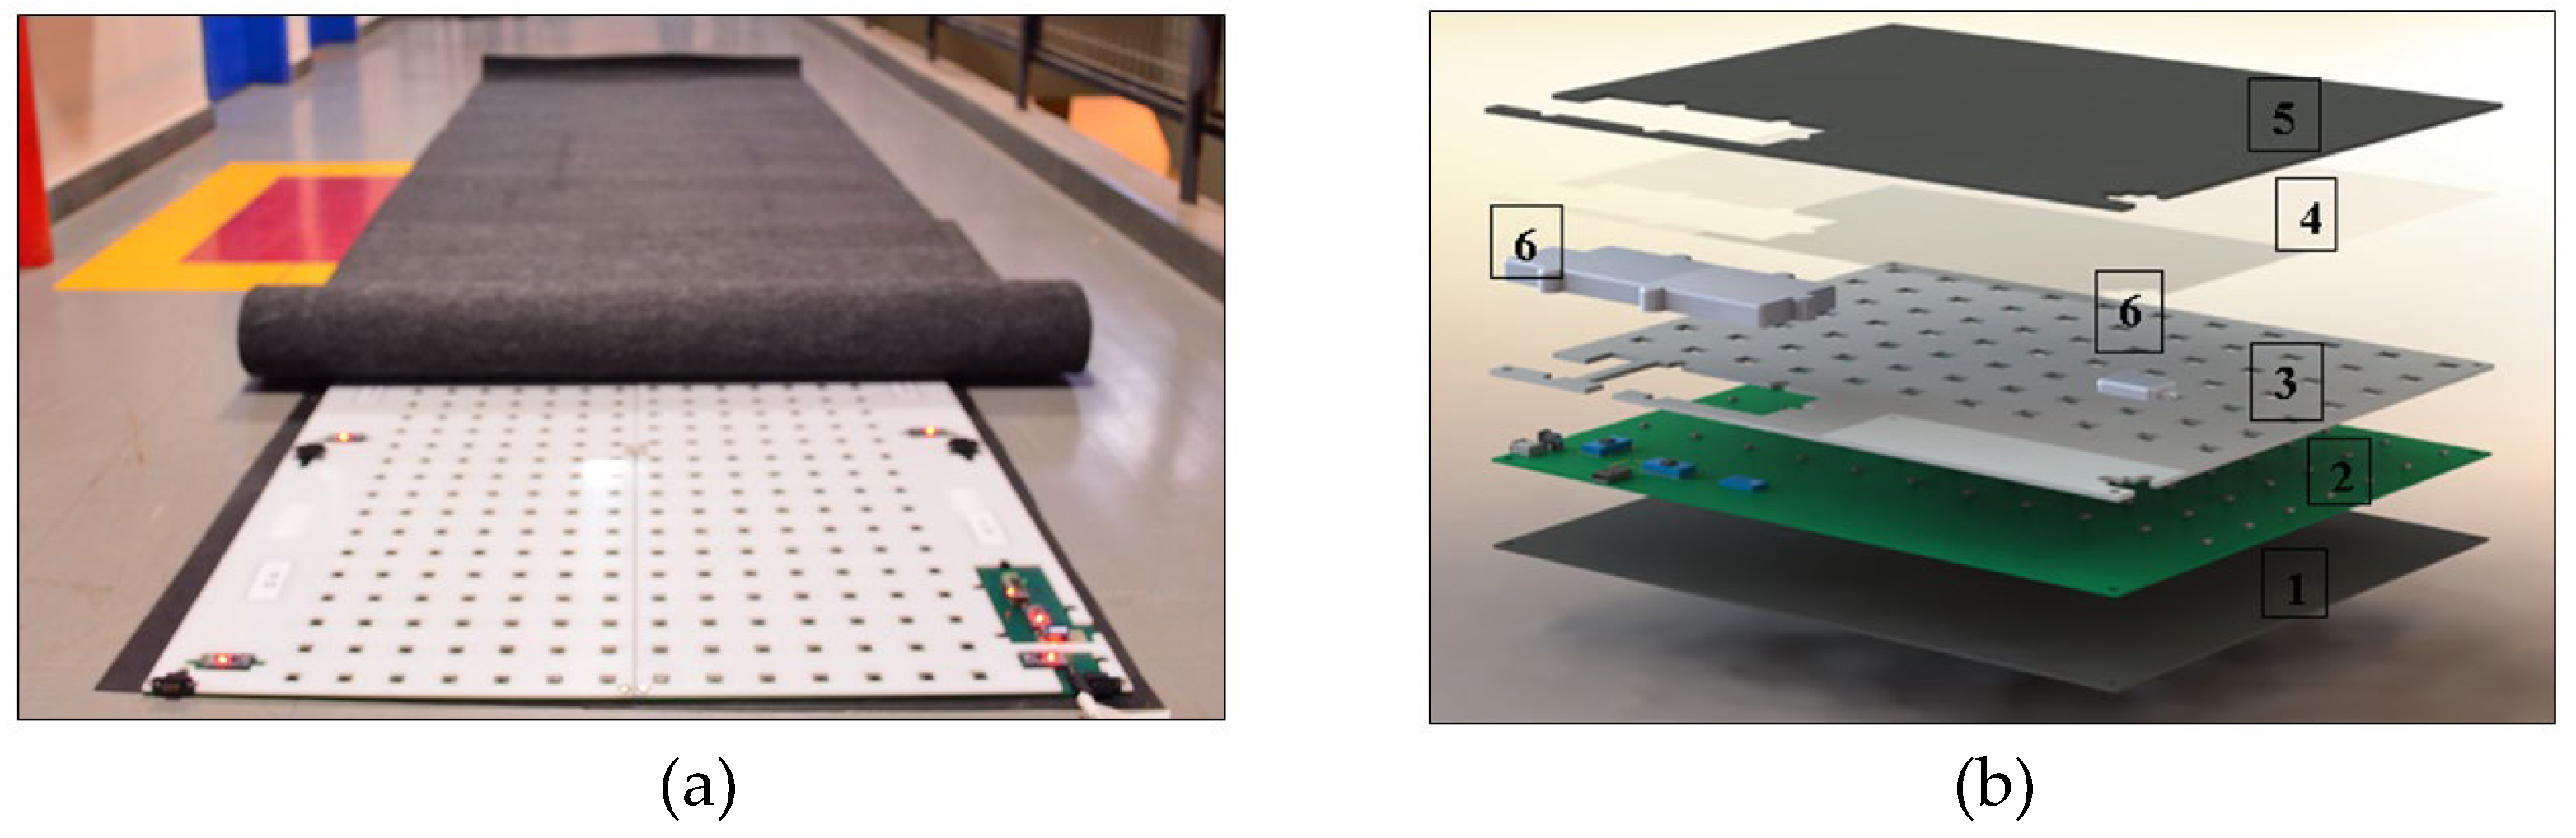
Figure 2.
In (a) Map of all footprints during the gait cycle test; (b) Resulting clustering analysis after excluding the initial partial footprint; (c) Schematic representation illustrating how GAITWell® (3.08 m, 14 interconnected modules) determines step length relative to the (x, y) coordinate and the initial sensor activation on the device by heel strike, stride length and base of support.
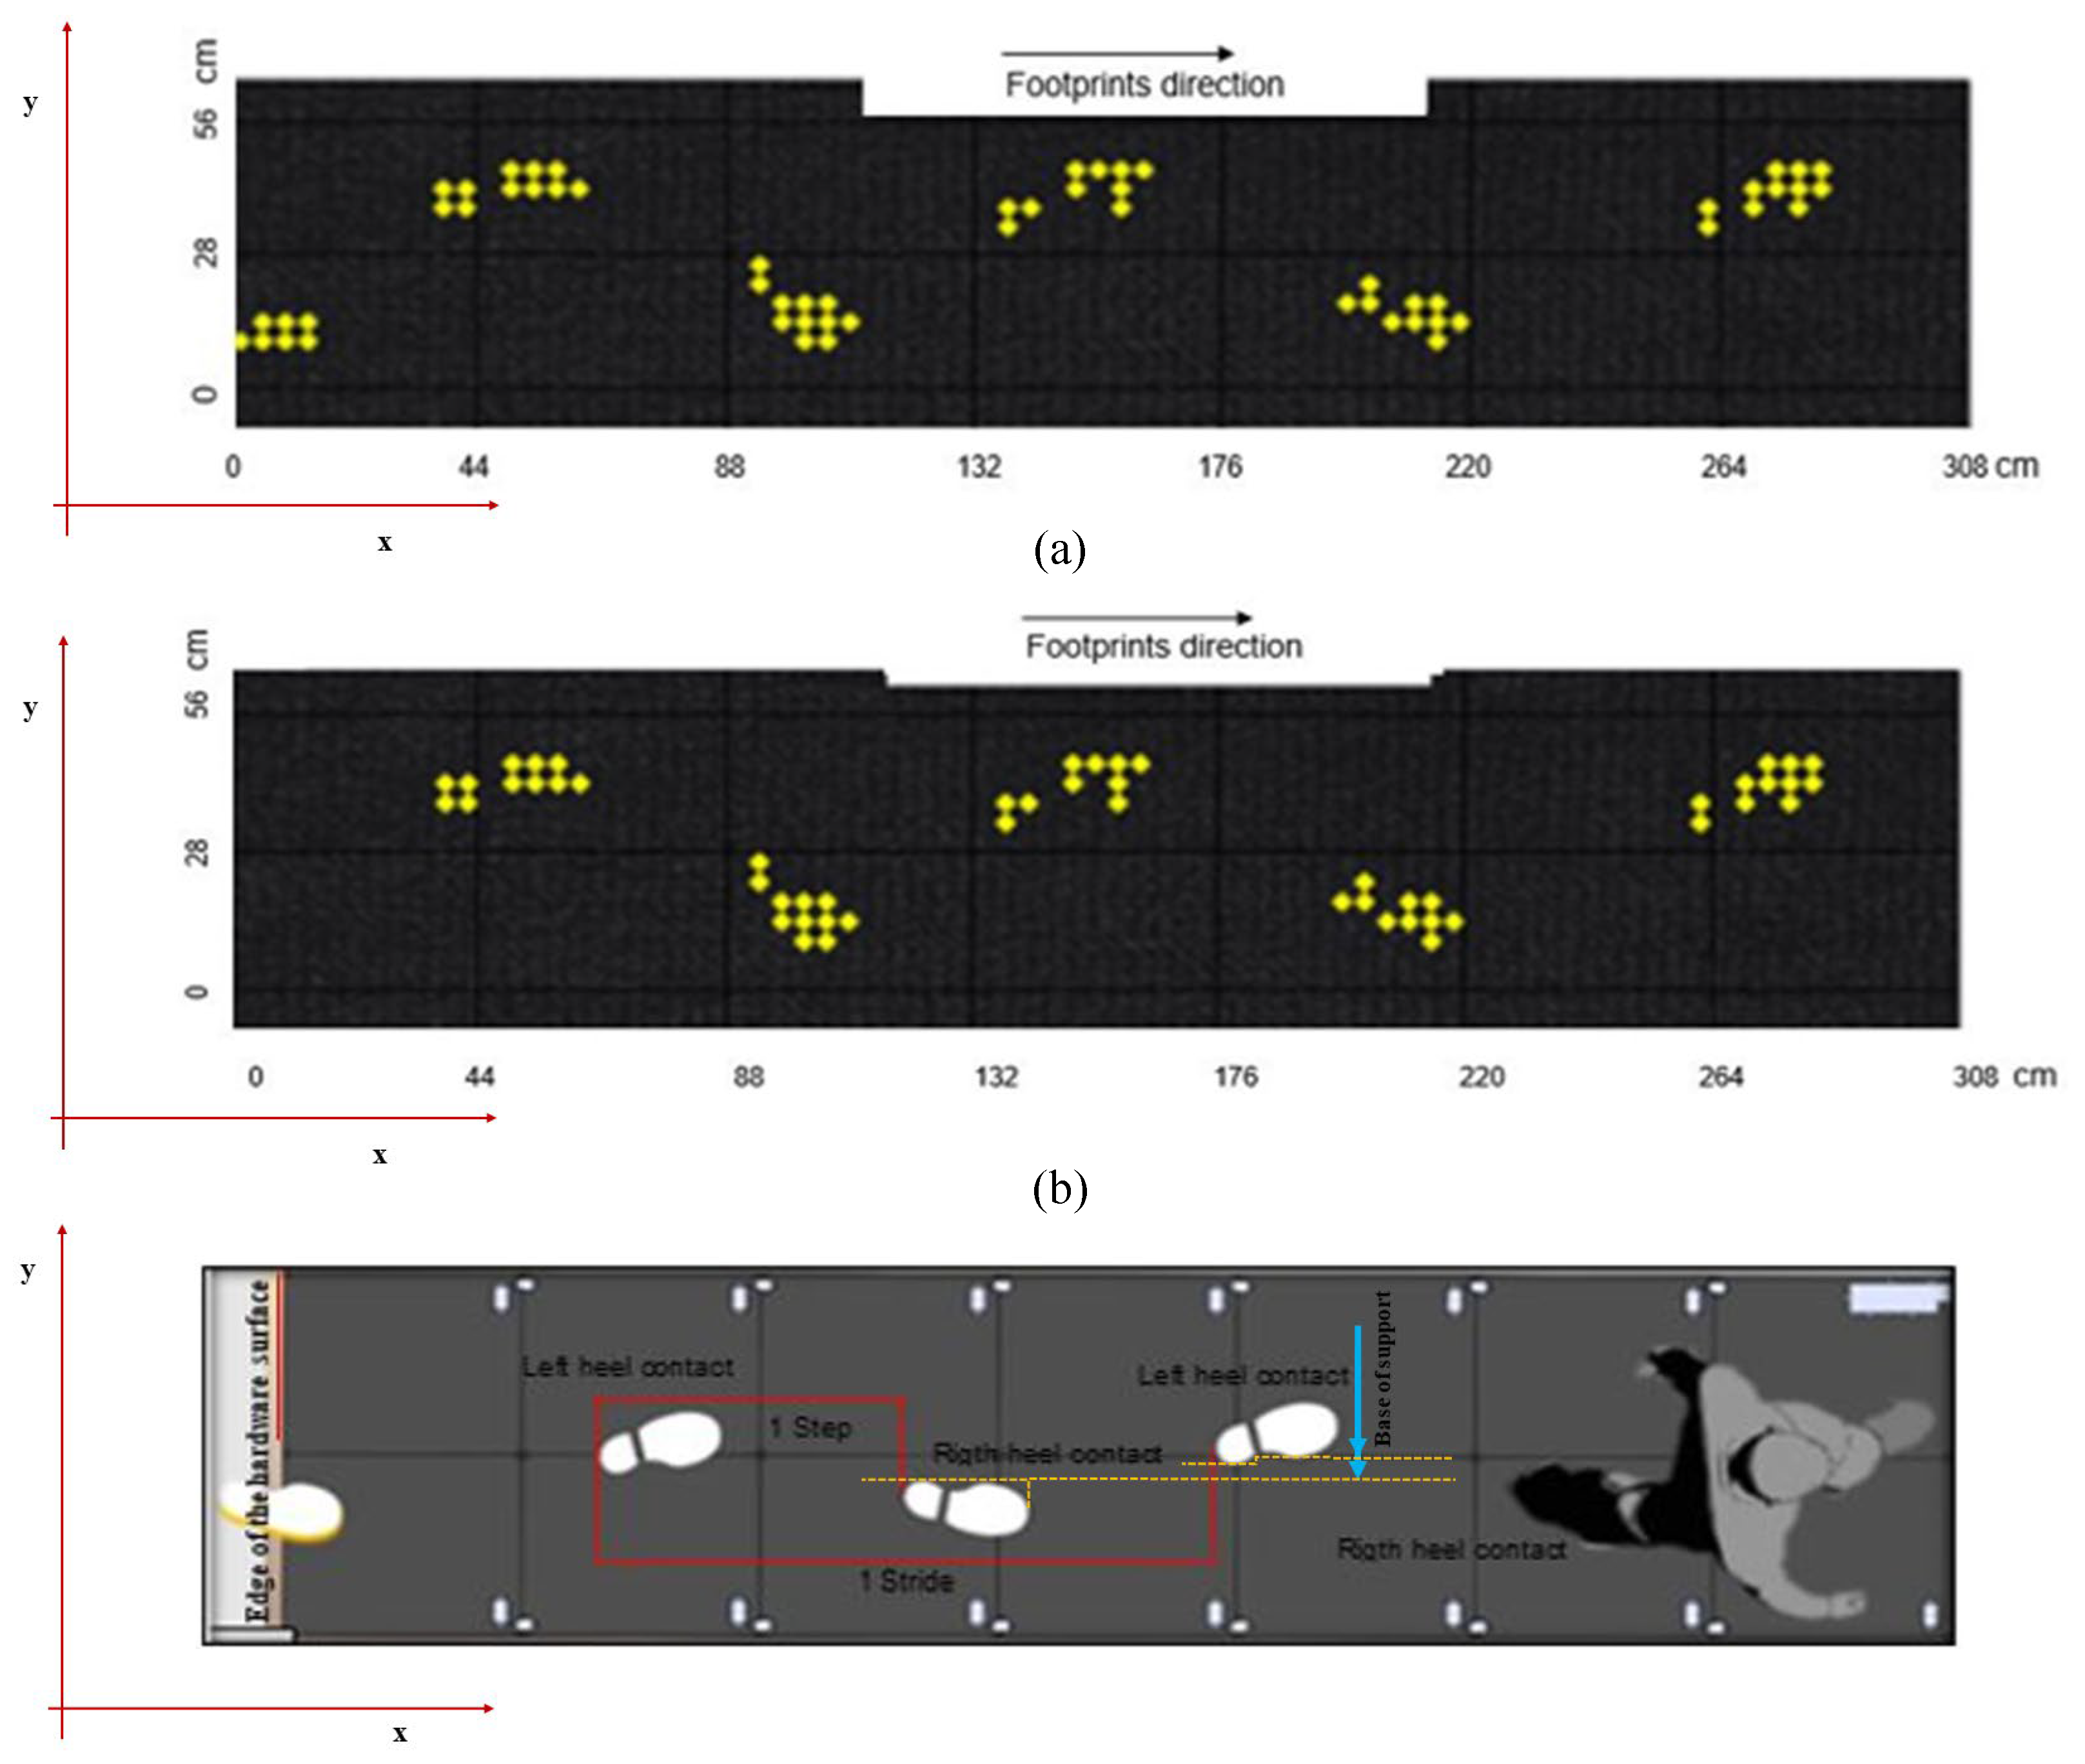
Figure 3.
GAITWell® interface shows the selected footprints and calculated spatiotemporal variables.
Figure 3.
GAITWell® interface shows the selected footprints and calculated spatiotemporal variables.
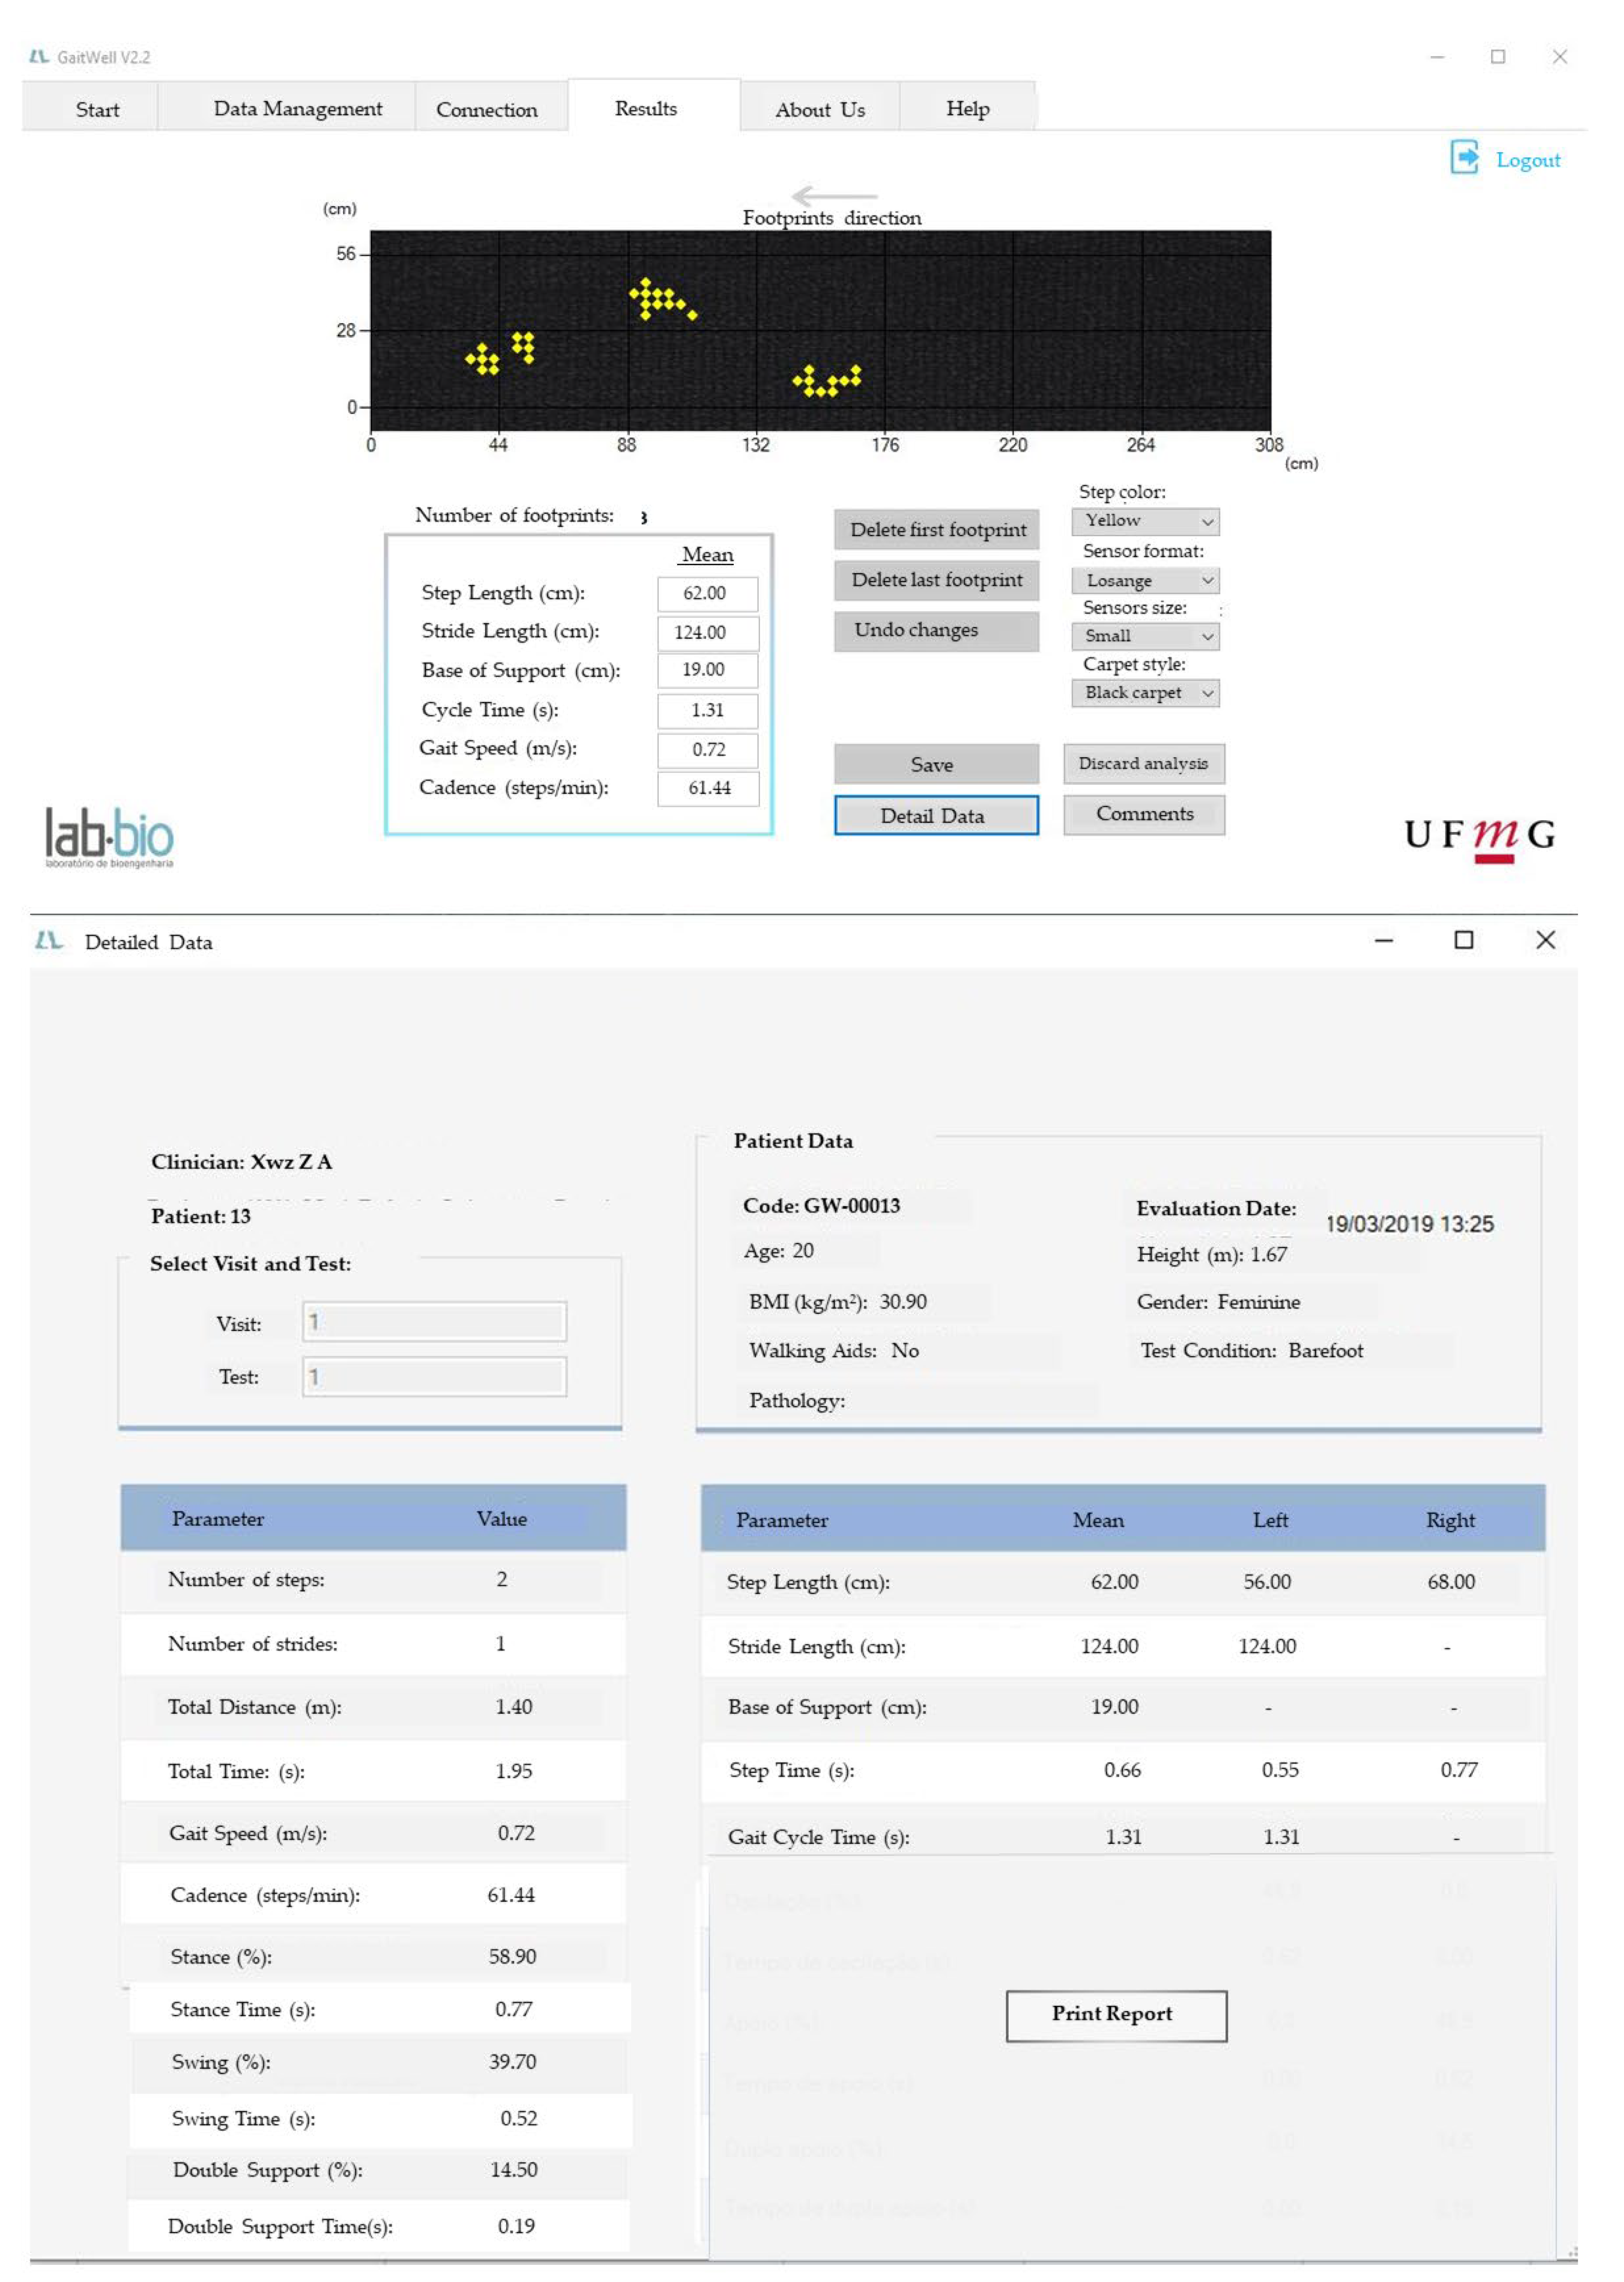
Figure 4.
a to 4d. Panoramic view of the testing area, showing the camera setup and the GAITWell® electronic walkway positioned over the wooden platform with two embedded force plates. The image also illustrates the capture of the gait cycle by the Qualisys cameras, with both feet in contact with the GAITWell® hardware on the force plates.
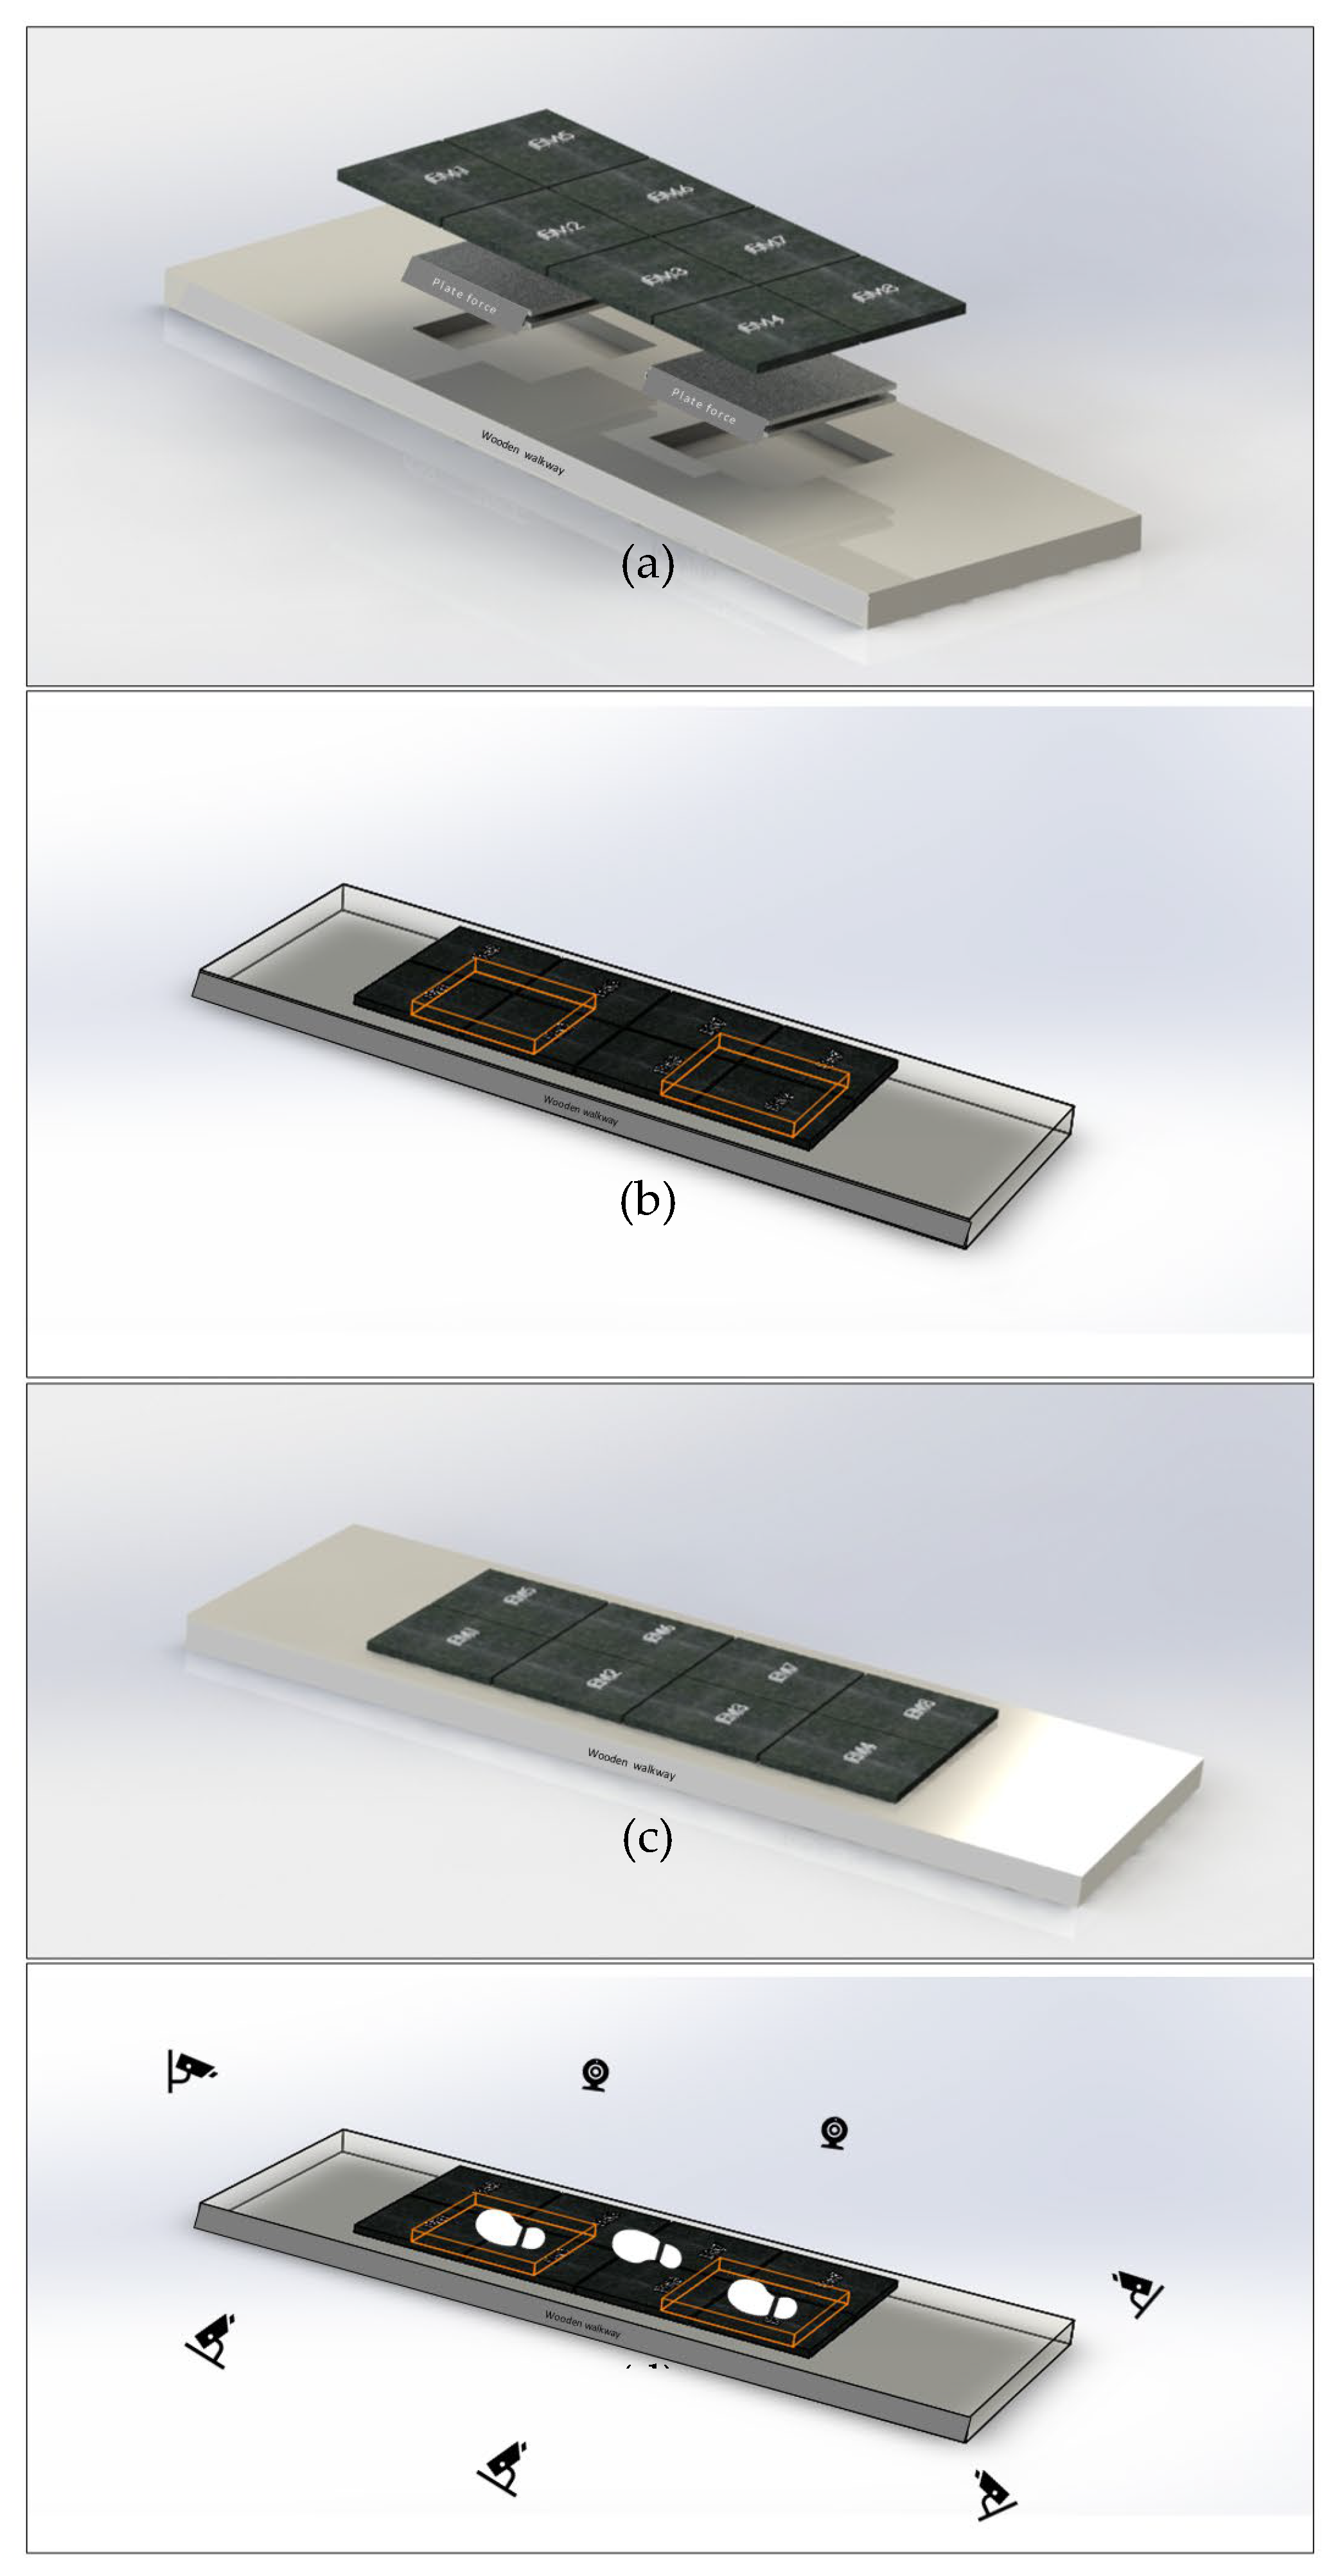
Figure 5.
Bland-Altman analysis of the variables that did not achieve reliability between visits 1 (V1) and 2 (V2) for the GAITWell system. The same variables are presented for the Qualisys system for visual comparison.
Figure 5.
Bland-Altman analysis of the variables that did not achieve reliability between visits 1 (V1) and 2 (V2) for the GAITWell system. The same variables are presented for the Qualisys system for visual comparison.
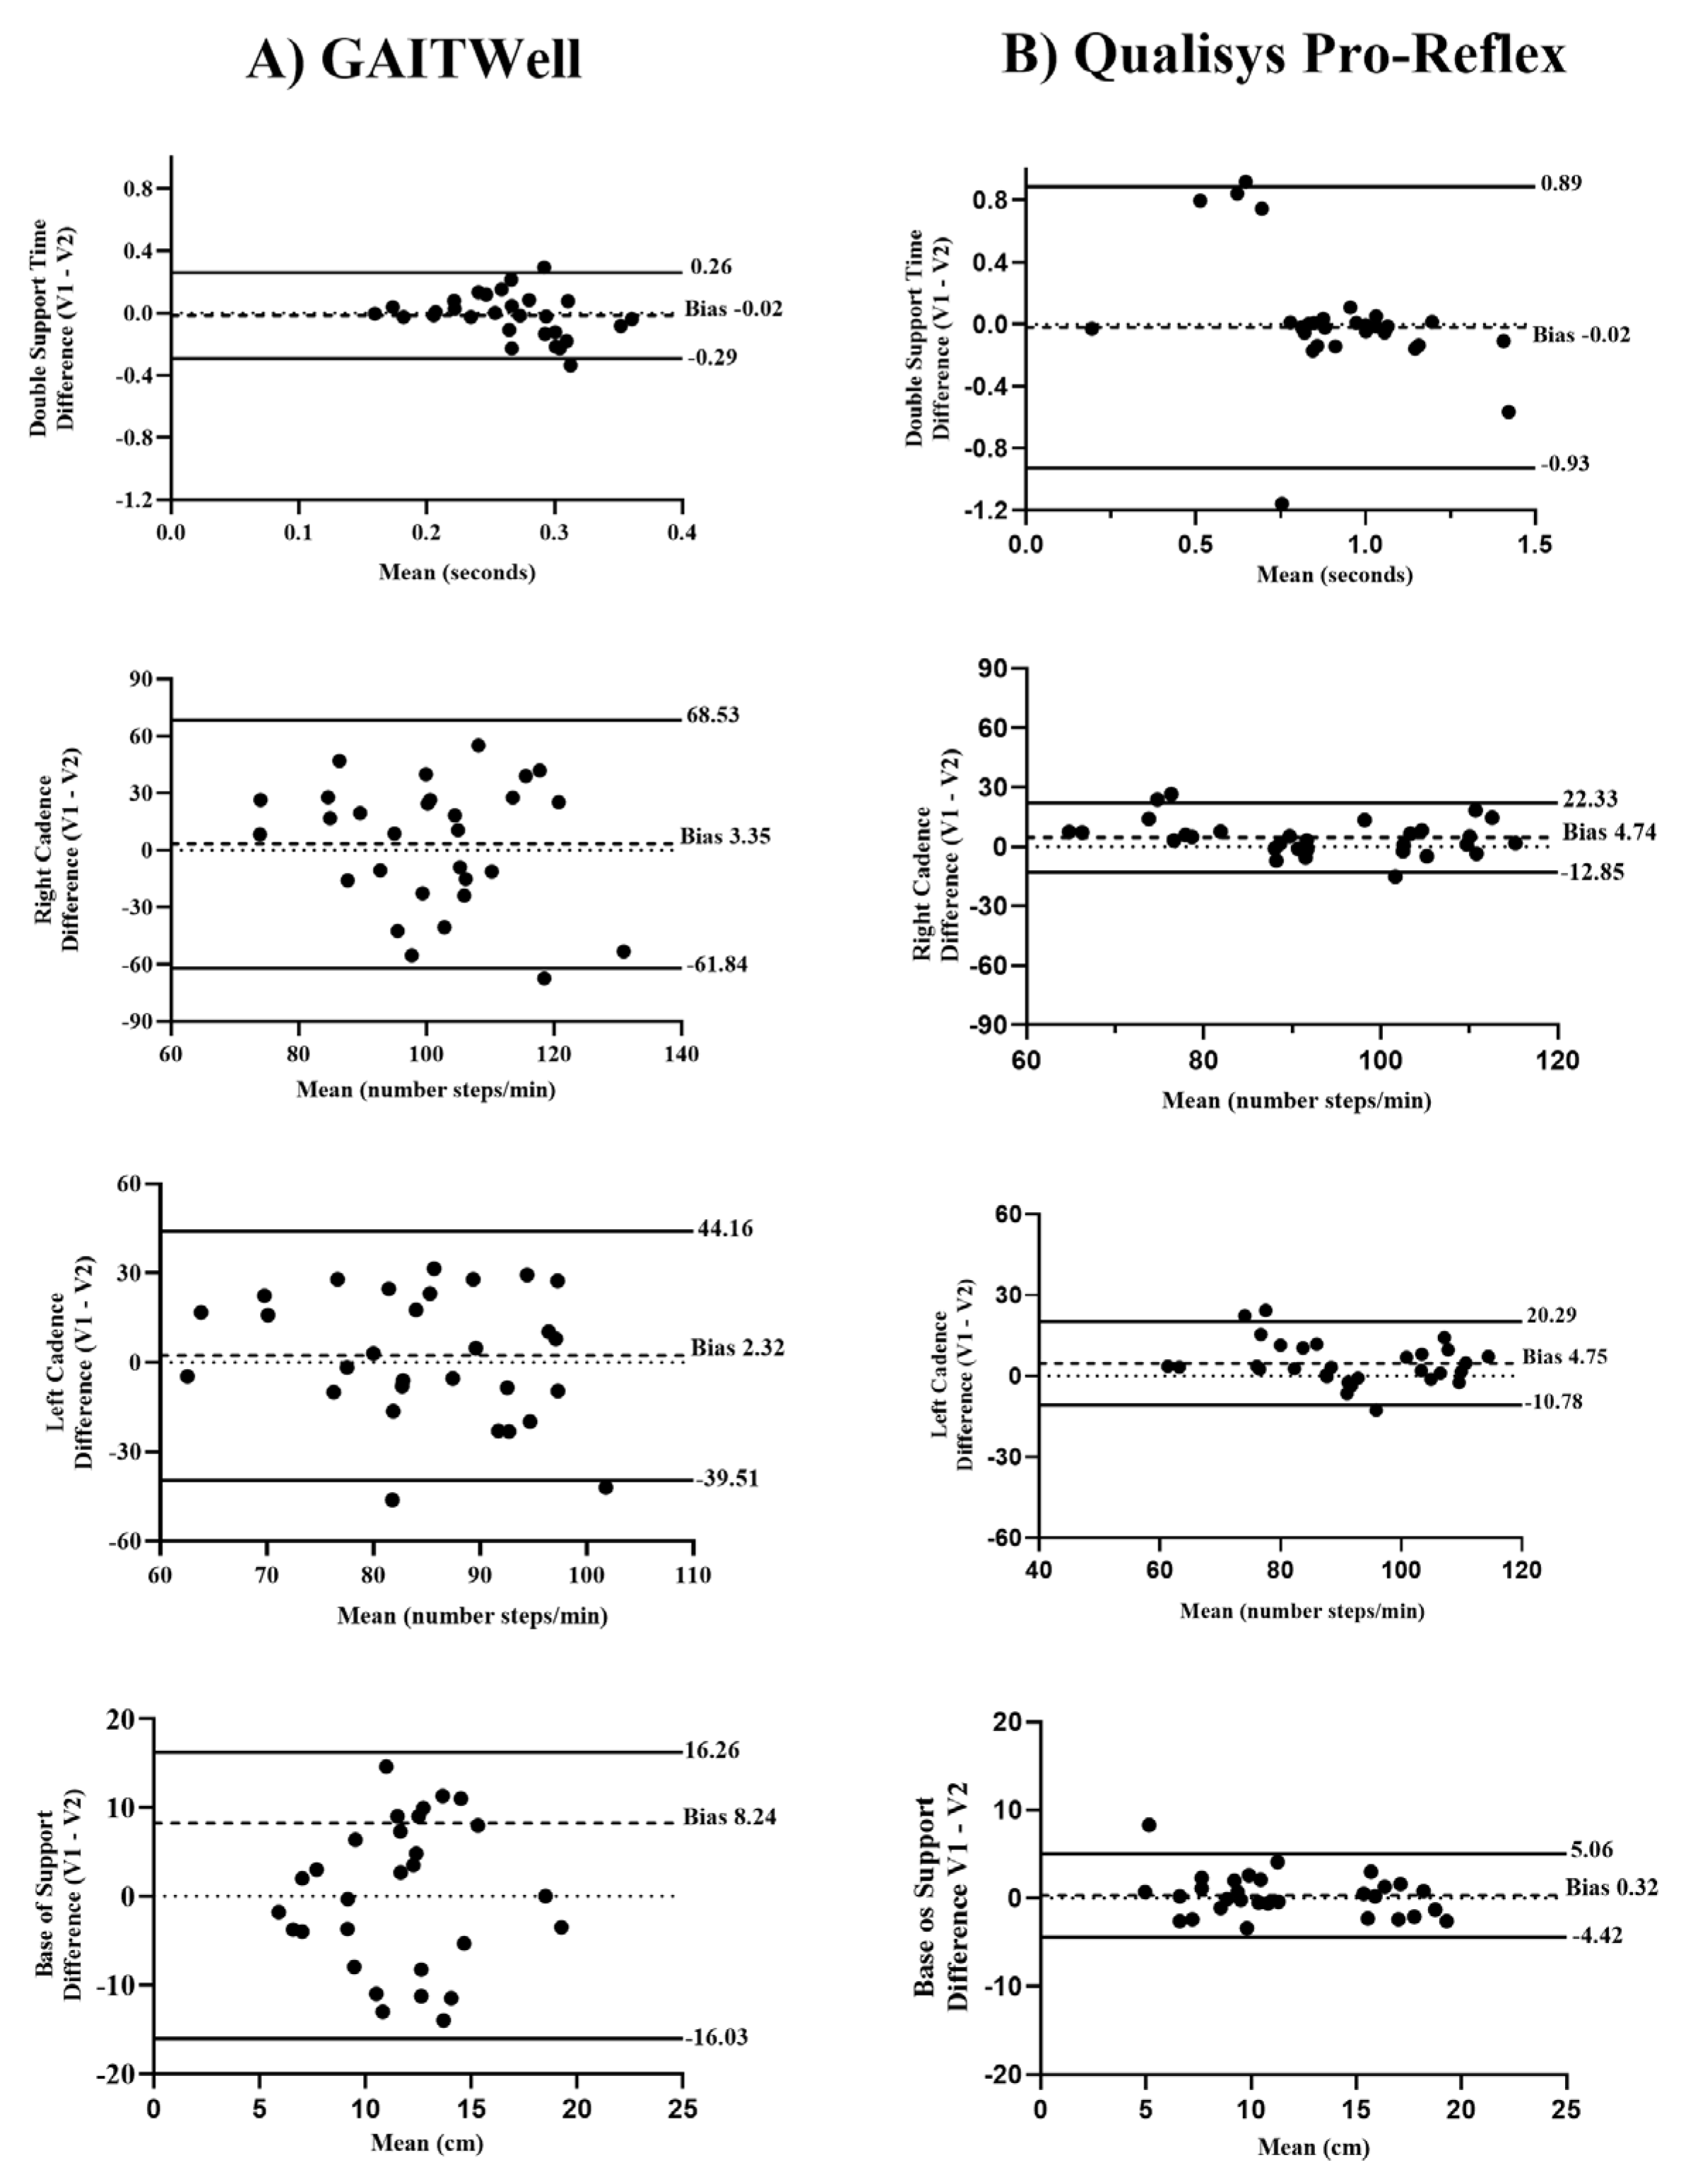
Figure 6.
(a) Sensor resolution of 4 cm x 4 cm and (b) Sensor resolution of 1.2 cm x 1.2 cm, showing contact points of the heel and toe positioned exactly in the middle between two sensors.
Figure 6.
(a) Sensor resolution of 4 cm x 4 cm and (b) Sensor resolution of 1.2 cm x 1.2 cm, showing contact points of the heel and toe positioned exactly in the middle between two sensors.
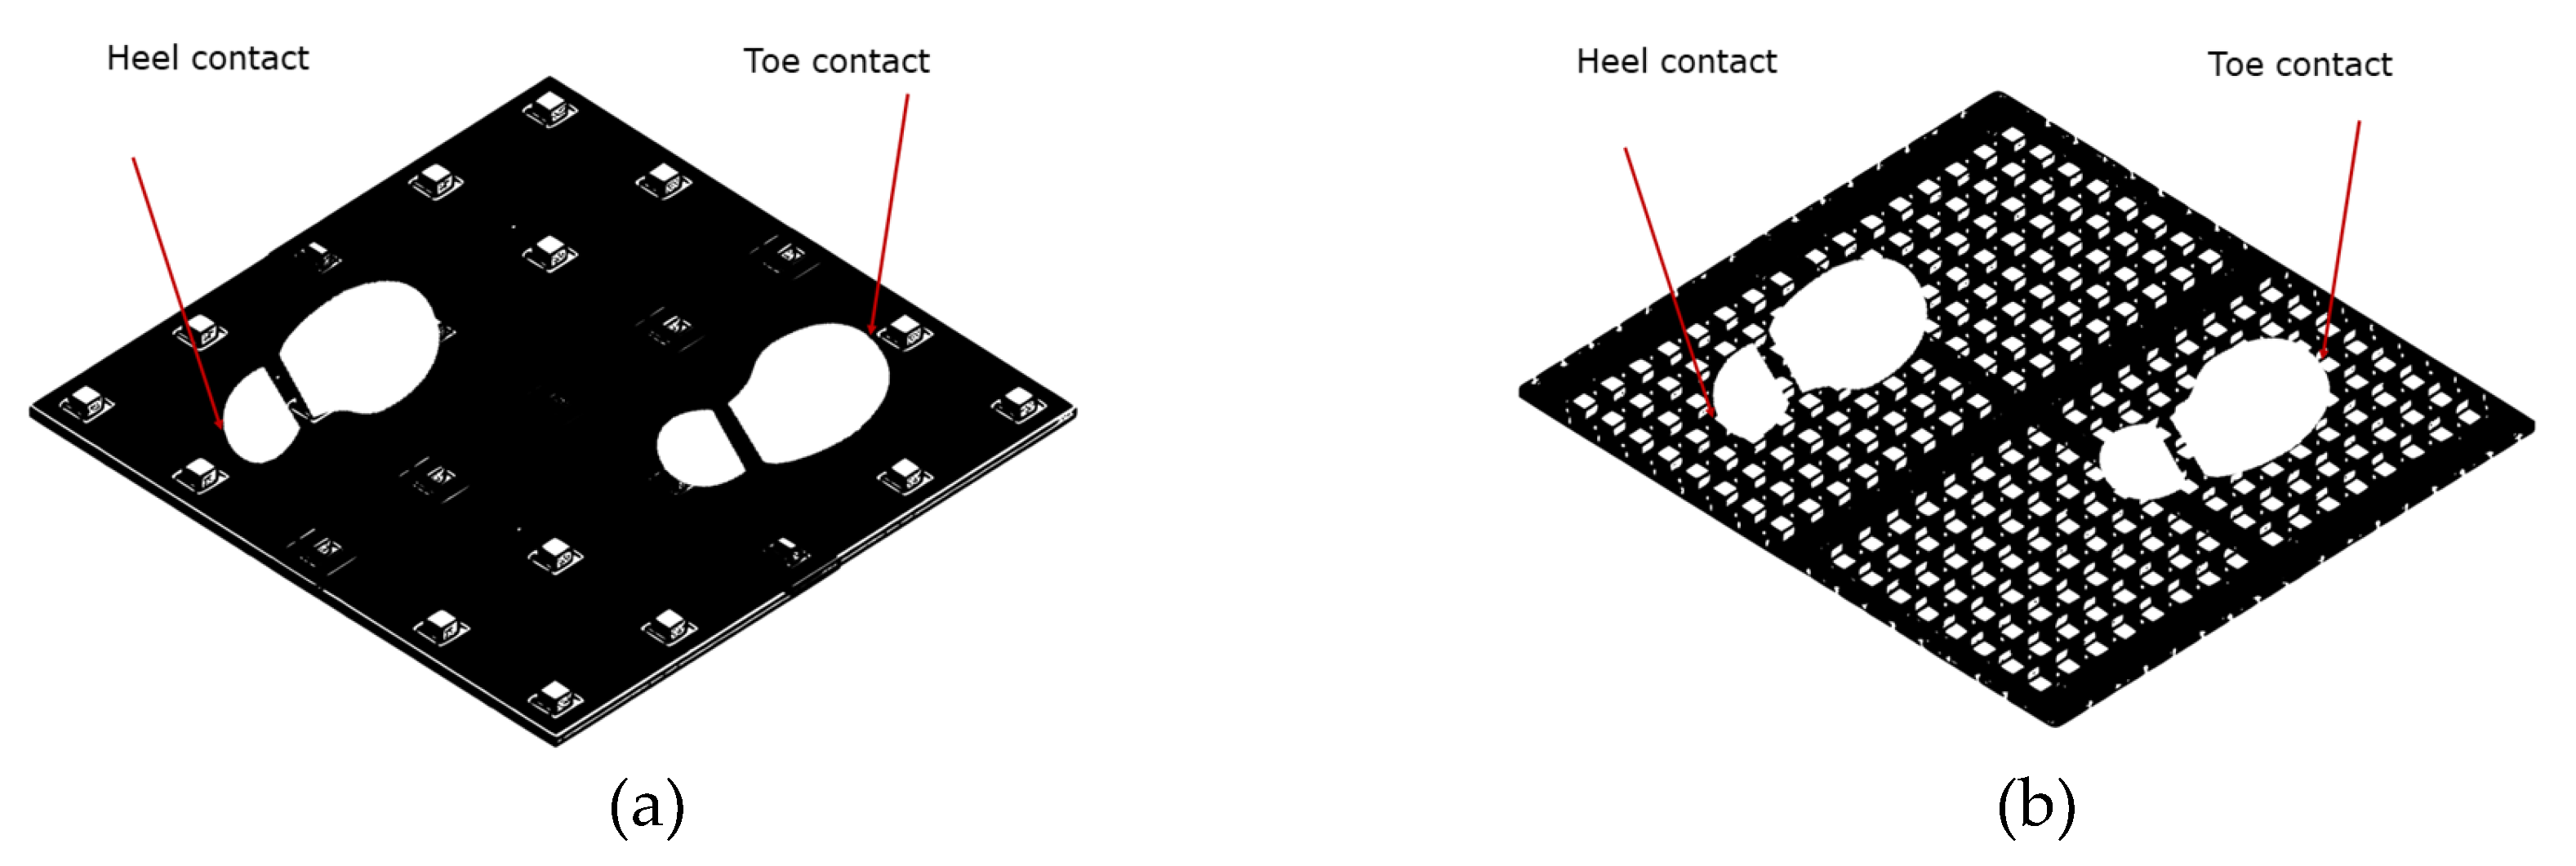
Figure 7.
Comparison of Sensor Resolutions: (a) 4 cm x 4 cm and (b) 1.2 cm x 1.2 cm. The chart illustrates sensor area and maximum measurement error, highlighting a 70% error reduction with increased resolution.
Figure 7.
Comparison of Sensor Resolutions: (a) 4 cm x 4 cm and (b) 1.2 cm x 1.2 cm. The chart illustrates sensor area and maximum measurement error, highlighting a 70% error reduction with increased resolution.
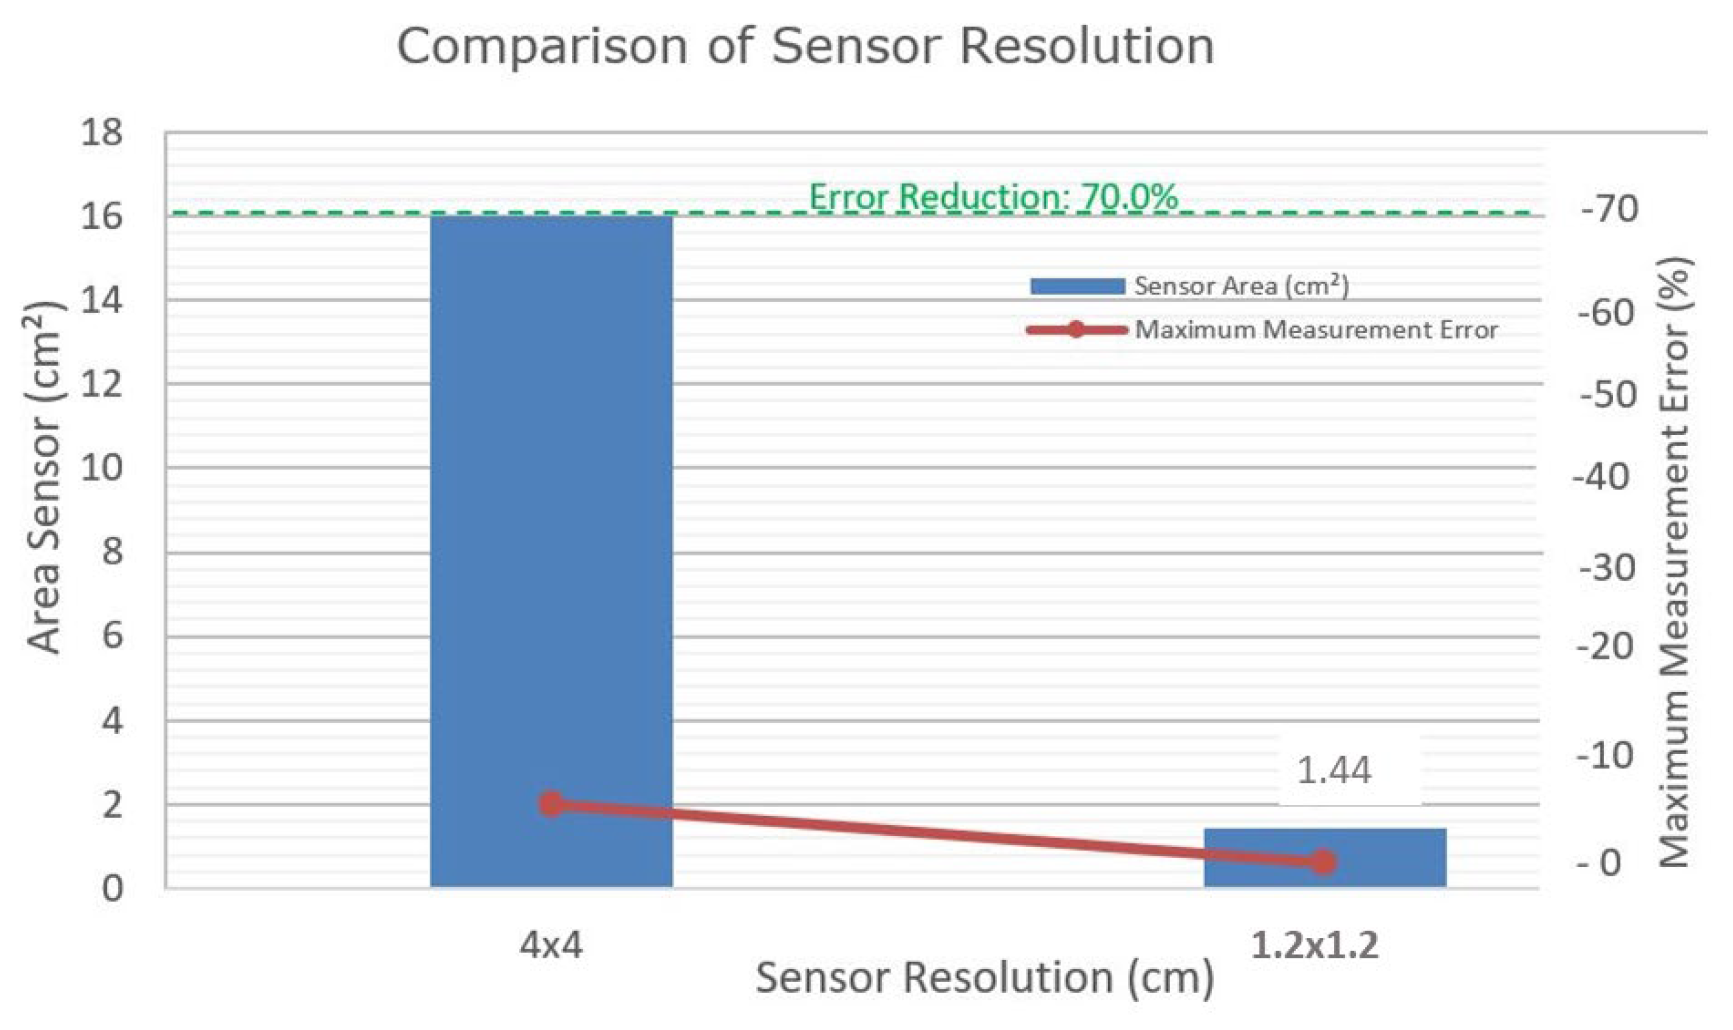

Table 1.
Mean, standard deviation, and correlation of gait variables between the GAITWell® and Qualisys systems during the first visit (n=38).
Table 1.
Mean, standard deviation, and correlation of gait variables between the GAITWell® and Qualisys systems during the first visit (n=38).
| Gait Variables | GAITWell N=38 Mean (SD) |
Qualisys N=38 Mean (SD) |
r |
|---|---|---|---|
| Gait Speed (m/s) | 0.89 (0.16) | 0.89 (0.15) | .9711 |
| Stride length (cm) | 112.9 (7.5) | 109.1 (16.0) | .3602 |
| Gait cycle time (s) | 1.30 (0.19) | 1.25 (0.21) | .7621 |
| Right step length (cm) | 56.1 (4.4) | 56.6 (3.9) | .6721 |
| Right step time (s) | 0.71 (0.11) | 0.63 (0.10) | .7961 |
| Left step length (cm) | 56.8 (3.9) | 56.7 (3.9) | .8031 |
| Left step time (s) | 0.59 (0.11) | 0.65 (0.10) | .8291 |
| Stance time (s) | 0.77 (0.11) | 0.81 (0.13) | .9801 |
| Swing time (s) | 0.53 (0.08) | 0.48 (0.06) | .8761 |
| Right cadence (steps/min) | 104.9 (18.1) | 96.1 (13.7) | .8261 |
| Left cadence (steps/min) | 87.2 (12.8) | 94.6 (13.9) | .8081 |
| Base of support (cm) | 11.4 (5.0) | 11.8 (4.0) | .9141 |
| m: meters, s: seconds; steps/min: steps per minute; r correlation coefficient; 1 <.001, 2 <.05 | |||
Table 2.
Test-retest reliability of the GAITWell® system (N=29).
| Gait Variables | Visit 1 Mean (SD) |
Visit 2 Mean (SD) |
Visit 1 vs. Visit 2 | SEM | |
| ICC2,1 (95% CI) |
P-value | ||||
| Gait Speed (m/s) | 0.88 (0.15) | 0.83 (0.16) | .864 (.675-.940) | .001 | .022 |
| Stride length (cm) | 113.3 (6.9) | 111.6 (7.3) | .818 (.616-.914) | .001 | .013 |
| Gait cycle time (s) | 1.31 (0.20) | 1.39 (0.27) | .847 (.645-.931) | .001 | .037 |
| Right step length (cm) | 56.6 (4.2) | 56.2 (3.9) | .650 (.250-.836) | .004 | .014 |
| Right step time (s) | 0.71 (0.12) | 0.75 (0.15) | .821 (.614-.916) | .001 | .024 |
| Left step length (cm) | 56.7 (3.5) | 55.4 (4.0) | .764 (.494-.889) | .001 | .009 |
| Left step time (s) | 0.60 (0.11) | 0.64 (0.15) | .691 (.357-.853) | .001 | .041 |
| Stance time (s) | 0.77 (0.13) | 0.81 (0.19) | .837 (.648-.924) | .001 | .026 |
| Swing time (s) | 0.54 (0.08) | 0.58 (0.10) | .767 (.490-.892) | .001 | .022 |
| Double-support time (s) | 0.26 (0.07) | 0.27 (0.10) | -.344 (-.644-.032) | .965 | .115 |
| Right cadence (steps/min) | 102.6 (19.2) | 99.3 (23.4) | -.528 (-2.41-.298) | .859 | 32.58 |
| Left cadence (steps/min) | 86.1 (13.1) | 83.8 (16.3) | -.091 (-1.39-.495) | .588 | 16.03 |
| Base of support (cm) | 11.7 (5.4) | 11.6 (5.1) | -.639 (-2.74-.253) | .891 | 8.53 |
Disclaimer/Publisher’s Note: The statements, opinions and data contained in all publications are solely those of the individual author(s) and contributor(s) and not of MDPI and/or the editor(s). MDPI and/or the editor(s) disclaim responsibility for any injury to people or property resulting from any ideas, methods, instructions or products referred to in the content. |
© 2024 by the authors. Licensee MDPI, Basel, Switzerland. This article is an open access article distributed under the terms and conditions of the Creative Commons Attribution (CC BY) license (http://creativecommons.org/licenses/by/4.0/).
Copyright: This open access article is published under a Creative Commons CC BY 4.0 license, which permit the free download, distribution, and reuse, provided that the author and preprint are cited in any reuse.


