Submitted:
19 June 2024
Posted:
20 June 2024
You are already at the latest version
Abstract
Keywords:
1. Introduction
| Sieving at 0.5 mm | Sieving at 64 µm and grinding |
|---|---|
| A | AP |
| B | BP |
2. Materials and Methods
2.1. Pine Wood Biochar Production
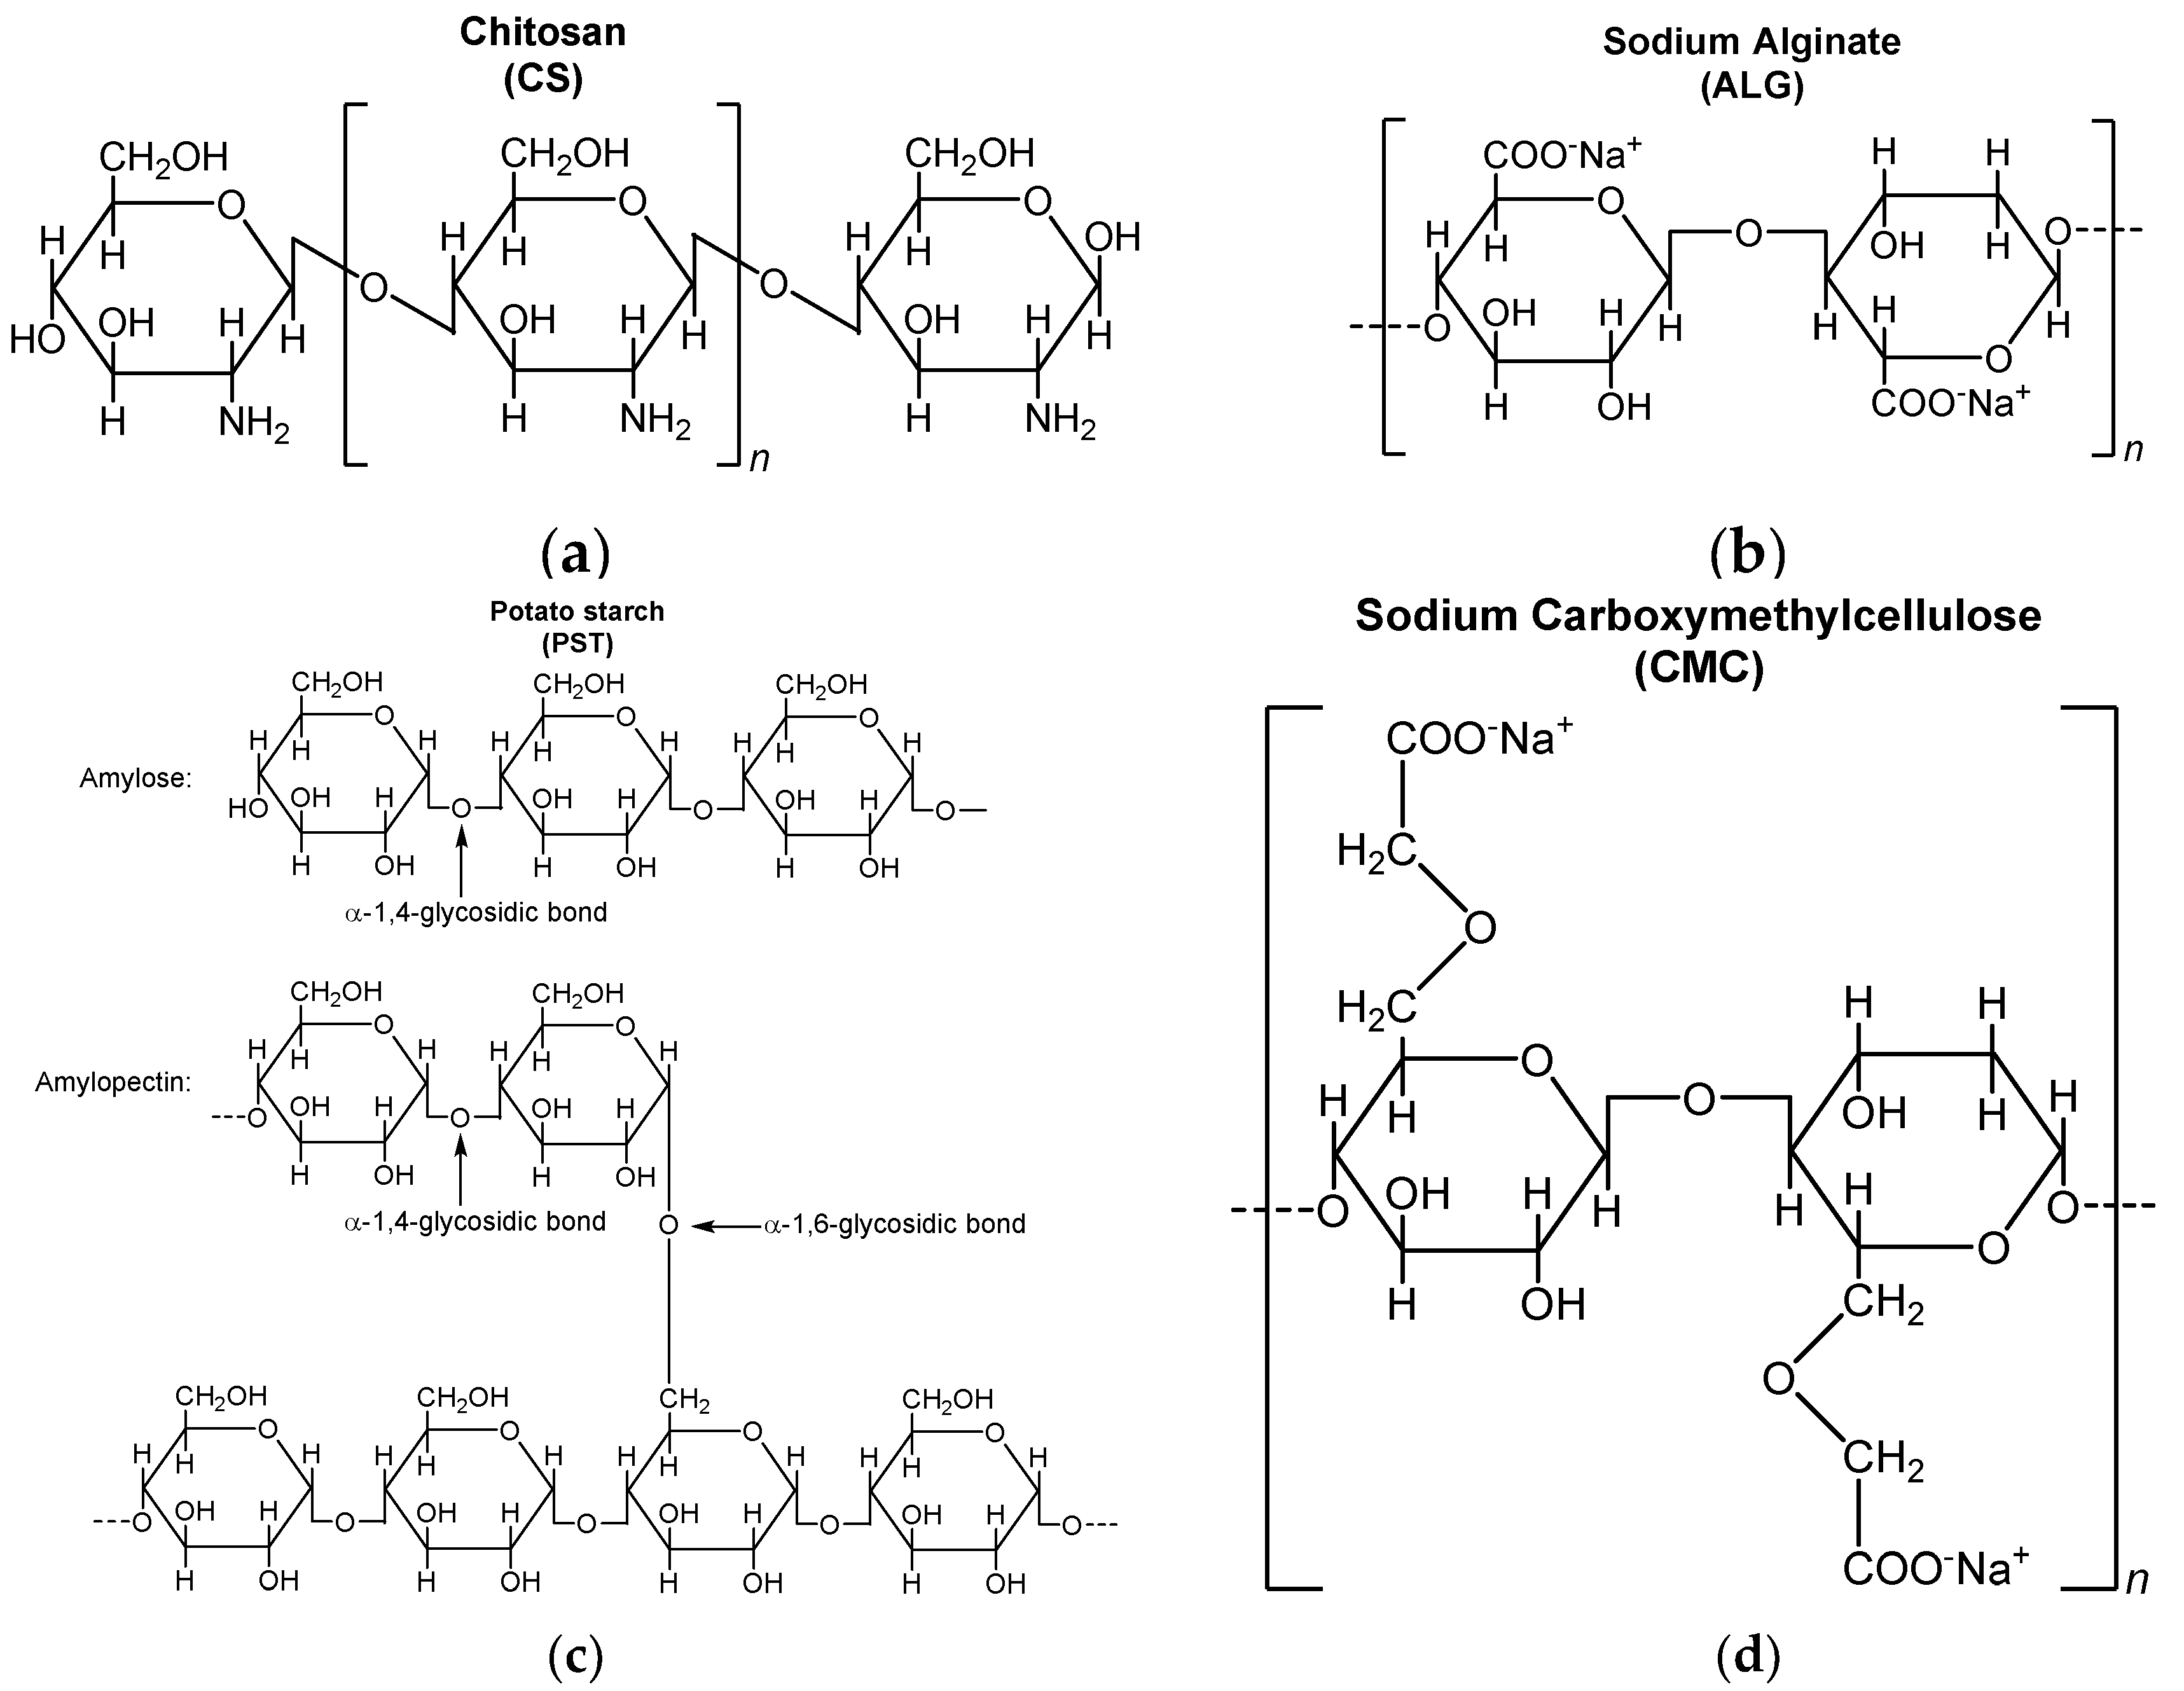
2.2. Preparation of BC@biopolymer Composites
2.3. Sedimentation Tests
2.4. Adsorption Isotherms
2.5. Continuous Flow Column Distribution Tests
2.6. Characterization Techniques and Analytical Methods
3. Results and Discussion
3.1. Raw Pine Wood Biochar Characterization
3.1.1. Fourier Transform Infrared Spectroscopy (FTIR) and Morphological Analysis
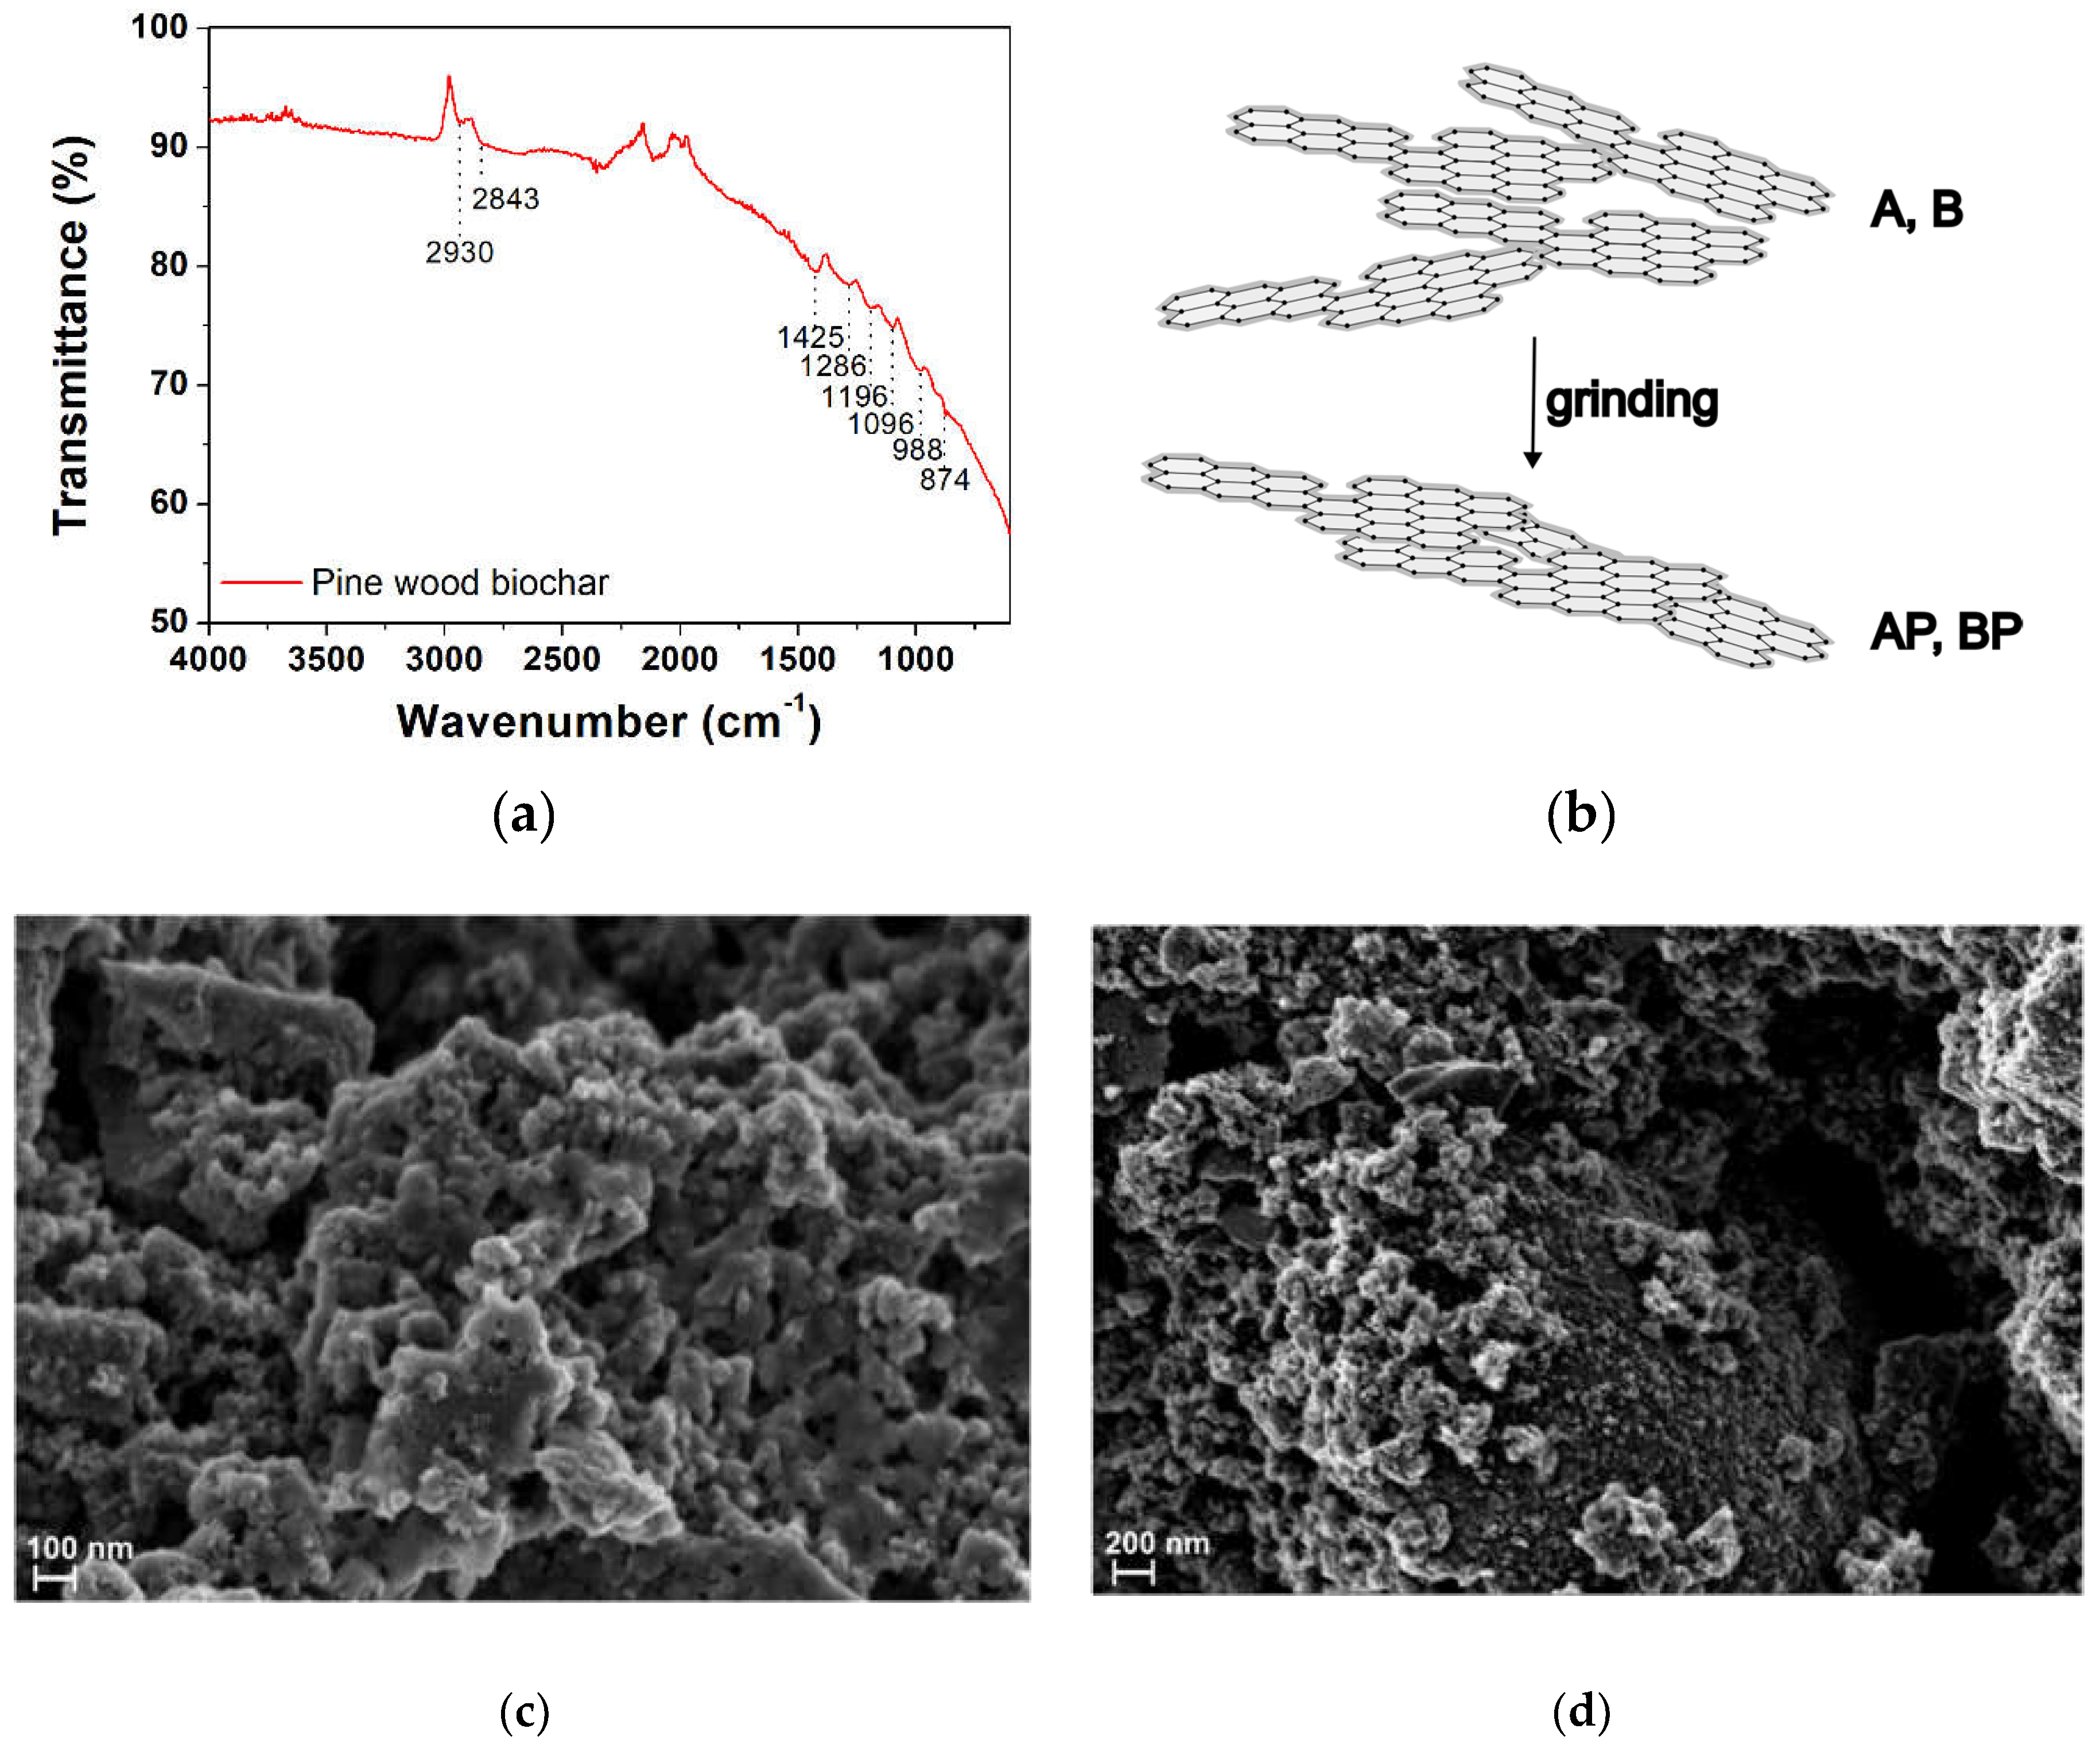
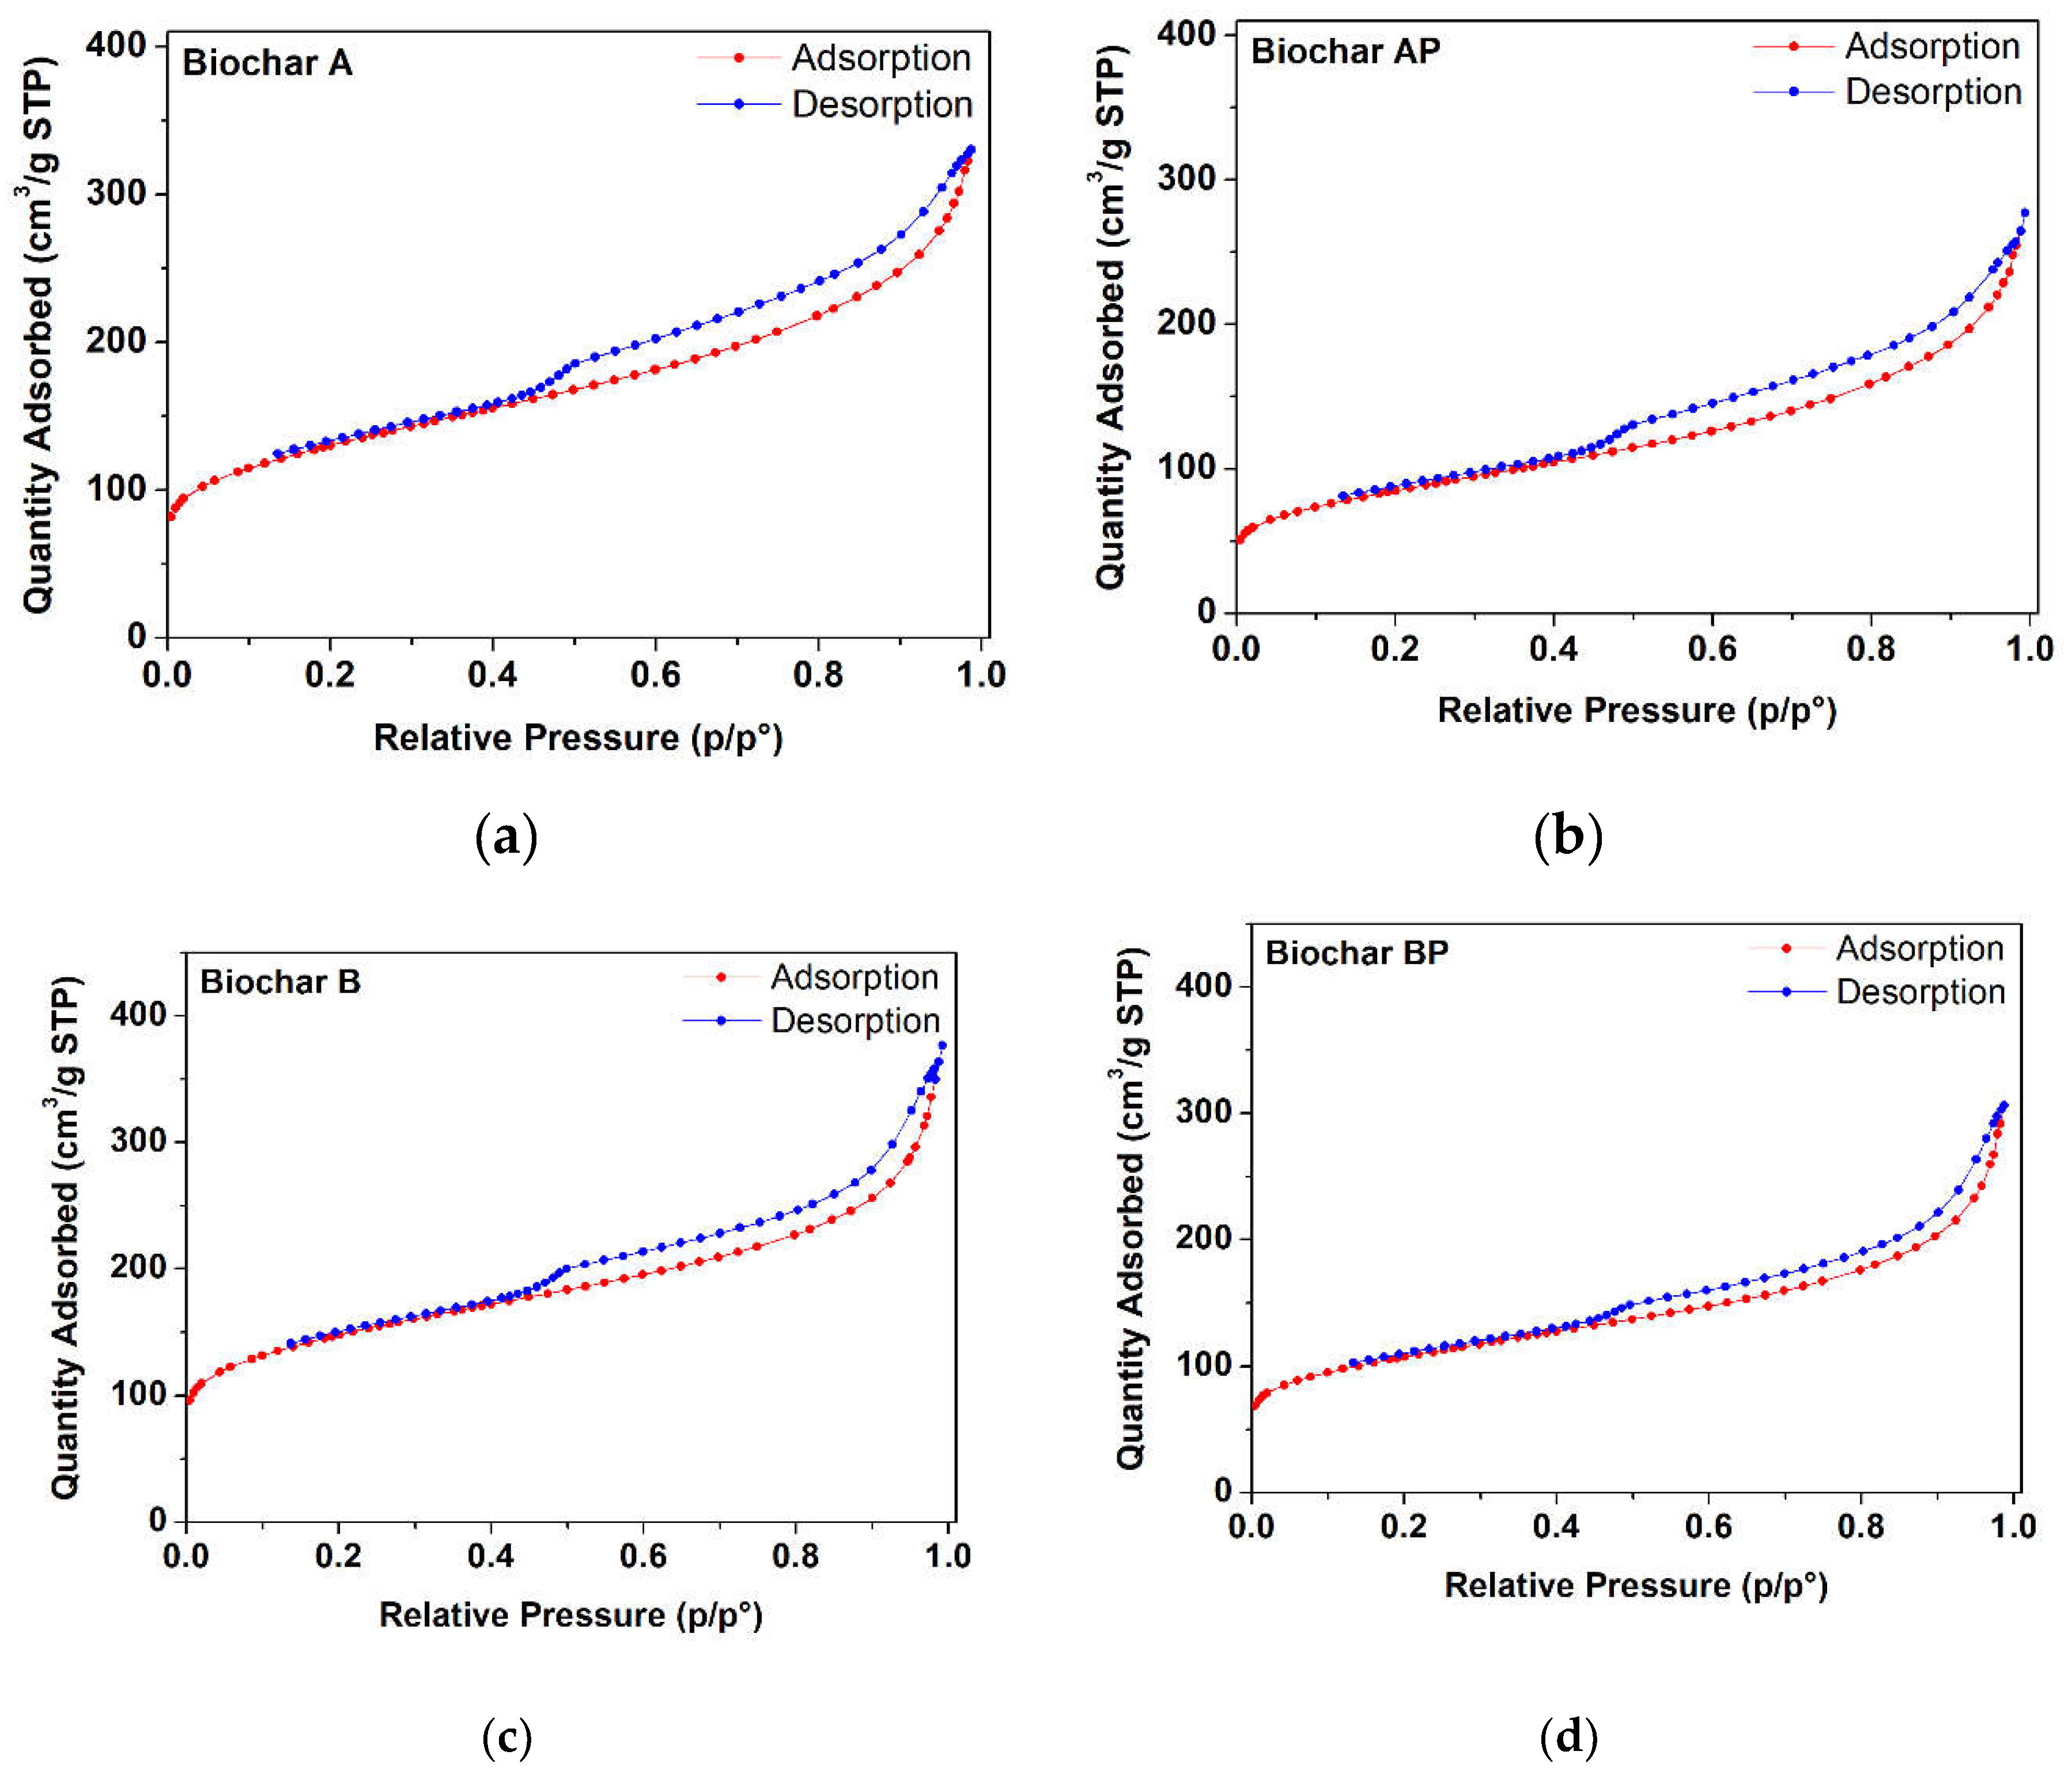
3.1.2. Brunauer–Emmett–Teller (BET) Surface Area and TEXTURAL PARAmeters
| BC sample * | Weight loss (%) | BET Specific surface area (m2·g−1) | Total pore Volume (cm3·g−1) | Micro-pore volume (cm3·g−1) |
|---|---|---|---|---|
| A | 6.59% | 457 ± 5 | 0.511 | 0.098 |
| AP | 3.31% | 293 ± 5 | 0.421 | 0.046 |
| B | 12.97% | 523 ± 5 | 0.578 | 0.140 |
| BP | 3.37% | 378 ± 5 | 0.474 | 0.087 |
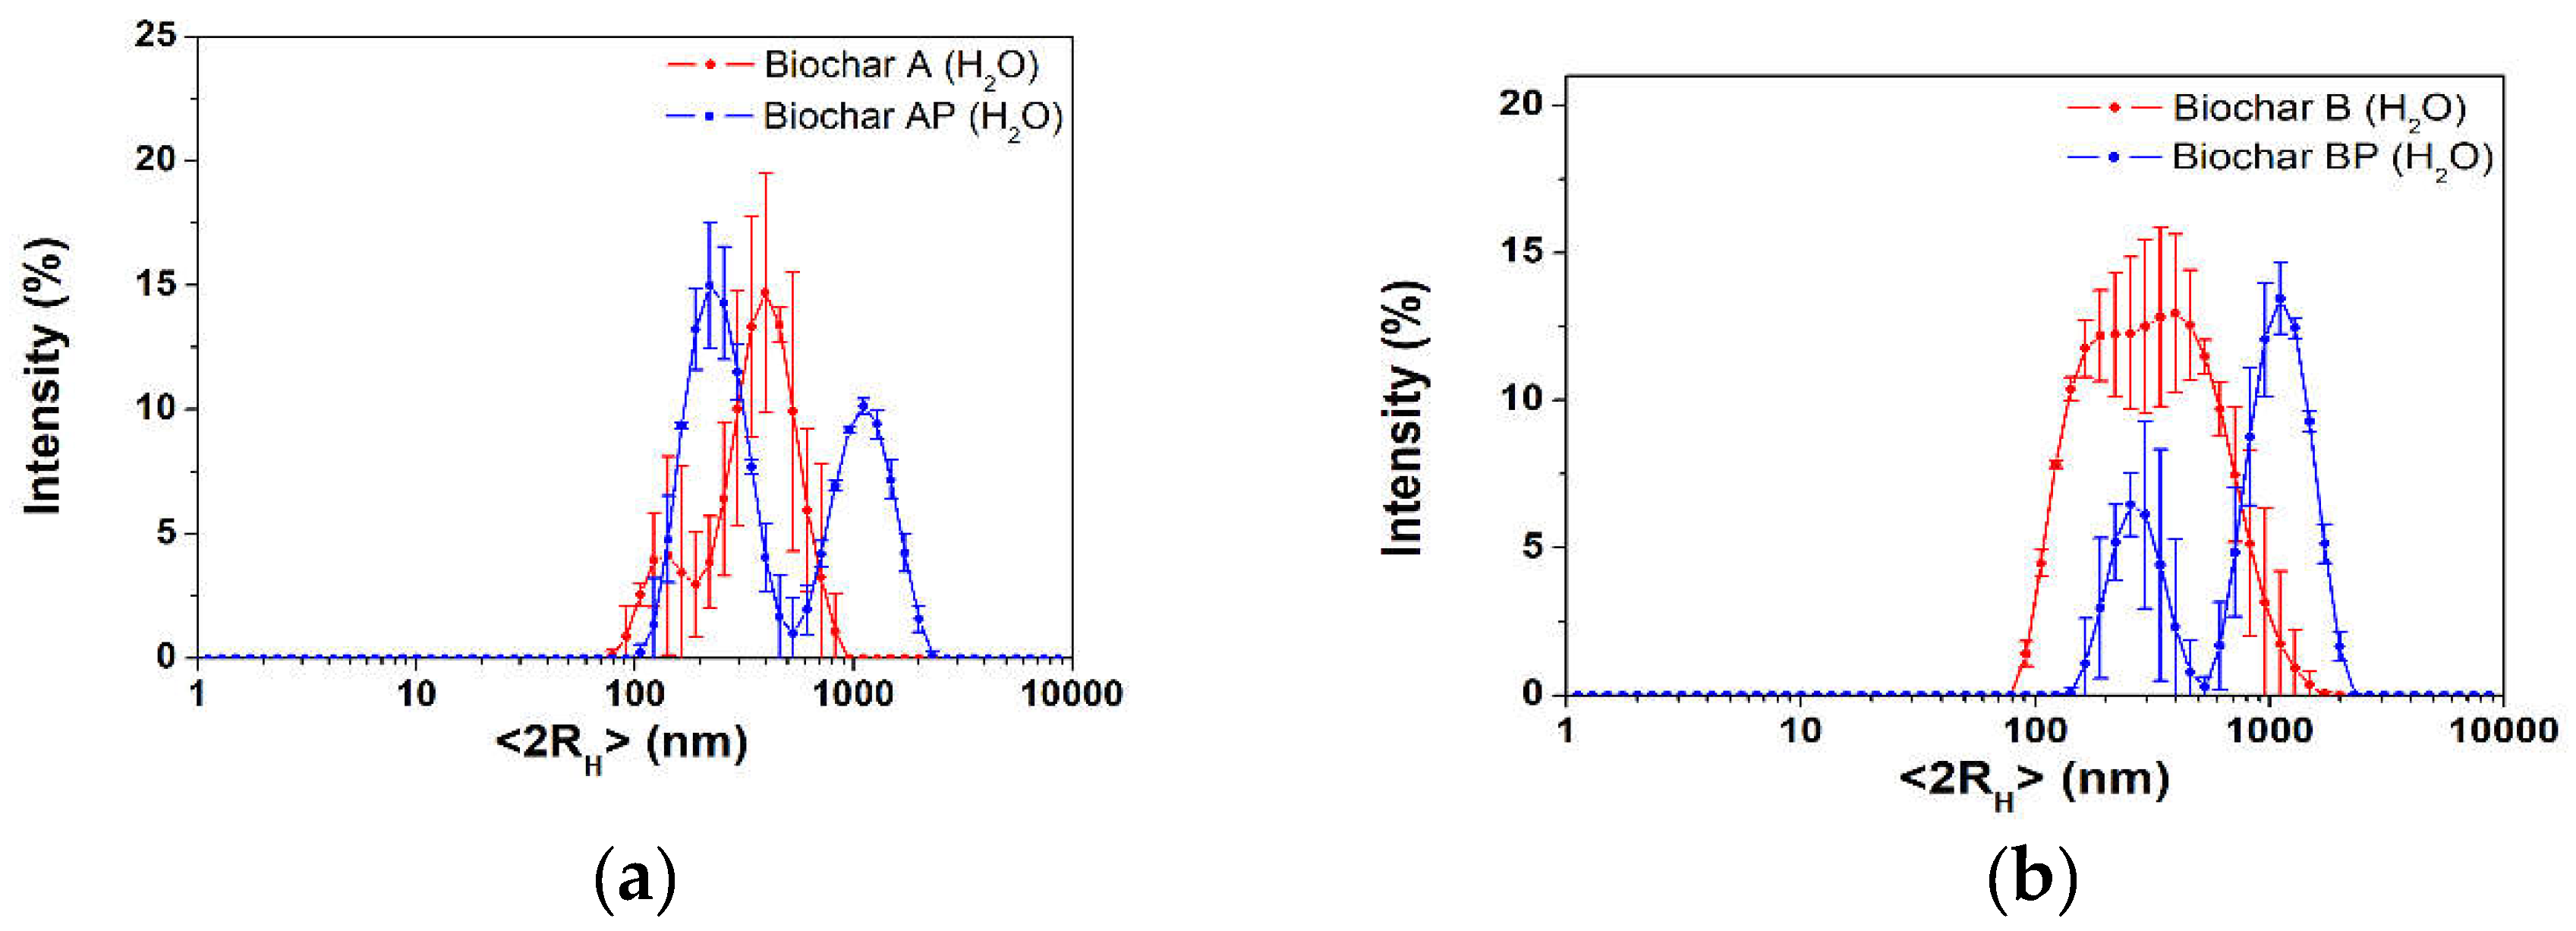
3.1.3. Hydrodynamic Particle Size Distribution
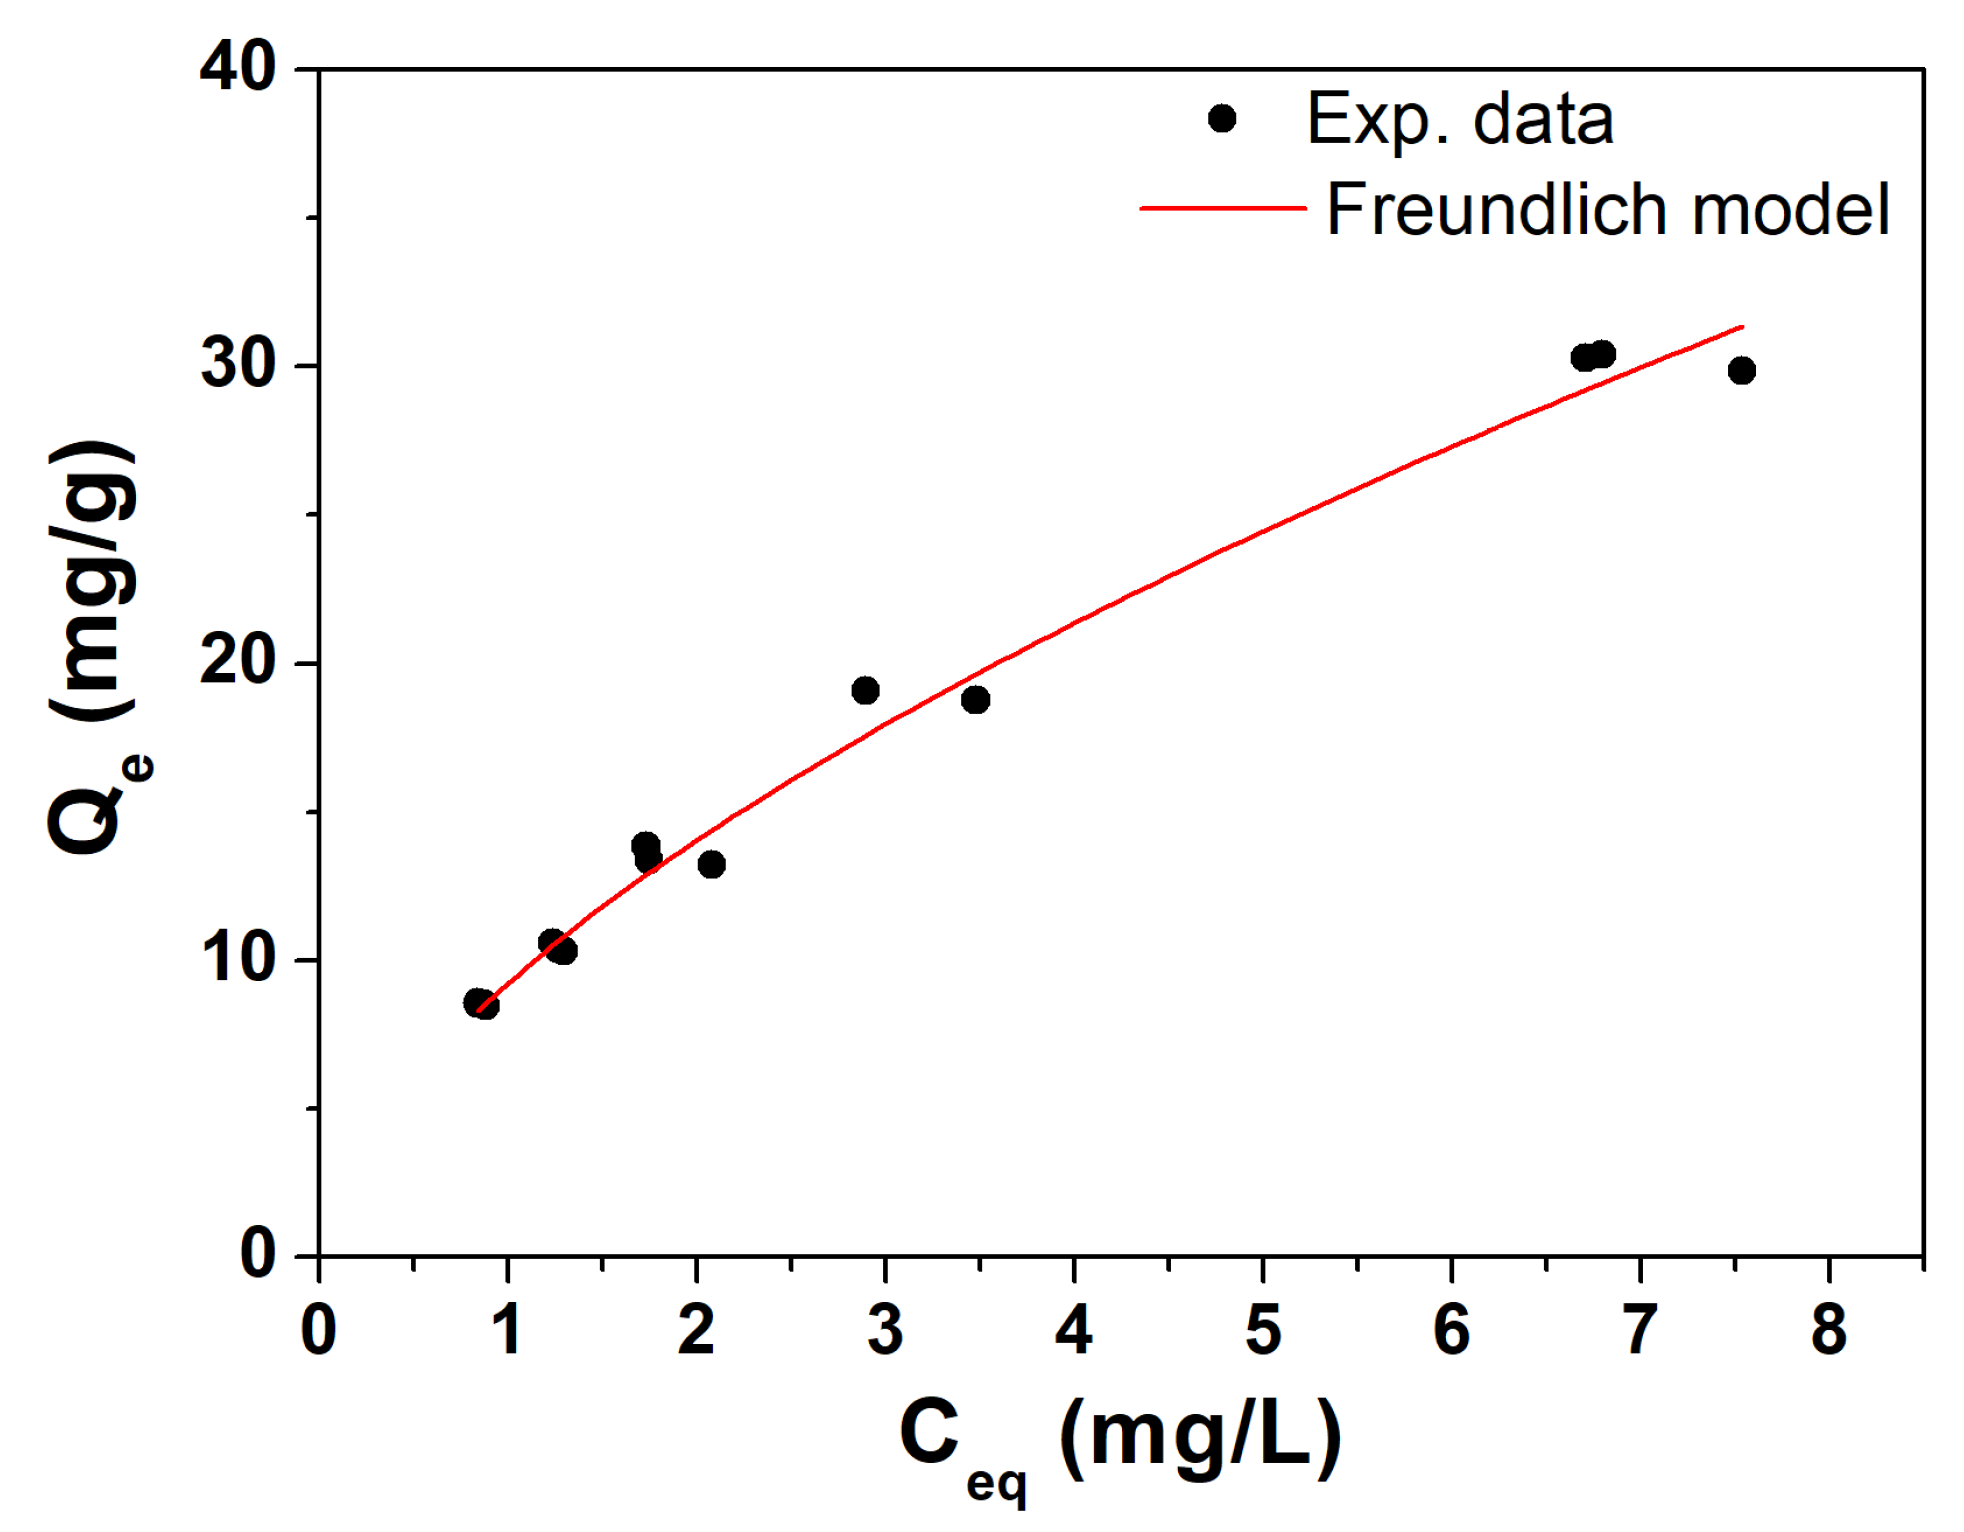
3.2. Adsorption Isotherm Curve of Trichloroethylene (TCE) of Raw Biochar
3.3. BC@biopolymer Composites Characterization
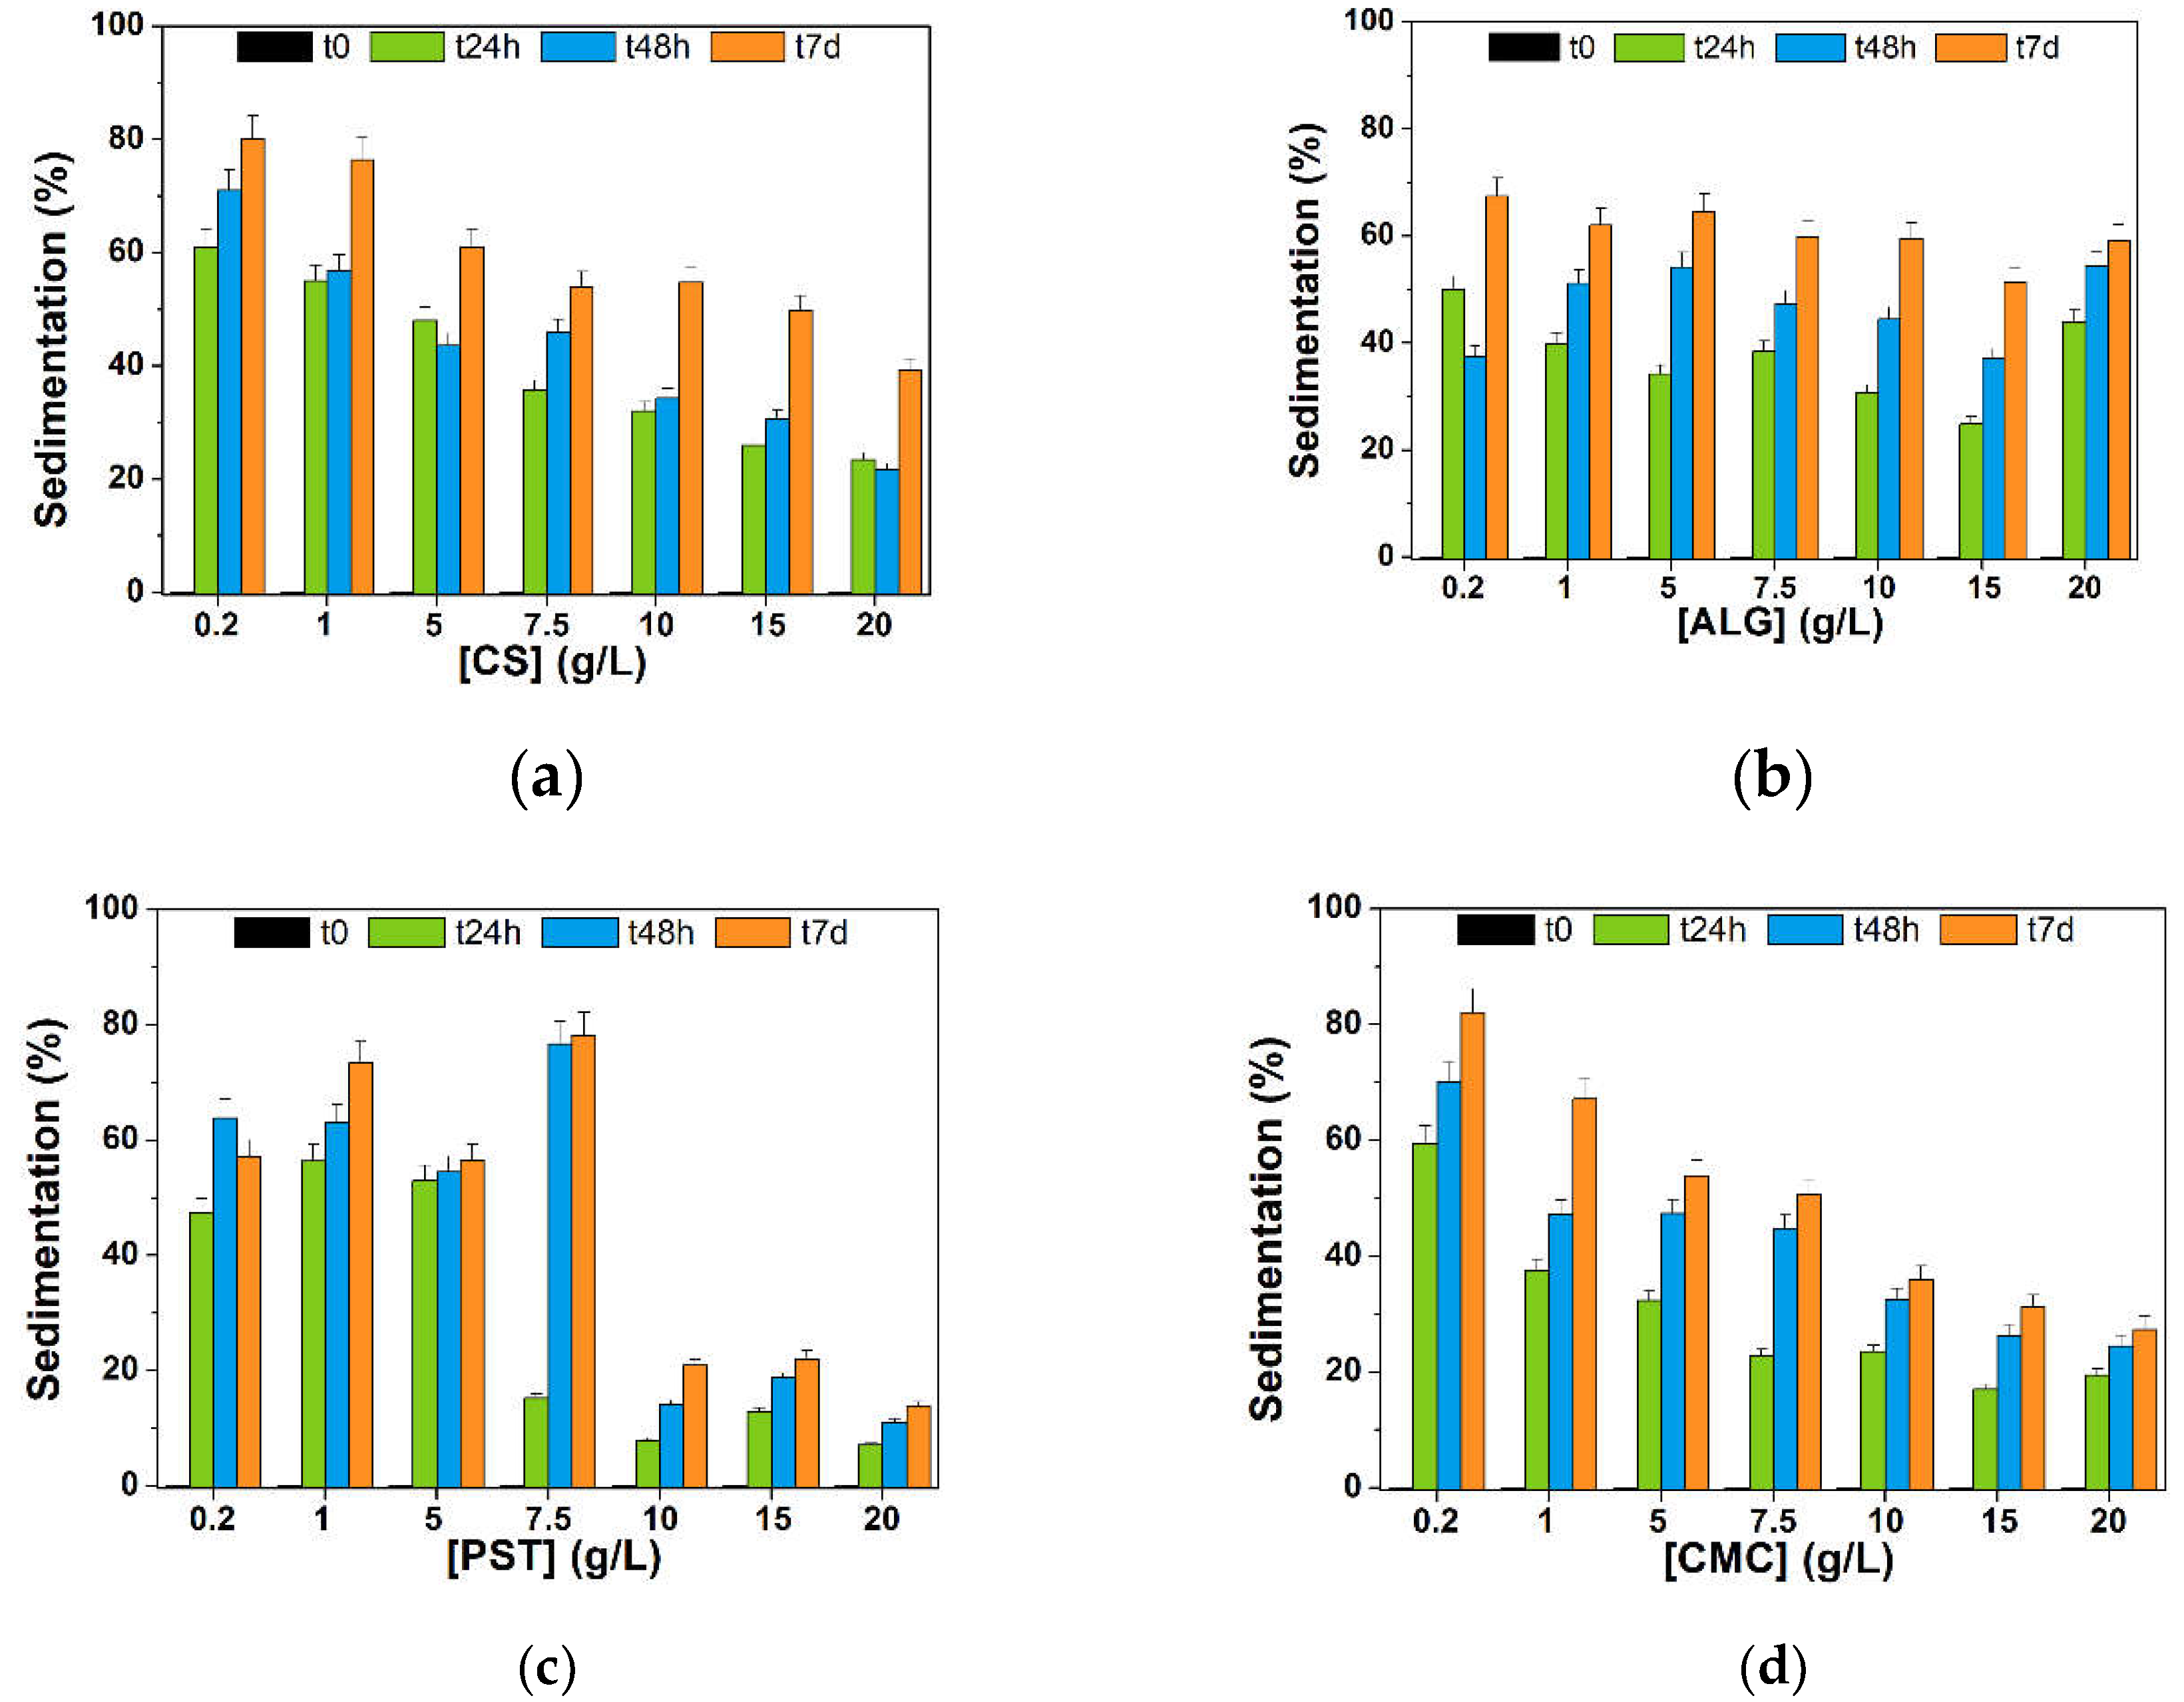
3.3.1. Sedimentation Tests
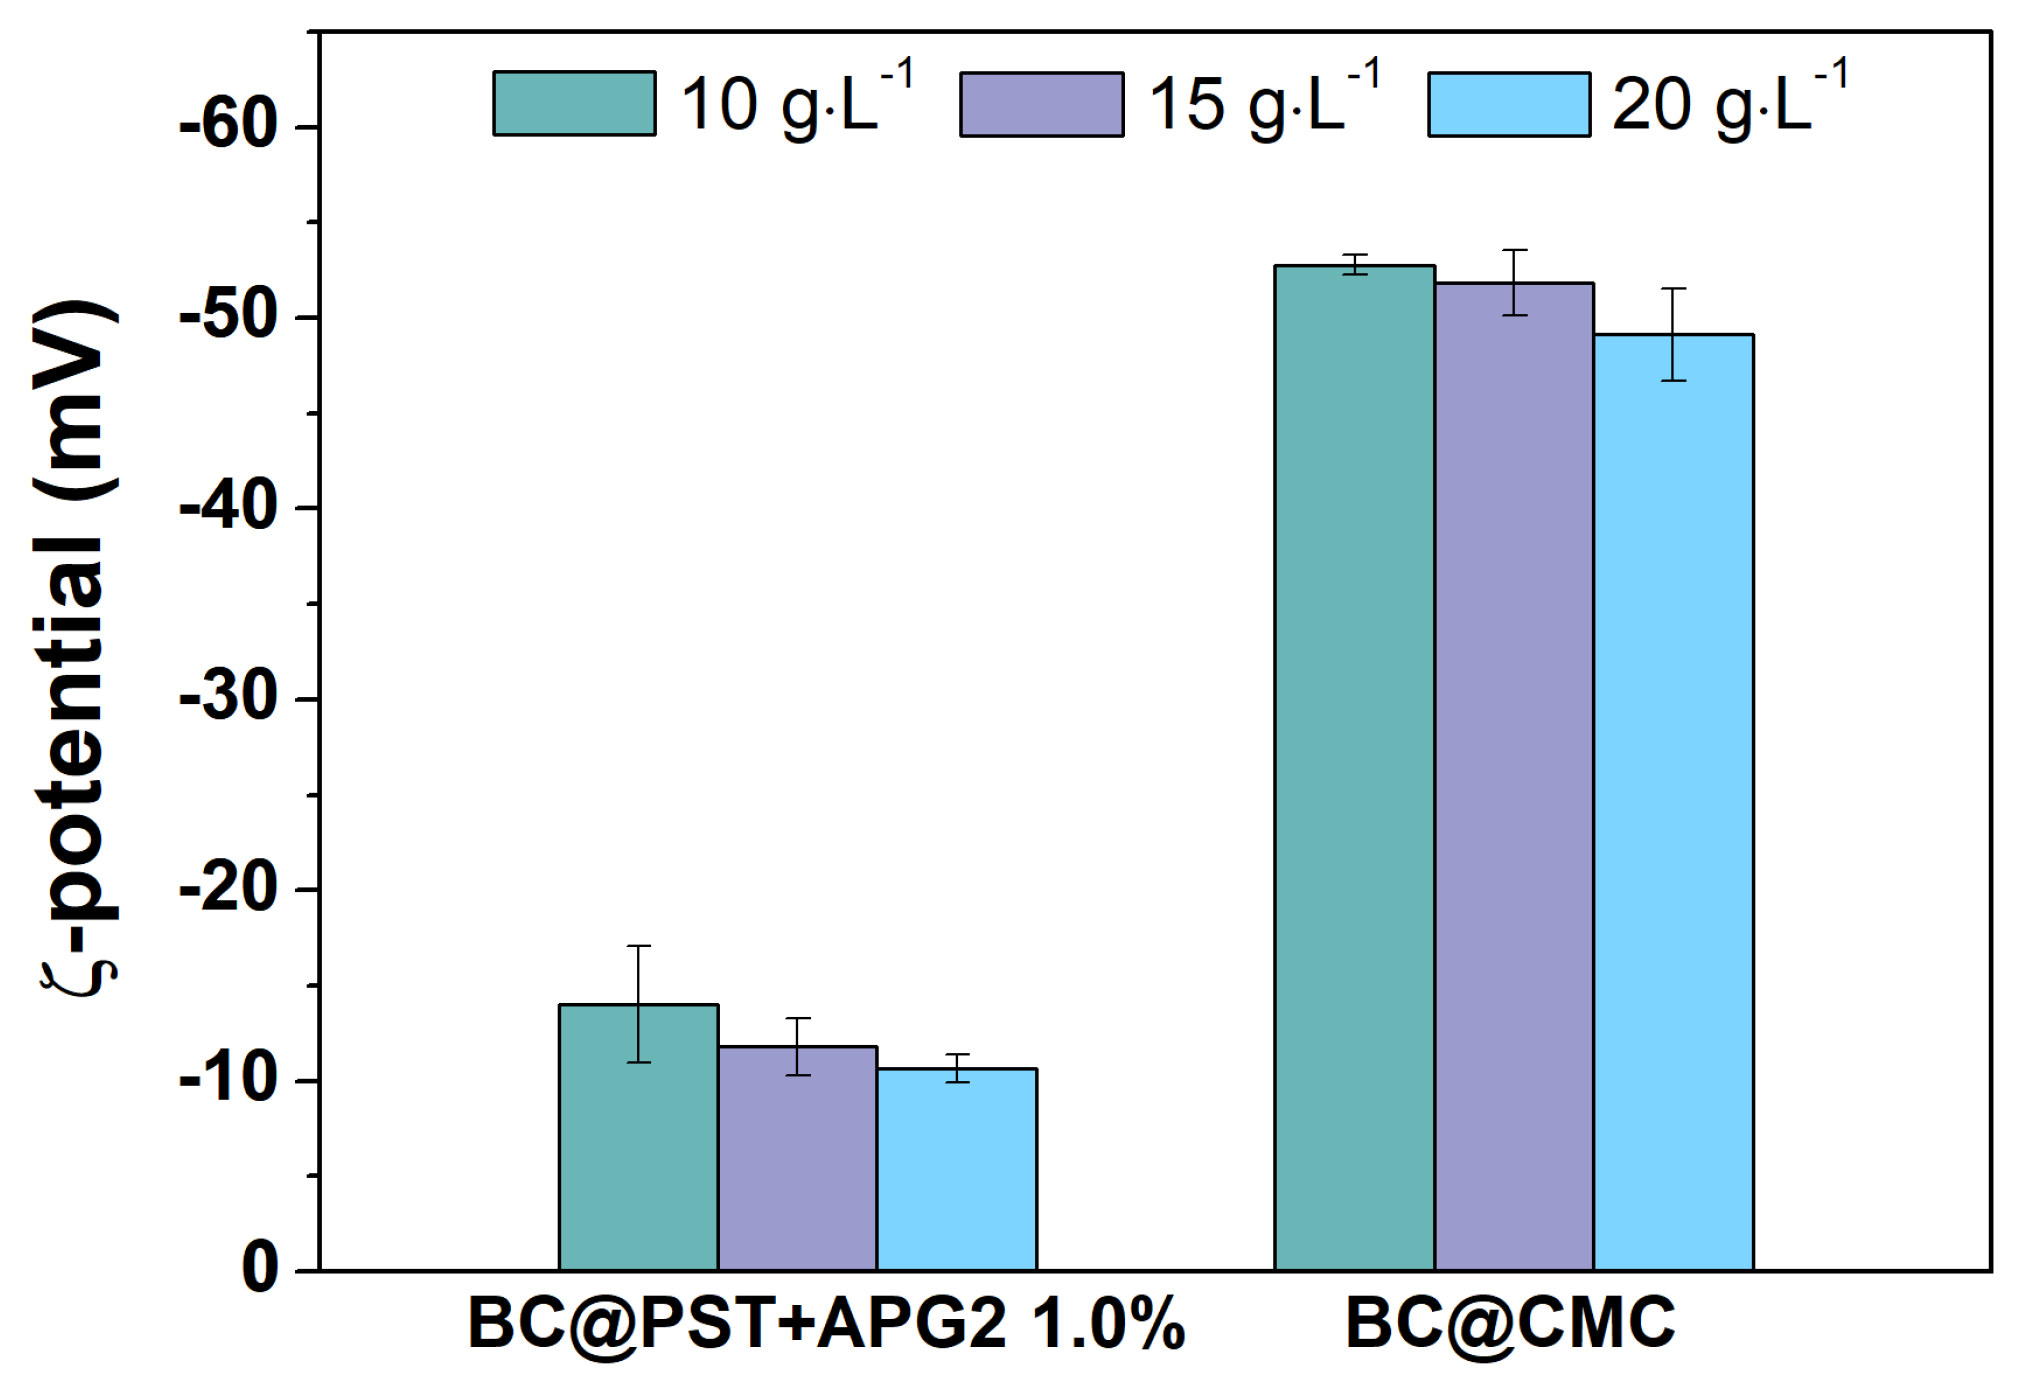
3.3.2. Hydrodynamic Parameters of BC@PST and BC@CMC Composites
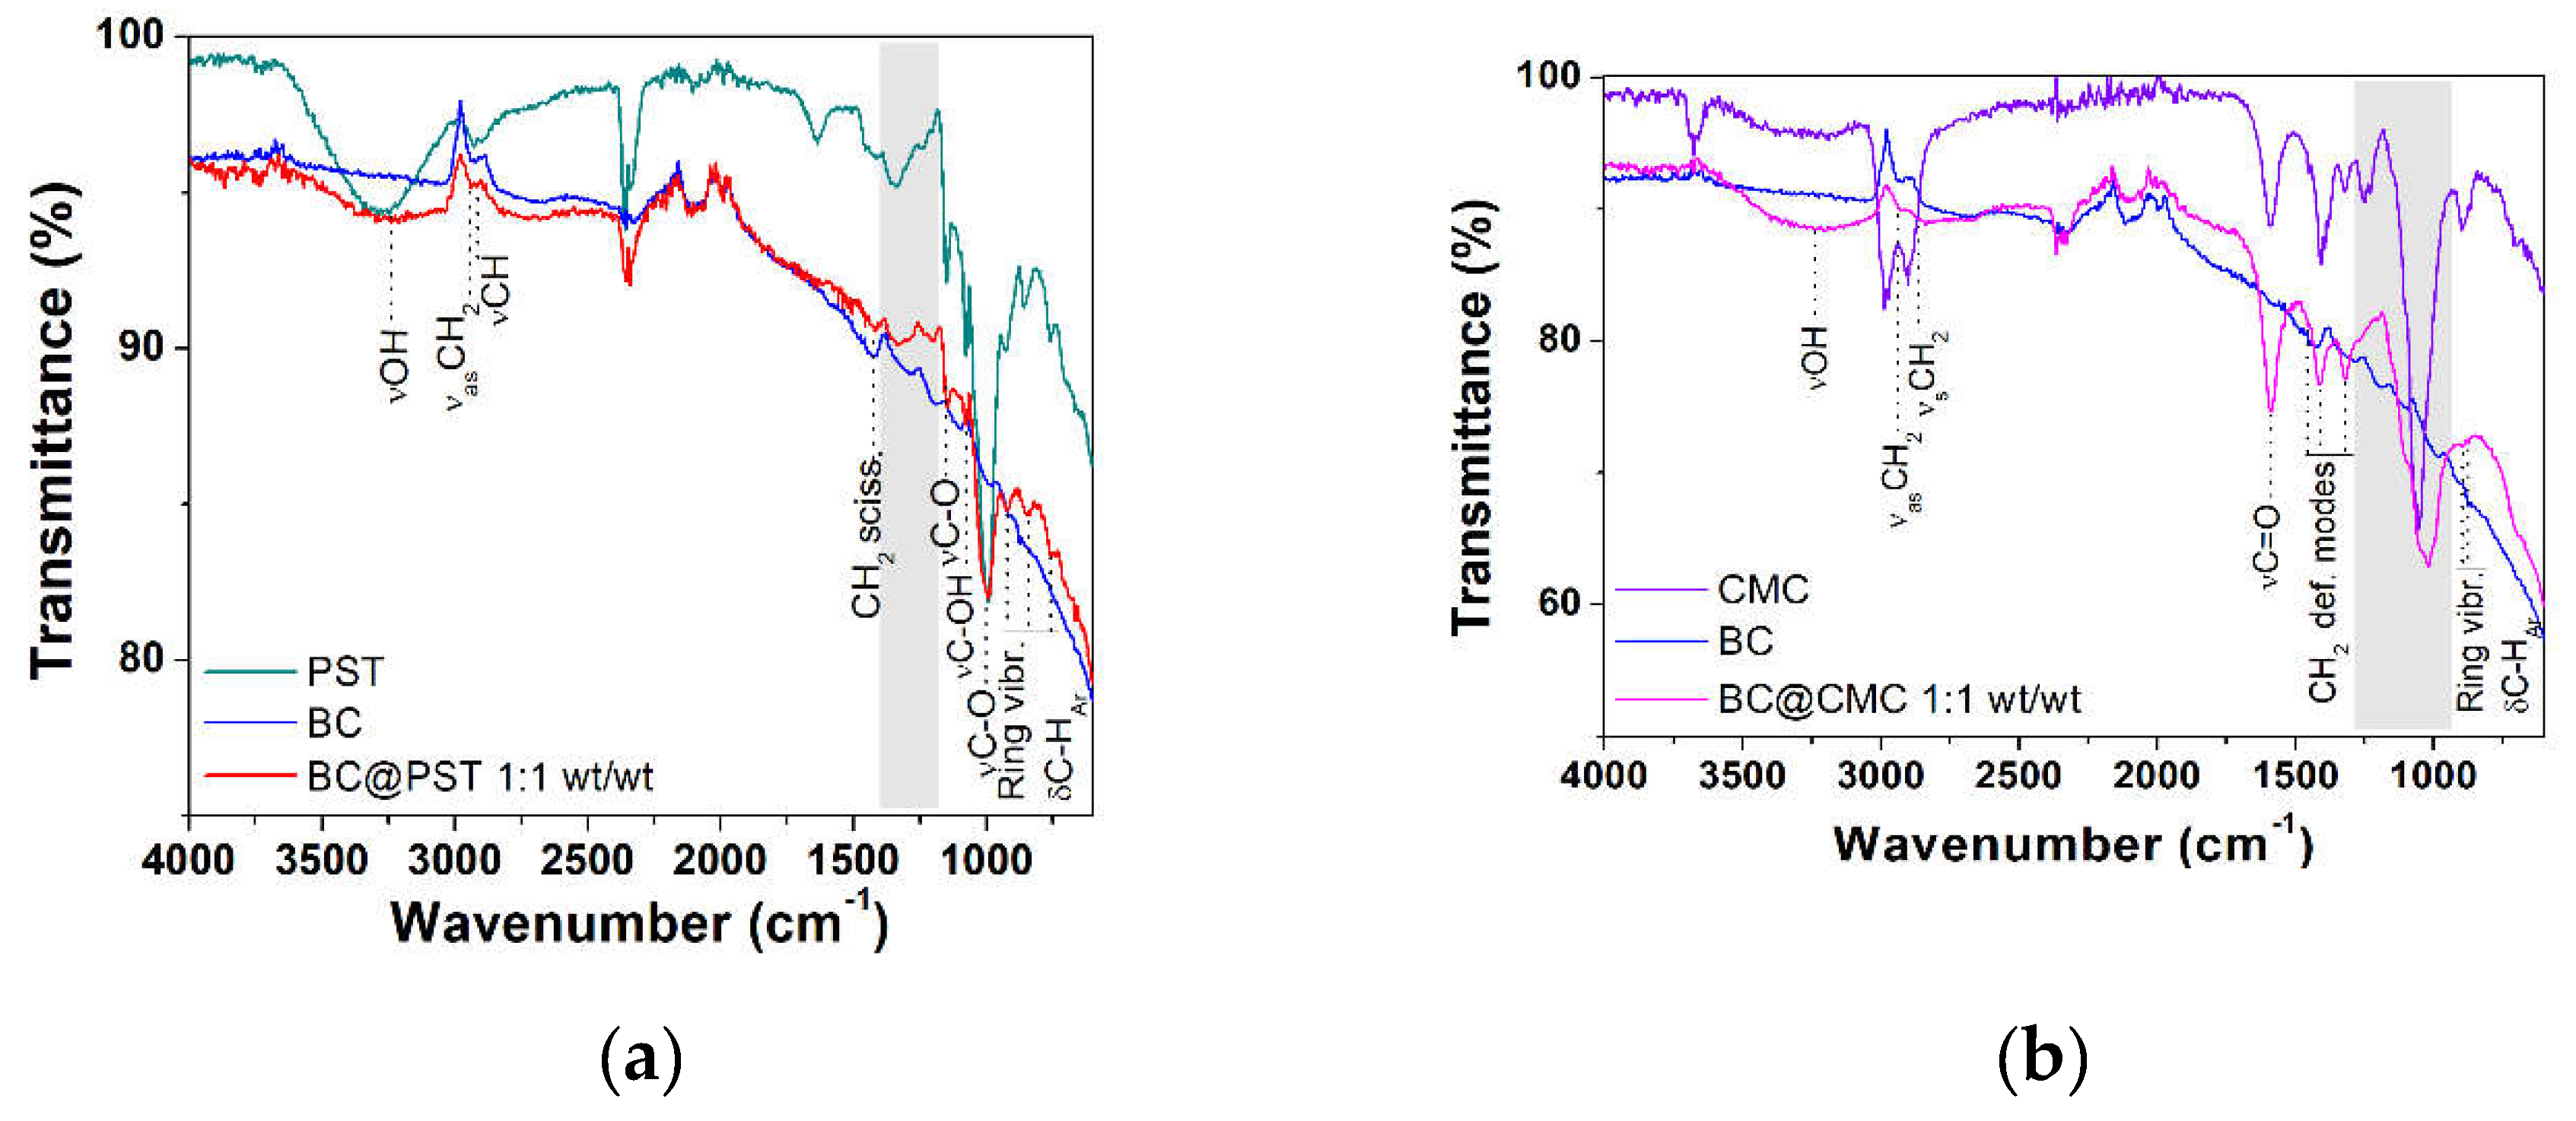
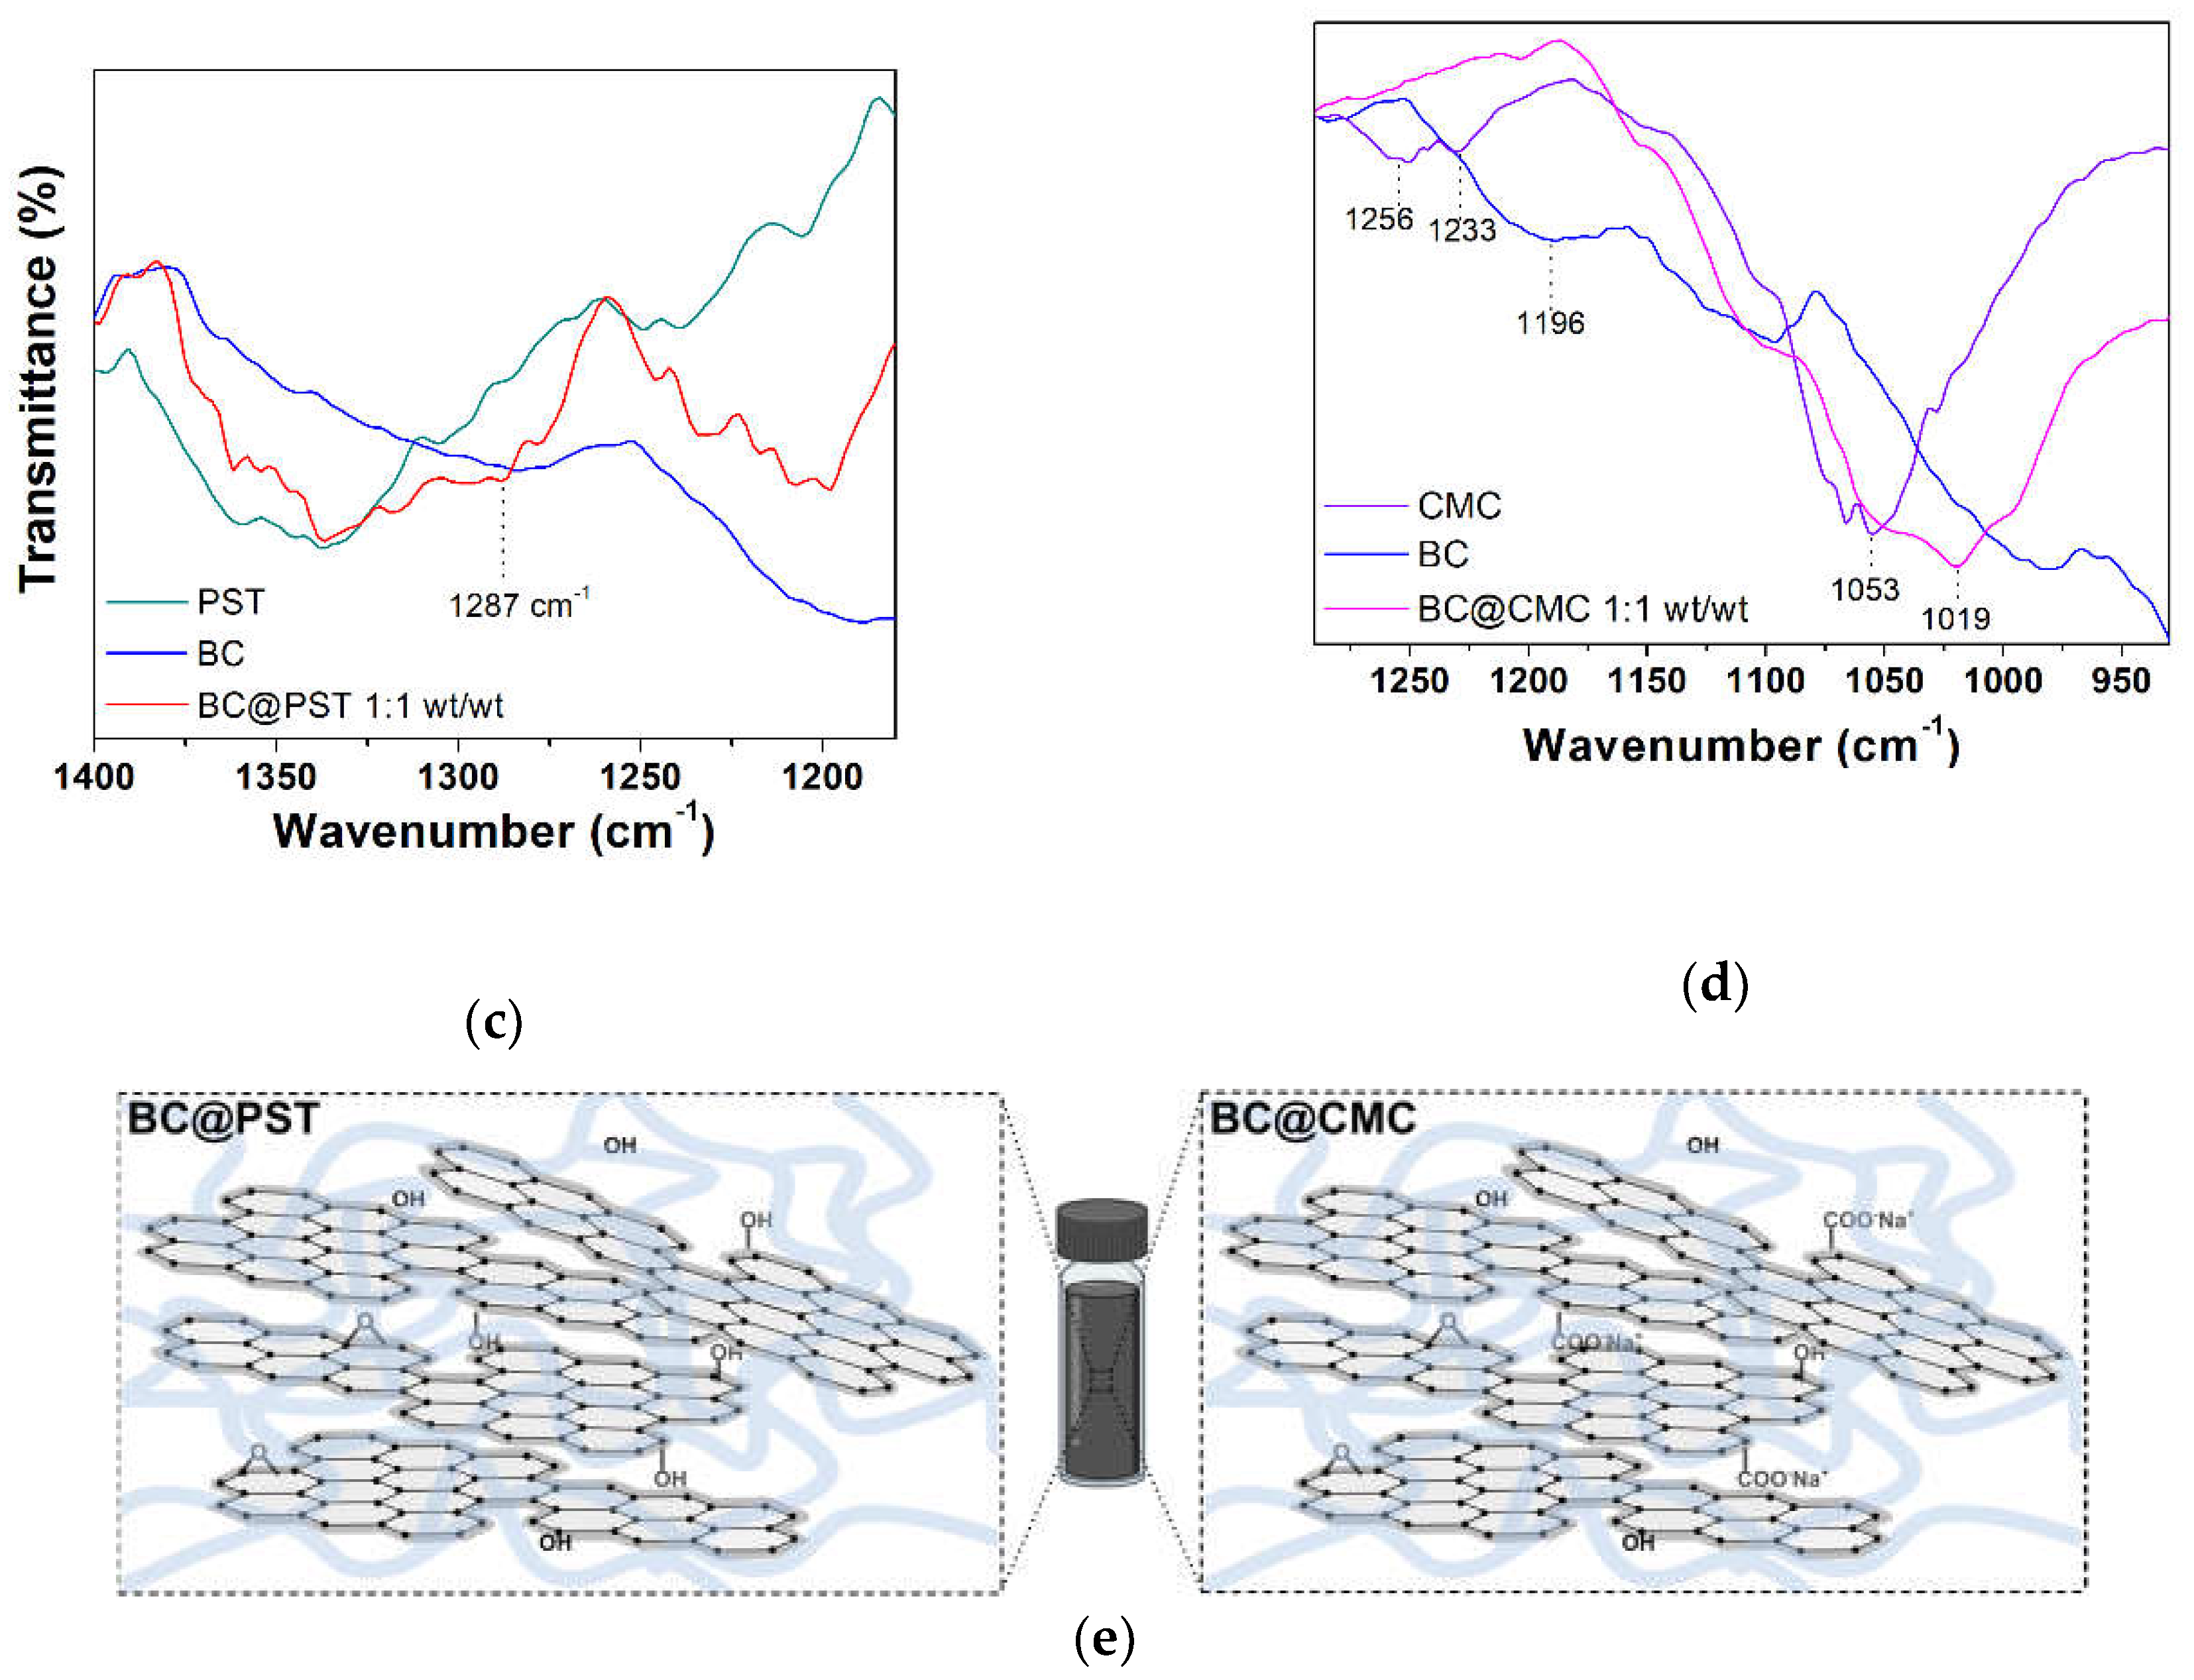
3.3.3. FT-IR Characterization of BC@PST and BC@CMC Composites
3.4. Continuous Flow Column Distribution Tests on BC@polymer Composites
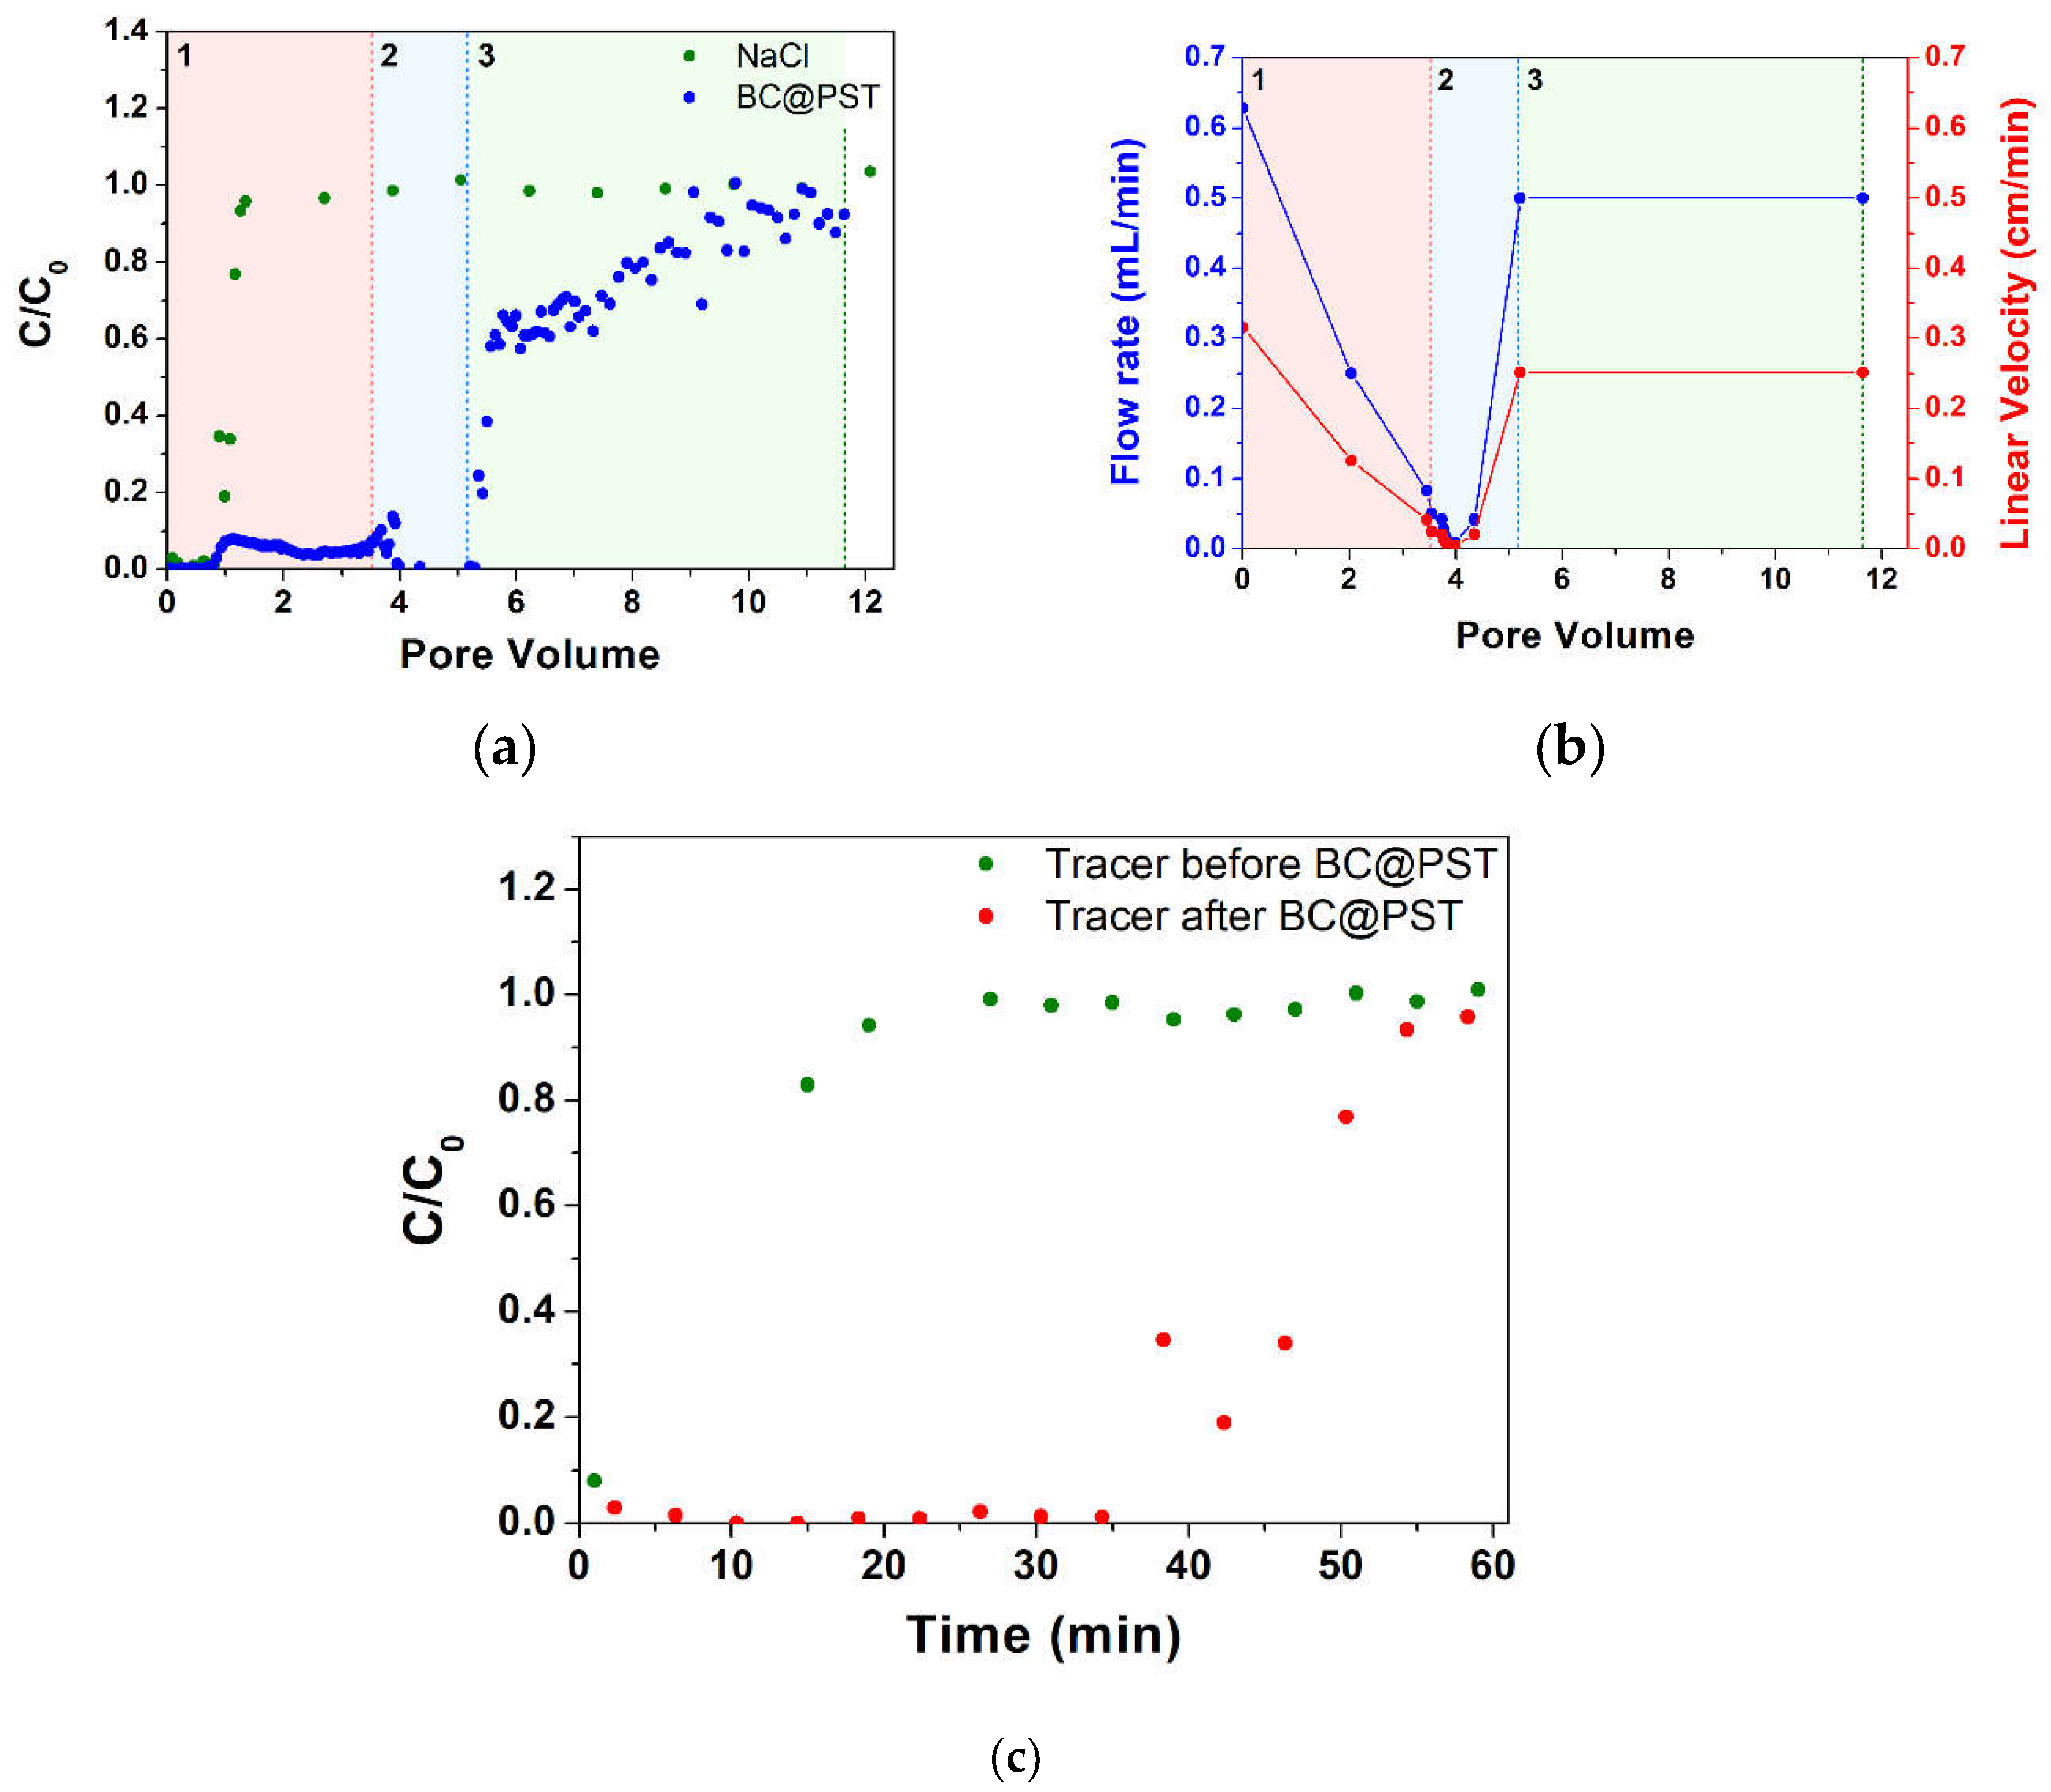
3.4.1. Continuous Flow Column Distribution Tests on BC@PST Composite
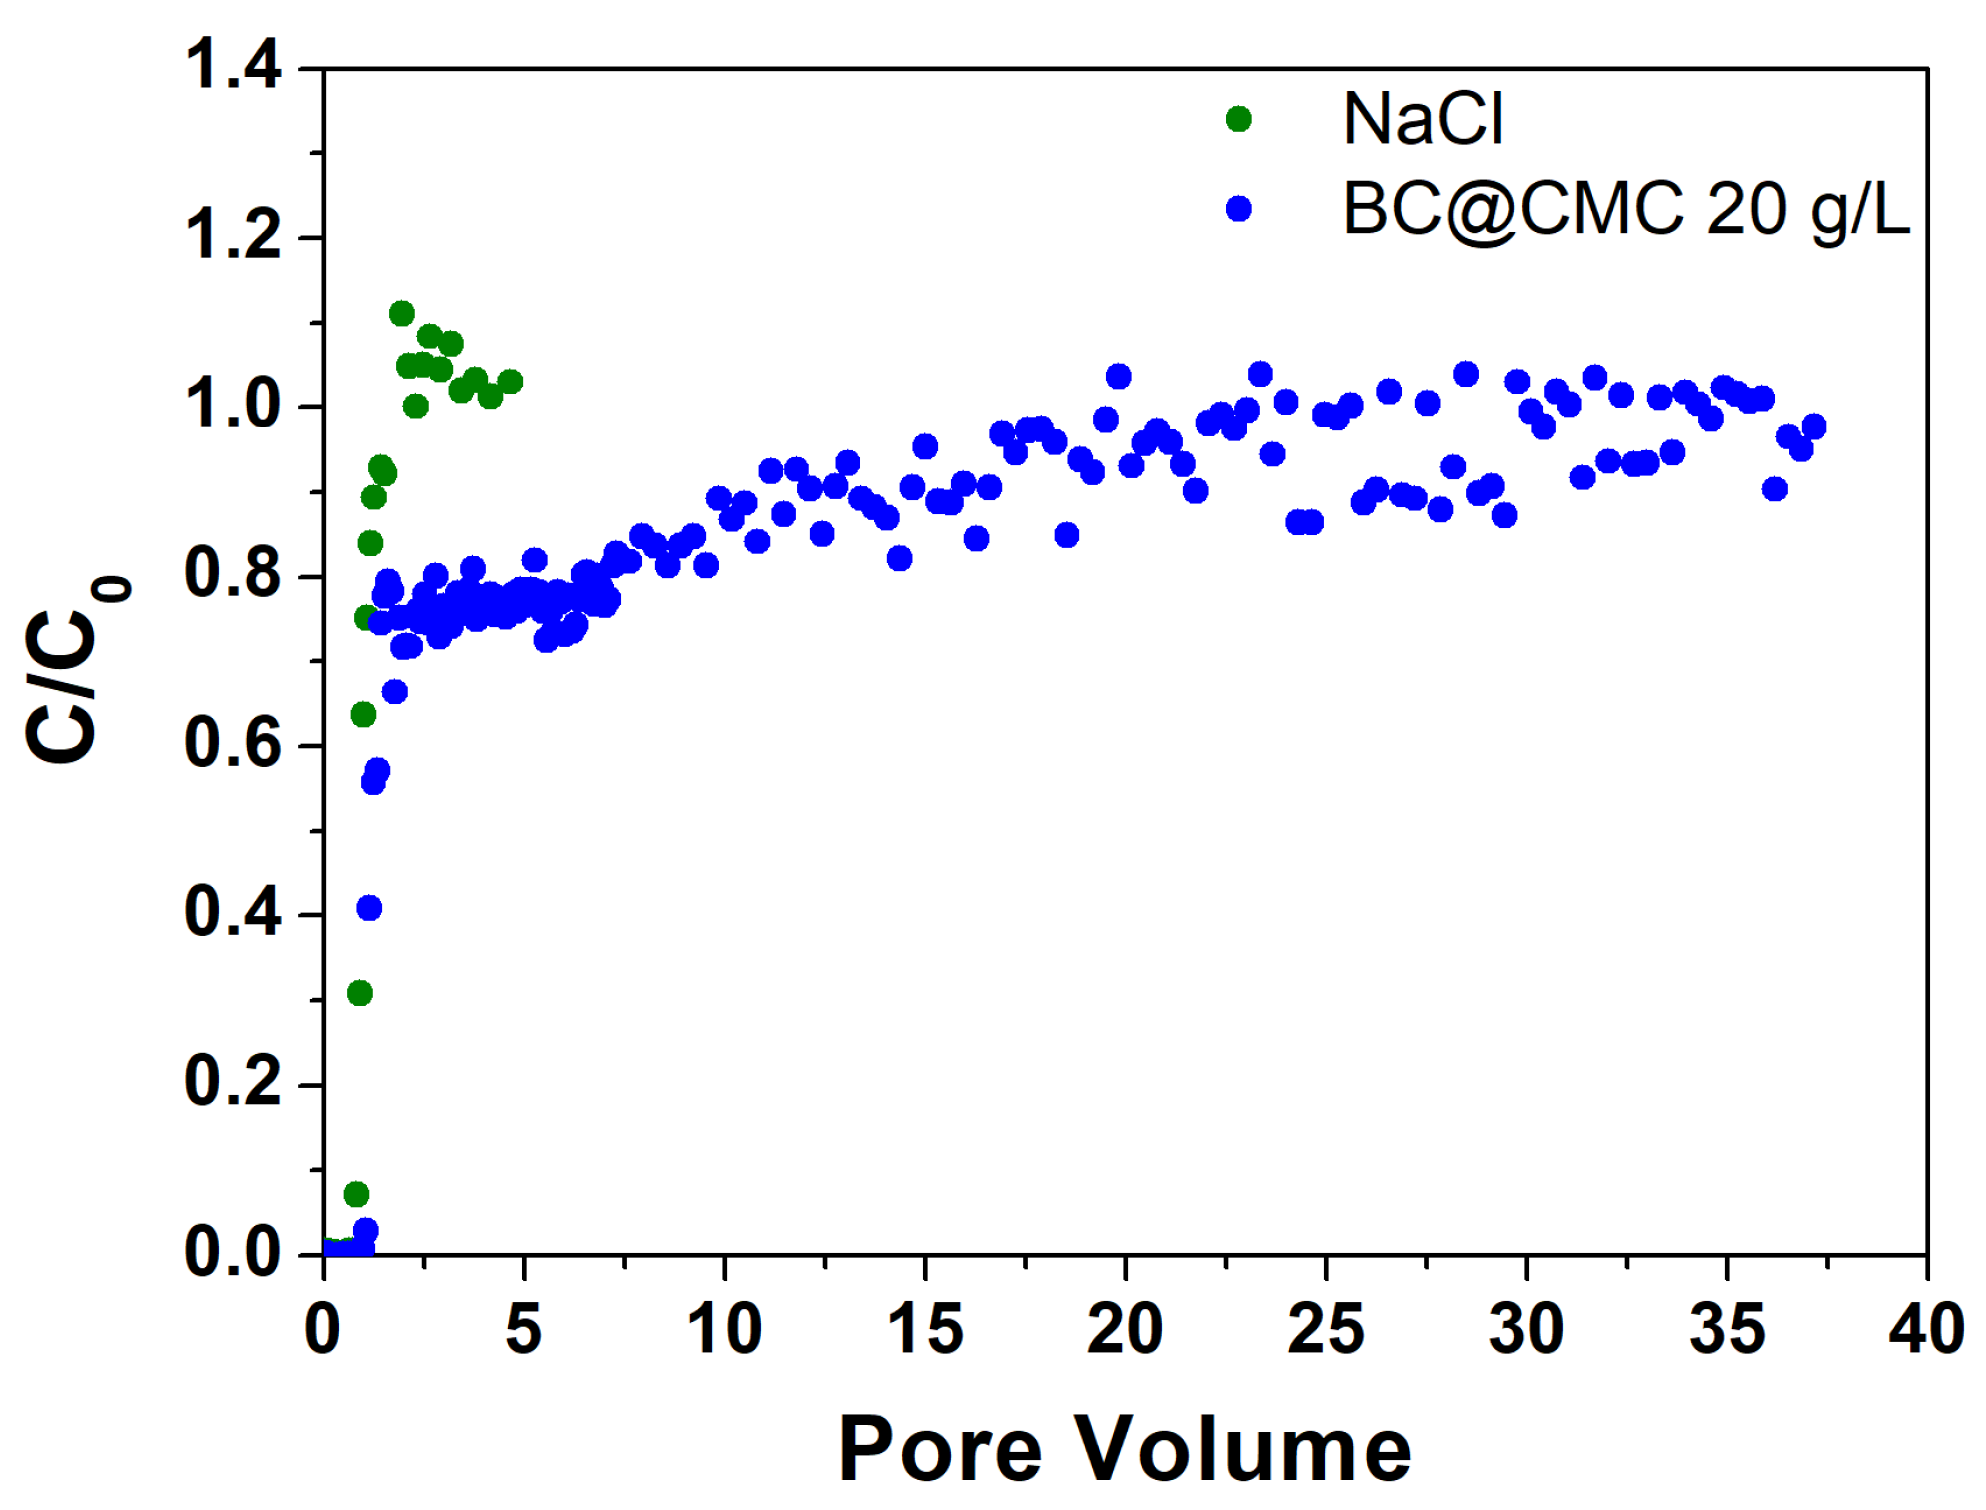
3.4.2. Continuous Flow Column Distribution Tests on BC@CMC 20 g·L−1 Composite
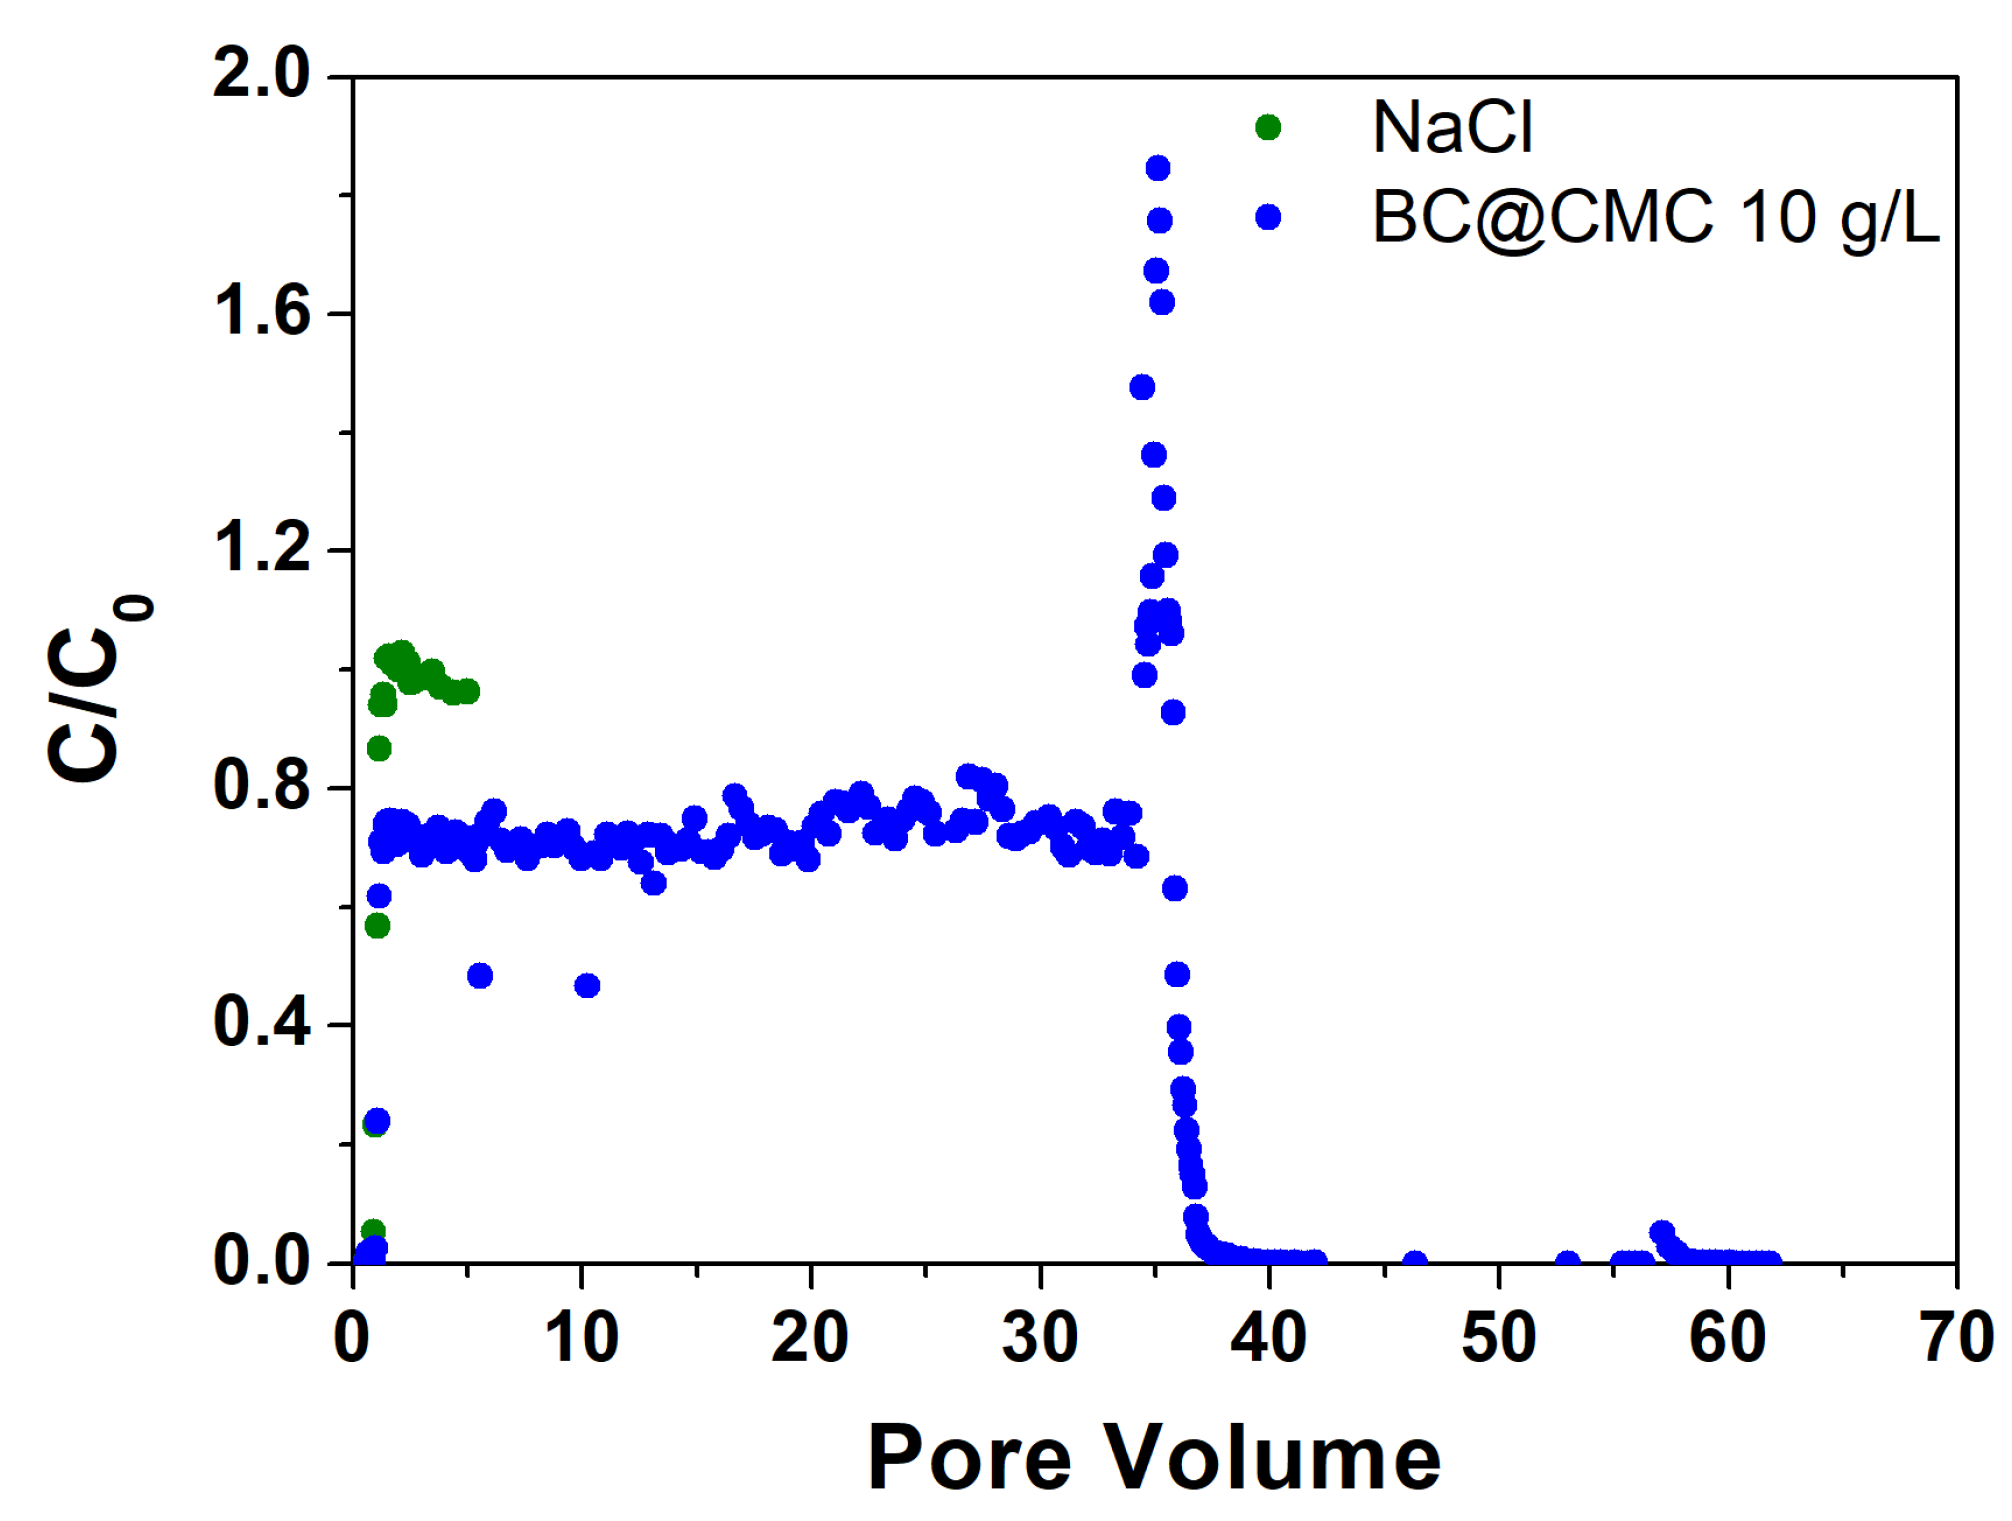
3.4.3. Continuous Flow Column Distribution Tests on BC@CMC 10 g·L−1 Composite
4. Conclusions
Supplementary Materials
Author Contributions
Funding
Data Availability Statement
Acknowledgments
Conflicts of Interest
References
- Chen, H.-M.; Wu, M.-T. Residential exposure to chlorinated hydrocarbons from groundwater contamination and the impairent of renal function-An ecological study. Sci. Rep. 2019, 7, 40283. [Google Scholar] [CrossRef] [PubMed]
- Lu, Y.; Yuan, J.; Lu, X.; Su, C.; Zhang, Y.; Wang, C.; Cao, X.; Li, Q.; Su, J.; Ittekkot, V.; Garbutt, R.A.; Bush, S.; Fletcher, S.; Wagey, T.; Kachur, A.; Sweijd, N. Major threats of pollution and climate change to global coastal ecosystems and enhanced management for sustainability. Environ. Pollut. 2018, 236, 670–680. [Google Scholar] [CrossRef] [PubMed]
- Kurwadkar, S. Occurrence and distribution of organic and inorganic pollutants in groundwater. Water Environ. Res. 2019, 91, 1001–1008. [Google Scholar] [CrossRef] [PubMed]
- Xia, H.; Lyu, T.; Guo, J.; Zhao, C.; Yang, Y. Simultaneous removal of organic micropollutants and inorganic heavy metals by nano-calcium peroxide induced Fenton-like treatment. Sep. Purif. Technol. 2023, 305, 122474. [Google Scholar] [CrossRef]
- Padhye, L.P.; Srivastava, P.; Jasemizad, T.; Bolan, S.; Hou, D.; Shaheen, S.M.; Rinklebe, J.; O’Connor, D.; Lamb, D.; Wang, H.; Siddique, K.H.M.; Bolan, N. Contaminant containment for sustainable remediation of persistent contaminants in soil and groundwater. J. Hazard. Mat. 2023, 455, 131575. [Google Scholar] [CrossRef] [PubMed]
- Ciampi, P.; Esposito, C.; Bartsch, E.; Alesi, E.J.; Rehner, G.; Petrangeli Papini, M. Remediation of chlorinated aliphatic hydrocarbons (CAHs) contaminated site coupling groundwater recirculation well (IEG-GCW®) with a peripheral injection of soluble nutrient supplement (IEG-C-MIX) via multilevel-injection wells (IEG-MIW). Heliyon 2022, 8, e11402. [Google Scholar] [CrossRef] [PubMed]
- Cerra, S.; Fratoddi, I. Nanoscale Solutions: The Transformative Applications of Functionalized Nanomaterials in Environmental Remediation. Appl. Nano 2024, 5, 14–19. [Google Scholar] [CrossRef]
- Aparicio, J.D.; Raimondo, E.E.; Saez, J.M.; Costa-Gutierrez, S.B.; Álvarez, A.; Benimeli, C.S.; Polti, M.A. The current approach to soil remediation: A review of physicochemical and biological technologies, and the potential of their strategic combination. J. Environ. Chem. Eng. 2022, 10, 107141. [Google Scholar] [CrossRef]
- Lyu, H.; Hu, K.; Wu, Z.; Shen, B.; Tang, J. Functional materials contributing to the removal of chlorinated hydrocarbons from soil and groundwater: Classification and intrinsic chemical-biological removal mechanisms. Sci. Total Environ. 2023, 879, 163011. [Google Scholar] [CrossRef]
- Hussain, A.; Rehman, F.; Rafeeq, H.; Waqas, M.; Asghar, A.; Afsheen, N.; Rahdar, A.; Bilal, M.; Iqbal, H.M.M. In-situ, Ex-situ, and nano-remediation strategies to treat polluted soil, water, and air—A review. Chemosphere 2022, 289, 133252. [Google Scholar] [CrossRef]
- Pochampally, S.V.; Krishnaswamy, P.; Obra, C.; Mortazavian, S.; Marti, E.; Moon, J. Adsorption of chlorinated hydrocarbons onto non-activated biochars: Biochar physicochemical characteristics and governing factors. Bioresour. Technol. 2023, 22, 101465. [Google Scholar] [CrossRef]
- Obiri-Nyarko, F.; Grajales-Mesa, S.J.; Malina, G. An overview of permeable reactive barriers for in situ sustainable groundwater remediation. Chemosphere 2014, 111, 243–259. [Google Scholar] [CrossRef] [PubMed]
- Powell, R.M.; Blowes, D.W.; Gillham, R.W.; Schultz, D.; Sivavec, T.; Puls, R.W.; Vogan, J.L.; Powell, P.D.; Landis, R. Permeable reactive barrier technologies for contaminant remediation. US EPA 1998, 600, 1–94. [Google Scholar]
- Mackenzie, K.; Schierz, A.; Georgi, A.; Kopinke, F.D. Colloidal activated carbon and carbo-iron–Novel materials for in-situ groundwater treatment. Global NEST Journal 2008, 10, 54–61. [Google Scholar]
- Georgi, A.; Schierz, A.; Mackenzie, K.; Kopinke, F.D. Colloidal activated carbon for in-situ groundwater remediation—Transport characteristics and adsorption of organic compounds in water-saturated sediment columns. J. Contam. Hydrol. 2015, 179, 76–88. [Google Scholar] [CrossRef] [PubMed]
- Sethi, R.; Day, S.; Di Molfetta, A. Clamshell vs. backhoe excavation of permeable reactive barriers. Am. J. Environ. Sci. 2011, 7, 463–467. [Google Scholar] [CrossRef]
- Ma, J.; Stevens, G.W.; Mumford, K.A. The performance of diphenyldichlorosilane coated ammonium exchange zeolite and its application in the combination of adsorption and biodegradation of hydrocarbon contaminated ground water. Chem. Eng. J. 2018, 347, 415–423. [Google Scholar] [CrossRef]
- Meiramkulova, K.; Kydyrbekova, A.; Devrishov, D.; Nurbala, U.; Tuyakbayeva, A.; Zhangazin, S.; Ualiyeva, R.; Kolpakova, V.; Yeremeyeva, Y.; Mkilima, T. Comparative Analysis of Natural and Synthetic Zeolite Filter Performance in the Purification of Groundwater. Water 2023, 15, 588. [Google Scholar] [CrossRef]
- Javadi, S.; Ghavami, M.; Zhao, Q.; Bate, B. Advection and retardation of non-polar contaminants in compacted clay barrier material with organoclay amendment. Appl. Clay Sci 2017, 142, 30–39. [Google Scholar] [CrossRef]
- Ni, H.; Fan, R.-D.; Reddy, K.R.; Du, Y.-J. Containment of phenol-impacted groundwater by vertical cutoff wall with backfill consisting of sand and bentonite modified with hydrophobic and hydrophilic polymers. J. Hazard. Mater. 2024, 461, 132627. [Google Scholar] [CrossRef]
- Alonso-de-Linaje, V.; Mangayayam, M.C.; Tobler, D.J.; Dietmann, K.M.; Espinosa, R.; Rives, V.; Dalby, K.N. Sorption of chlorinated hydrocarbons from synthetic and natural groundwater by organo-hydrotalcites: Towards their applications as remediation nanoparticles. Chemosphere 2019, 236, 124369. [Google Scholar] [CrossRef]
- Song, T.; Tian, W.; Qiao, K.; Zhao, J.; Chu, M.; Du, Z.; Wang, L.; Xie, W. Adsorption Behaviors of Polycyclic Aromatic Hydrocarbons and Oxygen Derivatives in Wastewater on N-Doped Reduced Graphene Oxide. Sep. Purif. Technol. 2021, 254, 117565. [Google Scholar] [CrossRef]
- Kinney, T.J.; Masiello, C.A.; Dugan, B.; Hockaday, W.C.; Dean, M.R.; Zygourakis, K.; Barnes, R.T. Hydrologic properties of biochars produced at different temperatures. Biomass Bioenergy 2012, 41, 34–43. [Google Scholar] [CrossRef]
- Yang, W.; Shang, J.; Li, B.; Flury, M. Surface and Colloid Properties of Biochar and Implications for Transport in Porous Media. Crit. Rev. Environ. Sci. Technol. 2020, 50, 2484–2522. [Google Scholar] [CrossRef]
- Meng, Q.; Jin, L.; Cheng, L.; Fang, J.; Lin, D. Release and sedimentation behaviors of biochar colloids in soil solutions. J. Environ. Sci. 2021, 100, 269–278. [Google Scholar] [CrossRef]
- Janu, R.; Mrlik, V.; Ribitsch, D.; Hofman, J.; Sedláček, P.; Bielská, L.; Soja, G. Biochar surface functional groups as affected by biomass feedstock, biochar composition and pyrolysis temperature. Carbon Resour. Convers. 2021, 4, 36–46. [Google Scholar] [CrossRef]
- Al-Wabel, M.I.; Al-Omran, A.; El-Naggar, A.H.; Nadeem, M.; Usman, A.R. A Pyrolysis temperature induced changes in characteristics and chemical composition of biochar produced from conocarpus wastes. Bioresour. Technol 2013, 131, 374–379. [Google Scholar] [CrossRef] [PubMed]
- Silvani, L.; Di Palma, P.R.; Riccardi, C.; Eek, E.; Hale, S.E.; Viotti, P.; Petrangeli Papini, M. Use of biochar as alternative sorbent for the active capping of oil contaminated sediments. J. Environ. Chem. Eng. 2017, 5, 5241–5249. [Google Scholar] [CrossRef]
- Loc, N.X.; Tuyen, P.T.T.; Mai, L.C.; Phuong, D.T.M. Chitosan-Modified Biochar and Unmodified Biochar for Methyl Orange: Adsorption Characteristics and Mechanism Exploration. Toxics 2022, 10, 500. [Google Scholar] [CrossRef]
- Li, N.; Yin, M.; Tsang, D.C.W.; Yang, S.; Liu, J.; Li, X.; Song, G.; Wang, J. Mechanisms of U(VI) removal by biochar derived from Ficus microcarpa aerial root: A comparison between raw and modified biochar. Sci. Total Environ. 2019, 697, 134115. [Google Scholar] [CrossRef]
- Zhong, Y.; Igalavithana, A.D.; Zhang, M.; Li, X.; Rinklebe, J.; Hou, D.; Tack, F.M.G.; Alessi, D.S.; Tsang, D.C.W.; Ok, Y.S. Effects of aging and weathering on immobilization of trace metals/metalloids in soils amended with biochar. Environ. Sci. Processes Impacts 2020, 22, 1790–1808. [Google Scholar] [CrossRef] [PubMed]
- Herzig, J.P.; Leclerc, D.M.; Goff, P.L. Flow of suspensions through porous media—application to deep filtration. Ind. Eng. Chem. 1970, 62, 8–35. [Google Scholar] [CrossRef]
- McDowell-Boyer, L.M. Chemical mobilization of micron-sized particles in saturated porous media under steady flow conditions. Environ. Sci. Technol. 1992, 26, 586–593. [Google Scholar] [CrossRef]
- Shen, C.; Huang, Y.; Li, B.; Jin, Y. Effects of solution chemistry on straining of colloids in porous media under unfavorable conditions. Water Resour. Res. 2008, 44, W05419. [Google Scholar] [CrossRef]
- Bradford, S.A.; Yates, S.R.; Bettahar, M.; Simunek, J. Physical factors affecting the transport and fate of colloids in saturated porous media. Water Resour. Res. 2002, 38, 1327. [Google Scholar] [CrossRef]
- Du, Y.; Shen, C.; Zhang, H.; Huang, Y. Effects of flow velocity and nonionic surfactant on colloid straining in saturated porous media under unfavorable conditions. Transp. Porous Med. 2013, 98, 193–208. [Google Scholar] [CrossRef]
- Rajapaksha, A.U.; Chen, S.S.; Tsang, D.C.W.; Zhang, M.; Vithanage, M.; Mandal, S.; Gao, B.; Bolan, N.S.; Ok, Y.S. Engineered/designer biochar for contaminant removal/immobilization from soil and water: Potential and implication of biochar modification. Chemosphere 2016, 148, 276–291. [Google Scholar] [CrossRef] [PubMed]
- Bartoli, M.; Arrigo, R.; Malucelli, G.; Tagliaferro, A.; Duraccio, D. Recent Advances in Biochar Polymer Composites. Polymers 2022, 14, 2506. [Google Scholar] [CrossRef] [PubMed]
- Rossi, M.M.; Alfano, S.; Amanat, N.; Andreini, F.; Lorini, L.; Martinelli, A.; Petrangeli Papini, M. A Polyhydroxybutyrate (PHB)-Biochar Reactor for the Adsorption and Biodegradation of Trichloroethylene: Design and Startup Phase. Bioengineering 2022, 9, 192. [Google Scholar] [CrossRef]
- Infurna, G.; Caruso, G.; Dintcheva, N.T. Sustainable Materials Containing Biochar Particles: A Review. Polymers 2023, 15, 343. [Google Scholar] [CrossRef]
- Alazaiza, M.Y.D.; Albahnasawi, A.; Eyvaz, M.; Al Maskari, T.; Nassani, D.E.; Amr, S.S.A.; Abujazar, M.S.S.; Bashir, M.J.K. An Overview of Green Bioprocessing of Algae-Derived Biochar and Biopolymers: Synthesis, Preparation, and Potential Applications. Energies 2023, 16, 791. [Google Scholar] [CrossRef]
- Amanat, N.; Barbati, B.; Rossi, M.M.; Bellagamba, M.; Buccolini, M.; Galantini, L.; Petrangeli Papini, M. Synthetic and Natural Surfactants for Potential Application in Mobilization of Organic Contaminants: Characterization and Batch Study. Water 2022, 14, 1182. [Google Scholar] [CrossRef]
- Rossi, M.M.; Silvani, L.; Amanat, N.; Petrangeli Papini, M. Biochar from pine wood, rice husks and iron-eupatorium shrubs for remediation applications: Surface characterization and experimental tests for trichloroethylene removal. Materials 2021, 14, 1776. [Google Scholar] [CrossRef] [PubMed]
- Moran, M.J.; Zogorski, J.S.; Squillace, P.J. Chlorinated solvents in groundwater of the United States. Environ. Sci. Technol. 2007, 41, 74–81. [Google Scholar] [CrossRef] [PubMed]
- Rossi, M.M.; Matturro, B.; Amanat, N.; Rossetti, S.; Petrangeli Papini, M. Coupled adsorption and biodegradation of trichloroethylene on biochar from pine wood wastes: A combined approach for a sustainable bioremediation strategy. Microorganisms 2022, 10, 101. [Google Scholar] [CrossRef]
- Rouquerol, J.; Llewellyn, P.; Rouquerol, F. Is the Bet Equation Applicable to Microporous Adsorbents? In Studies in Surface Science and Catalysis; Elsevier, 2007; Volume 160, pp. 49–56. ISBN 978-0-444-52022-7. [Google Scholar]
- Barrett, E.P.; Joyner, L.G.; Halenda, P.P. The Determination of Pore Volume and Area Distributions in Porous Substances. I. Computations from Nitrogen Isotherms. J. Am. Chem. Soc. 1951, 73, 373–380. [Google Scholar] [CrossRef]
- Gurvitsch, L.G. Physicochemical attractive force. J. Russ. Phys. Chem. Soc. 1915, 47, 805–827. [Google Scholar]
- Yu, X.-Y.; Ying, G.-G.; Kookana, R.S. Reduced plant uptake of pesticides with biochar additions to soil. Chemosphere 2009, 76, 665–671. [Google Scholar] [CrossRef]
- Kim, P.; Johnson, A.; Edmunds, C.W.; Radosevich, M.; Vogt, F.; Rials, T.G.; Labbé, N. Surface Functionality and Carbon Structures in Lignocellulosic-Derived Biochars Produced by Fast Pyrolysis. Energy Fuels 2011, 25, 4693–4703. [Google Scholar] [CrossRef]
- Wang, X.; Sotoudehniakarani, F.; Yu, Z.; Morrell, J.J.; Cappellazzi, J.; McDonald, A.G. Evaluation of corrugated cardboard biochar as reinforcing fiber on properties, biodegradability and weatherability of wood-plastic composites. Polym. Degrad. Stab. 2019, 168, 108955. [Google Scholar] [CrossRef]
- Liu, Y.; He, Z.; Uchimiya, M. Comparison of Biochar Formation from Various Agricultural By-Products Using FTIR Spectroscopy. Mod. Appl. Sci. 2015, 9, 246–253. [Google Scholar] [CrossRef]
- Fang, Q.; Chen, B.; Lin, Y.; Guan, Y. Aromatic and Hydrophobic Surfaces of Wood-derived Biochar Enhance Perchlorate Adsorption via Hydrogen Bonding to Oxygen-containing Organic Groups. Environ. Sci. Technol. 2014, 48, 279–288. [Google Scholar] [CrossRef] [PubMed]
- Kong, W.; Zhang, M.; Liu, Y.; Gou, J.; Wei, Q.; Shen, B. Physico-chemical characteristics and the adsorption of ammonium of biochar pyrolyzed from distilled spirit lees, tobacco fine and Chinese medicine residues. J. Anal. Appl. Pyrolysis 2021, 156, 105148. [Google Scholar] [CrossRef]
- Elnour, A.Y.; Alghyamah, A.; Shaikh, H.M.; Poulose, A.M.; Al-Zahrani, S.M.; Anis, A.; Al-Wabel, M. Effect of Pyrolysis Temperature on Biochar Microstructural Evolution, Physicochemical Characteristics, and Its Influence on Biochar/Polypropylene Composites. Appl. Sci. 2019, 9, 1149. [Google Scholar] [CrossRef]
- Sing, K.S.W. Reporting Physisorption Data for Gas/Solid Systems with Special Reference to the Determination of Surface Area and Porosity (Recommendations 1984). Pure Appl. Chem. 1985, 57, 603–619. [Google Scholar] [CrossRef]
- Li, Z.Q.; Lu, C.J.; Xia, Z.P.; Zhou, Y.; Luo, Z. X-ray diffraction patterns of graphite and turbostratic carbon. Carbon 2007, 45, 1686–1695. [Google Scholar] [CrossRef]
- Disma, F. Effect of Mechanical Grinding on the Lithium Intercalation Process in Graphites and Soft Carbons. J. Electrochem. Soc. 1996, 143, 3959. [Google Scholar] [CrossRef]
- Abulikemu, G.; Wahman, D.G.; Sorial, G.A.; Nadagouda, M.; Stebel, E.K.; Womack, E.A.; Smith, S.J.; Kleiner, E.J.; Gray, B.N.; Taylor, R.D.; et al. Role of Grinding Method on Granular Activated Carbon Characteristics. Carbon Trends 2023, 11, 100261. [Google Scholar] [CrossRef] [PubMed]
- Aranaz, I.; Alcántara, A.R.; Civera, M.C.; Arias, C.; Elorza, B.; Caballero, A.H.; Acosta, N. Chitosan: An Overview of Its Properties and Applications. Polymers 2021, 13, 3256. [Google Scholar] [CrossRef]
- Keetelsl, C.J.A.M.; van Vliet, T.; Walstra, P. Gelation and retrogradation of concentrated starch systems: 1. Gelation. Food Hydrocoll. 1996, 10, 343–353. [Google Scholar] [CrossRef]
- Lafarge, C.; Cayot, N. Potential Use of Mixed Gels from Konjac Glucomannan and Native Starch for Encapsulation and Delivery of Aroma Compounds: A Review. Starch 2018, 70, 1700159. [Google Scholar] [CrossRef]
- Yassaroh, Y.; Woortman, A.J.J.; Loos, K. A new way to improve physicochemical properties of potato starch. Carbohydr. Polym. 2019, 204, 1–8. [Google Scholar] [CrossRef] [PubMed]
- Geetha, D.; Tyagi, R. Alkyl Poly Glucosides (APGs) Surfactants and Their Properties: A Review. Tenside Surfactants Deterg. 2012, 49, 417–427. [Google Scholar] [CrossRef]
- Han, F.; Zhao, Y.; Liu, M.; Hu, F.; Peng, Y.; Ma, L. Effect of Sodium Carboxymethyl Cellulose on the Dynamic Wetting Characteristics of the Dust Suppression Droplet Impacting the Coal Surface. ACS Omega 2023, 8, 18414–18424. [Google Scholar] [CrossRef] [PubMed]
- Makowska, A.; Dwiecki, K.; Kubiak, P.; Baranowska, H.M.; Lewandowicz, G. Polymer-Solvent Interactions in Modified Starches Pastes–Electrokinetic, Dynamic Light Scattering, Rheological and Low Field Nuclear Magnetic Resonance Approach. Polymers 2022, 14, 2977. [Google Scholar] [CrossRef] [PubMed]
- Silverstein, R.; Webster, M.F.X.; Kiemle, D.J. Chapter 2: Infrared Spectrometry. In Spectrometric identification of organic compounds, 7th ed.; John Wiley & Sons, Inc.: Hoboken, New Jersey, 2005; pp. 88–92. [Google Scholar]
- Dankar, I.; Haddarah, A.; Omar, F.E.L.; Pujolà, M.; Sepulcre, F. Characterization of food additive-potato starch complexes by FTIR and X-ray diffraction. Food Chem. 2018, 160, 7–12. [Google Scholar] [CrossRef] [PubMed]
- Avram, M.; Mateescu, GH.D. Carbohydrates. In Infrared Spectroscopy: Applications in Organic Chemistry, 2nd ed.; R. E. Krieger Publishing Company: Huntington, New York, 1978; pp. 474–478. [Google Scholar]
- Lu, Z.-H.; Donner, E.; Yada, R.Y.; Liu, Q. Physicochemical properties and in vitro starch digestibility of potato starch/protein blends. Carbohydr. Polym. 2016, 154, 214–222. [Google Scholar] [CrossRef] [PubMed]
- Wang, B.; Gao, W.; Kang, X.; Dong, Y.; Liu, P.; Yan, S.; Yu, B.; Guo, L.; Cui, B.; El-Aty, A.M.A. Structural changes in corn starch granules treated at different temperatures. Food Hydrocoll. 2021, 118, 106770. [Google Scholar] [CrossRef]
- da Silva, A.M.; Gräbin Scherer, L.; Moschini Daudt, R.; Corralo Spada, J.; Medeiros Cardozo, N.S.; Damasceno Ferreira Marczak, L. Effects of starch source and treatment type—Conventional and ohmic heating—On stability and rheological properties of gels. LWT 2019, 109, 7–12. [Google Scholar] [CrossRef]
- Zhuang, Y.; Wang, Y.; Yang, H. Characterizing digestibility of potato starch with cations by SEM, X-ray, LF-NMR, FTIR. Food Chem. 2023, 424, 136396. [Google Scholar] [CrossRef]
- Badry, R.; Ezzat, H.A.; El-Khodary, S.; Morsy, M.; Elhaes, H.; Nada, N.; Ibrahim, M. Spectroscopic and thermal analyses for the effect of acetic acid on the plasticized sodium carboxymethyl cellulose. J. Mol. Struct. 2021, 1224, 129013. [Google Scholar] [CrossRef]
- Bradford, S.A.; Torkzaban, S.; Walker, S.L. Coupling of physical and chemical mechanisms of colloid straining in saturated porous media. Water Res. 2007, 41, 3012–3024. [Google Scholar] [CrossRef] [PubMed]
- Johnson, W.P.; Li, X.; Yal, G. Colloid retention in porous media: mechanistic confirmation of wedging and retention in zones of flow stagnation. Environ. Sci. Technol. 2007, 41, 1279–1287. [Google Scholar] [CrossRef] [PubMed]
- Mitropoulou, P.N.; Syngouna, V.I.; Chrysikopoulos, C.V. Transport of colloids in unsaturated packed columns: Role of ionic strength and sand grain size. Chem. Eng. J. 2013, 232, 237–248. [Google Scholar] [CrossRef]
- Xu, S.; Gao, B.; Saiers, J.E. Straining of colloidal particles in saturated porous media. Water Resour. Res. 2006, 42, W12S16. [Google Scholar] [CrossRef]
| Type of biopolymer | Temperature* | Reaction time | Additive |
|---|---|---|---|
| Chitosan | Room temperature | 2 h | - |
| Sodium alginate | Room temperature | 2 h | - |
| Potato starch | 70 °C | 1 h | APG2 1.0% v/v |
| Sodium carboxymethylcellulose | Room temperature | 2 h | - |
Disclaimer/Publisher’s Note: The statements, opinions and data contained in all publications are solely those of the individual author(s) and contributor(s) and not of MDPI and/or the editor(s). MDPI and/or the editor(s) disclaim responsibility for any injury to people or property resulting from any ideas, methods, instructions or products referred to in the content. |
© 2024 by the authors. Licensee MDPI, Basel, Switzerland. This article is an open access article distributed under the terms and conditions of the Creative Commons Attribution (CC BY) license (http://creativecommons.org/licenses/by/4.0/).


