1. Introduction
Estuaries are considered to be the most biologically productive systems on Earth (Kennish, 2002), with a mean primary production of 1500 g/m2;/year (dry matter), in comparison with only 125 g/m2;/year for the open ocean, 360 g/m2;/year for the waters of continental shelves, 400 g/m2;/year for lakes and streams, and 650 g/m2;/year for cultivated land (Whitaker and Likens, 1975). Given their productivity, estuaries provide important feeding, spawning, and nursery areas for many migratory species found in both marine and freshwater environments (McLusky and Elliott, 2004; Elliott and Quintino, 2007).
Recent studies have shown that climate events such as the Drought and the El Nino Southern Oscillation (ENSO) may affect these environments directly through anomalies in rainfall levels (Garcia-Rodriguez et al., 2013; Pereira et al., 2017), which may result in the reduction of freshwater discharge, affecting both water quality and ecosystem goods and services (Woodward et al., 2016). The principal changes can be observed in the availability and consumption of dissolved nutrients and organic matter, as well as in the occurrence of oscillations in the physical–chemical properties of the water, and ecosystem structure and function (Wetz and Yoskowitz, 2013). These processes may result in variations in the trophic status and salinity of the estuary, as observed at a number of locations, worldwide (Garcia-Rodriguez et al., 2013; Thompson et al., 2015). In the Amazon region, drought events make estuarine waters more saline, and result in a reduction in dissolved nutrient and chlorophyll a concentrations (Pereira et al., 2017; Costa et al., 2022; Oliveira et al., 2023; Procopio et al., 2024), whereas during periods of abnormally high rainfall, salinity declines, and the water becomes richer in dissolved inorganic nutrients and phytoplankton biomass (Pereira et al., 2013; Andrade et al., 2016).
The annual variability in the climate of the Amazon region is controlled mainly by large-scale circulation patterns, including the displacement of the Inter-Tropical Convergence Zone - ITCZ. In the first half of the year, the ITCZ shifts to the Southern Hemisphere, triggering the formation of intense convective currents, which cause heavy rainfall (up to 90% of the annual total) and decreasing winds in this coastal region. During the second half of the year, the ITCZ shifts to the Northern Hemisphere, to about 10º North, causing rainfall to decline in the Brazilian Amazon Coastal Zone (Figueroa and Nobre et al., 1990).
Inter-annual variations in rainfall levels in the Amazon region are closely linked to low-frequency, large-scale oceanic and atmospheric phenomena occurring over the Pacific (El Niño Southern Oscillation - ENSO) and Atlantic (North Atlantic Oscillation - NAO and Multidecadal Atlantic Oscillation - AMO) oceans (Fernandes et al., 2011; García-García and Ummenhofer, 2015). The anomalous warming of the surface waters of these oceans has been associated with a reduction in rainfall levels, whereas anomalous cooling is associated with an increase in rainfall (Marengo et al., 2008; Zeng et al., 2008; Yoon and Zeng, 2010; Coelho et al., 2012; Trenberth et al., 2014). In this context, severe floods were recorded in the Amazon region in 1954, 1989, 1999, 2009, 2011 and 2012 (Marengo et al., 2011; Espinoza et al., 2012a; Marengo et al., 2013a). A number of severe droughts have also been recorded in the region, with the first event being documented in 1911–1912 (William et al., 2005; Xu et al., 2011; Pinho et al., 2012; Senerevitane et al., 2012; Tomasella et al., 2013).
The Amazon drought of 2010 was one of the most severe episodes recorded in this region, and was associated with some of the highest Sea Surface Temperatures (SSTs) ever recorded in the tropical Atlantic during an El Niño event (Marengo et al. 2011; Coelho et al., 2012). In 2012–2013, with high pressure zones dominating the South Atlantic, anomalously cold southern waters migrated northward and contributed to a decline in rainfall levels in northeastern Brazil (Marengo et al. 2013b), a phenomenon that subsequently extended to the country’s northern (Amazon) coast.
In this context, the main aim of the present study is to analyze the influence of interannual climate forcing, such as the Drought and ENSO events, on the water quality of an Amazon estuary, the Caeté. The water quality in the Caeté estuary is determined primarily by the organic material and leaf litter deposited by the mangrove forests that surround the estuary (Dittmar and Lara, 2001), as well as the discharge of sewage and other untreated effluents from local settlements (Monteiro et al., 2016a). While the Caeté estuary is one of the best-studied bodies of water in the region, few studies have focused specifically on the effects of extreme climate events on its hydrological dynamics. Given this, the principal question investigated in the present study is: How do anomalous climate events (Drought, El Niño, La Niña) affect the trophic status of an Amazonian estuary? It is also hoped that the Caeté estuary can provide a useful model for the assessment of the effects of extreme climate events on the water quality of similar estuarine environments in the Amazon region, which may be affected by global climate change.
2. Study Area
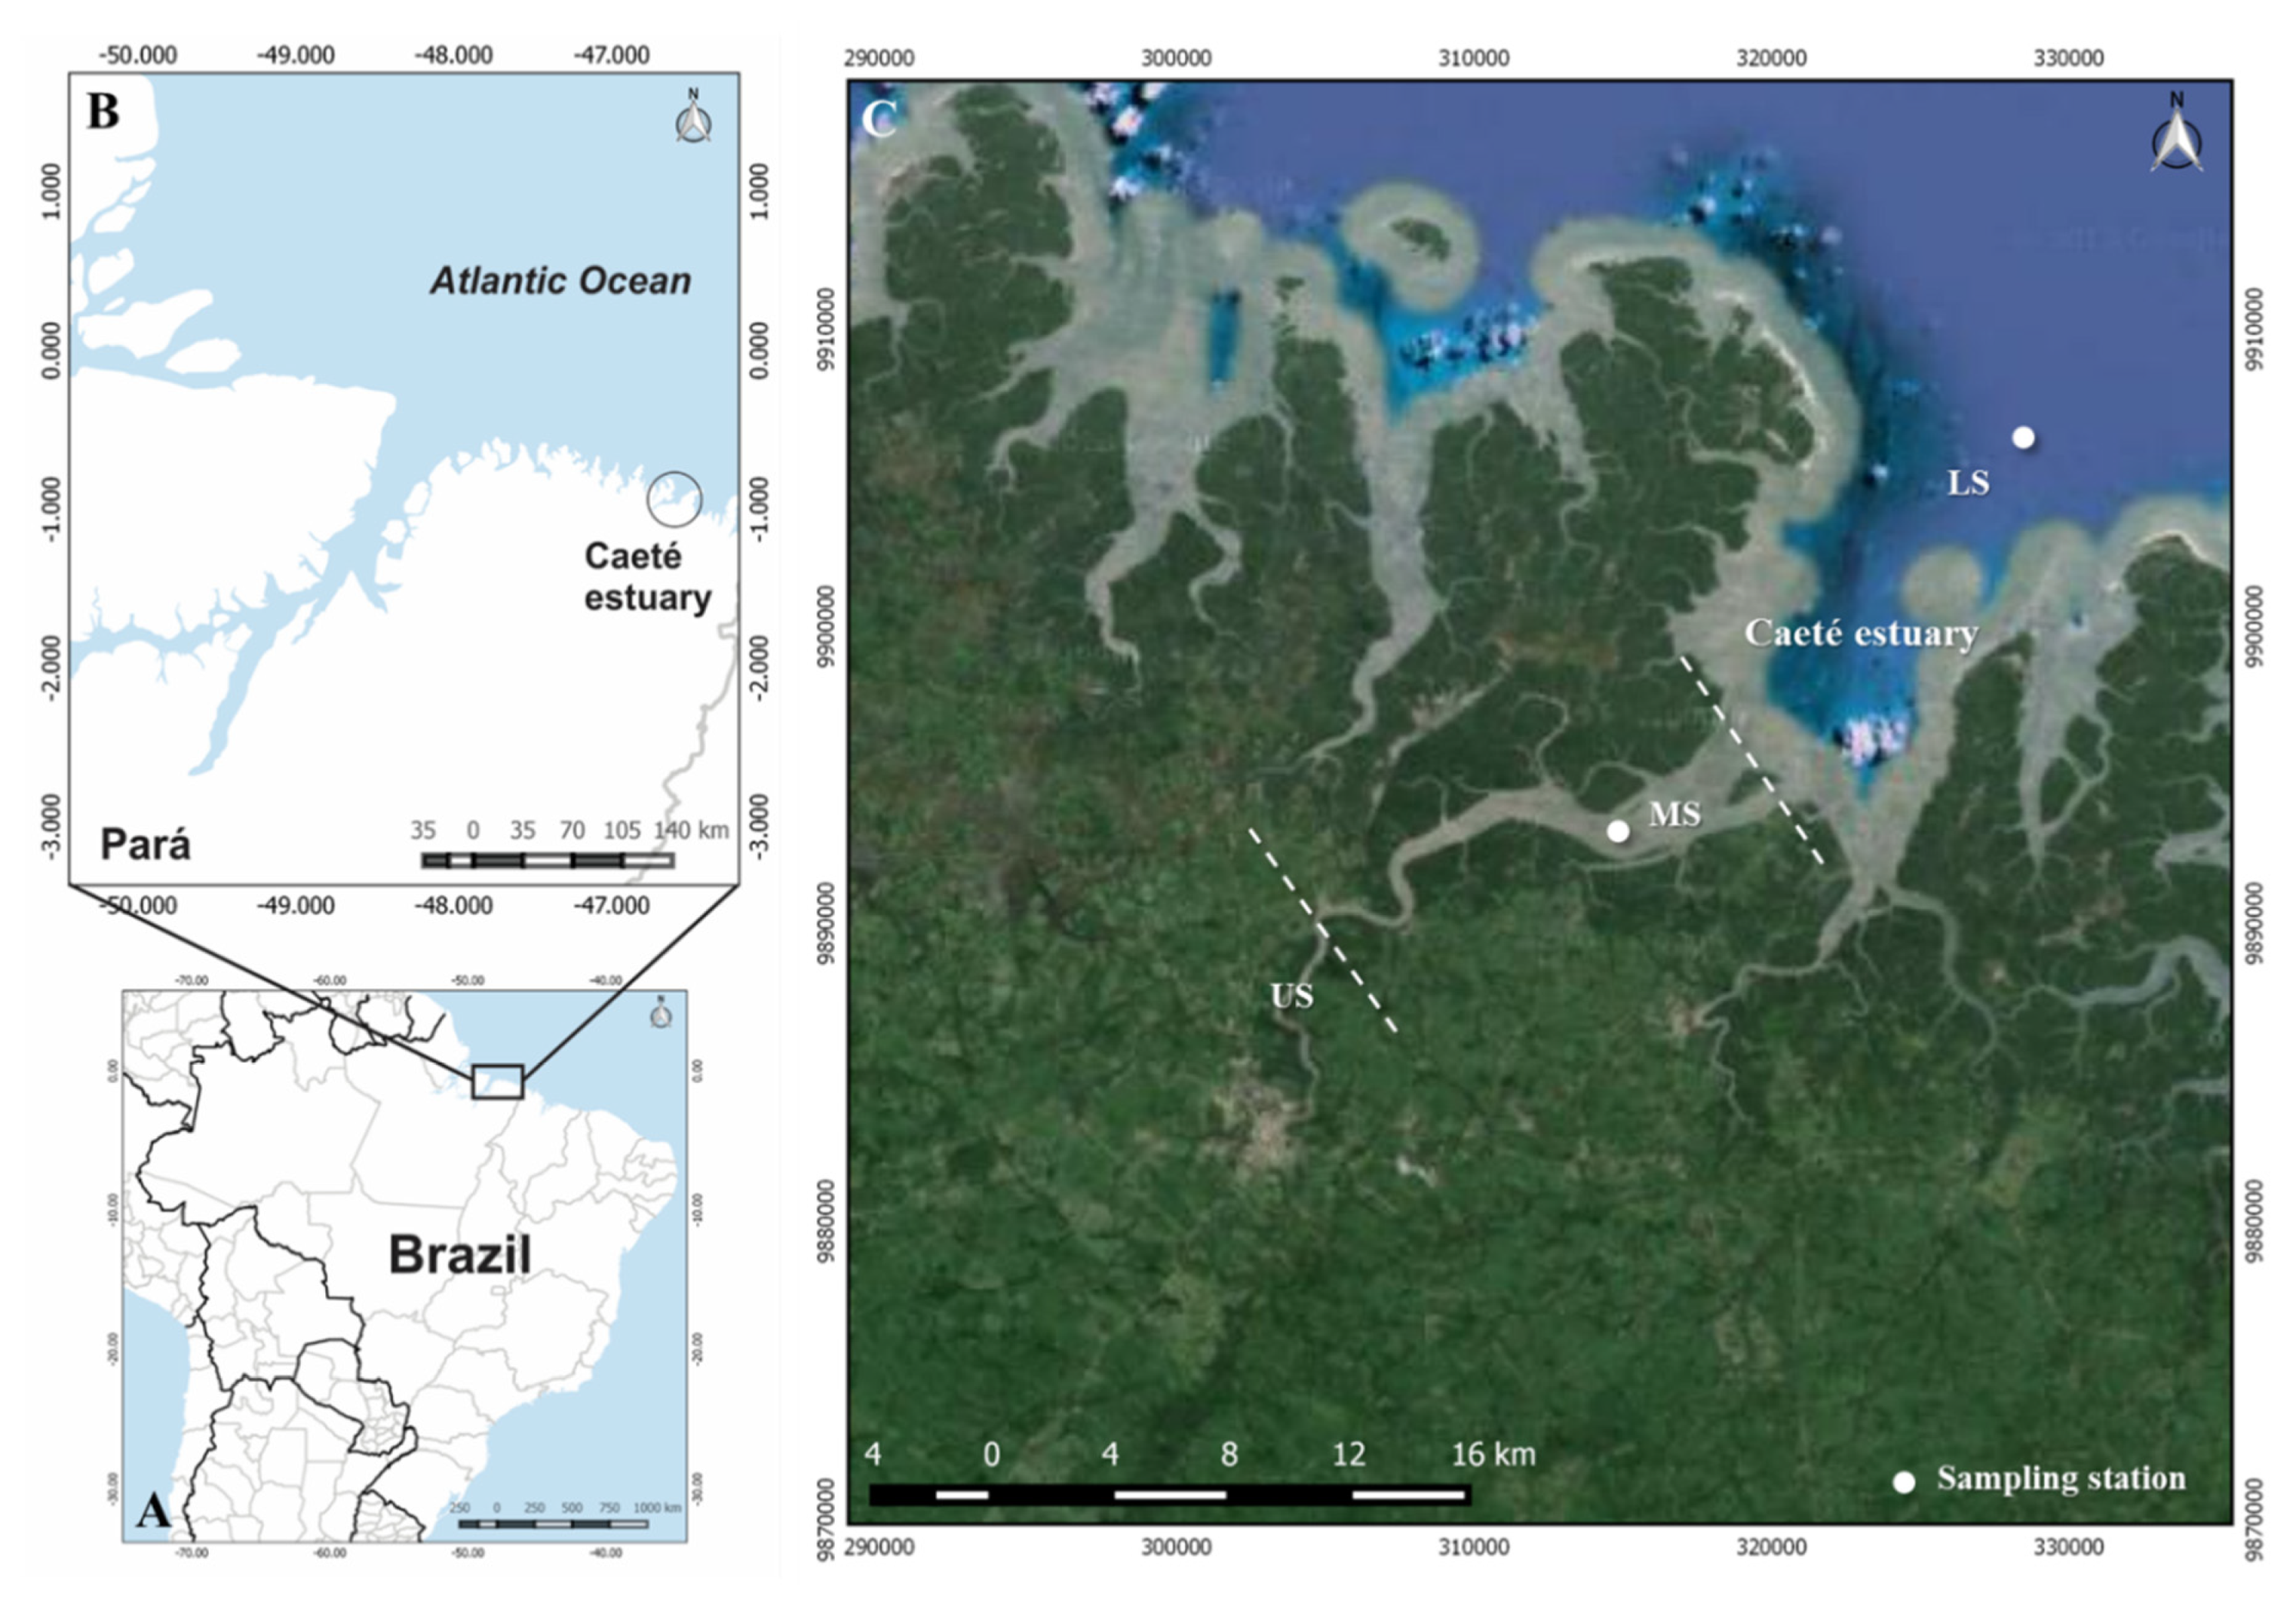
The Caeté estuary (
Figure 1) is located in northeastern Pará, about 150 km southeast of the mouth of the Amazon River, and forms the lower portion of the Caeté basin. This estuary is set within one of the world’s largest continuous tracts of mangrove forest, which covers an area of 8900 km
2. The basin of the Caeté estuary has an area of 220 km
2; (Wolff et al, 2000), of which, approximately 180 km
2; is covered by mangrove forest (Krause et al., 2001). This forest is flooded fortnightly, during the spring tides, and plays an important role in the nutrient profile of the adjacent coastal waters (Lara and Dittmar, 1999).
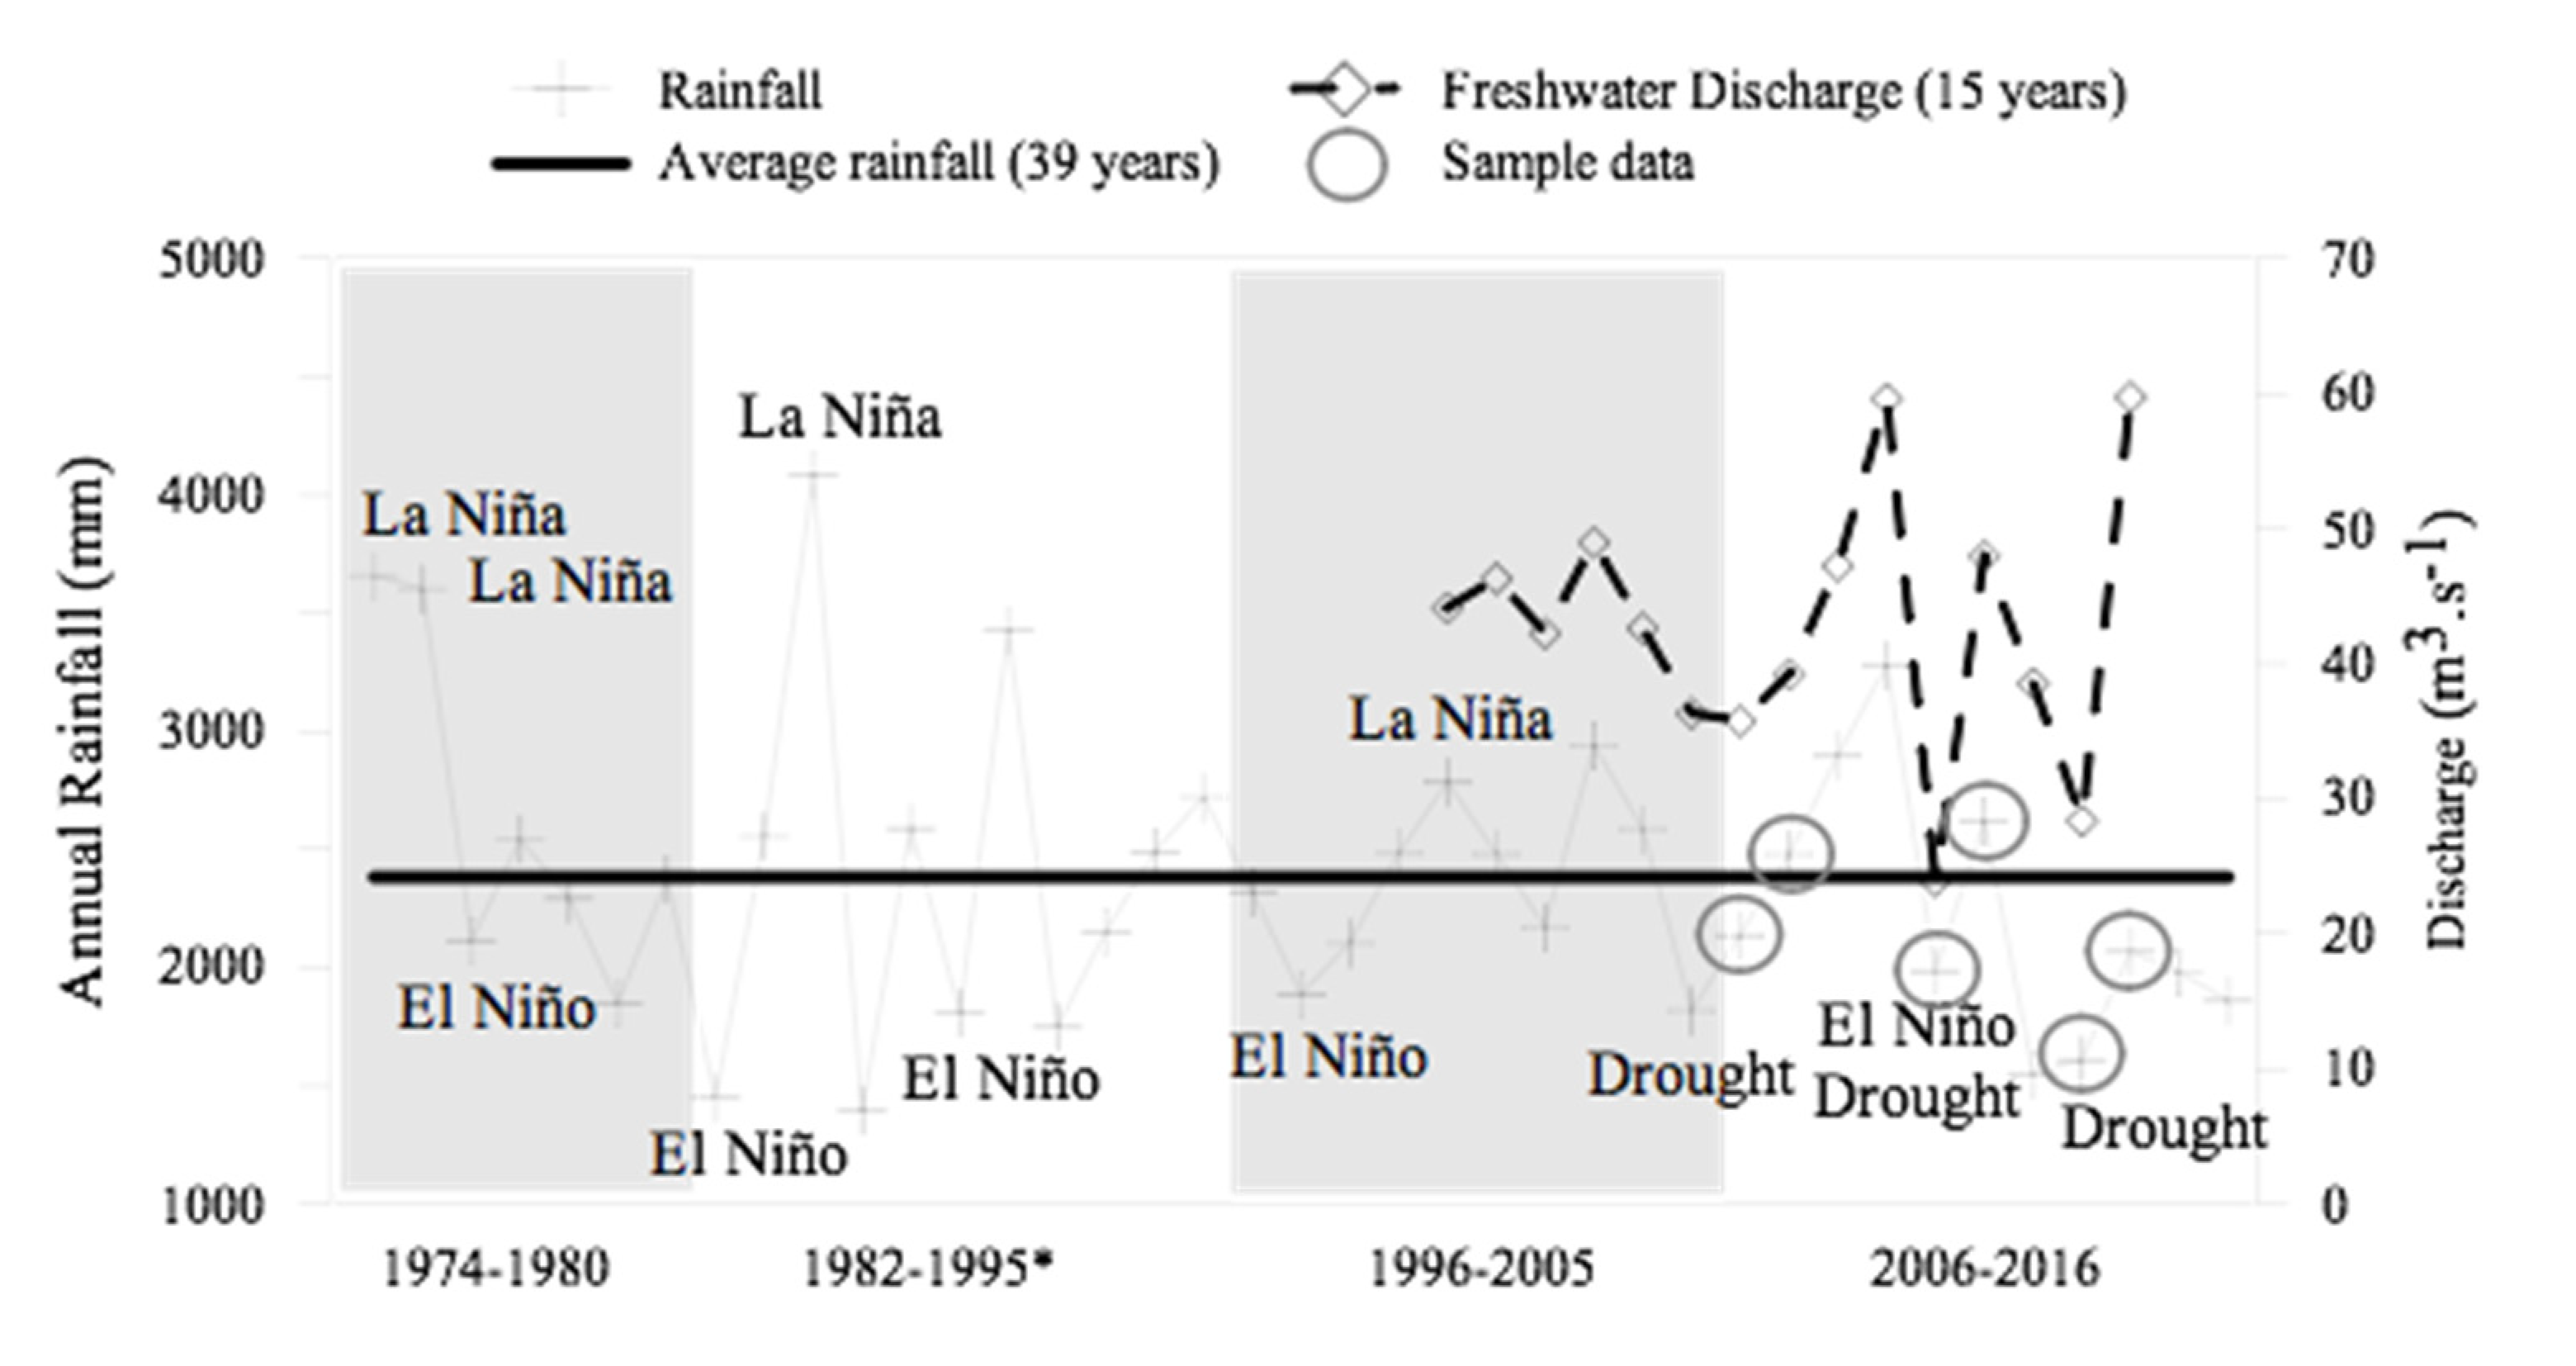
Based on a 39-year data series, the total annual rainfall in the study area ranges between 1400 and 4100 mm (
Figure 2). In the study region, more than 80% of the total annual precipitation falls during the first half of the year, between January and July (the rainy season), when monthly rainfall exceeds 100 mm. The dry season is typically between August and December, and normally accounts for less than 20% of total annual rainfall.
The Caeté River and its tributaries are the main source of the freshwater discharge into the Caeté estuary. Based on a 15-year data series, the mean annual freshwater discharge of the Caeté ranges between 23.9 m
3 s
-1 and 59.7 m
3 s
-1 (
Figure 2). In a typical year, around 70% of the total annual discharge is recorded during the rainy season, peaking in March, April and May. By contrast, October, November, and December are the driest months.
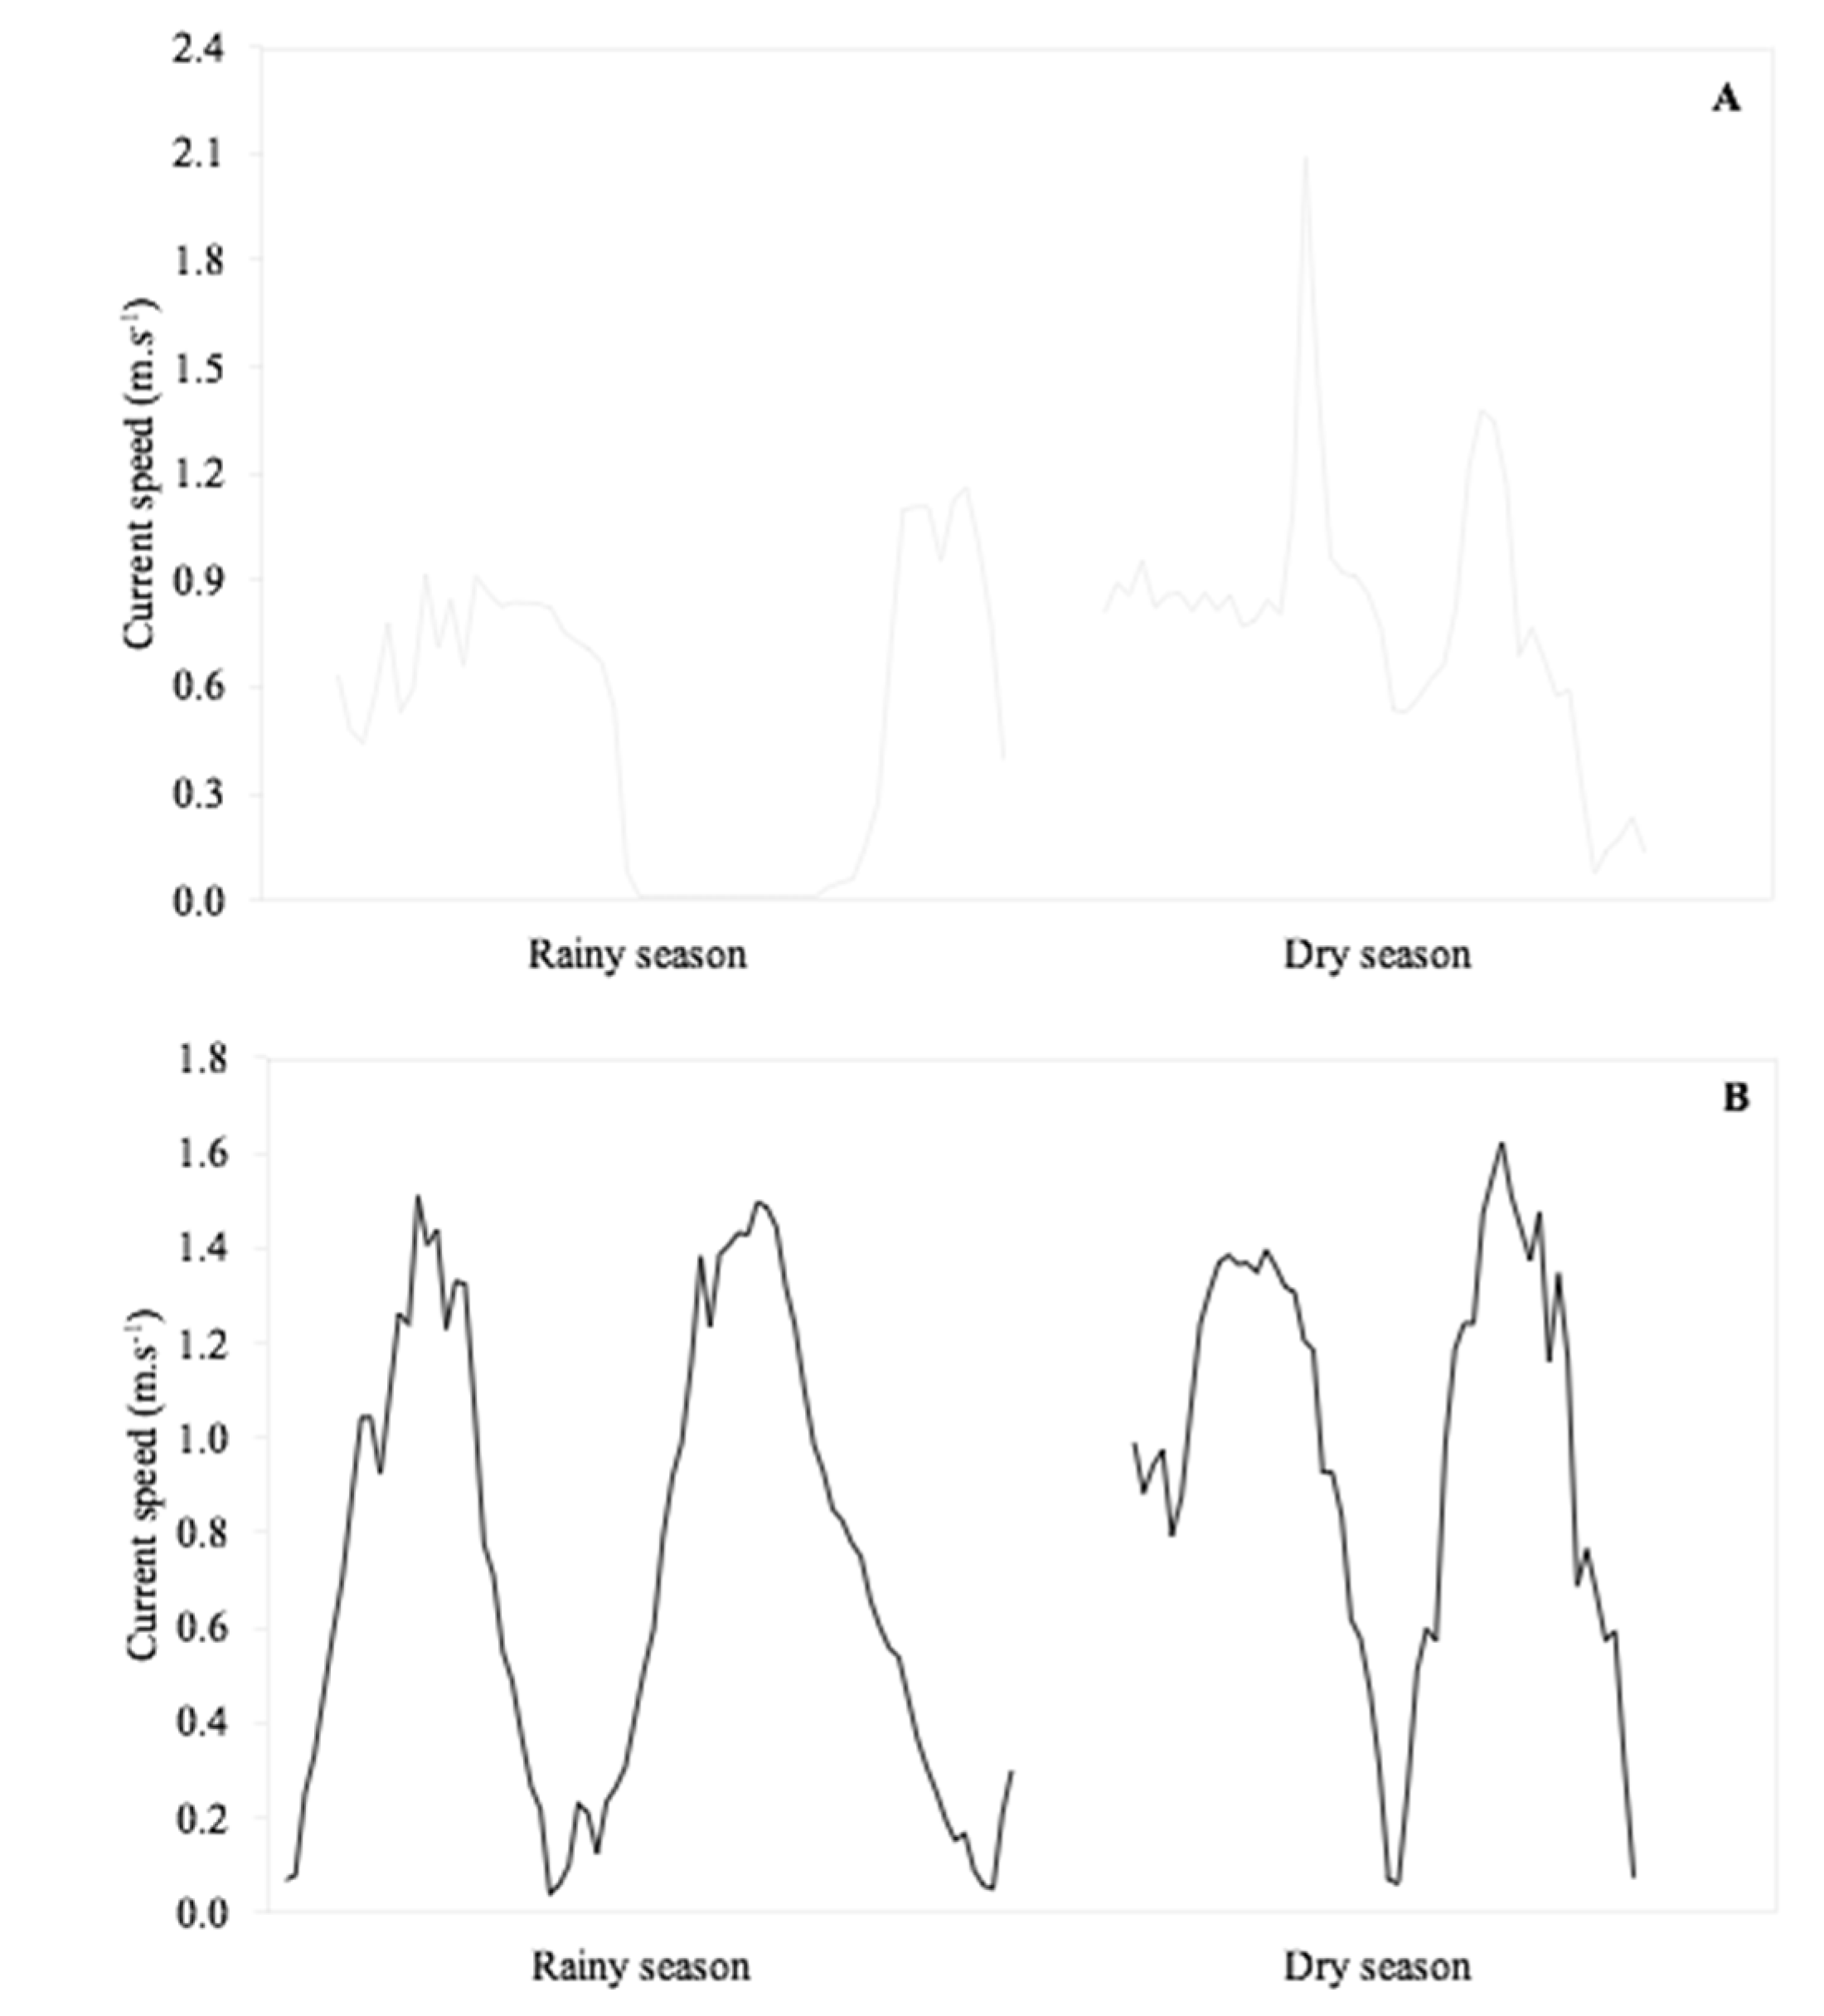
The Caeté estuary is characterized by high levels of hydrodynamic energy. Local tides are semidiurnal and asymmetric, ranging between 2 m and 4 m during the neap tides and from 4 m to 6 m during spring tides. Tidal current speeds are higher during spring tides, and also present a seasonal pattern. During the rainy season, the ebb flow is more pronounced, peaking at around 1.2 m s
-1 in the middle sector of the estuary, and 1 5 m.s
-1 in the lower sector. During the dry season, the influence of marine forces increases and fluvial discharge decreases, contributing to stronger flood tide currents, of around 1.5 m s
-1 and 2.0 m s
-1 in the middle and lower sectors, respectively. During neap tides, current speeds usually oscillate between 0.6 m s
-1 and 0.7 m s
-1 in both dry and rainy season in all sectors monitored (
Figure 3). The maximum tidal prism recorded during neap tides was 72 x 10
6 m
3 (Monteiro et al., 2016a, 2016b).
The basin of the Caeté estuary has approximately 80,800 inhabitants (IBGE, 2015), the majority (90%) of which are resident in the town of Bragança, on the margins of either the Caeté estuary or the Cereja River, which flow into the Caeté estuary. A number of smaller communities are found in the middle and lower sectors of the estuary, with a total population of approximately 8,259 inhabitants (Guimarães et al., 2009).
The trophic status of the Caeté estuary is determined by the combined effects of the presence of the mangrove forest, rainfall levels, freshwater discharge, and physical and anthropogenic factors. These variables act together as an important regulator of water quality through the control of trophic and microbiological conditions (Pereira et al., 2010; Monteiro et al., 2016a; Sousa et al., 2016).
3. Data and Methods
To understand the functioning of the Caeté estuary, data were collected on rainfall and freshwater discharge levels, as well as spatial and temporal oscillations in physical-chemical variables during several years under both typical conditions and those forced by extreme climate events. Information on the occurrence of extreme climate events was obtained from the National Oceanic and Atmospheric Administration (NOAA, 2018), and from regional studies (Coelho et al., 2012; Espinoza et al., 2012a; Marengo et al., 2011, 2013b; Marengo and Espinoza, 2015).
The rainfall data were provided by the National Meteorological Institute (INMET), and records of the freshwater discharge of the Caeté River were obtained from the National Waters Agency (ANA). The climate data were recorded for the 39-year period between 1974 and 2016 (except 1981 and 1983), while the hydrological data refer to the 15-year period between 2000 and 2014, and were obtained from the gauge station located approximately 30 km upstream from the middle sector of the Caeté Estuary.
Oceanographic monitoring was used to collect hydrological data at 1.0 m below the surface in the middle and lower sectors of the estuary during the rainy and dry seasons in different years under typical (April and June in 2006 and 2014, and September and October in 2011) and atypical conditions (El Niño: August, October and December in 2006, and February in 2007; Drought: September and November in 2010; June, October and December in 2013; La Niña: December, 2010; January, March, May, and July in 2011).
Data were collected using CTDs equipped with sensors that measured salinity, pH, dissolved oxygen, and turbidity at 10-second intervals for 5 minutes. Niskin bottles (General Oceanics) were used to obtain water samples for the analysis of dissolved inorganic nutrients (nitrite, nitrate-, ammonium, phosphate- and silicate) and chlorophyll a concentrations. A total of 80 water samples were collected during the flood tidal cycle. In the laboratory, dissolved inorganic nutrient concentrations were determined according to Strickland and Parsons (1972) and Grasshoff et al. (1983), and chlorophyll a was extracted and determined following Parsons and Strickland (1963) and UNESCO (1966).
The trophic status of the estuary was determined using the TRIX index proposed by Vollenweider et al. (1998): TRIX = (log10[ Chl a x ǀDO2%ǀ x DIN x DIP] + k)/m, where Chl a is the chlorophyll a concentration, DO2% is the oxygen saturation rate, DIN is the dissolved inorganic nitrogen concentration (NO2- + NO3- + NH4+), DIP is the concentration of dissolved inorganic phosphorus (PO4-), and k and m are constants with values of 1.5 and 1.2, respectively. The TRIX index provides scores of 0–10, which are assigned to four classes: (i) 0–4: low eutrophication and high water quality; (ii) > 4–5: moderate eutrophication and good water quality; (iii) > 5–6: high eutrophication and bad water quality and, (iv) > 6–10: elevated eutrophication and poor water quality. As the area of the present study is a relatively undisturbed natural environment, the terms “poor” and “bad” water quality classes were not applied here.
The physical and chemical data were analyzed spatiotemporally by sector (middle and lower estuary), season (dry and rainy), and climate event (Drought, El Niño, and La Niña). The assumptions of data normality and the homogeneity of variances were evaluated using Lilliefors’ test (Conover, 1971) and Bartlett’s Chi-square (Sokal and Rohlf, 1969), respectively. When the data were not normally distributed or the variance was not homogeneous, the data were log (x + 1) transformed to produce a near-normal or near-homogeneous distribution. Parametric tests (Student’s t-test) were used to assess whether the hydrological parameters varied significantly by sector, season or climate event. For data that remained non-normal or heterogeneous, even after transformation, the non-parametric Mann-Whitney U and Kruskal-Wallis H tests were applied. Environmental variables were also evaluated using a Spearman rank correlation analysis. A Principal Components Analysis (PCA) was used to verify the relationship between rainfall and hydrological parameters. All these analyses were run in STATISTICA 8, with a significance level of p < 0.05.
4. Results
This section presents the data on natural forcing and the response of the system response. Firstly, the climatological (rainfall levels) conditions and freshwater discharge recorded during each period are presented. Secondly, the hydrological conditions and trophic status of the estuary during the respective periods are also presented.
4.1. Climatological Aspects
4.1.1. Typical Conditions
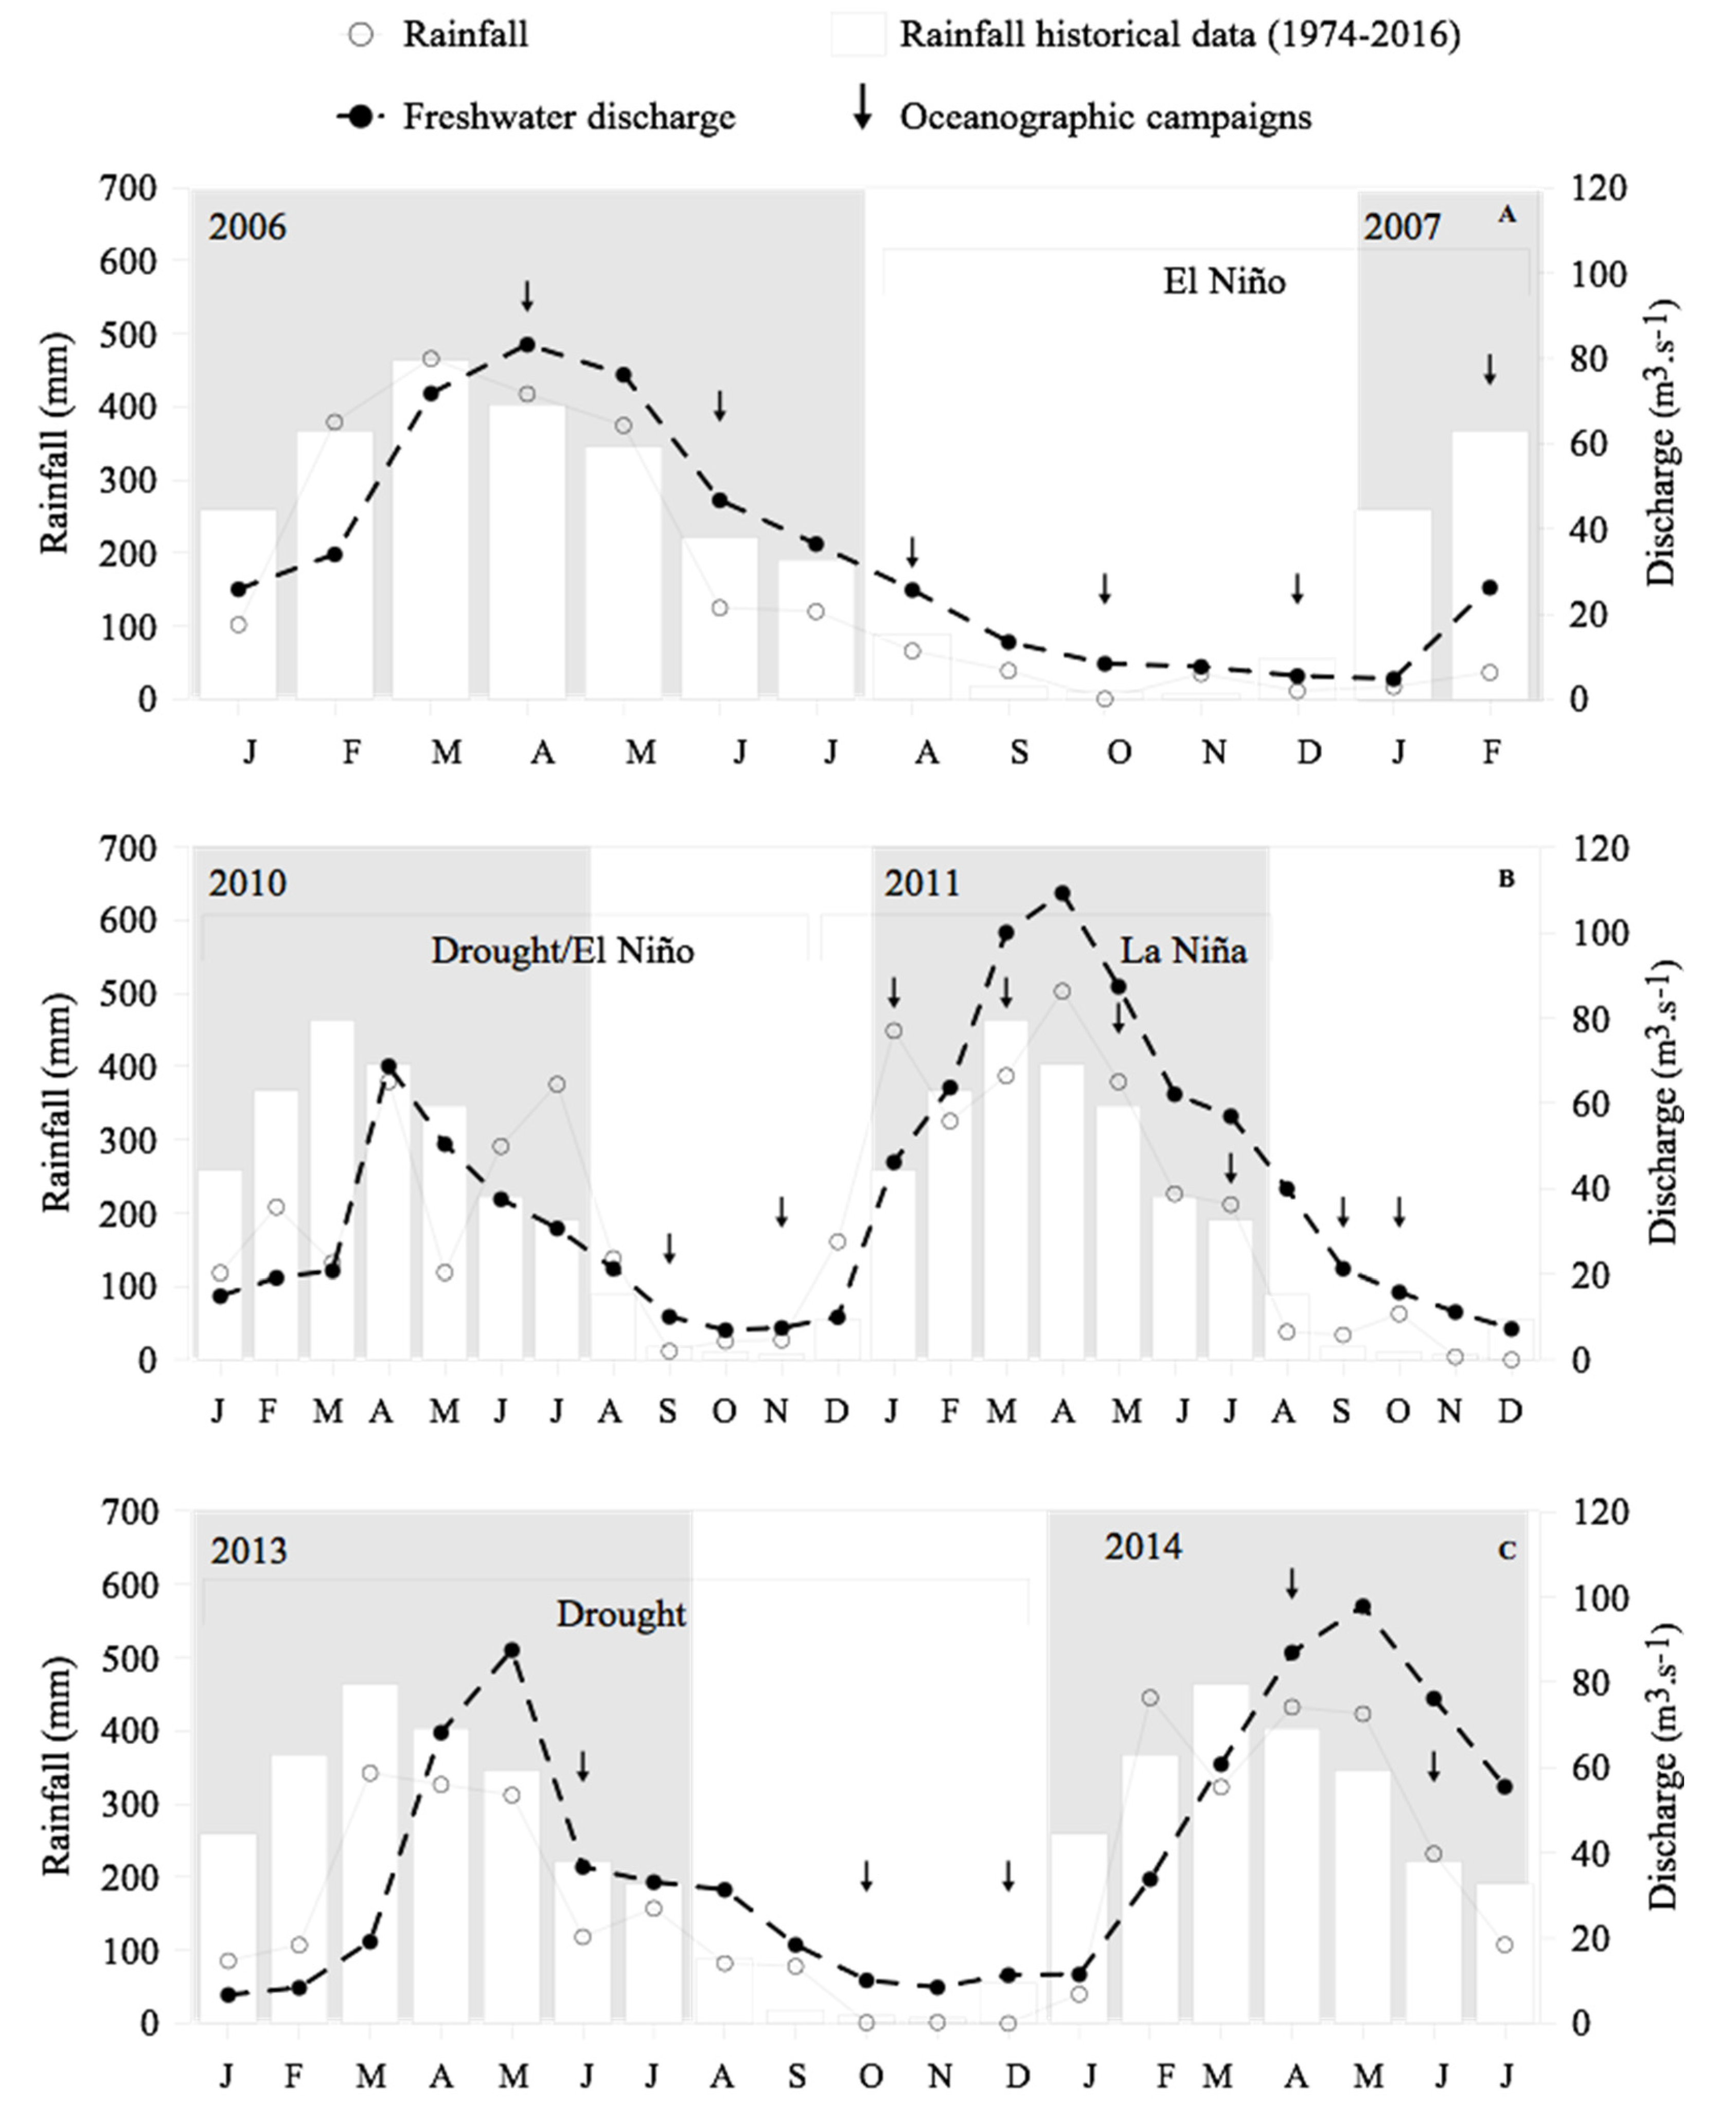
As described above, the rainfall recorded in April and June in 2006 and 2014 was typical of the expected rainy season conditions, and the precipitation recorded in September and October 2011 was also typically of the dry season. In the rainy season of 2006, total rainfall between January and July 2006 was 2000 mm, corresponding to 90% of the total precipitation recorded in this year. The rainfall recorded during the year was similar to the historical mean. The highest monthly rainfall (465 mm) was recorded in March 2006 (
Figure 4A). The freshwater discharge of the Caeté River in 2006 was also typical of the historical mean, with an average of 53 m
3 s
-1 in the rainy season, corresponding to 81% of the total annual discharge. The high rainfall levels recorded in February and March provoked a peak in the discharge (83 m
3 s
-1) in April (
Figure 4A).
In the dry season of 2011, the total rainfall recorded between August and December was approximately 140 mm, corresponding to 5% of the annual total (
Figure 4B). At the beginning of the dry season, monthly precipitation was around 70 mm, but at the end of the period, negligible values (less than 5 mm) were recorded. These low rainfall levels were reflected in reduced freshwater discharge. The mean discharge recorded in this period was 19 m
3 s
-1, with monthly levels of between 11 m
3 s
-1 and 40 m
3 s
-1 (
Figure 4B).
In the rainy season of 2014, total rainfall was 2070 mm, similar to the historical mean, and once again, corresponded to approximately 90% of the total annual rainfall. A monthly rainfall of between 300 mm and 500 mm was recorded in February-May (
Figure 4C), resulting in high freshwater discharge, at a mean level of 60 m
3 s
-1, and peaking at 97 m
3 s
-1 in May, following the heavy rains of the preceding months (
Figure 4C).
4.1.2. Atypical Conditions
El Niño Event: Dry Season (2006) and Rainy Season (2007)
An El Niño event occurred between August 2006 and February 2007. Despite this, rainfall levels recorded during the dry season of 2006 were similar to the historical mean, at 153 mm, which corresponds to around 10% of the annual total (
Figure 4A). The mean freshwater discharge was 12 m
3 s
-1, only slightly lower than expected for this season (
Figure 4A). In this season, then, the effects of El Niño or Drought events are less pronounced due to the prevailing conditions, i.e., low rainfall rates, primarily observed even in typical years. During the rainy season of 2007, however, the El Niño event appeared to have a clear impact on rainfall levels, given that only 57 mm was recorded in January and February, corresponding to 8% of the expected rainfall for this period (
Figure 4A). Mean freshwater discharge was approximately 15 m
3 s
-1, 60% lower than expected for this period.
La Niña Event: Dry Season (2010) Rainy Season (2011)
The La Niña event began in December 2010 persisted until July of 2011. During the first month, rainfall was 100% higher than usual, reaching 160 mm. The total rainfall recorded during this event was approximately 2200 mm, 15% higher than that expected for this period. Monthly rainfall peaked at 503 mm in April. This increase in rainfall levels was associated with an increase of 30% in the freshwater discharge recorded during this period, which averaged around 75 m
3 s
-1 (
Figure 4B).
Drought Event: Dry Season (2010) and Rainy and Dry Seasons (2013)
A Drought event was recorded in 2010. Despite this, during the second semester, when the oceanographic campaigns began, the rainfall rate was higher than expected, due to the atypical pattern recorded in July and August, which resulted in a total rainfall of around 515 mm. However, the freshwater discharge did decline considerably, to 14 m3 s-1, reflecting the low rainfall rate recorded in the first semester, 40% lower than expected.
The next Drought began in January 2012 and lasted until 2013, with total annual rainfall of 1552 mm and 1612 mm, respectively. These are the lowest annual rainfall values recorded over the past 30 years and represent only 65% of the historical mean for the Bragança region. In June 2013, when the oceanographic campaign was conducted, total rainfall was only 118 mm, well below the value expected for this month (
Figure 4C). Despite this Drought event, the typical seasonal pattern was upheld, with 80% of the total annual rainfall being recorded during the rainy season. During the dry season, oceanographic campaigns were conducted in October and December, when rainfall was negligible, being less than 1 mm (
Figure 4C).
The mean freshwater discharge of the Caeté River in 2013 was 28 m
3.s
-1, well below the historical mean of 40 m
3 s
-1 (
Figure 4C). This reflected the reduced total rainfall recorded in this year. During the rainy season the mean discharge was 37 m
3 s
-1, compared with 15 m
3 s
-1 during the dry season.
4.2. Hydrological Aspects
Spatial and temporal variation in hydrological parameters and trophic status reflect the balance of the freshwater discharge and the incursion of marine water into the estuary. Here, the hydrological conditions recorded in the middle and lower sectors of the Caeté Estuary are presented for the different monitoring periods.
Overall, the highest salinity and pH values were recorded when rainfall reached its lowest levels,
i.e. during the dry season, El Niño, and Drought events. Salinity was thus correlated negatively with rainfall in both the middle (
rs = -0.8;
p < 0.05) and lower sectors (
rs = -0.6;
p < 0.05) of the estuary (
Table 1 and
Table 2). In the case of the pH, a negative correlation with rainfall was recorded only in the middle sector (
rs = -0.5;
p < 0.05,
Table 1).
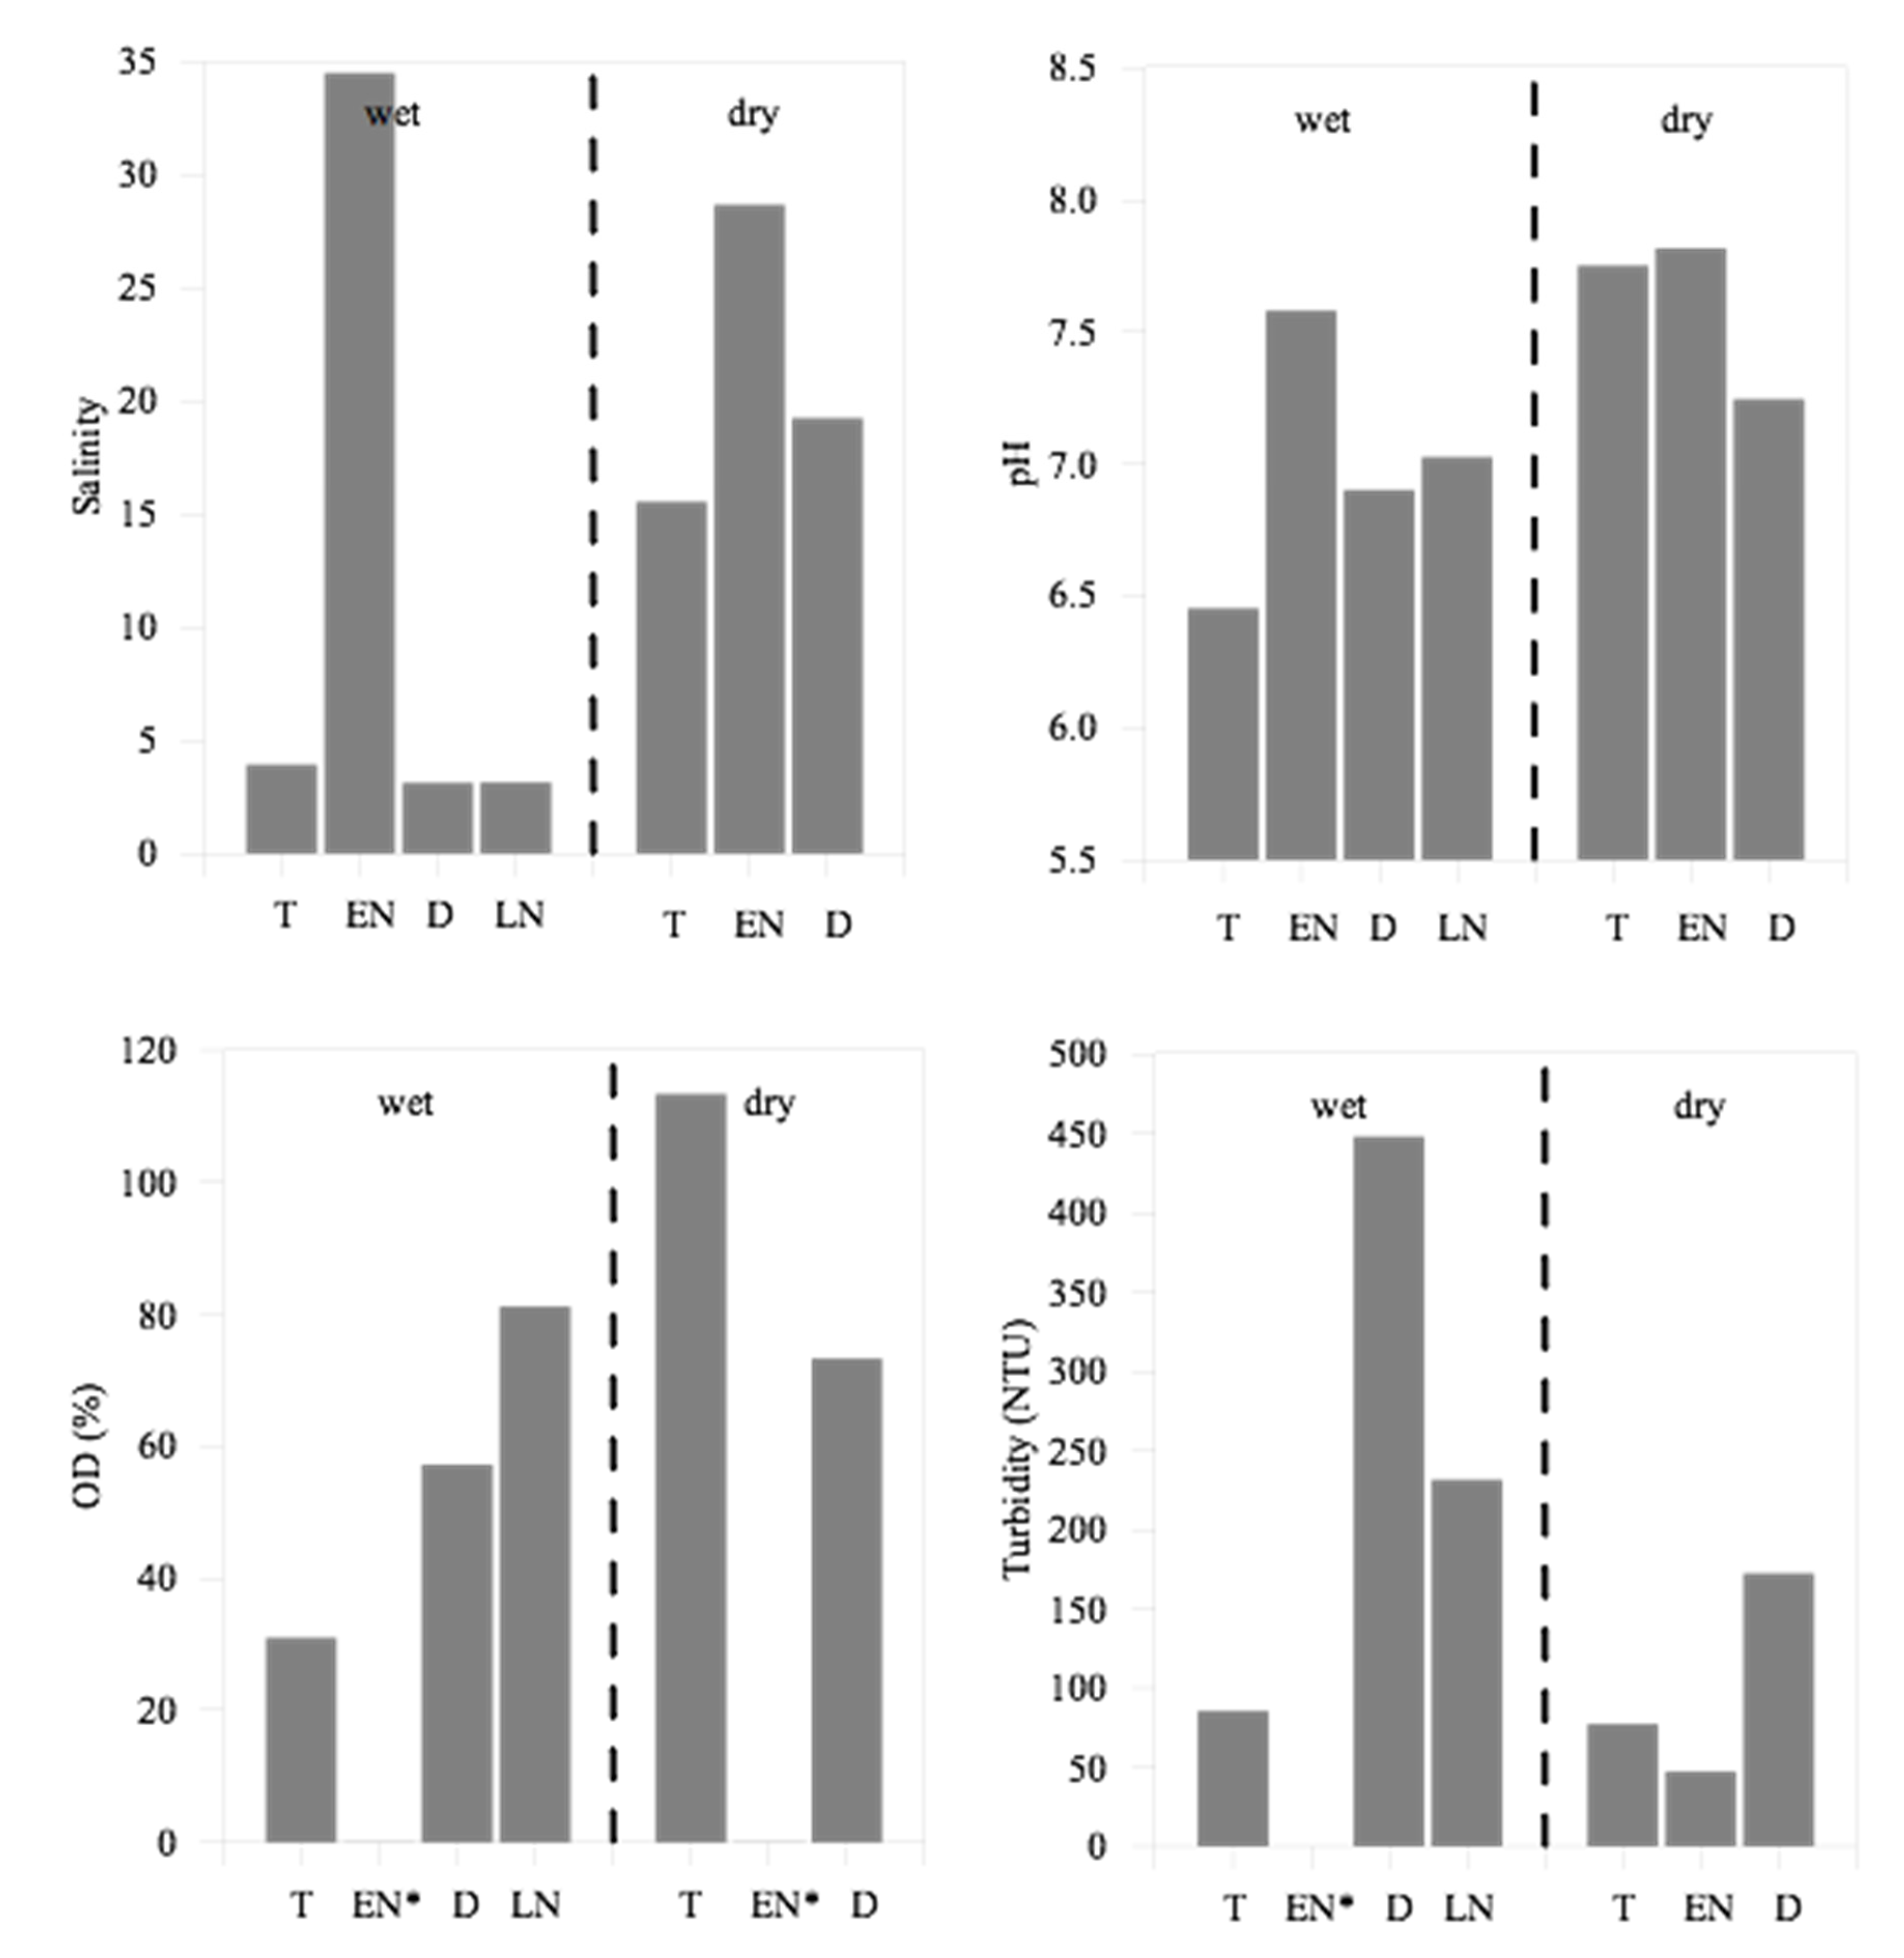
During typical years, salinity in the middle sector is around 4 in the rainy season and 16 in the dry season. Under Drought or El Niño conditions, however, the reduction in rainfall levels and freshwater discharge act synergistically, contributing to significantly more saline (
H = 15.1;
p < 0.001) and alkaline (
H = 14.6;
p < 0.01) waters. Salinity values of over 26 were recorded during both the rainy and the dry seasons. La Niña events had a less pronounced effect on salinity, however, which was little altered, despite the reduction in rainfall levels (
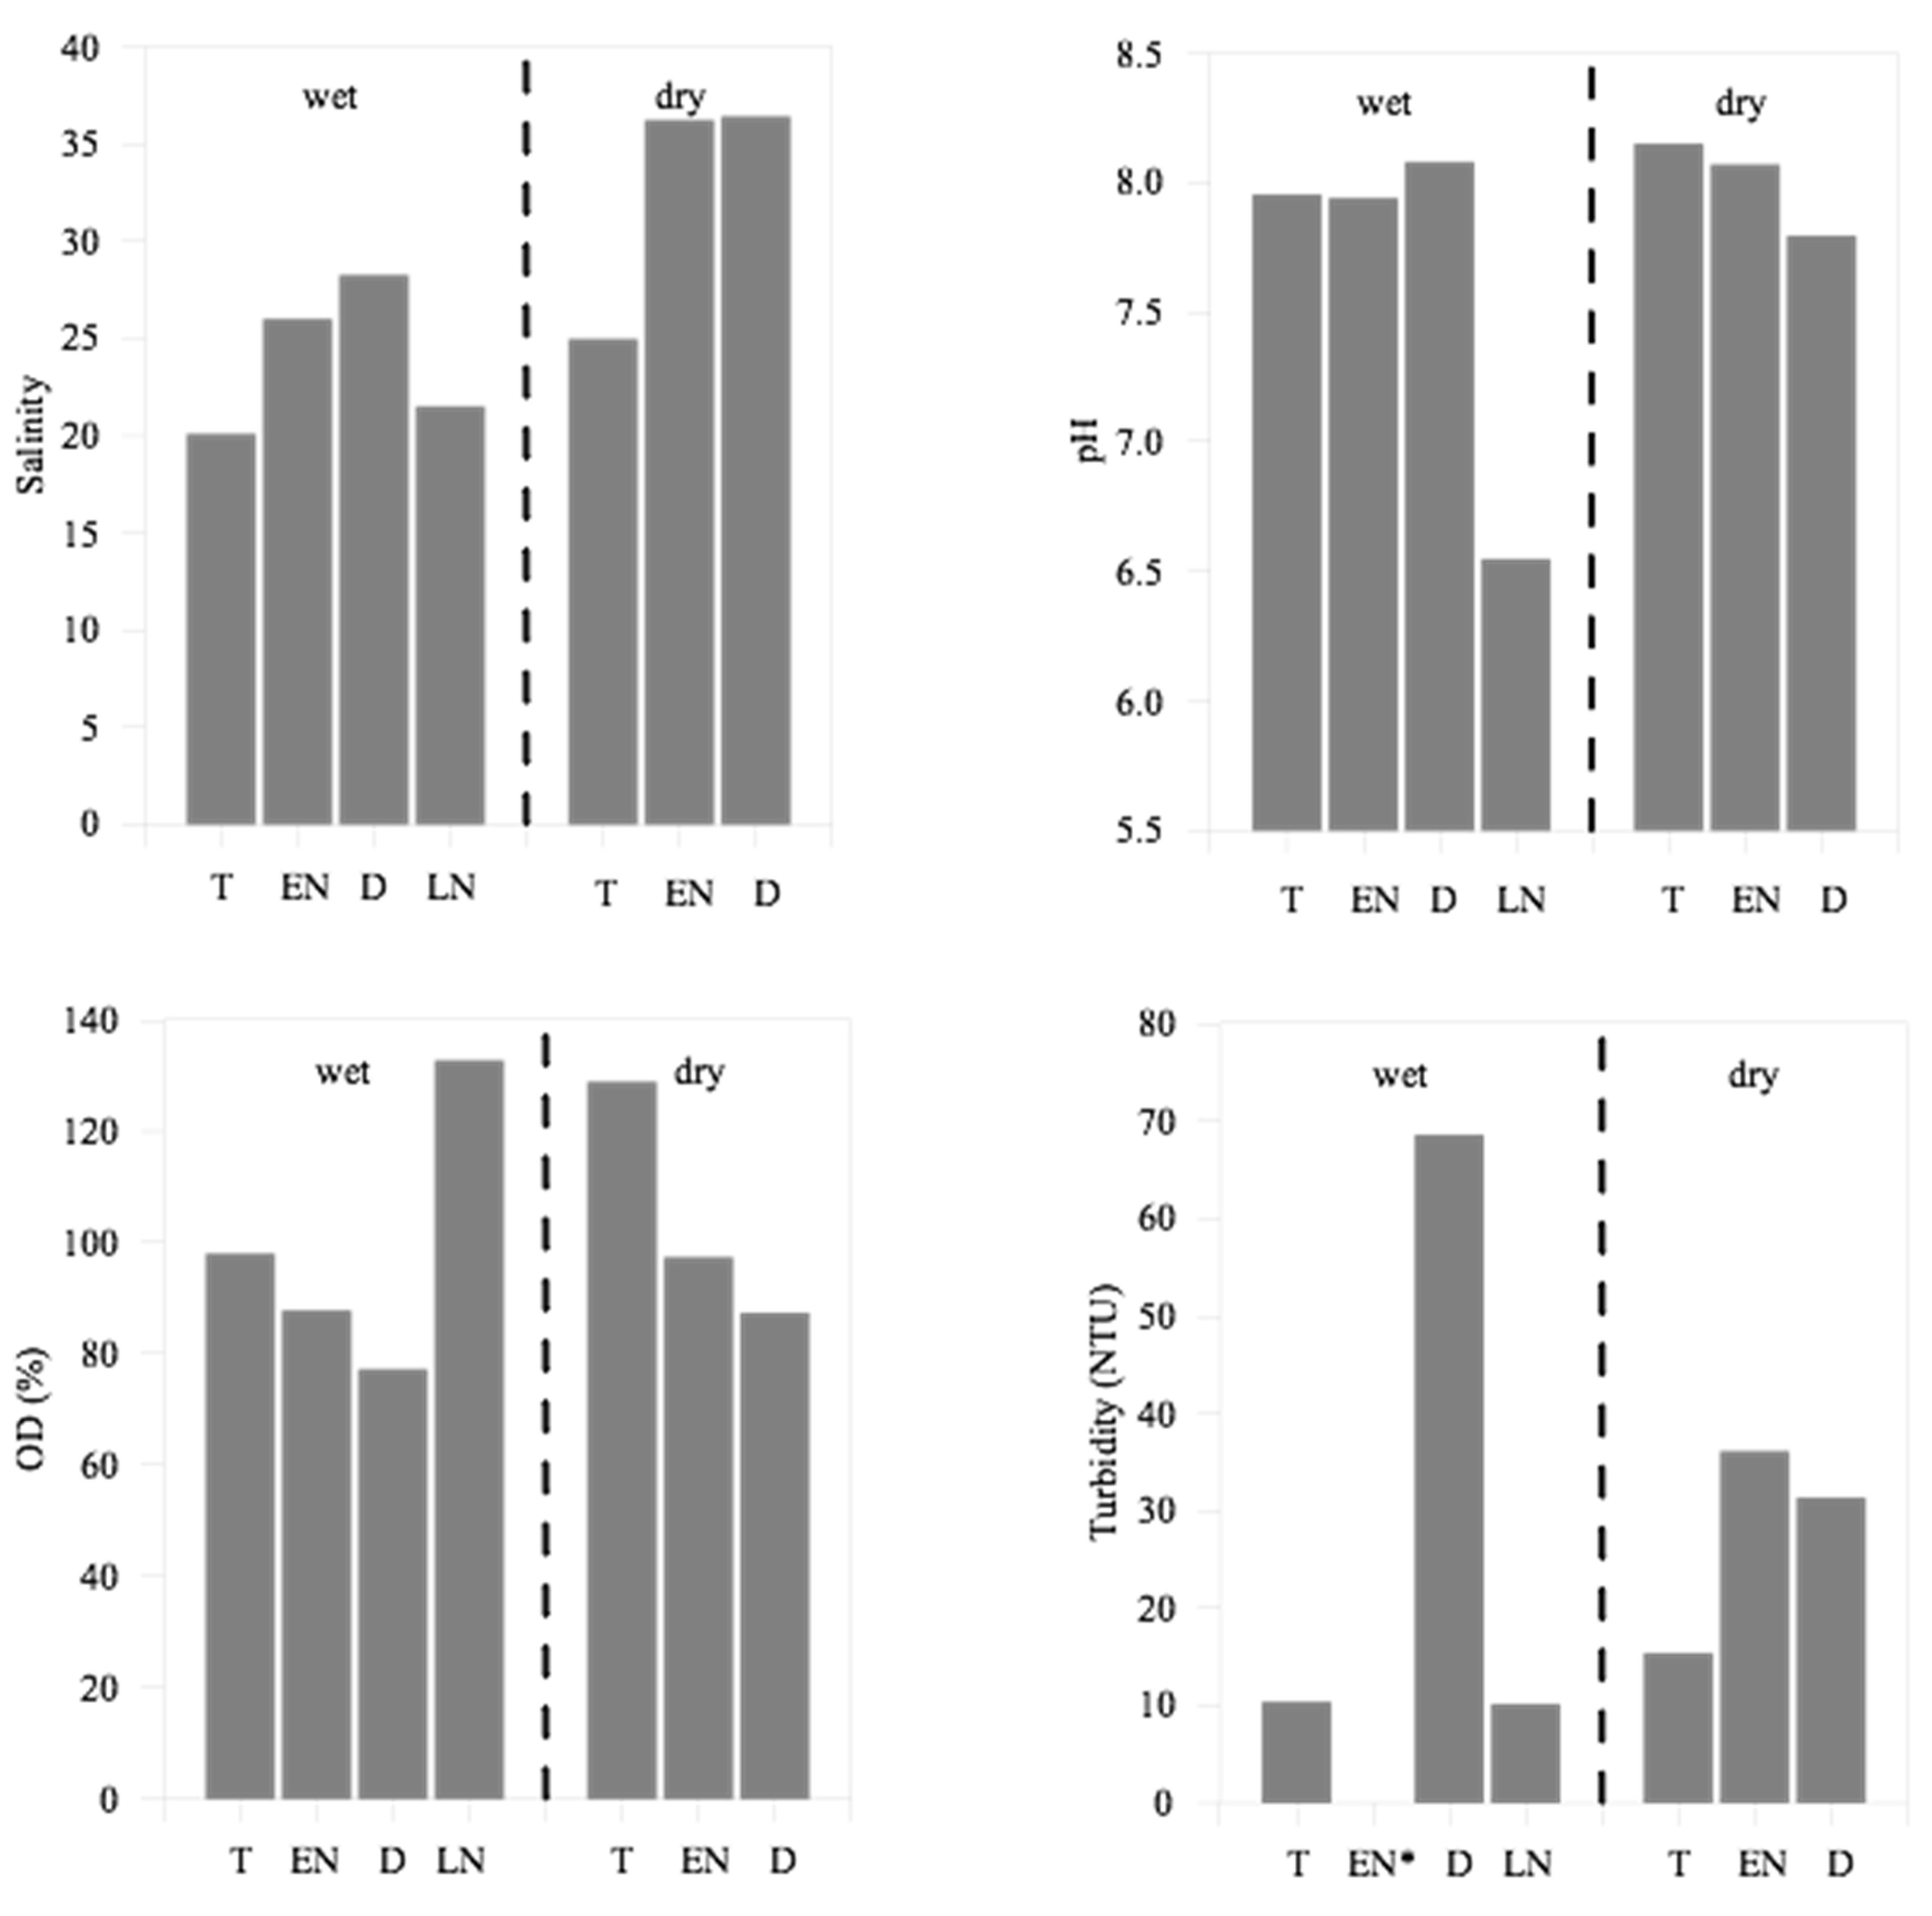
Figure 5). A similar pattern was observed in the lower sector (
Figure 6).
In the middle sector of the estuary, the influence of the freshwater discharge of the Caeté River is more pronounced, resulting in salinity of 3–35 (
U = 68.0;
p = 0.00), pH lower than 7.8 (
U = 88.5;
p = 0.00), and dissolved oxygen saturation usually lower than 100% (
U = 85.0;
p = 0.01,
Figure 5). The lower sector, in turn, was influenced more by the marine waters of the Atlantic Ocean, with salinity of 20–38, a predominantly alkaline pH (usually higher than 7.8), and dissolved oxygen saturation between 87 and 135% (
Figure 6).
Turbidity was correlated negatively with rainfall (
rs = -0.5;
p < 0.05,
Table 2) in the lower sector, and a significant increase was observed in this sector during Drought events (
F = 0.00;
p < 0.001). Drought events occurred mainly during the dry season, when hydrodynamic energy is higher and supports the suspension of sediments in the water column. In the middle sector, where the influence of freshwater discharge is greater, values of 100–440 NTU were recorded (
Figure 5). In the lower sector, turbidity was lower than 100 NTU (
Figure 6).
High turbidity, as observed during Drought events, restricts the penetration of light into the water column, leading to a reduction in the production of oxygen by phytoplankton and the exchange of gases with the atmosphere. An increment in oxygen saturation was observed during La Niña events in both the middle (
H = 12.8;
p < 0.001) and lower (
F = 51.1;
p < 0.01) sectors, probably due to the turbulence at the water surface causing by the more intense river flow. Dissolved oxygen concentrations were saturated primarily in the lower sector (
Figure 5 and
Figure 6), where a negative correlation (
rs = -0.6,
p < 0.05) was found with turbidity (
Table 2).
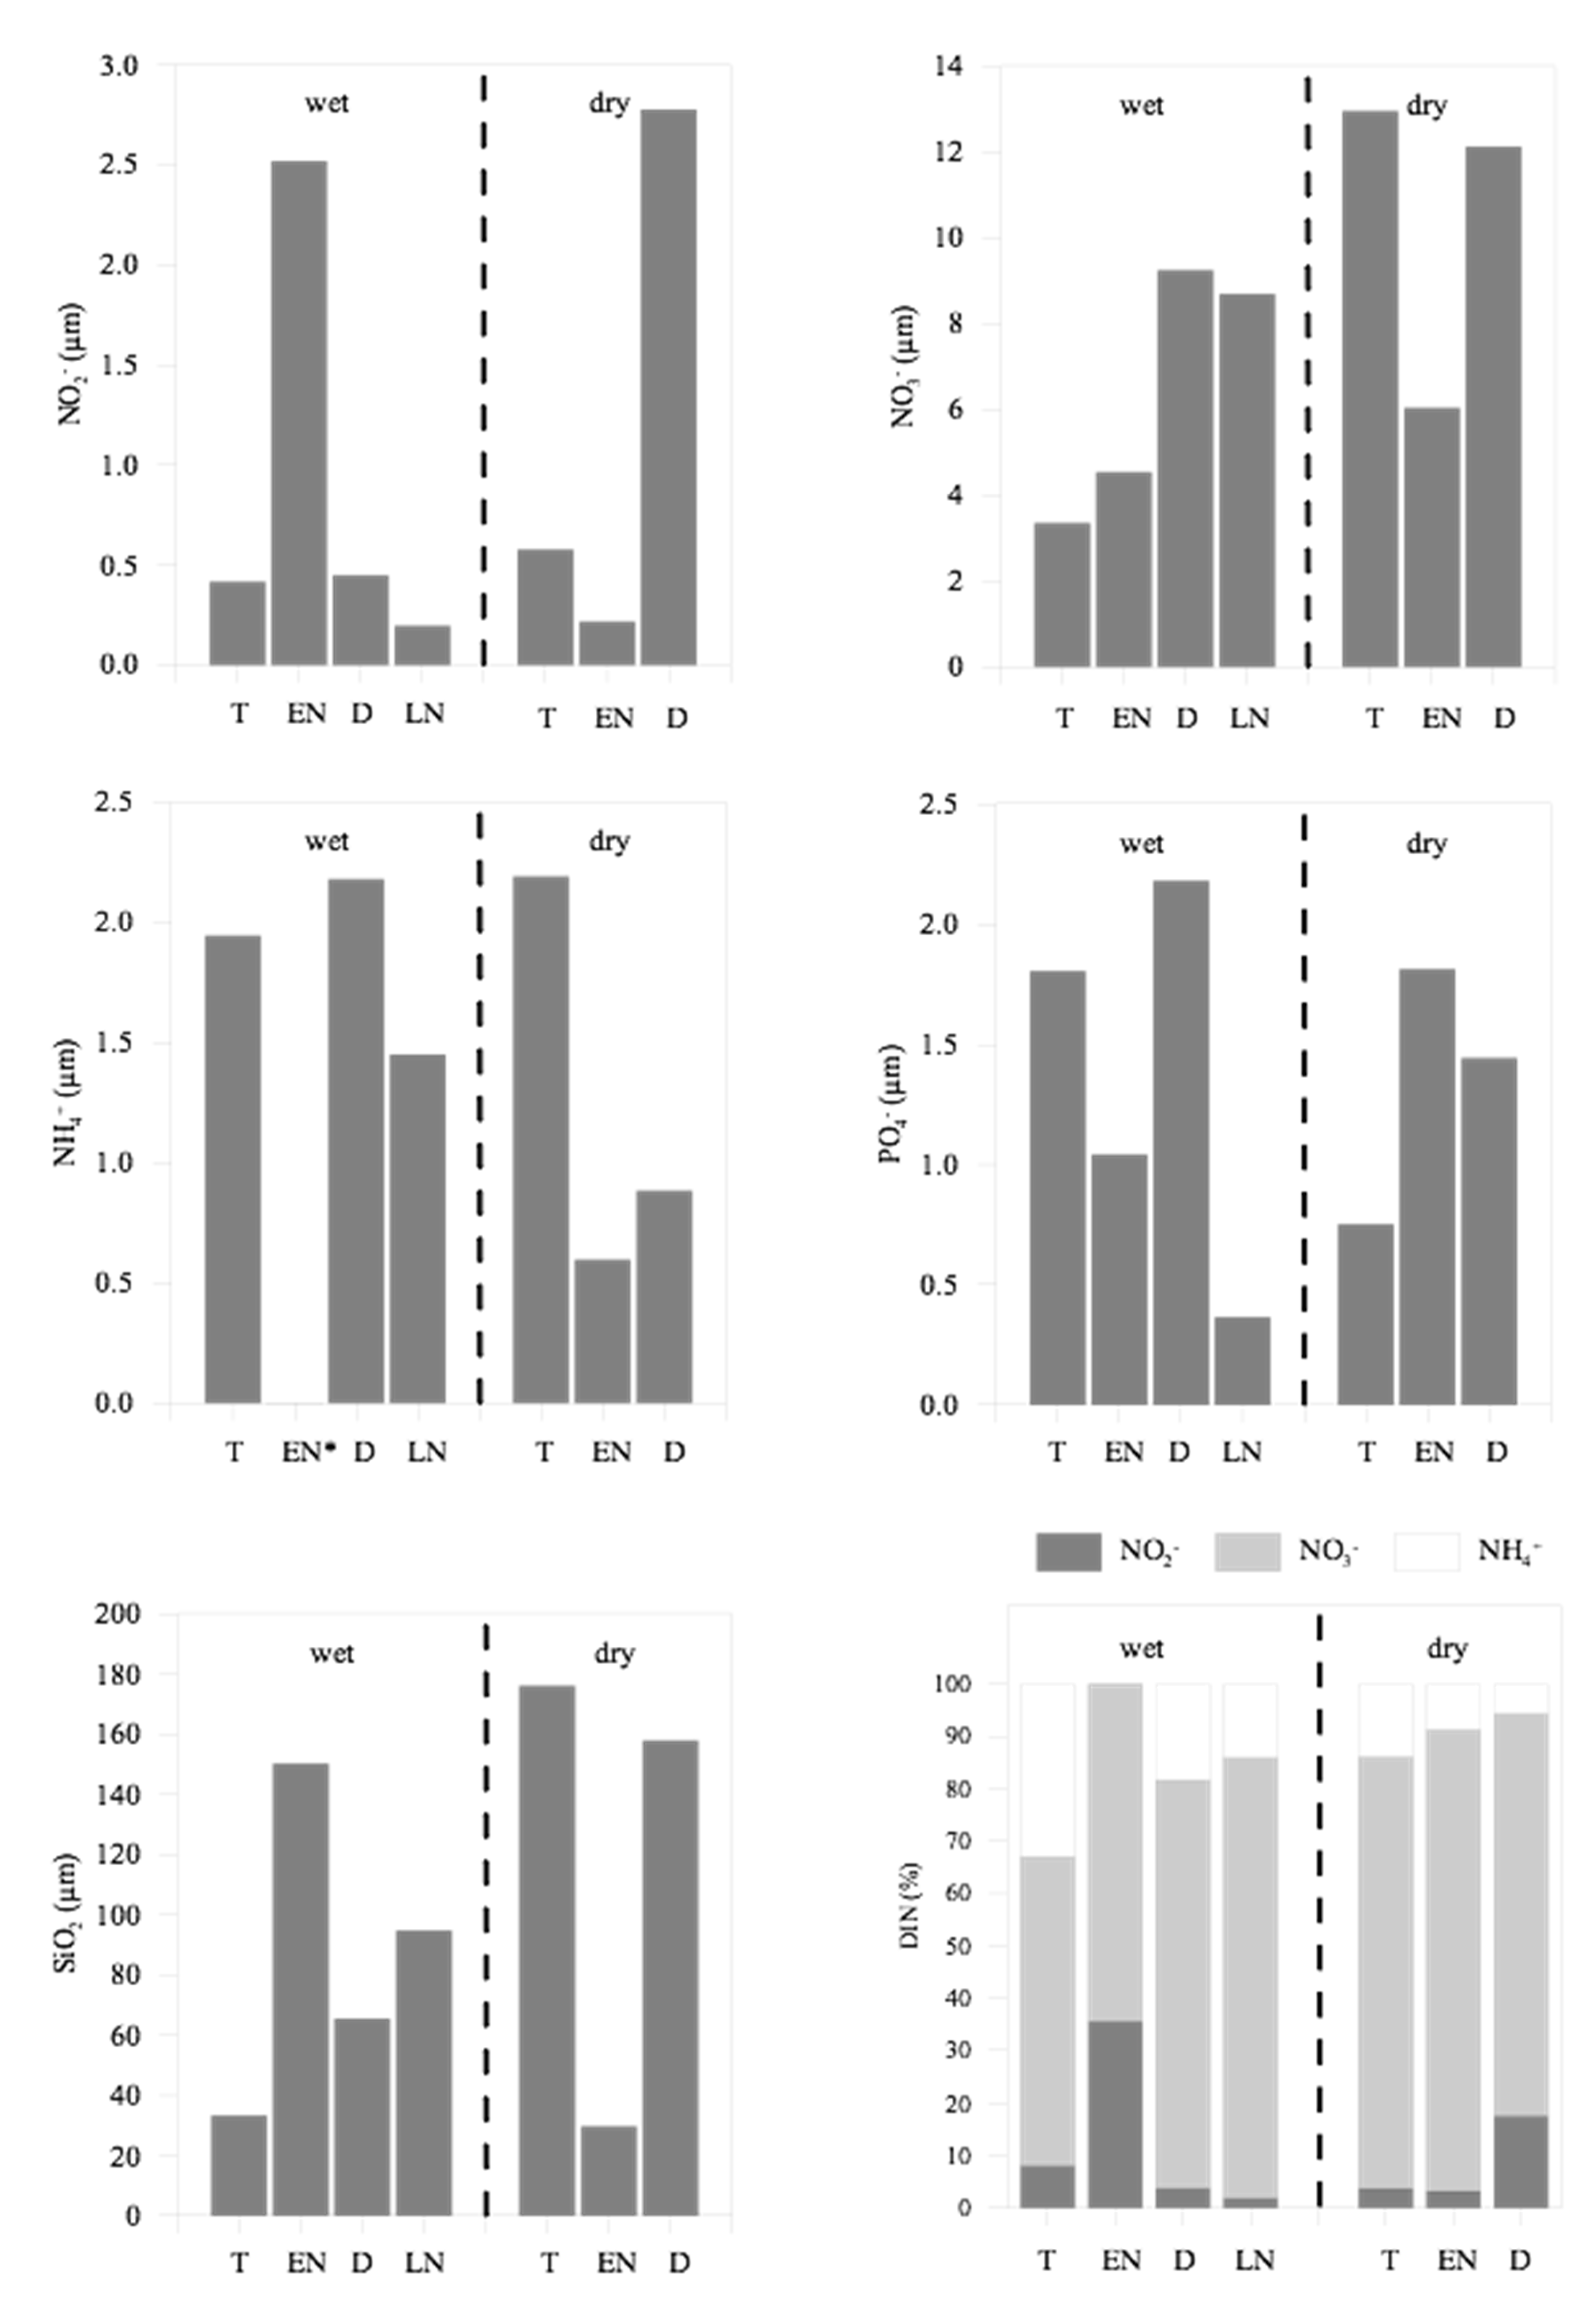
An increase in dissolved inorganic nutrient concentrations was observed in the middle sector, in both the rainy and dry seasons of the negatively anomalous periods, characterized by reduced rainfall (< 50 mm) and freshwater discharge (< 36 m
3 s
-1), as observed during Drought and El Niño events. During a typical rainy season, the concentration of NO
−2 was 0.4 µM, NO
−3 was 3.3 µM, NH
+4 was 1.9 µM, PO
3−4 was 1.8 µM, and SiO
2 was 33.0 µM. Under Drought or El Niño conditions, by contrast, these values increased to 2.5 µM for NO
−2, 9.2 µM for NO
−3, 2.2 µM for NH
4+, 2.2 µM for PO
3−4, and 150.0 µM for SiO
2. A similar pattern was observed during the dry season. By contrast, during the La Niña event, when rainfall (> 250 mm) and freshwater discharge (> 65 m
3.s
-1) were both higher, the concentrations of all inorganic nutrients, except NO
−3, decreased. The maximum observed concentrations were 0.2 µM for NO
−2, 1.5 µM for NH
+4, 0.4 µM for PO
3−4, and 94.6 µM for SiO
2 (
Figure 7)
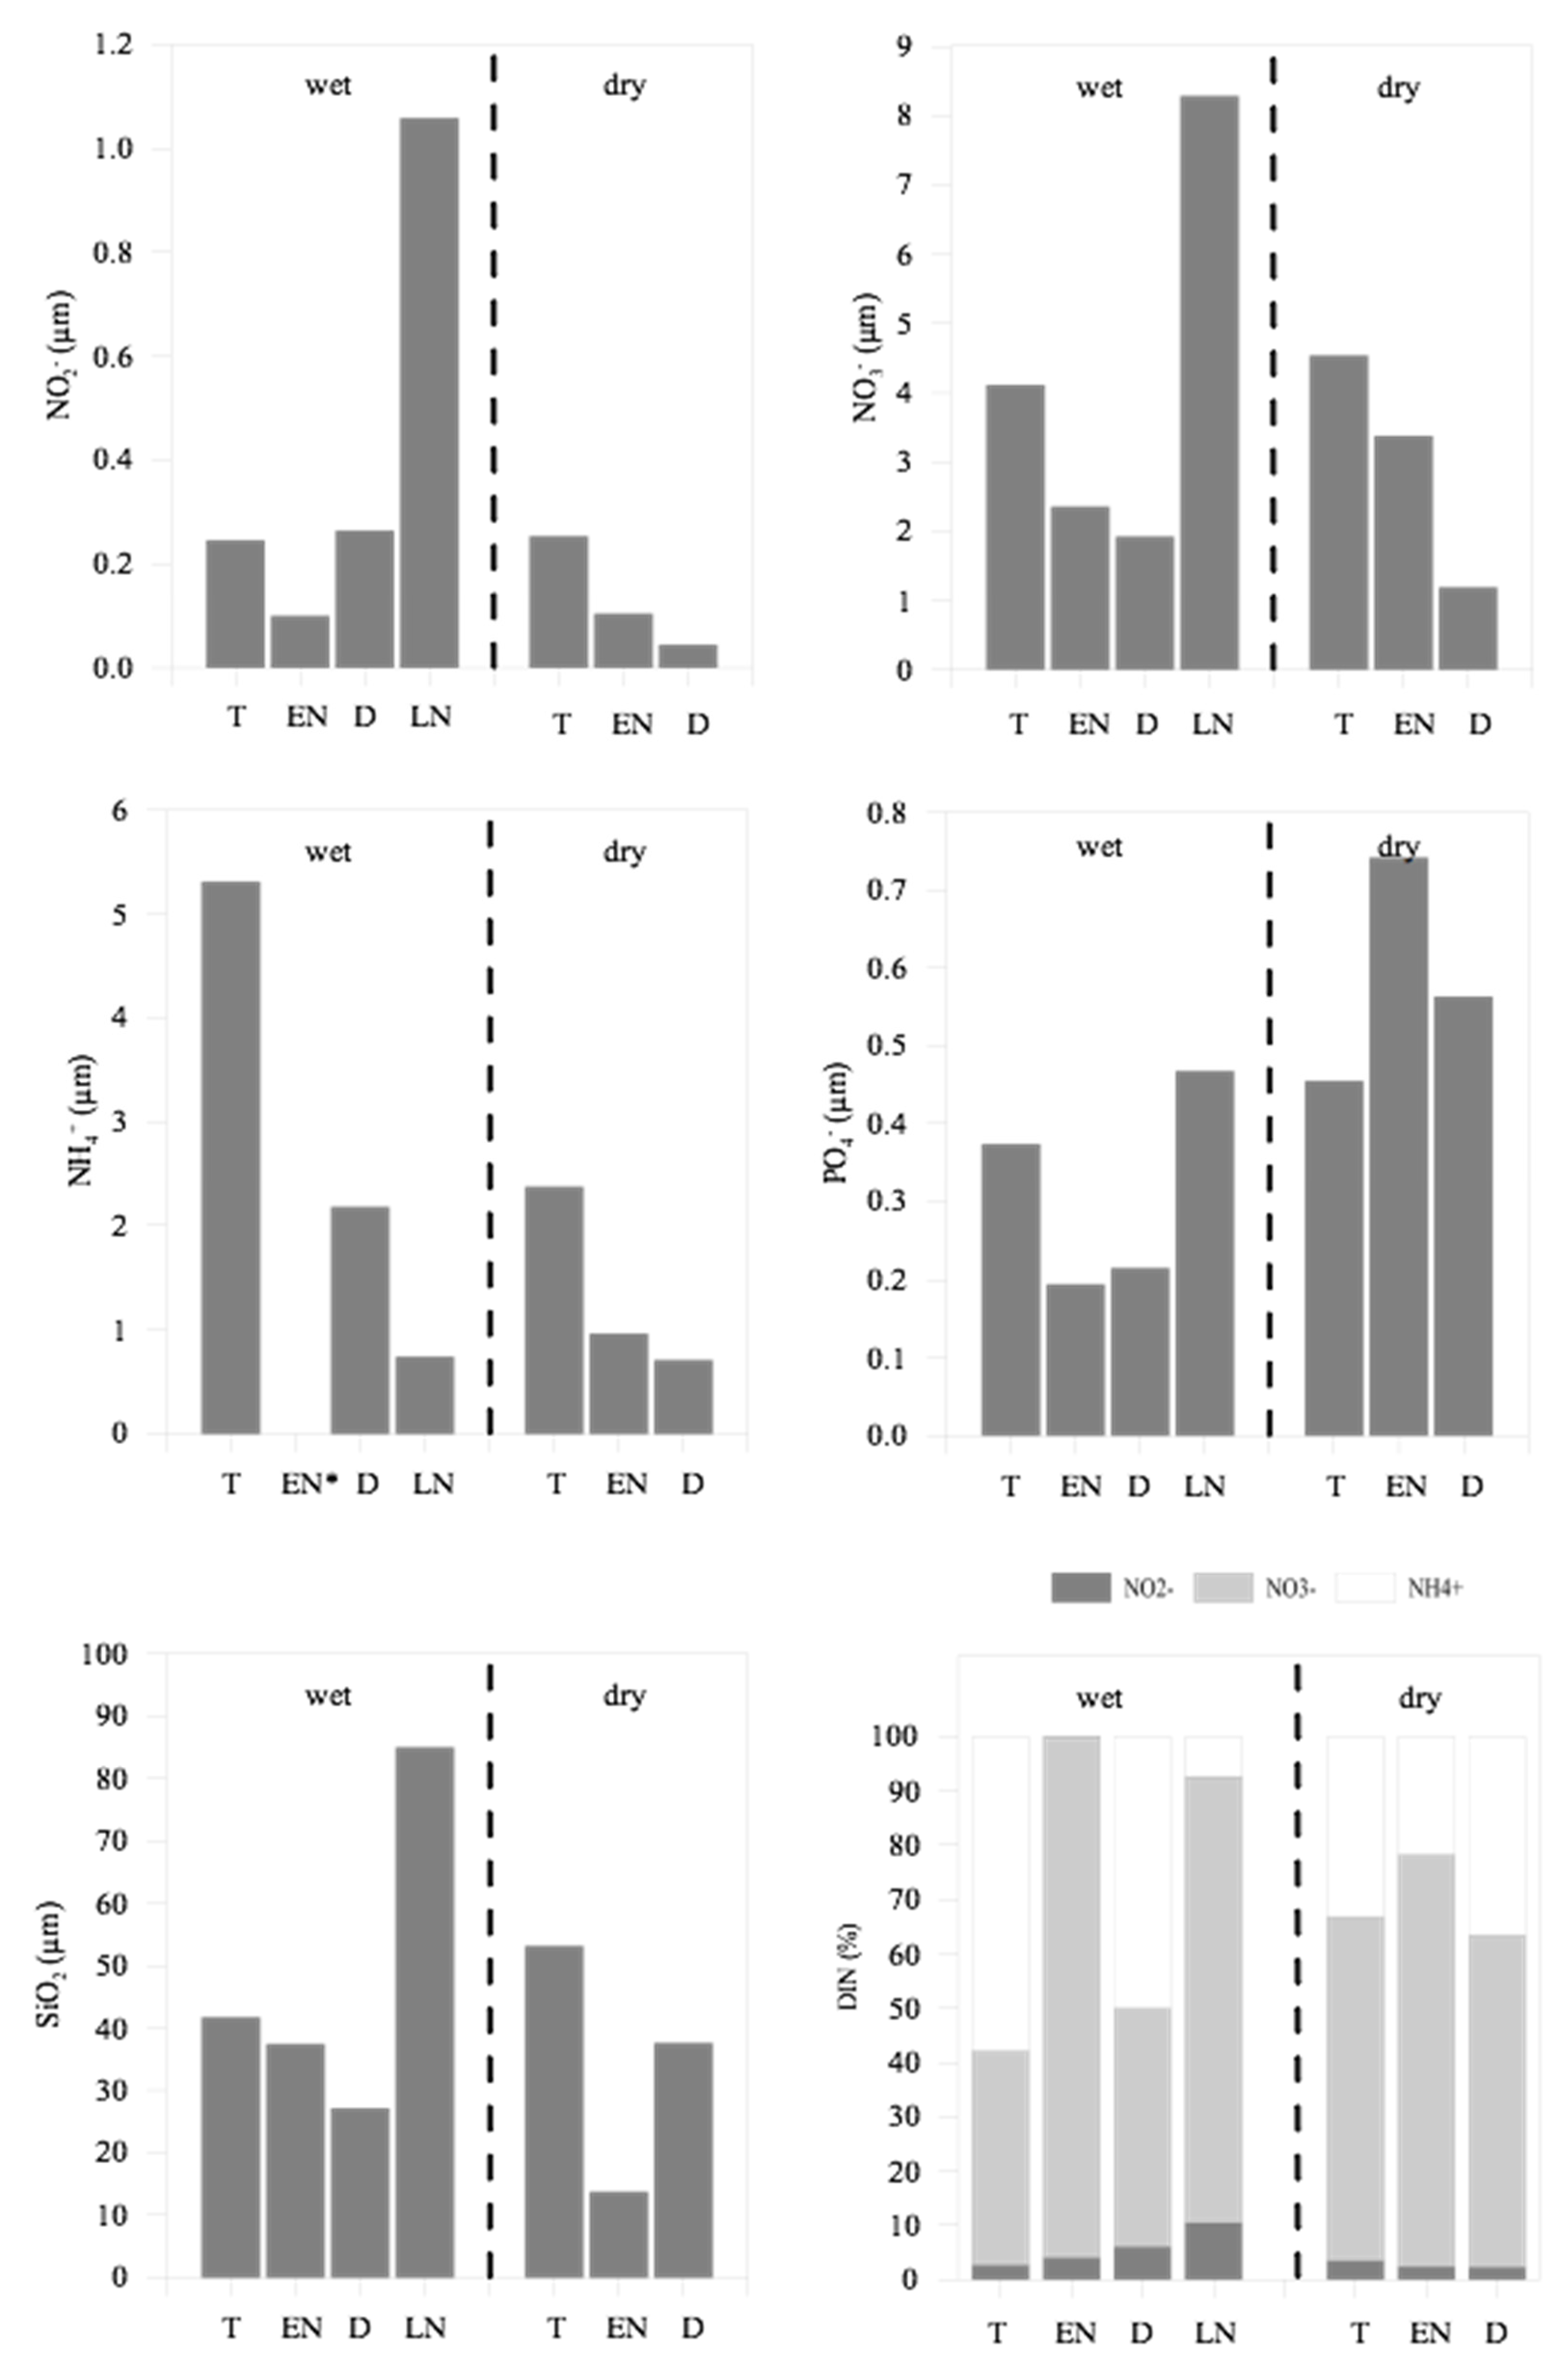
. The lower sector presented the exactly opposite pattern, with low dissolved inorganic nutrient concentrations being recorded under Drought and El Niño conditions. The maximum values recorded in this period were 0.2 µM for NO
−2, 2.3 µM for NO
−3, 2.1 µM for NH
+4, 0.2 µM for PO
3−4, and 37.4 µM for SiO
2, whereas relatively high concentrations were recorded under La Niña conditions (except for NH
4+),
i.e., 1.0 µM for NO
−2, 8.3 µM for NO
−3, 0.4 µM for PO
3−4, and 85.0 µM for SiO
2 (
Figure 8). Freshwater discharge from the hydrographic basin is usually the main source of nutrients for adjacent coastal waters, which explains the positive correlation between the different dissolved nutrients observed in the lower sector (NO
−2 vs. NO
−3:
rs = 0.7,
p < 0.05; NO
−3 vs. SiO
2:
rs = -0.4;
p < 0.05,
Table 2).
During all the periods monitored, NO
−3 was the dominant fraction of DIN, representing up to 95% of the total DIN in both sectors. This indicates high levels of bacterial oxidation and nitrification within the estuary (
Figure 7 and
Figure 8).
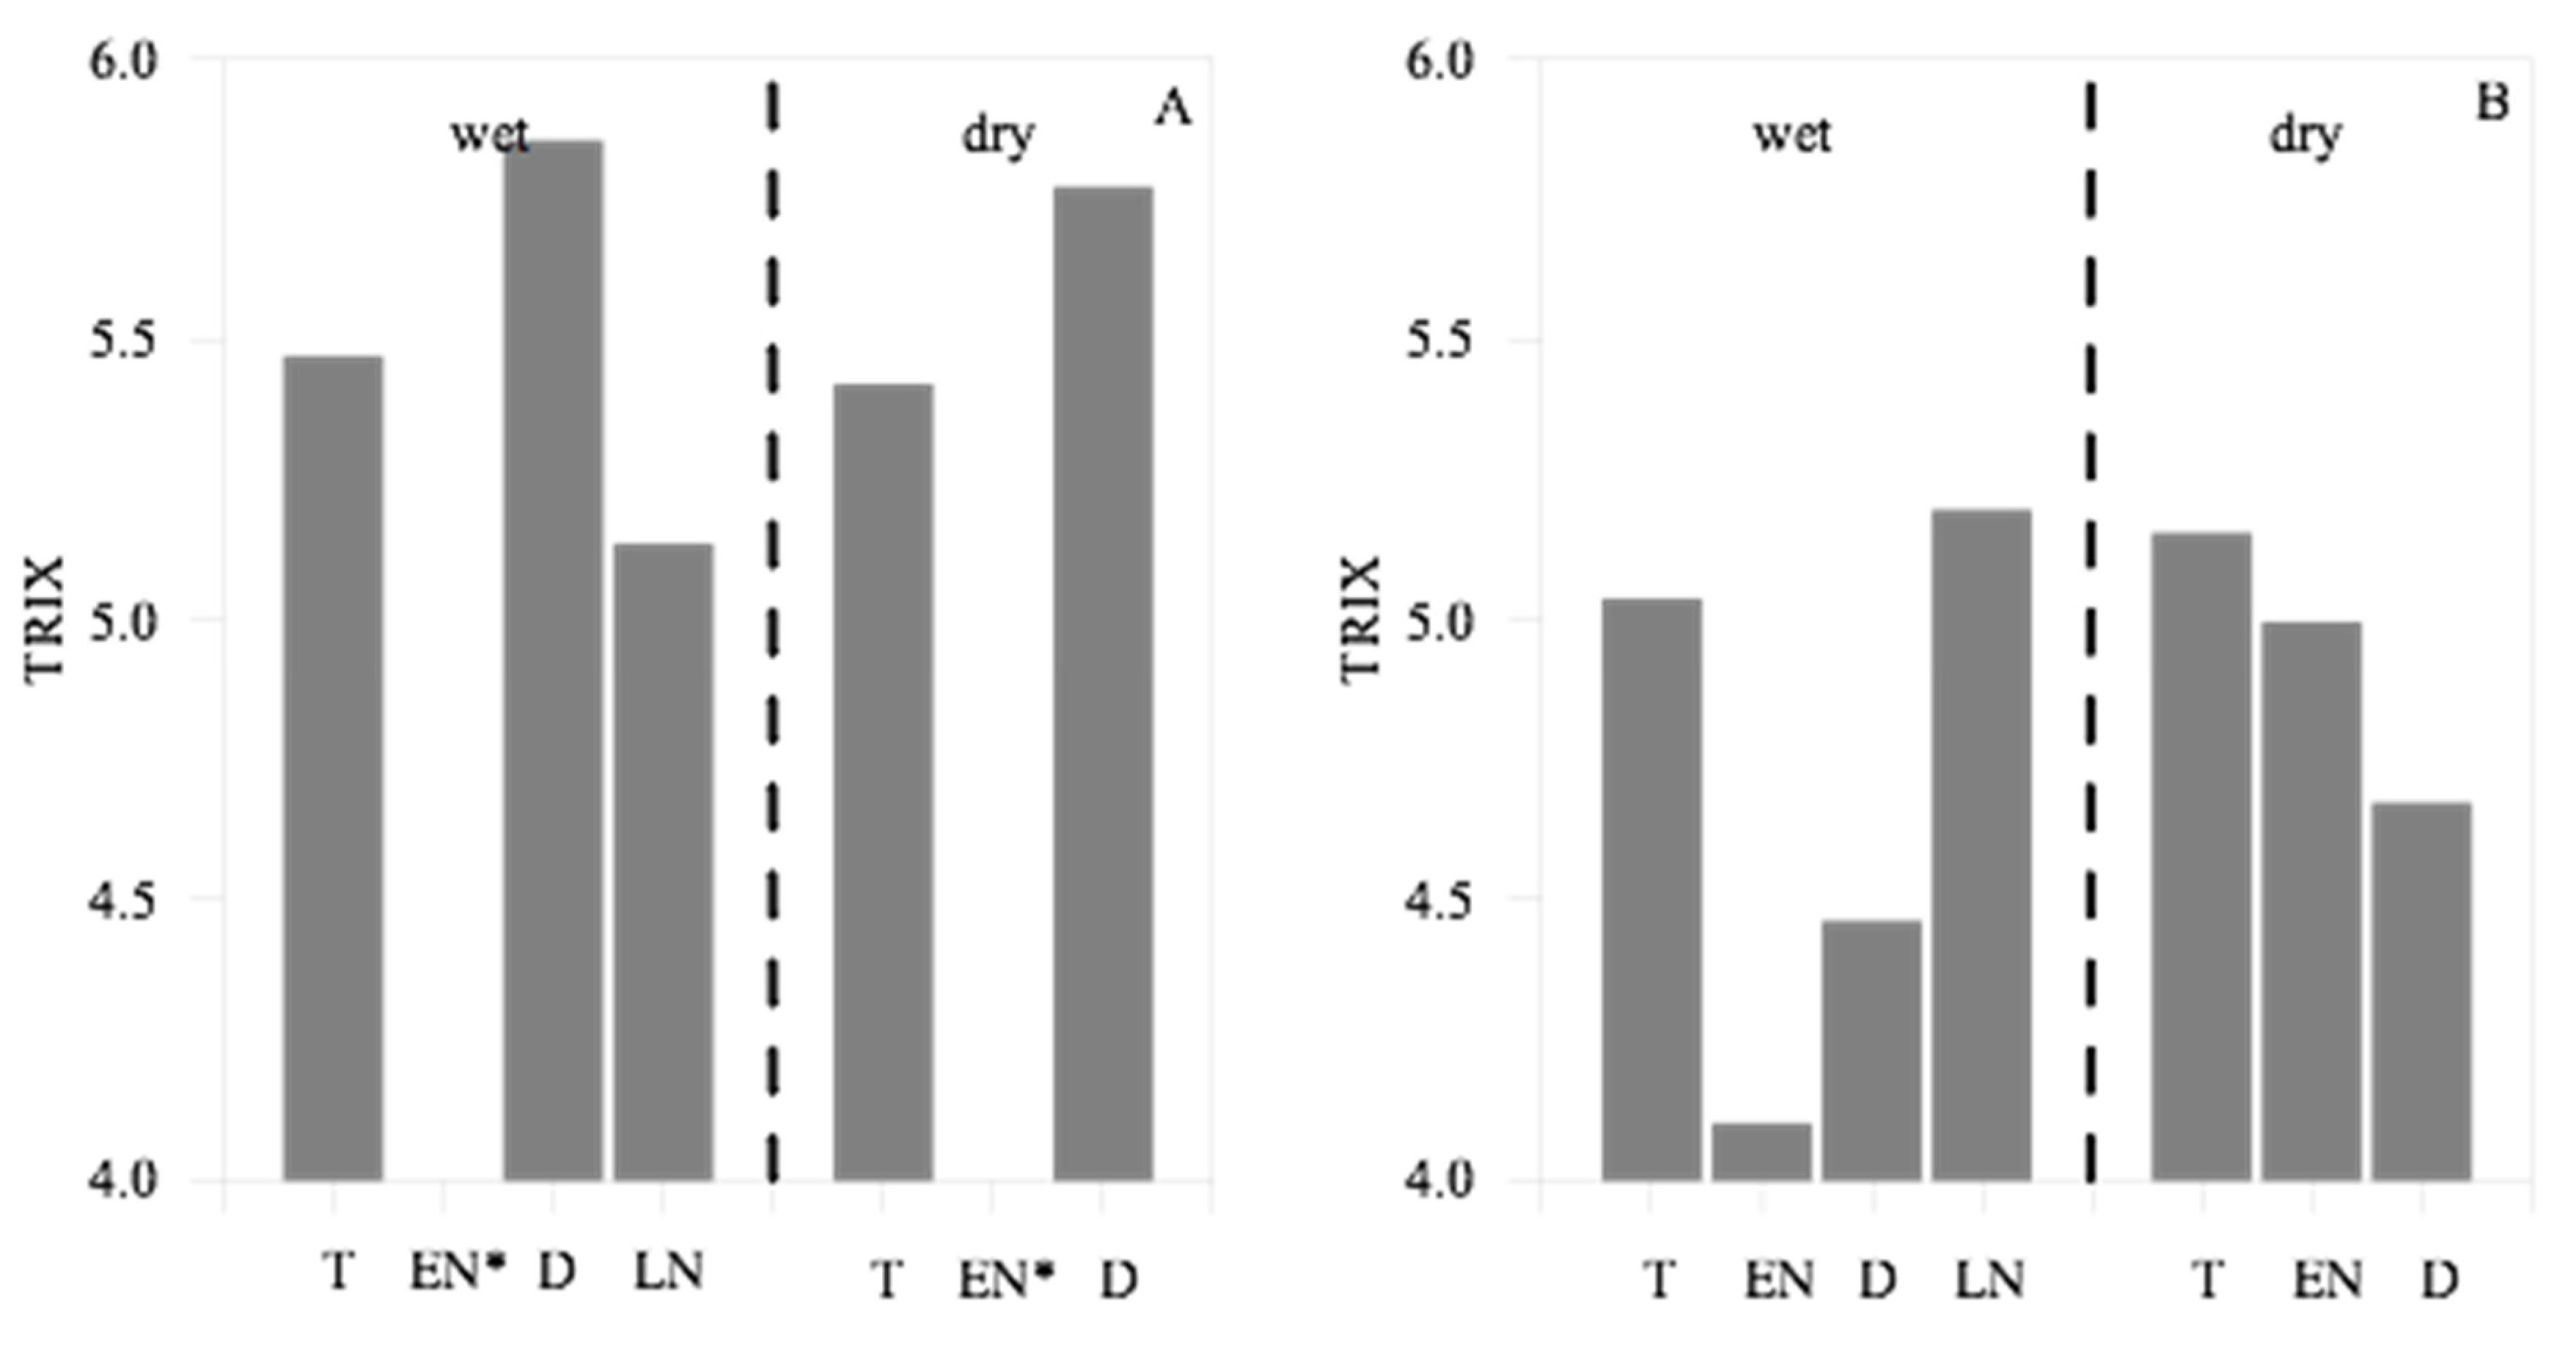
In the middle sector, where dissolved nutrient concentrations were 2 or 3 times higher than in the lower sector, trophic index scores were between 5.1 and 5.9, indicating a high level of eutrophication. This trophic status is reinforced by the remineralization of organic matter from the mangrove in the water column. While there was no alteration of the trophic status of this during the Drought period, scores increased by up to 5.8, indicating high levels of eutrophication, probably due to the increase in the dissolved nutrient concentrations recorded in this period. Better conditions were observed in the lower sector, where scores of between 4.1 and 5.0 predominated, indicating moderate eutrophication. In this sector, high levels of eutrophication were observed only during periods with abnormally high rainfall, such as that observed during La Niña events, when dissolved nutrient concentrations increase (
Figure 9).
Chlorophyll
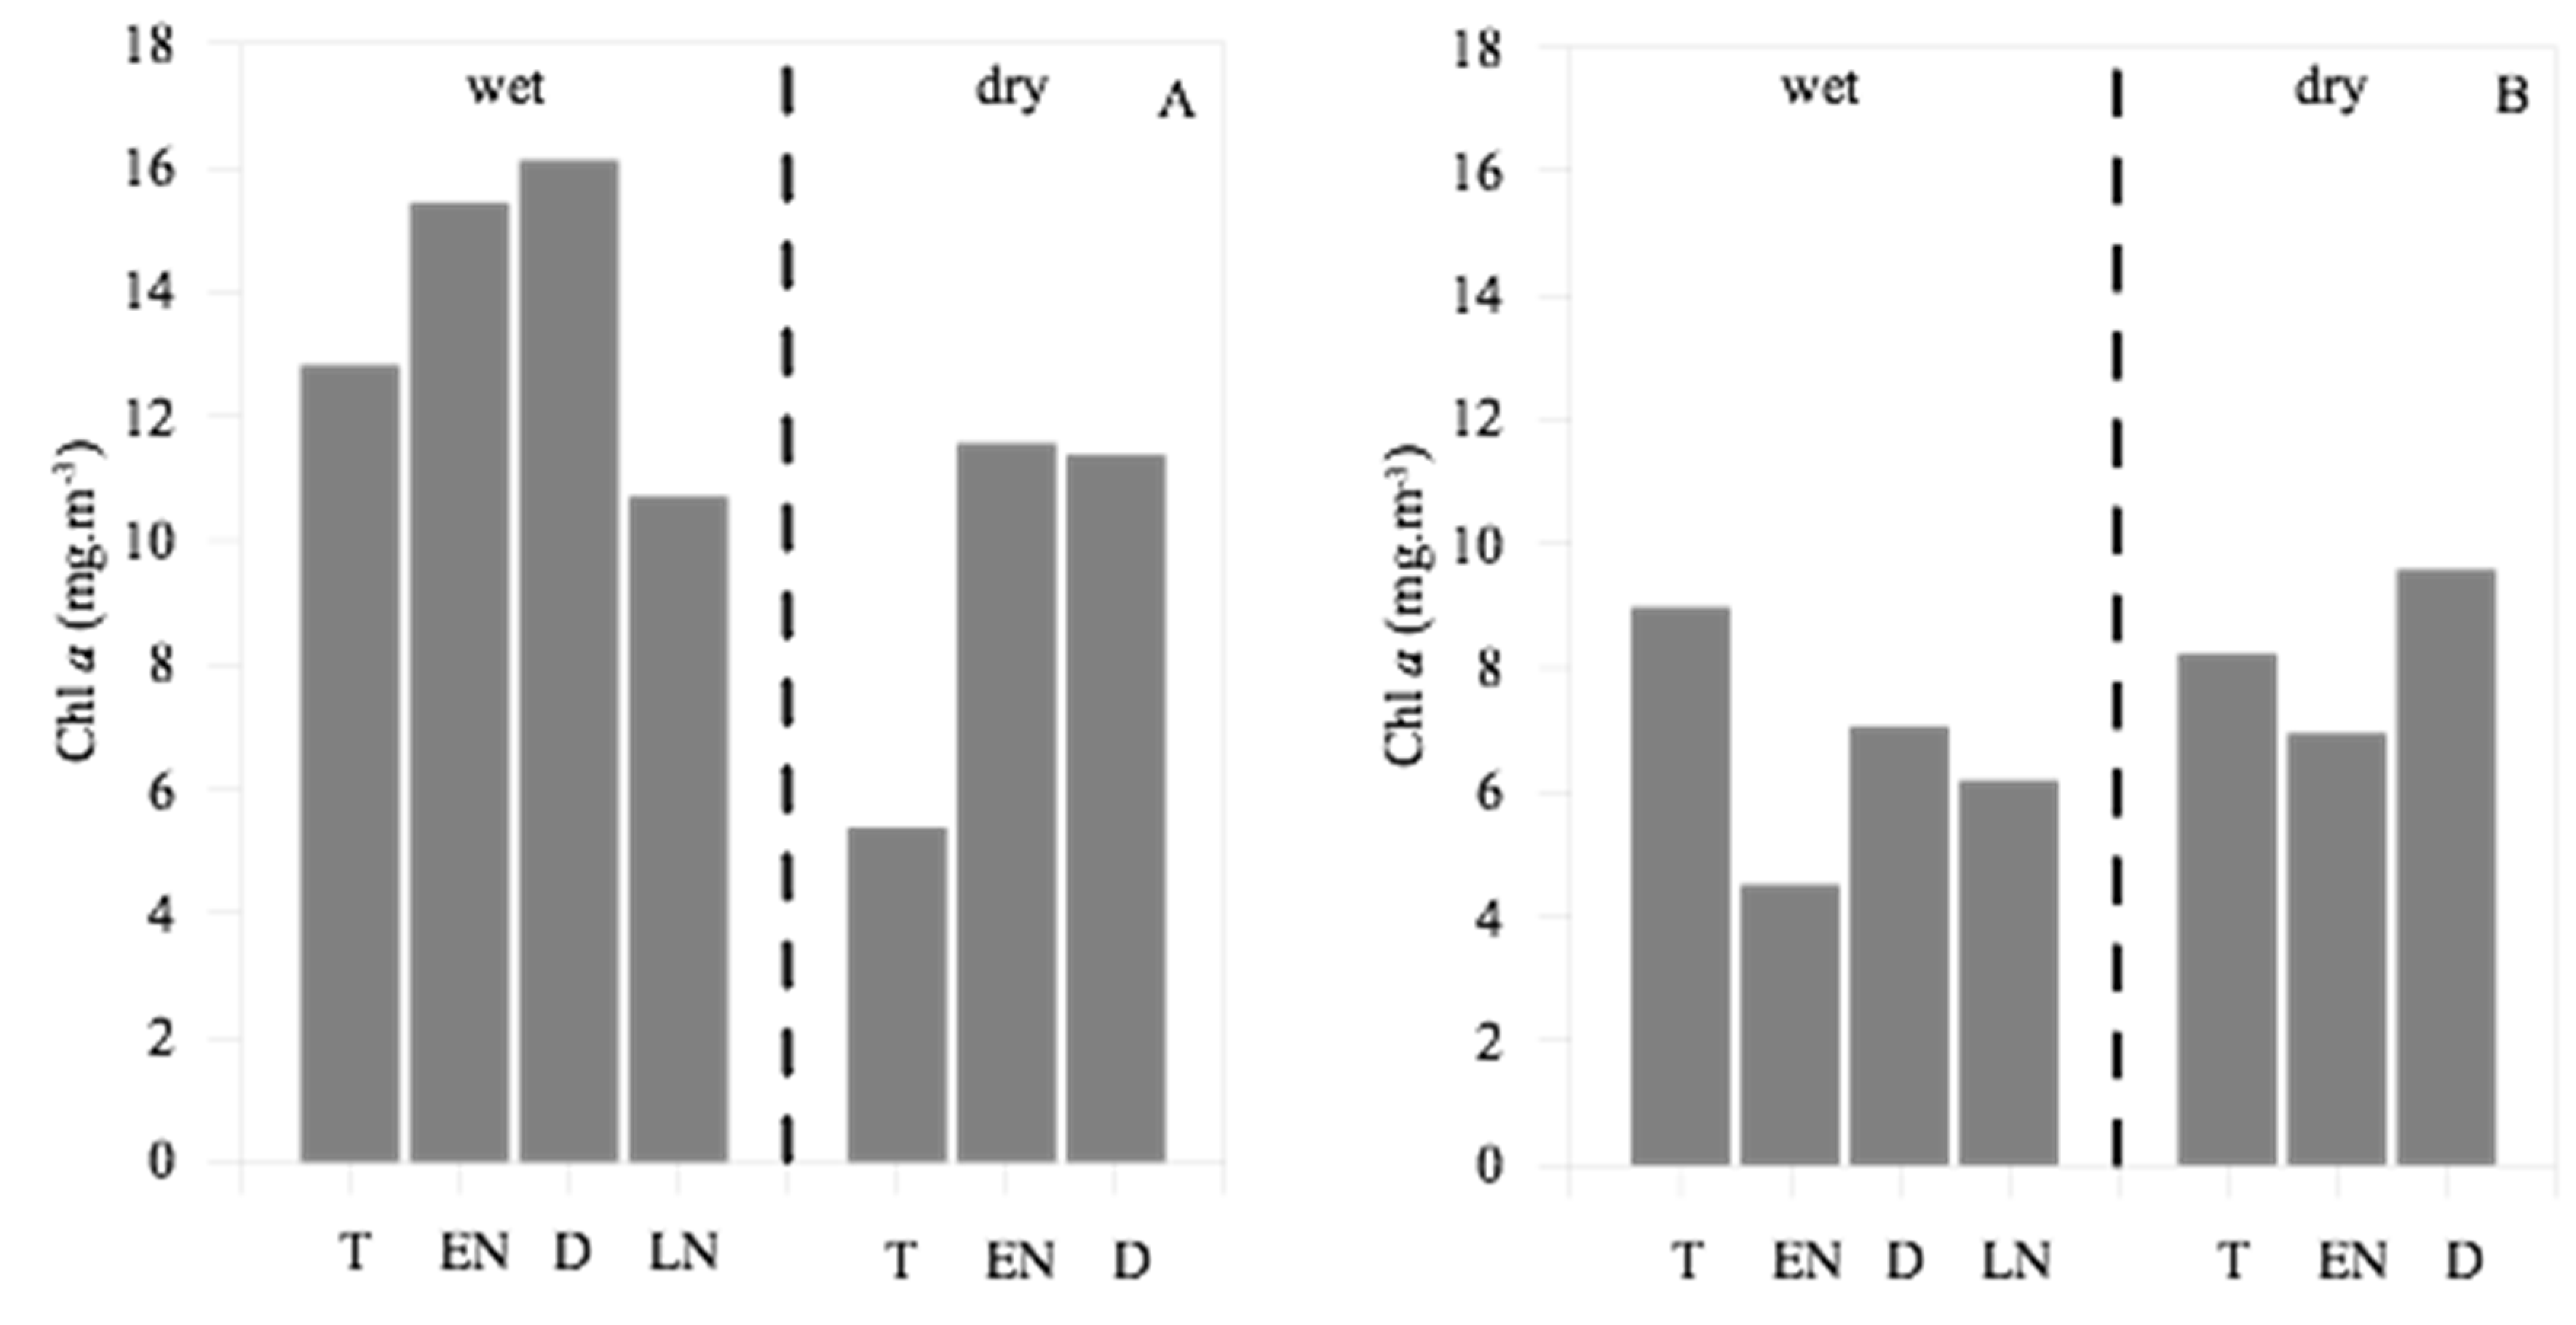
a concentrations indicate that productivity was highest during the Drought and El Niño events in the middle sector (
F = 1.41;
p = 0.03) where concentrations ranged mainly between 10 and 20 mg.m
-3, indicated more productive waters. In the lower sector, values of less than 10 mg.m
-3 indicated lower productivity than the middle sector, mainly during periods of decreased rainfall, such as El Niño events (
Figure 10).
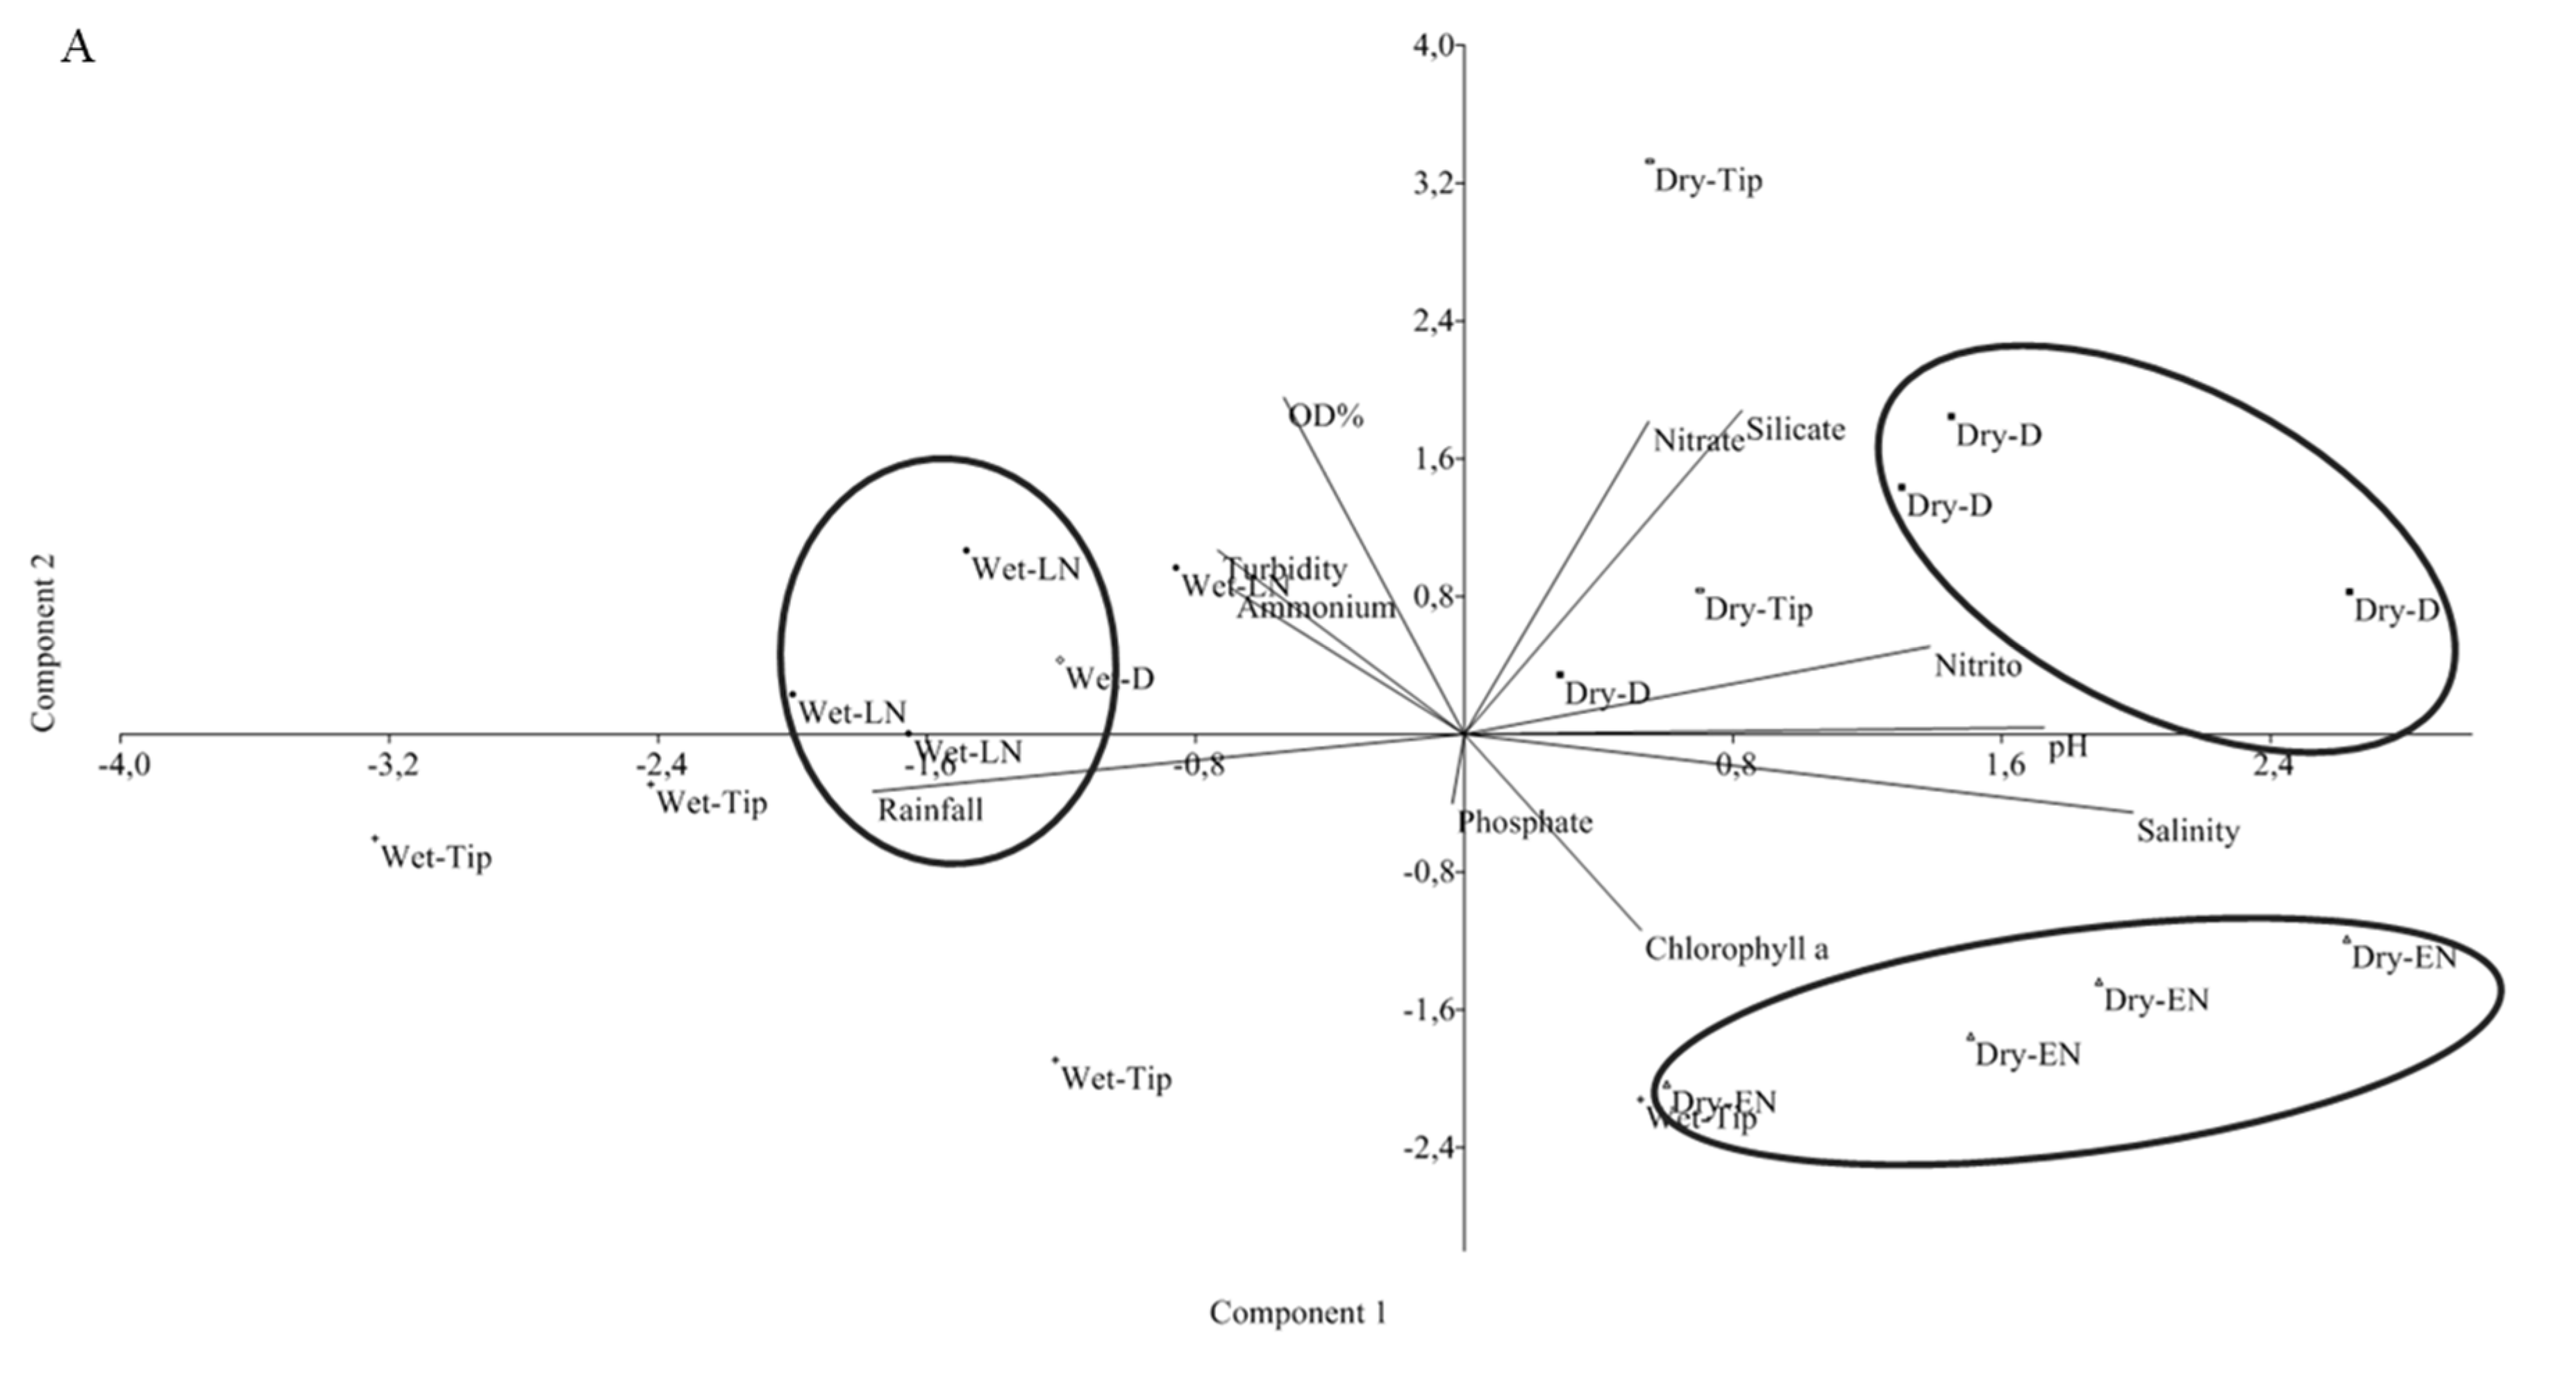
The Principal Components Analysis (PCA) of the middle sector (
Figure 11A) indicated that the first axis, represented primarily by salinity, explained 27% of the total variance. A strong positive relationship was recorded with pH in the dry season, irrespective of the influence of climate events. Both salinity and pH are influenced strongly by marine conditions, which explains their strong correlation, and their strong negative correlation with rainfall levels. The second axis, represented by dissolved oxygen concentrations, explained 20% of the total variance. This variable was related to turbidity. Both dissolved oxygen and turbidity increased during the rainy season in all years (typical and atypical), when increased turbulence contributes to more oxygenated waters and the resuspension of sediments in the water column.
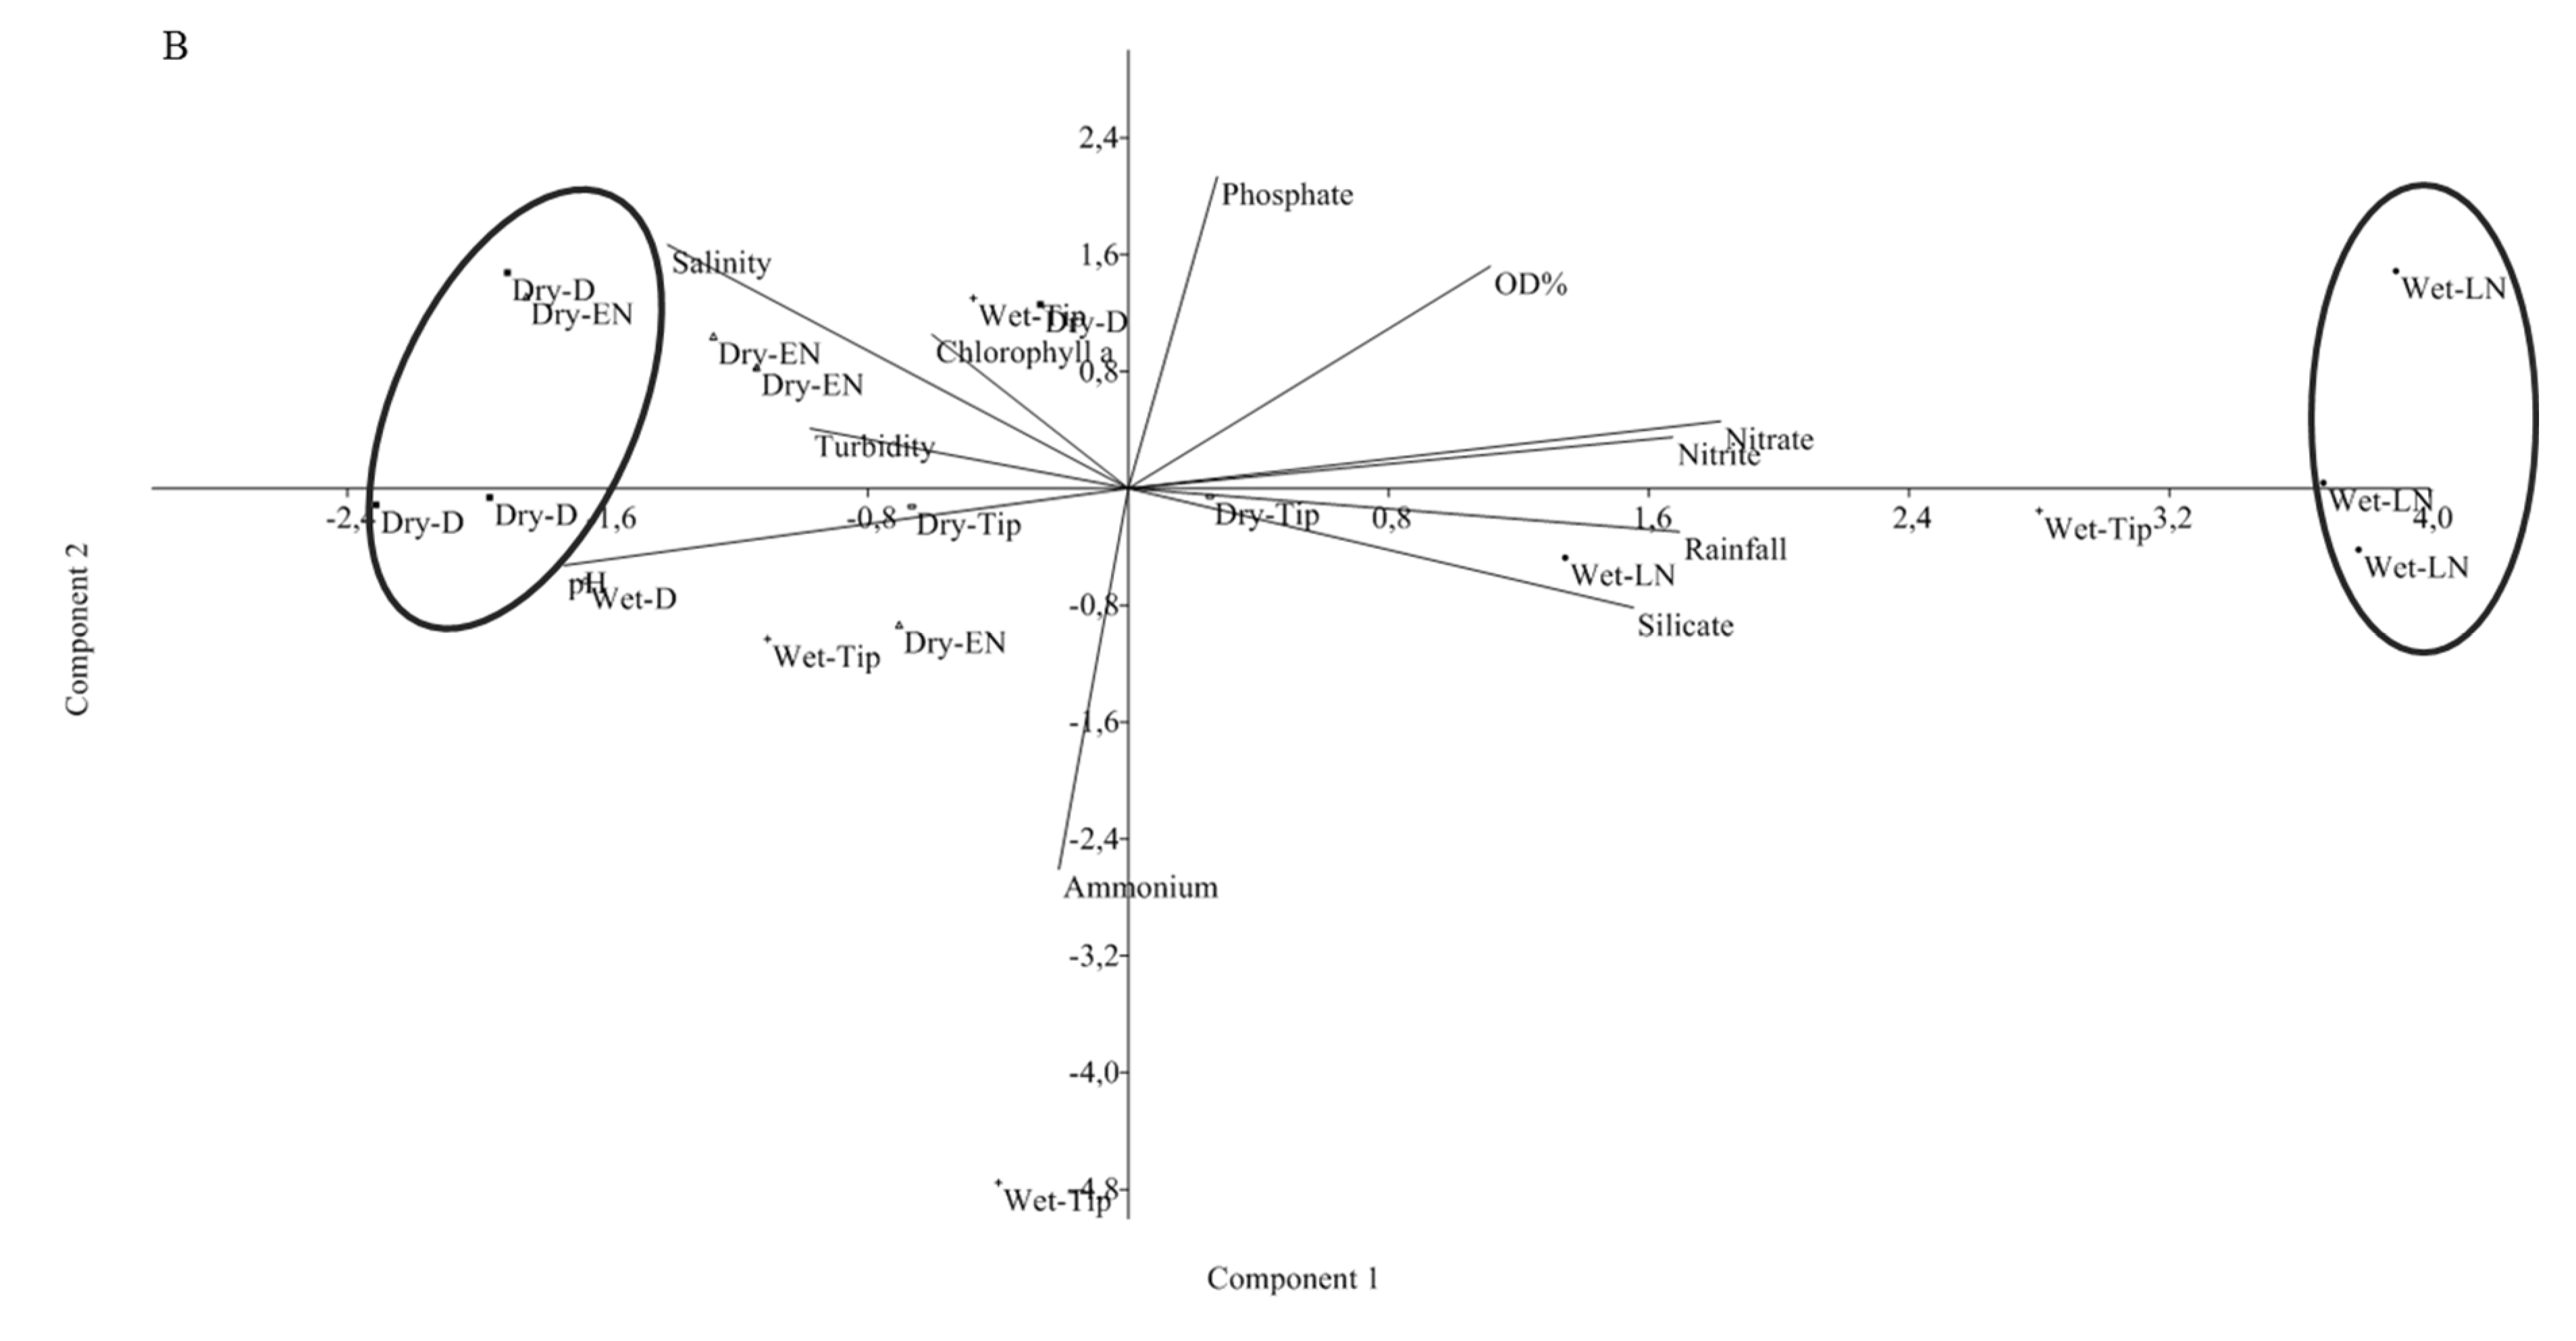
The PCA (
Figure 11B) of the lower sector explained 57% of the total variance. The first axis explained 39% of the total variance, which was related to NO
−3 concentrations. This nutrient increased during La Niña events and was correlated strongly with other nutrients such as NO
−2 and SiO
2. This further reinforces the patterns outlined above, which indicate that the increase in freshwater discharge observed during La Niña events contributes to the transportation of dissolved nutrients to adjacent coastal waters. The second axis explained 18% of the variance and was represented mainly by NH
+4, which presented the opposite pattern to the other parameters, presenting a stronger relationship with PO
3−4 and other variables influenced by waters with a strong marine influence.
5. Discussion
5.1. Climatological Conditions
The Amazon region is marked by high annual rainfall rates, which may reach 3300 mm in the coastal zone during typical years (CPTEC, 2018). During recent decades, a number of studies have shown that rainfall levels in the region have become increasingly variable due to the increase in the frequency and intensity of anomalous climate events (Coelho et al., 2012). For example, extreme rainfall levels and floods were recorded in 2008-2009 and 2015, alternating with strong droughts in 2005, 2007, 2010, 2013, and 2014. During some periods, in addition, while extreme levels of rainfall were recorded in the central Amazon region, drought conditions were experienced on the coast, as observed in 2012 (Coelho et al., 2012; Gloor et al., 2013; Marengo et al., 2013a).
Significant effects of extreme rainfall events or droughts have been detected in the Amazon coastal zone in some recent years. The El Niño event of August 2006 to February 2007 reduced rainfall levels in the Bragança region in 2007, and the rainy season started late, beginning only in February 2007. By contrast, the 2010 Amazon Drought began in the early austral summer, during an El Niño event, when the warming of the tropical North Atlantic, resulted in an even more intense Drought than that recorded in 2005, which had been referred to as “the worst drought of the century” (Marengo et al, 2011; Coelho et al., 2012). In 2010, the discharge of the Amazon River reached its lowest ever recorded level (8300 m3 s-1) during the austral spring (Espinoza et al., 2012b). During this event, rainfall decreased 20% in the Bragança region, and a river discharge was almost 40% lower than typical. Smaller deficits were recorded at other sites in the Amazon Coastal Zone, such as the city of Macapá, where river discharge decreased by around 10%, and Marajó Island, where it decreased by approximately 25% (INMET, 2018).
This Drought was followed by an unprecedented increase in river discharge during the subsequent summer and autumn, of 2011 (Espinoza et al., 2012a). The southward shift of the Intertropical Convergence Zone (ITCZ) coincided with negative SST anomalies in the central equatorial Pacific, producing La Niña-like conditions, which were responsible for the increase in rainfall levels. In the Caeté Estuary, as well as at Macapá and Marajó Island, rainfall increased 5–15% in 2011 (INMET, 2018).
In 2012–2013, the Amazon coastal zone also appears to have been affected by a drought on the coast of northeastern Brazil, which began in 2012 (Marengo et al., 2013a). This Drought was caused by anomalously cold surface water in the subtropical South Atlantic. It induced an intensification of the high-pressure zone in the South Atlantic, when the anomalously cold waters migrated to the north (10º–20º S), causing a northward displacement of the areas of high pressure. This high pressure interacted with sinking air masses induced by the strong upward motion in Amazonia, which determined the dry conditions in northeastern Brazil (Marengo et al., 201a3). The effects of this phenomenon on rainfall levels were probably extended to the Amazon Coastal Zone, where a strong drought was observed.
The analysis of the long-term rainfall data for the Bragança region indicates that during Drought or El Niño events, rainfall levels may be up to 45% lower than average. These anomalies are more pronounced during the rainy season, when rainfall typically exceeds 200 mm per quarter as observed in 2007 (rainy season started late). During La Niña events, by contrast, rainfall may be up to 60% higher than the mean. It is important to note that the relationship between extreme climate events and rainfall levels may vary considerably according to the frequency and intensity of the events.
5.2. Effects of Climate Events on Hydrological Aspects
The impacts of extreme climate events on the physical-chemical properties of the water of estuarine systems have been reported extensively from around the world. In South America, an El Niño event contributed to an increase in the trophic status of the sediments of the Plate River Estuary, due to an increase in freshwater input (Garcia-Rodriguez et al., 2013). In the equatorial Nha Phu Estuary, in southeast Vietnam, the strong La Niña of 2010 led to a reduction in salinity and an increase of primary production, probably fuelled by the inflow of nutrient-rich freshwater (Lund-Hansen et al, 2018).
In the estuaries of the Amazon region, Pereira et al. (2010), Costa et al. (2013), Monteiro et al. (2011, 2016a, 2016b), and Andrade et al. (2016) documented oscillations in water quality linked systematically to the rainfall regime, which is in turn controlled by large-scale climatic phenomena. The decrease in rainfall provoked by Drought or El Niño conditions results in a decrease in freshwater discharge, and a subsequent increase in the salinity of coastal waters. This increase in salinity is typically greater than that observed during a typical dry season. The opposite pattern has been observed under La Niña conditions at other sites on the Amazon coast, near the Caeté Estuary, including the Taperaçu Estuary (Andrade et al., 2016), and Ajuruteua Beach (Pereira et al., 2013), as well as macrotidal estuaries in Australia (Thompson et al., 2015).
In the present study, however, the increase in rainfall associated with the La Niña event did not result in any clear decrease in salinity in the Caeté estuary. Probably, the accumulation of salt crystals in the mangrove during the previous months, marked by El Niño and Drought events, resulted in the transfer of this salt to the estuary during the months of increased rainfall marked by the La Niña events of December 2010 and July 2011. A similar pattern was observed in this estuary during the rainy season in previous years (Cohen and Lara, 2003; Magalhães et al., 2006).
The increase of dissolved inorganic nutrient concentrations in the middle sector of the estuary recorded during Drought and El Niño events may be related to the retention of dissolved nutrients caused by the reduction in river discharge. As shown by Monteiro et al., (2016a) this tends to occur when rainfall levels decrease and mean freshwater discharge is lower than 45 m.s-1. This contributes to an increase in the trophic scores, but is not enough to increase the trophic status of the estuary. During typical rainy seasons or La Niña events, by contrast, the high freshwater river discharge will induce the transport of dissolved inorganic nutrients to the lower sector. During the typical rainy season, tidal asymmetry increases, with a longer ebb tide (8 h) and higher ebb current displacement, up to 36 km (Monteiro et al., 2016a), and during La Niña events, these conditions may be exacerbated, contributing to an increase in the trophic status of the estuary, as observed in the present study and in earlier studies in an area adjacent to the Caeté estuary under similar conditions (Pereira et al., 2013).
In addition to their influence on dissolved nutrient concentrations and trophic status, extreme climate events may affect biological productivity in estuarine environments. This would account for the increased chlorophyll a concentrations (an indirect measure of biomass) observed in the middle sector of the Caeté estuary, during Drought and El Niño events (Pereira et al., 2023). The increase in salinity during these events may contribute to the desorption of phosphate from the bottom sediment, causing an increase in its concentrations in the water column (e.g. Kadiri et al., 2012). This would favor the proliferation of diatoms, the second most abundant phytoplankton group in the Caeté estuary (Matos et al., 2011), which require compounds of phosphorus, silica and nitrogen for their growth and the formation of their cell structure (Hildebrand, 2008). Other impacts of extreme climate events on biological productivity in estuaries have been reported in previous studies, such as those of Andrade et al. (2016), Sathicq et al. (2015) and Zhang et al. (2016).
Overall, then, the effects of extreme climate events in the Caeté estuary have contrasting characteristics. Negative rainfall anomalies caused by Drought and El Niño events are responsible for high eutrophication in the middle sector, but moderate eutrophication in the lower sector. Conversely, positive rainfall anomalies caused by La Niña events decrease the trophic scores in the middle sector of the estuary, although no changes in its trophic status were observed. At the same time, the trophic conditions of the lower sector increased. It is important to note that these effects will vary according to the intensity and duration of the climate events and that, in the Caeté estuary, the water presents eutrophic characteristics due to the natural input of dissolved nutrients from the extensive area of mangrove surrounding the estuary. Given this, the quality of the water of the Caeté estuary cannot be classified as poor, according to TRIX criteria.
6. Conclusions
During the climate events monitored in the present study, rainfall decreased by up to 92% in the months affected by Drought or El Niño conditions, and increased between 15% and 100% in the months affected by La Niña conditions. These processes affected freshwater discharge into the estuary, altering the potential of this variable for the regulation of water quality.
As observed here, Drought or El Niño events contribute to a significant decrease in rainfall levels, with the water of the estuary becoming more saline and alkaline, and less oxygenated in both middle and lower sectors. During these events, high concentrations of dissolved nutrients and eutrophic condition are typically found in the middle sector of the estuary. During La Niña events, the dissolved nutrient concentrations decrease, but the trophic status of the estuary is unaltered. The lower sector presented a distinct pattern, with lower dissolved nutrient concentrations and moderate eutrophication of the water during El Niño and Drought events, and high eutrophication during La Niña events. Fluctuations in the frequency and intensity of climate events may thus minimize or exacerbate the trophic status of the Caeté estuary.
As few data are available on the effects of extreme climate events in Amazonian coastal environments, these findings can be considered to be an important work of reference for the assessment of the effects of these events on other natural environments in the Amazon coastal zone.
Acknowledgments
This study was financed by the Brazilian National Council for Scientific and Technological Development (CNPq), through a Universal project (483913/2012-0, 431295/2016-6), and by CAPES (Ciências do Mar II, Edital 43/2013; Pró-Amazônia). The first author would also like to thank CNPq for a research grant (process 150846/2017-7). The authors Pereira LCC (314037/ 2021–7) and Costa RM (314040/2021–8) would also like to thank CNPq for their research grants.
References
- Andrade, M.P. , Magalhães, A., Pereira, L.C.C., Flores-Montes, M.J., Pardal, E.C., Andrade, T.P., and Costa, R.M. Effects of a La Niña evento n hydrological patterns and copepod community structure in a shallow tropical estuary (Taperaçu, Northern Brazil). Journal of marine Systems 2016, 164, 128–143. [Google Scholar] [CrossRef]
- Coelho, C.A.S. , Cavalcanti, I.A.F., Costa, S.M.S., Freitas, S.R., Ito, E.R., Luz, G., Santos, A.F., Nobre, C.A., Marengo, J.A., and Pezza, A.B. Climate diagnostics of three major drought events in the Amazon and illustrations of their seasonal precipitation predictions. Meteorological Applications 2012, 19, 237–255. [Google Scholar] [CrossRef]
- Cohen, M.C. L, and Lara, R.J. Temporal changes of mangrove vegetation boundaries in Amazonia: Application of GIS and remote sensing techniques. Wetlands Ecology and Management 2003, 11, 223–231. [Google Scholar] [CrossRef]
- Conover, W.O.J. 1971. Pratical nonparametric statistics. New York: Jonh Wiley.
- Costa, A.K.R. , Pereira, L.C.C., Jiménez, J. A., Oliveira, A.R.G., Flores-Montes, M.J., Costa, R.M. 2022. Effects of Extreme Climatic Events on the Hydrological Parameters of the Estuarine Waters of the Amazon Coast. Estuaries and Coasts 2022, 45, 1517–1533. [Google Scholar] [CrossRef]
- Costa, A.K.R. , Pereira, L.C.C., da Costa, R.M., Monteiro, M.C., and Flores-Montes, M.J. Oceanographic processes in an Amazon estuary during an atypical wet season. Journal of Coastal Research 2013, 65, 1104–1109. [Google Scholar] [CrossRef]
- CPTEC/INMET. 2018. Climatologia de precipitação (mm) 2018. PARÁ, 2018.
- Dittmar, T. , and Lara, R.J. Driving forces behind nutrient and organic matter dynamics in a mangrove tidal creek in North Brazil. Estuarine, Coastal and Shelf Science 2001, 52, 249–259. [Google Scholar] [CrossRef]
- Elliott, M. , and Quintino, V. The Estuarine Quality Paradox, Environmental Homeostasis and the difficulty of detecting anthropogenic stress in naturally stressed areas. Marine Pollution Bulletin 2007, 54, 640–645. [Google Scholar] [CrossRef] [PubMed]
- Espinoza, J.C. , Lengaigne, M., Ronchail, J., and Janicot, S. Large-scale circulation patterns and related rainfall in the Amazon Basin: a neuronal networks approach. Climate Dynamics 2012, 38, 121–140. [Google Scholar] [CrossRef]
- Espinoza, J.C. , Ronchail, J., Guyot, J.L., Junquas, C., Drapeau, G., Martinez, J.M., Santini, W., Vauchel, P., Lavado, W., Ordoñez, J., and Espinoza, R. From drought to flooding: understanding the abrupt 2010-11 hydrological anual cycle in the Amazonas River and tributaries. Environmental Research Letters 2012, 7, 1–7. [Google Scholar]
- Fernandes, K. , Baethgen, W., Bernardes, S., DeFries, R., DeWitt, D.G., Goddard, L., Lavado, W., Lee, D.E., Padoch, C., Pinedo-Vasquez, M., and Uriarte, M. North Tropical Atlantic influence on western Amazon fire season variability. Geophysical Research Letters 2011, 38, 1–5. [Google Scholar]
- Figueroa, S.N. , and Nobre, C.. Precipitation distribution over Central and Western Tropical South America. Climanálise. 1990, 5, 36–45. [Google Scholar]
- García-García, D. , and Ummenhofer, C.C. Multidecadal variability of the continental precipitation annual amplitude driven by AMO and ENSO. Geophysical Research Letters 2015, 42, 526–535. [Google Scholar] [CrossRef]
- García-Rodríguez, F. , Brugnoli, E., Muniz., P., Venturini, N., Burone, L., Hutton, M., Rodriguez, M., Pita, A., Kandratavicius, N., Perez, L., and Verocai, J. Warm-phase ENSO events modulate the continental freshwater input and the trophic state of sediments in a large South American estuary. Marine and Freshwater Research 2013, 65, 1. [Google Scholar] [CrossRef]
- Gloor, M. , Brienen, R.J.W., Galbraith, D., Feldpausch, T.R.. Schöngart, J., Guyot, J.L., Espinoza, J.C., Lloyd, J., Phillips. O.L. Intensification of the Amazon hydrological cycle over the last two decades. Geophysical Research Letters 2013, 40, 1729–1733. [Google Scholar] [CrossRef]
- Grasshoff, K. , Emrhardt, M., and Kremling, K. 1983. Methods of seawater analysis. New York: Verlag Chemie.
- Guimarães, D. O. , Pereira, L. C. C., Costa, R. M. Aspectos Socioeconômicos e Ambientais das Comunidades Rurais da Bacia Hidrográfica do Rio Caeté (Pará-Brasil). Gerenciamento Costeiro Integrado 2009, 9, 71–84. [Google Scholar]
- Hildebrand, M. Diatoms, Biomineralization Processes, and Genomics. Chemical Review 2008, 108, 4855–4874. [Google Scholar] [CrossRef] [PubMed]
- IBGE – Instituto Brasileiro de Geografia e Estatística. 2015. Estimativas da população de 2015. http://www.ibge.gov.br/home/estatistica/populacao/estimativa2015. accessed 16 March 2016.
- INMET (Instituto Nacional de Meteorologia). 2018. http://www.inmet.gov.br/portal/index.php?r=estacoes/estacoesconvencionais. Accessed 14 April 2020.
- Kennish, M.J. Environmental threats and environmental future of estuaries. Environmental Conservation. 2002, 29, 78–107. [Google Scholar] [CrossRef]
- Krause, G. , Schories, D., Glaser, M., and Diele, K. Spatial Patterns of Mangrove Ecosystems: The Bragantinian Mangroves of Northern Brazil (Bragança, Pará). Ecotropica 2001, 7, 93–107. [Google Scholar]
- Lara, R.J. , and Dittmar, T. Nutrient dynamics in a mangrove creek (North Brazil) during the dry season. Mangroves and Salt Marshes 1999, 3, 185–195. [Google Scholar] [CrossRef]
- Lund-Hansen, L.C. , Thorbjørn, K.T., Andersen, J., Nielsen, M.H., Doan-Nhu, H., and Nguyen-Ngoc, L. Impacts and effects of a historical high and ENSO linked freshwater inflow in the tropical estuary Nha Phu, southeast Vietnam. Regional Studies in Marine Science 2018, 17, 28–37. [Google Scholar] [CrossRef]
- Magalhães, A. , Costa, R.M., Liang, T.H., Pereira, L.C.C., Ribeiro, M.J.S. 2006. Spatial and temporal distribution in density and biomass of two Pseudodiaptomus species (Copepoda: Calanoida) in the Caeté River Estuary (Amazon region-North of Brazil). Brazilian Journal of Biology 66 (2a).
- Marengo, J.A. , Alves, L.M., Wagner, R.S., and Rodriguez, D.A. Two Contrasting Severe Seasonal Extremes in Tropical South America in 2012: Flood in Amazonia and Drought in Northeast Brazil. American Meteorological Society 2013, 26, 9137–9154. [Google Scholar]
- Marengo, J.A. , and Espinoza, J.C. Extreme seasonal droughts and floods in Amazonia: causes, trends and impacts. International Journal of Climatology 2015, 36, 1033–1050. [Google Scholar] [CrossRef]
- Marengo, J.A. , Borma, L.S., Rodriguez, D.A., Pinho, P., Soares, W.R., and Alves, L.M. Recent extremes of drought and flooding in Amazonia: vulnerabilities and human adaptation. American Journal of Climate Change 2013, 2, 87–96. [Google Scholar] [CrossRef]
- Marengo, J.A. , Nobre, C.A., Oyama, T.M., Sampaio, G., Camargo, H., Alves, L., and Oliveira, R. The Drought of Amazonia in 2005. Journal of Climate 2008, 21, 495–516. [Google Scholar]
- Marengo, J.A. , Tomasella, J., Alves, L.M., Soares, W.R., and Rodriguez, D.A. The drought of 2010 in the Amazon region. Geophysical Research Letters 2011, 38, L12703. [Google Scholar]
- Matos, J.B. , Sodré, D.K.L., Costa, K.G., Pereira, L.C.C., and Costa, R.M. Spatial and temporal variation in the composition and biomass of phytoplankton in an Amazonian estuary. Journal of Coastal Research 2011, 64, 1525–1529. [Google Scholar]
- McLusky, D.S. , and Elliott, M. 2004. The Estuarine Ecosystem: Ecology, Threats and Management. Oxford University Press, New York. [CrossRef]
- Monteiro, M.C. , Jiménez, J.A., and Pereira, L.C.C. Natural and human controls of water quality of na Amazon estuary (Caeté-PA, Brazil). Ocean & Coastal Management 2016, 124, 42–52. [Google Scholar]
- Monteiro, M.C. , Pereira, L.C.C., Guimarães, D.O., Costa, R.M., Souza-Filho, P.W.M., Vieira, S.R., and Jiménez, J.A. Influence of natural and anthropogenic conditions on the water quality of the Caeté River Estuary (NE Brazil). Journal of Coastal Research 2011, 64, 1535–1539. [Google Scholar]
- Monteiro, M.C. , Pereira, L.C.C., Jiménez, J.A. The trophic status of an amazonian estuary under anthropogenic pressure (Brazil). Journal of Coastal Reserach 2016, 75, 98–102. [Google Scholar] [CrossRef]
- NOAA – National Oceanic and Atmospheric Administration. 2018. Climate Prediction Center. www.cpc.ncep.noaa.gov/products/precip/CWlink/MJO/enso.shtml. Accessed 20 May 2018.
- Oliveira, A. R.G. , Queiroz, J.B.M., Pardal, E. C., Pereira, L.C.C., Costa, R. M. How does the phytoplankton community respond to the effects of La Niña and post-drought events in a tide-dominated Amazon estuary? Aquatic Science 2023, 85, 9. [Google Scholar] [CrossRef]
- Parsons, T.R. , Strickland, J.D.H. Discusson of spectrophometric determination of marine-plant pigments, with revised equations for ascertaining chlorophyll a and carotenois. Journal Marine Research 1963, 21, 105–156. [Google Scholar]
- Pereira, L.C.C. , Costa, A.K.R., Costa, R.M., Magalhães, A., Flores-Montes, M.J., and Jiménez, J.A. Influence of a drought event on hydrological characteristics of a small estuary on the amazon mangrove coast. Estuaries and Coasts 2017, 41, 676–689. [Google Scholar] [CrossRef]
- Pereira, L.C.C. , Jiménez, J.A., Pineda, M.G., COSTA, A. K.R., SOUSA, N.S.S., Oliveira, A. R.G., Costa, R.M. Assessment of trophic status in Amazonian estuaries: A reinterpretation of TRIX values in mangrove estuaries. OCEAN & COASTAL MANAGEMENT 2023, 244, 106805. [Google Scholar]
- Pereira, L.C.C. , Monteiro, M.C., Guimarães, D.O., and Costa, R.M. Seasonal effects of wastewater to the water quality of the Caeté river estuary. Anais da Academia Brasileira de Ciências 2010, 82, 467–478. [Google Scholar] [CrossRef] [PubMed]
- Pereira, L.C.C. , Oliveira, S.M.O., Costa, R.M., Costa, K.G., and Vila-Concejo, A. What happens on na equatorial beach on the Amazon coast when La Niña occurs during the rainy season? Estuarine, Coastal and Shelf Science 2013, 135, 116–127. [Google Scholar] [CrossRef]
- Pinho, P.F. , Orlove, B., and Lubell, M. Overcoming barriers to collective action in community-based fisheries management in the Amazon. Human Organization 2012, 71, 99–109. [Google Scholar] [CrossRef]
- Procópio, A. D. , Costa, R. M. Magalhães A., Silva D. C., Silva, T. R. C., Fernandes, F. S. and Pereira, L.C.C. 2024. Effects of the El Niño 2015/2016 event on Acartia tonsa and A. lilljeborgii (Copepoda) production in a Brazilian Amazon estuary. Ecohydrology & Hydrobiology. [CrossRef]
- Sathicq, M.B. , Bauer, D.E., and Gómez, N.. Influence of El Niño Southern Oscillation phenomenon on coastal phytoplankton in a mixohaline ecosystem on the southeastern of South America: Río de la Plata estuary. Marine Pollution Bulletin 2015, 98, 26–33. [Google Scholar] [CrossRef] [PubMed]
- Seneviratne, S.I. , Nicholls, N., Easterling, D., Goodess, C.M., Kanae, S., Kossin, J., Luo, Y., Marengo, J., Mcinnes, K., Rahimi, M., Reichstein, M., Sorteberg, A., Vera, C., and Zhang, X. 2012. Changes in climate extremes and their impacts on the natural physical environment. In Managing the risks of extreme events and disasters to advance climate change adaptation, eds. Field, C.B., Barros, V., Stocker, T.F., Qin, D., Dokken, D.J., Ebi, K.L., Mastrandrea, M.D., Mach, K.J., Plattner, G.K., Allen, S.K., Tignor, M., Midgley, P.M., 109-230. Cambridge: Cambridge University Press.
- Sokal, R.R. , and Rohlf, F.J. 1969. Biometry: The principles and pratice of numerical classification in biological research. California: W.H. Freeman.
- Sousa, N.S.S. , Monteiro, M. C., Gorayeb, A., Costa, R., and Pereira, L.C.C. Effects of sewage on natural enrironments of the amazona region (Pará-Brazil). Journal of Coastal Research 2016, 75, 158–162. [Google Scholar]
- STATISTICA 8.0. Statsoft. (2009). Disponível em: .
- Strickland, J.D.H. , and Parsons, T.R.A. 1972. A practical handbook of seawater analysis. Bulletin 167. Ottawa, Ontario, Canadá: Alger Press.
- Thompson, P.A. , O’Brien, T.D., Paerl, H.W., Peierls, B.L., Harrison, P.J., and Robb, M. Precipitation as a driver of phytoplankton ecology in coastal Waters: A climatic perspective. Estuarine, Coastal and Shelf Science 2015, 162, 119–129. [Google Scholar] [CrossRef]
- Tomasella, J. , Pinho, P.F., Borma, L.S., Marengo, J.A., Nobre, C.A., Bittencourt, O.R.F.O., Prado, M.C.R., Rodriguez, D.A., and Cuartas, L.A. The droughts of 1997 and 2005 in Amazonia: floodplain hydrology and its potential ecological and human impacts. Climatic Change 2013, 116, 723–746. [Google Scholar] [CrossRef]
- Trenberth, K.E. , Dai, A., Van Der Schrier, G., Jones, P.D., Barichivich, J., Briffa, K.R., and Sheffield, J. Global warming and changes in drought. Nature Climate Change 2014, 4, 17–22. [Google Scholar] [CrossRef]
- UNESCO – United Nations Educational, Scientific and Cultural Organization. 1966. Determination of photosynthetic pigments in sea-water. Paris: UNESCO.
- Vollenweider, R.A. , Giovanardi, F., and Rinaldi, A. Characterization of the trophic conditions of marine coastal waters with special reference to the NW Adriatic Sea: proposal for a trophic scale, turbidity and generalized water quality index. Environmetrics 1998, 9, 329–357. [Google Scholar] [CrossRef]
- Wetz, M.S. , and Yoskowitz, D.W. An ‘extreme’ future for estuaries? Effects of extreme climatic events on estuarine water quality and ecology. Marine Pollution Bulletin. 2013, 69, 7–18. [Google Scholar] [CrossRef] [PubMed]
- Whittaker, R.H. , and Likens, G.E. 1975. The biosphere and man. In primary productivity of the biosphere, ed. Lieth, H., and Whittaker, R.H., Berlin Heidelberg New York: Springer-Verlag. 305-328.
- Williams, E. , Dall’ Antonia, A., Dall’ Antonia, V., Almeida, J.M., Suarez, F., Liebmann, B., and Malhado, C.M. The drought of the century in the Amazon Basin: An analysis of the regional variation of rainfall in South America in 1926. Acta Amazonica 2005, 35, 231–238. [Google Scholar] [CrossRef]
- Wolf, M. , Koch, V., and Isaac, V. A Trophic flow model of the Caeté mangrove estuary (North Brazil) with considerations for the sustainable use of its resources. Estuarine, Coastal and Shelf Science 2000, 50, 789–803. [Google Scholar] [CrossRef]
- Woodward, G. , Bonada, N., Brown, L.E., Death, R.G., Durance, I., Gray., Hladyz, S., Ledger, M.E., Milner, A.M., Ormerod, S.J., Thompson, R.M., and Pawar, S. The effects of climatic fluctuations and extreme events on running water ecosystems. Philosophical Transactions: The Royal Society 2016, 371, 1–15. [Google Scholar]
- Xu, L. , Samantha, A., Costa, M.H., Ganguly, S., Nemani, R.R., and Myneni, R.B. Widespread decline in greenness of Amazonian vegetation due to the 2010 drought. Geophysical Research Letters 2011, 38, 1–4. [Google Scholar]
- Yoon, J. H, and Zeng, N. An Atlantic influence on Amazon rainfall. Climate Dynamics 2010, 34, 249–264. [Google Scholar] [CrossRef]
- Zeng, N. , Yoon, J., Marengo, J.A., Subramanian, A., Nobre, C.A., Mariotti, A., and Neelin, J.D. Causes and impacts of the 2005 Amazon drought. Environmental Research Letters 2008, 3, 1–6. [Google Scholar]
- Zhang, Z. , Craft, C.B., Xue, Z.,Tong, S., Lu, X. Regulating effects of climate, net primary productivity, and nitrogen on carbon sequestration rates in temperate wetlands, Northeast China. Ecological Indicators 2016, 70, 114–124. [Google Scholar] [CrossRef]
Figure 1.
Location of study area on the northern coast of Brazil (A and B), showing the Caeté estuary (C) and the upper (US), middle (MS) and lower (LS) sectors of the estuary.
Figure 1.
Location of study area on the northern coast of Brazil (A and B), showing the Caeté estuary (C) and the upper (US), middle (MS) and lower (LS) sectors of the estuary.
Figure 2.
Annual rainfall in the Bragança region based on a 39-year series of meteorological data. Source: INMET. *No data for 1981 or 1983.
Figure 2.
Annual rainfall in the Bragança region based on a 39-year series of meteorological data. Source: INMET. *No data for 1981 or 1983.
Figure 3.
Current velocity in the Caeté estuary during the spring tide in the rainy and dry seasons in the middle (A) and lower (B) sectors.
Figure 3.
Current velocity in the Caeté estuary during the spring tide in the rainy and dry seasons in the middle (A) and lower (B) sectors.
Figure 4.
Monthly rainfall in Bragança and the freshwater discharge of the Caeté River during the oceanographic campaigns. The hatched gray areas represent the rainy season and the arrows the months of collection.
Figure 4.
Monthly rainfall in Bragança and the freshwater discharge of the Caeté River during the oceanographic campaigns. The hatched gray areas represent the rainy season and the arrows the months of collection.
Figure 5.
Salinity, pH, oxygen saturation, and turbidity recorded in the middle sector of the Caeté estuary during typical and atypical periods (EN: El Niño, D: Drought, and LN: La Niña). (*) Not sampled.
Figure 5.
Salinity, pH, oxygen saturation, and turbidity recorded in the middle sector of the Caeté estuary during typical and atypical periods (EN: El Niño, D: Drought, and LN: La Niña). (*) Not sampled.
Figure 6.
Salinity, pH, oxygen saturation and turbidity recorded in the lower sector of the Caeté estuary during typical and atypical periods (EN: El Niño, D: Drought, and LN: La Niña). (*) Not sampled.
Figure 6.
Salinity, pH, oxygen saturation and turbidity recorded in the lower sector of the Caeté estuary during typical and atypical periods (EN: El Niño, D: Drought, and LN: La Niña). (*) Not sampled.
Figure 7.
Dissolved nutrient concentrations recorded in the middle sector of the Caeté estuary during typical and atypical periods (EN: El Niño, D: Drought, and LN: La Niña). (*) Not sampled.
Figure 7.
Dissolved nutrient concentrations recorded in the middle sector of the Caeté estuary during typical and atypical periods (EN: El Niño, D: Drought, and LN: La Niña). (*) Not sampled.
Figure 8.
Dissolved nutrient concentrations recorded in the lower sector of the Caeté estuary during typical and atypical periods. (EN: El Niño, D: Drought, and LN: La Niña). (*) Not sampled.
Figure 8.
Dissolved nutrient concentrations recorded in the lower sector of the Caeté estuary during typical and atypical periods. (EN: El Niño, D: Drought, and LN: La Niña). (*) Not sampled.
Figure 9.
Trophic index recorded in the middle (A) and lower (B) sectors of the Caeté estuary in typical and atypical periods. (EN: El Niño, D: Drought, and LN: La Niña). (*) Data not available.
Figure 9.
Trophic index recorded in the middle (A) and lower (B) sectors of the Caeté estuary in typical and atypical periods. (EN: El Niño, D: Drought, and LN: La Niña). (*) Data not available.
Figure 10.
Chlorophyll a concentrations recorded in the middle (A) and lower (B) sectors of the Caeté estuary during typical and atypical periods. (EN: El Niño, D: Drought, and LN: La Niña).
Figure 10.
Chlorophyll a concentrations recorded in the middle (A) and lower (B) sectors of the Caeté estuary during typical and atypical periods. (EN: El Niño, D: Drought, and LN: La Niña).
Figure 11.
Principal Components Analysis of rainfall and hydrological variables recorded in the middle (A) and lower (B) sectors of the Caeté estuary.
Figure 11.
Principal Components Analysis of rainfall and hydrological variables recorded in the middle (A) and lower (B) sectors of the Caeté estuary.
Table 1.
Correlation matrix for the variables monitored in the middle sector.
Table 1.
Correlation matrix for the variables monitored in the middle sector.
| Variables |
Rainfall |
Salinity |
pH |
DO% |
NO2-
|
NO3-
|
NH4+
|
PO4- |
SiO2
|
Chl a |
| Salinity |
-0.80* |
|
|
|
|
|
|
|
|
|
| pH |
-0.58* |
0.84 |
|
|
|
|
|
|
|
|
| DO% |
0.10 |
-0.14 |
-0.11 |
|
|
|
|
|
|
|
| NO2-
|
-0.40 |
0.45 |
0.21 |
0.13 |
|
|
|
|
|
|
| NO3-
|
-0.38 |
0.17 |
0.14 |
0.13 |
-0.01 |
|
|
|
|
|
| NH4+
|
0.03 |
-0.26 |
-0.15 |
0.23 |
-0.33 |
0.03 |
|
|
|
|
| PO4- |
-0.47* |
0.16 |
-0.15 |
-0.30 |
0.27 |
0.00 |
0.20 |
|
|
|
| SiO2
|
-0.42 |
0.31 |
0.10 |
0.44 |
0.42 |
0.35 |
0.01 |
-0.11 |
|
|
| Chl a |
0.13 |
0.02 |
0.11 |
-0.37 |
0.24 |
-0.11 |
0.01 |
-0.08 |
-0.16 |
|
| Turbidity |
0.00 |
-0.28 |
-0.29 |
0.32 |
-0.16 |
0.41 |
0.30 |
0.17 |
0.13 |
-0.25 |
Table 2.
Correlation matrix for the parameters monitored in the Caeté estuary in lower sector.
Table 2.
Correlation matrix for the parameters monitored in the Caeté estuary in lower sector.
| Variables |
Rainfall |
Salinity |
pH |
DO% |
NO2-
|
NO3-
|
NH4+
|
PO4- |
SiO2
|
Chl a |
| Salinity |
-0.60* |
|
|
|
|
|
|
|
|
|
| pH |
-0.40 |
0.22 |
|
|
|
|
|
|
|
|
| DO% |
0.35 |
-0.26 |
-0.25 |
|
|
|
|
|
|
|
| NO2-
|
0.61* |
-0.63* |
-0.20 |
-0.01 |
|
|
|
|
|
|
| NO3-
|
0.43 |
-0.57* |
-0.47* |
0.45 |
0.71* |
|
|
|
|
|
| NH4+
|
-0.08 |
-0.02 |
0.25 |
-0.29 |
-0.08 |
-0.30 |
|
|
|
|
| PO4- |
-0.36 |
0.36 |
-0.19 |
0.30 |
-0.10 |
0.24 |
-0.31 |
|
|
|
| SiO2
|
0.41 |
-0.52* |
-0.71* |
0.17 |
0.37 |
0.49* |
-0.05 |
-0.03 |
|
|
| Chl a |
0.09 |
0.24 |
0.13 |
0.02 |
0.09 |
-0.26 |
-0.06 |
0.16 |
-0.18 |
|
| Turbidity |
-0.50* |
0.40 |
0.15 |
-0.60* |
-0.08 |
-0.34 |
0.39 |
0.07 |
-0.11 |
0.16 |
|
Disclaimer/Publisher’s Note: The statements, opinions and data contained in all publications are solely those of the individual author(s) and contributor(s) and not of MDPI and/or the editor(s). MDPI and/or the editor(s) disclaim responsibility for any injury to people or property resulting from any ideas, methods, instructions or products referred to in the content. |
© 2024 by the authors. Licensee MDPI, Basel, Switzerland. This article is an open access article distributed under the terms and conditions of the Creative Commons Attribution (CC BY) license (http://creativecommons.org/licenses/by/4.0/).
