Preprint
Article

Crystallization of Calcium Carbonate and Calcium Phosphate Phases in Silica Hydrogel: Morphological and Compositional Characterization

Altmetrics

Downloads

68

Views

28

Comments

0

A peer-reviewed article of this preprint also exists.

Submitted:

20 June 2024

Posted:

20 June 2024

You are already at the latest version

Alerts
Abstract
The present study showcases a series of crystallization experiments using a specially designed double diffusion system to grow crystals belonging to the calcium carbonate-phosphate system. The experimental U-shaped device comprised two vertical solution containers, separated by a horizontal column of silica hydrogel. Each container was filled with 0.5 M CaCl2 and 0.5 M Na2CO3 solutions, which diffused through the gel column over time. Na3PO4 solutions, with 50 and 500 ppm concentrations, were incorporated into the gel in different experiments, resulting in a homogeneous distribution of phosphate concentrations within the diffusion column. After 15 and 30 days incubation period post-nucleation, the crystals formed in different sections of the gel were carefully extracted and studied with scanning electron microscopy and electron microprobe. Additionally, Raman spectra were collected from the samples using a confocal Raman microscope, providing further insights into their molecular composition and structural properties. The obtained results show that under the induced experimental conditions (i) phosphate incorporates into calcite´s structure, and (ii) the growth of calcium phosphates in the presence of carbonate ions involves the sequential, heterogeneous nucleation of CO3-bearing OCP/HAP-like phases with Raman spectral characteristics very similar to those of bioapatites.
Keywords: 
Subject: Environmental and Earth Sciences  -   Geochemistry and Petrology

1. Introduction

Interest in calcium carbonate precipitation is considerable, both to its importance in biomineralization and its several industrial applications. Natural calcium carbonate polymorphs, calcite and aragonite, play a central role in the global cycle of carbon [1]. Due to the fast weathering rates and high buffer capacity associated with the carbonate system, small amounts of CaCO3 may strongly control the geochemical behavior of aquatic systems. The reaction of natural waters with carbonate minerals also exerts an important impact on the chemistry of the atmosphere and oceans, through the interplay established between oceanic acidity levels and atmospheric CO2 solubility [2]. In this framework, calcite is considered a potentially important sink for both anions and cations, due to its reactive nature and ubiquity in groundwater aquifers. Several studies [3,4,5,6,7] regarding the mobility of environmentally relevant anions and cations have therefore focused on the adsorption and co-precipitation with calcite. In general, the role played by foreign ions in the crystallization of minerals relates to the interplay among several factors, ranging from structural incorporation into a growing solid, to adsorption onto specific surface sites [8]. It has been demonstrated that under high supersaturation conditions, foreign ions can easily incorporate into the structure of solids, but in a higher proportion than predicted merely by thermodynamic considerations [9]. Furthermore, such deviation is strongly favored by isomorphic substitutions.
Co-precipitation experiments involving calcite and trace ions, have shown that its crystal lattice tolerates the incorporation of different ions in the crystal structure. As the latter are often of contrasting ionic radius and charge with respect to Ca and CO3, the incorporation of the trace ions often leads to structural distortion. Cations substitute for Ca in the calcite lattice, as for example observed for Cu, Co, Cd, Mg, Zn, Pb and Ba [10,11,12,13,14], whereas anions substitute for the CO32- group, as for example observes for CrO42- [15], SeO42- [16].
Aqueous phosphorous (P) occurs in most natural waters in the form of phosphate (PO43-) [17,18], which is crucial for certain biomineralization processes, and a common compound in soils and aquatic sediments. In agricultural activities, phosphates are widely used as fertilizers in large scale operations. Nevertheless, the combination of soil erosion and the release of P-rich wastewaters to the environment has led to increasing phosphate concentrations in both freshwater aquifers as well as in the oceans [19]. The result has been the ongoing hipertrophication of freshwaters and the coastal marine environment, with the subsequent degradation of water quality and the onset of toxic algae blooms. The disturbance of the terrestrial P cycle by human activity requires a proper understanding of the chemical processes regulating aqueous phosphate concentrations, to predict future anthropogenic effects [19]. One of the mechanisms controlling the bioavailability and mobility of phosphorus in the environment are the sorption/de-sorption mechanisms involving soils and sediments. The uptake of phosphate by minerals may proceed via adsorption (the coordination of the anion to the mineral surface), co-precipitation (the anion substitutes for lattice ions, and is thus incorporated into the mineral structure) and precipitation of phosphate-bearing phases [20]. Frequently, natural phosphate is present in low concentrations, thus preempting precipitation. In such cases, adsorption is rather the initial step, after which co-precipitation or formation of solid solutions may occur.
The link between calcium phosphate and carbonate systems is of special relevance to the investigation of biomineralization processes, especially those involving bioapatites. These non-stoichiometric materials may include several types of impurities (Mg, Na, K, CO3, etc.), whose physiologically controlled concentrations determine the mechanical properties and reactivity of each kind of hard tissue (i.e., dentin, bone, enamel). A compelling summary of the crystal-chemical characteristics of bioapatites, alongside their possible reactive pathways, is provided by [21]. Within the broad field of biologically produced calcium phosphates, the study of octacalcium phosphate (OCP) has also garnered significant interest due to its critical role in biomineralization mechanisms, and its potential applications in biomedical fields, particularly hard-tissue regeneration. OCP, chemically defined as Ca8(HPO4)2(PO4)4·5H2O, is a compound recognized for its precursor role in the formation of biological apatites, such as bone and tooth enamel. This phase is primarily characterized by a triclinic crystallographic structure, hence triclinic OCP (t-OCP) [22]. This form of OCP is defined by a specific chemical composition and structural typology, which have been extensively studied and documented [23,24,25], and references therein]. However, several other OCP-like phases, with similar compositions but differing structures, have also been identified, including apatitic OCP (ap-OCP), amorphous OCP (am-OCP), and carbonated OCP. Each of these phases exhibits unique properties and potential applications, particularly in the field of biomaterials [22,26,27]. Many studies have identified the crucial role of octacalcium phosphate (OCP), characterized by its water-rich composition, in the early stages of bone mineralization, acting as a transient precursor of hydroxyapatite (HAP) under physiological conditions [23,28,29,30,31]. This transformation is facilitated by the epidictic relationship between the structures of OCP and HAP, where nuclei of the former provide a template for crystal growth of the latter. The formation of OCP-HAP mixtures involves several mechanisms, with epitactic growth being a key process where the structural similarity between the (100) planes of OCP and HAP allows for a seamless transition [32,33,34,35,36].
Since numerous biomineralization processes occur in gelatinous matrices, the characteristics of reactant transport in hydrogels make them a suitable media to feasibly reproduce the crystallization conditions encountered in geo-biological environments [37,38,39]. Moreover, the possibility of preparing gels with different contents of foreign ions, their stability in a wide range of temperatures and the induced high degree of supersaturation [40,41,42] enables the use of these nanoporous media to grow crystals incorporating significant amounts of foreign ions.
The present investigation focuses on the analysis and discussion of morphological, structural, and chemical changes undergone by carbonate and phosphate crystals, grown in different silica gel media, by means of micro-Raman spectroscopy and Electron Microprobe studies. The obtained results show that: (i) phosphate incorporates into the calcite structure under our experimental conditions, and (ii) the growth of calcium phosphates in the presence of carbonate ions, involves the sequential, heterogeneous nucleation of CO3-bearing OCP/HAP-like phases with Raman spectral characteristics very similar to those of bioapatites.

2. Materials and Methods

The crystallization experiments were performed in a double diffusion system consisting of two vertical branches separated by a column of silica hydrogel. The vertical branches were filled with 0.5 M CaCl2 and 0.5 M Na2CO3 solutions, which diffused through the gel column over time. Na3PO4 solutions, with 50 and 500 ppm concentrations, were incorporated into the gel in different experiments, resulting in a homogeneous distribution of phosphate concentrations within the diffusion column. The silica hydrogel column was 125 mm long and 9 mm in diameter. The gel was prepared by adding 1 N HCl to a sodium silicate solution (Na2SiO3) (Merck KGaA, sp. gr.: 1.509 g/cm3; pH = 11.2) until pH = 5.5 was reached. Upon starting the experiments, the reactants are brought together by diffusion through the gel and, subsequently, nucleation and crystal growth occurs by chemical reaction within the gel column. Crystal growth was monitored by optical microscopy. The experiments, performed in triplicate, were stopped after two different time periods: 15 days and 1 month after the initial nucleation, and the crystals were extracted by dissolving the gel in a 1 M NaOH solution. All experiments were carried out at 25 °C. Crystals with representative morphologies were hand-picked and characterized using Raman spectroscopy, scanning electron microscopy, and electron microprobe (EMPA analysis and EDXS mapping).
Raman spectra of the samples were collected using a confocal Thermo Fischer DXR Raman spectrometer equipped with a confocal microscope with a point-and-shoot Raman capability of one micron spatial resolution. The objective selected was of 10x together with a laser source 532 nm at 10mV in a laser mode power at 100%. The average spectral resolution of the Raman shift ranging from 70 to 3300 cm−1 was 2-4 cm−1, i.e., grating 900 lines/mm and a spot size of 2 μm. The system was operated under OMNIC 1.0 software fitting working conditions such as pinhole aperture of 25 μm and bleaching time of 1-2 s; four exposures averaged in time of 12 s each. Peak deconvolution was carried out using the software package Fityk [43].
To study the crystal morphologies and the textural characteristics, the samples were carbon coated and inspected with a SEM microscope (JEOL JSM 6400, 40 kV) equipped with an EDX microanalysis detector (INCA systems). The idealized shape of the calcite crystal was modeled with the KrystalShaper software package (JCrystalSoft) [44].
Carbon-coated polished samples were used for the microprobe measurements. The samples were analyzed for Ca and P elements using a Jeol JXA 8900 microprobe. The spot analyses were done with an acceleration voltage of 15 kV, a probe current of 10 nA and a defocused beam with a diameter of 5 µm. Distribution maps for major elements were measured with a dwell time of 5 ms at a beam time current of 20 nA at 10 kV.

3. Results

3.1. Solid Morphologies

3.1.1. Inert Silica Gel Growth Experiments

In the absence of phosphate (mixture I in Table 1) the waiting time for the first nuclei to precipitate in the gel was of 216 hours (measured since the solutions were placed in the U-tube). One month after nucleation time, we observed precipitates exhibiting three different morphologies: a) Rhombohedral single crystals, bounded by rough faces depressed in their central region (hopper-like habit), and whose morphology is compatible with the {1014} form of the calcite (Figure 1a), b) flat flower-like aggregates that consist of fan-shaped crystallites (Figure 1b) and c) radial aggregates consisting of acicular crystallites (Figure 1c). The size of the crystals/aggregates are ranged between 200-500μm. The rhombohedral crystals are significantly more abundant than those of flower-like and radial morphologies.

3.1.2. 50 ppm P-Bearing Silica Gel Growth Experiments

In growth experiments using low amount of Na2PO4 (Table I, mixture II) the waiting time for the first nuclei to precipitate was also ~216 hours. In these experiments, we only observed elongated crystals with a faint blocky habit characterized by the emergence of rounded pseudofacets slightly misoriented between one to each (Figure 2a). This habit is mainly controlled by a more acute rhombohedron. Such crystals have also a slight but appreciable cleft in the equatorial region. The morphology of these crystal is compatible with a calcite crystal elongated along [001], bounded by the acute {0221} rhombohedron and bi-terminated by the {1014} form (Figure 2c). These habits are typical of calcite crystals grown in the presence of certain impurities [15,16,40,45].

3.1.3. 500 ppm P-Bearing Silica Gel Growth Experiments

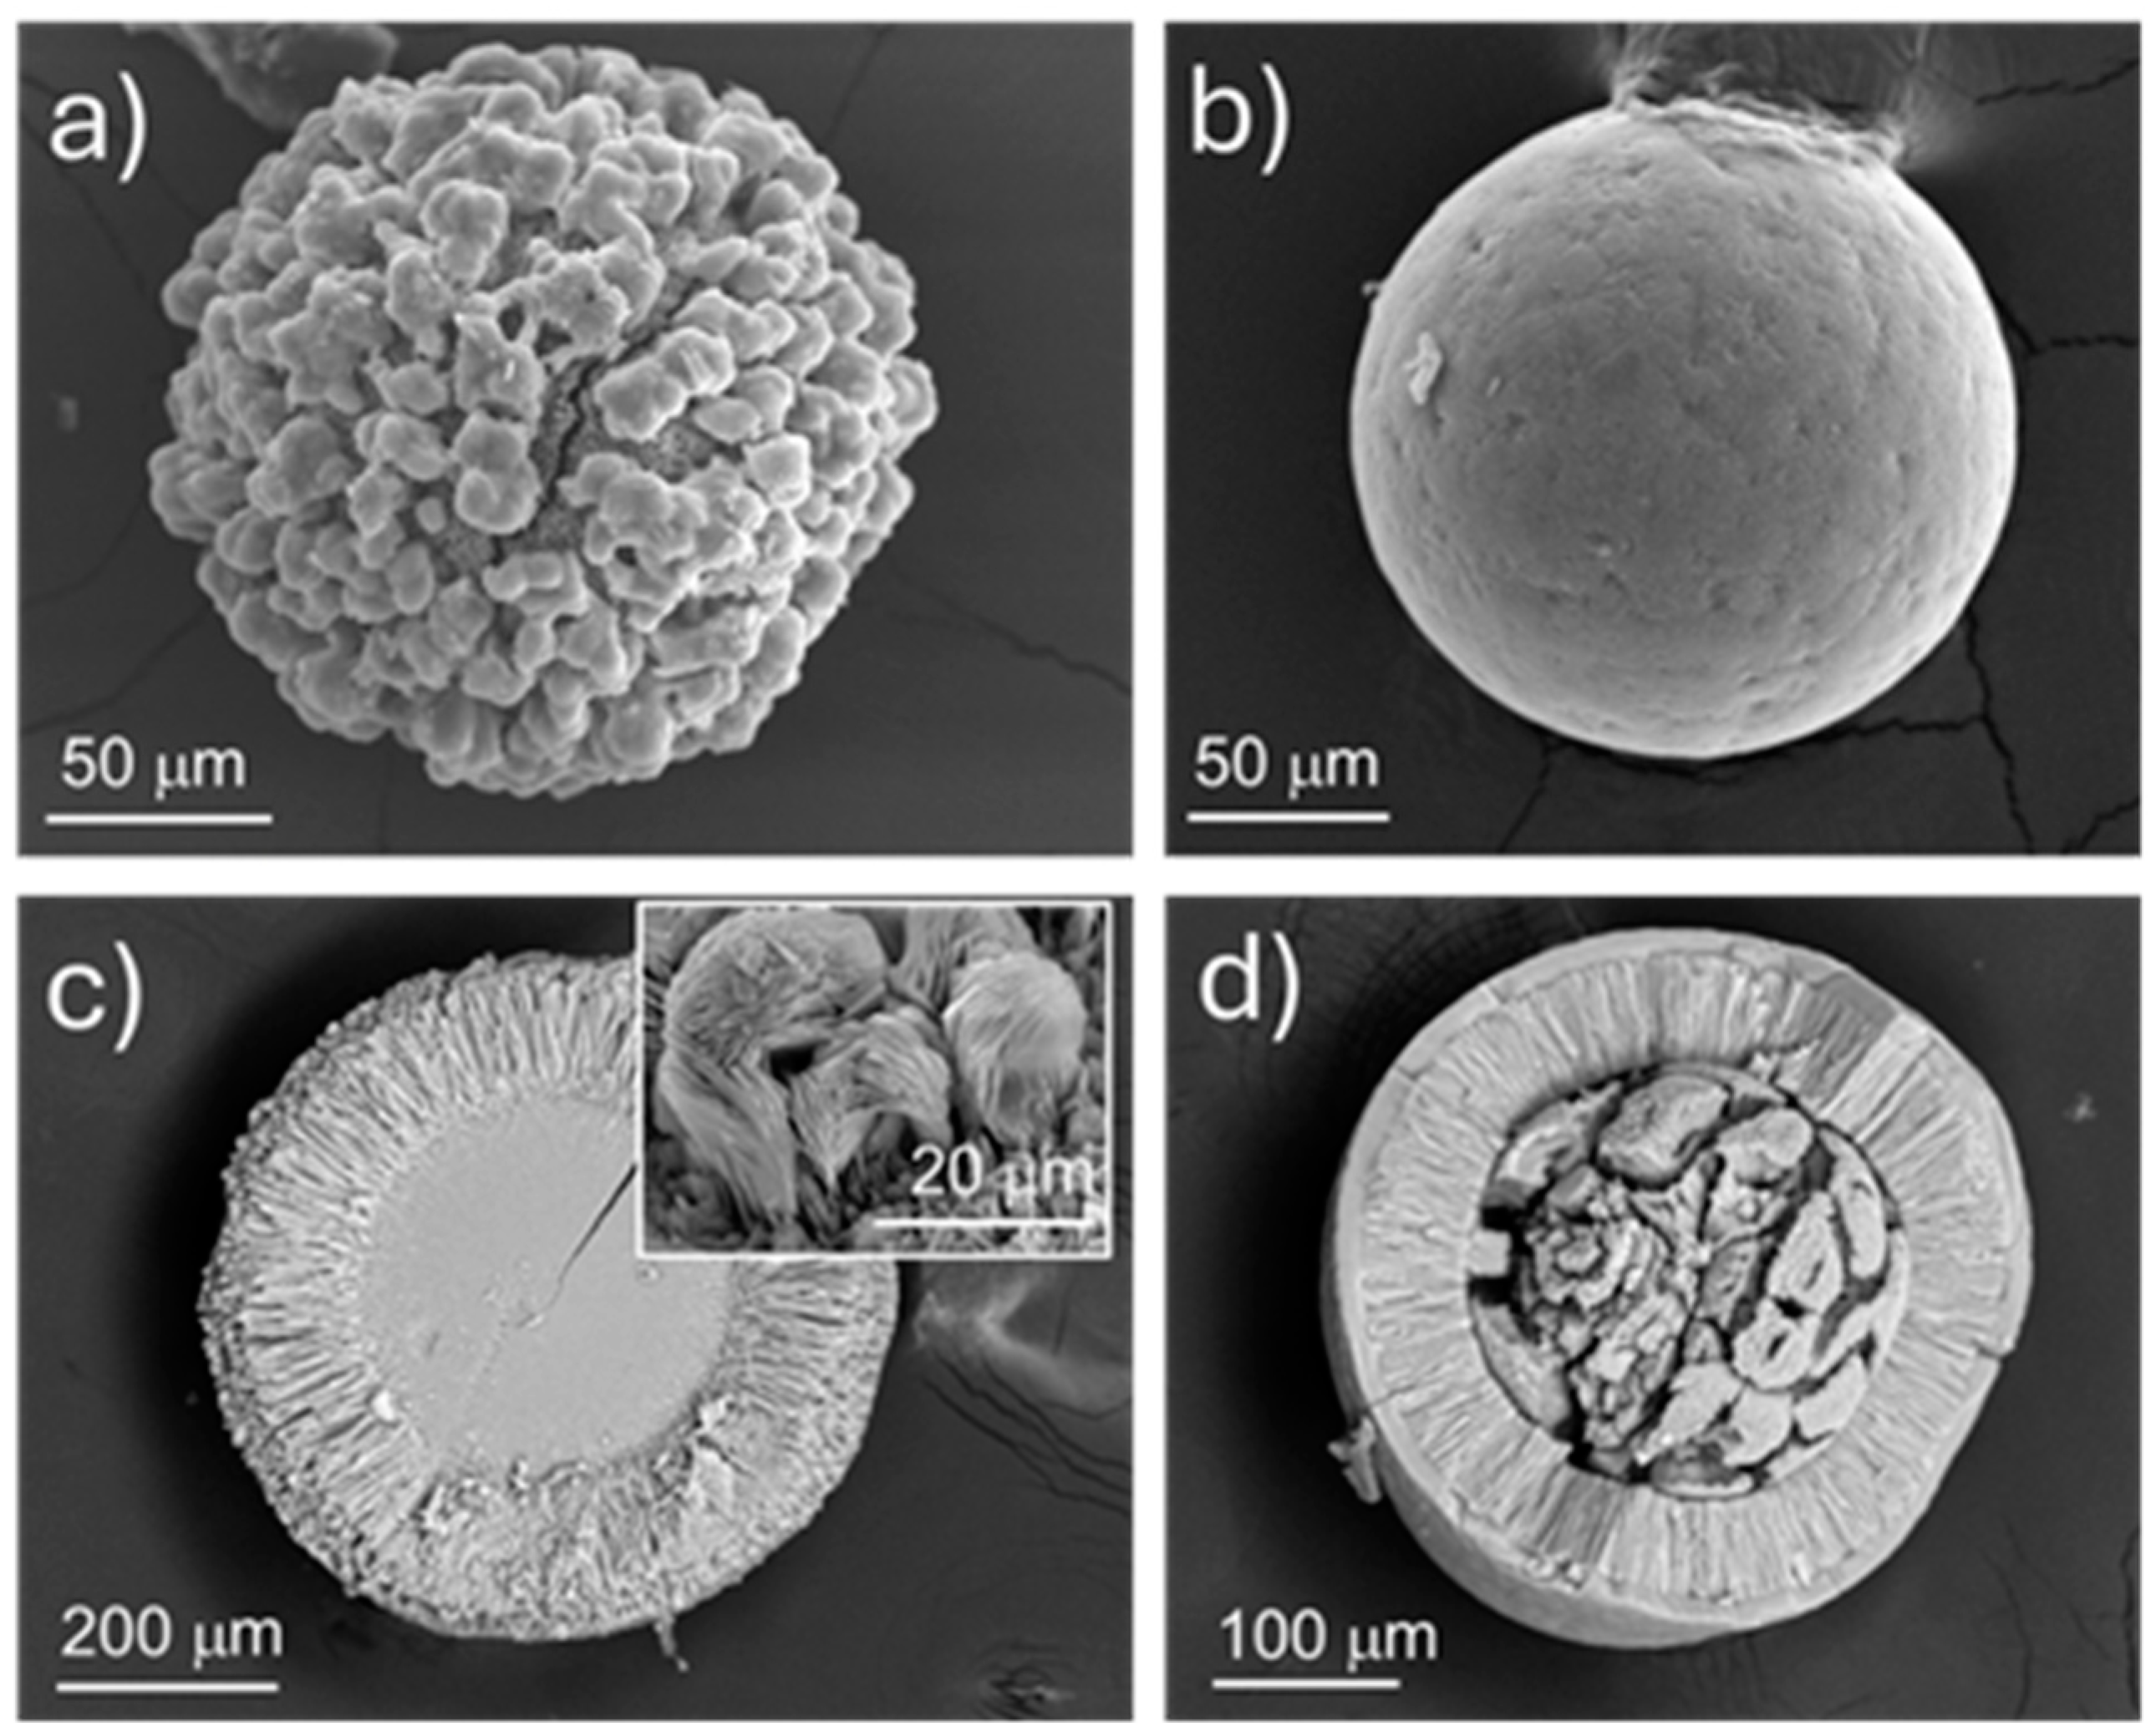
In the growth experiments using high concentrations of Na2PO4 (Table I, mixture III) it was possible to distinguish two different nucleation events. The first occurred ~168 hours after pouring the reagents into the branches of the tubes, while the second nucleation event occurred after 360 hours. The precipitates formed in the first event showed spherical morphologies. Figure 3 displays SEM images of these solids removed from the gel after 15 days (Figure 3a and c) and one month (Figure 3b and d) after the first nuclei appeared. Though the precipitates obtained are spherical in shape, their cross-section reveals a complex layered texture from core to rim, composed of aggregates with different habits and morphologies. Figure 3c displays a section of such aggregates, evidencing an anhedral, massive core, overgrown by a ~150 µm thick layer made up of radially arranged, bladed crystals, defining a stockade-like structure. The inset of Figure 3c shows that, on the outside, these undergo a splitting and a loss of co-orientation, resulting in the formation of rosettes comprised of flat plates. The aggregate illustrated by Figure 3d, relative to the same experimental conditions but collected after one month after the first nucleation, shows the presence of an outer compact layer of ~10 mm thickness. It is worth noting the change in morphology undergone by the core of the aggregates, occurred within the period 15 days < h < one month, since Figure 3d reveals a core which is no longer massive, comprising subhedral crystals of apparently elongated shapes.
The second event of nucleation occurred after 360 hours. Elongated crystals (Figure 2b) similar to that observed in experiments using low amount of Na2PO4 were observed. However, in this case, crystals lack of pseudofacets and the equatorial cleft, and their faces are striated and bounded by rounded edges.

3.2. Raman Spectroscopy

Solids nucleated and grown in the present experiments frequently included aggregates displaying microscopic features, whose nature was suitably assessed with micro-Raman.

3.2.1. Inert Silica Gel Growth Experiments

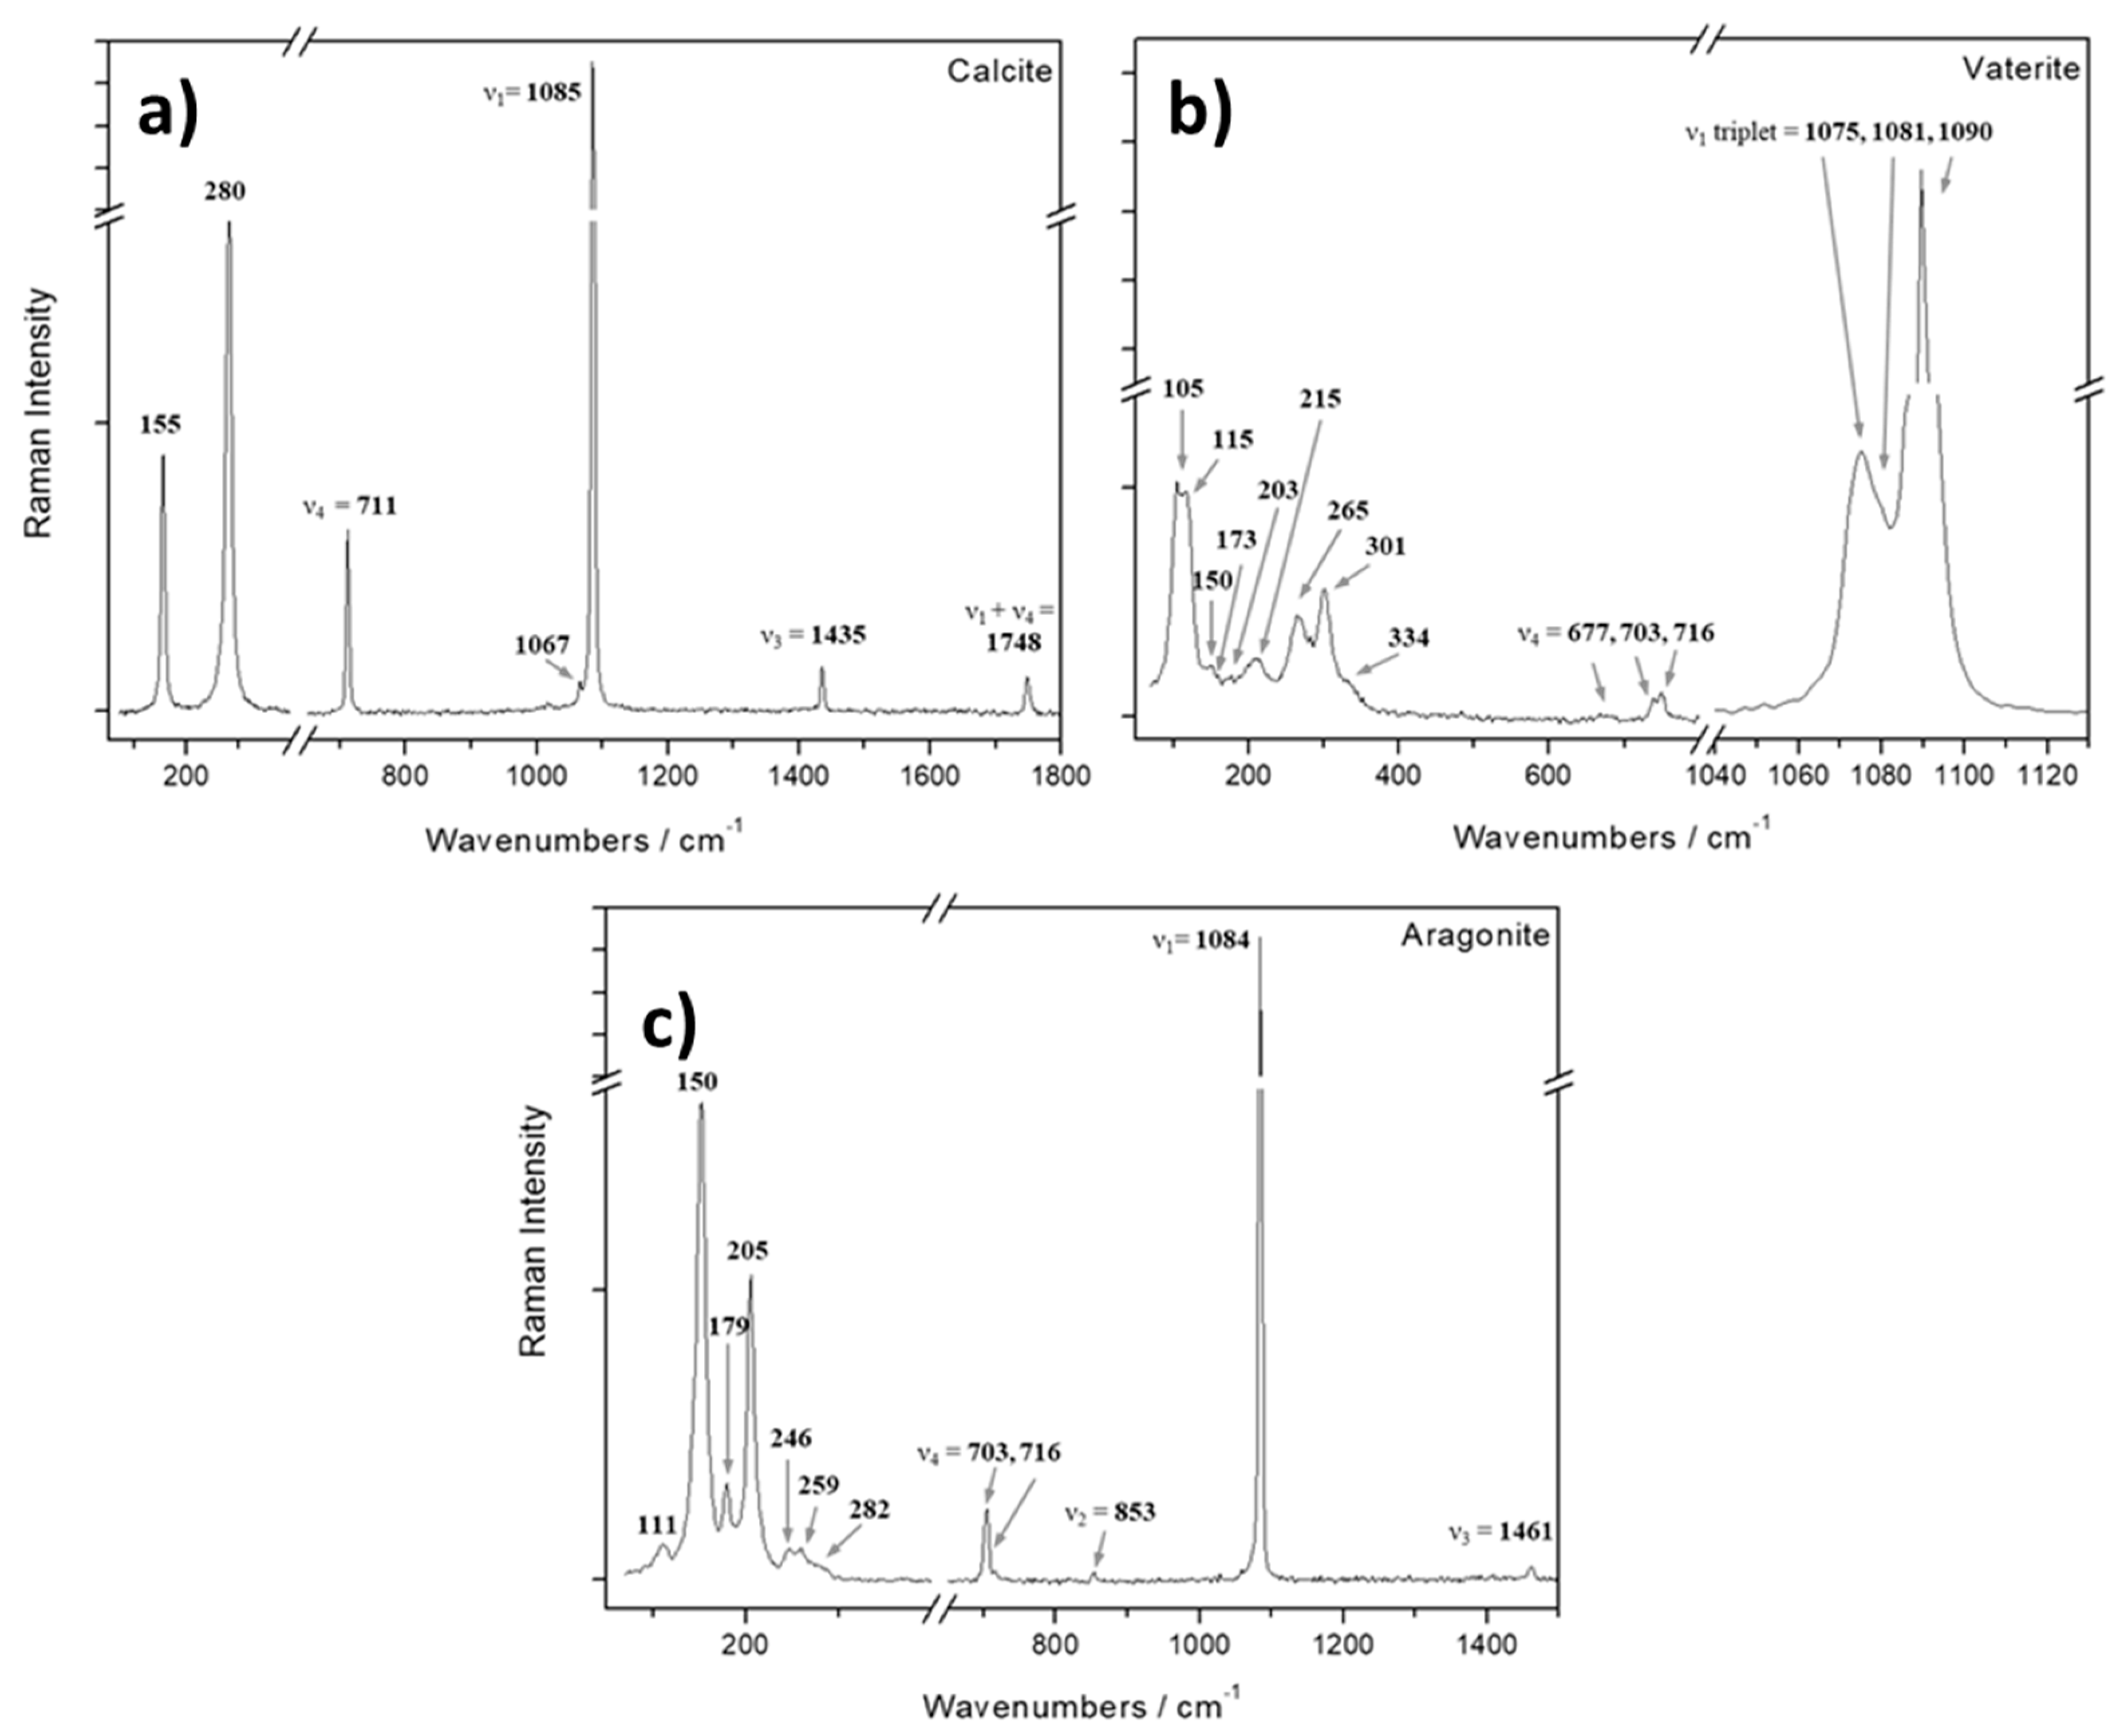
Figure 4 shows the Raman spectra of the three different morphologies found in the P-free experiments. In the case of the rhombohedral crystals (Figure 4a), five bands have been identified. The three with the larger frequencies (1435, 1085 and 711 cm-1) arise from the internal vibrations of the CO32- groups contained in the crystal. The intense band (ν1) corresponds to the symmetric stretching of CO32- group at 1085 cm-1. The ν2 (asymmetric deformation) vibration mode is not active in Raman. The values attributed to ν3 (asymmetric stretching) and ν4 modes (symmetric deformation) are 1435 cm-1 and 711 cm-1, respectively. Moreover, the principal Raman frequency ν1 is accompanied by a satellite at 1067 cm-1 [46]. The observed vibrational bands fit to well-documented values of experimental and natural calcites [47,48]. The lower wavenumbers of calcite (280 and 155 cm-1) observed in the spectrum arise from the external vibration of the CO32- groups that involve translatory and rotator oscillations of those groups (relative translations between the cation and anionic group) [46]. A weak line observed at 1749 cm-1 may be regarded as the combination band of ν1 + ν4 [48].
The Raman spectrum of flat crystals showing the flower-like morphology can be seen in Figure 4b. In this case, only the frequencies corresponding to the ν1 and ν4 vibration modes are visible. A triplet 1075-1081-1090 cm-1 can be observed with a high intensity in the ν1 region and another three lines at 677, 703 and 716 cm-1 arise in the ν4 region. This spectrum is in good agreement with that of vaterite. The ν2 and ν3 bands were not detected probably due to the presence of fluorescence and the weak intensities. In the low-frequency translational and rotational lattice region mode, nine Raman bands are observed. These vibrations together with the triplet in the symmetric stretching region help to clearly differentiate this polymorph from calcite which only has two bands at the low-frequency region. The presence of extra lattice modes is consistent with the large number of molecules in the unit cell (z = 12) of the vaterite crystals compared with the lower number of molecules (z = 2) in the unit cell of the calcite crystal [49].
Finally, the Raman spectrum of the spherulitic aggregates can be seen in Figure 4c. The bands shown in this spectrum are consistent with aragonite. In the characteristic Raman spectrum of aragonite, the rotational and translational lattice modes appear in the low-frequency region (100-350 cm-1), whereas the internal fundamental modes of vibration of the carbonate ions appear in the high-frequency region (600-1800 cm-1). This spectrum is governed by the very strong Raman line (1085 cm-1) attributed to the ν1 symmetric stretching mode of the carbonate group. The ν4 mode of CO32- has values at 703 and 716 cm-1. The ν2 vibration mode is observed as a very weak band at 852 cm-1; this vibrational mode is only permitted for the aragonite crystal structure. In the ν3 region we were able only to observe a single band at 1461 cm-1 rather than a doublet as reported by [50]. The low intensity bands in the region of 100-300 cm-1 arise from translational and rotational modes of lattice vibration. The positions of the observed Raman bands agree with those reported by [51].

3.2.1. 50 ppm P-Bearing Silica Gel Growth Experiments

In Figure 5a, the spectrum obtained after analyzing the elongated calcite crystals along the [100] direction can be observed. As shown, the spectrum exhibits characteristics very similar to those presented in the previous section for pure calcites, with the exception of the appearance of a new band, located at 965 cm-1, near the symmetric stretching C-O ν1 band. The detail of this band can be seen in Figure 5b. This figure shows the Raman band assigned to the P-O vibration located at 965 cm-1 for calcite crystals obtained from experiments from Mixture II (P-bearing 50 ppm) recovered from the gel 15 days from the first nucleation event (in red), for crystals from the same Mixture II obtained one month after the first nucleation event (in black), and for calcite crystals obtained from experiments from Mixture III (P-bearing 500 ppm) recovered from gel 15 days after nucleation. As can be observed, there is a significant increase in the intensity of the band for the crystals grown with a higher amount of P in the medium (green band for 500 ppm crystals). The presence of this band can be attributed to the incorporation of PO43- into the calcite structure.

3.2.2. 500 ppm P-Bearing Silica Gel Growth Experiments

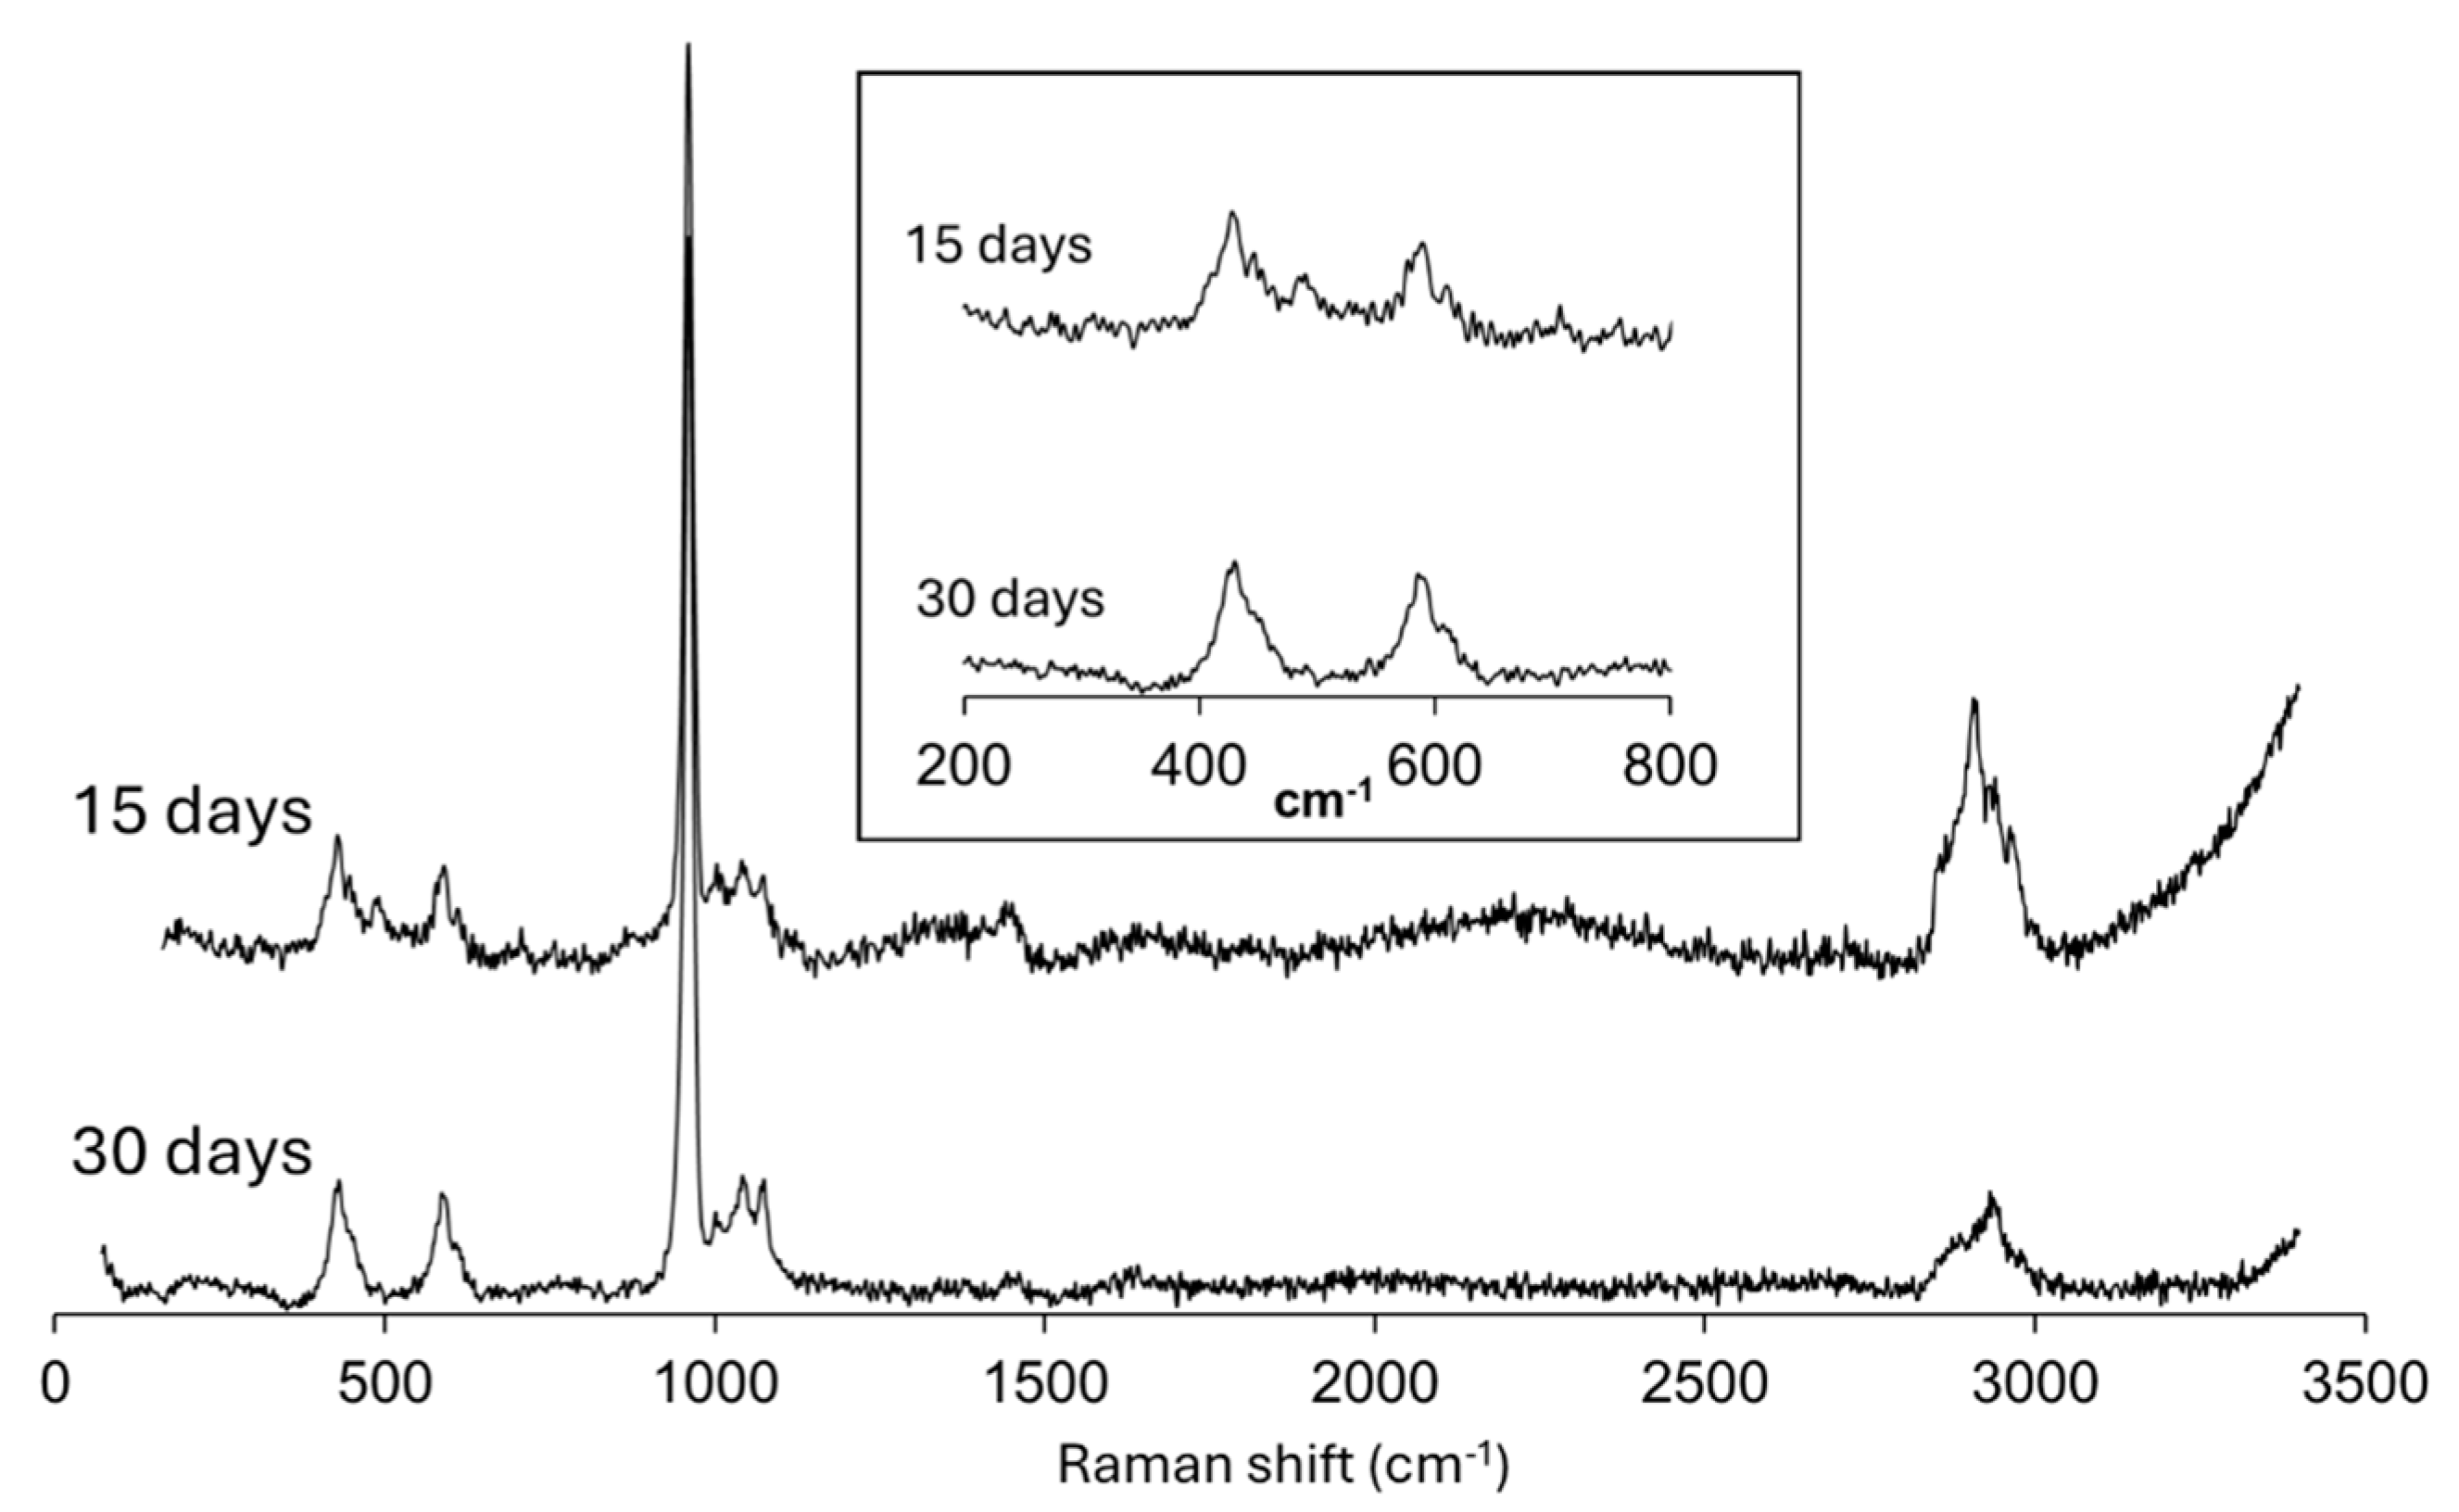
Figure 6 displays Raman spectra targeting the core of solid aggregates obtained in experiment from Mixture III, 15 days and 30 days after the first nucleation. The comparison of the overall spectral profile in the 150 < cm-1 < 3400 shift range reveals a very similar set of peaks in the vicinities of 450, 600, 1000, 1450 and 2800 cm-1, but with a decrease in peak broadening and noise, from 15 to 30 days. These spectrum modifications occur in tandem with the morphological variation shown in Figures 3 c and b, from massive to an intergrowth of subhedral crystal individuals.
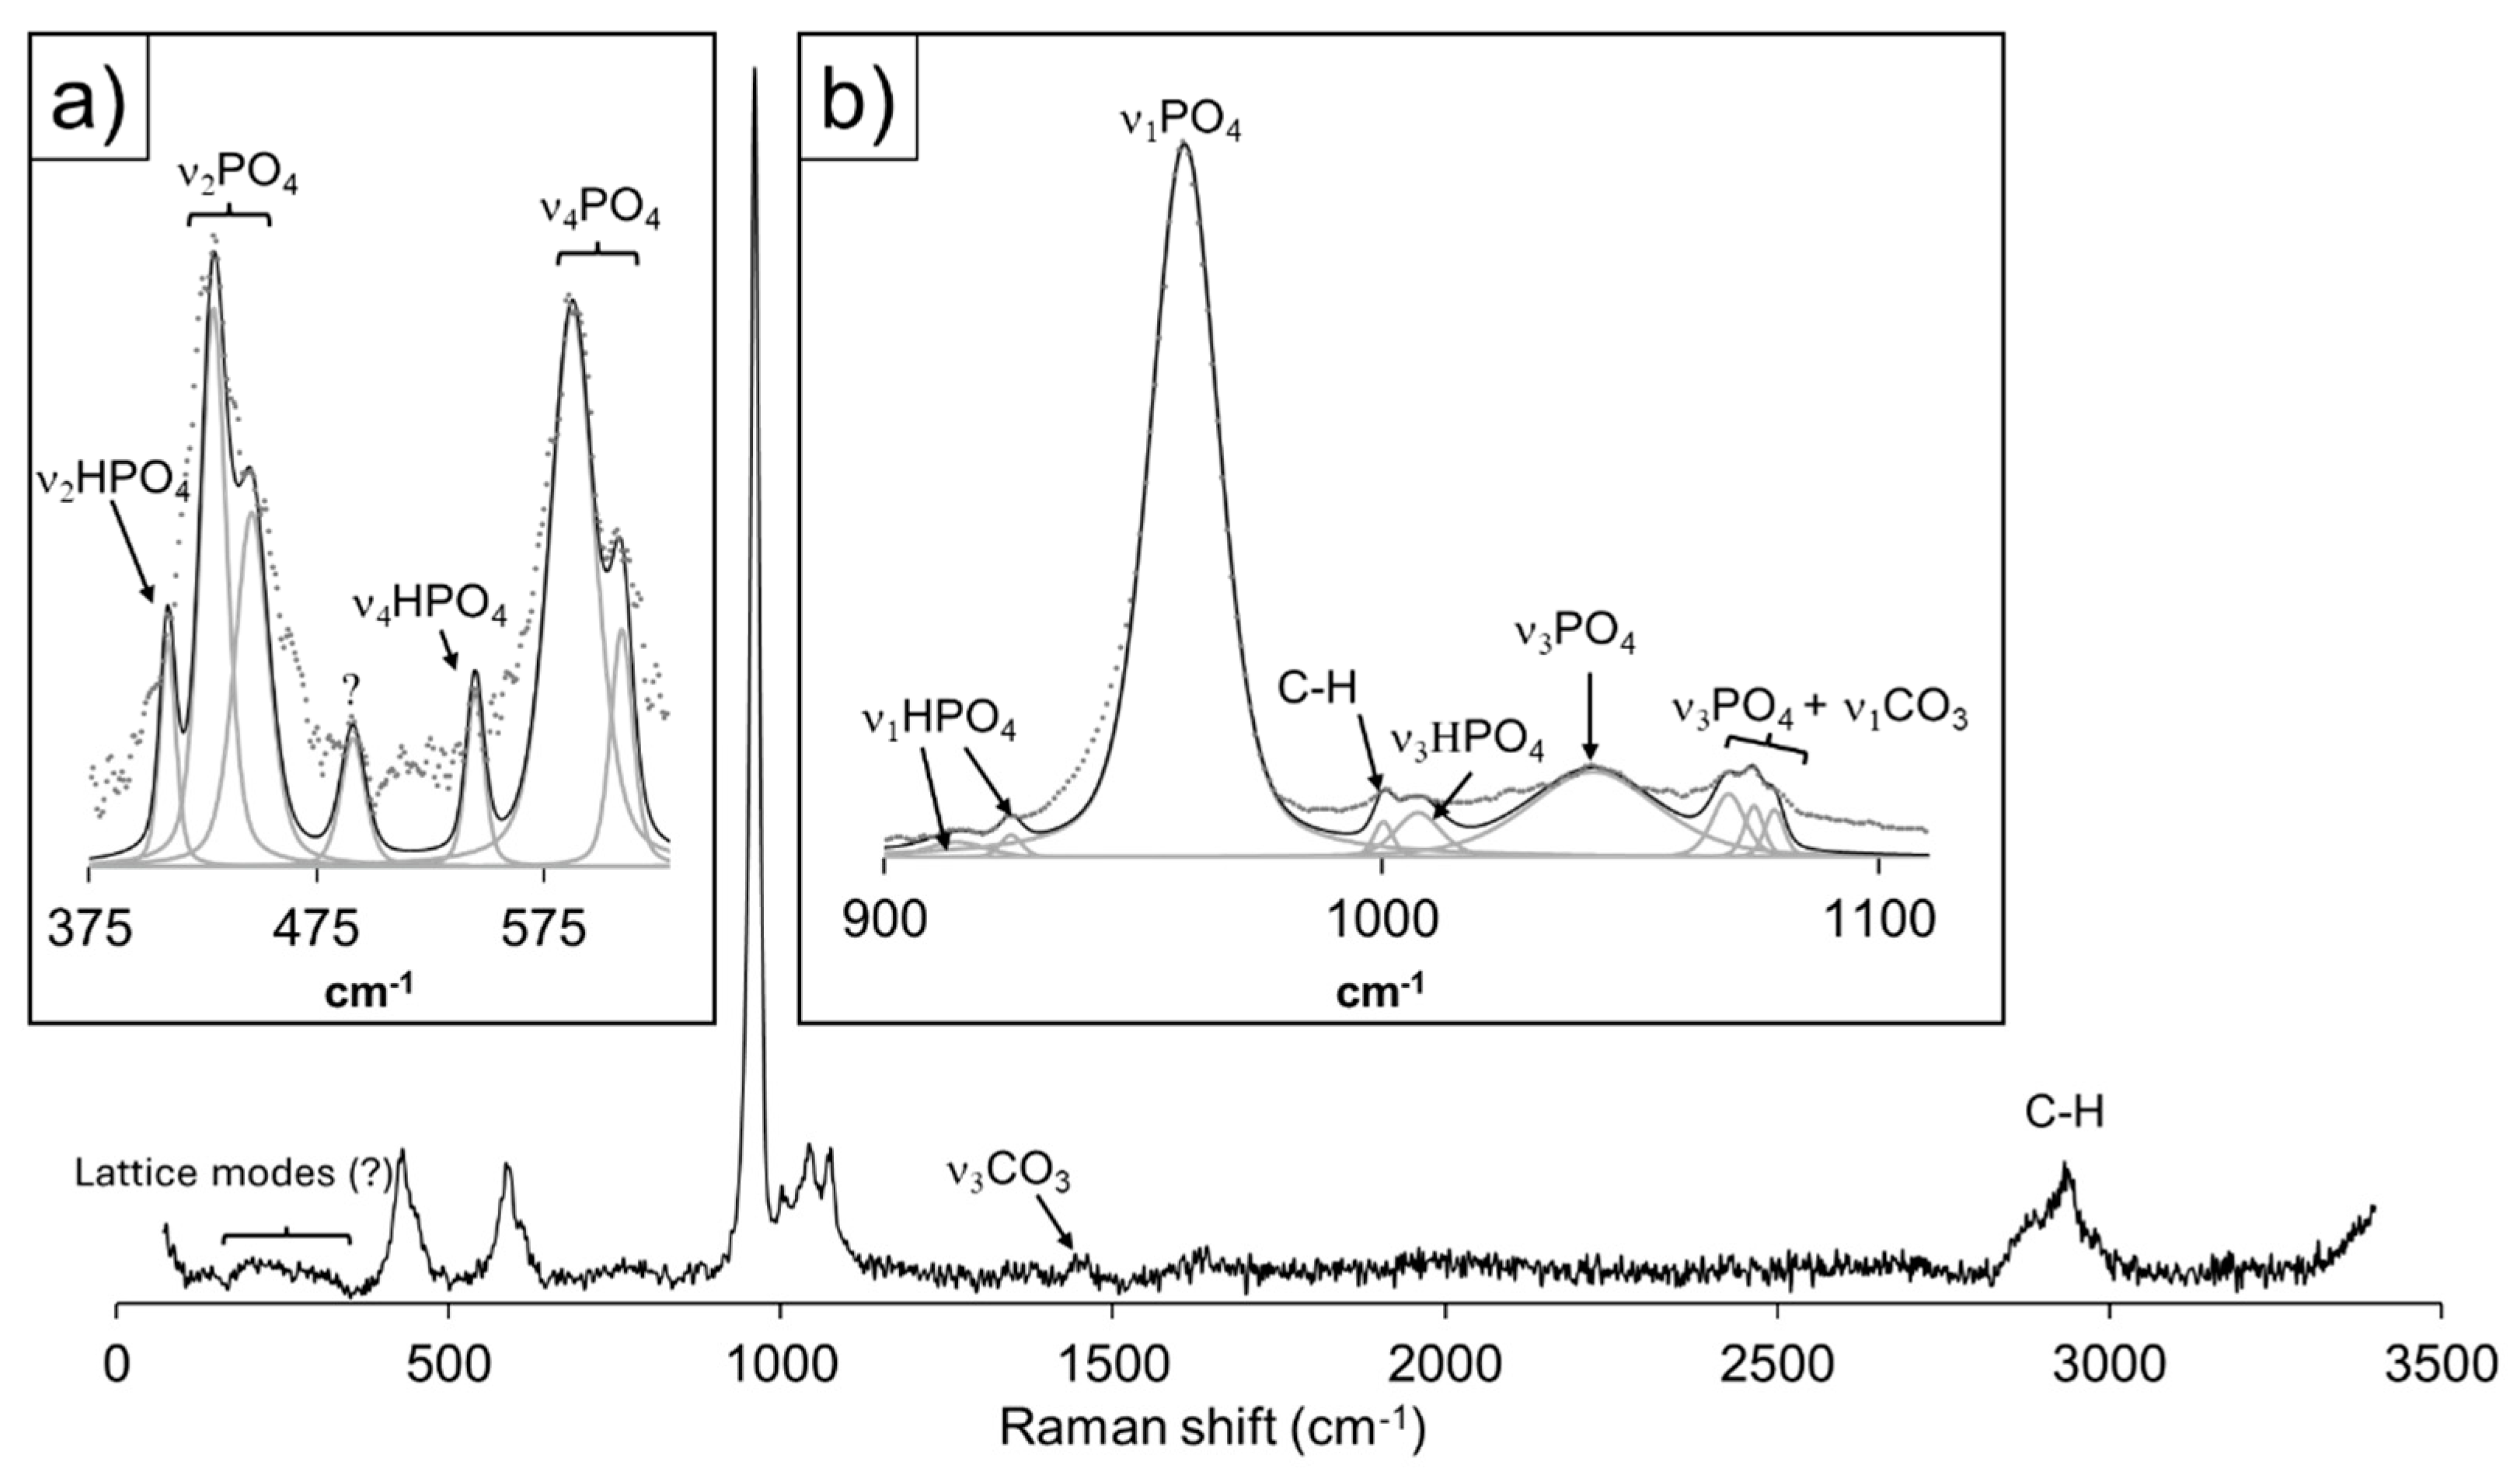
Figure 7 shows the detailed spectral analysis of the Raman results focusing on the core of spheres recovered from the gel 30 days after the first nucleation. For the band assignation concerning the vibrational modes of phosphate groups, we have relied on the work of [52,53,54,55,56,57,58], which suggest a good level of agreement with the overall spectra of octacalcium phosphate, Ca8(HPO4)2(PO4)4·5H2O (OCP), and/or hydroxyapatite, Ca5(PO4)3OH (HAP). The peaks in the 325 < cm-1 < 625 (Figure 7a) can be ascribed to the symmetric (ν2) and (ν4) antisymmetric bending vibrational modes of PO43- groups at 430, 447 and 588, 610 cm-1, respectively. Within the mentioned range, bands relative to vibrational motions of HPO42- occur, namely the symmetric ν2 and antisymmetric ν4 bending modes. Figure 7b reveals the band deconvolution performed in the 900 < cm-1 < 1100 interval, dominated by a very intense peak, ascribed to the symmetric stretching mode (ν1) of PO43- groups.
The peaks in the 325 < cm-1 < 625 (Figure 7a) can be ascribed to the symmetric (ν2) and (ν4) antisymmetric bending vibrational modes of PO43- groups at 430, 447 and 588, 610 cm-1, respectively. Within the mentioned range, bands relative to vibrational motions of HPO42- occur, namely the symmetric ν2 and antisymmetric ν4 bending modes. Figure 7b reveals the band deconvolution performed in the 900 < cm-1 < 1100 interval, dominated by a very intense peak, ascribed to the symmetric stretching mode (ν1) of PO43- groups. Though the remaining peaks in this interval are comparatively less intense and broad, it is possible to assign them to the antisymmetric stretching modes (ν3) of PO43- at 1043 and 1074 cm-1, and the HPO42- antisymmetric stretching mode (ν3) at 1007 cm-1. Regarding the latter phosphate group, the two low intensity peaks at 914 and 925 cm-1 may be attributed to its symmetric stretching mode ν1. The remaining peaks within this shift interval can´t be ascribed to the vibrational characteristics of phosphate groups. The peak at 1000 cm-1 is attributable to C-H bonds in apatite [59], with bands also occurring at 2876 and 2935 cm-1, while CO32- symmetric (ν1) and antisymmetric (ν3) stretching bands are observable at 1079 and 1451 cm-1. The former mode is ascribed to carbonate groups in B-type apatite by [59], and the latter to the same anion in the structure of aragonite, CaCO3 (Arg) [51]. It is worth noting that a low intensity, very broad hump spans the energy shifts in the 160 < cm-1 < 350 spectral region, where the lattice modes of vaterite, CaCO3 (Vtr) may be found [51]. The variable Ca/P (~1.8-1.3) and high, also uneven, volatile content (~ 60-40% of total analysis by weight difference, see Table S4 in the supplementary information) revealed by multiple EMP analysis, strongly suggests the co-nucleation of calcium phosphate and carbonate phases at the core.
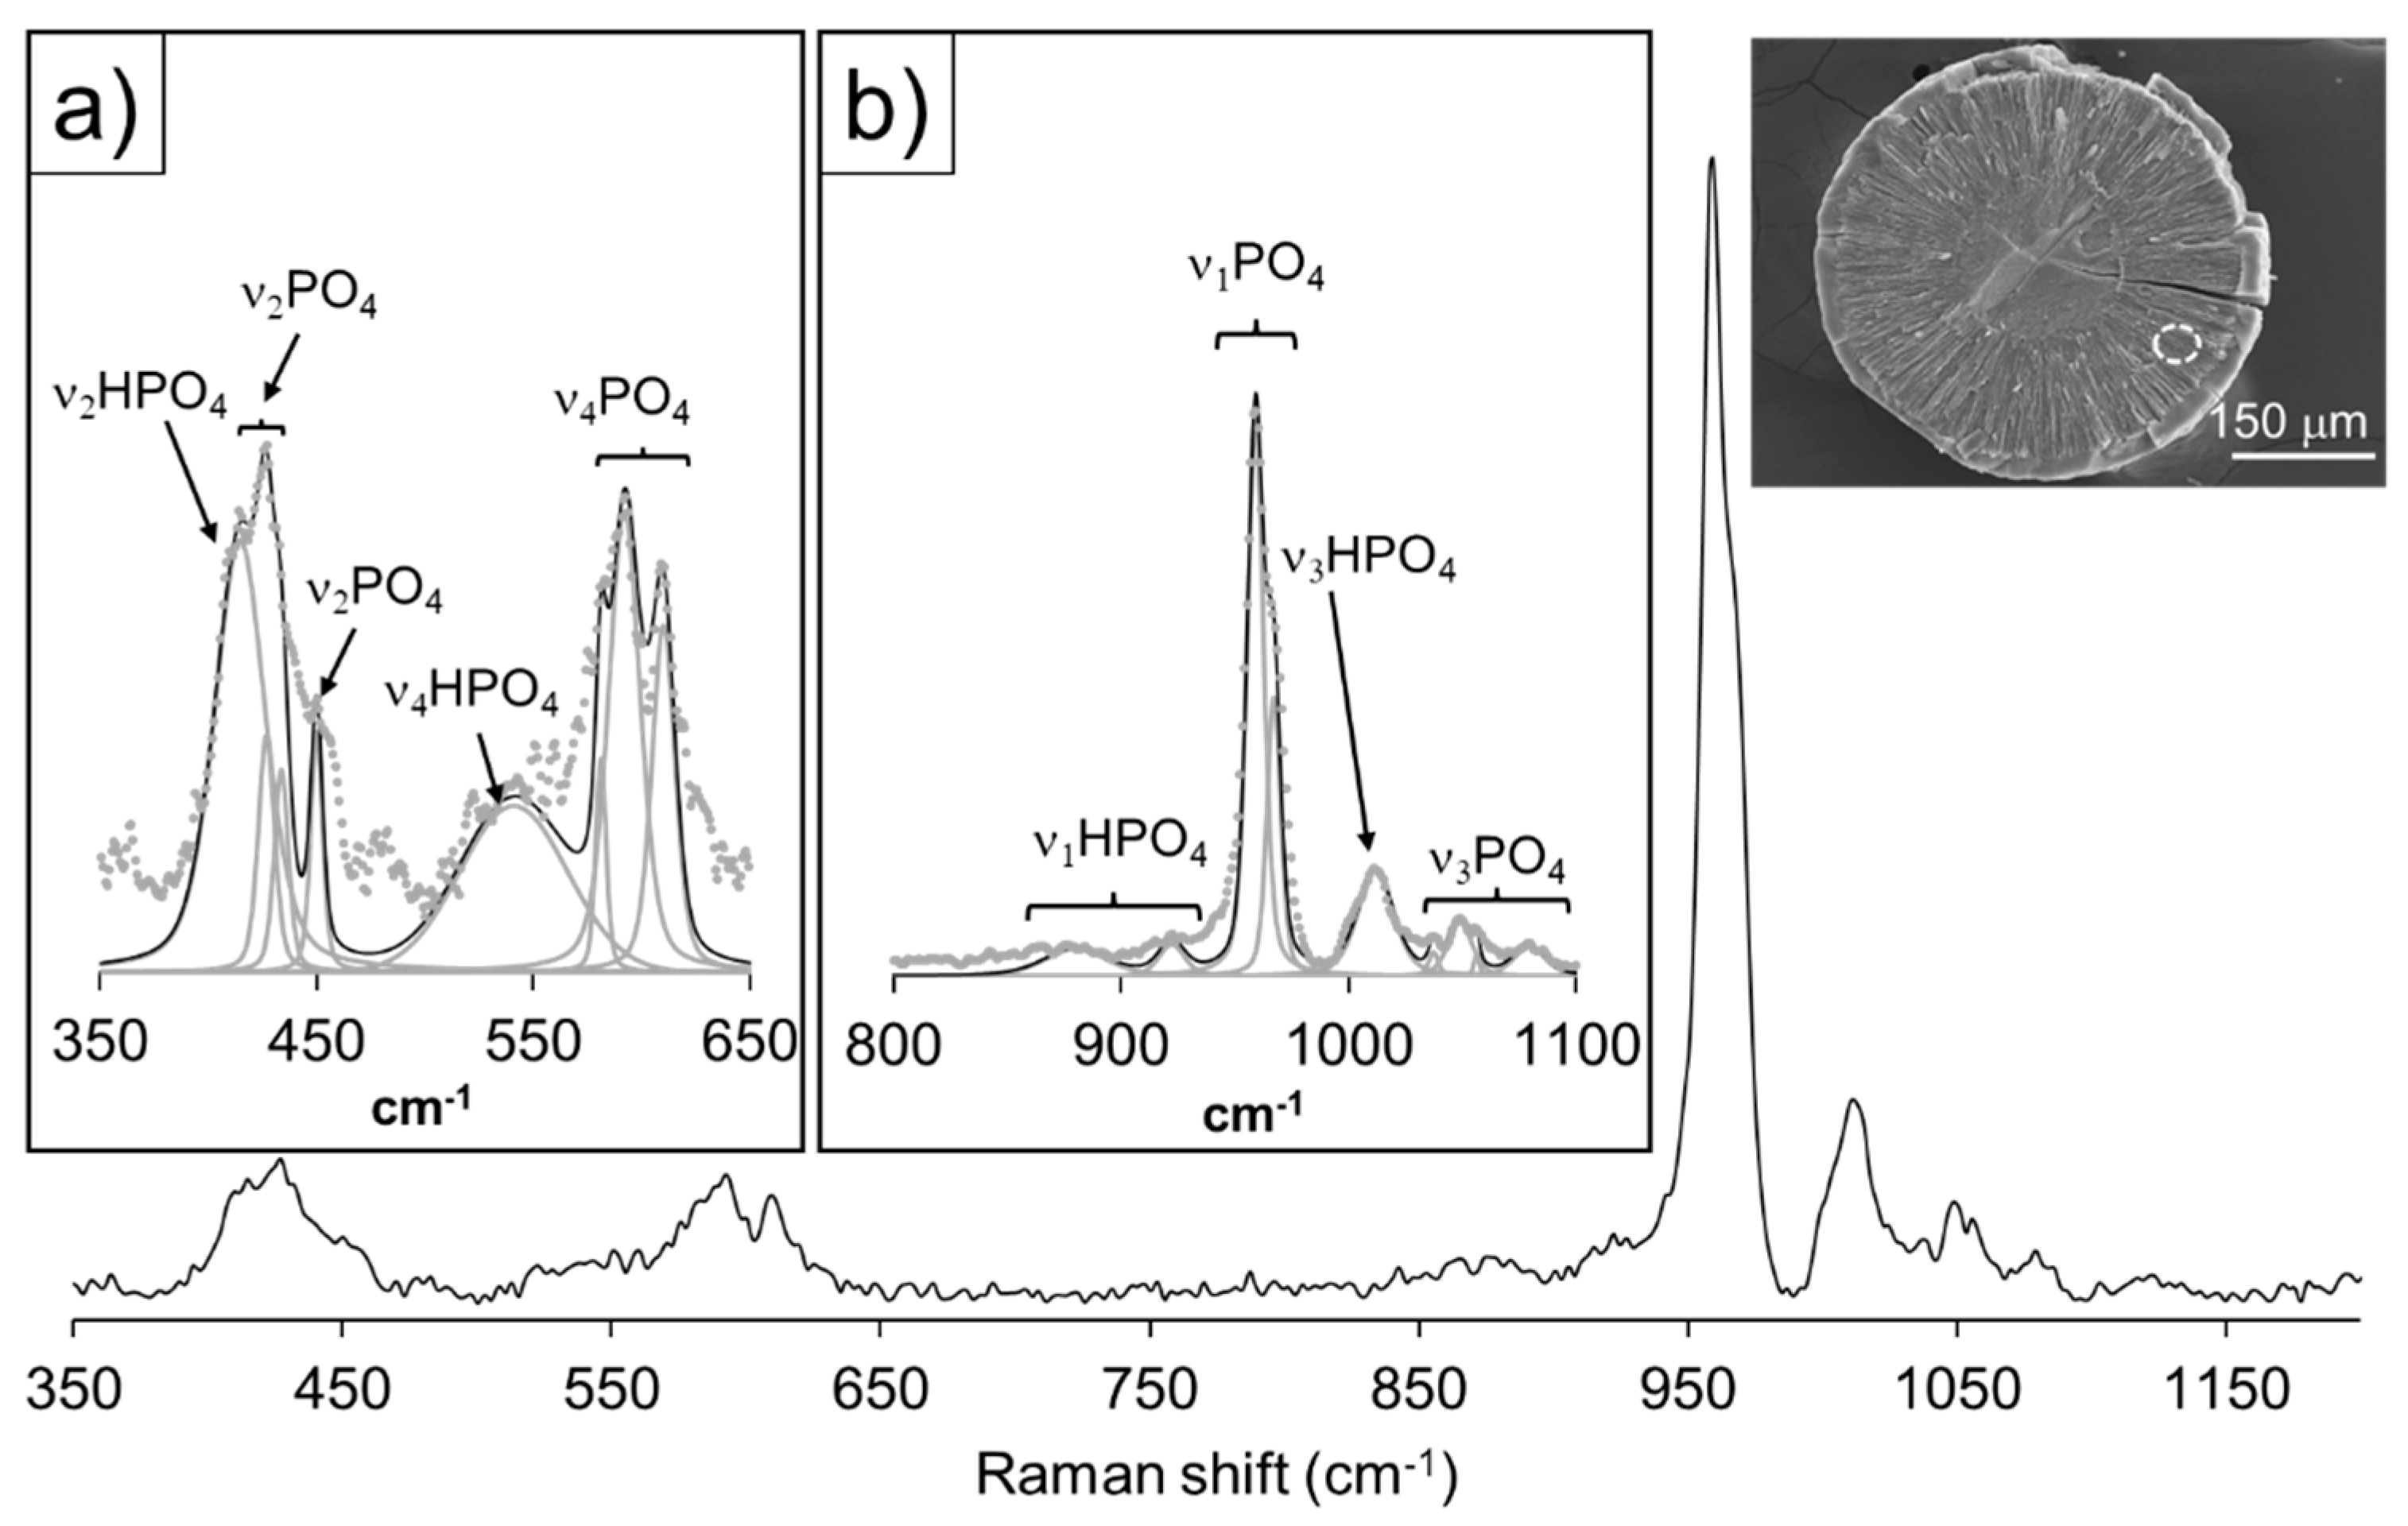
As Figures 8a and 8b reveal, band deconvolution is in good agreement with reference information [52] regarding the vibrational modes of both PO43- and HPO42- in OCP and HAP, with the most intense peak at 959 cm-1, displaying a shoulder towards 967 cm-1. This spectral feature was determined by the latter author as being typical of the lower vibrational symmetry of the P-O stretching mode (ν1) in the PO43- group of OCP. In the 350 < cm-1 < 650 and 850 < cm-1 < 1100 regions, the bands corresponding to the symmetric and antisymmetric stretching (ν1 and ν3) and bending (ν2 and ν4) vibrational modes of PO43- and HPO42- occur, respectively. It is worth noting the development of intense peaks related to the vibration of HPO42- groups, especially in the vicinity of 1010 cm-1, where the antisymmetric stretching band is assigned (ν3). The spectrum of these crystals is free from peaks assignable to the vibrations of carbonate groups, C-H, or O-H bonds (i.e., at shifts > 3000 cm-1), and the general broadness of all peaks is an expression of low vibrational symmetry. The Ca/P ratio falls in the 1.6-1.8 range (see Table S4 in the Supplementary Information), possibly indicating some chemical inhomogeneity within these phases. Given the absence of spectral evidence for the occurrence of C-H, C-O, and O-H bonds, the ~20wt% lacking in analyses totals may be attributed to the high porosity of the targeted areas (see SEM image inset in Figure 8).
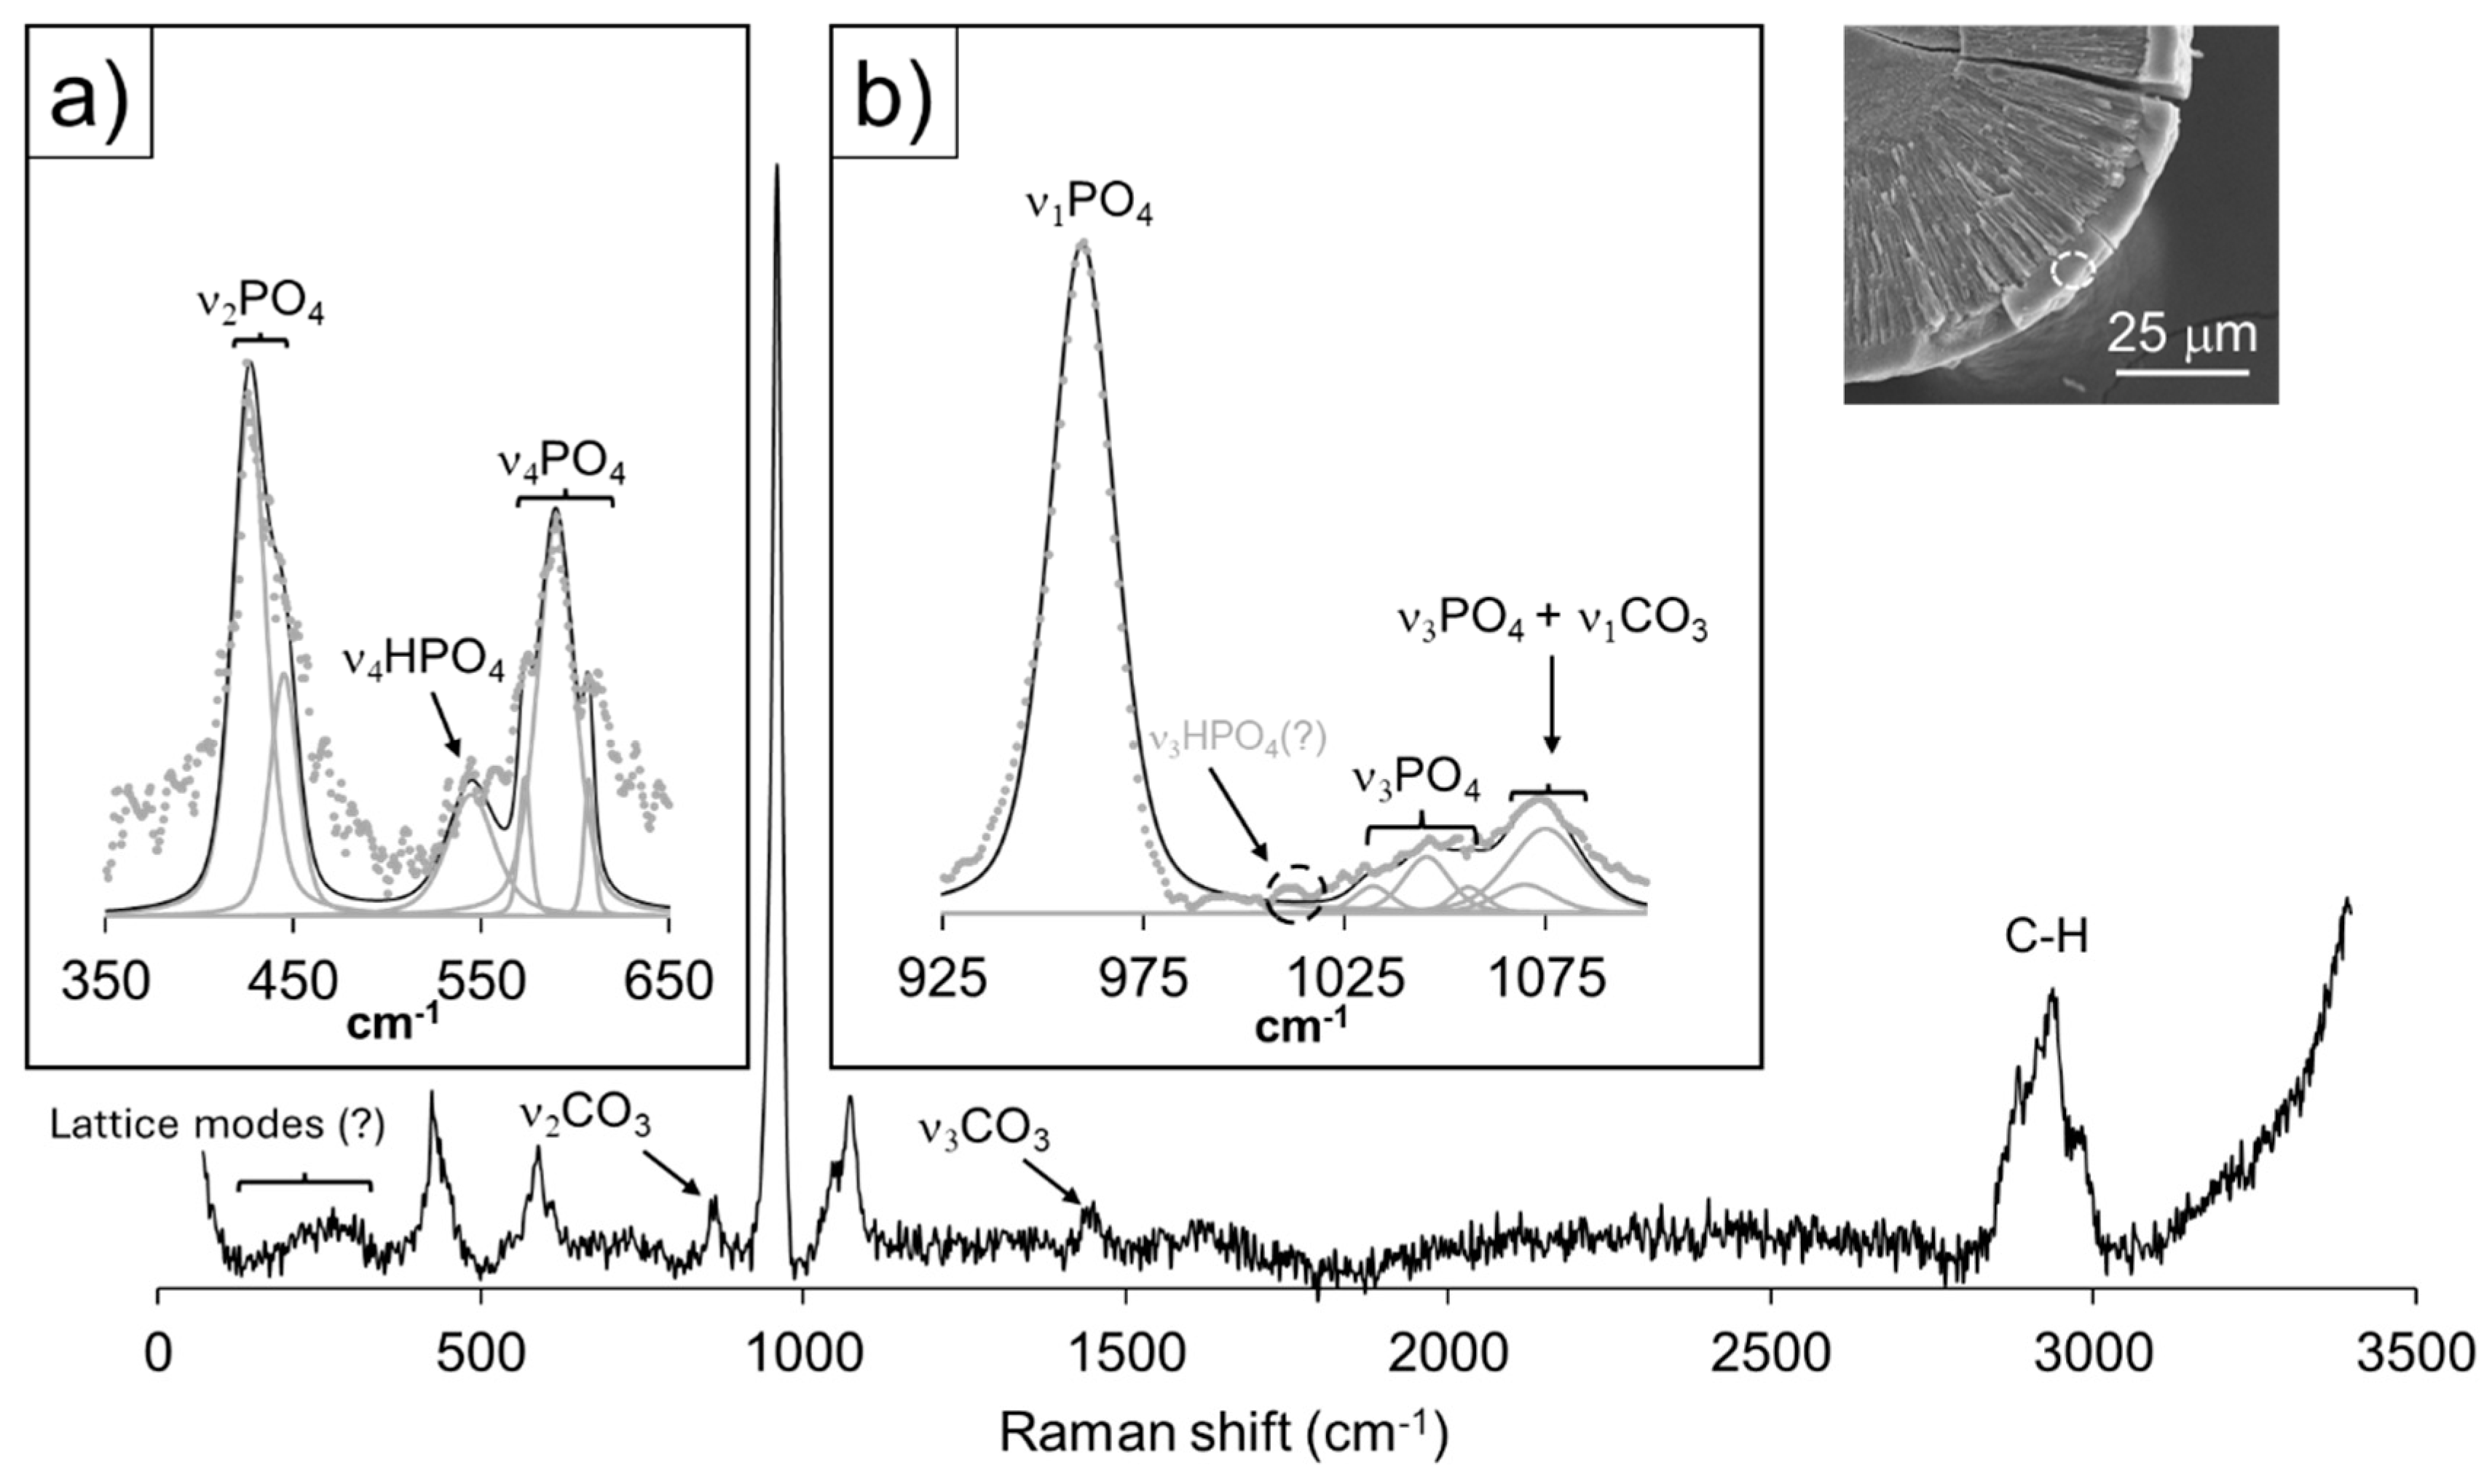
Figure 9 reveals a representative Raman spectrum relative to the thin outermost growth layer of the aggregates, spanning the 100 < cm-1 < 3400 shift range. The overall spectral analysis results in the identification of PO43- vibrational bands like those assigned to the Raman spectrum of the core, with slight differences focusing on the 925 < cm-1 < 1000 shift interval. In the 350 < cm-1 < 650 regions, the symmetric (ν2) and antisymmetric (ν4) bending modes of PO43- can be assigned to the corresponding vibrations in the structures of both OCP and HAP, at 445 (ν2) and 573, 590, and 607 cm-14), respectively. The O-P-O bending modes (ν2) of PO43- and the bending mode (ν4) of the HPO42− group in the structure of OCP, can be observed at 427 and 544 cm-1, respectively. The 925 < cm-1 < 1000 shift range is dominated by a very intense peak at 960 cm-1, ascribed to the symmetric stretching modes (ν1) of the PO43- group in the structure of OCP/HAP, followed by broad peaks assigned to the antisymmetric stretching mode (ν3) of PO43- (1032, 1046, 1056 cm-1) and the combination of latter with the CO32- symmetric stretching mode (ν1) in the structure of HAP (1075 and 1070 cm-1, respectively). A low intensity, broad peak of difficult interpretation in the vicinity of ~1010 cm-1 could be the expression of the ν3 antisymmetric stretching mode of HPO42- groups.
The peak in the vicinity of ~860 cm-1 can be assigned to the combination of the CO32- symmetric bending (ν2) modes at 856 and 865 cm-1, and the broad peak at 1452 cm-1 to the antisymmetric stretching (ν3) of the same anionic group, as observed for the structure of aragonite [51]. As observed for the core, the wide hump in 160 < cm-1 < 350 spectral region, could be the expression of vaterite lattice modes. It is worth mentioning the broad peak at ~2900 cm-1, assigned to vibrations of C-H bonds. Finally, the small thickness of this layer disallowed a reliable collection of Ca/P data.
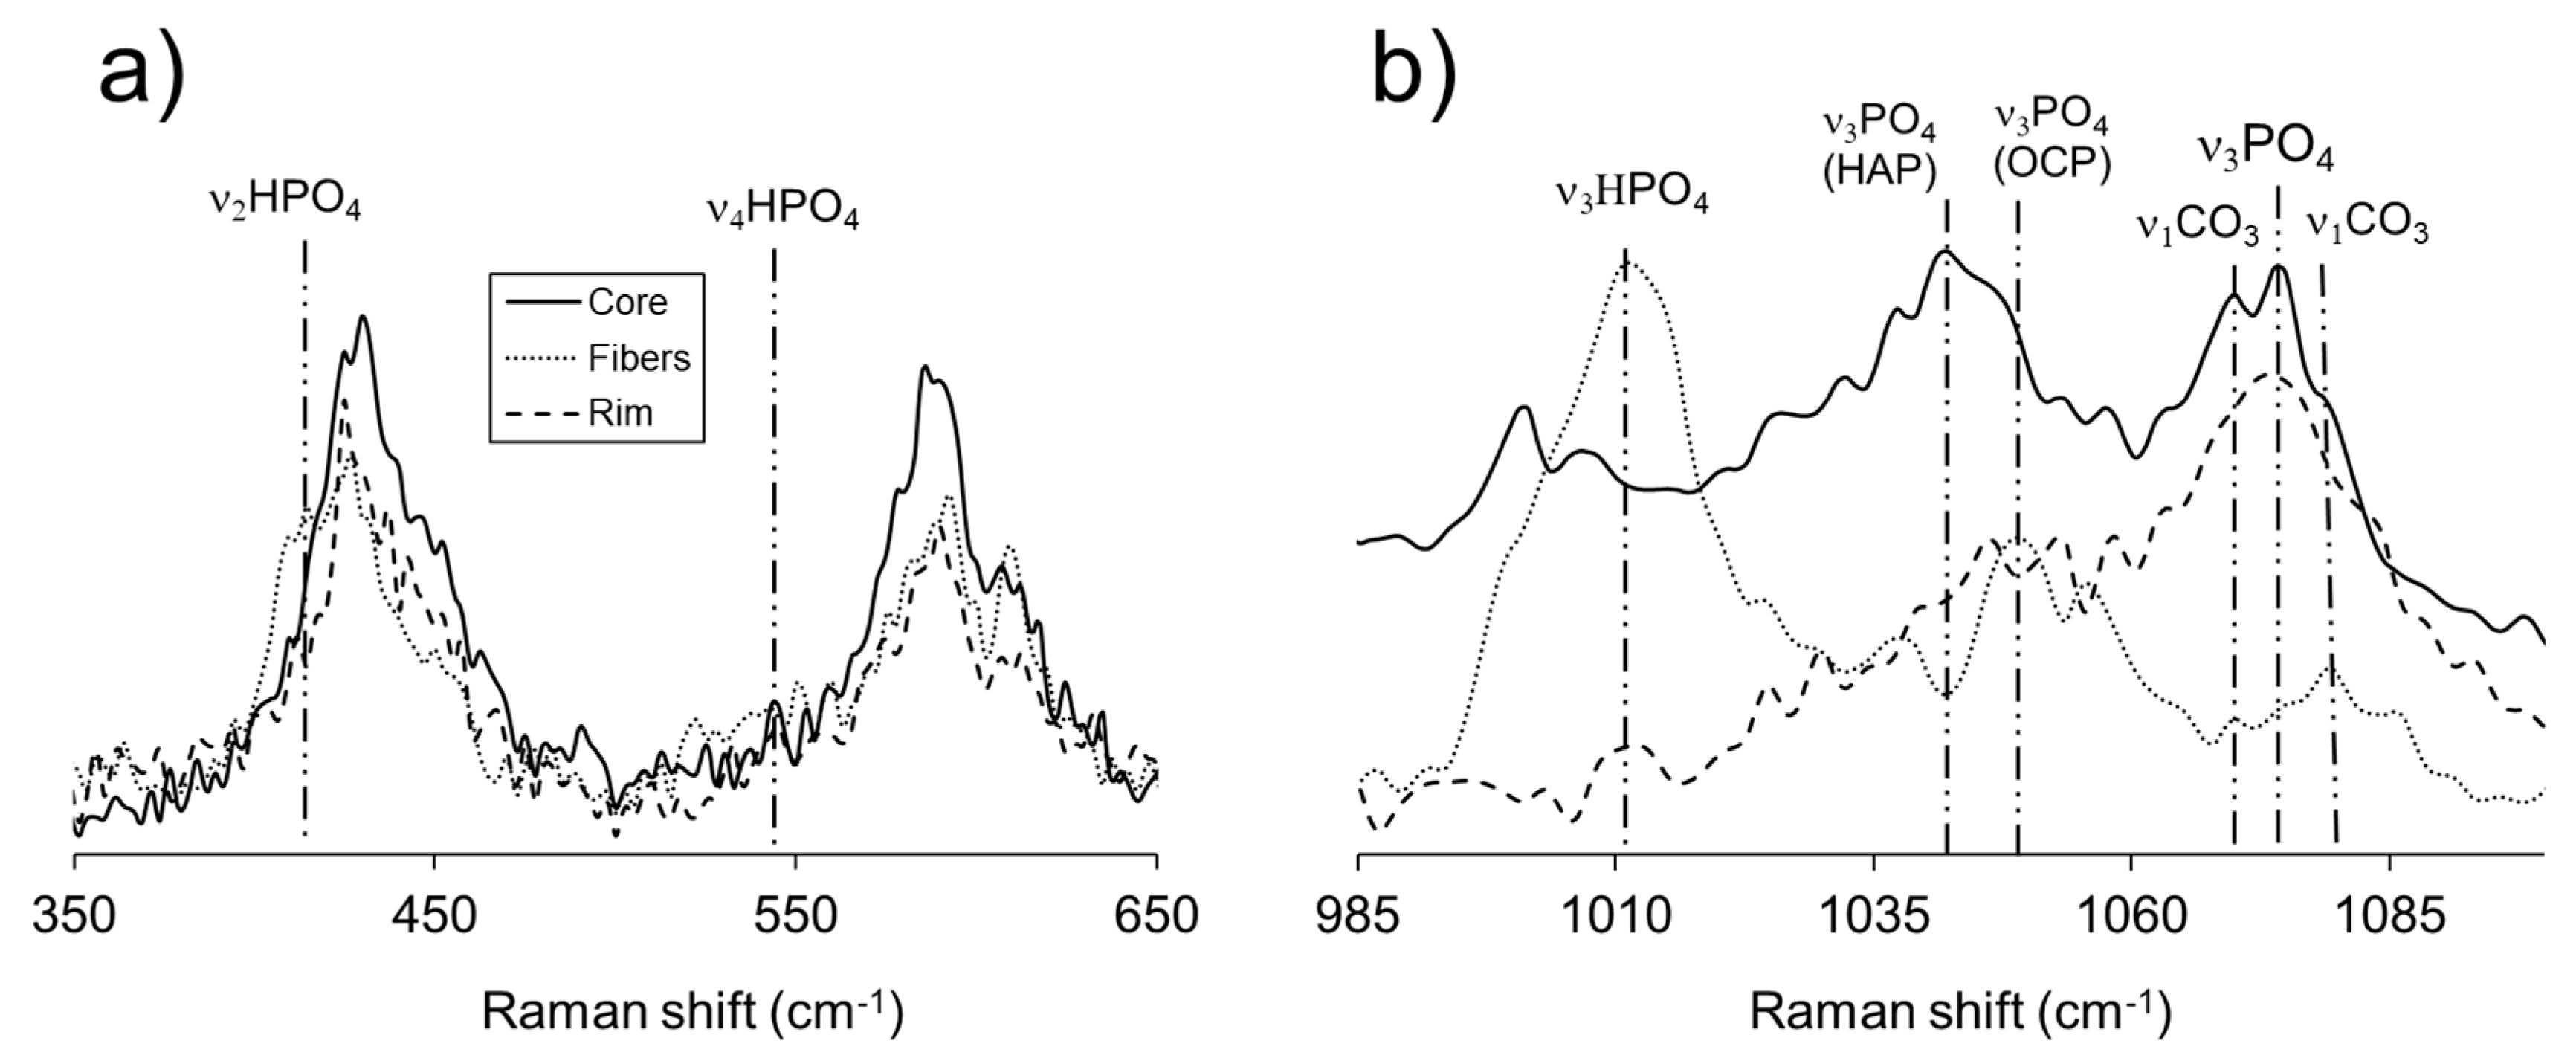
The differences among the described Raman results can be very subtle, especially those concerning the core and the rim of the aggregates. Figure 10a shows a group comparison of the three spectra in the 350 < cm-1 < 650 region, where the main discrepancies lay in the development of HPO42- vibrational bands. The spectral contrasts in the 985 < cm-1 < 1100 region, displayed in Figure 10b, are apparently more drastic, but harder to interpret, given the broad, low intense nature of peaks in this shift range. However, the main differences relate to the development of a ν3 HPO42- mode, the relative intensities of the ν3 PO43- bands in the structures of OCP and HAP, and the combination peak of ν3 PO4 + ν1 CO32- in HAP and the apatitic layers of OCP. The Raman spectrum of the tabular elongated crystals offer the most striking variations with respect to core and rim growths. These correspond to the absence of a wide hump at low shifts, the absence of C-H modes, the inexistence/low expression of carbonate group vibrational bands, the higher intensity and better definition of HPO42- modes, and the absence of a rise in intensity for cm-1 > 3200, where O-H modes develop. These contrasts, their corresponding interpretation, and the discussion of the reactive pathway they reflect, will be discussed in the following section.

4. Discussion

4.1. The Effect of Phosphate Ions on the Growth of Calcium Carbonate

The presence of phosphate in the aqueous media appears to be an important factor controlling the morphology of calcite. As mentioned in Section 3.2., the morphology of calcite crystals grown in the presence of phosphate differs greatly from those grown in its absence. While in the latter case, the crystals show the typical idiomorphic rhombohedral shape with hopper habit, the presence of phosphate in the aqueous media, even in low concentration, leads to the appearance of a new crystal form, the acute rhombohedron {0221} which gives calcite crystals a more elongated habit. Since Raman spectra analysis show that phosphate is incorporated into the structure of calcite, we can conclude that the change of habit is due to the incorporation/sorption of this anion in/on it. The modification of the habit of calcite crystals due to the presence of foreign ions in the crystallization medium has been extensively discussed in the literature [60,61]. It has been interpreted as the result of the preferential incorporation/adsorption of these ions onto certain faces other than those of the shape {1014}, which causes a significant lowering of their defect surface energies thus stabilizing these faces relative to other faces [60]. Using atomistic simulations, these authors conclude that the presence of phosphates additives causes an elongation of calcite crystals due to the stabilization of the {1010}. These results differ from ours, but this may be due to the fact that the two studies are hardly comparable. For example, in the study using atomistic simuations [60] only the equilibrium morphology was calculated, which may not correspond to that obtained in conditions far from equilibrium, such as the conditions prevailing in a reaction diffusion system. Furthermore, no energy calculations of the form {0221} were performed and only the effect of the HPO42- species was considered in their calculations. Other authors have attributed the modification of the habit to a change of calcite surface nanotopography as a consequence of differential interaction of the foreign ions with the steps on the calcite surfaces [61]. The authors demonstrate that this anisotropic interaction of the impurities with the rhombohedral form to a more elongated shape can occur by simply altering the orientation of steps already available on the surface.
In any case, the stabilization of the {0221} form, and the development of pseudofacets, observed in our experiments is remarkably similar to that of calcite crystals grown in the presence of sulphate and chromate anions [15,62] and small cations such as Mg2+, Co2+, or Mn2+ [45].

4.2. Growth of Ca-Phosphates in the Presence of Carbonate Ions

4.2.1. Phase Identification

The early nucleation stages of experiment III most likely involved the formation of low crystalline phases, as evidenced from both the modifications in core morphology and Raman spectral characteristics, from 15 to 30 days of reaction times in the results section. The nucleation of both amorphous calcium phosphate and carbonate precursors with respect to the most thermodynamically stable phases of apatite and calcite/aragonite CaCO3 polymorphs, respectively, is widely known in the literature [63,64,65]. The increase in crystallinity reflected by Raman spectra and the development of faces, reveals that, though already covered by an overgrowth of bladed crystals, the core of aggregates continued to mature towards a mixture of phases after 15 days of reaction times – one apatitic, the other a Ca carbonate. Such apatitic phase displays the typical combination of bands for carbonate-apatite, as described by [52], with the addition of HPO42- poorly defined vibrational modes. While the latter authors produced exclusively B-type carbonate apatite, where carbonate replaces for phosphate, the existence of C-H bonds and the spectral rise at >3300 cm-1 (O-H modes), could reflect the interaction between HPO42- and CO32- groups in the A sites of apatite. An alternative interpretation could attribute these spectral peculiarities to the presence of a hydrated calcium carbonate; however, Raman data suggests an intermediate between vaterite and aragonite polymorphs. The formula for type-B carbonated proposed by [66], would therefore not apply in the present case, due to the complex mutual replacements between PO43-, HPO42-, CO32- and OH- groups in both B and A-type sites.
The following growth layer of tabular and elongated crystals displays spectral characteristics typical of OCP, strikingly devoid of evidence for O-H bands, and little to no expression of carbonate group vibrational modes. Furthermore, the obtained range of Ca/P ratios (1.6-1.8, see Table S4 in the Supplementary Information) are closer to that of apatite than OCP, with an excess Ca with respect to the ideal apatite formula. The acquired data does not allow for speculations around the type of ionic substitutions and related vacancies, enabling such composition. However, the incorporation of HPO42- in Ca-deficient apatite proposed by [22] does not conform to the present results. We propose the occurrence of systematic structural inhomogeneities affecting these crystals, like the HAP-OCP nano-crystalline domains found by [31] in organic samples of osteocalcin. It is worth mentioning that the structures of OCP and apatite are very similar, with the former comprising apatitic Ca-PO4 layers, bound together by a hydrated interlayer, where HPO42- groups occur [29]. In fact, their epitactic intergrowth is governed by an excellent structural match along [001] in both minerals [30]. Figure 3c reveals the oriented growth of the tabular, elongated crystals, with the longest direction perpendicular to the interface with the preceding phase(s), indicating a structural affinity between substrate and overgrowth. Finally, the curved nature of these crystals, points towards the occurrence of structural strain in the reticular planes normal to the elongation, most likely induced by the inclusion of HPO42- groups in B and/or A sites of a deformed apatite, inheriting structural characteristics of OCP. The fact that such c-axis is curved, and not jagged, also points towards a systematic change in reticular parameters affecting the angular relationships among crystallographic axes.
The thin, outermost layer of the aggregates display a Raman spectrum very similar to the results gathered for the core, except for the poorly developed HPO42- bands and better defined CO32- modes, ascribed to the vibration of carbonate in the structure of aragonite. Though resolution constraints preempted the determination of Ca/P ratios, the data is consistent with the presence of a carbonate-apatite with low HPO42- contents, probably coexisting with aragonite.
It is worth noting that the Raman features displayed by calcium phosphate phases at both core and rims, and the consequent non-stoichiometric compositions, strongly resembled those described for bioapatite [59]. However, in the present case, C-H vibrational modes are obviously unrelated to the presence of collagen in the grown phosphates.

4.2.1. Reaction Pathways

The nano-porous media in experiment III consists of a hidro-silica gel column, with 500 ppm of Na2PO4, and pH ~ 5.5. Under such conditions and before the diffusion of the reactant solutions, the dominant phosphate specie corresponds to H2PO4- [67]. The diffusing anion-bearing solution, with 0.5 M of Na2CO3, following equilibration with atmospheric CO2, reaches a pH of ~9.8, and therefore the predominant carbonate-bearing species corresponds to HCO3- and CO32-, with nearly equal distributions in a classic Bjerrum plot [68]. At the point of first nucleation, the pH conditions of the media should necessarily be in the range 5.5 << pH << 9.8, with the corresponding shift in the distribution both phosphate and carbonate-bearing species. Given the existence of both HPO42- and PO43- anionic groups in the HAP-like core phase of slightly matured samples (recovered 15 days after the first nucleation period), it is probable that such solid does not correspond to the earliest nucleated phase, but rather to a recrystallized product of a primary, more protonated Ca phosphate (i.e. amorphous calcium phosphate, CaxHy(PO4)z·nH2O). It is worth mentioning that the occurrence of non-stoichiometry in bioapatites has been a long-held discussion [69,70], with real measurements eluding the establishment of integer coefficients.
The static formation of an HAP-like phosphate at the core, necessarily created an increasingly steep negative pH gradient over its surface, due to the decrease in the activities of dissociated phosphoric acid (HPO42-) and OH- ions in the surrounding media. Under more acidic conditions, an epitactic growth of bladed, elongated crystals of a “pseudo” apatitic, HPO4-rich, and OH-poor phase formed over the core substrate. Such an interpretation is also in agreement with spectral data provided by [71,72] where the authors discovered “non-apatitic” PO43- bands in FTIR spectra of bioapatites. The latter feature was also associated with the impossibility of assigning integer stoichiometric coefficients to biological apatites.
Similarly to what [73] described for the epitactic growth of brushite (CaHPO4.2H2O) on gypsum cleavage surfaces, this structurally strained “pseudo” apatite could be metastable, and its heterogeneous nucleation over the core substrate favored by the reduction of the nucleation energy barrier, in response to structural affinities between both phases. Such acidic conditions did not enable the co-crystallization of a carbonate phase in this growth layer.
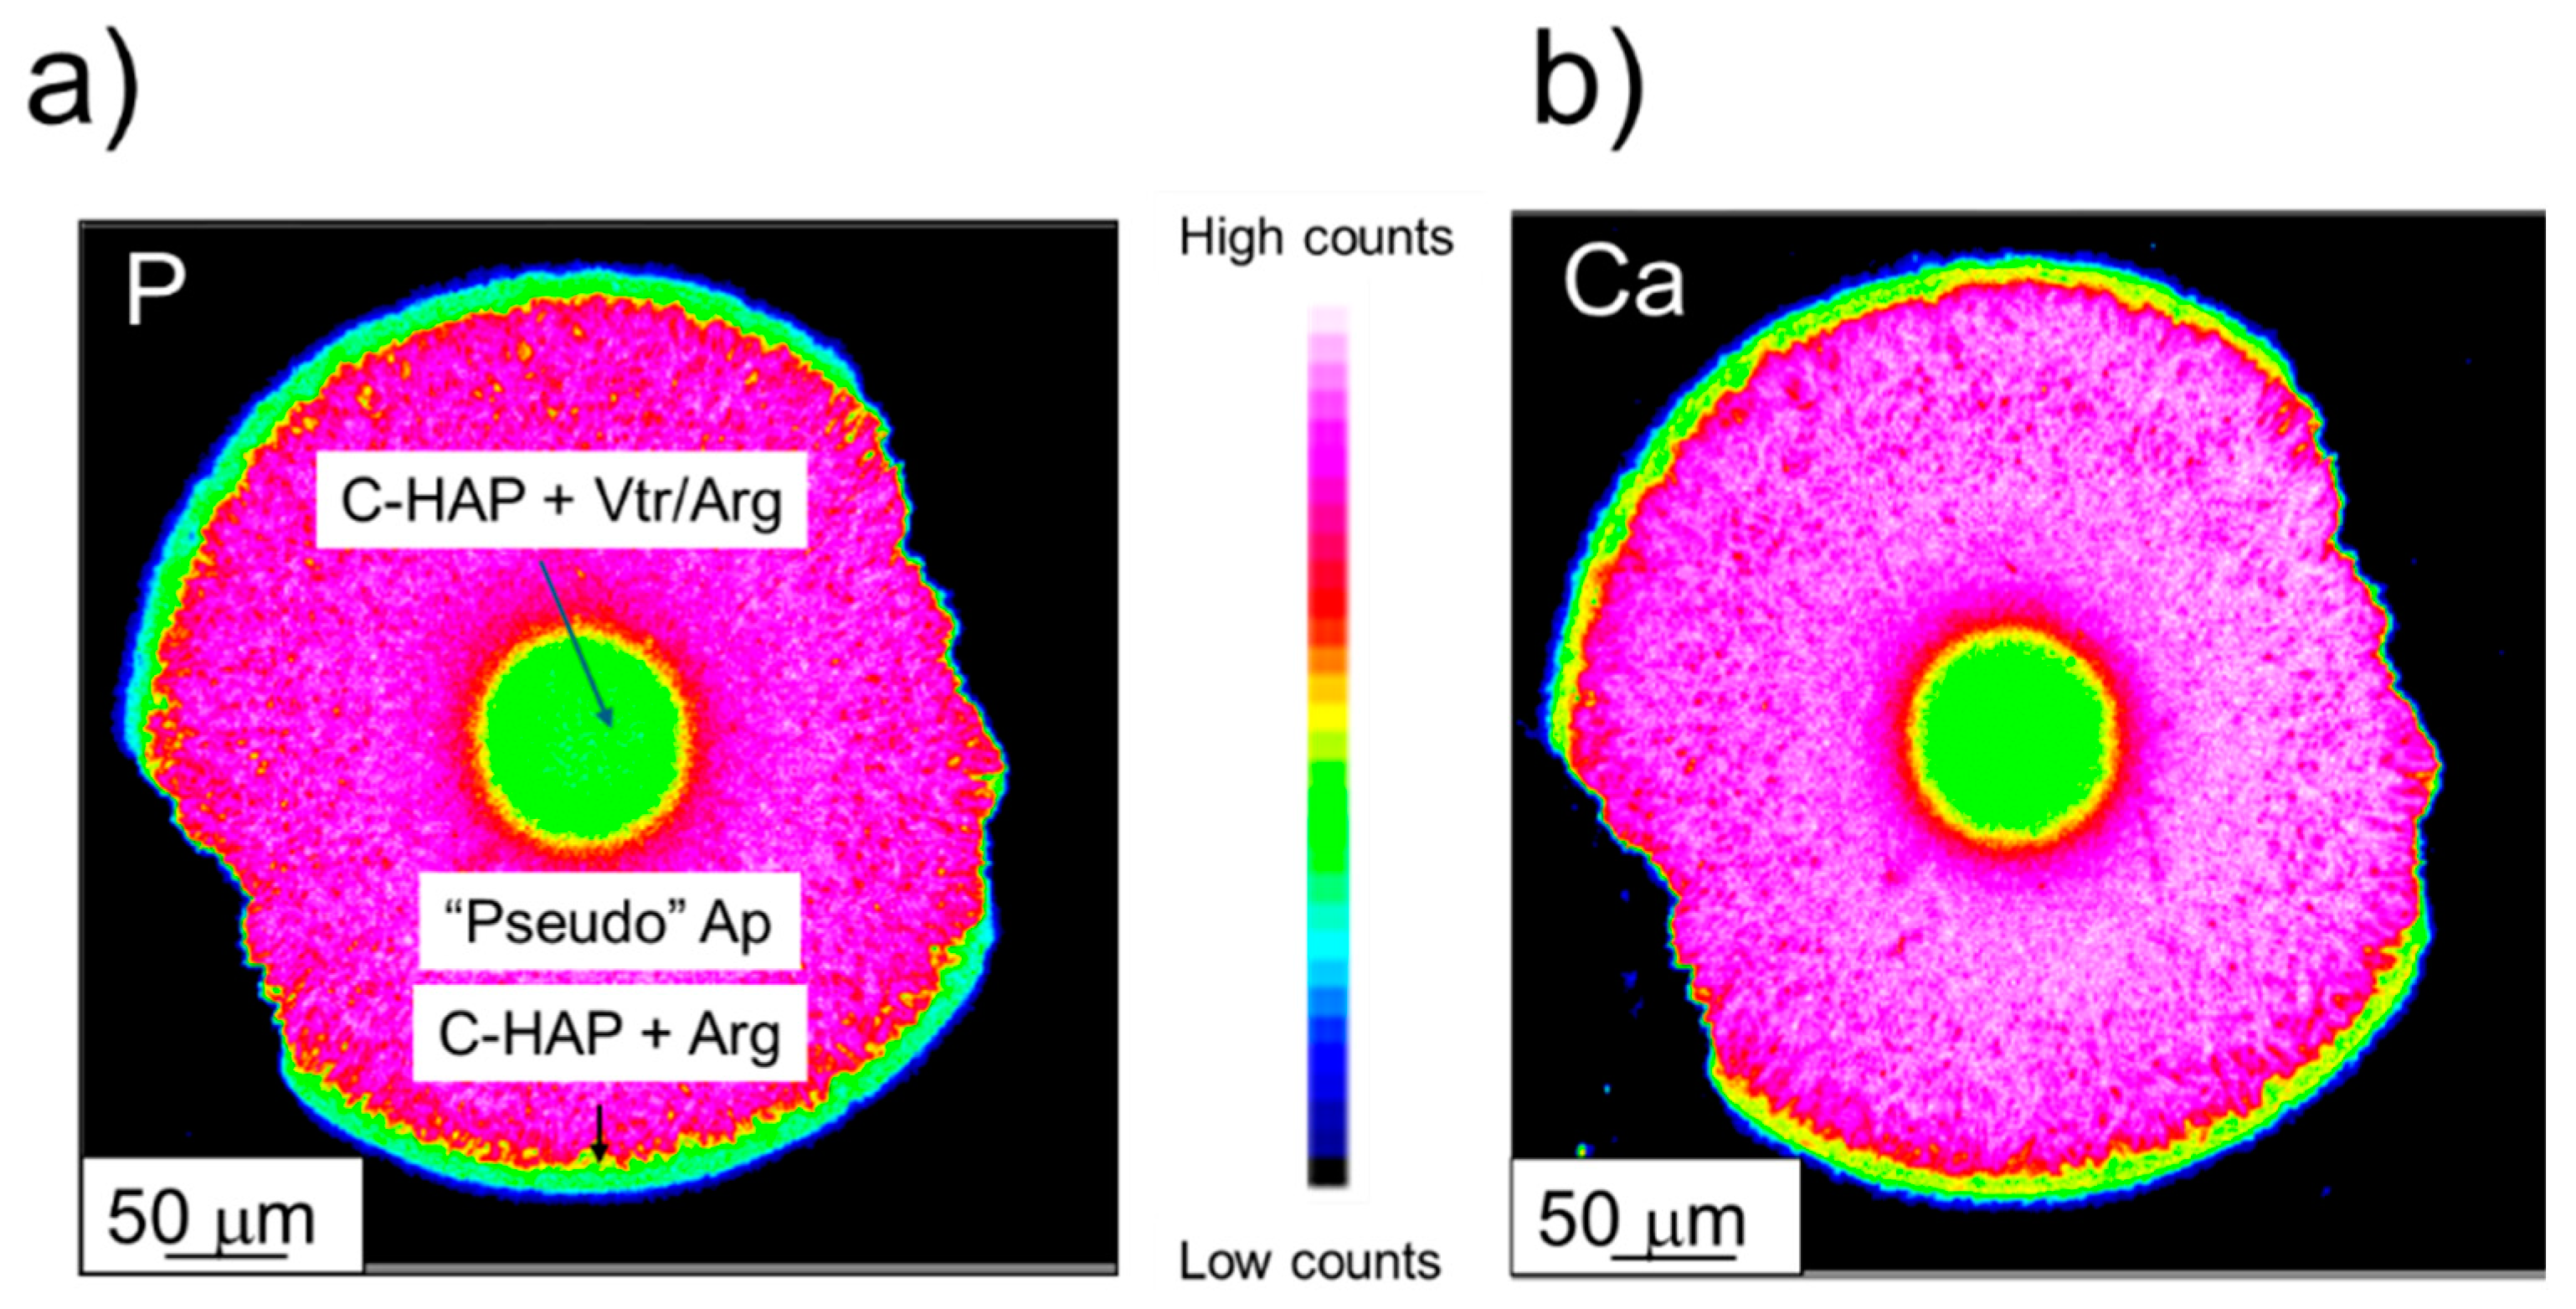
The continuous diffusion of an alkaline CO3-bearing solution towards the nucleation sites, finally favored the nucleation of an HPO4-poor, CO3-HAP, alongside an aragonitic CaCO3 phase. Figure 11 displays X-ray elemental maps, regarding the distributions of both Ca and P relative concentrations in the crystal aggregates obtained from experiment III. The relative concentration zoning reflects different growth pulses, from core to rim, induced not only by compositional changes (i.e., volatile content), but also morphology and, consequently, porosity. For instance, though no gradual compositional, nor spectral variations were found in point analysis, the transition between core and the overgrowing tabular crystals shown in Figure 11 appears to be characterized by a gradation in Ca and P concentrations. However, the most relevant chemical changes along this transition are the disappearance of a carbonate phase and little to no incorporation of OH/CO3 groups in calcium phosphate, (i.e., lower volatile content). Finally, the analytical artifacts induced by the morphological change from a more massive core to the more porous epitactic layer of elongated, bladed crystals, also needs to be accounted for in this transition.

5. Conclusions

The growth of calcium carbonate in the presence of phosphate in the double diffusion system clearly affects the morphology of the calcite crystals which exhibit the typical rhombohedral shape in the inert experiments and progressively become elongated along the c-axis as the P concentration increase in the gel medium as a direct result of the incorporation of this anion. On the other hand, the growth of calcium phosphates in the presence of carbonate ions, involves the sequential, heterogeneous nucleation of CO3-bearing OCP/HAP-like phases, whose structural features are strongly controlled by the prevailing pH conditions and the existing structural similarities between each substrate and overgrowth. The obtained aggregates revealed Raman spectral characteristics very similar to those of bioapatites, here produced through strictly inorganic processes. Alongside the nucleation and growth of calcium phosphates, saturation and pH conditions also favored the co-crystallization of CaCO3 with vaterite/aragonite structures, at the core and rim of aggregates. The obtained results underline the versatility of the experimental growth of crystals in gels, as a method to simulate certain biomineralization processes, especially those involving carbonate and/or phosphate phases.

Supplementary Materials

The following supporting information can be downloaded at the website of this paper posted on Preprints.org, Table S1. Raman band assignment for the core; Table S2. Raman band assignment for the fibres; Table S3. Raman band assignment for the rim; and Table S4. EMP.

Author Contributions

Conceptualization, N.S.P..; methodology, N.S.P. and P.dB-F.; software, N.S.P., A.J.P., and J.M.A.; writing—original draft preparation, A.J.P. and N.S.P.; writing—review and editing, A.J.P., N.S.P., and J.M.A.; project administration, J.M.A.; funding acquisition, J.M.A. All authors have read and agreed to the published version of the manuscript.

Funding

This study was supported by the Ministry of Science and Innovation (Spain) under project PID2021-125467NB-I00.

Data Availability Statement

The raw data supporting the conclusions of this article will be made available by the authors on request.

Conflicts of Interest

The authors declare no conflicts of interest.

References

  1. Ridgwell, A.; Zeebe, R.E. The role of the global carbonate cycle in the regulation and evolution of the Earth system. Earth Planet. SC, Lett. 2005, 234(3-4), 299–315. [Google Scholar] [CrossRef]
  2. Morse, J.W.; Mackenzie, F.T. Geochemistry of Sedimentary Carbonates. Developments in Sedimentology; Elsevier: Amsterdam. The Netherlands, 1990; p. 446. [Google Scholar]
  3. Hua, B.; Deng, B.L.; Thorton, E.C.; Yang, J.; Amonette, J.E. Incorporation of chromate into calcium carbonate structure during coprecipitation. Water, Air, Soil Pollut. 2007, 179, 381–390. [Google Scholar] [CrossRef]
  4. Tang, Y.Z.; Elzinga, E.J; Lee, Y.J.; Reeder, R.J. Coprecipitation of chromate with calcite: Batch experiments and X-ray absorption spectroscopy. Geochim. Cosmochim. Acta. 2007, 71, 1480–1493. [Google Scholar] [CrossRef]
  5. Fernández-Díaz, L.; Fernández-González, A.; Prieto, M. The role of sulfate groups in controlling CaCO3 polymorphism. Geochim. Cosmochim. Acta. 2010, 74, 6064–6076. [Google Scholar] [CrossRef]
  6. Fernández-Díaz, L.; Pina, C.M.; Astilleros, J.M.; Sánchez-Pastor, N. The carbonatation of Gypsum: Pathways and pseudomorph formation. Am. Mineral. 2009, 94, 1223–1234. [Google Scholar] [CrossRef]
  7. Parker, S.C.; Titiloye, J.O.; Watson G., W. Molecular modelling of carbonate minerals: studies of growth and morphology. Phil. Trans. R. Soc. Lond. A. 1993, 344, 37–44. [Google Scholar] [CrossRef]
  8. Sangwal, K. Additives and Crystallization Processes: From Fundamentals to Applications. Wiley-Blackwell: Chichester, West Sussex, England, 2007, pp. 468.
  9. Chernov, A.A. Growth of copolymer chains and mixed crystals trial-and-error statistics. Soviet Physics Uspekhi. 1970, 13, 101–128. [Google Scholar] [CrossRef]
  10. Schosseler, P.M.; Wehrli, B.; Schweiger, A. Uptake of Cu2+ by the calcium carbonates vaterite and calcite as studied by continuous wave (cw) and pulse electron paramagnetic resonance. Geochim. Cosmochim. Acta. 1999, 63, 1955–1967. [Google Scholar] [CrossRef]
  11. Prieto, M.; Astilleros, J.; Fernández-Díaz, L. Environmental remediation by crystallization of solid solutions. Elements, 2013, 9, 195–201. [Google Scholar] [CrossRef]
  12. Astilleros, J.M.; Fernández-Díaz, L.; Putnis, A. The role of magnesium in the growth of calcite: An AFM study. Chem. Geol. 2010, 271, 52–58. [Google Scholar] [CrossRef]
  13. Crocket, H.; Winchester, J.W. Coprecipitation of zinc with calcium carbonate. Geochim. Cosmochim. Acta. 1966, 30, 1093–1109. [Google Scholar] [CrossRef]
  14. Reeder, R.J.; Lamble, G.M.; Northrup, P.A. XAFS study of the coordination and local relaxation around Co2+, Zn2+, Pb2+, and Ba2+ trace elements in calcite. Am. Mineral. 1999, 84, 1049–1060. [Google Scholar] [CrossRef]
  15. Sánchez-Pastor, N.; Gigler, A.; Cruz, J.; Park, S.; Jordan, G.; Fernández-Díaz, L. Growth of calcium carbonate in the presence of Cr (VI). Cryst. Growth Des. 2011, 11, 3081–3089. [Google Scholar] [CrossRef]
  16. Fernández-González, Á.; Fernández-Díaz, L. Growth of calcium carbonate in the presence of Se (VI) in silica hydrogel. Am. Mineral. 2013, 98, 1824–1833. [Google Scholar] [CrossRef]
  17. Kohn, M.J.; Cerling, T.E. Stable isotope composition of Biological Apatite. Rev. Min. Geochem. 2002, 48, 455–488. [Google Scholar] [CrossRef]
  18. Smith, S.C.; Douglas, M.; Moore, D.A.; Kukkadapu, R.V.; Arey, B.W. Uranium extraction from laboratory-synthesized, uranium-doped hydrous ferric oxides. Environ. Sci. Technol. 2009, 43, 2341–2347. [Google Scholar] [CrossRef] [PubMed]
  19. Filippelli, G.M. The global phosphorous cycle: past, present, future. Elements. 2008, 4, 89–95. [Google Scholar] [CrossRef]
  20. Elzinga, E.J.; Rouff, A.A.; Reeder, R.J. The long-term fate of Cu2+, Zn2+, and Pb2+ adsorption complexes at the calcite surface: an x-ray absorption spectroscopy study. Geochim. Cosmochim. Acta. 2006, 70, 2715–2725. [Google Scholar] [CrossRef]
  21. Kuczumow, A.; Blicharski, T.; Gorzelak, M.; Kosinski, J.; Lasota, A.; Gagala, J.; Nowak, J.; Jarzebski, M.; Jablonski, M. Measurements of energetic states resulting from ion exchanges in the isomorphic crystals of apatites and bioapatites. Molecules 2022, 27, 8913. [Google Scholar] [CrossRef]
  22. Elliott, J.C. Structure and chemistry of the apatites and other calcium orthophosphates., 1st ed.; Elsevier Science BV: Amsterdam, The Netherlands, 1994; p. 404. [Google Scholar]
  23. Brown, W.E.; Smith, J.P.; Lehr, J.R.; Frazier, A.W. Cyrstallographic and chemical relations between octacalcium phosphate and hydroxyapatite. Nat. 1962, 196, 1050–1054. [Google Scholar] [CrossRef]
  24. Rey, C.; Hina, A.; Tofighi, A.; Glimcher, M.J. Maturation of poorly crystalline apatites: Chemical and structural aspects in vivo and in vitro. Cells Mater. 1995, 5, 345–356. [Google Scholar] [CrossRef]
  25. Elliott, J.C. Calcium Phosphate Biominerals. Rev. Min. Geochem. 2002, 48, 427–453. [Google Scholar] [CrossRef]
  26. Tung, M.S.; Brown, W.E. An intermediate state in hydrolysis of amorphous calcium phosphate. Calcif Tissue Int. 1983, 35, 783–790. [Google Scholar] [CrossRef] [PubMed]
  27. Montel, G.; Bonel, G.; Heughebaert, J.C.; Trombe, J.C.; Rey, C. New concepts in the composition, crystallization and growth of the mineral component of calcified tissues. J. Cryst. Growth. 1981, 53, 74–99. [Google Scholar] [CrossRef]
  28. Kay, M.I.; Young, A.R.; Posner, A.S. Crystal structure of hydroxyapatite. Nat. 1964, 204, 1050–1052. [Google Scholar] [CrossRef] [PubMed]
  29. Brown, W.E.; Eidelman, N.; Tomazic, B. Octacalcium phosphate as a Precursor in Biomineral Formation. Adv. Dent. Res. 1987, 1, 306–313. [Google Scholar] [CrossRef]
  30. Fernández, M.E.; Zorrilla-Cangas, C.; García-García, R.; Asensio, J.A.; Reyes-Gasga, J. New model for the hydroxyapatite-octacalcium phosphate interface. Acta Crystall. Sec. B: Struct. Sci. 2003, B59, 175–181. [Google Scholar] [CrossRef] [PubMed]
  31. Simon, P.; Grüner, D.; Worch, H.; Pompe, W.; Liche, H.; El Khassawna, T.; Heiss, C.; Wenisch, S.; Kniep, R. First evidence of octacalcium phosphate at osteocalcin nanocomplex as skeletal bone component directing collagen triple-helix nanofibril mineralization. Sci. Rep. 2018, 8, 13696. [Google Scholar] [CrossRef]
  32. Miake, Y.; Shimoda, S.; Fukae, M.; Aoba, T. Epitaxial overgrowth of apatite crystals on the thin-ribbon precursor at early stages of porcine enamel mineralization. Calcif. Tissue Int. 1993, 53, 249–256. [Google Scholar] [CrossRef] [PubMed]
  33. Rooji, J.F.; Nancollas, G.H. The formation and remineralization of artificial white spots lesions: a constant composition approach. J. De. Res. 1984, 63, 864–867. [Google Scholar] [CrossRef]
  34. Nelson, D.G.A.; Wood, G.J.; Barry, J.C.; Featherstone, J.D.B. The structure of (100) defects in carbonates apatite crystallites: a high-resolution electron microscope study. Ultramicroscopy 1986, 19, 253–265. [Google Scholar] [CrossRef] [PubMed]
  35. Iijima, M.; Moriwaki, Y. Lengthwise and oriented growth of octacalcium phosphate crystal in polyacryalamide gel in a model system of tooth enamel apatite formation. J. Cryst. Growth 1998, 194, 125–132. [Google Scholar] [CrossRef]
  36. Falini, G.; Gazzano, M.; Ripamonti, A. Control of the architectural assembly of octacalcium phosphate crystals in denatured collagenous matrices. J. Mat. Chem. 2000, 10, 535–538. [Google Scholar] [CrossRef]
  37. Grassmann, O.; Löbmann, P. Morphogenetic control of calcite crystal growth in sulfonic acid based hidrogels. Chem. Eur. J. 2003, 9, 1310–1316. [Google Scholar] [CrossRef]
  38. Grassmann, O.; Löbmann, P. Biomimetic nucleation and growth of CaCO3 in hydrogels incorporating carboxylate groups. Biomater. 2004, 25, 277–282. [Google Scholar] [CrossRef]
  39. Helbig, U. Growth of calcium carbonate in polyacrylamide hydrogel: investigation of the influence of polymer content. J. Cryst. Growth. 2008, 310, 2863–2870. [Google Scholar] [CrossRef]
  40. Fernández-Díaz, L.; Putnis, A.; Prieto, M.; Putnis, C.V. The role of magnesium in the crystallization of calcite and aragonite in a porous medium. J. Sedimentary Res. 1996, 66, 482–491. [Google Scholar] [CrossRef]
  41. Prieto, M.; Putnis, A.; Fernández-Díaz, L. Crystallization of solid solutions from aqueous solutions in a porous medium: zoning in (Ba, Sr), SO4. Geol. Mag. 1993, 130, 289–299. [Google Scholar] [CrossRef]
  42. Prieto, M.; Putnis, A.; Fernández-Díaz, L.; López-Andrés, S. Metastability in diffusing-reacting systems. J. Cryst. Growth, 1994, 142, 225–235. [Google Scholar] [CrossRef]
  43. Wojdyr, M. Fityk: a general-purpose peak fitting program. J.Appl. Cryst. 2010, 43, 1126–1128. [Google Scholar] [CrossRef]
  44. KrystalShaper V1.5.0 © JCrystalSoft, 2018. Available online: http://www.jcrystal.com/products/krystalshaper/ (Accessed 29 Sept 2019).
  45. Fernández-Díaz, L.; Astilleros, J.M.; Pina, C.M. The morphology of calcite crystals grown in a porous medium doped with divalent cations. Chem. Geol. 2006, 225, 314–321. [Google Scholar] [CrossRef]
  46. Krishnamurti, D. The Raman spectrum of calcite and its interpretation. Proc. Indian. Acad. Sci. Section. A. 1957, 46, 183–202. [Google Scholar] [CrossRef]
  47. Buzgar, N.; Apopei, A.I. The Raman study on certain carbonates. Analele Stiintifice ale Universitatii “Al. I. Cuza” - Iasi, 2009, 55, 97–112. [Google Scholar]
  48. Gunasekaran, S.; Anbalagan, G.; Pandi, S. Raman and infrared spectra of carbonates of calcite structure. J. Raman Spect. 2006, 37, 892–899. [Google Scholar] [CrossRef]
  49. Gauldie, R.W.; Sharma, S.K.; Volk, E. Micro-raman spectral study of vaterite and aragonite otoliths of the coho salmon, Oncorhynchus kisutch. Comp. Biochem. Physiol. Part A: Physiol. 1997, 118, 753–757. [Google Scholar] [CrossRef]
  50. Couture, J.P.M. Anisotropy of the Raman effect in cubic crystals; theoretical study. C. R. Hebd. Seances. Acad. Sci. 1947, 224, 902–904. [Google Scholar]
  51. Urmos, J.; Sharma, S.K.; Mackenzie, F.T. Characterization of some biogenic carbonates with Raman spectroscopy. Am. Mineral. 1991, 76, 641–646. [Google Scholar]
  52. Koutsopoulos, S. Synthesis and characterization of hydroxyapatite crystals: A review study on the analytical methods. J. Biomed. Mater. Res. 2002, 62, 600–612. [Google Scholar] [CrossRef]
  53. Penel, G.; Leroy, N.; van Landuyt, P.; Flautre, B.; Hardouin, P.; Lemaître, J.; Leroy, G. Raman microspectrometry studies of brushite cement: in vivo evolution in a sheep model. Bone 1999, 25 (Suppl.), 81S–84S. [Google Scholar] [CrossRef]
  54. de Aza, P.N.; Guitian, F.; Santos, C.; de Aza, S.; Cusco, R.; Artus, L. Vibrational investigation of calcium phosphate compounds. 2. Comparison between hydroxyapatite and -tricalcium phosphate. Chem. Mater. 1997, 9, 916–922. [Google Scholar] [CrossRef]
  55. Sauer, G.R.; Zunic, W.B.; During, J.R.; Wuthier, R.E. Fourier transform Raman spectroscopy of synthetic and biological calcium phosphates. Calcif. Tissue Int. 1994, 54, 414–420. [Google Scholar] [CrossRef] [PubMed]
  56. Tsuda, H.; Arends, J. Raman spectra of human dental calculus. J. Dental Res. 1993, 72, 1609–1613. [Google Scholar] [CrossRef] [PubMed]
  57. O’Shea, D.C.; Bartlett, M.L.; Young, R.A. Compositional analysis of apatites with laser-Raman spectroscopy: (OH, F, Cl) apatites. Arch. Oral Biol. 1974, 19, 995–1006. [Google Scholar] [CrossRef]
  58. Griffith, W.P. Raman studies of rock-forming minerals. Part II. Minerals containing MO3, MO4, and MO6 groups. J. Chem. Soc. (A) 1970, 286–291. [Google Scholar] [CrossRef]
  59. Awonusi, A.; Morris, M.D.; Tecklenburg, M.M.J. Carbonate assignment and calibration in the Raman spectrum of apatite. Calcif. Tissue Int. 2007, 81, 46–52. [Google Scholar] [CrossRef] [PubMed]
  60. Titiloye J., O.; Parker S., C.; Mann S., J. Atomistic simulation of calcite surfaces and the influence of growth additives on their morphology. J. Cryst. Growth. 1993, 131, 533–545. [Google Scholar] [CrossRef]
  61. Davis, K.J.; Dove, P.M.; Wasylenki, L.E.; De Yoreo, J.J. Morphological consequences of differential Mg2+ incorporation at structurally distinct steps on calcite. Am. Mineral. 2004, 89, 714–720. [Google Scholar] [CrossRef]
  62. Mayorga, I.C; Astilleros, J.M.; Fernández-Díaz, L. Precipitation of CaCO3 Polymorphs from Aqueous Solutions: The Role of pH and Sulphate Groups. Minerals, 2019, 9, 178. [Google Scholar] [CrossRef]
  63. Addadi, L.; Joester, D.; Nudelman, F.; Weiner, S. Mollusk shell formation: A source of new concepts for understanding biomineralization processes. Chem. Eur. J. 2006, 12, 980–987. [Google Scholar] [CrossRef]
  64. Veis, A.; Dorvee, J.R. Biomineralization Mechanisms: A New Paradigm for Crystal Nucleation in Organic Matrices. Calcif. Tissue Int. 2013, 93, 307–315. [Google Scholar] [CrossRef]
  65. Bachra, B.N; Trautz, O.R; Simon, S.L. Precipitation of calcium carbonates and phosphates. I. Spontaneous precipitation of calcium carbonates and phosphates under physiological conditions. Arch. Biochem. Biophys. 1963, 103, 124–138. [Google Scholar] [CrossRef]
  66. Rey, C.C.; Combes, C.; Drouet, C. Synthesis and physical chemical characterizations of octacalcium phosphate-based biomaterials for hard-tissue regeneration. In: Octacalcium Phosphate Biomaterials: Understanding of Bioactive Properties and Application. 1st ed.; Suzuki, O., Insley, G., Eds.; Woodhead Publishing Series in Biomaterials. Elsevier, 2019, pp. 177–212. [CrossRef]
  67. Havlin, J.L.; Schlegel, A.J. Review of phosphite as a plant nutrient and fungicide. Soil Syst. 2021, 5, 52. [Google Scholar] [CrossRef]
  68. Zeebe, R.E.; Wolf-Gladrow, D.A. CO2 in seawater: equilibrium, kinetics, isotopes. Elsevier, Amsterdam. 2001, 346 pp.
  69. Legros, R.; Balmain, N.; Bonel, G. Age-related changes in mineral of rat and bovine cortical bone. Calcif. Tissue. Int., 1987, 41, 137–144. [Google Scholar] [CrossRef]
  70. Kuczumow, A.; Gorzelak, M.; Kosiński, J.; Lasota, A.; Blicharski, T.; Gągała, J.; Nowak, J.; Jarzębski, M.; Jabłoński, M. Hierarchy of Bioapatites. Int. J. Mol. Sci. 2022, 23, 9537. [Google Scholar] [CrossRef]
  71. Omelon, S.J.; Grynpas, M.D. Relationships between polyphosphate chemistry, biochemistry and apatite biomineralization. Chem Rev. 2008, 108, 4694–715. [Google Scholar] [CrossRef]
  72. Rey, C.; Collins, B.; Goehl, T.; Dickson, I.R.; Glimcher, M.J. The carbonate environment in bone mineral: A resolution-enhanced fourier transform infrared spectroscopy study. Calcif Tissue Int. 1989, 45, 157–164. [Google Scholar] [CrossRef]
  73. Pinto A., J.; Jiménez, A.; Prieto, M. Interaction of phosphate-bearing solutions with gypsum: Epitaxy and induced twinning of brushite (CaHPO4·2H2O) on the gypsum cleavage surface. Am. Mineral. 2009, 94, 313–322. [Google Scholar] [CrossRef]
Figure 1. Crystals obtained in the reference P-free experiment (Mixture I). a) Rhombohedral single crystal, b) flower-like aggregates and, c) radial aggregates of acicular crystallites.
Preprints 109879 g001
Figure 2. Crystals obtained in the P-doped experiments (a-b): a) elongated crystals from Mixture II grown in the presence of 50 ppm of phosphate in the gel medium, and b) elongated crystals from Mixture III grown in the presence of 500 ppm of phosphate. c) Sketch showing a calcite crystal elongated along the c axis and bounded by the {0221} and {1014} rhombohedra.
Preprints 109879 g002
Figure 3. SEM micrographs of solids obtained from Mixture III following 15 days (a and c), and one month (b and d) after the first nucleation, respectively. The inset in c) corresponds to a magnified micrograph over the layer of tabular, elongated crystals.
Preprints 109879 g003
Figure 4. Raman spectra of crystals and aggregates obtained in the P-free experiments.
Preprints 109879 g004
Figure 5. a) Raman spectra of calcite crystals grown in the presence of phosphate. b) Inset displaying the P-O Raman band area. Red line belongs to elongated calcite crystals from Mixture II (P-bearing 50 ppm) recovered from the gel 15 days after nucleation, black line belongs to more elongated calcite crystals from same Mixture but recovered after one month nucleation, and green line corresponds to very elongated crystals from Mixture III (P-bearing 500 ppm) recovered from gel 15 days after nucleation.
Preprints 109879 g005
Figure 6. Raman spectra of cores in aggregates obtained in experiment III, after 15 days and 30 days diffusion times after the first nucleation.
Preprints 109879 g006
Figure 7. Raman spectra of a core from an aggregate obtained in experiment III, after 360 h of diffusion time. Insets display band deconvolutions and assignments for the spectral regions a) 325 < cm-1 < 625, and b) 900 < cm-1 < 1100. (See Table S1 in the Supplementary Information for the band assignments).
Preprints 109879 g007
Figure 8. Raman spectra of the bladed crystals (see inset), from an aggregate obtained in experiment III 15 and 30 days after the first nucleation. Insets display band deconvolutions and assignments for the spectral regions a) 350 < cm-1 < 650, and b) 800 < cm-1 < 1200. (See Table S2 in the Supplementary Information for the band assignments).
Preprints 109879 g008
Figure 9. Raman spectra of the outermost growth layer (see inset) of an aggregate obtained from experiment III 30 days after the first nucleation. Insets display band deconvolutions and assignments for the spectral regions a) 350 < cm-1 < 650, and b) 925 < cm-1 < 1100. (See Table S3 in the Supplementary Information for the band assignments).
Preprints 109879 g009
Figure 10. Raman spectra of core, fibers, and rim, of crystal aggregates obtained in experiment III, 30 days after the first nucleation, focusing on a) 350 < cm-1 < 650, and b) 985 < cm-1 < 1100 regions.
Preprints 109879 g010
Figure 11. EMP X-ray elemental mapping of an aggregate collected in experiment III, 30 days after the first nucleation, regarding a) calcium and b) phosphorus. C-HAP = Carbonate-Hydroxyapatite, “Pseudo” Ap = “Pseudo” apatite, Arg = Aragonite, Vtr = Vaterite.
Preprints 109879 g011
Table 1. Concentrations of the solutions used in the gel experiments.
Mixture Reagents GEL Tw1 Morphologies
[CaCl2] [Na2CO3] [Na2PO4]
I 0.5 M 0.5 M - 216 h Rhombohedral
Flower-like
Radial
II 0.5 M 0.5 M 50 ppm 216 h Elongated
III 0.5 M 0.5 M 500 ppm 168 h
360 h
Spheres
Elongated
1 Tw: waiting time for the first nucleation.
Disclaimer/Publisher’s Note: The statements, opinions and data contained in all publications are solely those of the individual author(s) and contributor(s) and not of MDPI and/or the editor(s). MDPI and/or the editor(s) disclaim responsibility for any injury to people or property resulting from any ideas, methods, instructions or products referred to in the content.
Copyright: This open access article is published under a Creative Commons CC BY 4.0 license, which permit the free download, distribution, and reuse, provided that the author and preprint are cited in any reuse.
Prerpints.org logo

Preprints.org is a free preprint server supported by MDPI in Basel, Switzerland.

Subscribe

© 2024 MDPI (Basel, Switzerland) unless otherwise stated