1. Introduction
Global warming is increasing [
1] and higher temperatures will progressively limit agricultural production, especially in tropical and subtropical regions [
2,
3,
4,
5]. A 28% reduction in tomato yield under high temperatures was reported in Australia [
6]. There is an urgent need to improve adaptive management of crops and the selection of heat tolerant germplasm for current and future production environments [
7,
8]. Qatar has a desert climate, and crops can only grow in winter and spring. However, global warming is reducing the duration of both winter and spring with consequences for vegetable production [
9]. Heat tolerant crops, therefore, will play an important role in future agriculture in Qatar.
Tomato (
Solanum lycopersicum L.) is an important horticultural crop worldwide. It can be grown in both subtropical and tropical zones. The optimal daytime temperature for tomato production is 25 °C to 30 °C [
10]. If temperature exceeds a critical point, productivity will fall significantly. For example, El Ahmadi and Stevens [
11] reported that in several heat-tolerant tomato varieties, the number of flowers, pollen viability, fruit set, and yield were dramatically reduced under 38/27 °C day/night temperatures. Heat stress is defined as temperatures 10–15 °C higher than optimal [
2]. High temperature stress can cause negative impact on plant development, including morphology, physiology, biochemistry, and molecular pathways at all vegetative and reproductive stages, which leads to loss of yield. During anthesis, tomato is very sensitive to temperature fluctuations, which impairs anther, pollen, and pistil development, leading to reduced fertilization, lower fruit set, and poorer quality fruit and yield [
2,
12,
13,
14]. At the physiological level, heat stress impacts photosynthesis, respiration, and membrane plasticity [
15,
16,
17]. Damage to cell membranes results in electrolyte leakage [
18,
19]. Electrolyte leakage is commonly used to assess tolerance and sensitivity to heat stress [
6,
20]. Studies of the tomato transcriptome under normal and heat stressed conditions, identified hundreds of genes that changed expression, including heat shock proteins (HSPs) and their related transcription factors (HSFs) [
21,
22,
23,
24]. High temperature stress also causes biochemical changes, including changes to the levels of sugars, fatty acids, proline, salicylic acid, and abscisic acid. In addition, reactive oxygen species (ROS) accumulate and enzymes in chloroplasts and mitochondria are inactivated [
17,
25].
Heat tolerance is controlled by multiple genes which induce physiological and biochemical changes. Several studies have identified quantitative trait loci (QTL) linked to reproductive traits under heat stress using biparental QTL mapping, introgression lines, multiparent advanced generation intercross (MAGIC) populations [
26,
27,
28,
29] and genome-wide association studies (GWAS) [
6]. Candidate genes linked to the heat stress response have also been identified [
23,
24,
30]. Recently, genomic selection was applied to tomato [
30,
31,
32] with some success. Heat tolerant genotypes were successfully predicted with good accuracy for yield (0.729) and total soluble solids (SCC, 0.715) [
30]. Whole genome sequencing of a heat tolerant line revealed highly variable chromosome regions (QTL) compared to a reference genome and a high number of candidate genes [
24]. While genomic selection and whole-genome sequencing may not be cost effective for a small breeding program, traditional marker-assisted selection (MAS) for key traits remains viable.
In this study, previously identified tomato QTL markers for agronomic traits under heat stress [
6,
26] were validated in a totally different set of 71 tomato varieties grown in Qatar. The aim was to identify and validate QTL for genotypic selection for heat tolerance. The identified markers would be useful to breeders for MAS.
4. Discussion
Qatar has a desert climate. It has very low annual rainfall and a hot and long summer. The experiment was carried out in a net greenhouse to assess tomato production under high temperature. The temperature inside the net greenhouse was higher than the ambient temperature.
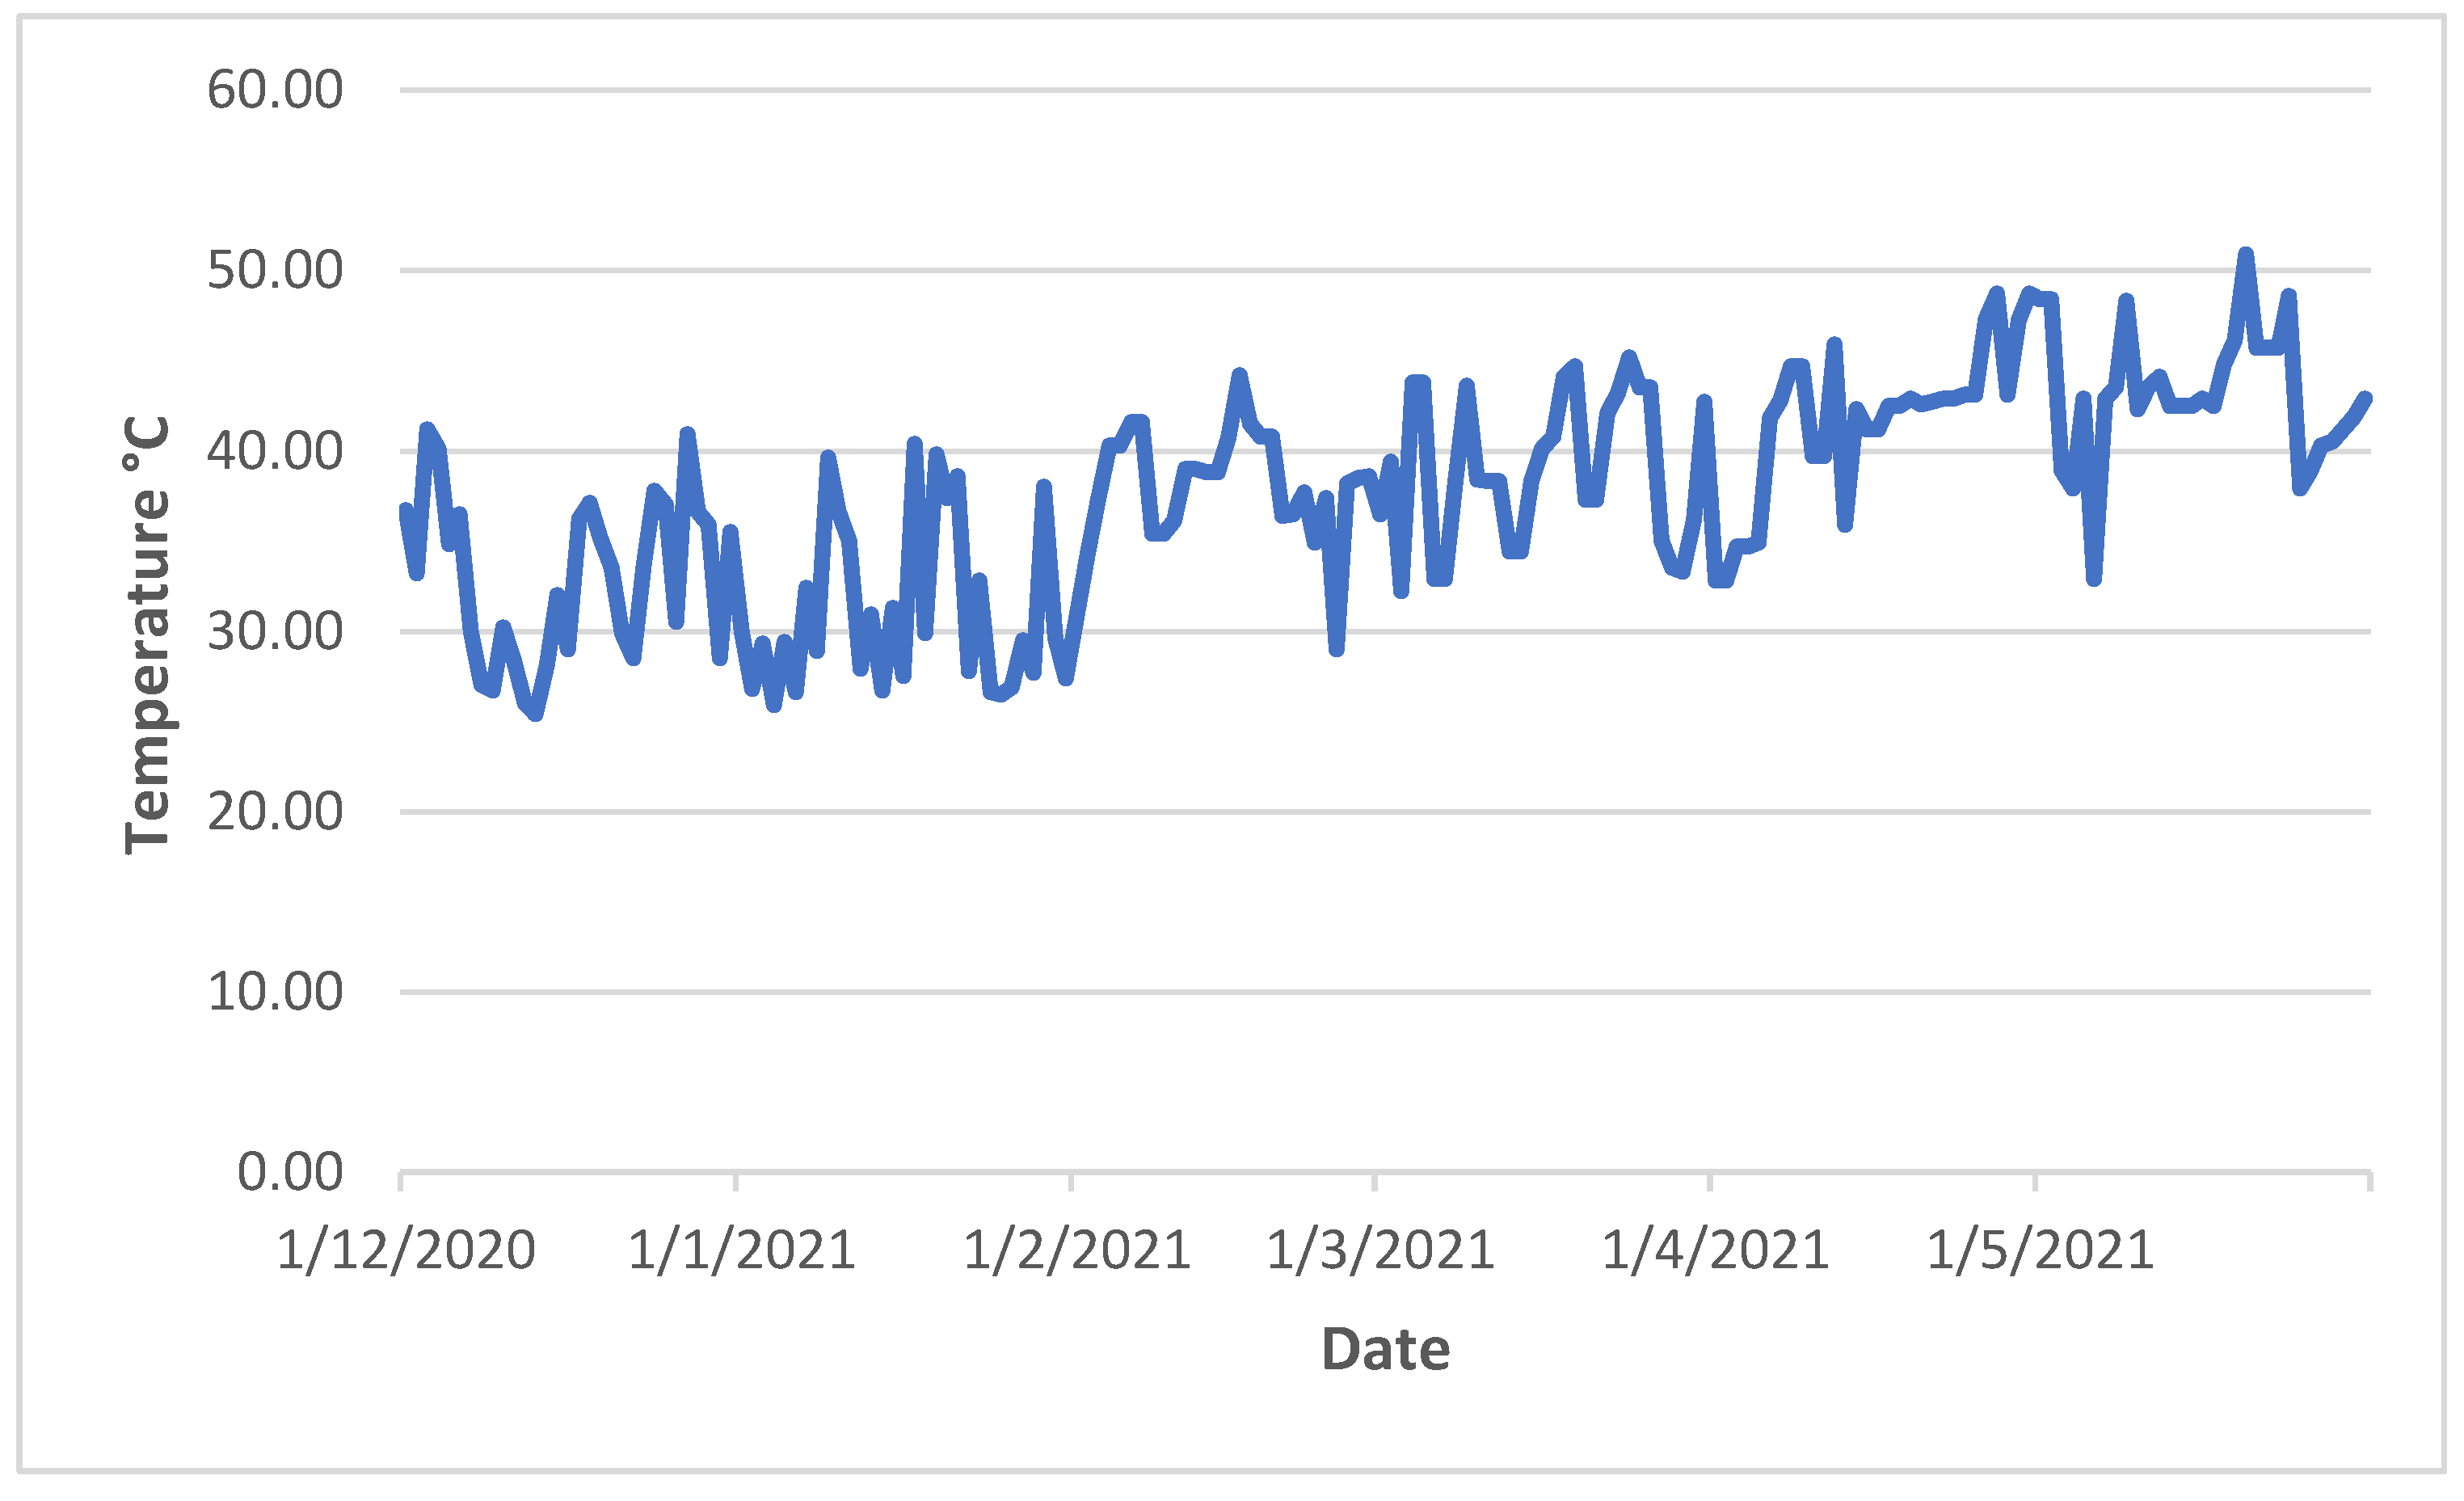
Figure 1 demonstrated that day temperature during the tomato growth period was fluctuated severely. During the vegetative growth (December), the plants experienced a few days of over 40 °C. During the reproductive period (January and February), more days exceeded 40 °C. The effects of heat stress on vegetative development were evident at high temperature (i.e., 40 °C) [
22], whereas reproductive traits are often affected by long-term mild heat stress (i.e., 31 °C) [
26], or short periods of high heat stress (over 40 °C) [
2]. Plant response to heat stress is complex and controlled by multiple genes. Phenotypic traits, such as flower number, fruit number, percentage of fruit set, stigma exsertion, pollen viability, electrolyte leakage, soluble solid content, were used for QTL analysis by others [
6,
26,
27,
28]. It was shown that fruit set is an important trait that directly affects yield. In this report, fruit set and yield were the focus of the genetic analysis. As TSS was an important trait for the fruit quality it was also included in the analysis.
Previous GWAS [
6] used 144 tomato accessions and DArTseq (Diversity Arrays Technology by sequencing) for association study and identified 142 QTL markers (SNP) that had high log scores associated with heat tolerance. In the previous report, the arbitrary number from DArTseq were used as the marker name, which was not meaningful. In this study, 96 markers were selected, and the SNP position was converted from tomato genome SL2.4 to SL4.0. The name of the markers was converted to show genome sequence version, chromosome number, and position. This will allow the research community and breeders to use these markers easily. The QTL markers/positions identified in other studies [
26,
27,
28] were also converted according to SL4.0. Thus, these QTL were comparable (
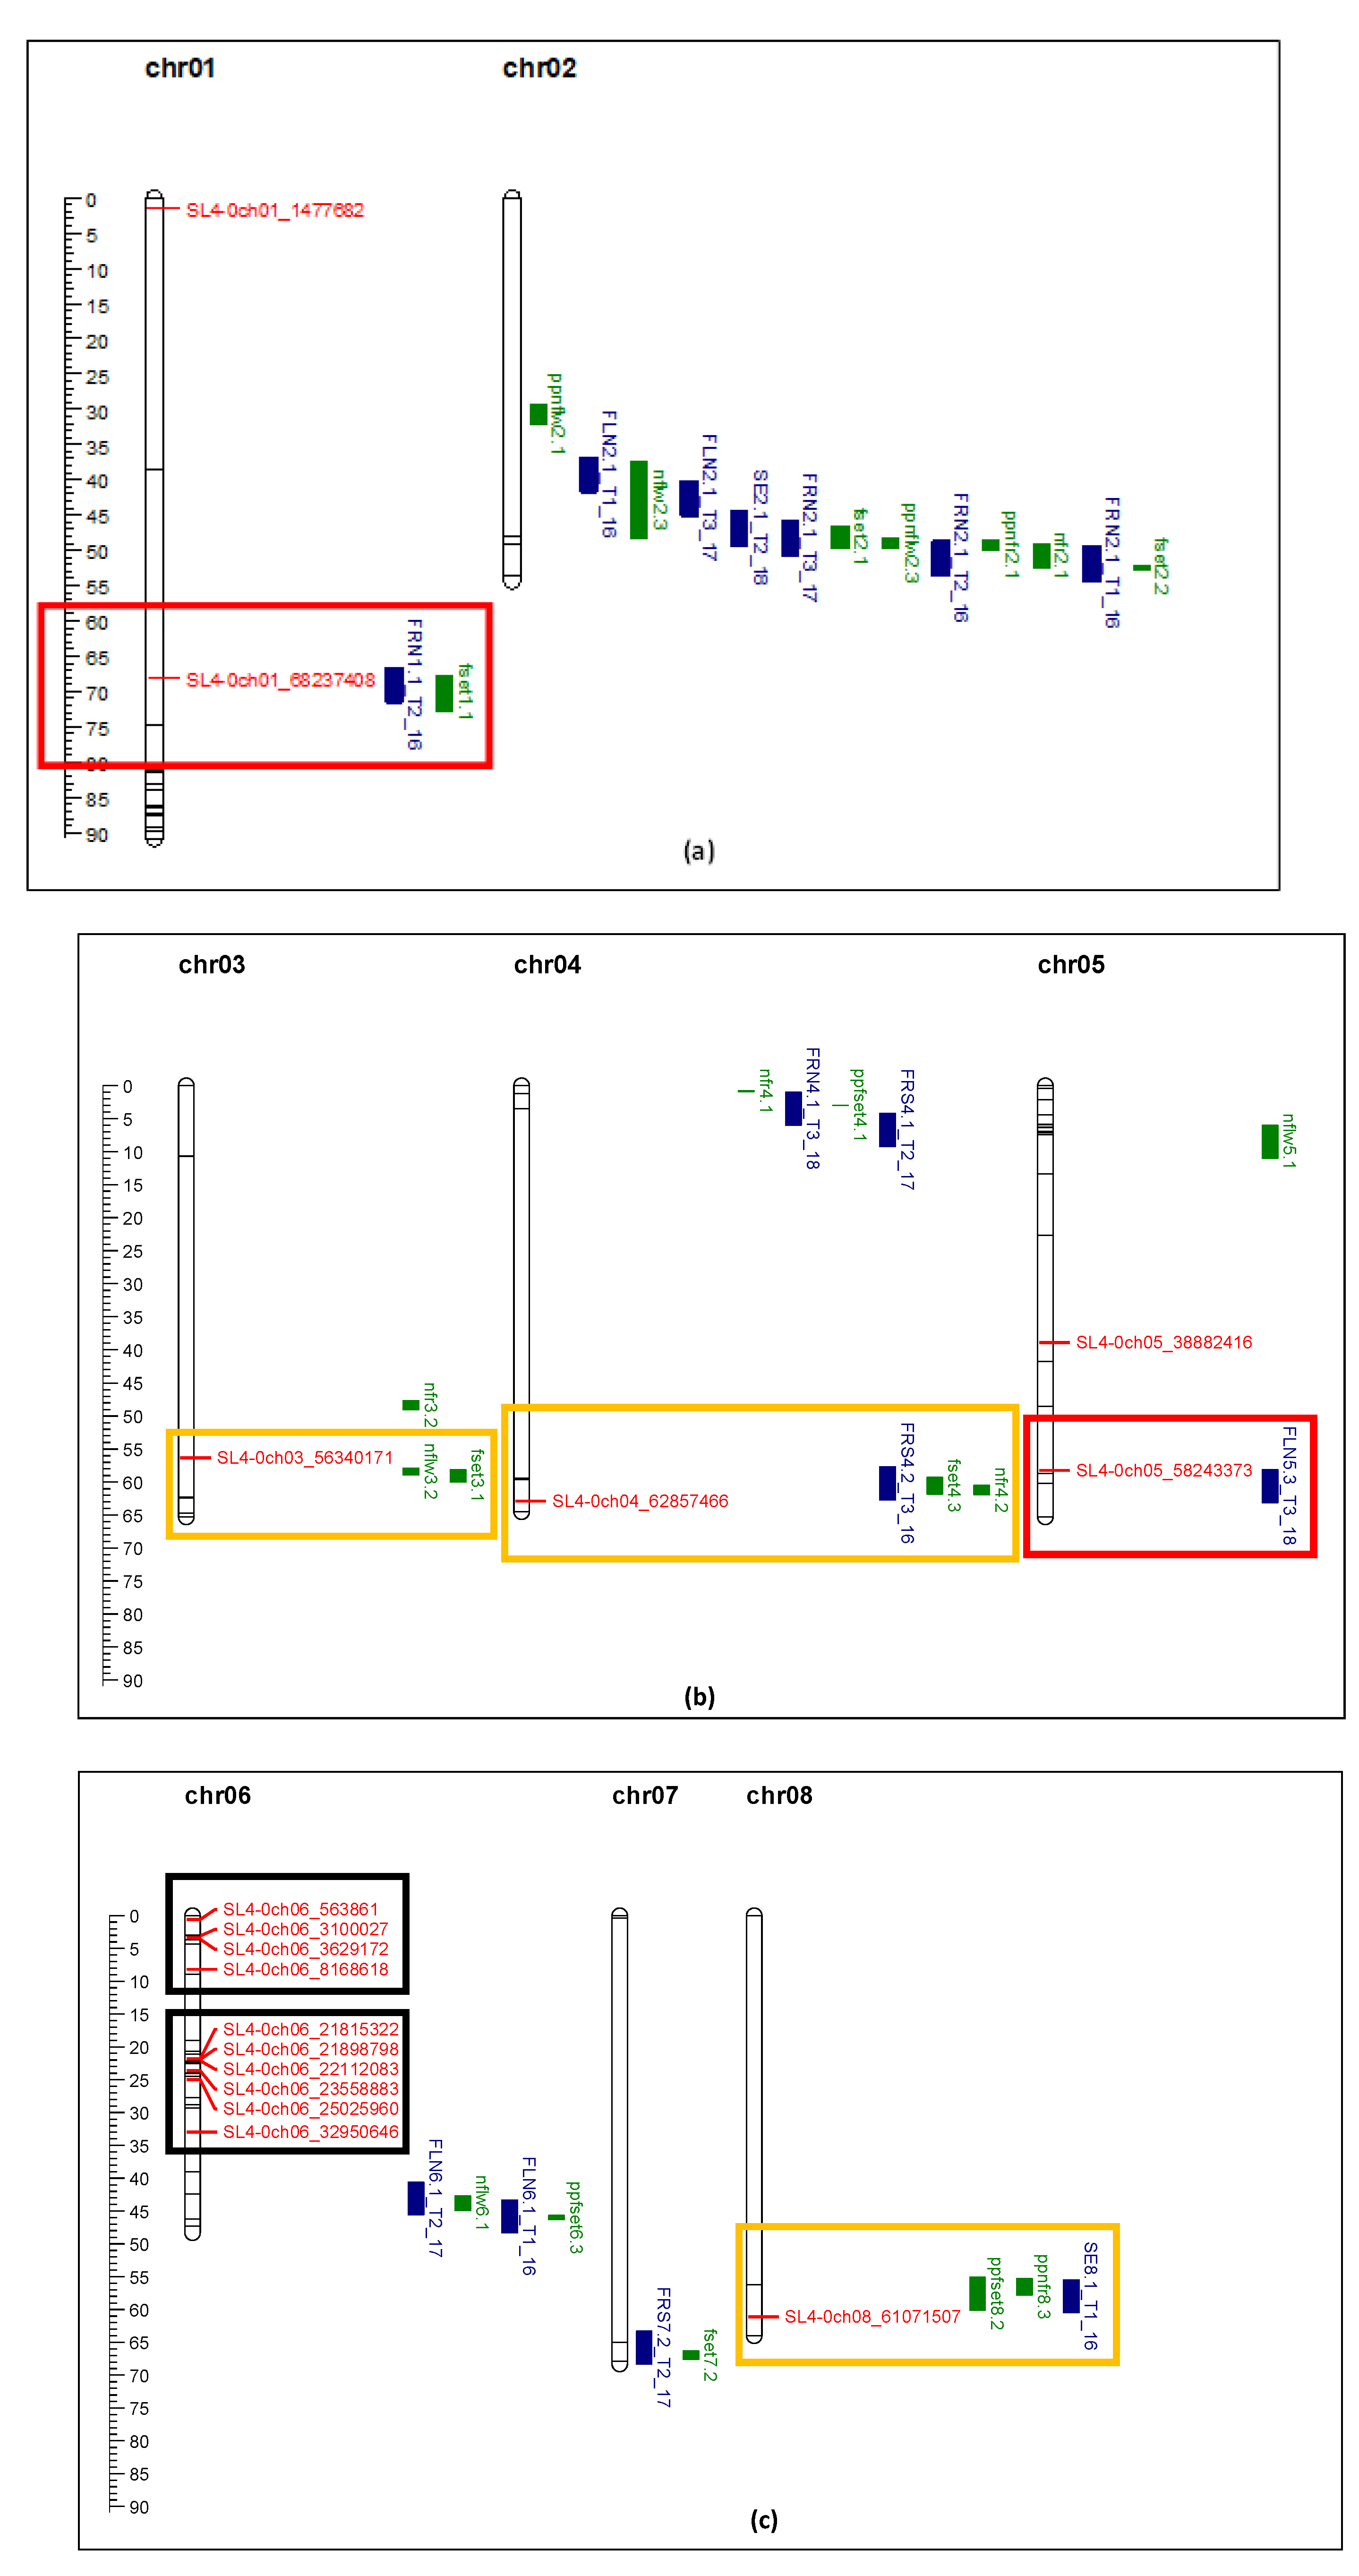
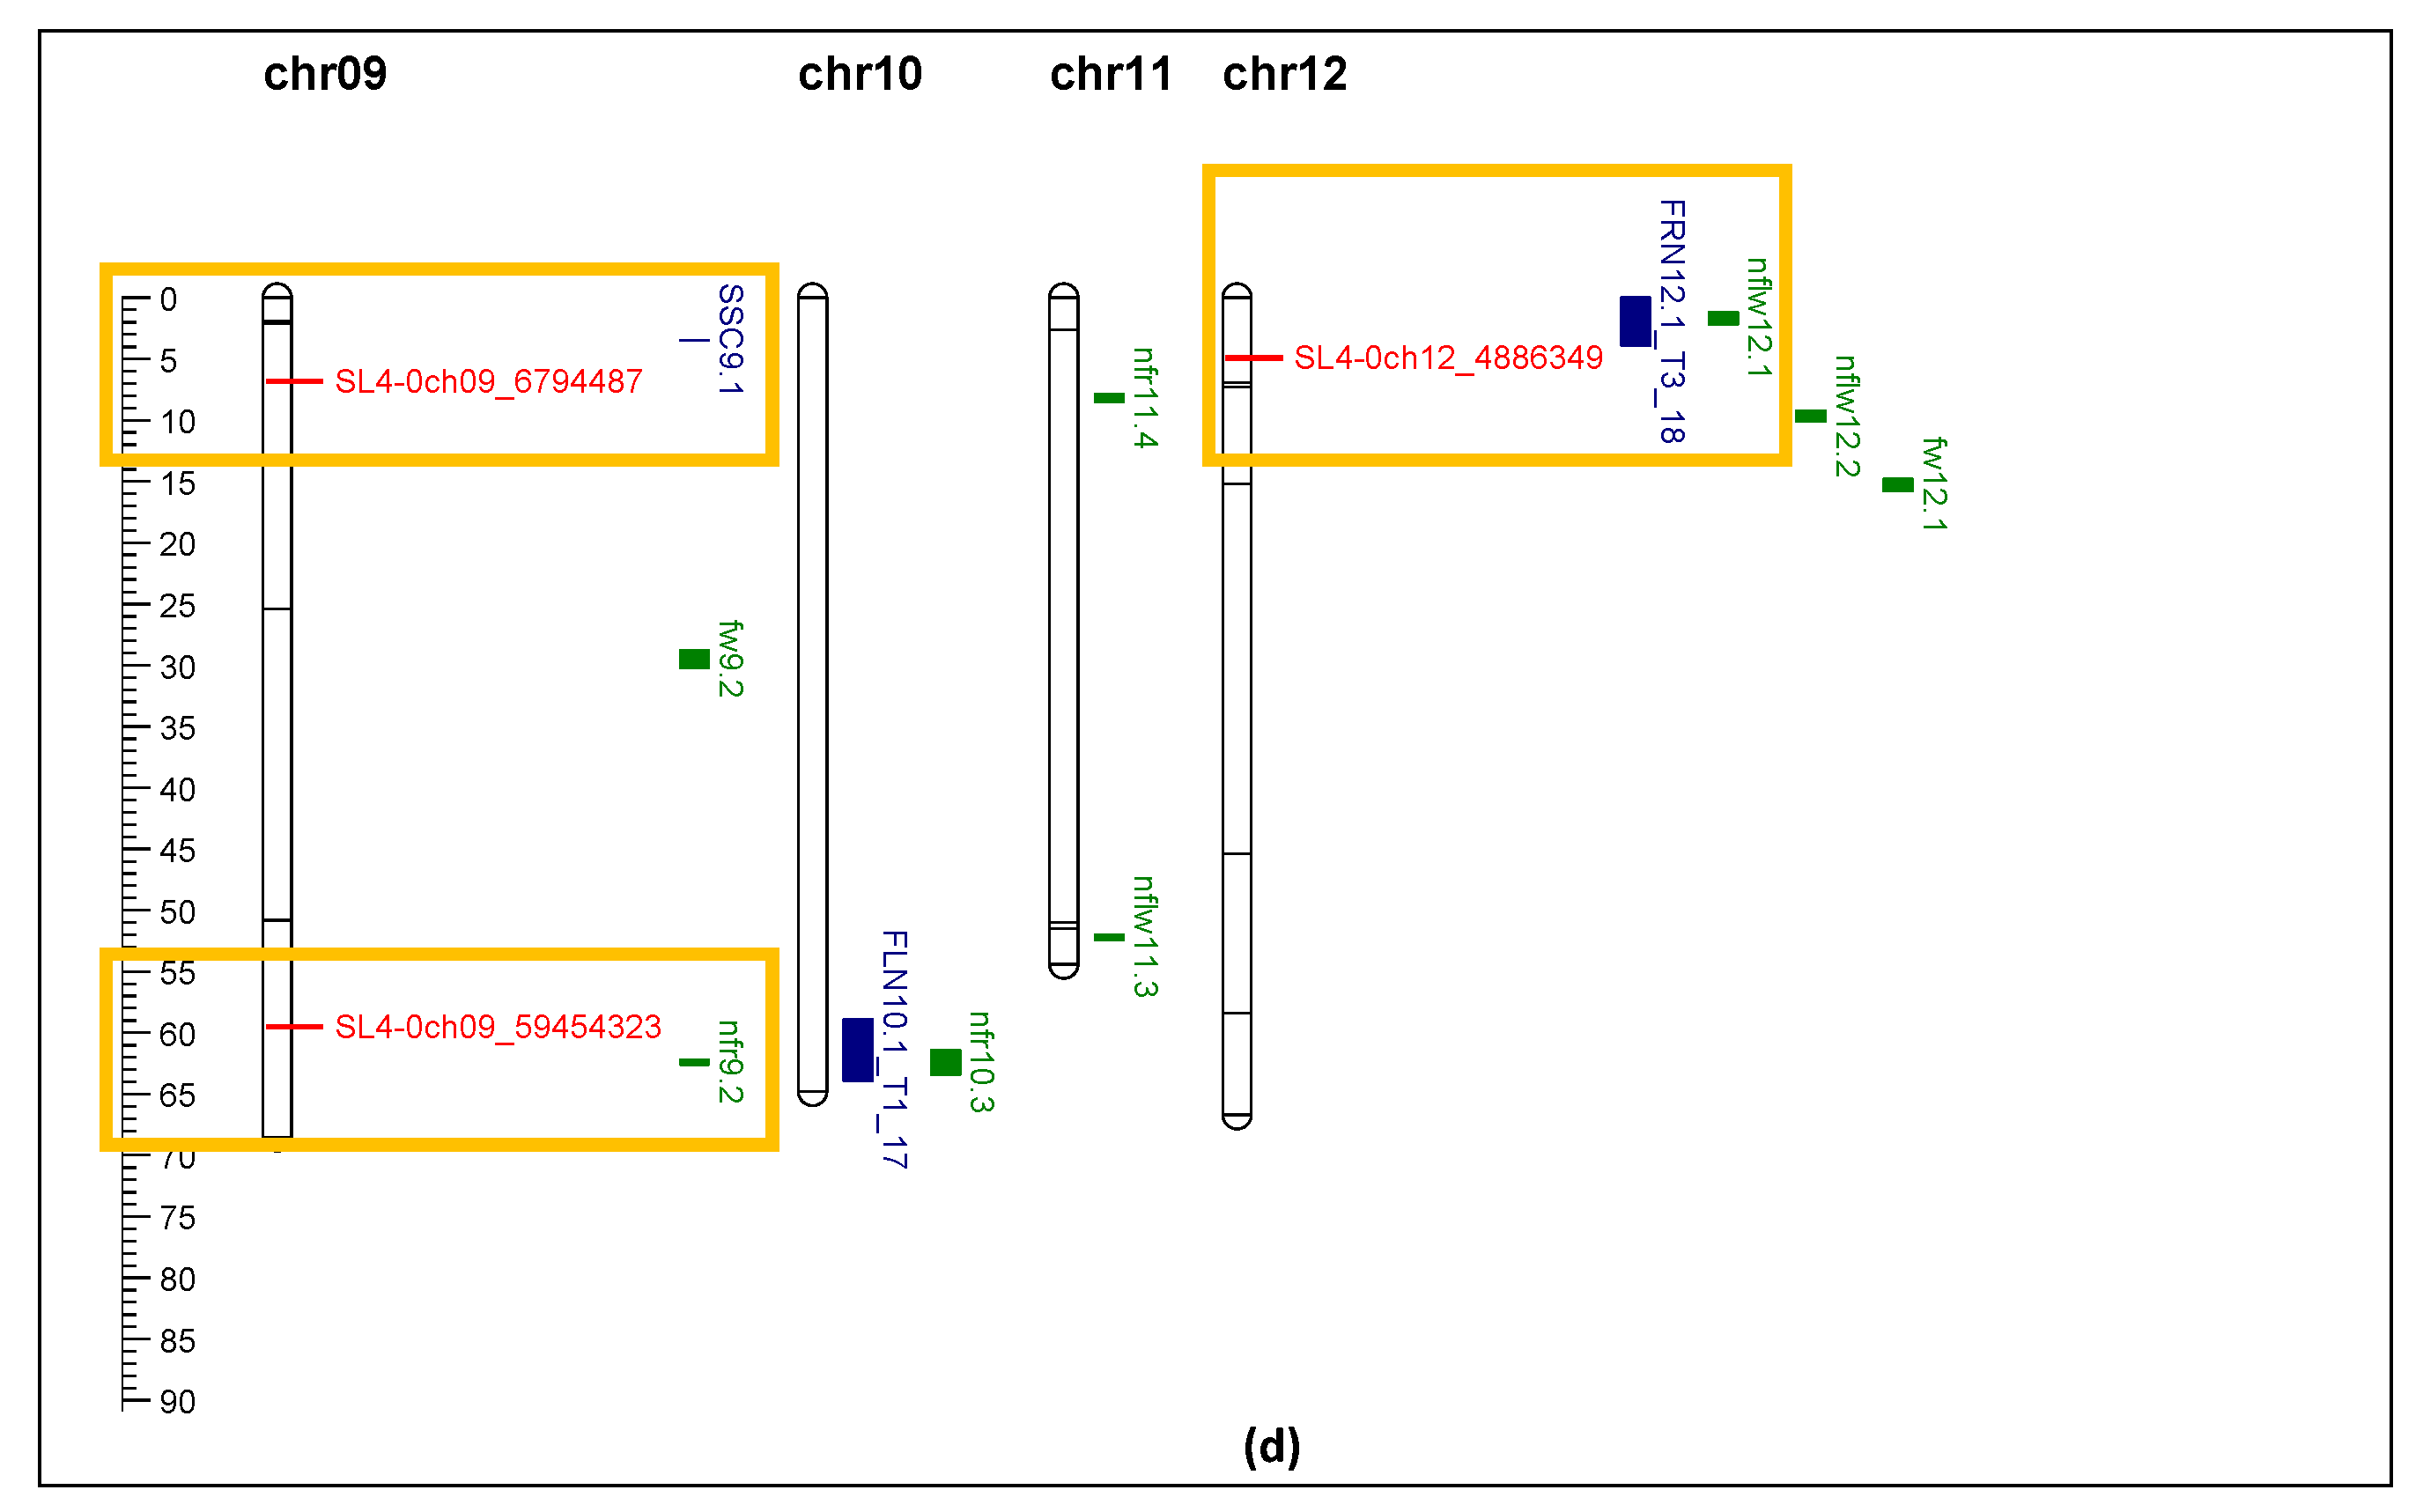
Figure 8).
Comparison of markers identified in this study with the QTL reported by other researchers showed general agreement for several QTL. Markers SL4-0ch01_68237408 and SL4-0ch05_58243373 perfectly aligned with QTL associated with fruit number, flower number, and fruit set [
27,
28]. Other markers, SL4-0ch8_ 61071507, SL4-0ch09_59454323, SL4-0ch12_4886349, located within 4 Mbp of other QTL related to flower and fruit traits [
27,
28]. Marker SL4-0ch09_6794487 showed strong association with TSS, which is also located within 4 Mbp of a SSC QTL [
27]. Three markers from Xu et al. (2017) showed correlation with yield and fruit set in this study. SL4-0ch01_1477682 (solcap_snp_sl_8704) was associated with style length [
26]. SL4.0ch01_68237408 (solcap_snp_sl_13762) was associated with flower number per inflorescence [
26]. These two traits were related to productivity and final yield. Another marker, SL4.0ch08_61071507 (solcap_snp_sl_15446), was associated with inflorescence number [
26], which in this study was related to fruit set. Although 104 markers were used to genotype the 71 tomato varieties/accessions, only 21 markers showed enough polymorphism (minor allele frequency larger than 9%) for association analysis, and 19 markers showed significant association with yield, fruit set, and TSS. Two markers, SL4-0ch03_56340171 and SL4-0ch04_62857466, which mapped within the QTLs related to flower number, fruit number, and fruit set (
Figure 8), were not significant for fruit set and yield in this study. This was probably due to the small population size and reduced power of the association study.
Interestingly 10 markers on chromosome 6 had a significant impact on yield, fruit set and TSS. Alsamir et al. (2017) [
6] identified markers on chromosomes 1 and 6 that significantly impacted electrolyte leakage (EL). The EL trait was indicative of heat stress impact which was reflected in yield in this study. Cappetta et al. (2021) [
30] found a high density of SNPs on chromosome 6 linked to heat tolerance. A major QTL was found on chromosome 6 (in a similar region to that reported here) which explained 86% of the phenotypic variance related to yield [
30]. This QTL region contains Solyc06g006057, Solyc06g007310, Solyc06g007530, Solyc06g008720, Solyc06g009920, Solyc06g036260, Solyc06g036485, Solyc06g051190 variant genes, coding for Leucine-rich receptor-like protein kinase family protein, Deoxyribonuclease tatD, B3 domain-containing protein (Os05g0481400), Zinc ion binding protein, ATPase E1-E2 type family protein, Beta-carotene hydroxylase 1, Kinase family protein, and RNA-dependent RNA polymerase family protein. Using differential gene expression analysis of tolerant and sensitive accessions under high temperature, Gonzalo et al. (2021) [
23] identified genes on chromosome 6 that upregulated during heat stress in tolerant accessions, including heat shock proteins, gibberellin-3-β-dioxygenase 1, and indeterminate-domain 16-like protein, which is plant specific transcription factor regulating in sugar homeostasis, leaf and root architecture, inflorescence and seed development.
The most interesting finding was that the markers identified in this study are all located in a gene body except one.
Table 8 lists the SNP markers and their associated genes and gene functions. These genes may be important for conveying heat tolerance in tomato. For example, ABC transporter (SL4-0ch05_38882416) is a transmembrane protein; its function is to import essential nutrients to the cell and to export toxic molecules out. The role of ABC transporter in the defence of multiple plant pathogens has been demonstrated [
33,
34,
35]. The role of ABC transporters in abiotic stress response, such as heat stress, could also be important, but have yet to be studied. Another protein, Cullin (SL4-0ch01_68237408) and its protein family is involved in protein degradation. Involvement of Cullin in the heat stress response is also possible. Multiple markers on chromosome 6 are located in different genes, including protein kinase (same finding as in [
30]), Glyoxysomal fatty acid β-oxidation multifunctional protein (lipid metabolism), hydrolase, pleiotropic drug resistance protein, and phosphoinositide phospholipase C (signal transduction). Another chloroplastic Serine/threonine-protein kinase (SL4-0ch12_15246947) may play roles in photosynthesis during heat stress. Indeed, SNP location is important for genetic selection. Cappetta et al. (2021) [
30] used a subset of 2,278 SNPs mapped in gene body regions to perform genomic selection (GS). They obtained similar accuracy to the full dataset of 10,648 SNPs. Overall, the markers/genes identified in this study are of importance for selection of heat tolerant tomato varieties/accessions.
Author Contributions
Conceptualization and funding acquisition, R.T., T.M., E.E.; methodology, E.E., T.M., C.D.; formal analysis, C.D., L.Z., R.T.; investigation, E.E., N.E., M.Q., N.S., A.K., M.M.; resources, E.E., T.M.; data curation, E.E., C.D.; writing—original draft preparation, C.D., E.E., T.M.; writing—review and editing, R.T., C.D., L.Z. All authors have read and agreed to the published version of the manuscript.
Figure 1.
Temperature at mid-day during the growth period of year 2.
Figure 1.
Temperature at mid-day during the growth period of year 2.
Figure 2.
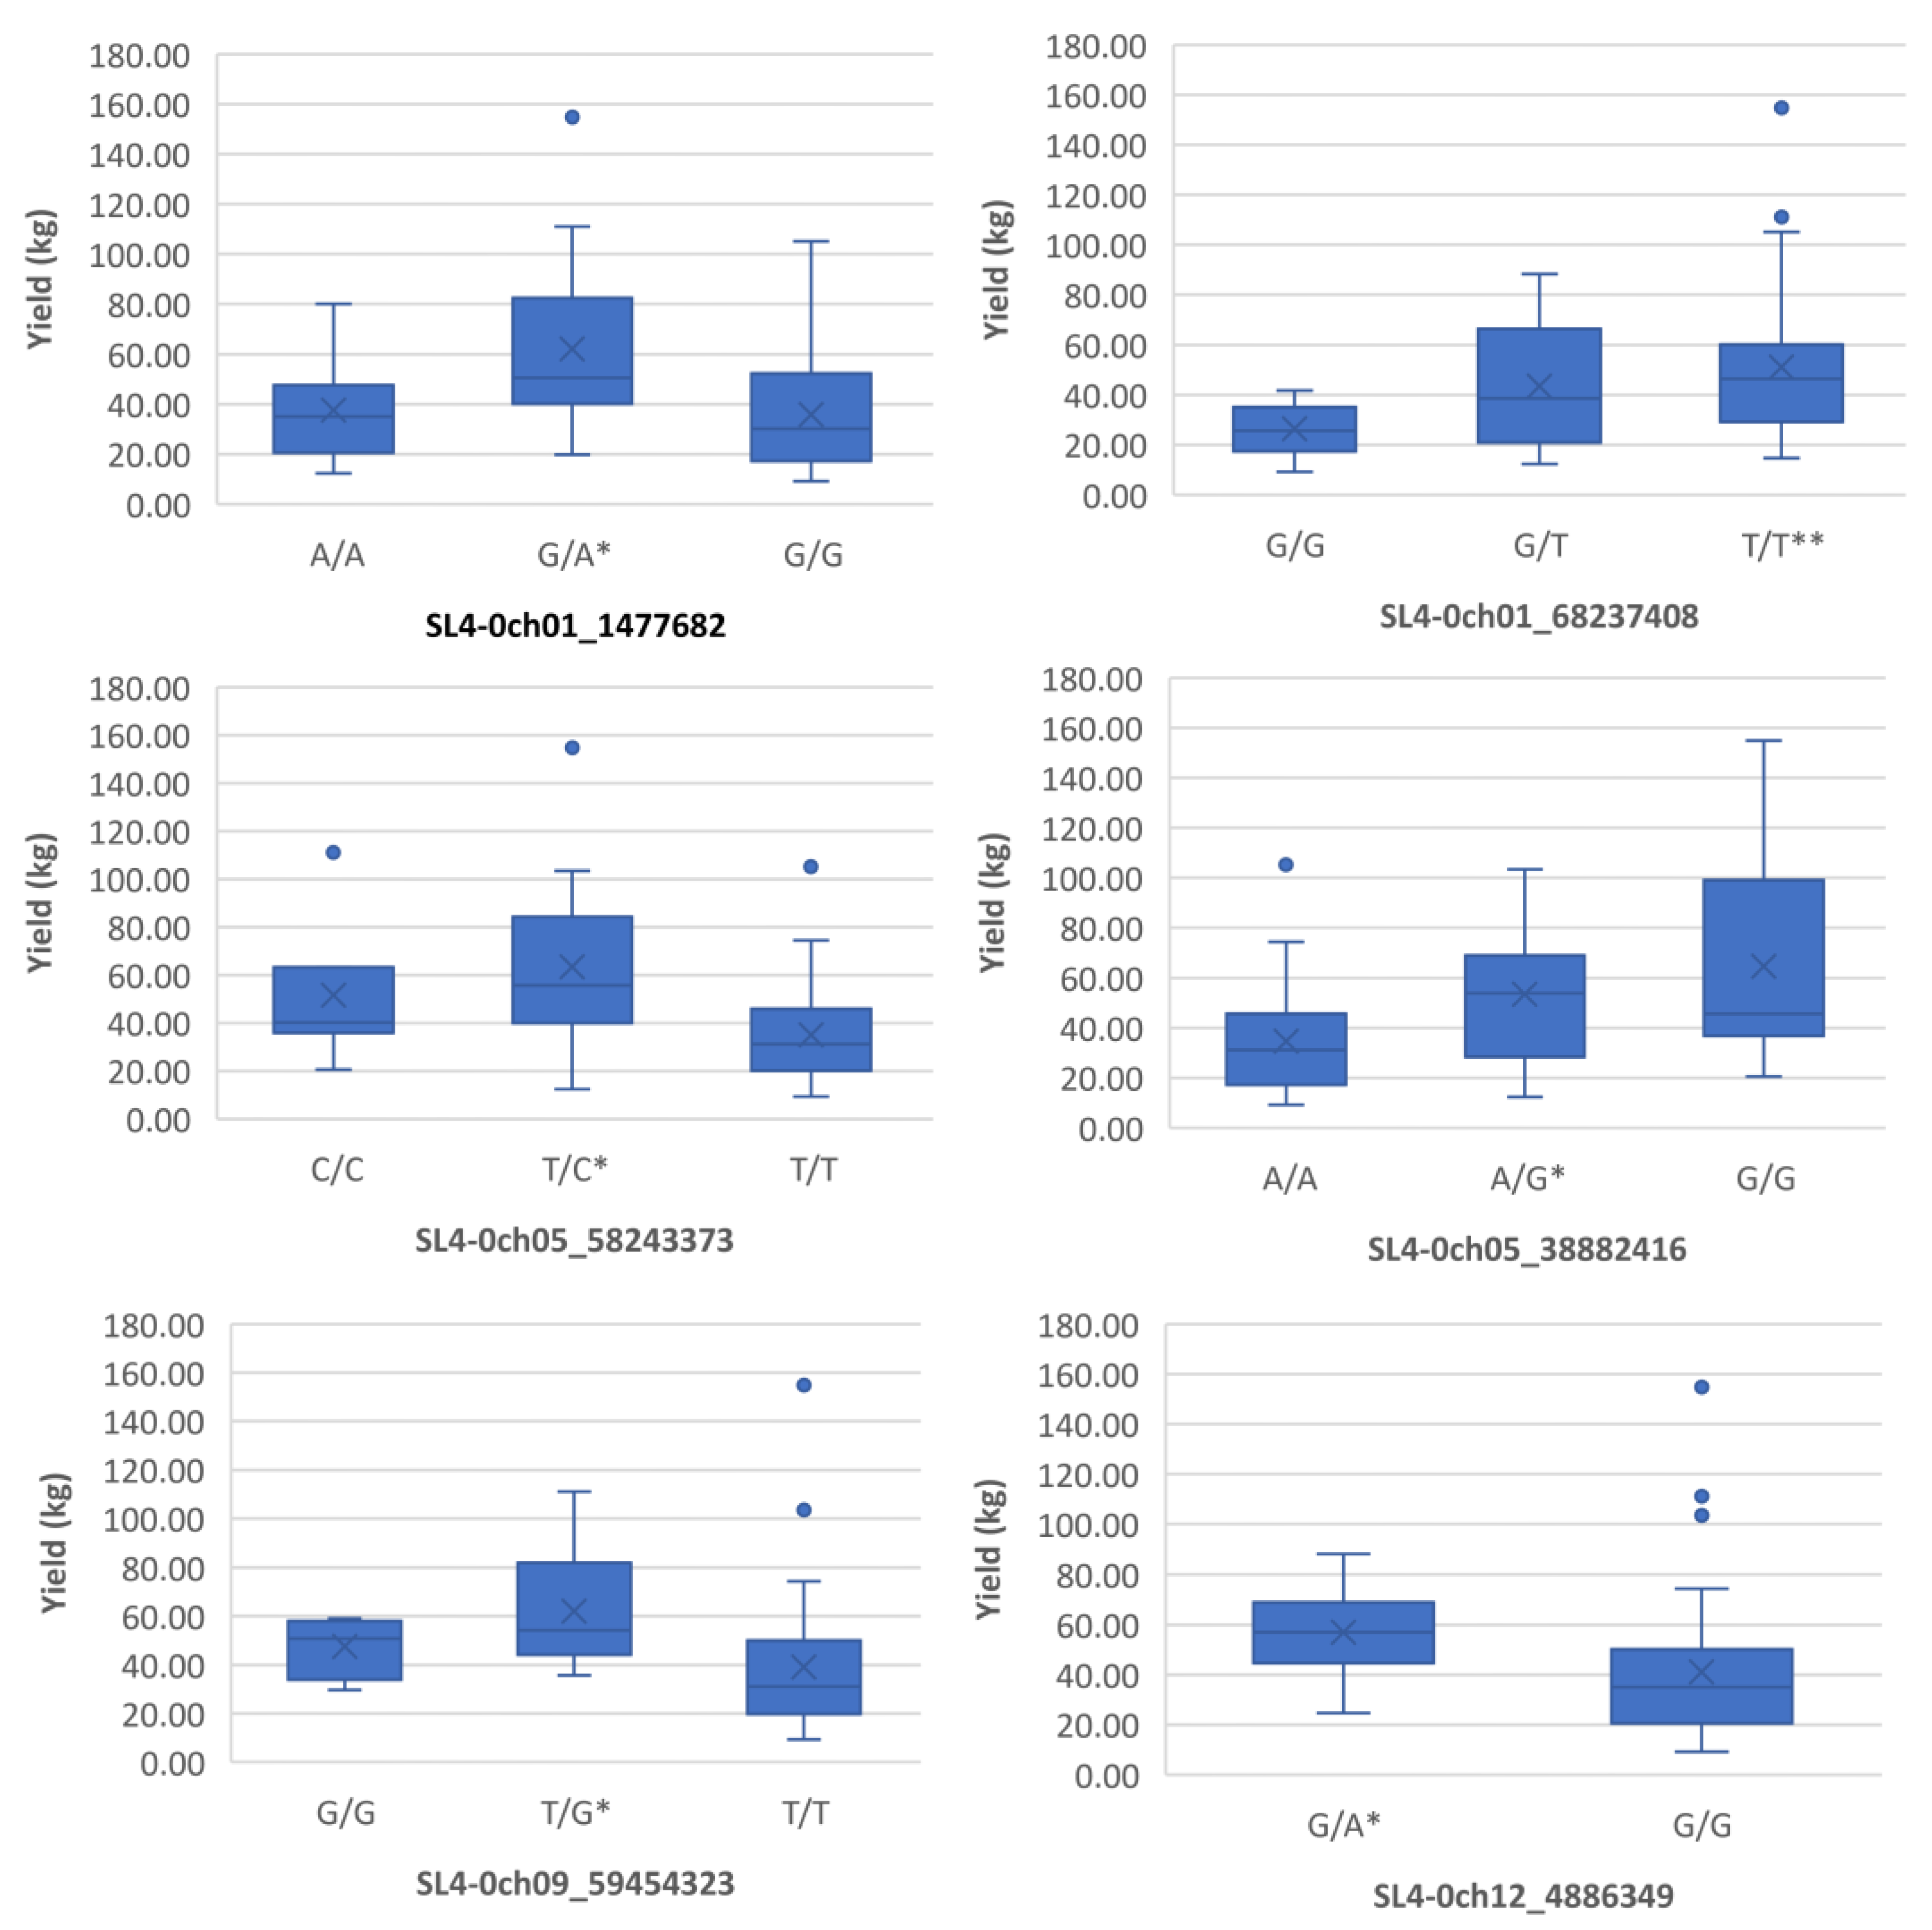
Boxplots showing markers on chromosome 1, 5, 9 and 12 associated with yield under heat stress. The mean is represented by the x sign, while the median is represented by the horizontal line that divide the box. The lower and upper box boundaries represent 25th percentile and 75th percentile, respectively. ** and * indicate statistical significance p<0.01 and p<0.05, respectively.
Figure 3.
Boxplots showing markers on chromosome 8 and 12 associated with fruit_set under heat stress. The mean is represented by the x sign, while the median is represented by the horizontal line that divide the box. The lower and upper box boundaries represent 25th percentile and 75th percentile, respectively. ** and * indicate statistical significance p<0.01 and p<0.05, respectively.
Figure 4.
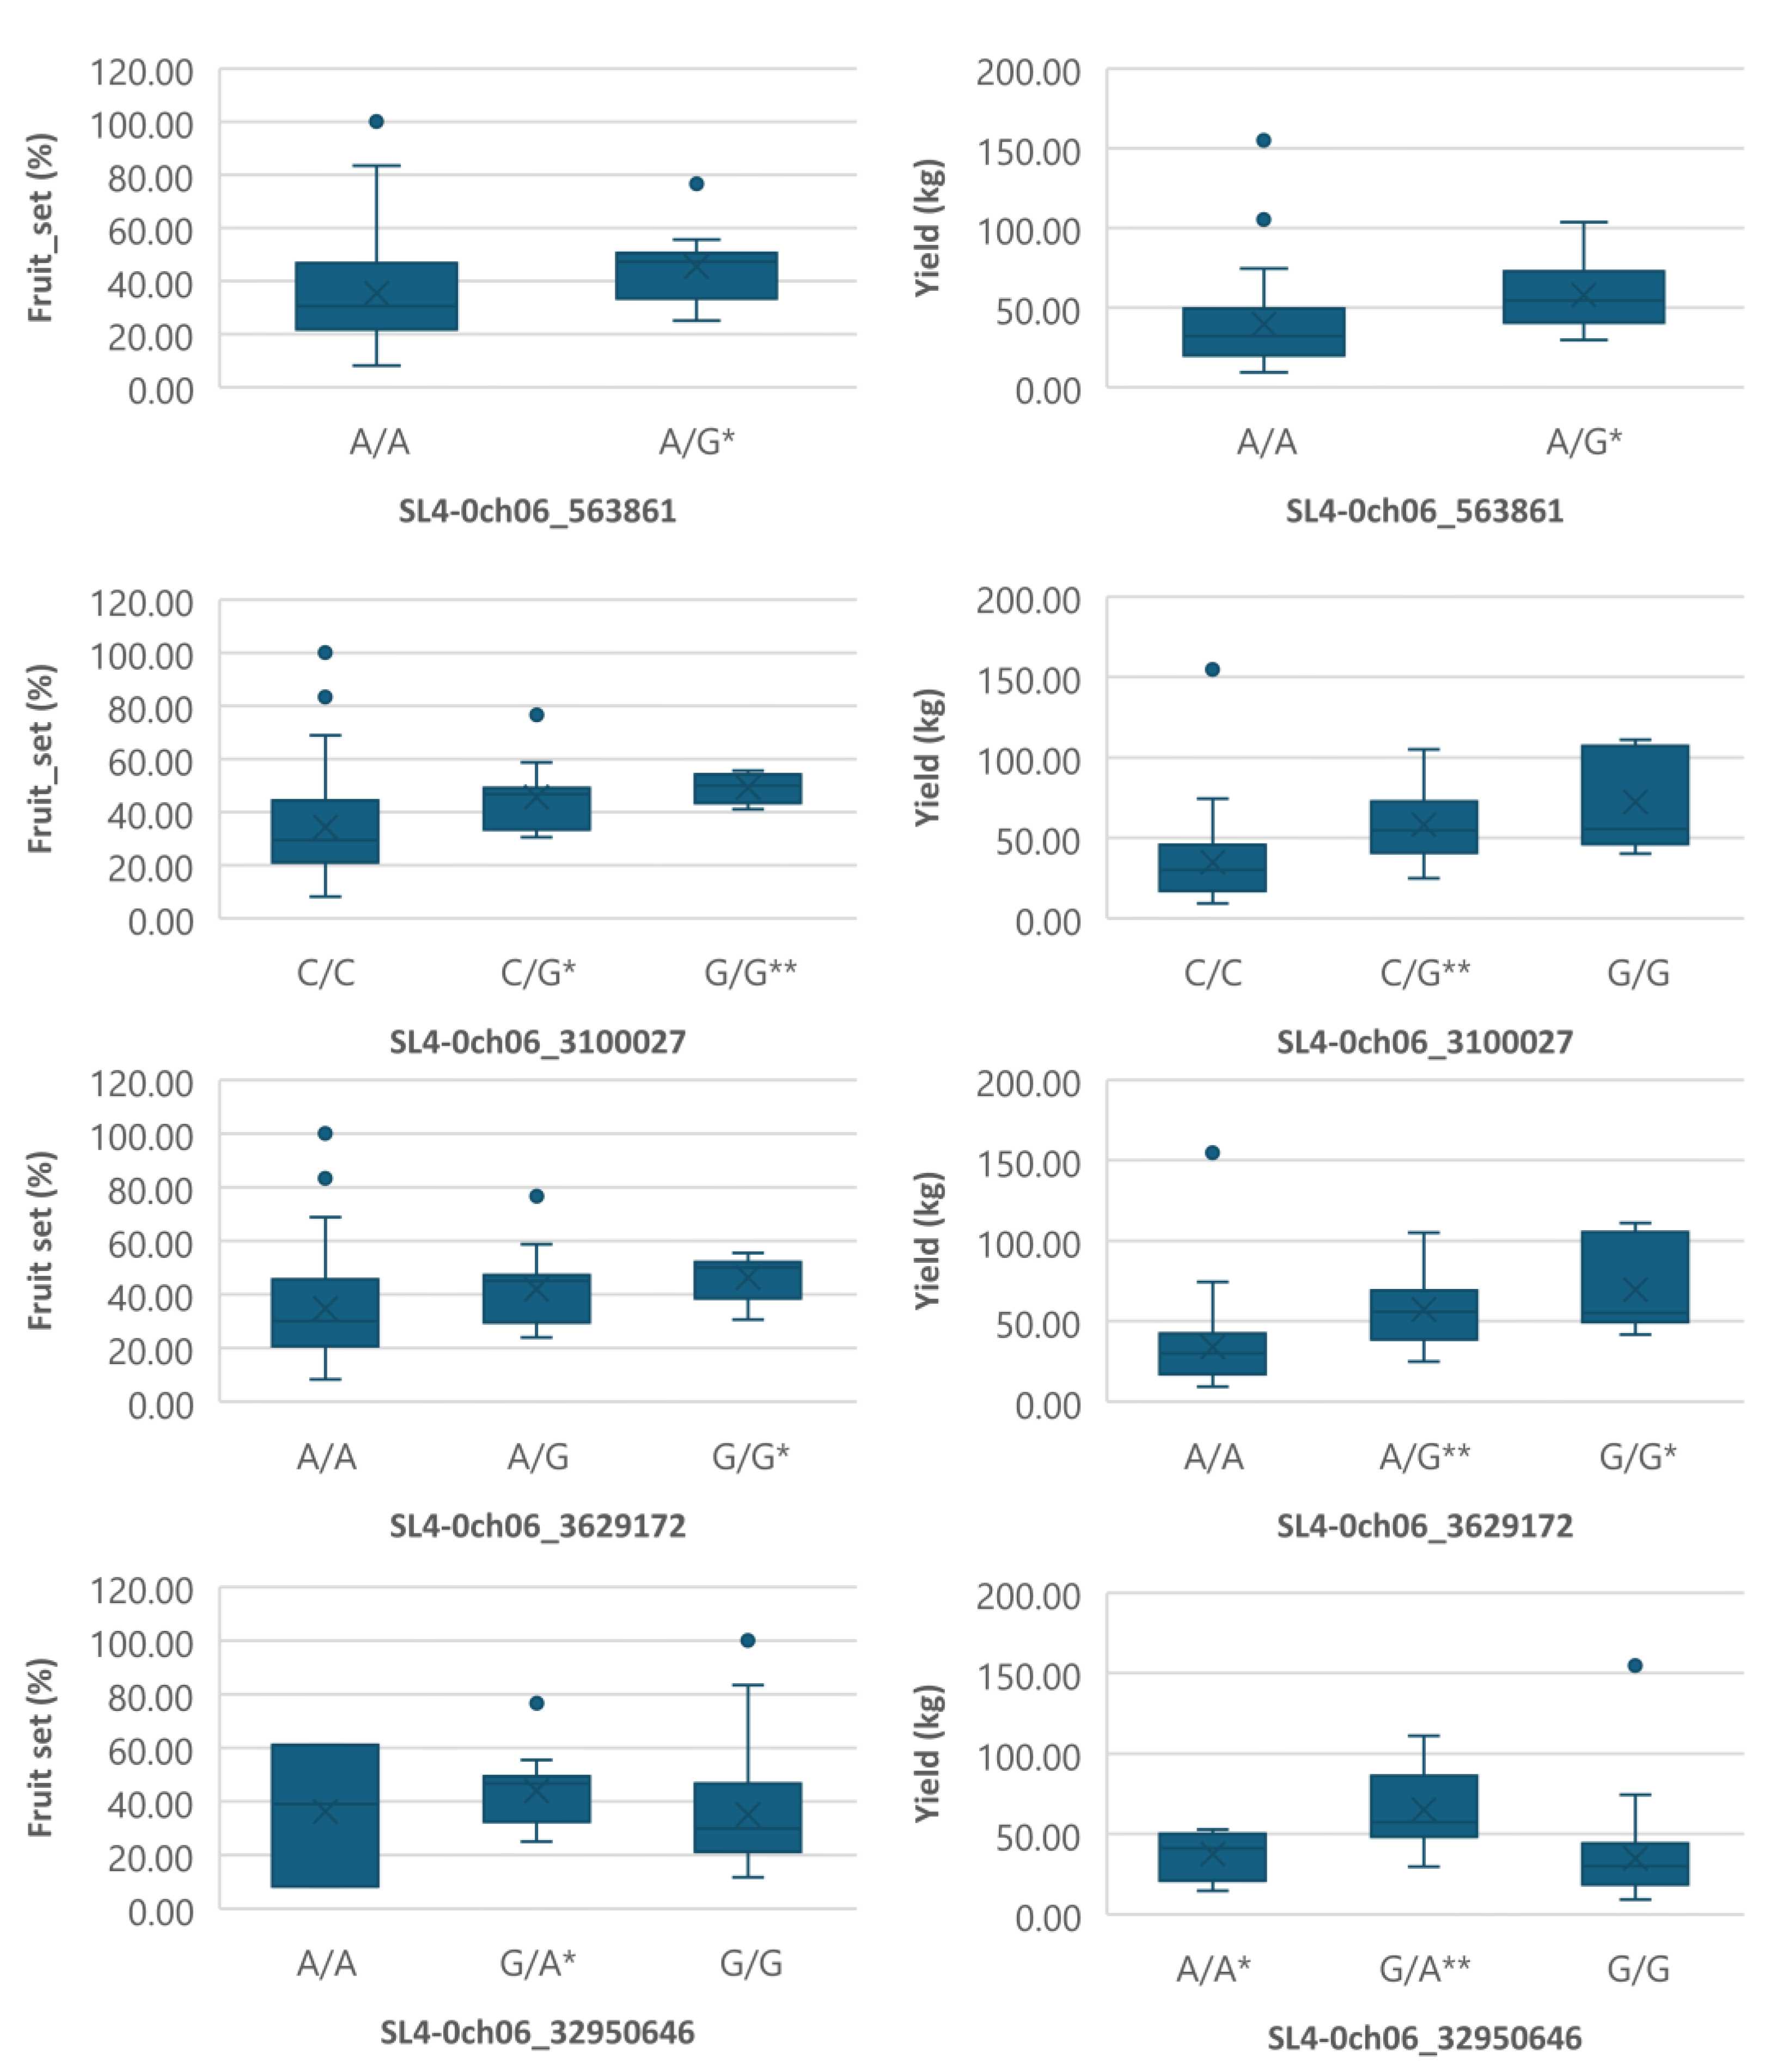
Boxplots showing markers on chromosome 6 associated with both fruit_set and yield under heat stress. The mean is represented by the x sign, while the median is represented by the horizontal line that divide the box. The lower and upper box boundaries represent 25th percentile and 75th percentile, respectively. ** and * indicate statistical significance p<0.01 and p<0.05, respectively.
Figure 5.
Boxplots showing markers on chromosome 6 associated with yield under heat stress. The mean is represented by the x sign, while the median is represented by the horizontal line that divide the box. The lower and upper box boundaries represent 25th percentile and 75th percentile, respectively. ** and * indicate statistical significance p<0.01 and p<0.05, respectively.
Figure 6.
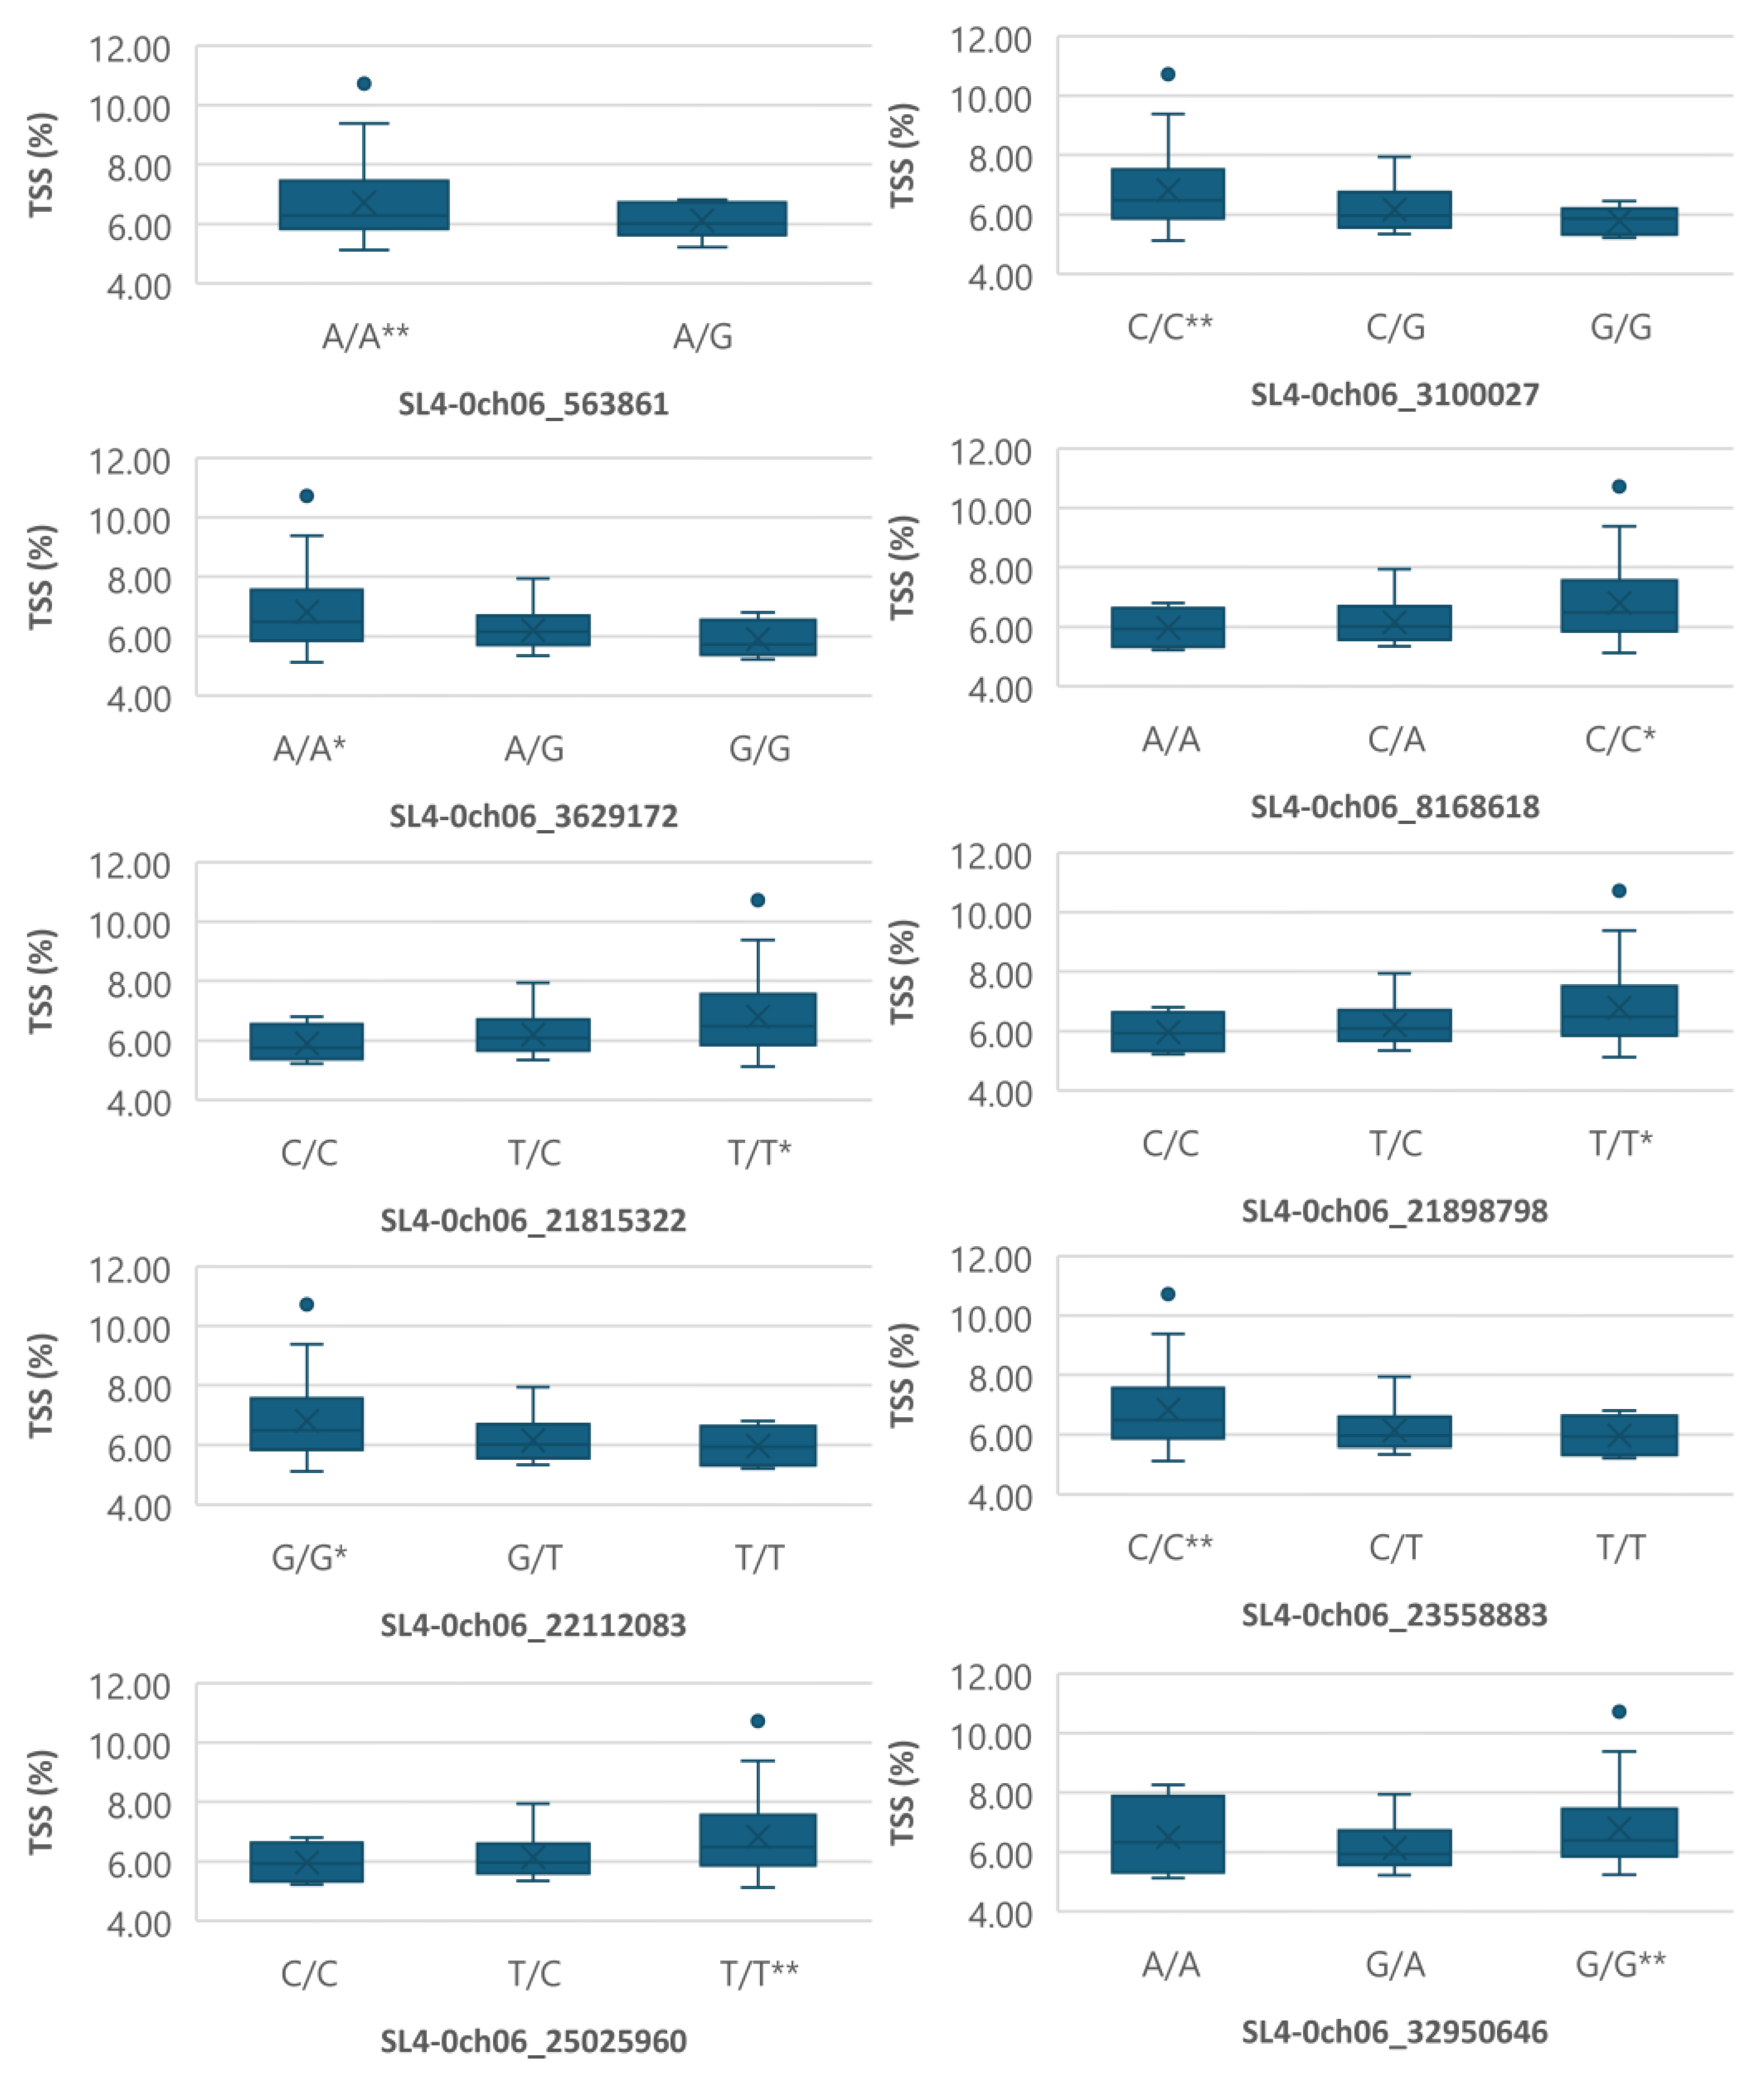
Boxplots showing markers on chromosome 6 associated with TSS. The mean is represented by the x sign, while the median is represented by the horizontal line that divide the box. The lower and upper box boundaries represent 25th percentile and 75th percentile, respectively. ** and * indicate statistical significance p<0.01 and p<0.05, respectively.
Figure 7.
Boxplots showing markers on chromosome 9 associated with TSS. The mean is represented by the x sign, while the median is represented by the horizontal line that divide the box. The lower and upper box boundaries represent 25th percentile and 75th percentile, respectively. ** and * indicate statistical significance p<0.01 and p<0.05, respectively.
Figure 8.
comparison of QTL markers identified in this study (red) with QTL identified in Gonzalo et al. (2020, blue) and Bineau et al. (2021, green). Red rectangle shows the makers of interest are aligned in the same chromosome position of other QTL. Yellow rectangle shows the markers of interest are located within 4 Mbp of other QTL. Black rectangle shows clusters of markers identified in this study significantly associated with fruit_set, yield, and TSS under heat stress. (a) Chromosome 1 and 2; (b) Chromosome 3, 4, and 5; (c) Chromosome 6, 7, and 8; (d) Chromosome 9, 10, 11, and 12.
Table 1.
Tomato varieties selected from year 1 testing for evaluation in years 2 and 3.
Table 1.
Tomato varieties selected from year 1 testing for evaluation in years 2 and 3.
| ID |
Company code |
Variety name |
|
ID |
Company code |
Variety name |
| 1 |
TF-0014 |
Amish Gold |
|
36 |
TF-0141 |
Ding Wall Scotty |
| 2 |
TF-0017S |
Amy's Apricot |
|
37 |
TF-0147 |
Double Rich |
| 3 |
TF-0018 |
Amy's Sugar Gem |
|
38 |
TF-0176 |
Florida Pink |
| 4 |
TF-0027 |
Arkansas Marvel |
|
39 |
Pakistan |
Salar F1 |
| 5 |
TF-0032 |
Aunt Lucy's Italian Paste |
|
40 |
Pakistan |
Surkhail F1 |
| 6 |
TF-0268 |
Japanese Oxheart |
|
41 |
Pakistan |
Sundar F1 |
| 7 |
TF-0367 |
Ozark Pink |
|
42 |
Pakistan |
Saandal F1 |
| 8 |
TF-0449 |
Shenghaung Cherry |
|
43 |
Pakistan |
Tomato seed -2198 |
| 9 |
TF-0450 |
Shirley Amish Red |
|
44 |
Pakistan |
Tomato seed -2199 |
| 10 |
TF-0173 |
Fence Row Cherry |
|
45 |
Pakistan |
Tomato seed -2217 |
| 11 |
TF-0187 |
German Johnson |
|
46 |
Pakistan |
Tomato seed -2218 |
| 12 |
TF-0197 |
Giant Syrian |
|
47 |
Pakistan |
Tomato seed -2230 |
| 13 |
TF-0213F |
Goose Creek |
|
48 |
AVRDC |
AVTO90304 |
| 14 |
TF-0227 |
Gregori's Altai |
|
49 |
AVRDC |
AVTO9801 |
| 15 |
TF-0227G |
Grightmire's Pride |
|
50 |
AVRDC |
AVTO1007 |
| 16 |
TF-0235 |
Hazel Mae |
|
51 |
AVRDC |
AVTO1010 |
| 17 |
TF-0561 |
Homer Fike's Yellow Oxheart |
|
52 |
AVRDC |
AVTO9001 |
| 18 |
TF-0035A |
Austin's Red Pear |
|
53 |
DRW7806 |
hybrid tomato |
| 19 |
TF-0036 |
Australia |
|
54 |
Bright Star F1 |
Bright Star F1 |
| 20 |
TF-0070A |
Bloody Butcher |
|
55 |
Roenza |
Roenza |
| 21 |
TF-0077M |
Brandy Sweet Plum |
|
56 |
619 |
619 |
| 22 |
TF-0078 |
Brandywine |
|
57 |
SV7846TH |
SV7846TH |
| 23 |
TF-0106 |
Chadwick Cherry |
|
58 |
syngenta |
Tomato: 413485 |
| 24 |
TF-0109 |
Chapman |
|
59 |
syngenta |
Jarawa Ind tomato |
| 25 |
TF-0129 |
Creole |
|
60 |
syngenta |
Tomato -Beef Vikllio |
| 26 |
TF-0135 |
Dad's Sunset |
|
61 |
syngenta |
Pilavy Ind tomato |
| 27 |
TF-0137 |
Debarao |
|
62 |
syngenta |
T415271 Ind tomato |
| 28 |
TF-0142 |
Dinner Plate |
|
63 |
syngenta |
Tomato Dafnis |
| 29 |
TF-0146 |
Dona |
|
64 |
syngenta |
Tomato Commondo |
| 30 |
TF-0149 |
Dr. Lyle |
|
65 |
syngenta |
Tomato Izmono |
| 31 |
TF-0150 |
Dr. Neal |
|
66 |
TF-0004 |
Ace 55 |
| 32 |
TF-0167 |
Ethiopia Roi Humbert |
|
67 |
TF-0021 |
Anahu |
| 33 |
TF-0024 |
Angora Super Sweet |
|
68 |
TF-0330 |
Mrs. Houseworth |
| 34 |
TF-0093 |
Bulgarian Triumph |
|
69 |
TF-0404J |
Punta Banda |
| 35 |
TF-0121 |
Clint Eastwood's Rowdy Red |
|
70 |
TF-0486 |
Sweet Organic tomato |
| |
|
|
|
71 |
Banana Legs |
Banana Legs |
Table 2.
The probability values of Wald statistics for different tomato types for various traits assessed on 71 tomato varieties.
Table 2.
The probability values of Wald statistics for different tomato types for various traits assessed on 71 tomato varieties.
| |
Frt_Width (cm) |
Frt_Length (cm) |
TSS (%) |
Flowers /inflo |
Fruit_set (%) |
yield (kg) |
yield* (kg) |
| Tomato_type |
<0.001 |
<0.001 |
0.058 |
<0.001 |
0.237 |
0.002 |
0.056 |
| *yield excluding Beefsteak. |
|
|
|
|
|
|
Table 3.
The probability values of Wald statistics from the 2 year analysis of 10 varieties.
Table 3.
The probability values of Wald statistics from the 2 year analysis of 10 varieties.
| |
Frt_Width (cm) |
Frt_Length (cm) |
Hardness (lb/cm2) |
TSS (%) |
Locule_ number |
Flowrs /inflo |
Fruits /inflo |
Fruit_set (%) |
yield (kg) |
| Year |
0.005 |
0.043 |
<0.001 |
<0.001 |
0.01 |
0.466 |
<0.001 |
<0.001 |
0.005 |
| Genotype |
<0.001 |
<0.001 |
<0.001 |
<0.001 |
<0.001 |
<0.001 |
<0.001 |
0.001 |
<0.001 |
| Year x Genotype |
0.029 |
<0.001 |
<0.001 |
<0.001 |
0.354 |
0.016 |
0.013 |
0.132 |
<0.001 |
Table 4.
The probability values of Wald statistics from the 2 year analysis of Globe only and Plum only.
Table 4.
The probability values of Wald statistics from the 2 year analysis of Globe only and Plum only.
| |
Globe |
Plum |
| |
Frt_Width (cm) |
Frt_Length (cm) |
Locule_ number |
yield (kg) |
Frt_Width (cm) |
Frt_Length (cm) |
Locule_ number |
yield (kg) |
| Year |
0.066 |
0.008 |
0.154 |
0.467 |
0.027 |
0.026 |
0.015 |
0.001 |
| Genotype |
<0.001 |
<0.001 |
<0.001 |
<0.001 |
<0.001 |
0.369 |
0.215 |
0.316 |
| Year x Genotype |
0.031 |
0.433 |
0.49 |
<0.001 |
0.116 |
0.252 |
0.32 |
0.015 |
Table 5.
List of favorable alleles of SNP markers for yield, fruit_set, and TSS.
Table 5.
List of favorable alleles of SNP markers for yield, fruit_set, and TSS.
| Marker |
Traits |
Favorable alleles |
| SL4-0ch01_1477682 |
Yield |
GA* > GG, AA |
| SL4-0ch01_68237408 |
Yield |
TT**, GT > GG |
| SL4-0ch05_38882416 |
Yield |
GA*, GG > AA |
| SL4-0ch05_58243373 |
Yield |
CT*, CC > TT |
| SL4-0ch06_563861 |
Fruit set |
GA* > AA |
| SL4-0ch06_563861 |
Yield |
GA* > AA |
| SL4-0ch06_563861 |
TSS |
AA** > GA |
| SL4-0ch06_3100027 |
Fruit set |
GG**, GC* > CC |
| SL4-0ch06_3100027 |
Yield |
GC**, GG > CC |
| SL4-0ch06_3100027 |
TSS |
CC** > GC, GG |
| SL4-0ch06_3629172 |
Fruit set |
GG*, GA > AA |
| SL4-0ch06_3629172 |
Yield |
GA**, GG* > AA |
| SL4-0ch06_3629172 |
TSS |
AA* > GA, GG |
| SL4-0ch06_8168618 |
Yield |
CA**, AA* > CC |
| SL4-0ch06_8168618 |
TSS |
CC* > CA, AA |
| SL4-0ch06_21815322 |
Yield |
CC**, CT* > TT |
| SL4-0ch06_21815322 |
TSS |
TT* > CT, CC |
| SL4-0ch06_21898798 |
Yield |
CT**, CC* > TT |
| SL4-0ch06_21898798 |
TSS |
TT* > CT, CC |
| SL4-0ch06_22112083 |
Yield |
GT**, TT* > GG |
| SL4-0ch06_22112083 |
TSS |
GG* > GT, TT |
| SL4-0ch06_23558883 |
Yield |
CT**, TT* > CC |
| SL4-0ch06_23558883 |
TSS |
CC** > CT, TT |
| SL4-0ch06_25025960 |
Yield |
CT**, CC* > TT |
| SL4-0ch06_25025960 |
TSS |
TT** > CT, CC |
| SL4-0ch06_32950646 |
Fruit set |
GA* > GG, (AA) |
| SL4-0ch06_32950646 |
Yield |
GA** > AA* > GG |
| SL4-0ch06_32950646 |
TSS |
GG** > GA, (AA) |
| SL4-0ch08_61071507 |
Fruit set |
AT*, TT > AA |
| SL4-0ch09_6794487 |
TSS |
GG**, GA* > AA |
| SL4-0ch09_59454323 |
Yield |
GT*, (GG) > TT |
| SL4-0ch09_59454323 |
TSS |
TT*, (GG) > GT |
| SL4-0ch12_4886349 |
Yield |
GA* > GG |
| SL4-0ch12_15246947 |
Fruit set |
CT**, TT** > CC |
Table 6.
The fifteen varieties selected for high yield based on genotype (favourable alleles > 15 out of total 19 markers).
Table 6.
The fifteen varieties selected for high yield based on genotype (favourable alleles > 15 out of total 19 markers).
| ID |
Company code |
Variety name |
Favorable allele % |
| 43 |
Pakistan |
Tomato seed -2198 |
89.5 |
| 44 |
Pakistan |
Tomato seed -2199 |
100 |
| 45 |
Pakistan |
Tomato seed -2217 |
78.9 |
| 46 |
Pakistan |
Tomato seed -2218 |
89.5 |
| 53 |
DRW7806 |
hybrid tomato |
100 |
| 55 |
Roenza |
Roenza |
89.5 |
| 56 |
619 |
619 |
84.2 |
| 57 |
SV7846TH |
SV7846TH |
89.5 |
| 59 |
syngenta |
Jarawa Ind tomato |
94.7 |
| 60 |
syngenta |
Tomato -Beef Vikllio |
84.2 |
| 61 |
syngenta |
Pilavy Ind tomato |
100 |
| 62 |
syngenta |
T415271 Ind tomato |
84.2 |
| 63 |
syngenta |
Tomato Dafnis |
94.7 |
| 64 |
syngenta |
Tomato Commondo |
100 |
| 65 |
syngenta |
Tomato Izmono |
89.5 |
Table 7.
Genotypes of heat tolerant lines selected by phenotyping based on yield and quality.
Table 7.
Genotypes of heat tolerant lines selected by phenotyping based on yield and quality.
| |
#43 |
#44 |
#45 |
#47 |
#58 |
| SL4-0ch01_1477682 |
GA |
GA |
GA |
AA |
GG |
| SL4-0ch01_68237408 |
TT |
TT |
TT |
TT |
TT |
| SL4-0ch05_38882416 |
GG |
GG |
GG |
GA |
GA |
| SL4-0ch05_58243373 |
CC |
C/C |
C/C |
T/T |
CT |
| SL4-0ch06_563861 |
GA |
GA |
AA |
AA |
AA |
| SL4-0ch06_3100027 |
GC |
GC |
GC |
GC |
GG |
| SL4-0ch06_3629172 |
GA |
GA |
GA |
GA |
GG |
| SL4-0ch06_8168618 |
CA |
CA |
CA |
CC |
AA |
| SL4-0ch06_21815322 |
CT |
CT |
CT |
TT |
CC |
| SL4-0ch06_21898798 |
CT |
CT |
CT |
TT |
CC |
| SL4-0ch06_22112083 |
GT |
GT |
GT |
GG |
TT |
| SL4-0ch06_23558883 |
CT |
CT |
CT |
CC |
TT |
| SL4-0ch06_25025960 |
CT |
CT |
CT |
T/T |
CC |
| SL4-0ch06_32950646 |
GA |
GA |
GA |
GG |
GA |
| SL4-0ch08_61071507 |
AA |
AT |
AA |
AT |
AT |
| SL4-0ch09_6794487 |
GA |
GG |
AA |
GA |
AA |
| SL4-0ch09_59454323 |
TT |
GT |
TT |
TT |
TT |
| SL4-0ch12_4886349 |
GA |
GA |
GA |
GA |
GG |
| SL4-0ch12_15246947 |
TT |
TT |
TT |
CT |
TT |
| Allele for yield/total markers |
89.5% |
100% |
78.9% |
42.1% |
73.7% |
Table 8.
Locations of markers in gene body.
Table 8.
Locations of markers in gene body.
| Marker |
Genes SNP located |
SNP position |
gene function |
| SL4-0ch01_1477682 |
Solyc01g006890 |
coding |
EEIG1/EHBP1 N-terminal domain (C2 domain superfamily) |
| SL4-0ch01_68237408 |
Solyc01g067100 |
coding |
Cullin |
| SL4-0ch05_38882416 |
Solyc05g025955 |
intron |
ABC transporter B family member 11 |
| SL4-0ch05_58243373 |
Solyc05g047450 |
intron |
Methyl-CpG-binding domain-containing protein 2 |
| SL4-0ch06_563861 |
Solyc06g005520 |
coding |
Protein kinase superfamily |
| SL4-0ch06_3100027 |
Solyc06g009160 |
3’ UTR |
Glyoxysomal fatty acid β-oxidation multifunctional protein MFP-a |
| SL4-0ch06_3629172 |
Solyc06g009680 |
coding |
BRCT domain-containing protein |
| SL4-0ch06_8168618 |
Solyc06g011570 |
coding |
Haloacid dehalogenase-like hydrolase family protein |
| SL4-0ch06_21815322 |
Solyc06g034330 |
3’ UTR |
unknown |
| SL4-0ch06_21898798 |
intergenic region |
|
|
| SL4-0ch06_22112083 |
Solyc06g035450 |
5’ UTR |
DEAD-box ATP-dependent RNA helicase |
| SL4-0ch06_23558883 |
Solyc06g036240 |
3’ UTR |
Pleiotropic drug resistance protein |
| SL4-0ch06_25025960 |
Solyc06g036690 |
intron |
unknown |
| SL4-0ch06_32950646 |
Solyc06g051630 |
intron |
Phosphoinositide phospholipase C |
| SL4-0ch08_61071507 |
Solyc08g079440 |
coding |
UDP-glucuronate 4-epimerase 4 |
| SL4-0ch09_6794487 |
Solyc09g014720 |
coding |
Protein kinase domain |
| SL4-0ch09_59454323 |
Solyc09g065300 |
coding |
spindle pole body-associated protein |
| SL4-0ch12_4886349 |
Solyc12g014010 |
coding |
Glycosyltransferase |
| SL4-0ch12_15246947 |
Solyc12g021280 |
downstream |
Serine/threonine-protein kinase STN7, chloroplastic |
