Preprint
Article

Variation in the Health Status of the Mediterranean Gorgonian Forests: The Synergistic Effect of Marine Heat Waves and Fishing Activity

Altmetrics

Downloads

91

Views

35

Comments

0

A peer-reviewed article of this preprint also exists.

Submitted:

20 June 2024

Posted:

20 June 2024

You are already at the latest version

Alerts
Abstract
Over the past thirty years, the red gorgonian Paramuricea clavata in the Mediterranean Sea has faced increasing threats, including heat waves and human activities such as fishing and diving. Epibiosis on damaged gorgonian colonies is generally used as an indirect indication of stressed conditions. The density and height of P. clavata and the percentage of colonies affected by epibiosis and entangled in lost fishing gear were studied to investigate the phenomenon and its trend over time in the Ligurian Sea. Analyses were based on transects collected during ROV campaigns between 2015 and 2022 at depths of 33-90 meters. A strong correlation was observed between fishing effort in the study area and the level of epibiosis. Maximal percentages of colonies affected by epibiosis and entanglement were recorded at depths of 50-70 meters. Temporally, marine heat waves before 2019 were identified as the primary cause of damage to P. clavata. The decrease in epibiosis percentages after 2019, despite the 2022 heat wave, may be due to a quick recovery ability of the populations and a reduction in fishing activities during the COVID-19 lockdown in 2020. Long-term monitoring programs are essential to understand the changes in marine benthic communities exposed to different stressors.
Keywords: 
Subject: Biology and Life Sciences  -   Animal Science, Veterinary Science and Zoology

1. Introduction

The red gorgonian Paramuricea clavata (Risso, 1827) (Cnidaria: Anthozoa) is among the main habitat-forming species in the Mediterranean circalittoral zone, and its aggregations are known to heavily influence the diversity and structure of the associated assemblage [1,2,3]. P. clavata forests constitute noteworthy seascapes attracting broad fluxes of SCUBA diving tourism, thus resulting in an important economic resource [4,5]. Moreover, they host significant populations of commercial fish such as the common dentex Dentex dentex (Linnaeus, 1758) and the dusky grouper Epinephelus marginatus (Lowe, 1834), typical targets of artisanal fishing [6].
P. clavata forests can be impacted by different kinds of pressures, mainly related to global warming and anthropogenic activities; therefore, the species is considered “vulnerable” according to the Red List of the International Union for Conservation of Nature (IUCN), and the reduction of some Mediterranean populations has been assessed in the last three decades [7]. The first pressure is related to the recent increase of positive thermal anomalies causing cascade effects such as the development of pathogenic bacteria and blooms of filamentous algae and mucilage. In turn, these phenomena affect the gorgonians with extensive diseases that favour the settling of invertebrate epibionts on the damaged colonies [8,9,10,11,12,13,14,15,16]. Marine Heat Waves (MHWs) also result in Mass Mortality Events (MMEs) that have been well-described for many organisms of the coralligenous assemblage [11,17,18,19,20,21,22,23], but mainly hit the red gorgonians [24,25,26,27].
In addition to climate-related impacts, it is well known that also boat anchoring and demersal recreational and artisanal fishing activities threaten P. clavata due to its large size, branched shape, and skeleton limited flexibility that favour the entanglement of fishing gear [20,28,29]. Bavestrello et al. [28] described the abrasive action by lost lines in contact with the gorgonian coenenchyme, producing suitable conditions for the settlement of several epibiotic organisms that ultimately cause the total or partial breaking of the colony under the current flow. In this regard, several authors employed the percentage of epibionted colonies as a biological index quantifying the fishing-induced stress of a gorgonian population [24,30,31,32,33,34]. Variable levels of epibiosis, hence the health status of the populations, have been reported in different Mediterranean sites. A study conducted in the Medes Islands (Catalan Sea) indicated that 10–33% of the colonies settled in unprotected areas were partially colonised by epibionts, whereas only 4–10% of the populations inside the borders of the Marine Protected Area (MPA) were involved in the phenomenon [35]. Along the eastern Adriatic coasts, in an area characterised by low fishing pressure, the colonies with denuded or epibionted branches were less than 10% [36]. On the contrary, inside the Portofino MPA (Ligurian Sea) and in the Tavolara - Punta Coda Cavallo MPA (Tyrrhenian Sea) colonies with epibiosis exceeded 50% of the total, suggesting a high fishing impact [6,37,38].
Monitoring programs on a broad spatial and temporal scale dedicated to the evaluation of the health status of gorgonian forests are lacking, and the recovery ability of populations after mass mortality episodes was followed only for a few years [39,40,41,42]. The Marine Strategy Framework Directive (MSFD 2008/56/EC) represents the EU’s Integrated Maritime Policy tool to achieve the Good Environmental Status (GES) of marine waters, based on eleven qualitative descriptors. Within these, the descriptor “biodiversity” states that “The quality and occurrence of habitats and the distribution and abundance of species are in line with prevailing physiographic, geographic and climatic conditions (MSFD, 2008/56/EC, Annex I). Ecosystem components – groups of species and habitat types, such as the coralligenous – are recognised as indicators of environmental quality, becoming priority habitats target of study and monitoring activities”.
Thanks to the data obtained during the Marine Strategy project (2015–2022), the Ligurian Sea (NW Mediterranean Sea) is nowadays one of the best-known areas along Italian coasts [43]. During this project, 80 sites were explored (2015–2018) and then subjected to monitoring in the following years. The forests of P. clavata were widely distributed along the whole Ligurian arc, occurring on sloping outcroppings and coralligenous rocks up to 89 m. The forests dominated by this species represented over 13% of the sampling units considered in the study and were characterised by an average density of 7.4 ± 3.0 colonies m−2 with maximum values reaching 19 colonies m−2. This gorgonian also consistently occurred in other communities, such as that dominated by Corallium rubrum (Linnaeus, 1758) [43].
Thanks to the large ROV footage collected during the Ligurian Marine Strategy surveys, this paper aims to give a comprehensive view of the level of epibiosis affecting the P. clavata forests along the whole Ligurian coastline and describe a pluriannual trajectory of their health status evolution.

2. Materials and Methods

2.1. Study Area
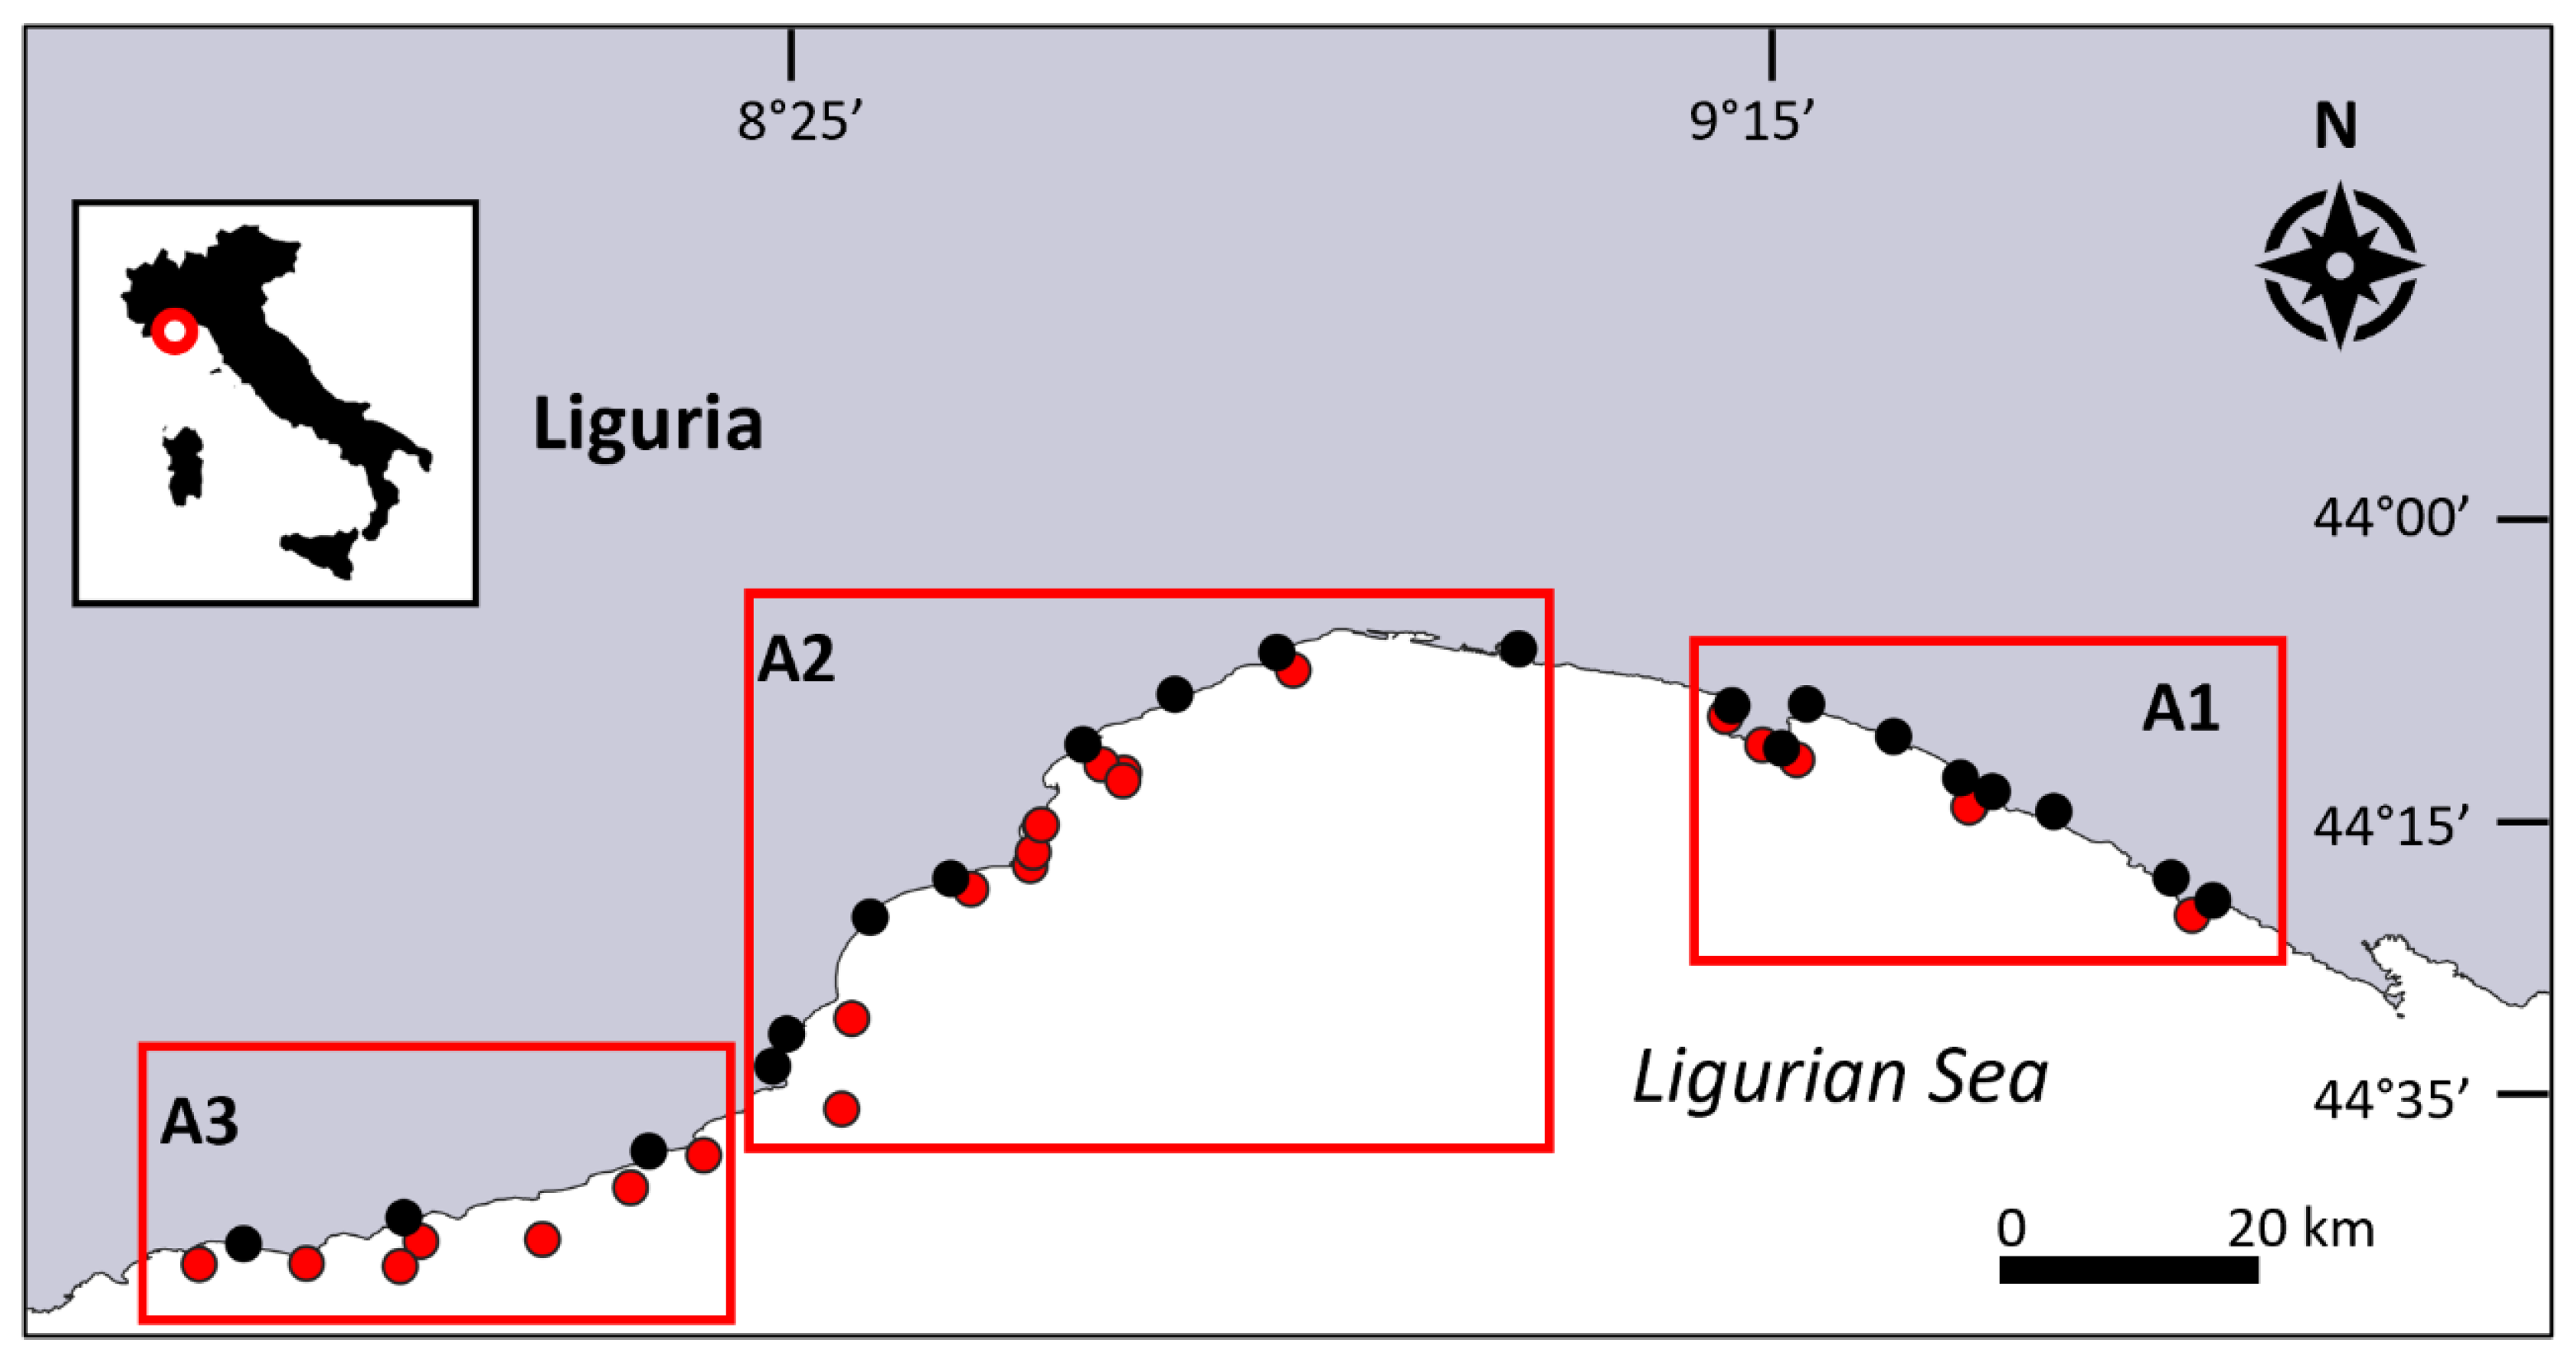
The Ligurian coast extends for over 350 km, from La Spezia in the East to Ventimiglia in the West, in the North-western sector of the Mediterranean Sea (Figure 1). The coast is densely populated with cities and large commercial harbours [44].
In this study, the Ligurian coast was divided into three macro-areas: East (A1), from Mesco Cape to Isuela Shoal (Portofino Promontory); Centre (A2), from Arenzano to Finale Ligure; West (A3), from Albenga to Mortola Cape (Ventimiglia) (Figure 1; Table 1).
Data coming from the European fleet register (https://webgate.ec.europa.eu) were used to obtain the number of fishing harbours and boats targeting on demersal fishing insisting on each identified macro-area.
Figure 1. The Ligurian coast, with the localisation of the studied transects hosting the Paramuricea clavata forests (red dots), grouped into the three macro-areas. The black dots represent the fishing harbours.
Preprints 109884 g001
Table 1. The repeated explored sites with occurrence of Paramuricea clavata forests in the three macro-areas of the Ligurian coast.
Year Site Lat.
(N)
Long.
(E)
Transect
ID
Depth
(m)
N
colony
Density
(col m-2)
Epibiosis
%
Entanglement
%
Av. H ± SE
(cm)
Macroarea A1 2016 Mesco Cape 44.13108 9.63407 PMMN_S2_T2 47 64 1.3 9.4 7.8 28.8 ± 2.3
2019 66 0.5 15.9 4.5 20.3 ± 1.3
2022 66 0.8 9.1 3.0 23.6 ± 0.9
2015 Manara Cape W 44.243216 9.40207 SLMO_S3_T1 59 82 0.9 20.7 3.7 38.4 ± 2.2
2019 107 4.1 40.0 77.6 35.5 ± 1.7
2019 SLMO_S3_T3 41 198 2.0 73.0 21.2 30.2 ± 0.9
2022 284 3.6 56.0 1.1 28.0 ± 1.1
2015 SLMO_S3_T4 47 228 2.5 10.1 1.3 47.3 ± 2.2
2019 95 1.4 89.4 46.3 35.0 ± 1.1
2022 94 1.0 39.4 3.2 29.0 ± 1.7
2015 Manara Cape E 44.24516 9.40409 SLMO_S2_T1 55 119 1.6 16.0 0.8 34.3 ± 2.3
2019 212 2.6 76.0 22.2 35.3 ± 1.0
2015 SLMO_S2_T2 64 97 1.0 9.3 4.1 32.2 ± 2.2
2019 94 1.8 37.5 9.6 25.5 ± 1.1
2016 Portofino Cape 44.2923 9.22313 AMPP_S1_T3 60 174 6.7 6.3 1.1 31.7 ± 1.2
2019 115 1.2 58.8 9.6 32.7 ± 1.6
2022 50 0.6 10.0 - 28.2 ± 1.3
2016 Isuela Shoal 44.33713 9.14897 AMPP_S3_T2 33 838 10.6 24.6 2.7 24.2 ± 1.5
2019 833 8.3 36.0 1.6 29.2 ± 1.0
2022 649 6.6 8.8 - 30.8 ± 0.7
2016 AMPP_S3_T3 52 332 3.8 15.1 6.9 24.9 ± 1.5
2019 247 4.4 33.0 11.7 28.7 ± 1.5
2022 104 1.2 53.1 1.0 28.5 ± 0.9
Macro-area A2 2015 Arenzano-Varazze 44.38512 8.6996 NOAR_S1_T2 40 337 4.3 11.6 2.1 34.3 ± 1.3
2018 411 5.1 60.3 42.8 33.2 ± 1.2
2021 315 3.6 79.0 31.0 21.0 ± 0.9
2015 Vado Ligure 44.2603 8.46638 NOAR_S2_T1 48 277 3.4 12.3 9.0 34.6 ± 2.0
2018 207 4.0 28.5 50.7 31.1 ± 1.4
2015 NOAR_S2_T2 63 184 1.5 12.5 14.2 30.0 ± 2.0
2018 144 3.0 78.5 22.2 34.5 ± 1.2
2021 152 3.2 44.0 8.0 22.3 ± 1.0
2015 NOAR_S2_T3 56 72 0.9 5.6 4.2 13.4 ± 1.5
2018 81 1.5 66.7 76.5 25.3 ± 1.2
2016 Savona A 44.28739 8.50042 SVCL_S3_T2 45 291 3.5 3.8 22.0 29.8 ± 1.6
2019 158 3.9 51.0 21.5 28.7 ± 0.9
2022 314 4.5 7.6 9.2 25.0 ± 0.6
2016 Savona B 44.27878 8.52335 SVCL_S2_T3 58 309 3.3 6.1 37.5 25.6 ± 1.7
2019 125 2.6 76.7 72.0 35.3 ± 1.7
2022 482 12.4 38.0 19.9 25.1 ± 0.8
2015 Maledetti Shoal 44.22381 8.43657 NOAR_S4_T1 58 610 5.3 1.7 47.3 21.7 ± 1.0
2018 276 2.8 42.4 84.4 25.2 ± 1.0
2015 NOAR_S4_T2 68 69 4.2 8.8 29.8 17.8 ± 1.5
2018 179 2.3 7.8 97.2 27.8 ± 1.2
2021 89 2.1 28.2 12.8 12.5 ± 1.2
2018 NOAR_S4_T4 56 271 3.2 42.1 87.8 29.8 ± 1.4
2021 138 1.6 36.0 14.0 19.1 ± 0.7
2018 NOAR_S4_T5 62 382 3.8 20.7 79.8 26.3 ± 1.3
2021 352 4.2 30.0 58.0 21.5 ± 0.7
2018 NOAR_S4_T7 53 68 0.7 10.3 36.8 15.8 ± 0.8
2021 84 0.8 12.9 21.4 11.6 ± 0.5
2018 NOAR_S4_T8 59 640 6.6 10.8 60.0 15.8 ± 0.4
2021 421 4.2 53.0 25.0 12.5 ± 0.3
2017 Finale Ligure 44.15817 8.36462 BONO_S1_T2 83 163 2.0 4.9 12.3 24.2 ± 1.2
2020 112 5.9 34.3 18.8 33.2 ± 3.4
2017 BONO_S1_T3 77 405 5.1 3.6 35.3 32.9 ± 1.2
2020 453 5.3 12.0 5.7 65.7 ± 2.6
Macro-area A3 2017 Albenga 44.02396 8.24063 ALGA_S3_T2 58 54 0.7 11.8 38.2 30.1 ± 1.5
2020 72 1.2 70.8 1.4 35.4 ± 2.1
2015 Diano Marina 43.88217 8.08675 SSDM_S1_T2 51 175 2.4 6.3 18.9 33.2 ± 1.5
2018 119 2.0 55.5 68.9 39.4 ± 1.2
2021 115 1.3 28.4 10.8 20.6 ± 1.0
2018 Porto Maurizio 43.84858 8.01065 SSDM_S2_T3 36 76 1.2 1.3 - 37.8 ± 1.2
2021 156 3.1 21.0 11.0 21.5 ± 0.9
2017 Sanremo E 43.7929 7.79271 SRSST_S1_T2 69 265 3.3 18.1 46.2 27.7 ± 0.9
2020 335 6.6 4.0 25.1 37.4 ± 1.3
2017 SRSST_S1_T3 61 232 2.9 18.7 46.7 24.9 ± 1.2
2020 135 3.5 7.0 26.7 31.7 ± 1.6
2017 Sanremo W 43.76695 7.77113 BOSR_S3_T1 65 180 2.3 9.7 55.9 25.9 ± 1.1
2020 181 4.4 10.4 1.7 38.3 ± 2.1
2017 BOSR_S3_T2 49 54 0.7 9.7 55.9 32.9 ± 1.5
2020 77 0.9 33.3 15.6 50.5 ± 2.2
2016 Bordighera E 43.7699 7.67639 CMBO_S1_T1 49 155 1.9 4.5 5.8 19.5 ± 1.6
2018 218 4.0 11.5 13.3 45.0 ± 1.2
2021 556 8.4 7.0 3.4 21.7 ± 1.0
2016 CMBO_S1_T2 60 179 1.9 8.4 13.4 26.8 ± 2.1
2018 180 3.8 13.3 31.7 34.9 ± 1.6
2021 823 13.1 49.0 6.0 24.8 ± 0.9
2016 CMBO_S1_T3 66 400 5.0 2.8 11.3 22.5 ± 1.6
2018 517 8.6 7.4 44.7 25.9 ± 1.2
2021 407 5.1 0.0 0.0 13.6 ± 1.1
2016 Mortola Cape 43.76952 7.56353 CMBO_S3_T2 35 302 3.8 29.1 3.3 28.1 ± 2.1
2020 243 4.5 39.3 7.4 43.1 ± 1.9

2.2. ROV Footage Analysis

The surveys were carried out following the indications reported on the Marine Strategy Framework Directive (MSFD) methodological sheet created in 2016 by the Ministero dell’Ambiente e della Tutela del Territorio e del Mare (MATTM) in collaboration with ISPRA and ARPA, relating to coralligenous habitats (Module 7, Rocky reefs), including all following modifications (Art. 11, D.lgs. 190/2010). From 2015 to 2022, 264 transects were performed in the 33–90 m depth range along the whole Ligurian coast and repeated to check putative differences after a span of time of 2–4 years.
Each ROV transect had a length of 200 m and a width of 50 cm, covering 100 m2 of seafloor. In each transect, all the colonies of P. clavata were counted, and their density was calculated, referring only to the percentage of hard bottom seafloor present in the transect, thus excluding soft bottom areas unsuitable for the settling of the gorgonian.
Sessile epibionts (sponges, anthozoans, bryozoans, annelids) and vagile fauna spotted associated with the colonies were noted. The percentage of colonies with epibiosis or entangled in fishing gear was used to estimate the health status of the populations. The height of 100 colonies randomly selected per transect was measured using the laser pointers as a reference (15 cm apart). In transects with less than 100 gorgonians, all the colonies were measured (Table 1).
Only the transects with more than 50 colonies were selected for the formal analysis. In particular, 13 transects replicated after 3–4 years in A1, 19 transects replicated after 3 years in A2, and 14 transects replicated after 2–3 years in A3 (Table 1).
Considering the entire database, putative differences in the percentage of epibionted colonies were investigated among macro-areas and compared with the number of fishing harbours and fishing vessels working with set gear (set longlines, set gillnets, and trammel nets). Differences across time (Before/After) were studied within each macro-area, comparing data of epibiosis and entanglement in the same transects replicated after 2–4 years. To evaluate if the putative trajectories of temporal variations were generalised at a spatial scale or linked to stochastic phenomena, we evaluated the percentage of transects that presented a positive (epibiosis/entanglement increasing) or negative (epibiosis/entanglement decreasing) variation in the percentage of affected colonies in each considered period.

2.3. Statistical Analysis

Differences in P. clavata density, colony height, and percentage of epibiosis in the whole study area were tested by one-way ANalysis Of VAriance (ANOVA). Temporal analysis of the replicated transects was performed by PERMutational ANalysis Of VAriance (PERMANOVA) [45] (factor “macro-area”, fixed, 3 levels, and “time”, i.e., Before/After, fixed, 2 levels; Bray–Curtis similarity Index measure, permutation = 9999). All statistical analyses were performed using PRIMER-e 7 with PERMANOVA+ Add On package.

3. Results

3.1. Health Status of Paramuricea clavata Forests in the Ligurian Sea

In total, 24834 colonies of Paramuricea clavata were observed, of which 6836 were affected by epibiosis (28%), and 6140 were entangled in lost fishing gear (25%).
The forests appeared homogeneously distributed along the Ligurian arc (Figure 1). The average density (about 3.3 ± 0.5 colonies m−2) showed no significant differences between the three macro-areas (Figure 2a; Table 2). On the contrary, the average height was significantly lower in A2 (26.6 ± 1.5 cm) than in the two other macro-areas (29.4 ± 1 cm and 31 ± 1.5 cm respectively in A1 and A3) (Figure 2b; Table 2). Particularly the percentage of the epibionted colonies significantly decreased from the eastern area (A1, 36%) to the centre (A2, 30%) and to the western ones (A3, 18%) (Figure 2c; Table 2).
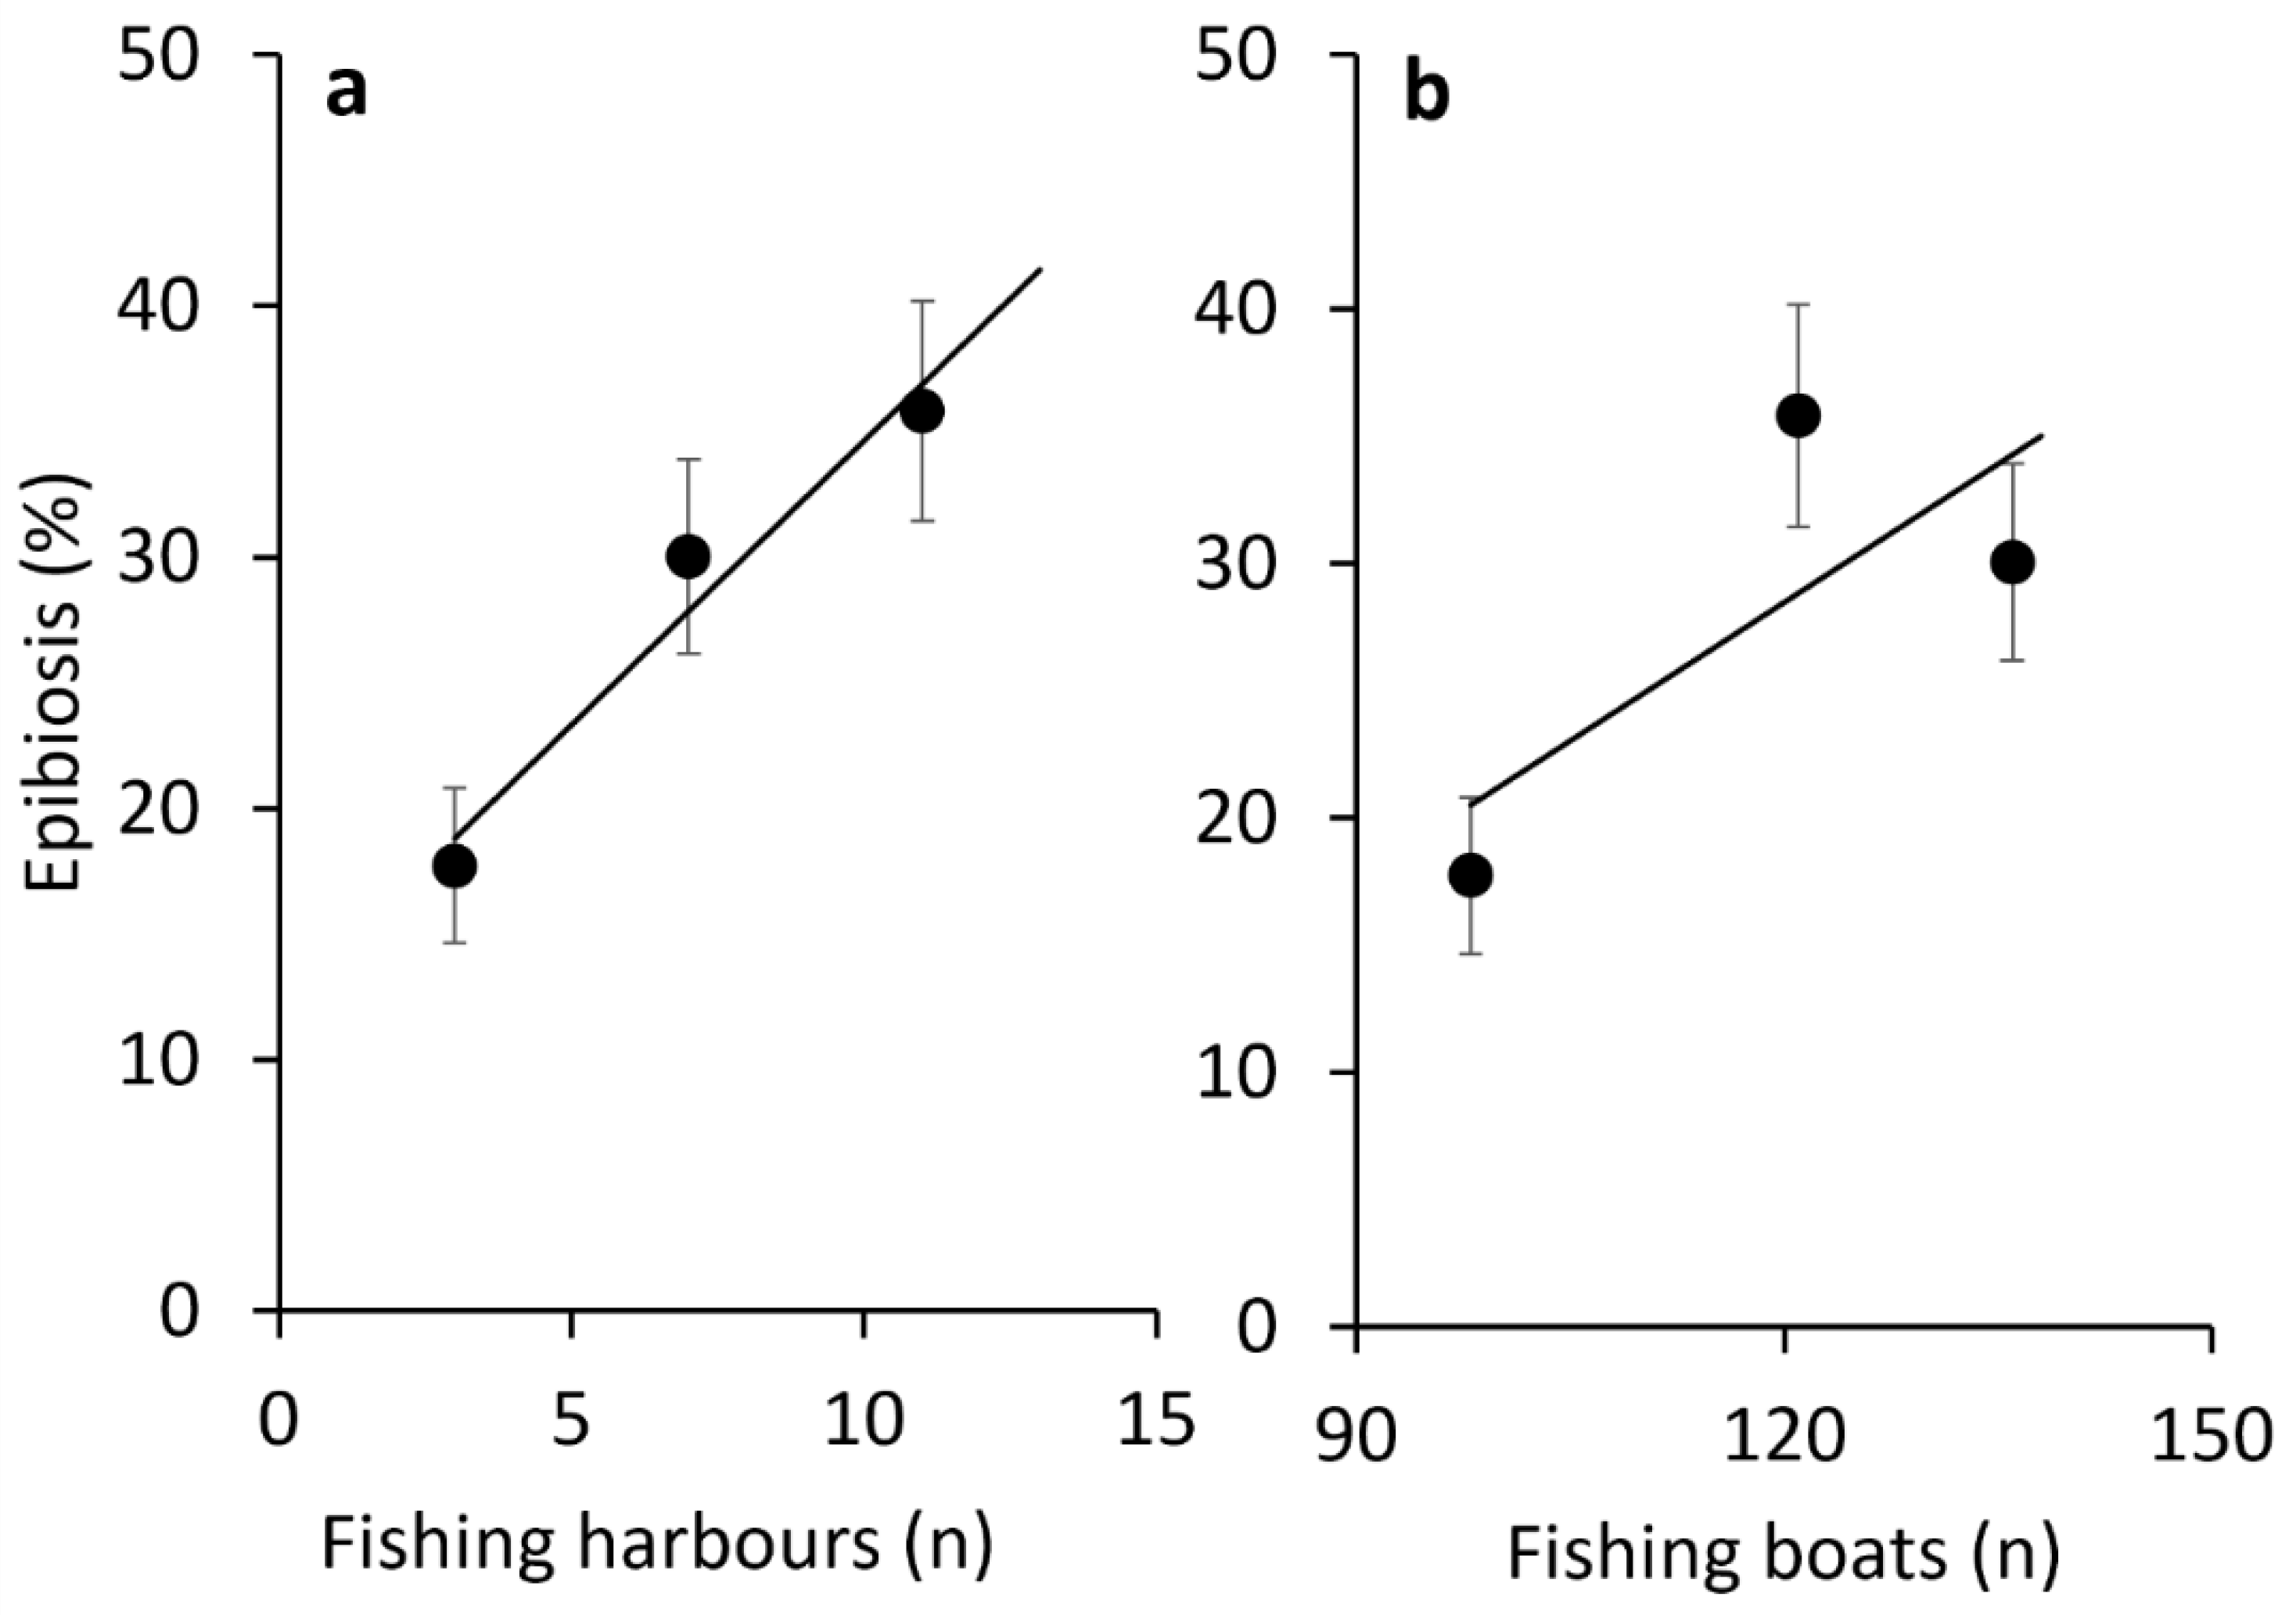
This trend was correlated with the fishing effort estimated per each macro-area: in fact, the fishing harbours were 11, 7, 3 respectively in A1, A2 and A3 and the fleets were represented by 121 vessels in A1, 136 in A2 and 98 in A3 (Figure 3a,b).
The bathymetric trend of the incidence of the epibiosis showed maximal values in the depth range 50–70 m (32–35% of the observed colonies), with a decrease at lower and higher depths (Figure 4a). The bathymetric distribution of the colonies entangled in lost fishing lines reflected a very similar trend (Figure 4b).
The species most frequently found as epibionts on P. clavata were the sponge Pleraplysilla spinifera (Schulze, 1879), the soft coral Alcyonium coralloides (Pallas, 1766), the bushy serpulids belonging to the Filograna/Salmacina complex, and the branched bryozoans Adeonella calveti Canu & Bassler, 1930, Smittina cervicornis (Pallas, 1766), and Turbicellepora avicularis (Hincks, 1860). Finally, specimens of the passive filter-feeder echinoderm Astrospartus mediterraneus (Risso, 1826) were commonly observed.

3.2. Temporal Analysis of Epibiosis and Entanglement

The comparison of the same groups of transects replicated after 2–4 years revealed a similar trend in the three considered macro-areas.
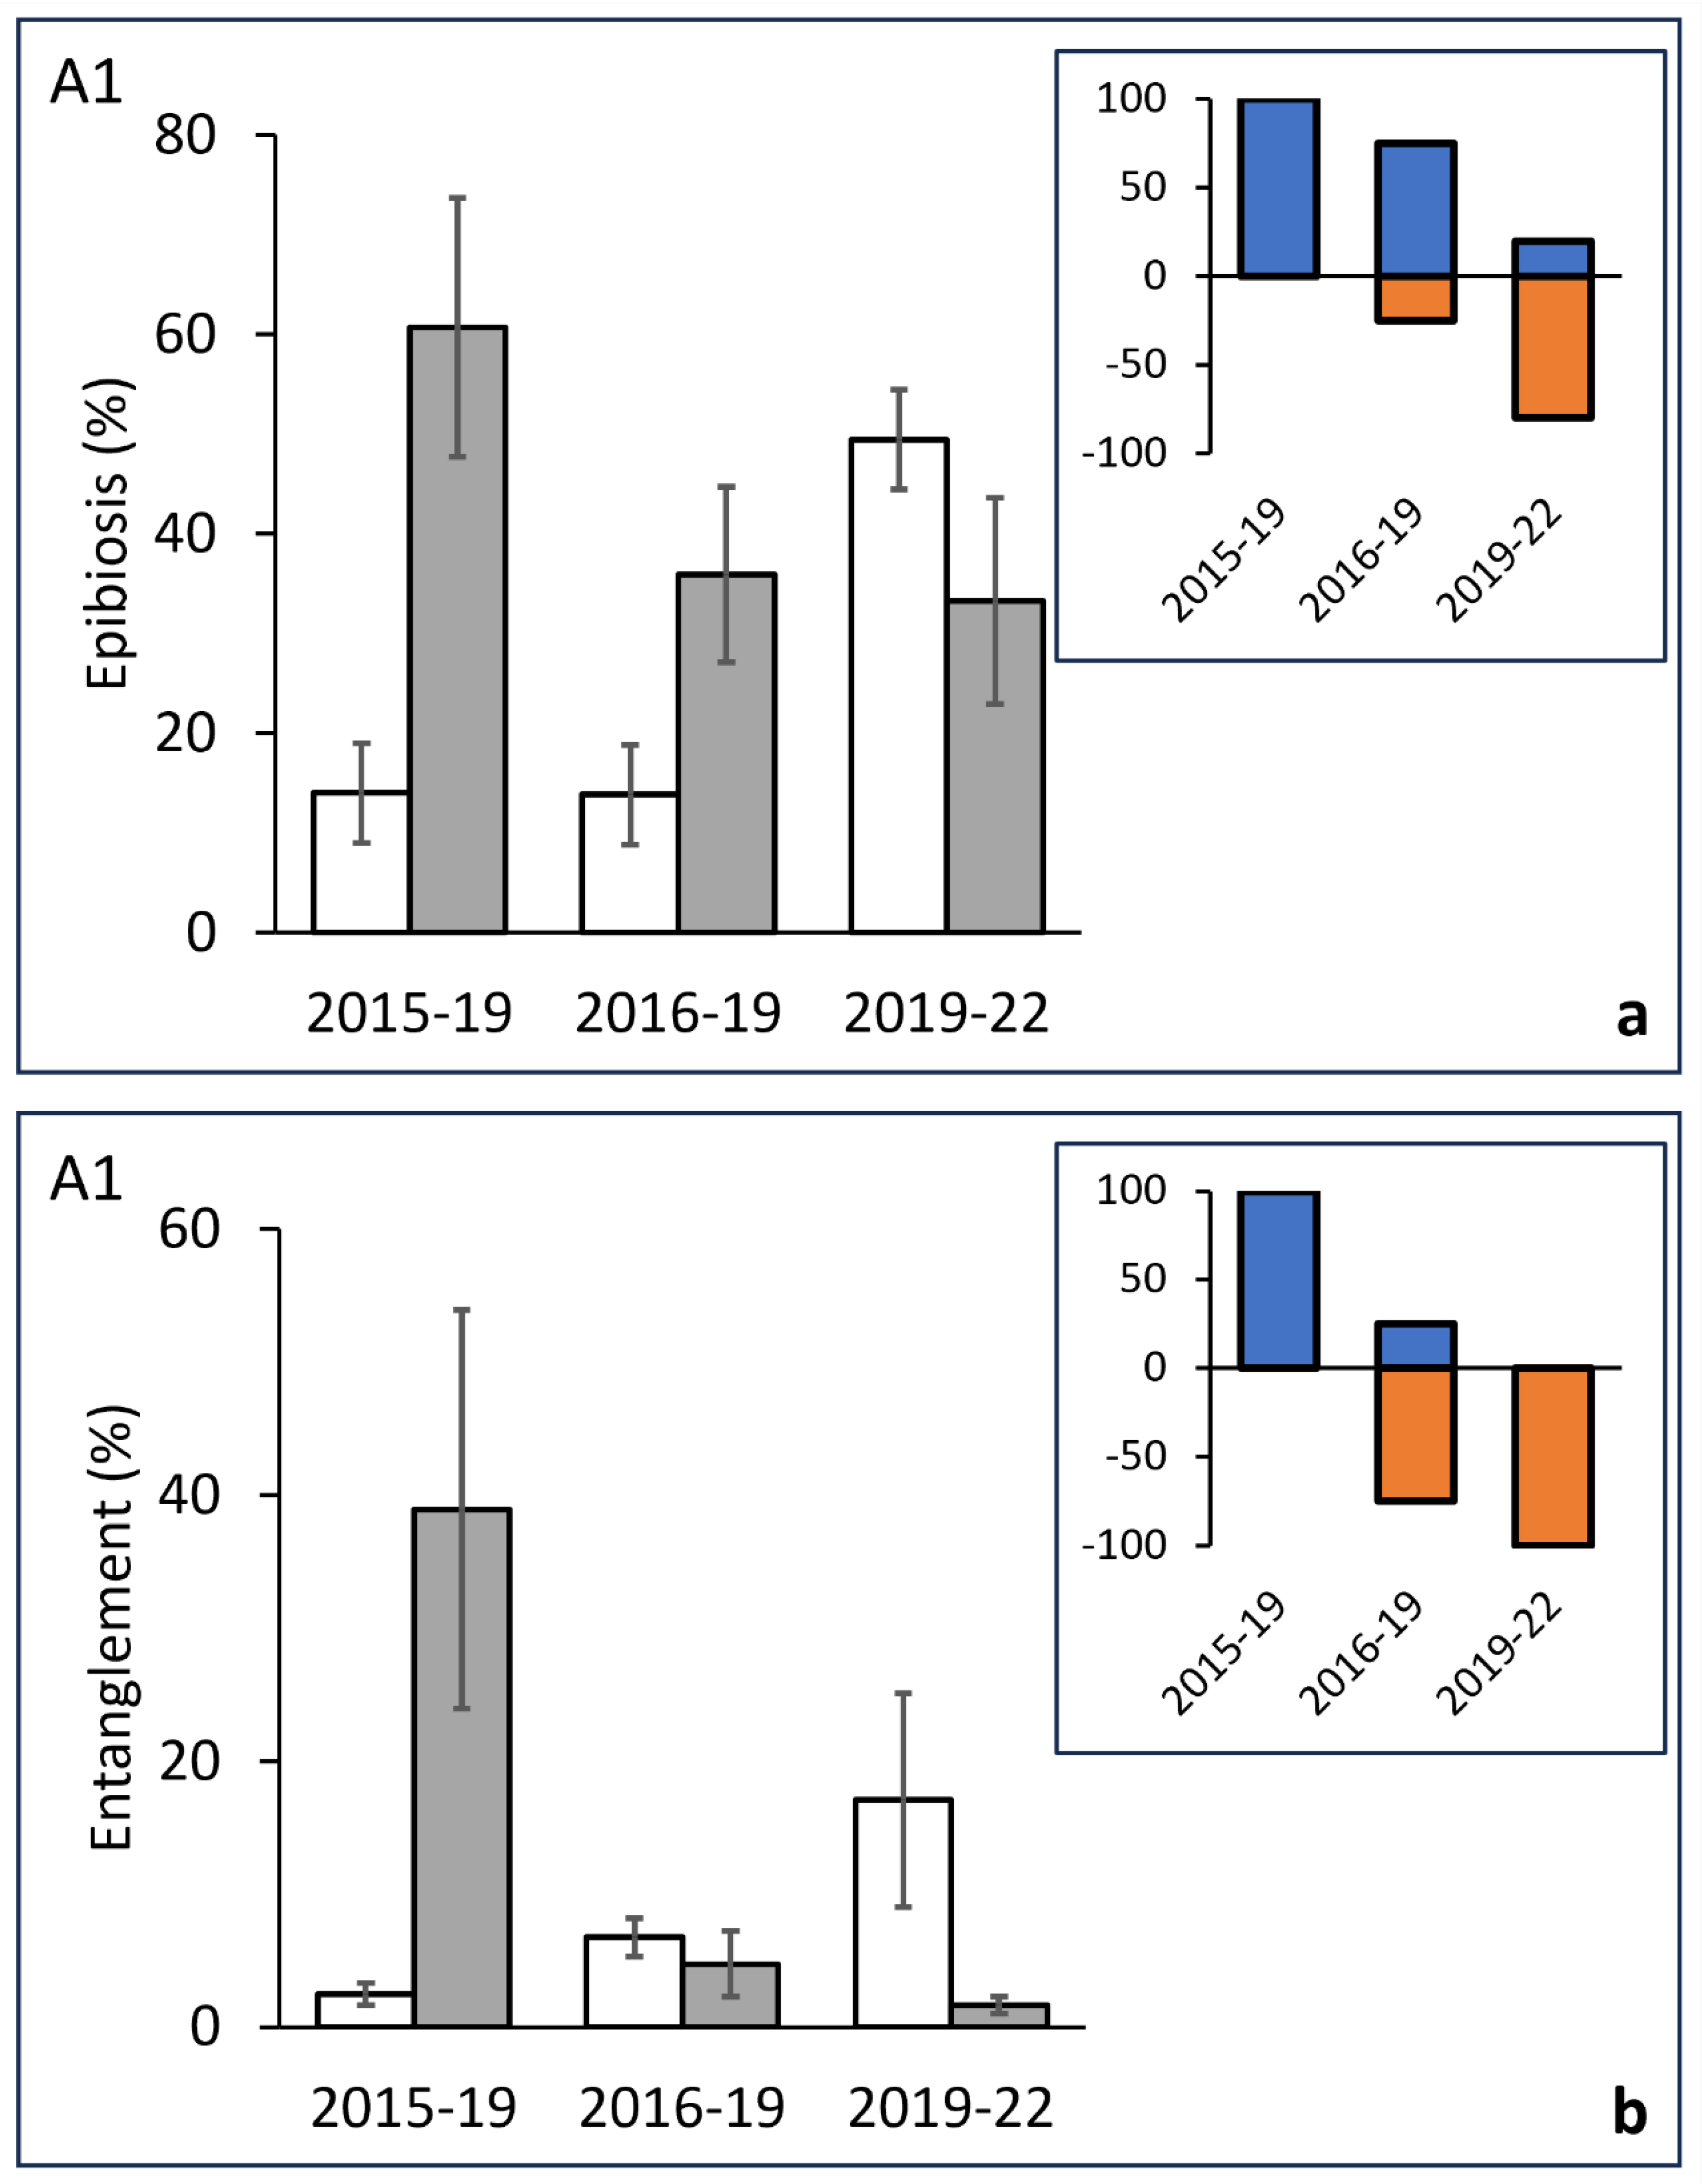
In macro-area A1, the transects studied in 2015 and replicated in 2019 showed a significant increase in the percentage of epibionted colonies, shifting from 14% to 61%. A similar trend was observed in the transects made in 2016 and replicated in 2019, with values increasing from 13.8% to 35.9%. Differently, in the group of transects studied during 2019 and repeated in 2022, the incidence of epibiosis was not significantly different (Figure 5a; Table 3). These variations were homogeneously recorded among the considered transects, confirming the progressive shift. In fact, in the periods 2015–19 and 2016–19, almost all the studied transects showed positive variations (increase) of the epibiosis. Conversely, in the period 2019–22, 80% of the transects showed negative percentage variations (decrease) (Figure 5a inset). The percentage of entangled colonies significantly surged from 2.5% to 38.9% in the period 2015–19, while in both the following periods (2016–19; 2019–22), no significant differences were assessed (Figure 5b; Table 3). The trend of the percentage of transects with positive/negative variations showed 100% of positive variations in the first period while in the following periods, the percentage of negative variations progressively grew (Figure 5b inset).
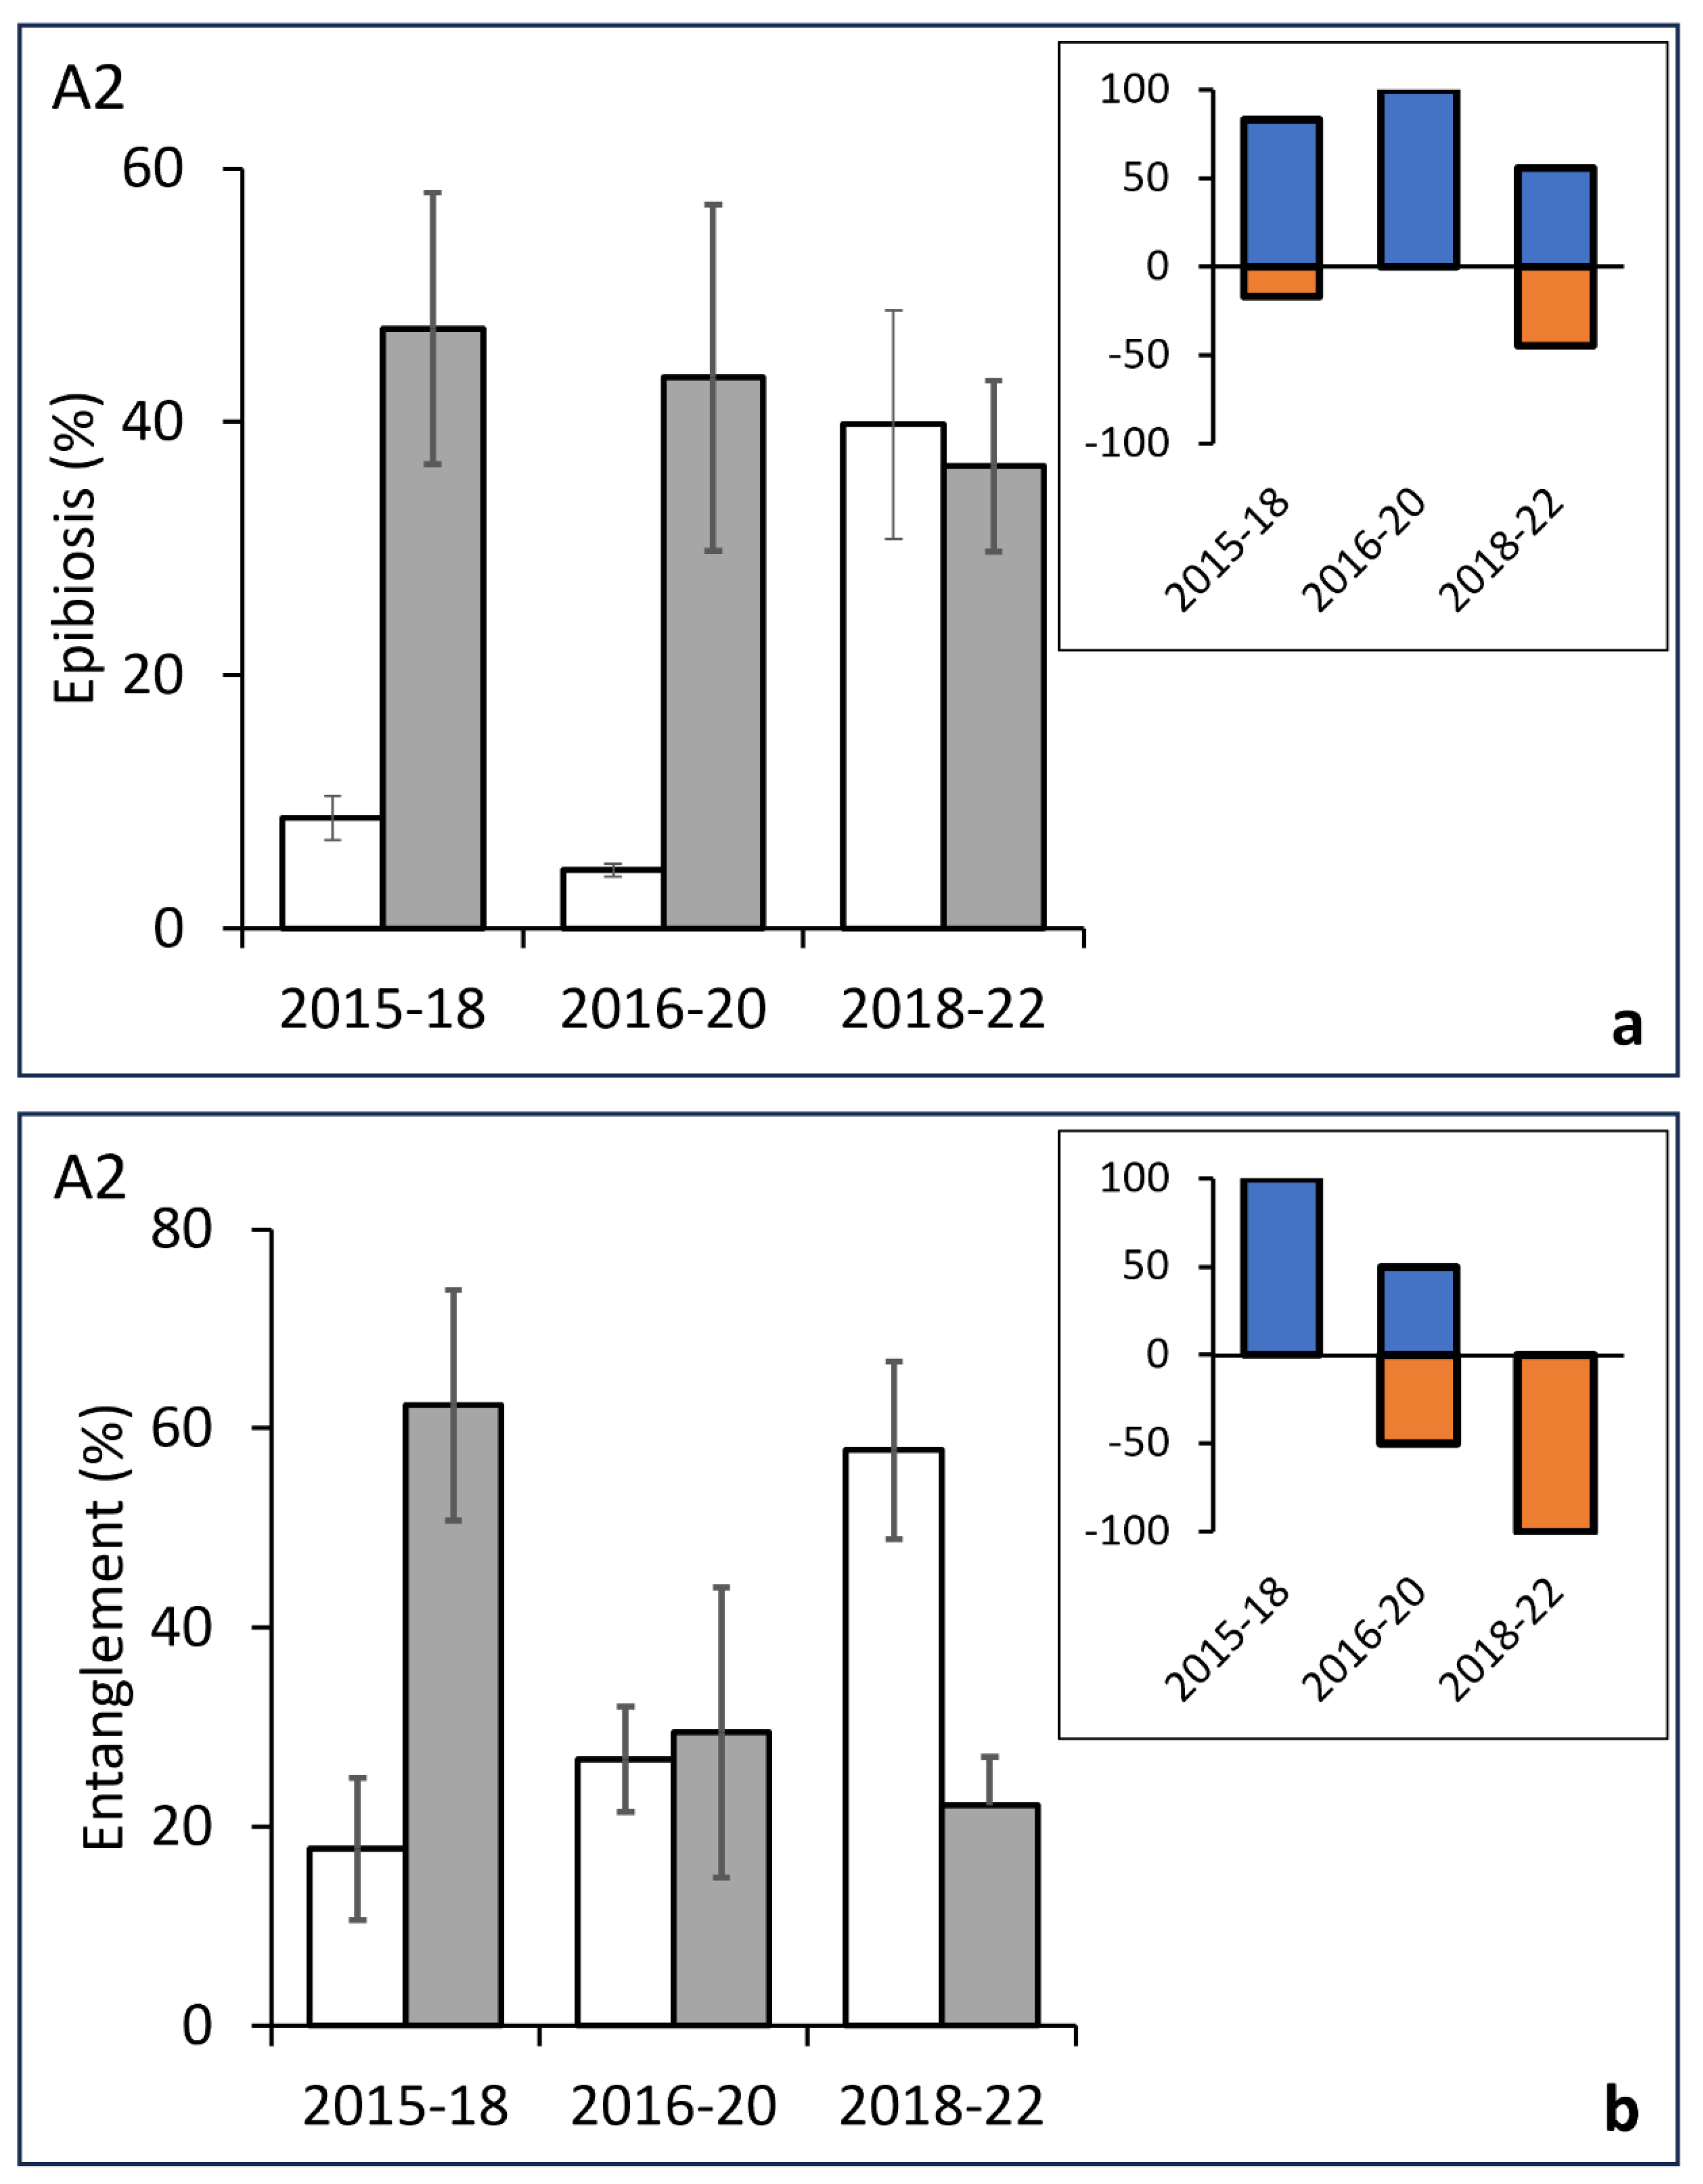
A similar situation was observed for macro-area A2. The comparison of the transects carried out in the periods 2015–18 and 2016–20 showed a progressive steady rise in the percentage of colonies affected by epibiosis, from 8.7% to 47% and from 4.6% to 43.5%, respectively. In the period 2018–22, no significant differences were detected (Figure 6a; Table 3). In the first two periods, the totality of studied transects showed soaring values, while in the third period, this value decreased to 50% (Figure 6a inset).
Considering the entanglement percentages, a strong increase was observed in the first period, followed by a period without significant variations and, finally, by a third period characterised by a significant decrease (Figure 6b; Table 3). The analysis of the homogeneity of the variations across time showed a regular trend from 100% of transects with positive variations in the period 2015–18 to 100% of transects characterised by a negative variation in the period 2019–22 (Figure 6b inset).
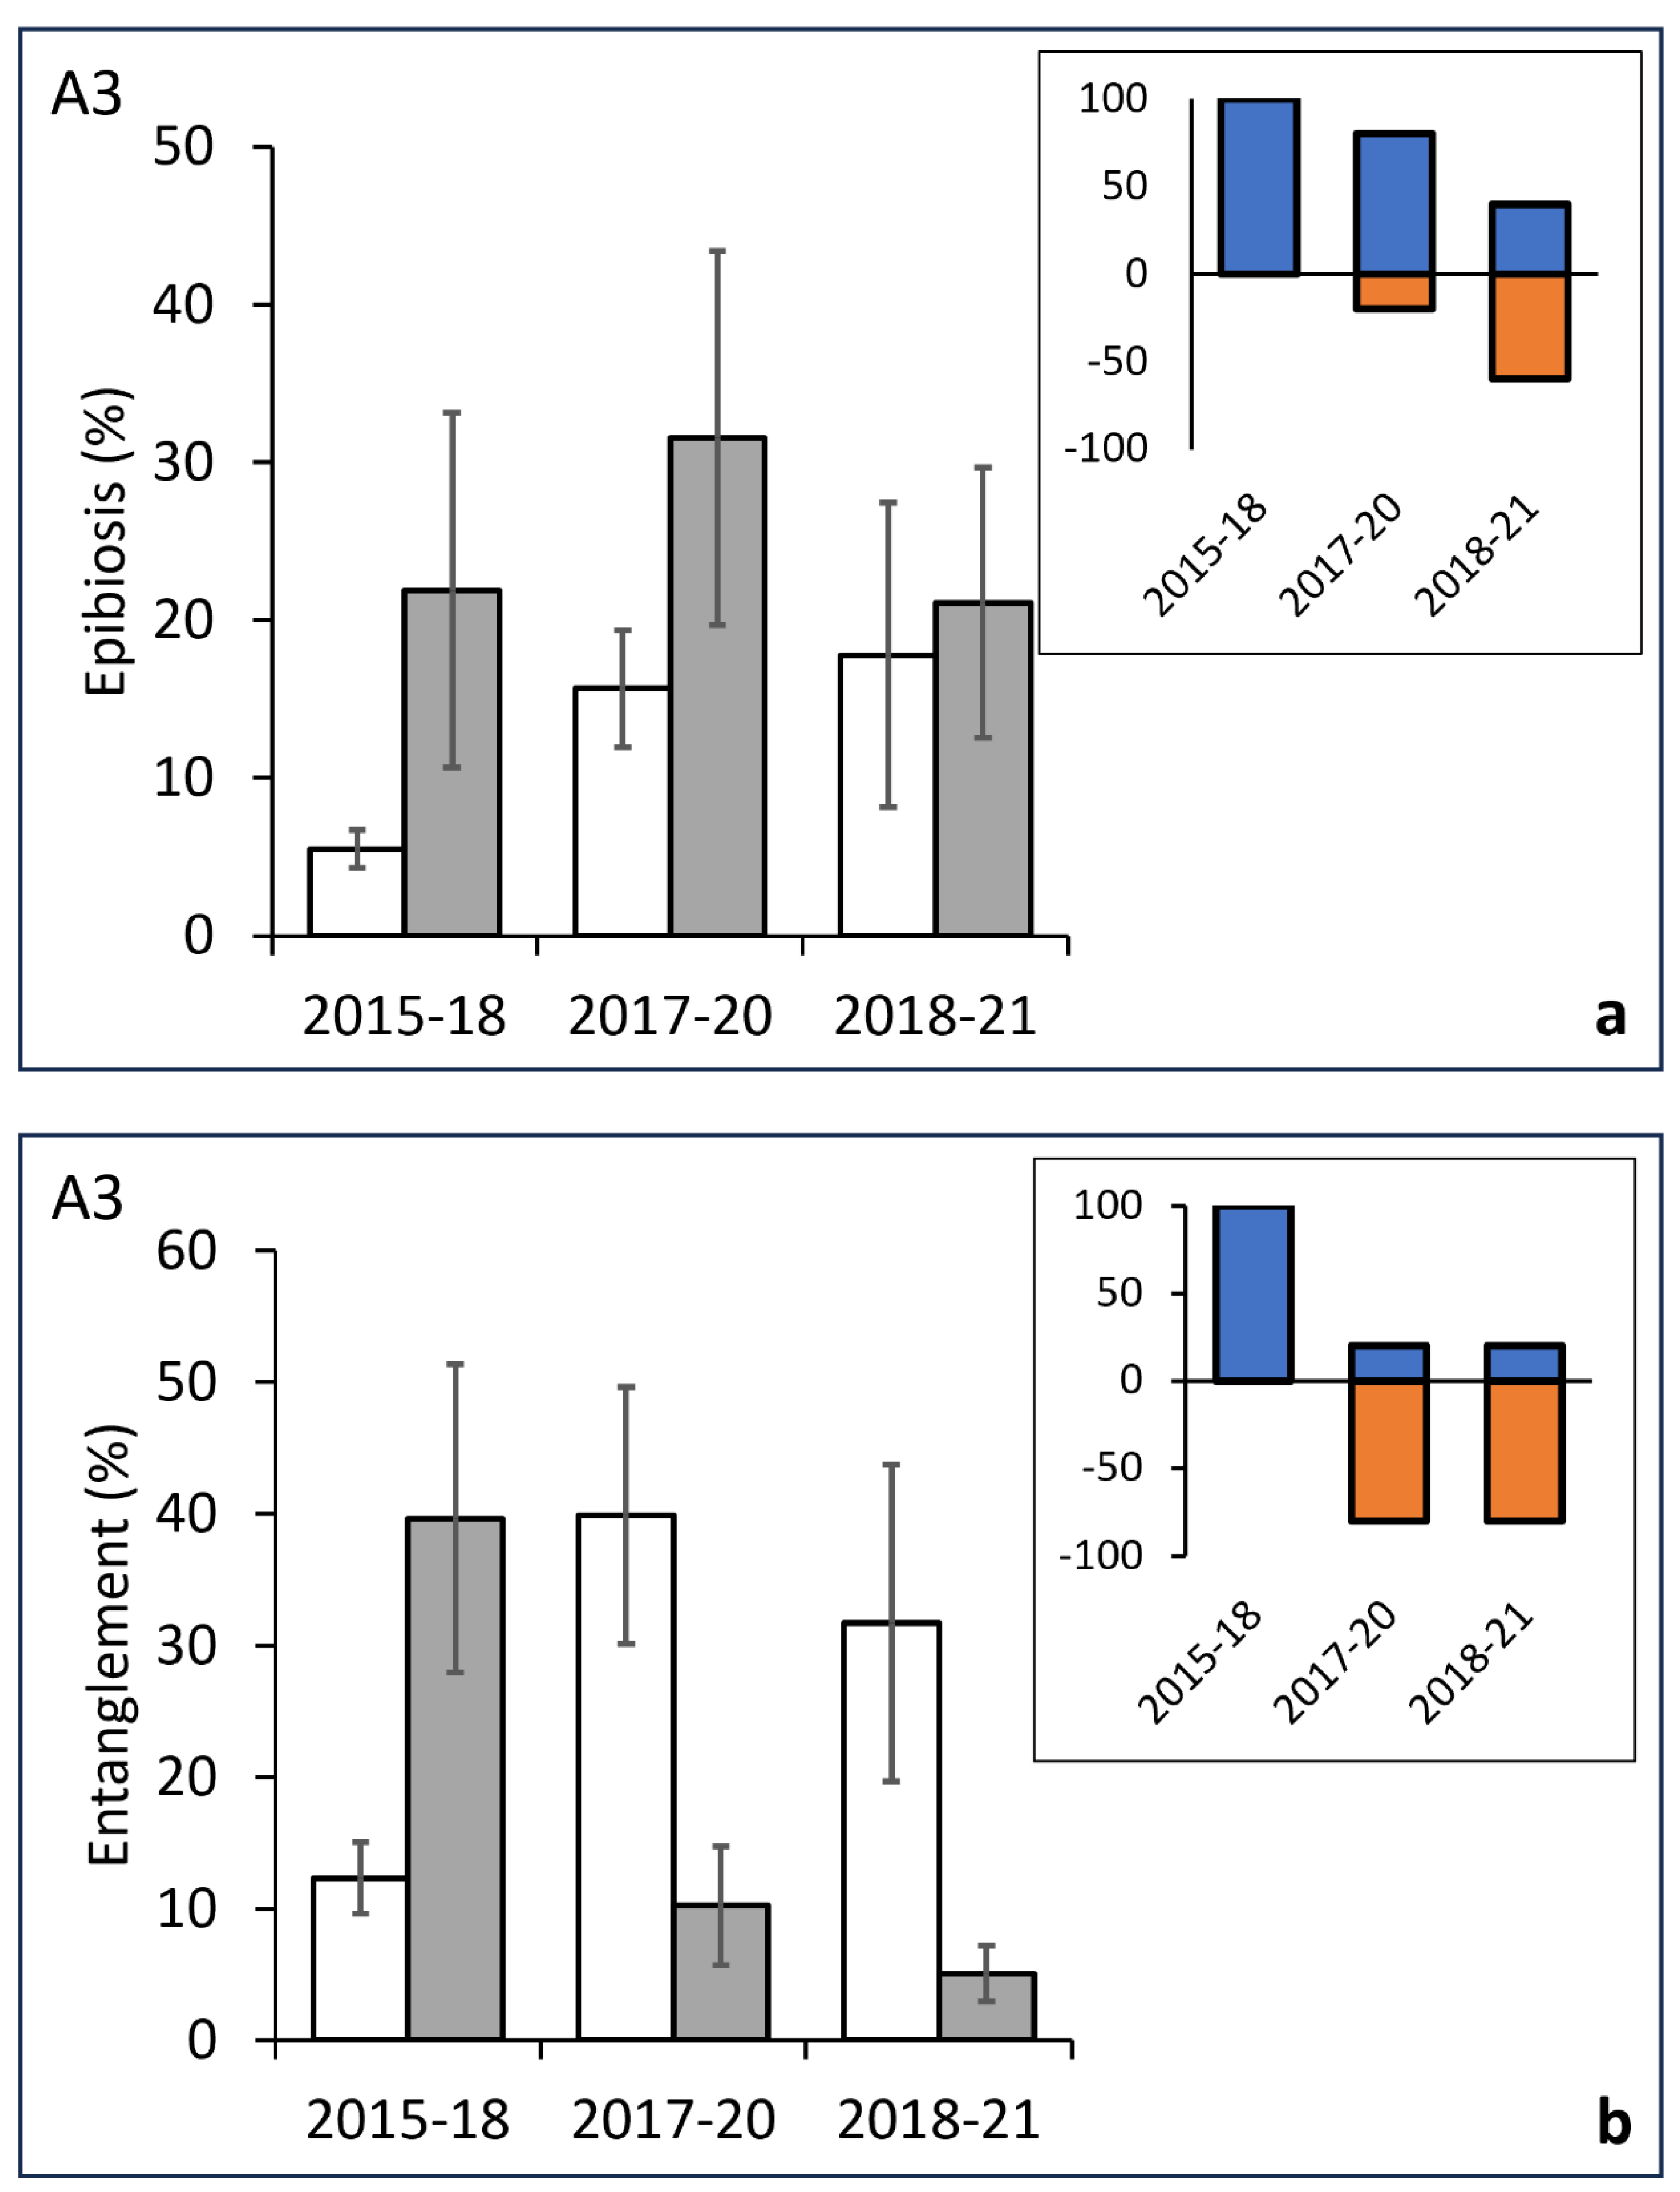
Finally, regarding macro-area A3, the diachronic analysis highlighted a significant upsurge of the epibionted colonies in the first period, followed by two periods without significant variations (Figure 7a). The corresponding trend of the percentage of transects with positive variation progressively decreased from 100% in the first period to 33% in the third one (Figure 7a inset). Finally, the trend of the entanglement showed a significant increase in the first period followed by a significant decrease in the other two periods (Figure 7b; Table 3), also confirmed by a specular trend of the percentage of transects with positive/negative variations (Figure 7b inset).

4. Discussion

The diseases hitting the gorgonian populations in the Mediterranean Sea are generally attributed to the acute stress produced by positive thermal anomalies that have progressively increased in frequency and intensity in the last decades [22,42]. During the period of our observations, MHW events were recorded in 2015, 2016, 2018, and 2022 [22,46].
Our study revealed that the epibiosis affecting Paramuricea clavata in three macro-areas along the Ligurian coast had an overlapping temporal trajectory that can be generalised at the regional scale. The percentage of involved colonies strongly increased from 2015 until 2019, while in the following period (2019–2022), the level remained unvaried or decreased. This pattern agrees with the trend of MHWs in the western Mediterranean Sea. In fact, the significant sharp increase between 2015 and 2019 could be related to the intense MHWs that took place between 2015 and 2018. Iborra et al. [42] investigated the gorgonian population of the Gulf of Calvi (NW Corsica Island) over a 15-year period (2004, 2014, and 2019) and the observed changes in the level of necrosis of the colonies were related to the trend of MHWs occurring in that period. According to these authors, the effect of MHWs on the gorgonian integrity reached relatively deep coastal waters (down to 40 m), where temperature increases are generally not recorded [42]. The shallow water temperature rise induces a strong stratification of the water column with a consequent low availability of trophic resources and a high respiratory demand [47,48]. This hypothesis agrees with the bathymetric distribution of the level of epibiosis observed during our study in the Ligurian Sea, where the maximum values were recorded below 50 m. In the same area, previous diseases involving cnidarians and sponges were already observed up to 70 m [17,49,50,51]. At the same time, the bathymetric distribution of the maximum level of epibiosis and entanglement (50–70 m) can be also related to the bathymetric distribution of P. clavata forests in the Ligurian Sea, being mainly concentrated between 45 and 65 m [43].
A remarkable quickness in the evolution of the levels of epibiosis emerges from the present study. In the eastern Ligurian Sea, in four years (2015–2019), the percentage of epibionted colonies increased more than three times, and in the central area increased six times. This evidence supports the damages inflicted by mass diseases following MHWs. In fact, during the 2003 episode, almost 80% of the studied colonies in the Gulf of Genoa developed epibiosis in a few weeks [21]. A long-term monitoring conducted on the P. clavata populations in the period 2003–2017 in the Scandola MPA highlighted a substantial decline in density and a slight loss of mean colony biomass after 15 years, and all populations were farther from recovery in 2017–2018 than in 2008. On average, in 2003, values decreased by around 71% and 80%, despite no significant changes in the size structure were observed in any population immediately after the 2003 MHW [41]. On the other hand, Cupido et al. [50] observed a strong recovery of the populations in the La Spezia Gulf after the late-summer 1999 and 2003 large mortality events due to thermal stress. The long-term observation (1998 to 2008) confirmed that a positive net recruitment and canopy reestablishment could start some years after a high-mortality event, also under naturally stressed environmental conditions.
Despite this evidence, our data strongly suggest that also human activities are deeply involved in the development of epibiosis in P. clavata. The correlation, at the regional scale, between the level of epibiosis with the number of fishing vessels and harbours evidences the role of fishing activities. Moreover, the overlapping of the bathymetric trend of epibiosis with that of the entanglement indicates a strong correlation also with this kind of impact. The depth range of epibionted colonies overlaps that of fishing with settled gear targeting spiny lobsters, sparids (common dentex, gilthead seabreams), and groupers [52]. Finally, the influence of fishing on the level of epibiosis was also supported by the temporal correlation of the two parameters in all the studied areas. In some cases (e.g., A3) it appears evident that a reduction in the entangled colonies anticipates that of epibionted ones.
These data strongly enforce the idea that the observed variations in the Ligurian forests are due to a synergistic effect of natural and anthropogenic causes. Probably, the damages caused by fishing activities pile up on colonies already deeply stressed by thermal diseases. A further indication is that, in the period 2018–2022, despite the occurrence of one of the strongest MHW ever observed [46], the epibiosis remained stable or decreased concomitantly with a period of strong reduction in the percentage of entanglement supporting a decrease in the fishing effort.
Unfortunately, data about the annual trend of artisanal fishing and, particularly, recreative fishing are virtually impossible to obtain, and therefore, only a hypothesis can be formulated. We suggest that the reduction of the fishing activity speculated for the period 2019–22 could be due to the COVID-19 pandemic lockdown imposed from March to May 2020. Fisheries were limited by the coronavirus pandemic at a global scale. In that period, the lockdown, followed by a strong shrinking in seafood requests, determined a decrease in fishing activities. For example, a recent study demonstrated a reduction of about 50% of the fishing effort for the Adriatic Sea [53]. In the eastern Mediterranean Sea, from December 2019 to February 2020, the average monthly gross margin for fishermen was 2.5 times less than the usual average [54]. The fishing effort in an exploited area of the north-western Mediterranean coast (Spain) during the lockdown dropped by 34%, landings were down by 49%, and revenues declined by 39% in comparison with the same period in 2017–2019 [55]. This scenario well represents also the conditions of the Ligurian fishing economy in that period, an economy based on traditional activities carried out by small artisanal communities, mainly targeting high-value resources [56].
In addition, during the lockdown period, the media reported the presence of iconic large marine animals, such as marine mammals, elasmobranchs and marine turtles, in unexpected areas, such as very coastal areas or harbours [55]. Despite the wide interest in the effects of the COVID-19 pandemic on marine habitats and fisheries, no data are available about benthic organisms: our observation could be the first suggestion of an improvement in the health status of P. clavata forests resulting from a short-term strong reduction of fishing activities. The vulnerability of habitat-forming species is influenced by their low resilience to mechanical impacts, driven by modest to slow growth rates [57]. This work supports the potential effectiveness of Fisheries Restricted Areas (FRAs) on these complex habitats.

5. Conclusion

In conclusion, the importance of long-term monitoring programs must be underlined to understand the trajectories of modification of marine communities prone to different stressors. This kind of monitoring can provide evidence of unsuspected drivers of benthic community health, together with possible mitigation strategies.

Author Contributions

F Conceptualization, G.B. and M.C.; methodology, M.C., A.D., F.E., M.T.; formal analysis and investigation, M.C., F.E., M.T.; resources, R.B.; data curation, M.C., F.E., M.T.; writing—original draft preparation, G.B., F.B., M.B., M.C., A.D., F.E., M.T.; writing—review and editing, G.B., F.B., M.B., M.C., A.D., F.E., M.T.; visualization, F.B; supervision, G.B., M.B.; project administration, G.B.; funding acquisition, R.B. All authors have read and agreed to the published version of the manuscript.

Funding

Project funded under the National Recovery and Resilience Plan (NRRP), Mission 4 Component 2 Investment 1.4 - Call for tender No. 3138 of 16 December 2021, rectified by Decree n.3175 of 18 December 2021 of Italian Ministry of University and Research funded by the European Union – NextGenerationEU.

Institutional Review Board Statement

Not applicable.

Data Availability Statement

The authors confirm that the data supporting the findings of this study are available within the article. The video dataset collected and analyzed during the present study is available from the corresponding author upon request.

Conflicts of Interest

The authors declare no conflicts of interest. The funders had no role in the design of the study; in the collection, analyses, or interpretation of data; in the writing of the manuscript; or in the decision to publish the results.

References

  1. Gori, A.; Bavestrello, G.; Grinyó, J.; Dominguez-Carrió, C.; Ambroso, S.; Bo, M. Animal forests in deep coastal bottoms and continental shelf of the Mediterranean Sea. In Marine Animal Forests: the ecology of benthic biodiversity hotspots; 2017; pp. 207–233. [Google Scholar]
  2. Rossi, S.; Bramanti, L.; Gori, A.; Orejas, C. An overview of the animal forests of the world. In Marine Animal Forests: the ecology of benthic biodiversity hotspots; 2017; pp. 1–28. [Google Scholar]
  3. Piazzi, L.; Atzori, F.; Cadoni, N.; Cinti, M.F.; Frau, F.; Pansini, A.; Pinna, F.; Stipcich, P.; Ceccherelli, G. Animal Forest mortality: Following the consequences of a gorgonian coral loss on a Mediterranean Coralligenous assemblage. Diversity 2021, 13, 133. [Google Scholar] [CrossRef]
  4. Linares, C.; Doak, D.F. Forecasting the combined effects of disparate disturbances on the persistence of long-lived gorgonians: a case study of Paramuricea clavata. Mar Ecol Prog Ser 2020, 402, 59–68. [Google Scholar] [CrossRef]
  5. Cerrano, C.; Milanese, M.; Ponti, M. Diving for science-science for diving: volunteer scuba divers support science and conservation in the Mediterranean Sea. Aquat Conserv Mar Freshw Ecos 2017, 27, 303–323. [Google Scholar] [CrossRef]
  6. Betti, F.; Bavestrello, G.; Bo, M.; Ravanetti, G.; Enrichetti, F.; Coppari, M.; Cappanera, V.; Venturini, S.; Cattaneo-Vietti, R. Evidences of fishing impact on the coastal gorgonian forests inside the Portofino MPA (NW Mediterranean Sea). Ocean Coast Manag 2020, 187, 105105. [Google Scholar] [CrossRef]
  7. Otero, M.M.; Numa, C.; Bo, M.; Orejas, C.; Garrabou, J.; Cerrano, C.; et al. Overview of the Conservation Status of Mediterranean Anthozoans; IUCN: Málaga, Spain, 2017; pp. 1–73. ISBN 978-2-8317-1845-3. http://hdl.handle.net/10261/150115. [CrossRef]
  8. Martin, Y.; Bonnefont, J.L.; Chancerelle, L. Gorgonians mass mortality during the 1999 late summer in French Mediterranean coastal waters: the bacterial hypothesis. Water Res 2002, 36, 779–782. [Google Scholar] [CrossRef] [PubMed]
  9. Giuliani, S.; Lamberti, C.V.; Sonni, C.; Pellegrini, D. Mucilage impact on gorgonians in the Tyrrhenian sea. STOTEN 2005, 353, 340–349. [Google Scholar] [CrossRef] [PubMed]
  10. Schiaparelli, S.; Castellano, M.; Povero, P.; Sartoni, G.; Cattaneo-Vietti, R. A benthic mucilage event in North-Western Mediter- ranean Sea and its possible relationships with the summer 2003 European heatwave: Short term effects on littoral rocky assemblages. Mar Ecol 2007, 28, 341–353. [Google Scholar] [CrossRef]
  11. Garrabou, J.; Coma, R.; Bensoussan, N.; Bally, M.; Chevaldonné, P.; Cigliano, M.; et al. Mass mortality in Northwestern Mediterranean rocky benthic communities: Effects of the 2003 heat wave. Glob Chang Biol 2009, 15, 1090–1103. [Google Scholar] [CrossRef]
  12. Vezzulli, L.; Previati, M.; Pruzzo, C.; Marchese, A.; Bourne, D.G.; Cerrano, C. VibrioSea Consortium. Vibrio infections triggering mass mortality events in a warming Mediterranean Sea. Environ Microbiol 2010, 12, 2007–2019. [Google Scholar] [CrossRef]
  13. Vezzulli, L.; Pezzati, E.; Huete-Stauffer, C.; Pruzzo, C.; Cerrano, C. 16SrDNA pyrosequencing of the Mediterranean gorgonian Paramuricea clavata reveals a link among alterations in bacterial holobiont members, anthropogenic influence and disease outbreaks. PLoS One 2013, 8, e67745. [Google Scholar] [CrossRef]
  14. Piazzi, L.; Atzori, F.; Cadoni, N.; Cinti, M.F.; Frau, F.; Ceccherelli, G. Benthic mucilage blooms threaten coralligenous reefs. Mar Environ Res 2018, 140, 145–151. [Google Scholar] [CrossRef] [PubMed]
  15. Verdura, J.; Linares, C.; Ballesteros, E.; Coma, R.; Uriz, M.J.; Bensoussan, N.; Cebrian, E. Biodiversity loss in a Mediterranean ecosystem due to an extreme warming event unveils the role of an engineering gorgonian species. Sci Rep 2019, 9, 5911. [Google Scholar] [CrossRef] [PubMed]
  16. Ceccherelli, G.; Pinna, F.; Pansini, A.; Piazzi, L.; La Manna, G. The constraint of ignoring the subtidal water climatology in evaluating the changes of coralligenous reefs due to heating events. Sci Rep 2020, 10, 17332. [Google Scholar] [CrossRef] [PubMed]
  17. Cerrano, C.; Bavestrello, G.; Bianchi, C.N.; Cattaneo-Vietti, R.; Bava, S.; Morganti, C.; Morri, C.; Picco, P.G.; Schiaparelli, S.; Siccardi, A.; Sponga, F. A catastrophic mass-mortality episode of gorgonians and other organisms in the Ligurian Sea (North-western Mediterranean), summer 1999. Ecol Let 2000, 3, 284–293. [Google Scholar] [CrossRef]
  18. Garrabou, J.; Perez, T.; Sartoretto, S.; Harmelin, J.G. Mass mortality event in red coral Corallium rubrum populations in the Provence region (France, NW Mediterranean). Mar Ecol Progr Ser 2001, 217, 263–272. [Google Scholar] [CrossRef]
  19. Cebrian, E.; Uriz, M.J.; Garrabou, J.; Ballesteros, E. Sponge mass mortalities in a warming Mediterranean Sea: are cyanobacteria-harboring species worse off? PLoS One 2011, 6, e20211. [Google Scholar] [CrossRef]
  20. Cebrian, E.; Linares, C.; Marschal, C.; Garrabou, J. Exploring the effects of invasive algae on the persistence of gorgonian populations. Biol Inv 2012, 14, 2647–2656. [Google Scholar] [CrossRef]
  21. Garrabou, J.; Gómez-Gras, D.; Ledoux, J.B.; Linares, C.; Bensoussan, N.; López-Sendino, P.; et al. Collaborative database to track mass mortality events in the Mediterranean Sea. Front Mar Sci 2019, 6, 478167. [Google Scholar] [CrossRef]
  22. Garrabou, J.; Gómez-Gras, D.; Medrano, A.; Cerrano, C.; Ponti, M.; Schlegel, R.; et al. Marine heatwaves drive recurrent mass mortalities in the Mediterranean Sea. Glob Chang Biol 2022, 28, 5708–5725. [Google Scholar] [CrossRef]
  23. Cocito, S.; Sgorbini, S. Long-term trend in substratum occupation by a clonal, carbonate bryozoan in a temperate rocky reef in times of thermal anomalies. Mar Biol 2014, 161, 17–27. [Google Scholar] [CrossRef]
  24. Linares, C.; Coma, R.; Diaz, D.; Zabala, M.; Hereu, B.; Dantart, L. Immediate and delayed effects of a mass mortality event on gorgonian population dynamics and benthic community structure in the NW Mediterranean Sea. Mar Ecol Prog Ser 2005, 305, 127–137. [Google Scholar] [CrossRef]
  25. Cerrano, C.; Bavestrello, G. Medium-term effects of die-off of rocky benthos in the Ligurian Sea. What can we learn from gorgonians? Chem Ecol 2008, 24, 73–82. [Google Scholar] [CrossRef]
  26. Huete-Stauffer, C.; Vielmini, I.; Palma, M.; Navone, A.; Panzalis, P.; Vezzulli, L.; Misic, C.; Cerrano, C. Paramuricea clavata (Anthozoa, Octocorallia) loss in the Marine Protected Area of Tavolara (Sardinia, Italy) due to a mass mortality event. Mar Ecol 2011, 32, 107–116. [Google Scholar] [CrossRef]
  27. Teixidó, N.; Casas, E.; Cebrian, E.; Linares, C.; Garrabou, J. Impacts on coralligenous outcrop biodiversity of a dramatic coastal storm. PLoS One 2013, 8, e53742. [Google Scholar] [CrossRef]
  28. Bavestrello, G.; Cerrano, C.; Zanzi, D.; Cattaneo-Vietti, R. Damage by fishing activities to the Gorgonian coral Paramuricea clavata in the Ligurian Sea. Aquat Conserv Mar Freshw Ecosyst 1997, 7, 253–262. [Google Scholar] [CrossRef]
  29. Coma, R.; Pola, E.; Ribes, M.; Zabala, M. Long-term assessment of temperate octocoral mortality patterns, protected vs. unprotected areas. Ecol Appl 2004, 14, 1466–1478. [Google Scholar] [CrossRef]
  30. Bo, M.; Bava, S.; Canese, S.; Angiolillo, M.; Cattaneo-Vietti, R.; Bavestrello, G. Fishing impact on deep Mediterranean rocky habitats as revealed by ROV investigation. Biol Conserv 2014, 171, 167–176. [Google Scholar] [CrossRef]
  31. Angiolillo, M.; di Lorenzo, B.; Farcomeni, A.; Bo, M.; Bavestrello, G.; Santangelo, G.; Cau, A.; Mastascusa, V.; Cau, A.; Sacco, F.; Canese, S. Distribution and assessment of marine debris in the deep Tyrrhenian Sea (NW Mediterranean Sea, Italy). Mar Pollut 2015, 92, 149–159. [Google Scholar] [CrossRef]
  32. Angiolillo, M.; Fortibuoni, T. Impacts of marine litter on Mediterranean reef systems: From shallow to deep waters. Front Mar Sci 2020, 7, 581966. [Google Scholar] [CrossRef]
  33. Sini, M.; Kipson, S.; Linares, C.; Koutsoubas, D.; Garrabou, J. The yellow gorgonian Eunicella cavolini: Demography and disturbance levels across the Mediterranean Sea. PLoS One 2015, 10, e0126253. [Google Scholar] [CrossRef]
  34. Enrichetti, F.; Bo, M.; Morri, C.; Montefalcone, M.; Toma, M.; Bavestrello, G.; Tunesi, L.; Canese, S.; Giusti, M.; Salvati, E.; Bertolotto, R.M.; Bianchi, C.N. Assessing the environmental status of temperate mesophotic reefs: A new, integrated methodological approach. Ecol Ind 2019, 102, 218–229. [Google Scholar] [CrossRef]
  35. Tsounis, G.; Martinez, L.; Bramanti, L.; Viladrich, N.; Gili, J.M.; Martinez, A.; Rossi, S. Anthropogenic effects on reproductive effort and allocation of energy reserves in the Mediterranean octocoral Paramuricea clavata. Mar Ecol Prog Ser 2012, 449, 161–172. [Google Scholar] [CrossRef]
  36. Kipson, S.; Linares, C.; Cˇižmek, H.; Cebrián, E.; Ballesteros, E.; Bakran-Petricioli, T.; Garrabou, J. Population structure and conservation status of the red gorgonian Paramuricea clavata (Risso, 1826) in the Eastern Adriatic Sea. Mar Ecol 2015, 36, 982–993. [Google Scholar] [CrossRef]
  37. Canessa, M.; Amedeo, I.; Bavestrello, G.; Panzalis, P.; Trainito, E. The diversity, structure, and development of the epibiont community of Paramuricea clavata (Risso, 1826) (Cnidaria, Anthozoa). Water 2023, 15, 2664. [Google Scholar] [CrossRef]
  38. Enrichetti, F.; Bavestrello, G.; Cappanera, V.; Mariotti, M.; Massa, F.; Merotto, L.; Povero, P.; Rigo, I.; Toma, M.; Tunesi, L.; Vassallo, P.; Venturini, S.; Bo, M. High megabenthic complexity and vulnerability of a mesophotic rocky shoal support its inclusion in a Mediterranean MPA. Diversity 2023, 15, 933. [Google Scholar] [CrossRef]
  39. Cerrano, C.; Arillo, A.; Azzini, F.; Calcinai, B.; Castellano, L.; Muti, C.; Valisano, L.; Zega, G.; Bavestrello, G. Gorgonian population recovery after a mass mortality event. Aquat Conserv Mar Freshw Ecos 2005, 15, 147–157. [Google Scholar] [CrossRef]
  40. Fava, F.; Bavestrello, G.; Valisano, L.; Cerrano, C. Survival, growth and regeneration in explants of four temperate gorgonian species in the Mediterranean Sea. Ital J Zool 2010, 77, 44–52. [Google Scholar] [CrossRef]
  41. Gómez-Gras, D.; Linares, C.; Dornelas, M.; Madin, J.S.; Brambilla, V.; Ledoux, J.B.; et al. Climate change transforms the functional identity of Mediterranean coralligenous assemblages. Ecol Lett 2021, 24, 1038–1051. [Google Scholar] [CrossRef] [PubMed]
  42. Iborra, L.; Leduc, M.; Fullgrabe, L.; Cuny, P.; Gobert, S. Temporal trends of two iconic Mediterranean gorgonians (Paramuricea clavata and Eunicella cavolini) in the climate change context. J Sea Res 2022, 186, 102241. [Google Scholar] [CrossRef]
  43. Enrichetti, F.; Dominguez-Carrió, C.; Toma, M.; Bavestrello, G.; Betti, F.; Canese, S.; Bo, M. Megabenthic communities of the Ligurian deep continental shelf and shelf break (NW Mediterranean Sea). PLoS One 2019, 14, e0223949. [Google Scholar] [CrossRef]
  44. Enrichetti, F.; Dominguez-Carrió, C.; Toma, M.; Bavestrello, G.; Canese, S.; Bo, M. Assessment and distribution of seafloor litter on the deep Ligurian continental shelf and shelf break (NW Mediterranean Sea). Mar Pollut 2020, 151, 110872. [Google Scholar] [CrossRef] [PubMed]
  45. Anderson, M.J. Permutation tests for univariate or multivariate analysis of variance and regression. Can J Fish Aquat 2001, 58, 626–639. [Google Scholar] [CrossRef]
  46. Estaque, T.; Richaume, J.; Bianchimani, O.; Schull, Q.; Mérigot, B.; Bensoussan, N.; et al. Marine heatwaves on the rise: One of the strongest ever observed mass mortality event in temperate gorgonians. Glob Chang Biol 2023, 29, 6159–6162. [Google Scholar] [CrossRef] [PubMed]
  47. Previati, M.; Scinto, A.; Cerrano, C.; Osinga, R. Oxygen consumption in Mediterranean octocorals under different temperatures. J Experim Mar Biol Ecol 2010, 390, 39–48. [Google Scholar] [CrossRef]
  48. Ezzat, L.; Merle, P.L.; Furla, P.; Buttler, A.; Ferrier-Pages, C. The response of the Mediterranean gorgonian Eunicella singularis to thermal stress is independent of its nutritional regime. PLoS One 2013, 8, e64370. [Google Scholar] [CrossRef]
  49. Rodolfo-Metalpa, R.; Bianchi, C.N.; Peirano, A.; Morri, C. Tissue necrosis and mortality of the temperate coral Cladocora caespitosa. Ital J Zool 2005, 72, 271–276. [Google Scholar] [CrossRef]
  50. Cupido, R.; Cocito, S.; Barsanti, M.; Sgorbini, S.; Peirano, A.; Santangelo, G. Unexpected long-term population dynamics in a canopy-forming gorgonian coral following mass mortality. Mar Ecol Progr Ser 2009, 394, 195–200. [Google Scholar] [CrossRef]
  51. Rivetti, I.; Fraschetti, S.; Lionello, P.; Zambianchi, E.; Boero, F. Global warming and mass mortalities of benthic invertebrates in the Mediterranean Sea. PLoS One 2014, 9, e115655. [Google Scholar] [CrossRef]
  52. Enrichetti, F.; Bava, S.; Bavestrello, G.; Betti, F.; Lanteri, L.; Bo, M. Artisanal fishing impact on deep coralligenous animal forests: A Mediterranean case study of marine vulnerability. Ocean Coastal Manag 2019, 177, 112–126. [Google Scholar] [CrossRef]
  53. Russo, E.; Anelli Monti, M.; Toninato, G.; Silvestri, C.; Raffaetà, A.; Pranovi, F. Lockdown: how the COVID-19 pandemic affected the fishing activities in the adriatic sea (Central Mediterranean Sea). Front Mar Sci 2021, 8, 685808. [Google Scholar] [CrossRef]
  54. Giannakis, E.; Hadjioannou, L.; Jimenez, C.; Papageorgiou, M.; Karonias, A.; Petrou, A. Economic consequences of coronavirus disease (COVID-19) on fisheries in the eastern Mediterranean (Cyprus). Sustainability 2020, 12, 9406. [Google Scholar] [CrossRef]
  55. Coll, M.; Ortega-Cerdà, M.; Mascarell-Rocher, Y. Ecological and economic effects of COVID-19 in marine fisheries from the Northwestern Mediterranean Sea. Biol Conserv 2021, 255, 108997. [Google Scholar] [CrossRef] [PubMed]
  56. Dapueto, G.; Massa, F.; Costa, S.; Cimoli, L.; Olivari, E.; Chiantore, M.; Federici, B.; Povero, P. A spatial multi-criteria evaluation for site selection of offshore marine fish farm in the Ligurian Sea, Italy. Ocean Coast Manag 2015, 116, 64–77. [Google Scholar] [CrossRef]
  57. FAO. International Guidelines for the Management of Deep-Sea Fisheries in the High Seas. Rome, 2009; 73p.
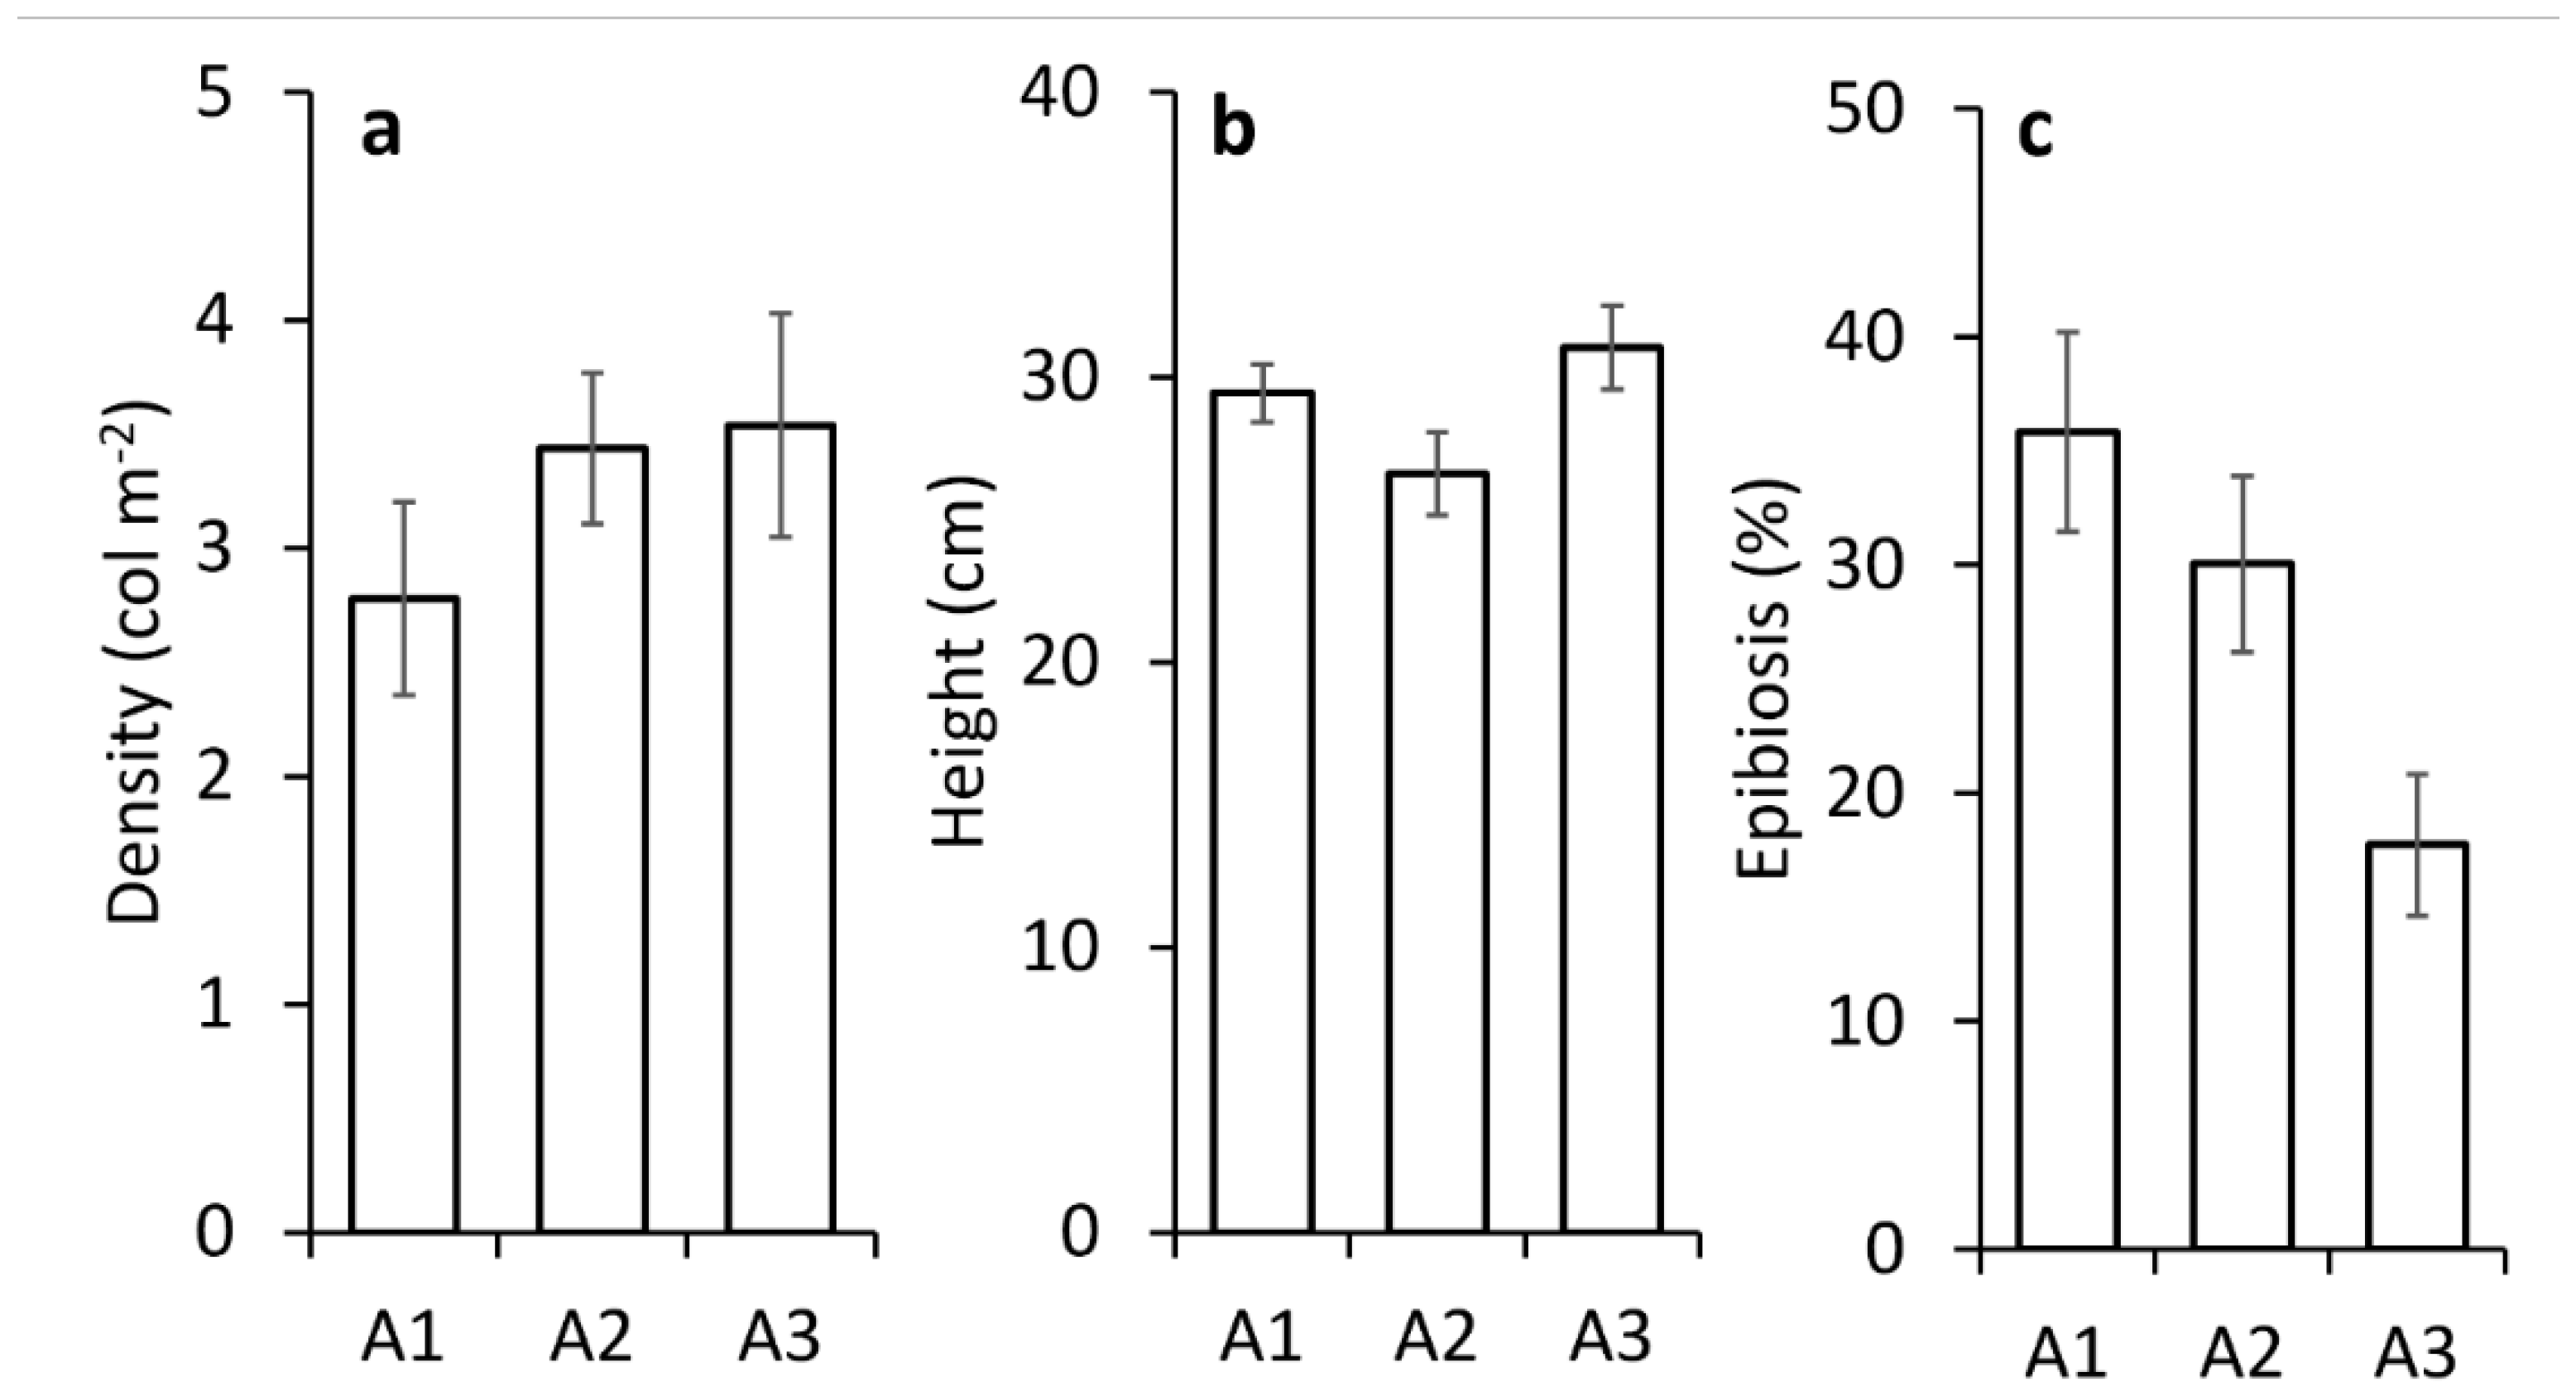
Figure 2. (a) Average density (± SE); (b) average height (± SE), and (c) average percentage of epibionted colonies (± SE) in the three macro-areas.
Preprints 109884 g002
Figure 3. Correlation of the percentage of epibionted colonies in the three macro-areas with the number of fishing harbours ((a), r = 0.98) and fishing boats ((b), r = 0.75) insisting in each macro-area.
Preprints 109884 g003
Figure 4. Bathymetric distribution of the percentage (a) of epibionted colonies and (b) of colonies entangled in lost fishing gear.
Preprints 109884 g004
Figure 5. Eastern macro-area (A1). Differences across time (Before, white bars/After, grey bars) obtained comparing data of (a) epibiosis and (b) entanglement in the same groups of transects replicated after 3–4 years. Inset: Percentage of transects that presented a positive (epibiosis/entanglement increasing, blue bars) or negative (epibiosis/entanglement decreasing, red bars) variation in the value of affected colonies in each considered period.
Preprints 109884 g005
Figure 6. Central macro-area (A2). Differences across time (Before, white bars/After, grey bars) obtained comparing data of (a) epibiosis and (b) entanglement in the same groups of transects replicated after 3–4 years. Inset: Percentage of transects that presented a positive (epibiosis/entanglement increasing, blue bars) or negative (epibiosis/entanglement decreasing, red bars) variation in the value of affected colonies in each considered period.
Preprints 109884 g006
Figure 7. Western macro-area (A3). Differences across time (Before, white bars/After, grey bars) obtained comparing data of (a) epibiosis and (b) entanglement in the same groups of transects replicated after 3–4 years. Inset: Percentage of transects that presented a positive (epibiosis/entanglement increasing, blue bars) or negative (epibiosis/entanglement decreasing, red bars) variation in the value of affected colonies in each considered period.
Preprints 109884 g007
Table 2. Results of ANOVA and pair-wise comparisons of Paramuricea clavata, density, colony height, and percentages of epibionted specimens in each macro-area. Bray-Curtis similarity index used for the resemblance matrix construction; permutation n = 9999. Significant effects are in bold.
df SS MS Pseudo-F P (perm) Pair-wises T P (perm)
Density
Macro-area 2 5201.1 2600.5 2.716 0.3686
Res 107 1.0245E+05 957.5
Total
Height Height
Macro-area 2 1360.9 680.44 35.551 0.0267 A1 vs A2 20.462 0.0357
Res 107 20480 191.4 A1 vs A3 0.70001 0.5049
Total 109 21840 A2 vs A3 22.188 0.0249
Epibiosis Epibiosis
Macro-area 2 11824 5912.2 38.355 0.006 A1 vs A2 12.312 0.1907
Res 107 1.65E+09 1541.4 A1 vs A3 2.721 0.0012
Total 109 1.77E+09 A2 vs A3 16.747 0.0545
Entanglement Entanglement
Macro-area 2 25589 12795 68.677 0.0001 A1 vs A2 37.941 0.0001
Res 107 1.99E+09 1863 A1 vs A3 19.837 0.0119
Total 109 2.25E+09 A2 vs A3 16.131 0.0553
Table 3. Results of PERMANOVA and pair-wise comparisons for the temporal analysis (Before/After) of percentage of epibiosis and entanglement of Paramuricea clavata in each replicated transect. Bray-Curtis similarity index used for the resemblance matrix construction; permutation n = 9999. Significant effects are in bold.
df SS MS Pseudo-F P (perm) Pair-wises t P (perm) Unique perms P (MC)
A1
Epibiosis
Before/After 5 11612 2322.3 29.303 0.0228 2015/19 40.632 0.027 35 0.0024
Res 20 15850 792.52 2016/19 20.984 0.0532 35 0.0529
Total 25 27462 2019/22 0.79759 0.502 126 0.4923
Entanglement
Before/After 5 18518 3703.6 21.411 0.0244 2015/19 27.952 0.0259 35 0.006
Res 20 34595 1729.7 2016/19 0.4955 0.7255 35 0.7313
Total 25 53113 2019/22 14.721 0.0794 126 0.1193
A2
Epibiosis
Before/After 5 23565 4713 46.103 0.001 2015/18 27.982 0.0135 462 0.0043
Res 32 32713 1022.3 2016/20 38.243 0.0287 35 0.0029
Total 37 56278 2018/22 0.516 0.709 8170 0.7162
Entanglement
Before/After 5 15630 3125.9 32.804 0.0031 2015/18 2.362 0.0203 461 0.0157
Res 32 30493 952.92 2016/20 0.59803 0.8289 35 0.6893
Total 37 46123 2018/22 30.371 0.0046 8150 0.0043
A3
Epibiosis
Before/After 5 9829.4 1965.9 12.736 0.2349 2015/18 18.318 0.0536 35 0.0779
Res 22 33959 1543.6 2016/20 11.444 0.2483 91 0.2815
Total 27 43788 2018/21 0.83113 0.6803 126 0.5607
Entanglement
Before/After 5 17345 3469 19.534 0.0293 2015/18 21.685 0.0855 35 0.0435
Res 22 39068 1775.8 2016/20 15.939 0.1094 91 0.1148
Total 27 56413 2018/21 15.329 0.0403 91 0.0872
Disclaimer/Publisher’s Note: The statements, opinions and data contained in all publications are solely those of the individual author(s) and contributor(s) and not of MDPI and/or the editor(s). MDPI and/or the editor(s) disclaim responsibility for any injury to people or property resulting from any ideas, methods, instructions or products referred to in the content.
Copyright: This open access article is published under a Creative Commons CC BY 4.0 license, which permit the free download, distribution, and reuse, provided that the author and preprint are cited in any reuse.
Prerpints.org logo

Preprints.org is a free preprint server supported by MDPI in Basel, Switzerland.

Subscribe

© 2024 MDPI (Basel, Switzerland) unless otherwise stated