1. Introduction
The propagation of Covid 19 has proven to be a challenge for most countries in the world. Even developed countries have faced problems in data manipulation, massive testing methodologies, measuring the effectiveness of different contention policies such as nonpharmacological measures (lock downs, vehicle restrictions, etc) and the timing of reopening policies Haffajee et al. (2020). These tasks are difficult for the richest countries, but due to a lack of resources and social and economic problems, the testing methods in developing countries seem to be extremely limited, a problem enhanced by a more urgent economic recovery Ebrahim et al. (2021). Limited testing leads to a lack of prediction mathematical tools.
As discussed, for example, in Roda et al. (2020), the predictive value of propagation models can be affected by the lack of reliable information used to calibrate the models. Consequently, in many cases, the severity of COVID-19 propagation in developing countries is relatively unknown if compared to the more reliable information provided by higher-income nations (Levin et al., 2022). Predominantly reactive testing methodologies could be seen as a clear signal of under-reporting (Hasell et al., 2020), as the only confirmed cases are patients who require hospitalization, while asymptomatic or slightly affected patients remain undetected (Alene et al., 2021). Because of this incomplete data, model calibration may be insufficient, and analysis of the effectiveness of non-pharmacological measures is a challenge for health institutions as they are provided with a narrow criterion for decision-making. In this paper, we propose a simple metric, based on Benford distribution (Koch & Okamura, 2020), to evaluate the reliability of data from different sources for the Costa Rican case. We show that countries such as Costa Rica, which provide universal health care, have very useful and reliable data on hospitalizations despite lack of reliable information on the number of cases. Although this information should not be used to model the pandemic spread, it can be used as a metric to measure the effectiveness of nonpharmacological measures as they may impact the number of persons that require specialized healthcare. We propose a simple digital signal processing methodology which can be executed with free software, to eliminate data noise (due to the stochastic nature of the phenomena) and pick smoother, more general tendencies of data. We use Octave (Eaton, 2012), a free tool with low computational demands to guarantee reproducible results. As far as we know, descriptive analysis of pandemic data are mainly based on Rt number which is mainly based on active cases.
2. Materials and Methods
2.1. Evaluating Active Cases Information
We use Benford’s law to assess the reliability of the different databases provided by the Costa Rican government during the spread of COVID-19. Benford’s law, also known as the first diatom law, is a statistical phenomenon that predicts the frequency distribution of the leading digits in many sets of numerical data. This law has been used in various fields, including auditing and forensic accounting, to detect anomalies or fraud (Grammatikos & Papanikolaou, 2021), and in the context of the COVID-19 pandemic, we can apply Benford’s law to the reported case numbers. According to the law, the leading digit of these numbers (ignoring the zeros) should follow a certain distribution: about 30% should start with digit 1, 17.6% with 2, and so on, with each subsequent number having a lower frequency. If the reported COVID-19 case numbers significantly deviate from this expected distribution, it could suggest inaccuracies or manipulation in data reporting. This could be due to various factors, such as under-reporting, over−reporting, or delays in reporting. (Campolieti, 2022; Kolias, 2022). Noncompliance with the Benford distribution, however, can be a sign of mistrust in the reliability of the data to be used in a propagation or machine learning model and its ability as a decision-making tool (Koch & Okamura, 2020).
Benford’s law predicts the frequencies of different digits in data that are not constructed by the human or a machine according to the following relation for each digit
d.
where
d is the leading digit of each cipher. We use the number of confirmed cases for the Costa Rican case, publicly available at (COVID-19 30 de mayo (ministeriodesalud.go.cr)). We use the following comparison metric between the observed histogram
and the theoretical values
, known as the mean absolute deviation (MAD):
As shown in
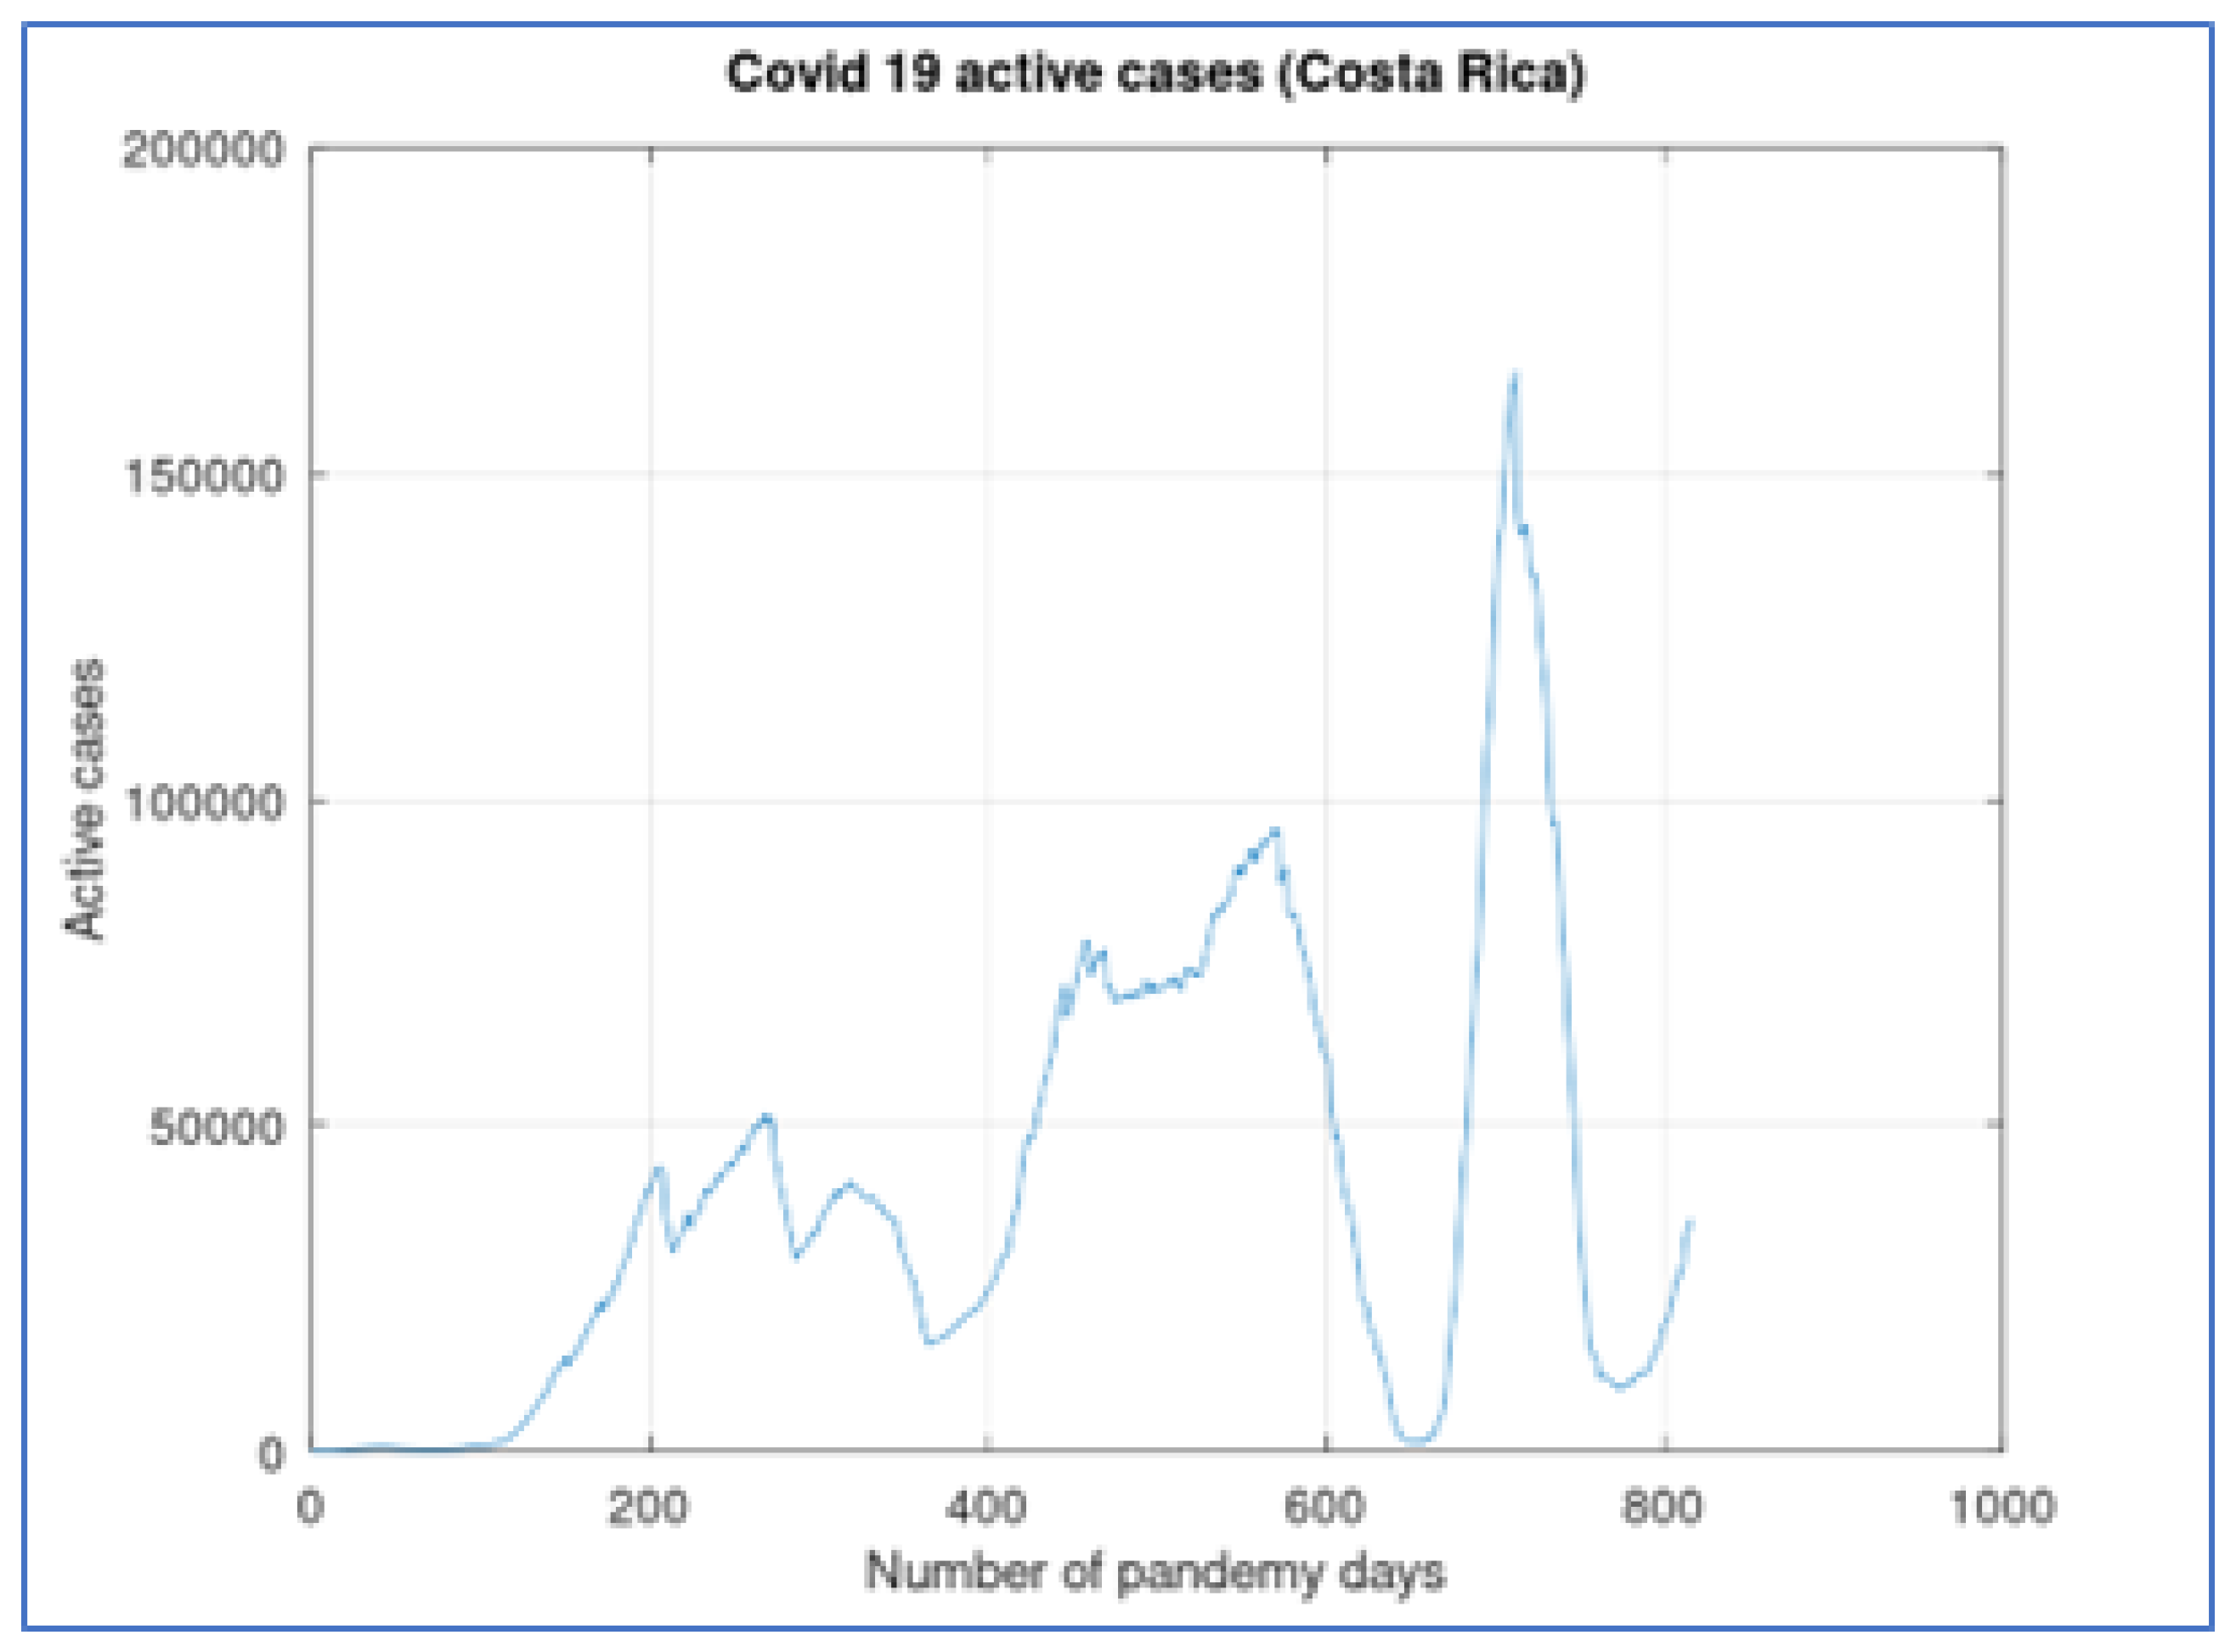
Figure 1, the number of active cases in Costa Rica, during the first 816 days of widespread pandemic, presents three main waves (from day 0 to 400, approximately, another wave from day 400 to 625 and a third wave with the highest values from day 625 to the end). These waves present small subwaves in which the behavior is not smooth (this is especially visible in the first wave) with changes that may be due to changes in testing policy and not a consequence of the dynamics of the pandemic.
The first positive case of covid in Costa Rica was registered on March 6, 2020. It is considered day zero of the pandemic.
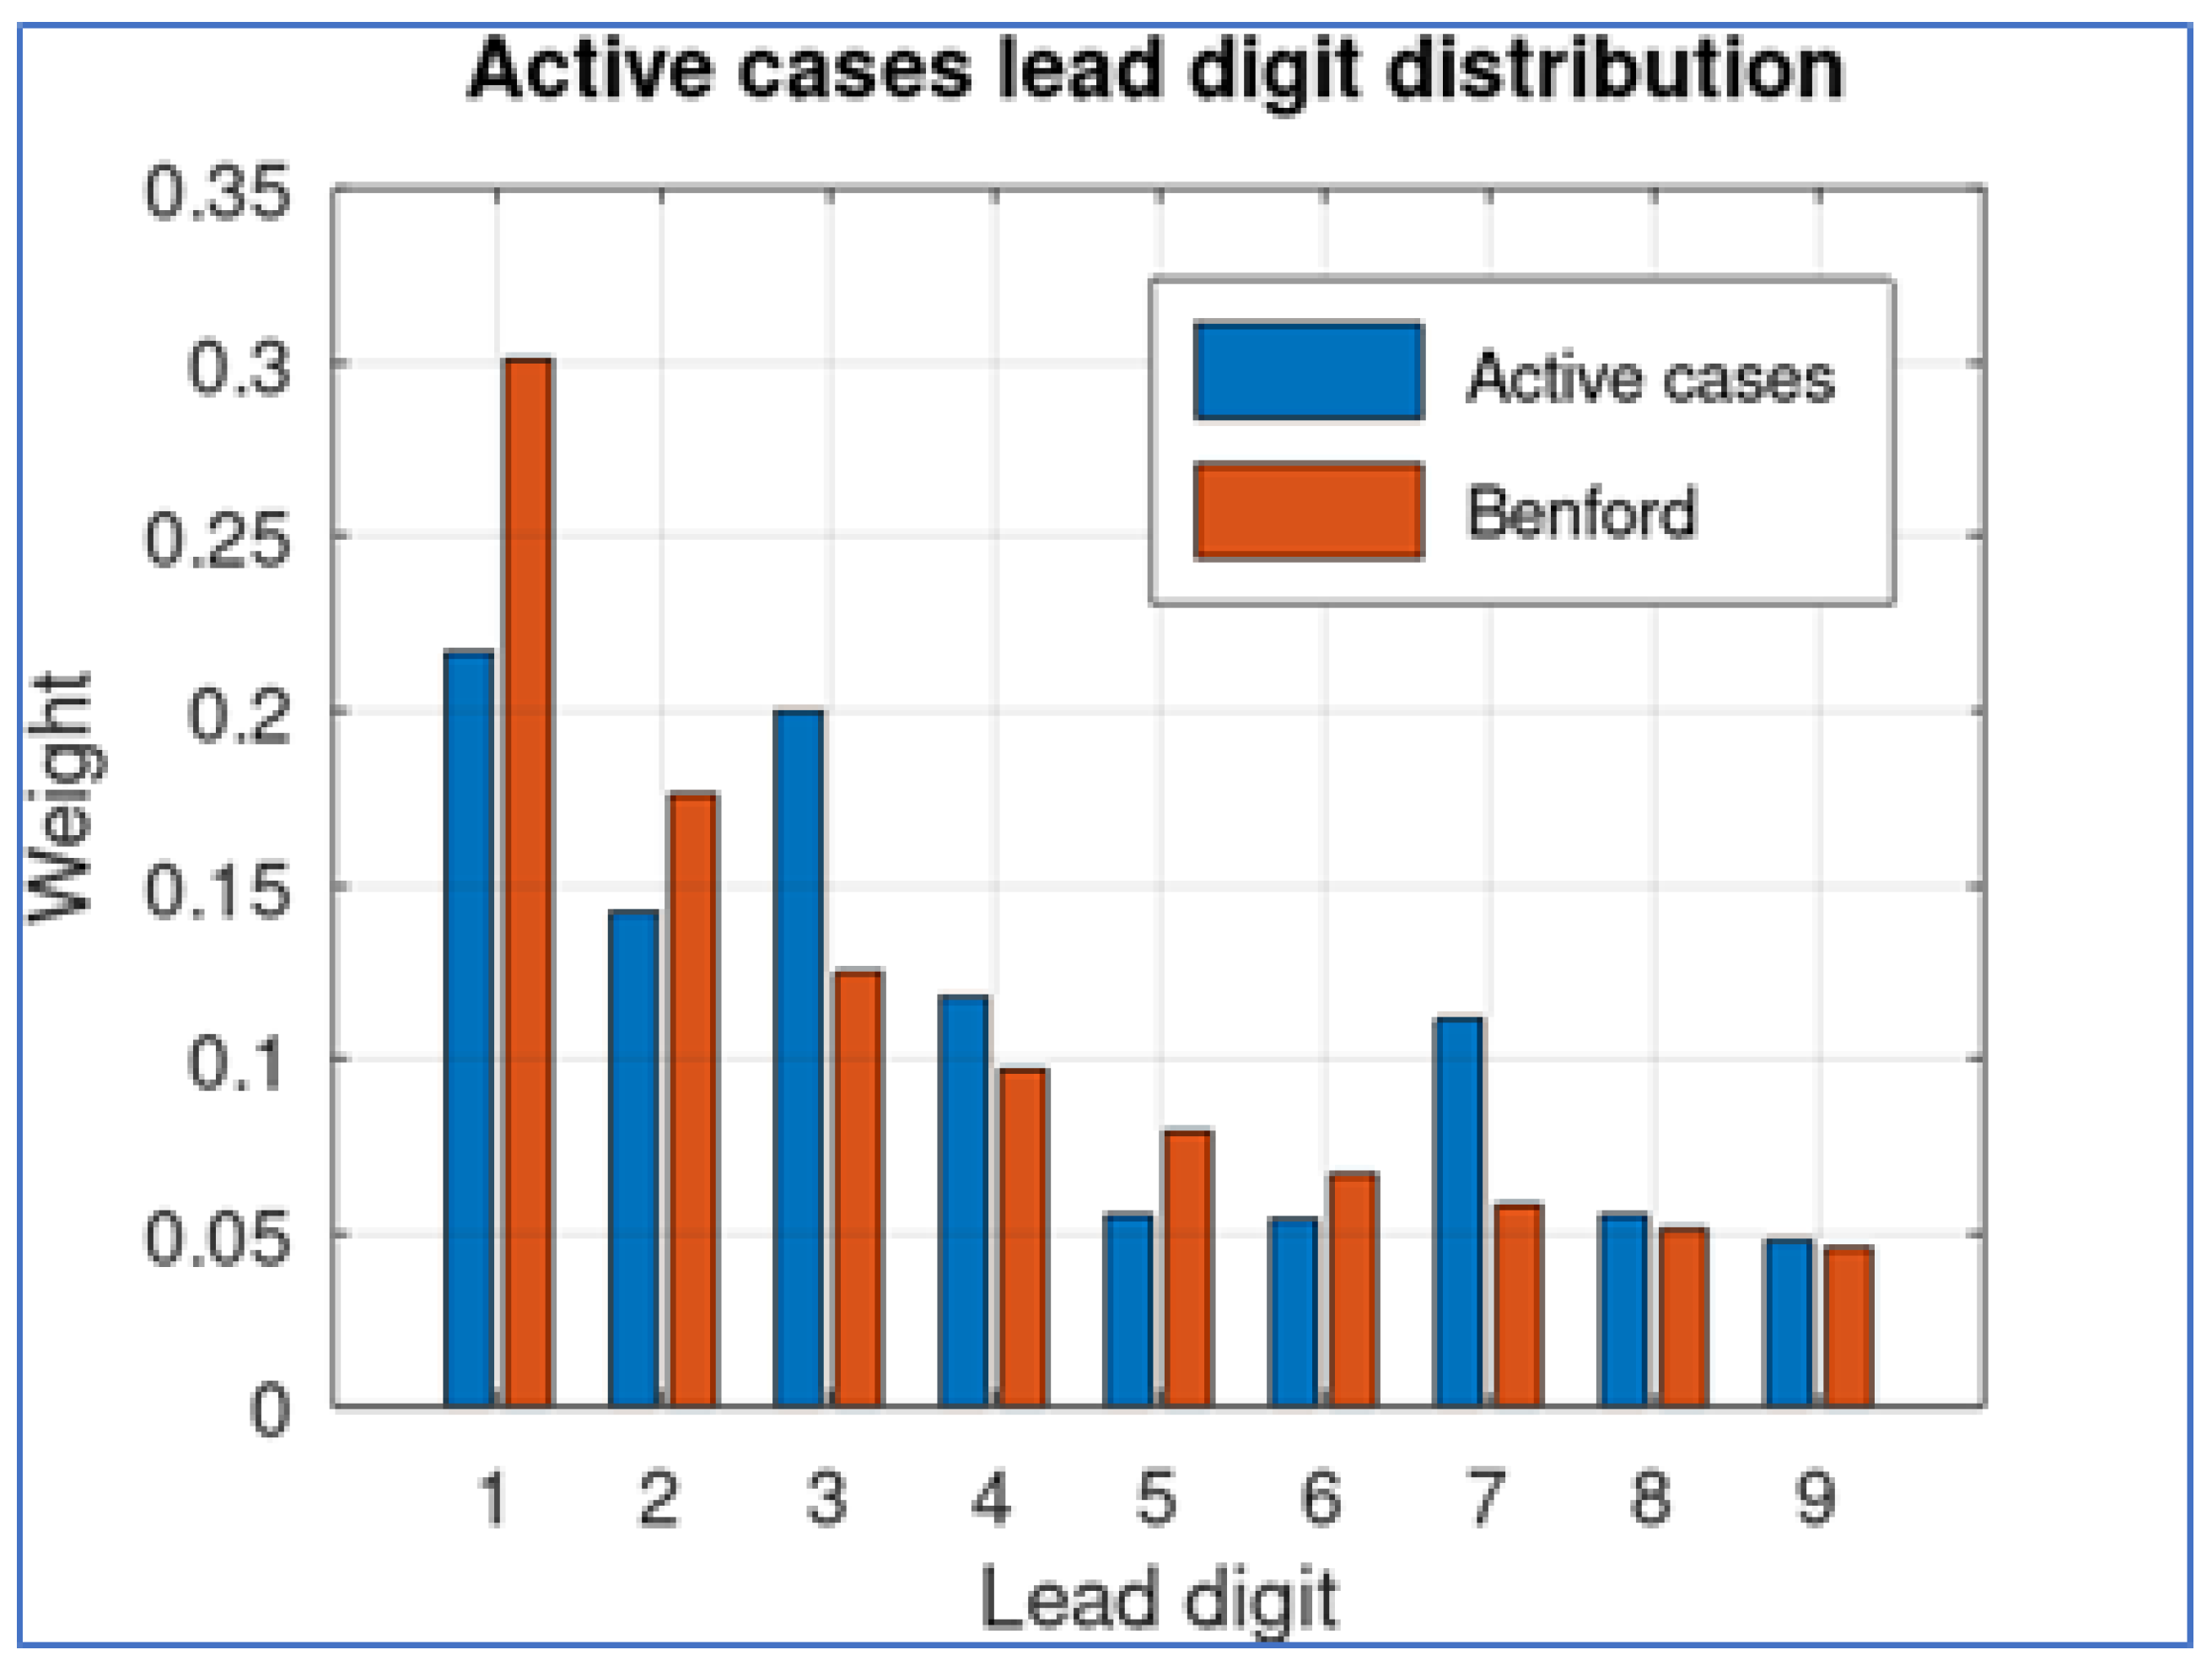
To provide support for this assertion, we take this data set and obtain the lead digit of each quantity, comparing its distribution with the corresponding theoretical Benford distribution. The result is shown in
Figure 2.
The results show that the digits 1 and 2 are underrepresented while digit 7 seems to be over-represented. The MAD difference (Equation (
2)) between both distributions is 0.034.
2.2. First Wave, the Hammer and the Dance (100 First Days)
Unlike other countries, the first COVID-19 in Costa Rica produced early contention measures by the government. A few days after the first, schools were closed and a vehicular restriction was applied. The first 100 days of virus propagation produced very few cases, and this is evident in
Figure 1. However, these contention measures were relaxed around month, the third month and an increase of the virus widespread began. During these days, the official policy was to apply aggressive contentions in different periods of time, a measure supported by a multilayer network model (Sanchez et al., 2022). In this section we explore the possibility that these early measures may have an impact in non-Benford conformity of the active cases. We used a simple SEICR model to simulate the first 100 days of the pandemic in which contention measures were applied and the impact on the population was minimized (De-Camino-Beck, 2020):
Where the variables represent:
S is the number of susceptible,
E, exposed,
I infected, and
R recovered or deceased. Variable
C represents the number of confined individuals, as a fraction of the susceptible population. When the contention measures were relaxed, this population affects the change rate in the susceptible population:
As far as we know, this model was the only one during the first days of pandemic widespread, publicly available to make projections. We adjust this model to the first 100 days of pandemic widespread obtaining:
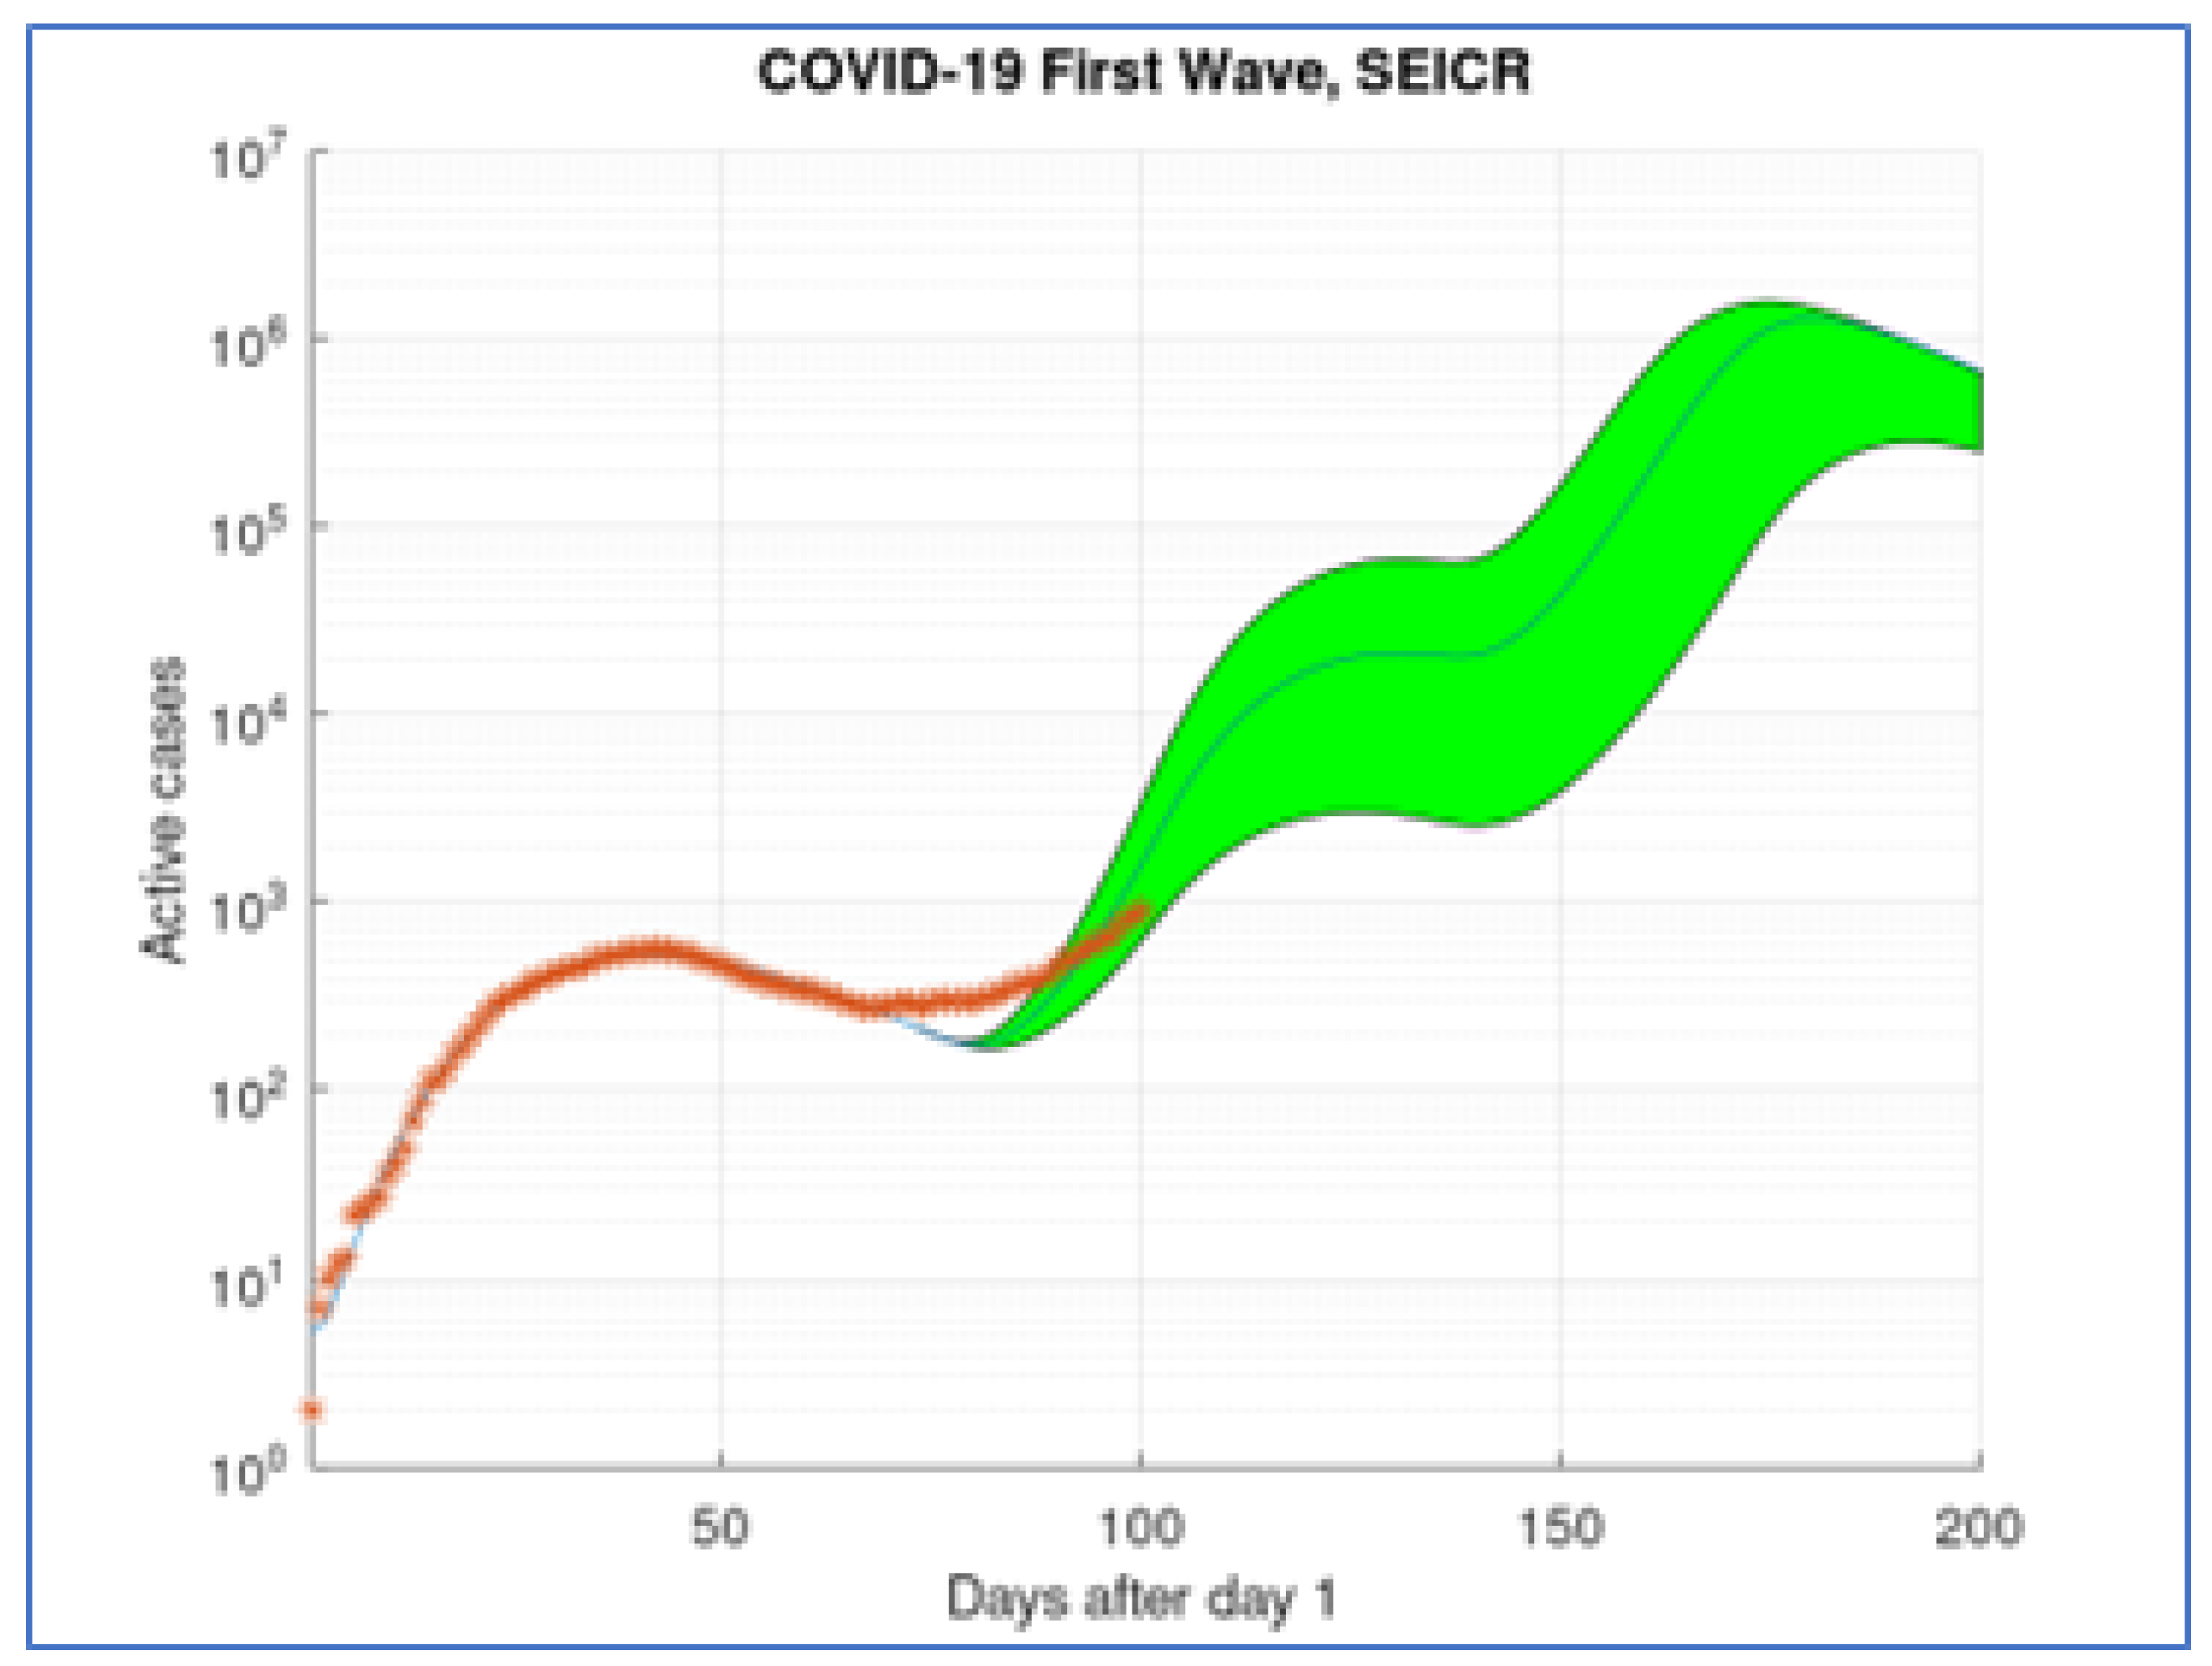
. After these first days we apply a theoretical monthly hammer and dance ”policy” to obtain the result shown in
Figure 3.
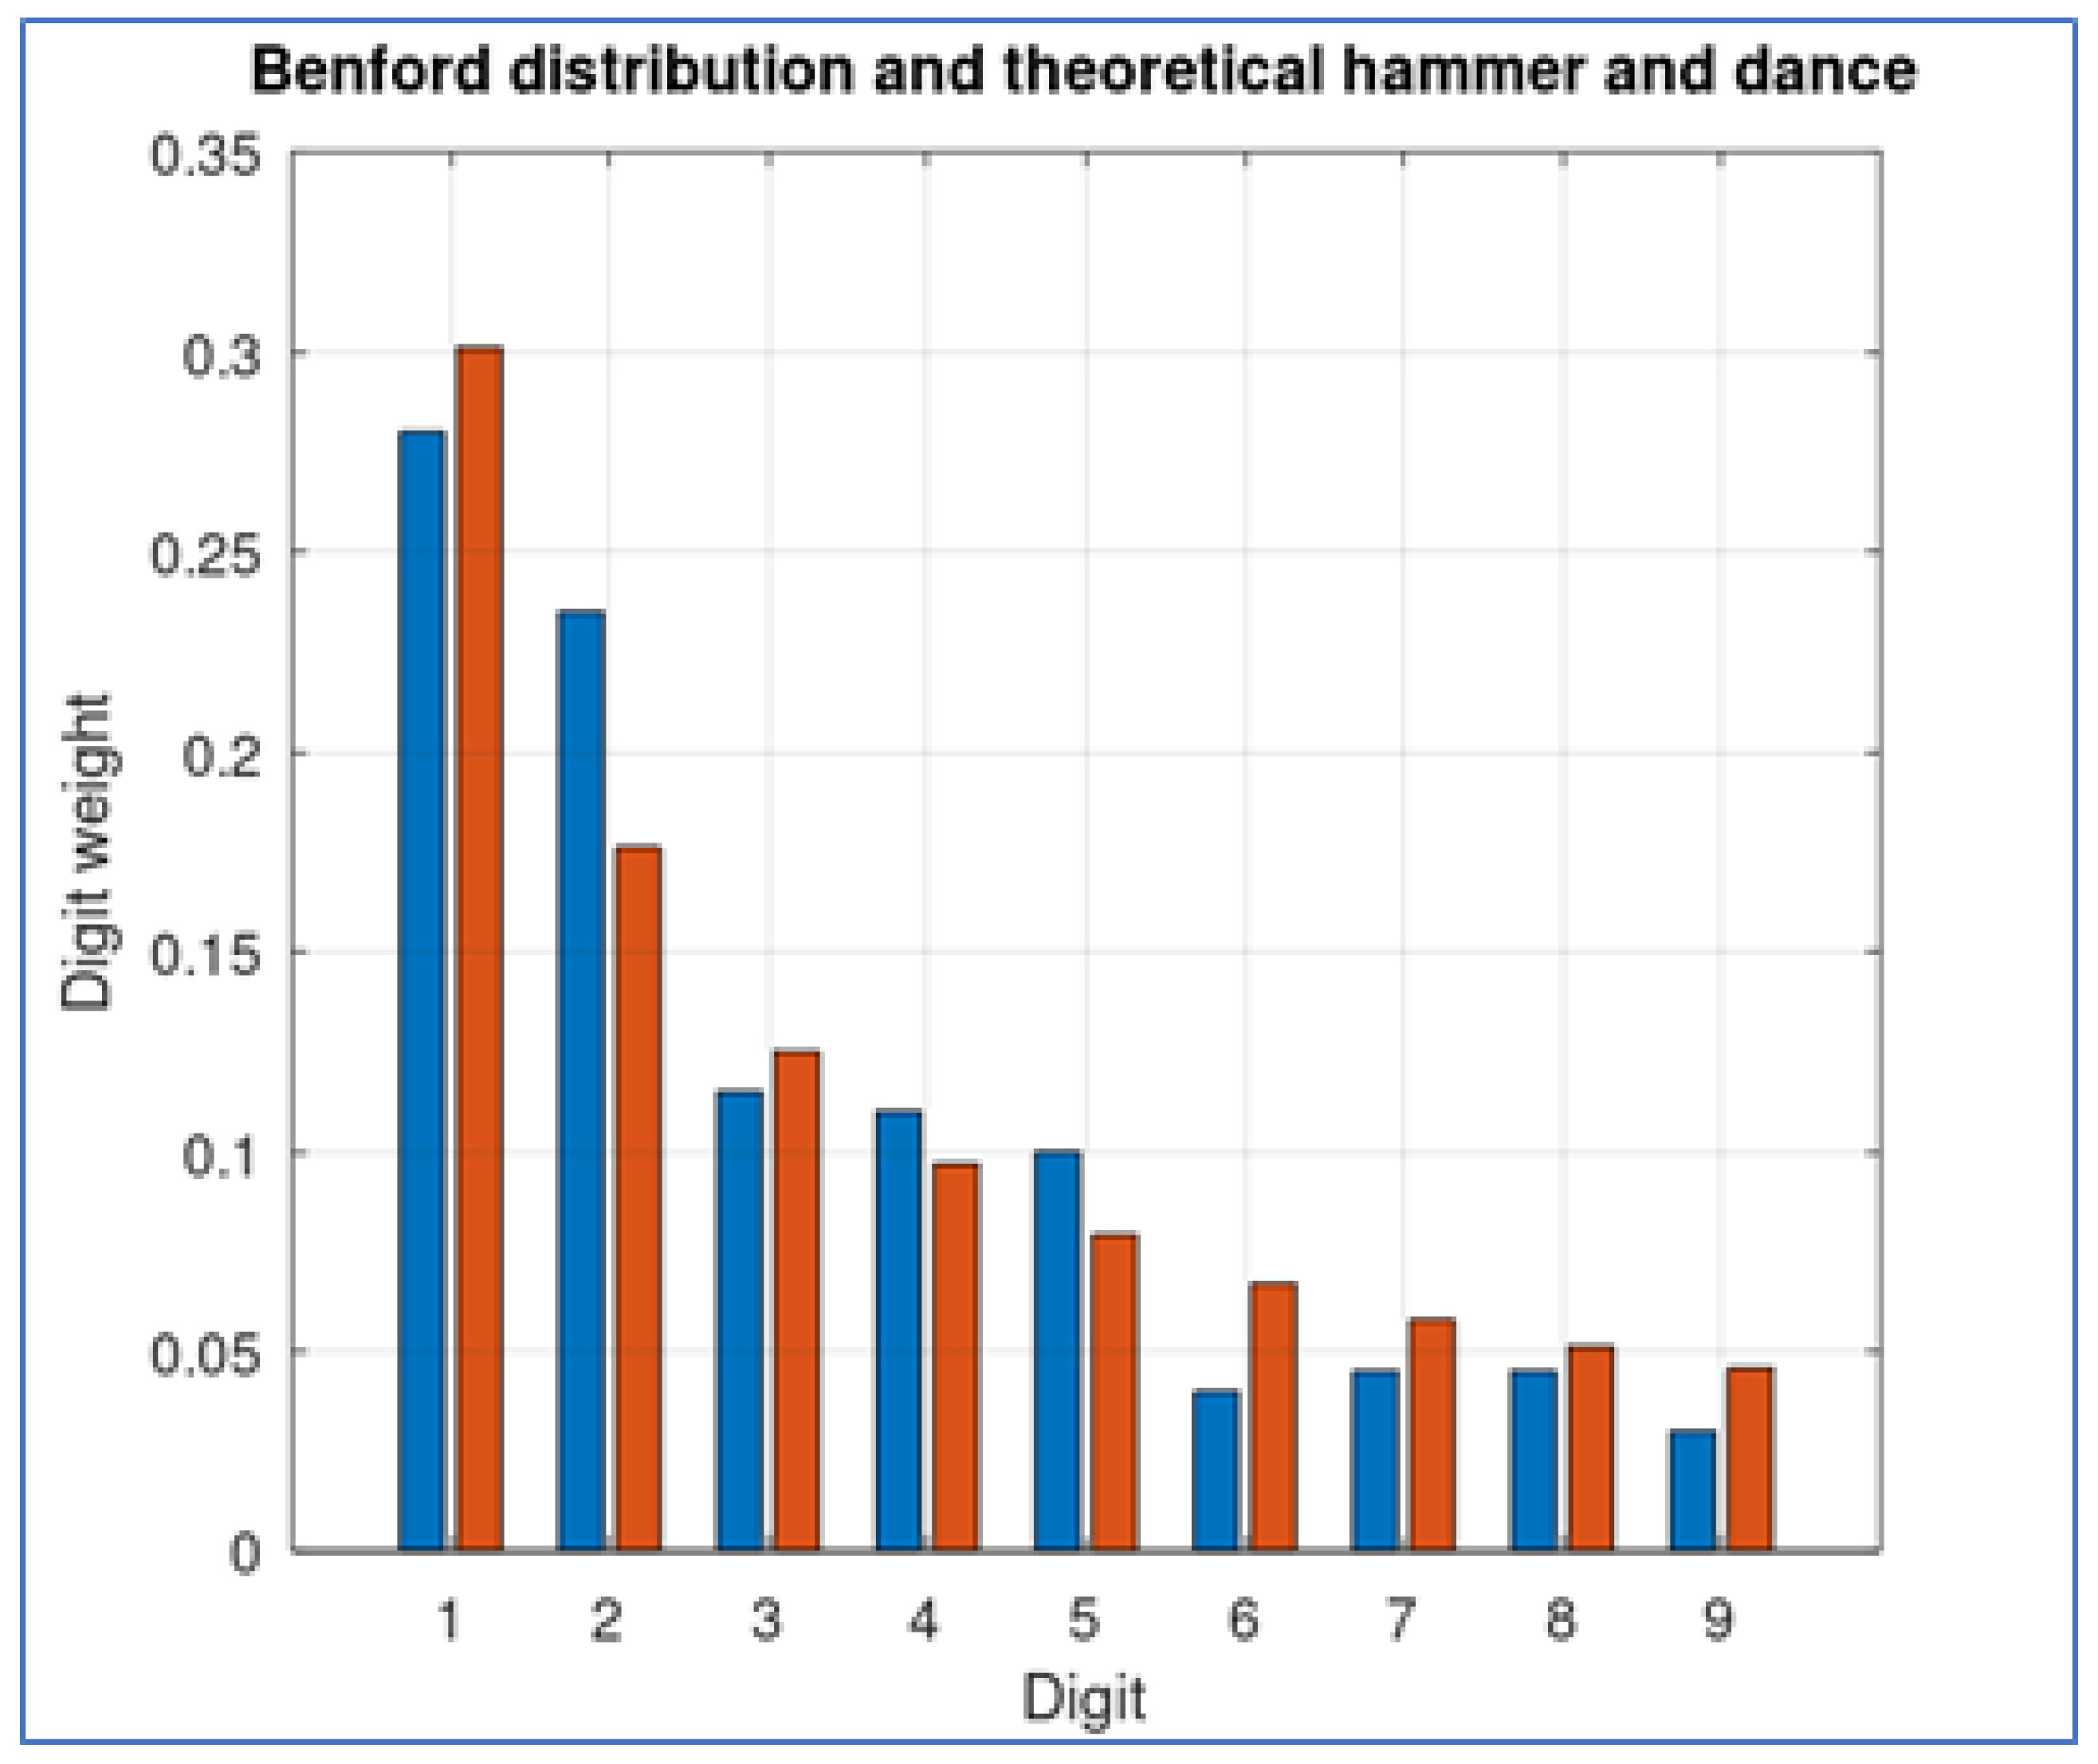
Even though this theoretical model produces oscillations in the number of active cases, its conformity to Benford distribution is better than the active cases database (
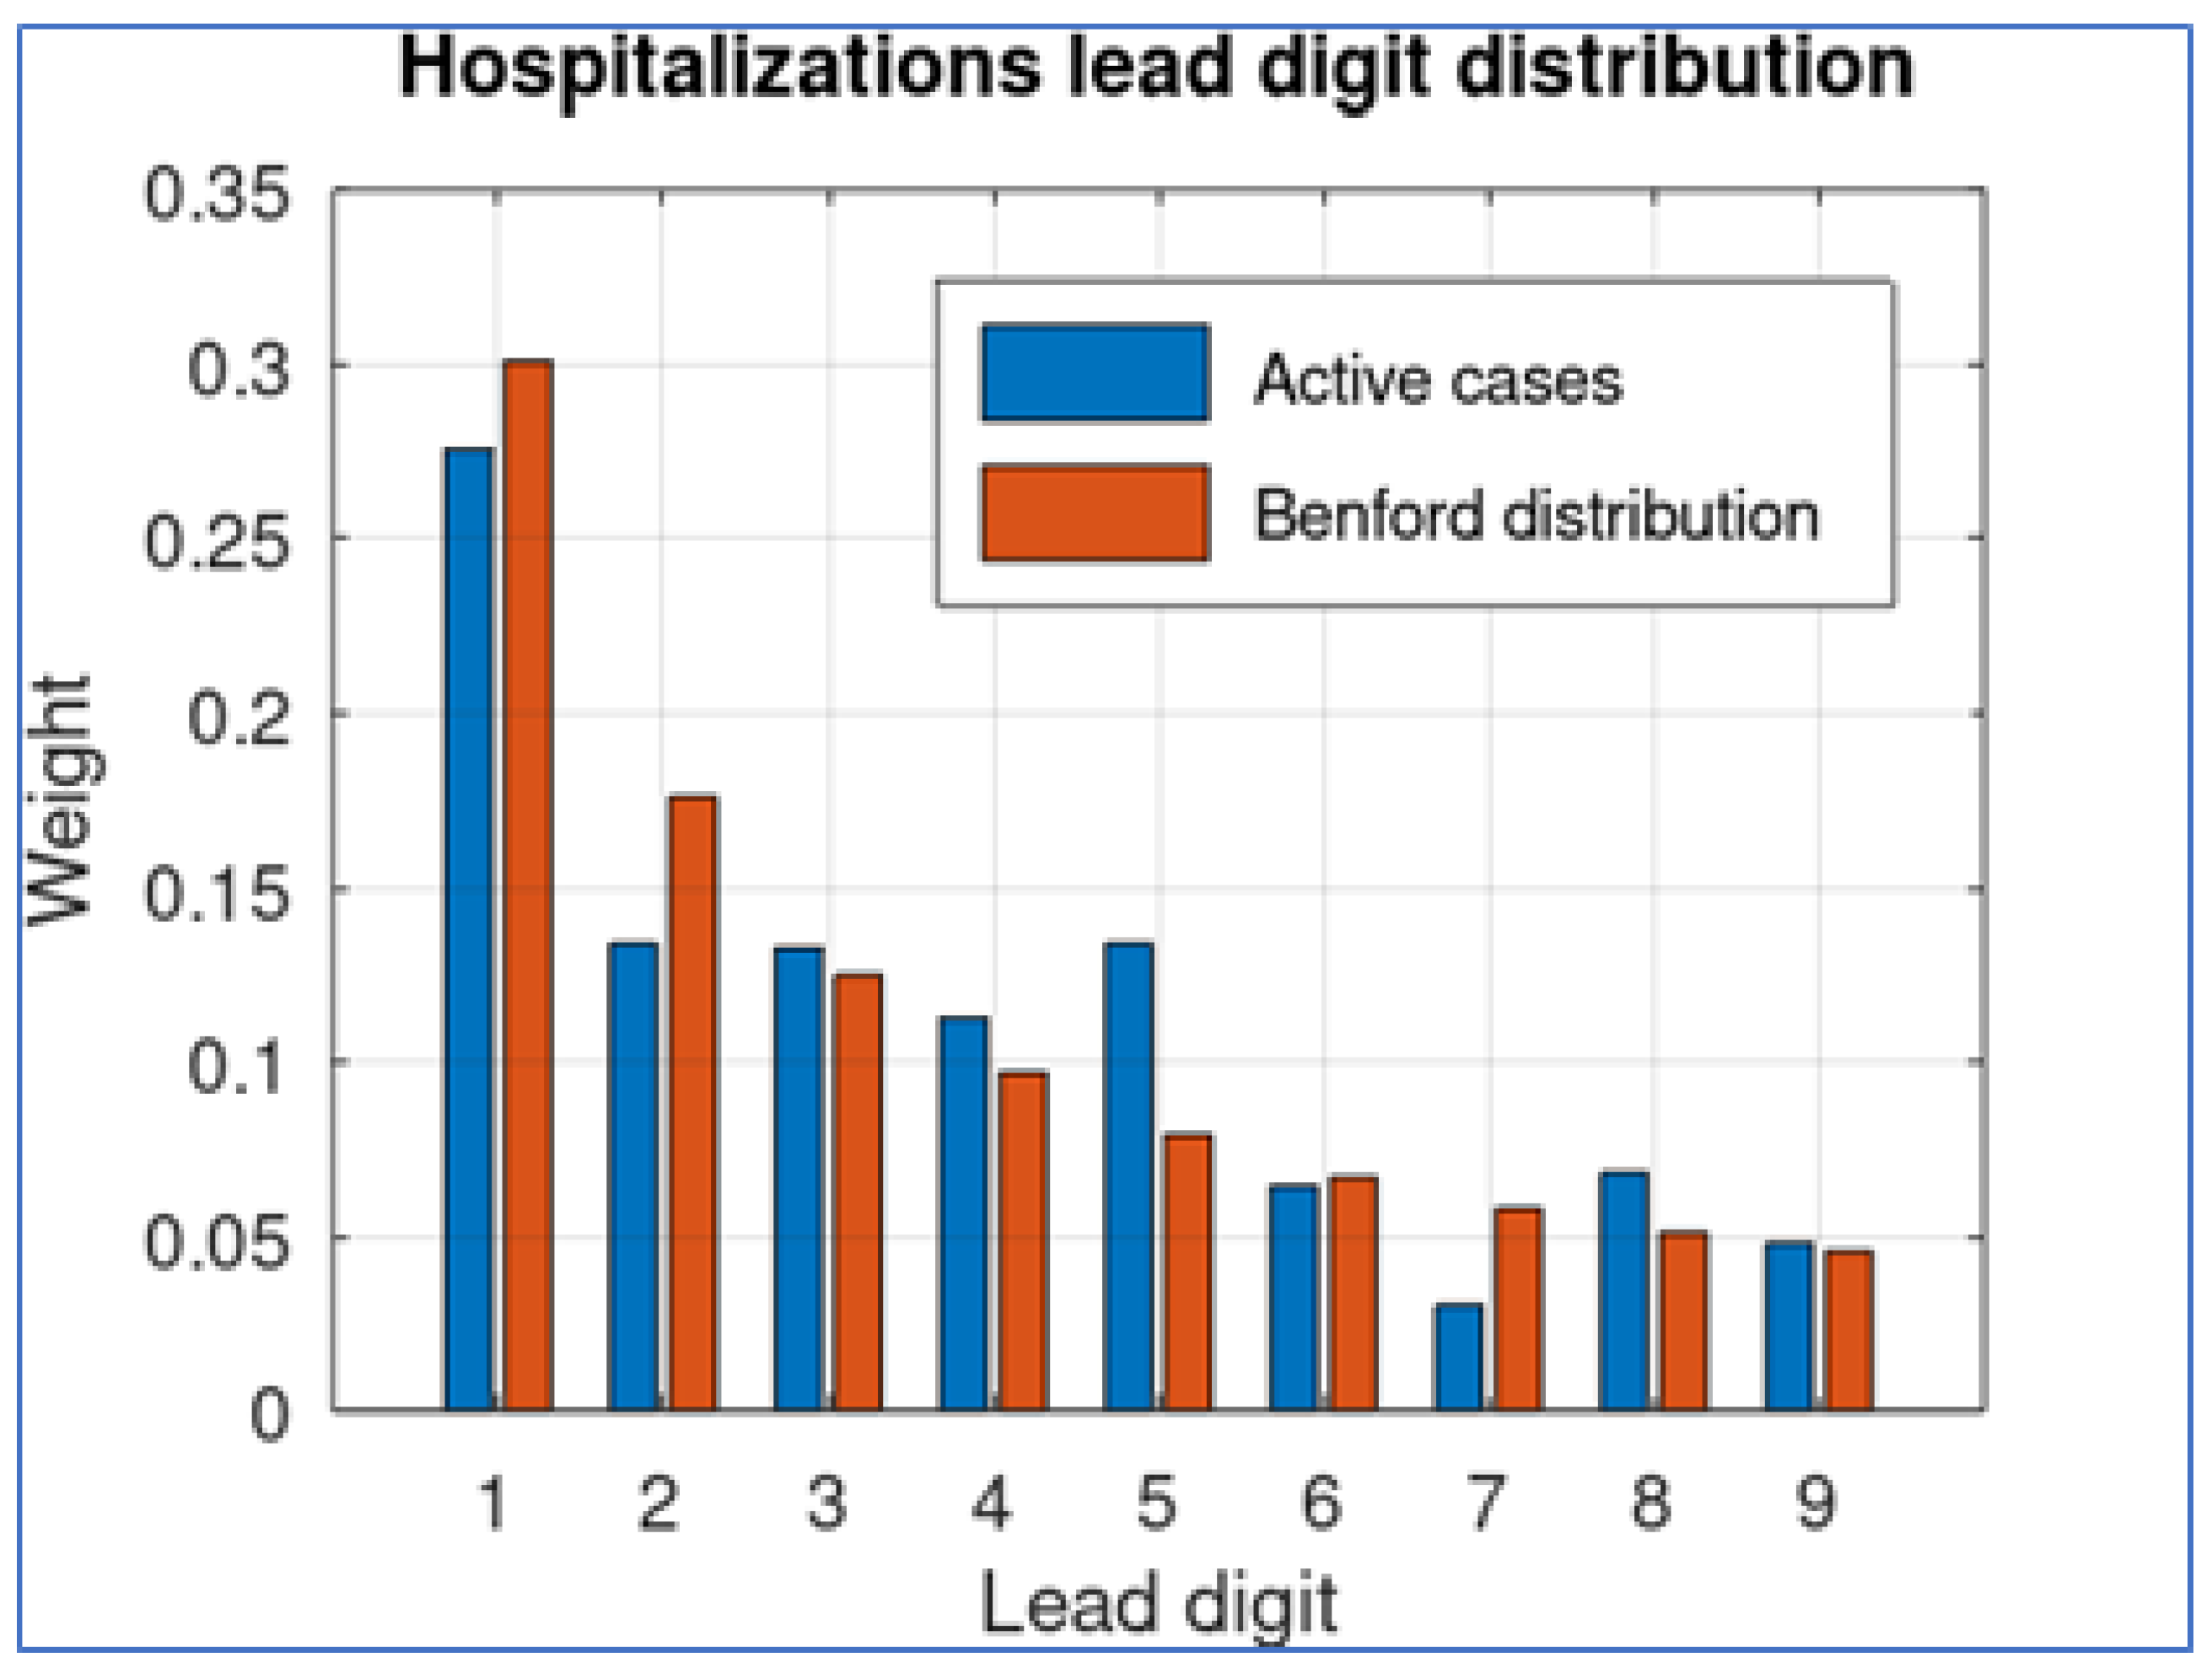
Figure 4) (with a distance of 0.020626).
We use this practical case to assert that, even though non-conformity to Benford distribution can be expected as a consequence to contention measures, the deviation of the real data is larger than what we could expect. In fact, the distance between distributions we obtain with this theoretical approach is very similar to the Benford conformity of the hospitalization data (as we show in the next section).
2.3. Hospitalizations Dataset
One of the key factors contributing to the reliability of COVID-19 hospitalization data in Costa Rica is the centralized nature of its healthcare system. With a single-payer universal healthcare system managed by the Costa Rican Social Security Fund (CCSS), information on hospitalizations is collected, managed, and reported through a centralized platform. This centralized approach ensures consistency and uniformity in data collection practices throughout the country, minimizing discrepancies and reporting errors. The hospitalization data curve is shown in
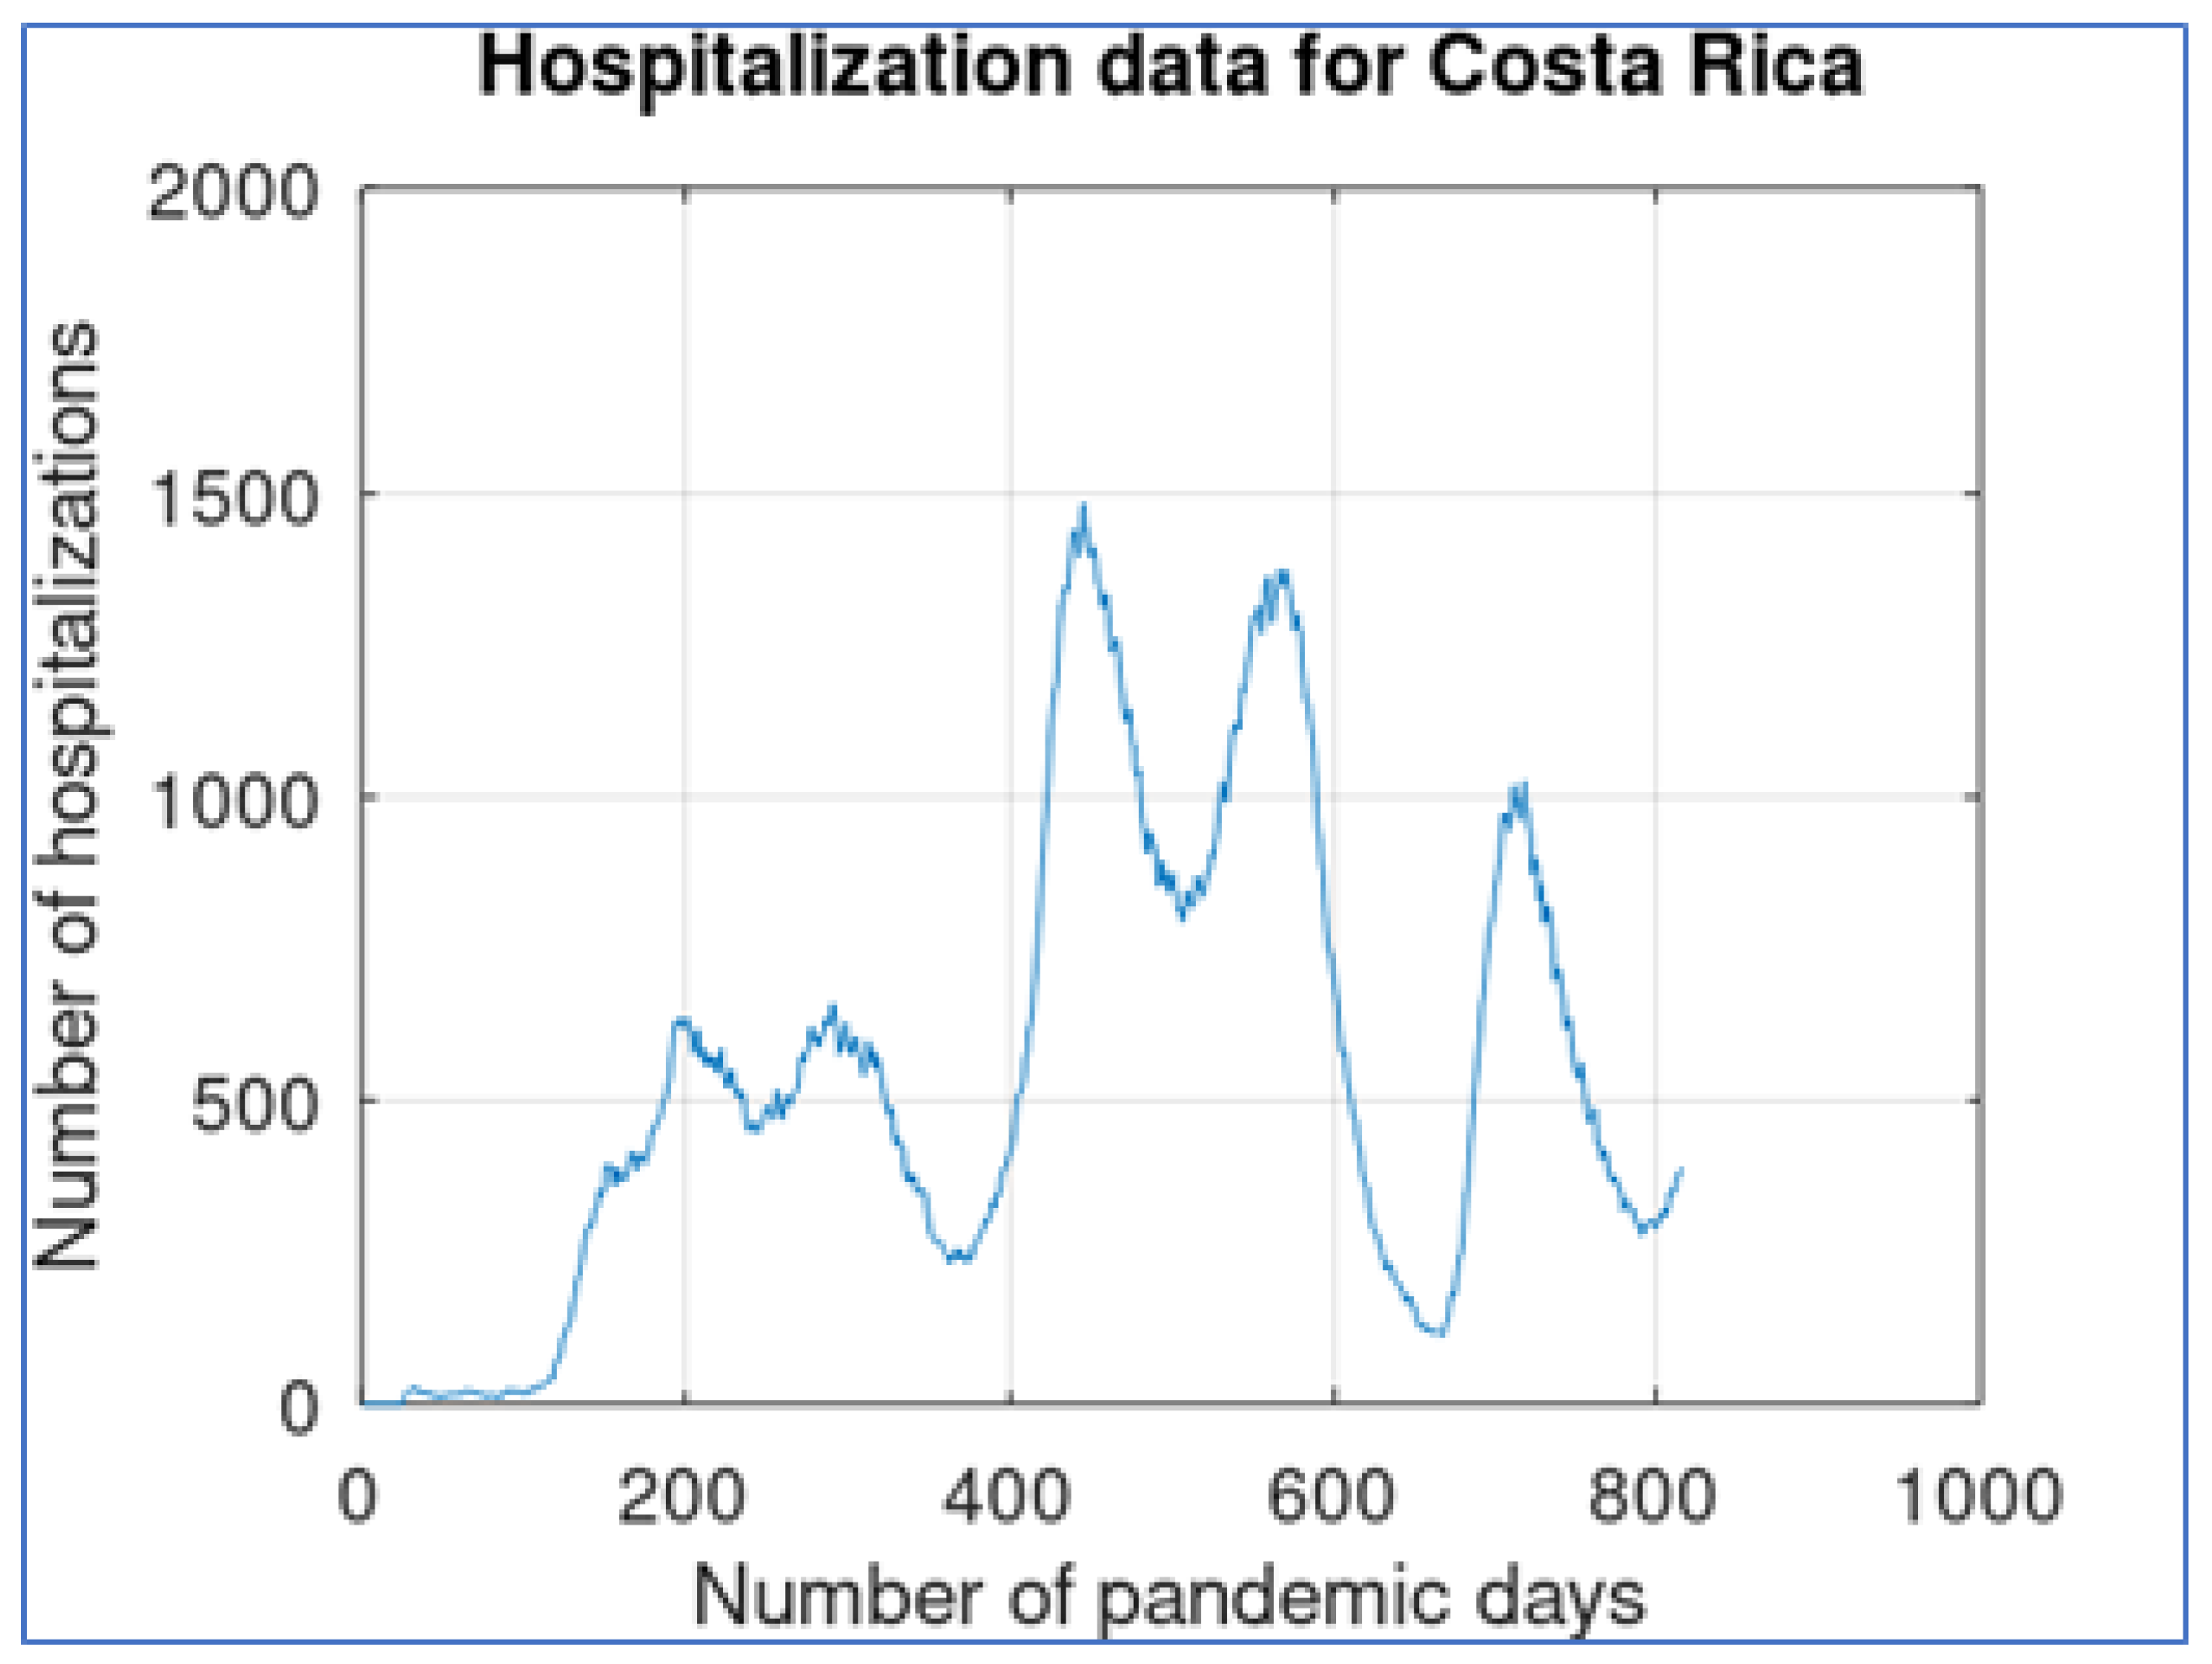
Figure 5.
The shape of this curve is similar to what is shown in
Figure 1, but the three main waves contain smoother sub-waves and there are at most two of them. As shown in
Figure 4, the lead-digit distribution for the hospitalization data provides a better fit to Benford distribution, with a small overrepresentation of digit 5 (possibly because of rounding number procedures). The MAD distance between the lead-digit distribution and Benford distribution is remarkably smaller: 0.0217.
It is important to note that not conforming to Benford’s Law does not necessarily indicate data manipulation. There are many legitimate reasons why a dataset might not follow Benford’s distribution. For instance, the data might not be naturally occurring, or it might be influenced by maximum or minimum limits, or the data might not be distributed across multiple orders of magnitude. We remark that both obtained do not satisfy the marginally acceptable criterion to be considered a marginally acceptable fit (Mark J. Nigrini, 2011), but we are comparing reliability of available data.
2.4. Processing Available Reliable Information
As we have assessed, the number of active cases data set for the case of Costa Rica can be considered at least incomplete and at most unreliable. This may lead to biased estimators. For example, the reproductive number Rt, a key parameter in epidemiology, is used to measure the transmission potential of a disease. It represents the average number of secondary infections produced by a typical case of infection in a population where everyone is susceptible (Cori et al., 2013; Heidrich et al., 2020; Obadia et al., 2012; Thompson et al., 2019). The estimation of Rt can be significantly impacted due to the quality of the data sets used. These data sets may be inaccurate in several orders of magnitude due to deficient testing policies, leading to a skewed understanding of the spread of the disease (Rosero-Bixby & Miller, 2021). Instead, we propose a simpler approach based on the general tendencies of the hospitalization data shown in
Figure 3. Our analysis is based on the following general principles.
Hospitalization data only represent a fraction of the total number of contagious individuals in a population. This is because not all infected individuals require hospitalization. Many cases, especially those that are mild or asymptomatic, may not seek medical attention and therefore are not included in hospitalization data (Wolf et al., 2022). However, an increase in the number of hospitalizations mirrors the spread of a larger disease, although it is impossible to assume a constant direct proportionality. Therefore, the number of hospitalizations and the corresponding rate change provide an indication of mitigation measures.
The stochastic nature of the hospitalization data set produces high-frequency changes that do not correspond to a general trend and should not be considered. Our approach should consider only smooth, low-resolution tendencies of hospitalization data, ignoring high-resolution details.
We applied a wavelet multiresolution analysis, which allows one to filter fine details and take only the general tendency of the sequence. The main principle of a wavelet multiresolution analysis consists of iteratively decomposing the signal (in this case, hospitalization data) at different levels of resolution, usually two branches per iteration (Guo et al., 2022). One of these branches corresponds to details, while the other branch is decomposed again. After each iteration, the number of entries in the signal is divided by 2, and this is why this process is called downscaling. The downscaling consists of two main operators: a convolution (which depends on the chosen wavelet basis) and a decimation (which selects only half of the sequence entries). The process is invertible, and the signal can be recovered again in an upscaling sequence of operations (incrementing the signal dimension by inserting 0’s and applying a new convolution). The reconstruction process can be executed suppressing high-frequency details, and the result is a smooth signal that represents the general tendency of the signal.
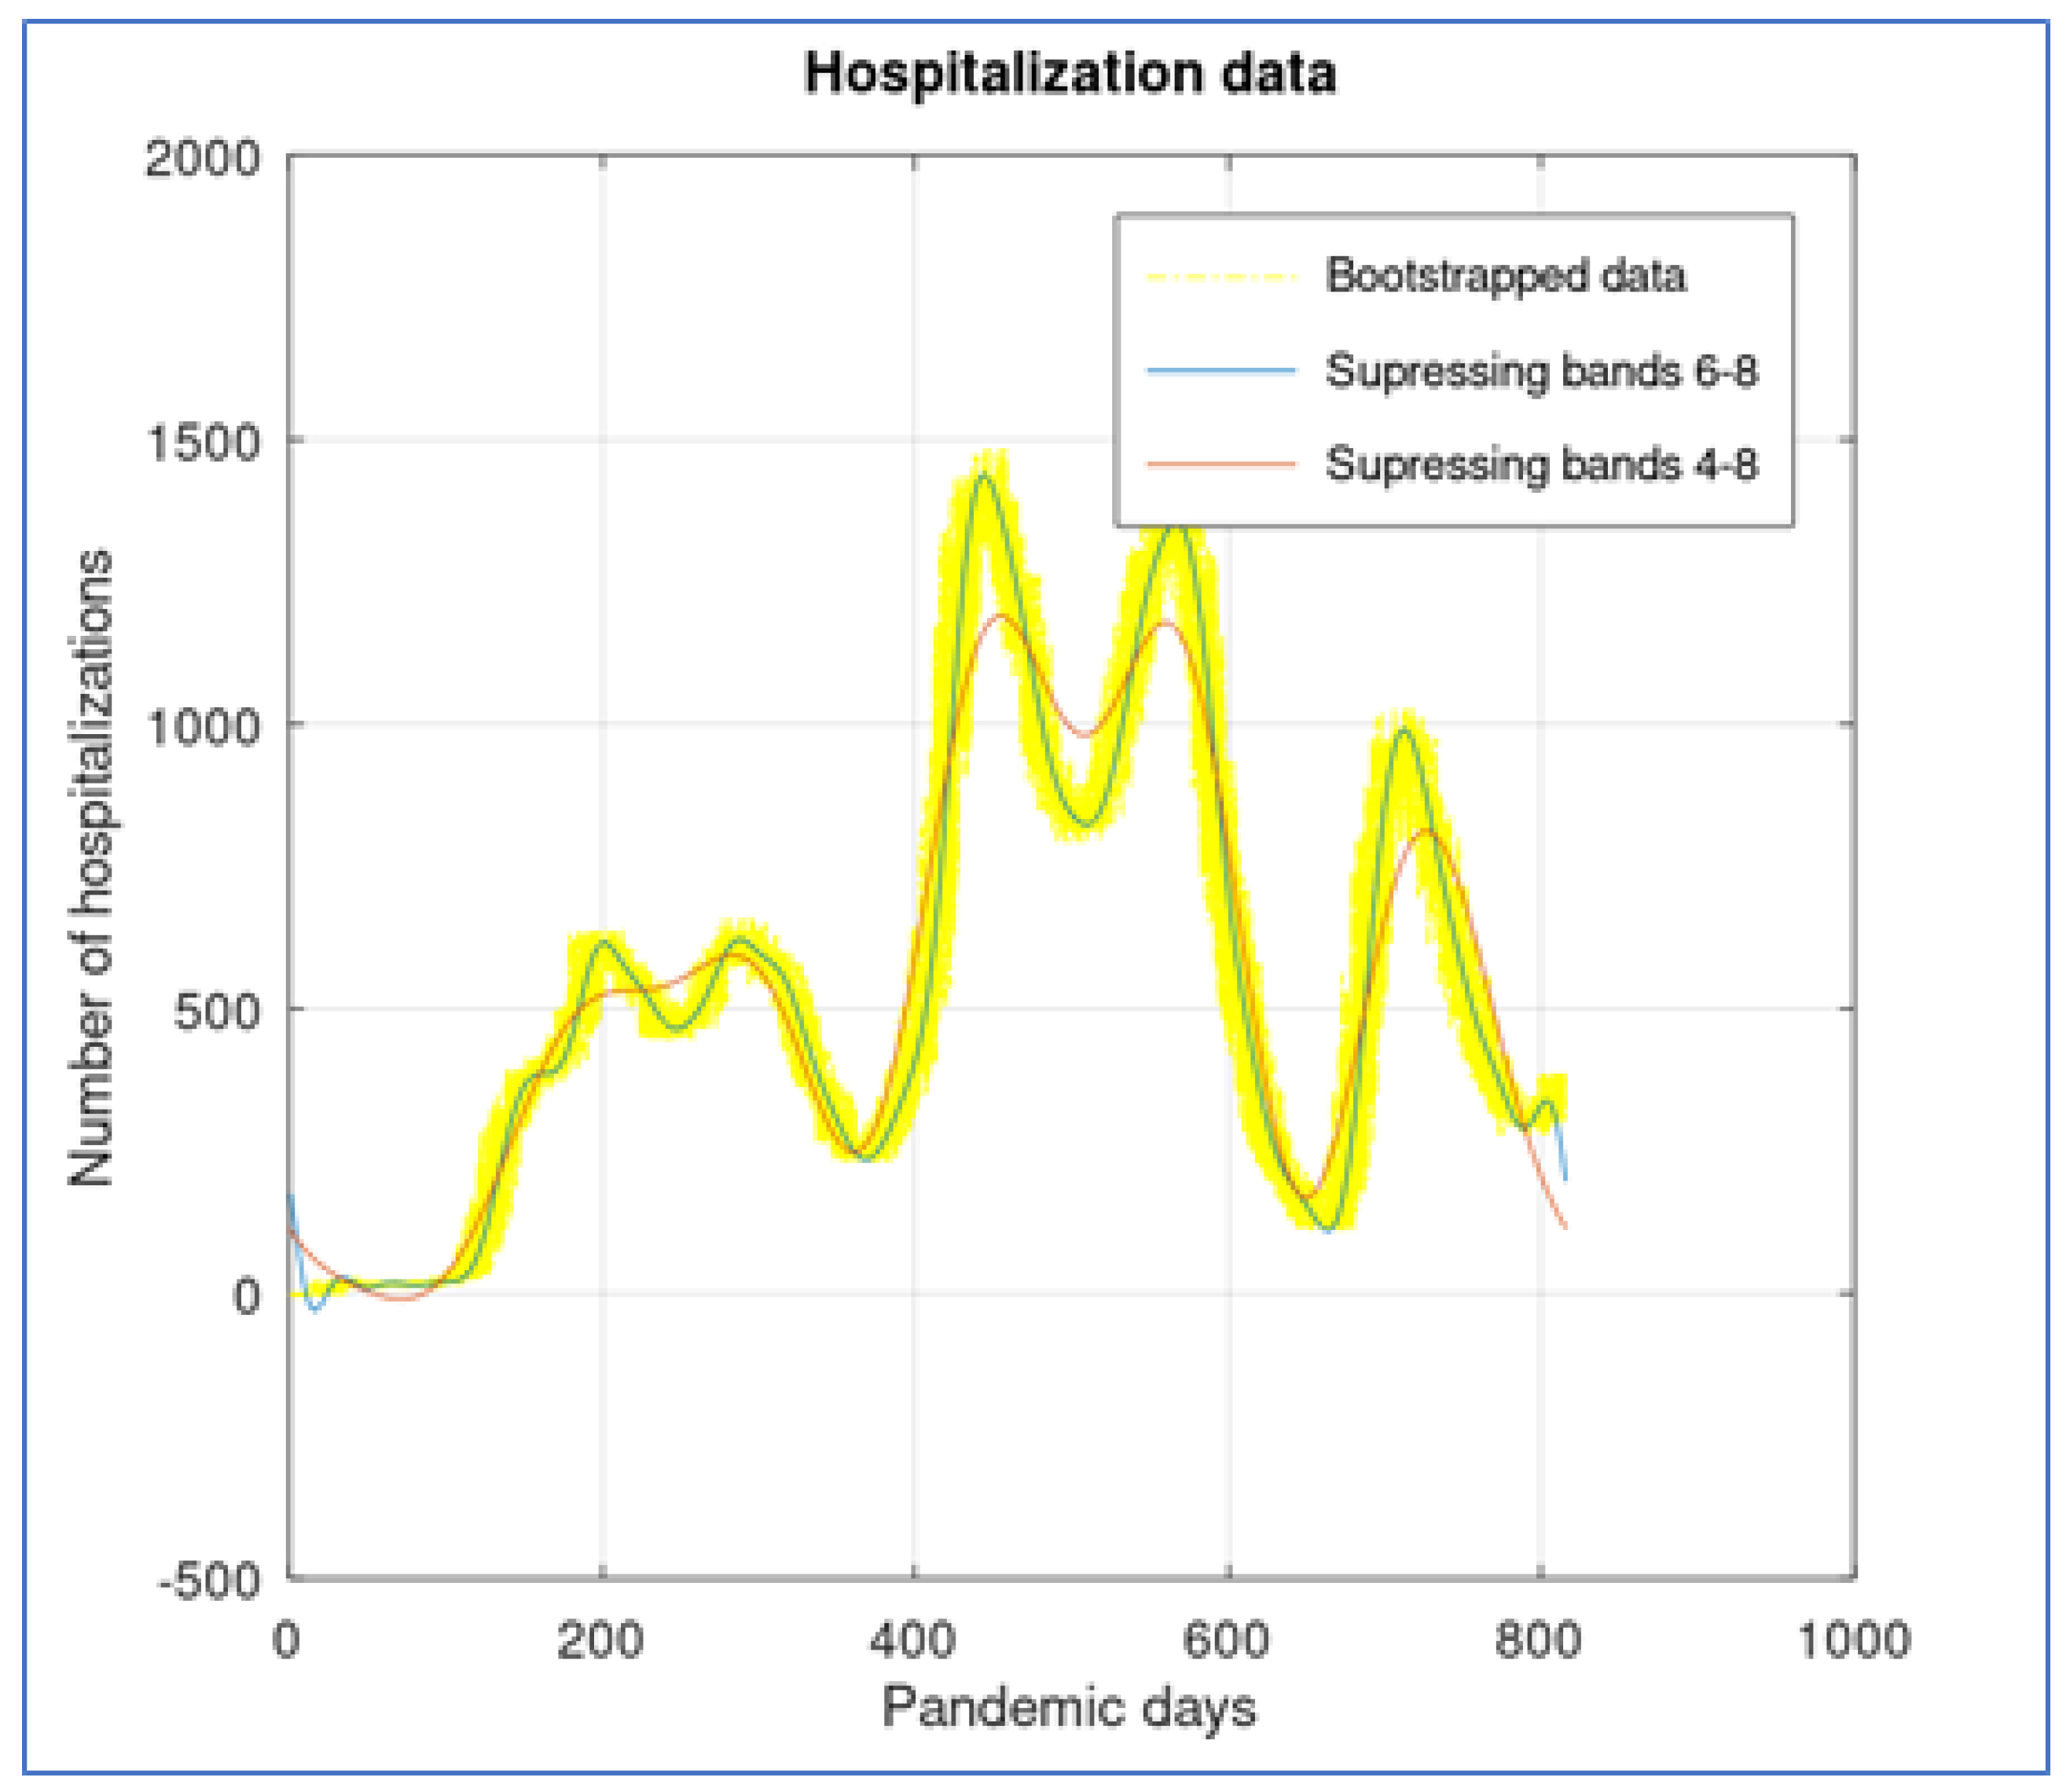
The octave package ’ltfat’ allows reproducing this methodology with several wavelet bases. We used a Deubechis wavelet basis with 8 bands, and in
Figure 7 we show a comparison. First, the original data were bootstrapped around 15 days to estimate variability. Visually, the recovered signal that suppresses bands 6 to 8 seems to capture all global signal behavior, while suppressing bands 4 to 8 flatten the curve and produces a slight displacement to the right.
We apply the first derivative to the processed hospitalization data to show how the rate of hospitalizations may be affected by the contention measures.
3. Results
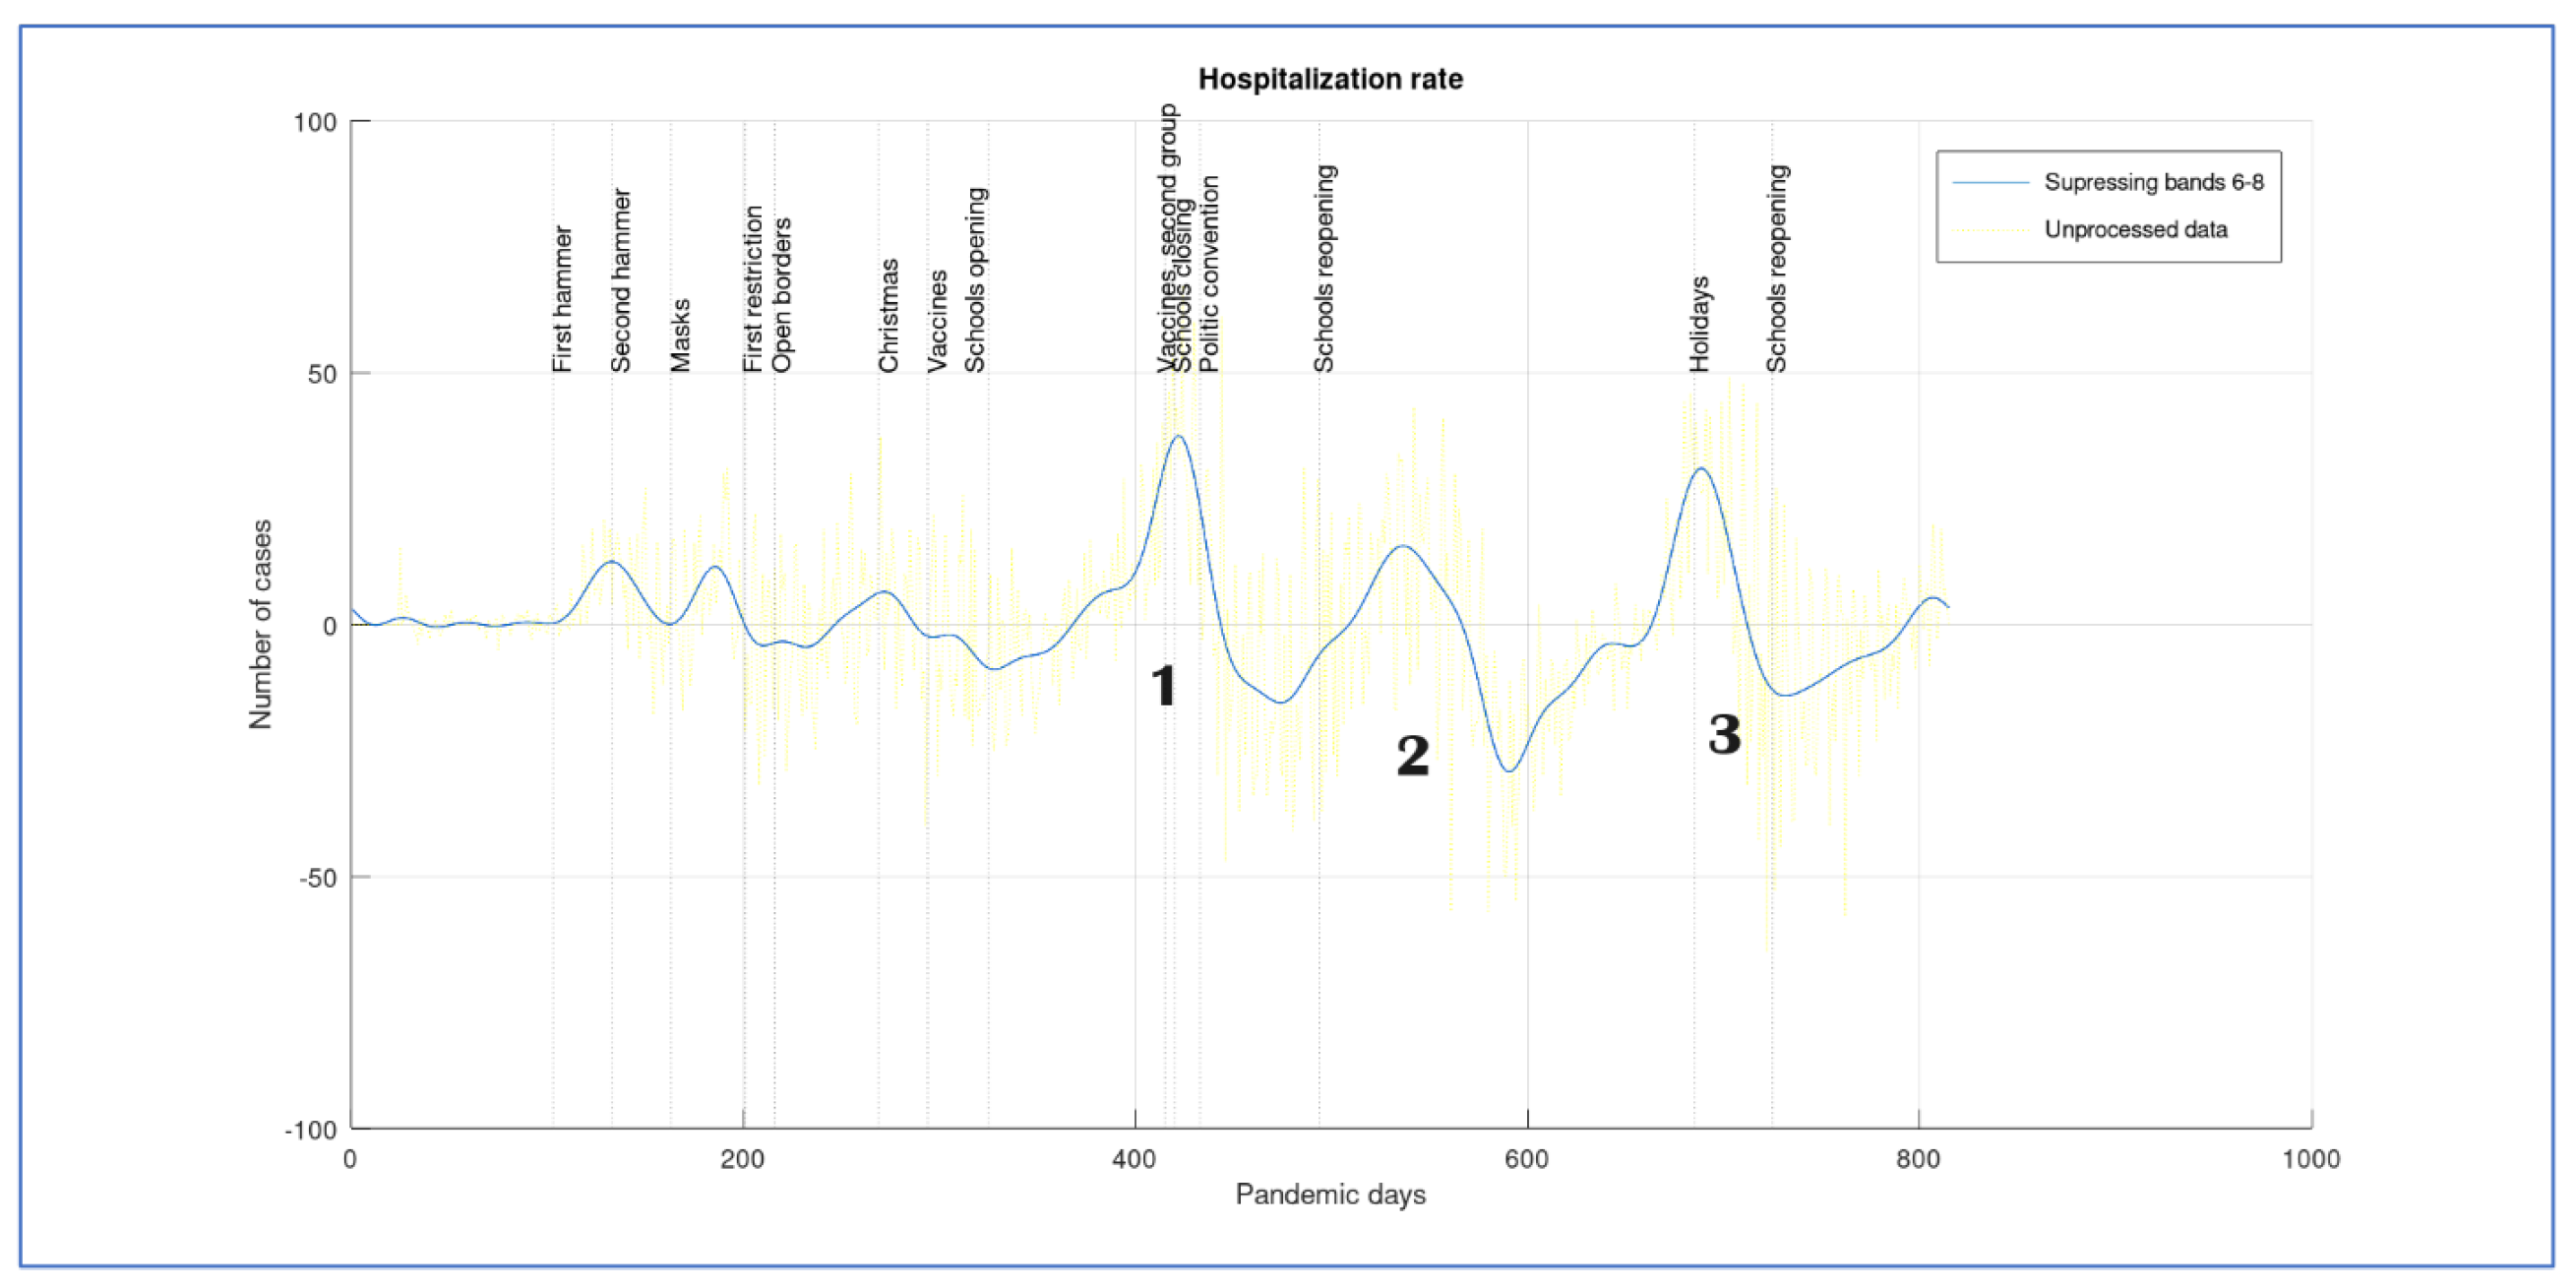
We show the derivative of the smoothed signal of the number of hospitalizations obtained in
Figure 5. This can be considered as the hospitalization rate or the velocity of change in the number of hospitalizations. We suppose that an effective contention measure will tend to decrease this rate. If the rate becomes negative, the number of hospitalizations tends to decrease with time, but if the rate is positive, then the number of hospitalizations increases. We show with vertical lines the dates of important events (when people started being vaccinated, political conventions, or schools opening). This information is plotted in
Figure 8.
The start of the pandemic is characterized by three small waves whose causality is not clearly established. It should be noted that, in Costa Rica, when the pandemic started, a lockdown was ordered in schools. We note that after the first school reopening, the hospitalization rate starts to increase, producing the first larger peak wave (as shown in
Figure 5). At
Figure 7, we number the hospitalization wave peaks as 1,2 and 3. Peak 1 only decreases after vaccination of the second age group (almost all people older than 58 had been vaccinated) and schools closed. This decrease is fast and a causality may be supposed.
When schools reopen the rate was still negative, but it starts to increase to reach peak number 2. This peak is almost as large as the first one in the number of cases, even though its velocity is slower. During this period, it was said that there was no evidence of pandemic spread due to schools reopening, even though, according to our graph, this is the second time that an increasing number of cases is triggered or increased by it (ref). However, the second wave of the hospitalization rate increase started before schools reopening. This increase is slow, and we suppose that half period holidays increased people’s mobility (as they often go out with the family) and, even though the hospitalization rate was still negative, it was starting to accelerate. After reaching a new maximal number of cases, the rate starts to decrease and reaches its maximal deacceleration before day 600, a fact that can be attributed to vaccine spreading and second doses appliances. After this, a new acceleration starts in wave 3, reaching a new rate maximum but with a smaller number of cases. When schools close again, for end of year holidays, the rate decelerates only to start again when schools reopen. We suggest a causality between schools open and an increase in the number of cases.
4. Discussion
We describe a new descriptive methodology to measure the effectiveness of contention measures and the effect of lockdowns and reopening on the hospitalization rate. As testing policies in developing countries such as Costa Rica may be considered unreliable and insufficient, the use of a noisy data number based on incomplete data, such as Rt (reproduction number) is not liable. We recommend using the descriptive analysis of the hospitalization rate based on multiresolution analysis, as shown in the last section, as a direct representation of the effect of the contention measures. When applied to the Costa Rican case, we establish a causality between school openings and lockdowns and the increase and decrease in hospitalization rate. We conclude that in this case, schools were disease propagators, and this result contradicts what the Costa Rican press released in those days.
Author Contributions
Both authors participated in all sections of the research.
Funding
This research received no external funding.
Data Availability Statement
Conflicts of Interest
The authors declare no conflicts of interest.
References
- Haffajee, R. L., & Mello, M. M. Thinking Globally, Acting Locally — The U.S. Response to Covid-19. New England Journal of Medicine 2020, 382(22), e75. [CrossRef]
- Alene, M., Yismaw, L., Assemie, M. A., Ketema, D. B., Mengist, B., Kassie, B., & Birhan, T. Y. Magnitude of asymptomatic COVID-19 cases throughout the course of infection: A systematic review and meta-analysis. PLoS ONE. (2021). 16 (3 March). [CrossRef]
- Campolieti, M. COVID-19 deaths in the USA: Benford’s law and under-reporting. Journal of Public Health. 44(2), e268–e271. [CrossRef] [PubMed]
- Cori, A., Ferguson, N. M., Fraser, C., & Cauchemez, S. A new framework and software to estimate time-varying reproduction numbers during epidemics. American Journal of Epidemiology. 2013. 178(9), 1505–1512. [CrossRef]
- De-Camino-Beck, T. A modified SEIR Model with Confinement and Lockdown of COVID-19 for Costa Rica. 2020. [Google Scholar] [CrossRef]
- Eaton, J. W. GNU Octave and reproducible research. Journal of Process Control. 22(8), 1433–1438. [CrossRef]
- Ebrahim, S. H., Gozzer, E., Ahmed, Y., Imtiaz, R., Ditekemena, J., Rahman, N. M. M., Schlagenhauf, P., Alqahtani, S. A., & Memish, Z. A. COVID-19 in the least developed, fragile, and conflict-affected countries — How can the most vulnerable be protected? In International Journal of Infectious Diseases. 2021. Vol. 102. Elsevier B.V. [CrossRef]
- Grammatikos, T., & Papanikolaou, N. I. Applying Benford’s Law to Detect Accounting Data Manipulation in the Banking Industry. Journal of Financial Services Research. 2021. 59(1–2), 115–142. [CrossRef]
- Guo, T., Zhang, T., Lim, E., Lopez-Benitez, M., Ma, F., & Yu, L. A Review of Wavelet Analysis and Its Applications: Challenges and Opportunities. 2022. IEEE Access, 10, 58869–58903. [CrossRef]
- Haffajee, R. L. , & Mello, M. M. Thinking Globally, Acting Locally — The U.S. Response to Covid-19. New England Journal of Medicine. 2020. 382(22), e75. [CrossRef]
- Hasell, J. , Mathieu, E., Beltekian, D., Macdonald, B., Giattino, C., Ortiz-Ospina, E., Roser, M., & Ritchie, H.. A cross-country database of COVID-19 testing. Scientific Data. 2020. 7(1). [CrossRef]
- Heidrich, B. , Mühlpfordt, T., Hagenmeyer, V., & Mikut, R. DELAY-ROBUST ESTIMATION OF THE REPRODUCTION NUMBER AND COMPARATIVE EVALUATION ON GENERATED SYNTHETIC DATA A PREPRINT List of Symbols Delay-robust Estimation of the Reproduction Number A PREPRINT. 2020. [Google Scholar] [CrossRef]
- Koch, C. , & Okamura, K. Benford’s Law and COVID-19 reporting. Economics Letters. 2020. 196. [CrossRef]
- Kolias, P. . Applying Benford’s law to COVID-19 data: the case of the European Union. Journal of Public Health (United Kingdom). 2022. 44(2), E221–E226. [CrossRef]
- Levin, A. T. , Owusu-Boaitey, N., Pugh, S., Fosdick, B. K., Zwi, A. B., Malani, A., Soman, S., Besançon, L., Kashnitsky, I., Ganesh, S., McLaughlin, A., Song, G., Uhm, R., Herrera-Esposito, D., De Los Campos, G., Peçanha Antonio, A. C. P., Tadese, E. B., & Meyerowitz-Katz, G. (2022). Assessing the burden of COVID-19 in developing countries: Systematic review, meta-Analysis and public policy implications. In BMJ Global Health (Vol. 7, Issue 5). BMJ Publishing Group. [CrossRef]
- Mark, J. Nigrini. (2011). Benford’s Law. In Forensic Analytics (2nd ed., pp. 109–129). Wiley. [CrossRef]
- Obadia, T. , Haneef, R., & Boëlle, P. Y. (2012). The R0 package: A toolbox to estimate reproduction numbers for epidemic outbreaks. BMC Medical Informatics and Decision Making, 12(1). [CrossRef]
- Roda, W. C. , Varughese, M. B., Han, D., & Li, M. Y. (2020). Why is it difficult to accurately predict the COVID-19 epidemic? Infectious Disease Modelling, 5, 271–281. Rosero-Bixby, L., & Miller, T. The mathematics of the reproduction number R for Covid-19: A primer for demographers. (2021). https://shiny.dide.imperial.ac.uk/epiestim/. [CrossRef]
- Sanchez, F., Calvo, J. G., Mery, G., García, Y. E., Vásquez, P., Barboza, L. A., Pérez, M. D., & Rivas, T. A multilayer network model of Covid-19: Implications in public health policy in Costa Rica. Epidemics. (2022). 39, 100577. [CrossRef]
- Thompson, R. N. , Stockwin, J. E., van Gaalen, R. D., Polonsky, J. A., Kamvar, Z. N., Demarsh, P. A., Dahlqwist, E., Li, S., Miguel, E., Jombart, T., Lessler, J., Cauchemez, S., & Cori, A. Improved inference of time-varying reproduction numbers during infectious disease outbreaks. Epidemics. (2019). 29. [CrossRef]
- Wolf, J. M., Petek, H., Maccari, J. G., & Nasi, L. A. COVID-19 pandemic in Southern Brazil: Hospitalizations, intensive care unit admissions, lethality rates, and length of stay between March 2020 and April 2022. Journal of Medical Virology, 94(10), 4839–4849. [CrossRef]
|
Disclaimer/Publisher’s Note: The statements, opinions and data contained in all publications are solely those of the individual author(s) and contributor(s) and not of MDPI and/or the editor(s). MDPI and/or the editor(s) disclaim responsibility for any injury to people or property resulting from any ideas, methods, instructions or products referred to in the content. |
© 2024 by the authors. Licensee MDPI, Basel, Switzerland. This article is an open access article distributed under the terms and conditions of the Creative Commons Attribution (CC BY) license (http://creativecommons.org/licenses/by/4.0/).
