Submitted:

21 June 2024

Posted:

24 June 2024

You are already at the latest version

A peer-reviewed article of this preprint also exists.

Abstract
In this study, we investigated the relationship between age and microbial diversity in cattle, revealing significant changes in both protist diversity and fungal microbiota composition with age. Using fecal samples from 21 Simmental cattle, we analyzed microbial communities through 18S rRNA gene sequencing. Results indicated significant differences in alpha protist diversity among the three age groups, while fungal composition varied notably with age and was linked to hematological parameters. Despite the stability of fungal alpha diversity, compositional changes suggest the gut as a stable niche for microbial colonization influenced by diet, clinical parameters, and microbial interactions. All cattle were maintained on a consistent diet, tailored to meet specific nutritional needs of each age group. These findings emphasize the importance of understanding age-related microbial dynamics to enhance livestock management and animal health, contributing to broader ecological and biomedical research. However, the study was limited by the lack of comprehensive metabolic analyses correlating microbiota changes with specific age-related variations, indicating a need for further research in this area.
Keywords: 
Subject: 
Biology and Life Sciences  -   Animal Science, Veterinary Science and Zoology

1. Introduction

The gut microbiota constitutes a complex and diverse ecosystem, composed of various microorganisms such as bacteria, methanogenic archaea, ciliates, anaerobic fungi, viruses, and bacteriophages [1]. These symbiotic communities degrade dietary components like plant fibers, carbohydrates, proteins, and lipids, generating volatile fatty acids (VFAs) that are crucial for the animal, meeting up to 70-80% of its energy requirements [2]. The gut microbiome, closely related to various physiological functions of the host, is fundamental to the health and performance of livestock [3,4]. This complex system, influenced by factors such as diet, genetics, and the age of the host and its environment, has significant implications for the animal's health and development [5,6].
The composition of the microbiota in ruminants varies significantly with age, influencing their health and metabolic processes [7]. In young cattle, the microbiota is diverse and becomes more complex as the animals mature, which is crucial for efficient digestion and overall health [8]. For example, in cattle, the ruminal microbiota changes with age, affecting the diversity and stability of intestinal microbes, impacting digestion and general health [9]. However, diet is the primary factor determining the structure and composition of the ruminal microbiota [10]. Clinical parameters such as glucose and cholesterol are linked to age-induced variations in the microbiota, reflecting metabolic adjustments as the animal matures [11]. Additionally, the diet of animals is influenced by geographical location and the type of production system. It has been proven that lipid supplements can reduce enteric methane production, providing viable options to mitigate the environmental impact of animal production [12].
The intestinal microbiota of cattle includes diverse fungal and protist communities. The dominant fungal phyla in cattle gut microbiota are Ascomycota, Basidiomycota, and Neocallimastigomycota [13]. These fungal phyla play crucial roles in various gut functions [14]. Additionally, prominent protist phyla include Ciliophora and Apicomplexa, which are integral to nutrient metabolism and overall gut health [15,16].
The gut microbiota in cattle undergoes age-related changes, influencing various aspects of health, including metabolic, immune, and cognitive functions. Probiotics play a significant role in modulating this microbiota, aiding in healthy aging by enhancing the intestinal barrier and improving nutrient absorption, particularly in older cattle [17]. Early probiotic supplementation can benefit young animals, such as newborn calves, by promoting growth, enhancing gut health, and increasing disease resistance [18]. Additionally, examining the microbiota from a genetic core perspective provides valuable insights into its hereditary effects on health. This approach facilitates the development of personalized probiotic therapies tailored to different animal populations, optimizing their overall health and productivity [17]. The diet of cattle is also shaped by geographical location and production systems, which in turn affects the microbiota's composition and function. Simmental cattle are particularly noted for their dual-purpose use in meat and milk production, thanks to their rapid growth rates and efficient feed conversion [19]. Recent genomic research identified genetic variants associated with meat quality, focusing on genes related to growth rate and muscle development [20,21]. Moreover, Simmental cows are known for their strong milk production capacity, making them highly suitable for dual-purpose farming operations [22,23].
The 18S rRNA molecular marker is crucial for deciphering the intestinal microbiota of fungi and protists due to its conserved nature among eukaryotes, allowing precise identification and classification [24]. This marker, coupled with high-throughput sequencing technologies like Illumina, enables detailed profiling of microbial communities, including low-abundance species [25]. This comprehensive approach is essential for linking microbial diversity with host health, facilitating targeted probiotic therapies to enhance animal health and productivity [26].
This study investigates how age affects the intestinal microbiota of cattle, focusing on fungi and protists, and examines correlations with blood parameters across three age groups within a genetic core of healthy bovines. The findings reveal that age significantly impacts the diversity and composition of the microbiota and its association with various clinical parameters. These results emphasize the importance of understanding the age-related dynamics of the intestinal microbiota and its influence on the metabolic health of cattle. Additionally, the study underscores the significance of identifying age-specific biomarkers and exploring personalized probiotic therapies to enhance cattle health and performance throughout different life stages.

2. Materials and Methods

2.1. Animal and Sample Collection

In Huaral, Lima, at an altitude of 128 meters above sea level (11°31'18" S and 77°14'06" W), 21 fecal samples were gathered from Simmental cattle at the Donoso Agricultural Research Station (EEA Donoso for its acronym in Spanish). This station hosts a government-owned herd that serves as a cattle genetic nucleus. The conditions included natural light exposure, a relative humidity of 88.5%, and an average temperature of 25.5°C [27]. The specified age groups were as follows: 58 to 63 months for 5Y, 18 to 21 months for 1Y8M, and 5 months for 5M. The sex ratio in all age groups was 4 females to 3 males. The diet regimen at the Donoso Experimental Station of INIA (Peru) relies on fresh forage, with particular supplements tailored to the age group. The diet of all cattle comprised the same components, with proportions adjusted to meet the specific nutritional requirements of each life stage. The 5M calves were given 6 liters of milk per day, split into two feedings, along with dry matter (DM) equivalent to 3.5% of their body weight (corn silage) and 1.0 kg of balanced feed containing 17% crude protein (CP). Cattle aged 1Y8M were fed with dry matter (DM) amounting to 3.0% of their body weight (corn silage) and 2.0 kg of balanced feed containing 14% crude protein (CP). Cattle aged 5Y were provided with 1.4% of their body weight in dry matter (DM) from corn silage and 2.0 kg of balanced feed with 18% crude protein (CP). The corn silage comprised 24%-26% dry matter (DM), corresponding to 74%-76% moisture, while the feed contained 90% DM, equivalent to 10% moisture. Fecal samples were obtained directly from the rectum of each animal using disposable gloves, transported to the laboratory in liquid nitrogen, and stored at -80°C until DNA extraction. Additionally, blood samples were drawn from the jugular vein of each animal. Twenty-one cattle from EEA Donoso were included in this study. These animals, regularly monitored by the veterinary unit, underwent parasitological examinations revealing no cysts, oocysts, or larvae, and were certified as healthy. Regular veterinary checks, including physical examinations, clinical history assessments, and laboratory tests, are performed to uphold the stringent health standards required for semen and ovum donors. As a result, there are no unhealthy animals in the genetic nucleus. This study was conducted in compliance with Peruvian National Law No. 30407: “Animal Protection and Welfare”.

2.2. Clinical Parameters

A total of 3 mL of whole blood were drawn into two BD Vacutainer® K2 EDTA tubes (Becton, Dickinson and Company, Franklin Lakes, NJ, USA) and stored at 4°C. In parallel, 4 mL of blood were left to clot at room temperature in BD Vacutainer® SST tubes (Becton, Dickinson and Company, Franklin Lakes, NJ, USA) before being quickly transported to the laboratory. To separate serum and plasma, the SST tube and one of the K2 EDTA tubes were both centrifuged at 3000 g for 30 minutes. A complete blood count (CBC) was then conducted using a Procyte Dx® hematology analyzer (IDEXX Laboratories, Westbrook, MA, USA) with blood samples collected in EDTA tubes. The test profiles included three categories: red blood cell series, white blood cell series, and platelets (PLT). The red cell series parameters encompass erythrocytes (RBC), hemoglobin (HGB), hematocrit (HCT), mean corpuscular volume (MCV), mean corpuscular hemoglobin (MCH), and mean corpuscular hemoglobin concentration (MCHC). For the white cell series, the parameters include leukocytes (WBC), neutrophils (NEU), segmented cells (SEG), lymphocytes (LYM), monocytes (MON), eosinophils (EOS), basophils (BAS), and their respective percentages: neutrophils(%) (NEU%), lymphocytes(%) (LYM%), monocytes(%) (MON%), eosinophils(%) (EOS%), and basophils(%) (BAS%) [28]. For biochemical analyses, plasma samples were utilized and processed with a Bayer Advia® 1200 chemical system (Siemens Medical Solutions Diagnostics, Tarrytown, NY, USA). The plasma was examined to measure total proteins (TP) and triglycerides (TG).

2.3. DNA Extraction and 18S rRNA Gene Sequencing

Using the Stool DNA Isolation Kit (Norgen, Biotek Corporation, Sacramento, CA, USA), genomic DNA was extracted from 21 fecal samples, following the manufacturer's guidelines. To assess the quality of the extracted DNA, its concentration was measured using the NanoDrop ND-1000 spectrophotometer; the 260/280 absorbance ratio was determined simultaneously. Furthermore, DNA integrity was verified through the process of 1% agarose gel electrophoresis, ensuring the reliability of the extracted samples. Approximately 10 ng of DNA from each sample was used for PCR amplification with the 528F/706R primer pair targeting the 18S rRNA gene, to construct the Illumina amplicon sequencing library. The PCR protocol began with an initial denaturation step at 94 °C for 2 minutes, followed by an initial set of 5 cycles consisting of denaturation at 94 °C for 45 seconds, annealing at 52/54 °C for 45 seconds each, and elongation at 72 °C for 1 minute. This was followed by 35 more cycles with a reduced annealing temperature of 50/52 °C. The process concluded with a final elongation step at 72 °C for 10 minutes. Using the Illumina TruSeq DNA PCR-Free Library Preparation Kit (Illumina, USA) and following the manufacturer's instructions, sequencing libraries were prepared, including the addition of index sequences. The quality of the libraries was then assessed with a Qubit 2.0 Fluorometer (Thermo Scientific). The validated libraries were ultimately sequenced on the 250-bp paired-end Illumina NovaSeq 6000 platform (Illumina Inc., San Diego, CA, USA) following the manufacturer's guidelines.

2.4. Bioinformatics Analysis

In the QIIME2 [29] analysis, trimming and quality filtering were performed. Following this, the paired-end reads, demultiplexed by Illumina, were analyzed with the Qiime2-DADA2 [30] software, leading to the creation of an Amplicon Sequence Variants (ASVs) table. To reduce the likelihood of false positive ASVs, sequences with a combined abundance of fewer than 10 reads across all samples were excluded. Specifically, plant sequences were removed. Taxonomy assignment for the ASVs was carried out using the SILVA v138.1 database for analyzing 18S sequences to identify fungi and protists. The high-quality filtered sequences were subsequently aligned utilizing the integrated MAFFT [31] aligner. Using the QIIME2 phylogenetic module, rooted and unrooted phylogenetic trees for fungi and protists were constructed with the FastTree algorithm.

2.5. Statistic Analysis

The data underwent statistical analysis using the packages Phyloseq [32], MicrobiotaProcess, and Microeco [33] in R software v4.1.1 [34]. Individual samples were analyzed to generate rarefaction curves, assessing the sequencing depth. Subsequently, various measures of intestinal bacterial alpha diversity were evaluated (Pielou, Simpson, ACE, Observed, Chao1 and Shannon indices). Beta diversity was assessed using the Jaccard and Unweighted Unifrac methods, and the results were visualized using Principal Coordinate Analysis (PCoA). To evaluate differences in bacterial communities among groups, a two-way PERMANOVA [35] analysis was conducted, utilizing 9999 permutations. Distinctive characteristics of gut microbiota profiles were identified using linear discriminant analysis (LDA) effect size with LEfSe. This method allowed us to highlight biomarkers with the highest statistical and biological significance. Spearman rank correlation analyses were performed on variable pairs, including blood parameters and bacterial alpha diversity indices. Furthermore, the relationship between clinical variables and fungal community composition was examined using Mantel tests with 999 permutations.

3. Results

For fungi, a total of 1,808,136 high-quality reads were generated, with an average of 86,101 high-quality reads, a maximum of 17,1671 high-quality reads, and a minimum of 20,340 high-quality reads. Similarly, for protists, a total of 1,189,559 high-quality reads were obtained, with an average of 56,645 high-quality reads, a maximum of 144,851 high-quality reads, and a minimum of 4,288 high-quality reads.

3.1. Impact of Age on the Diversity and Composition of Fungal and Protist Communities in the Bovine Microbiome

The rarefaction curve demonstrated good representativity of species diversity in the analyzed samples, indicating that the sampling was adequate for the analysis of both fungi (Figure S1.) and protists (Figure S2). The alpha diversity of fungal and protists and communities in cattle showed distinct patterns (Figure 1). For fungal communities, measured through the same metrics, no significant differences were shown (Figure 1A). In contrast, the alpha diversity of protist communities, measured through the metrics ACE, Chao1, Observed, Pielou, Shannon, and Simpson, significant differences were observed between age groups. In particular, Pielou (p=0.026) and Simpson (p=0.026) metrics presented significant differences between the age groups 1Y8M and 5M (Figure 1B).
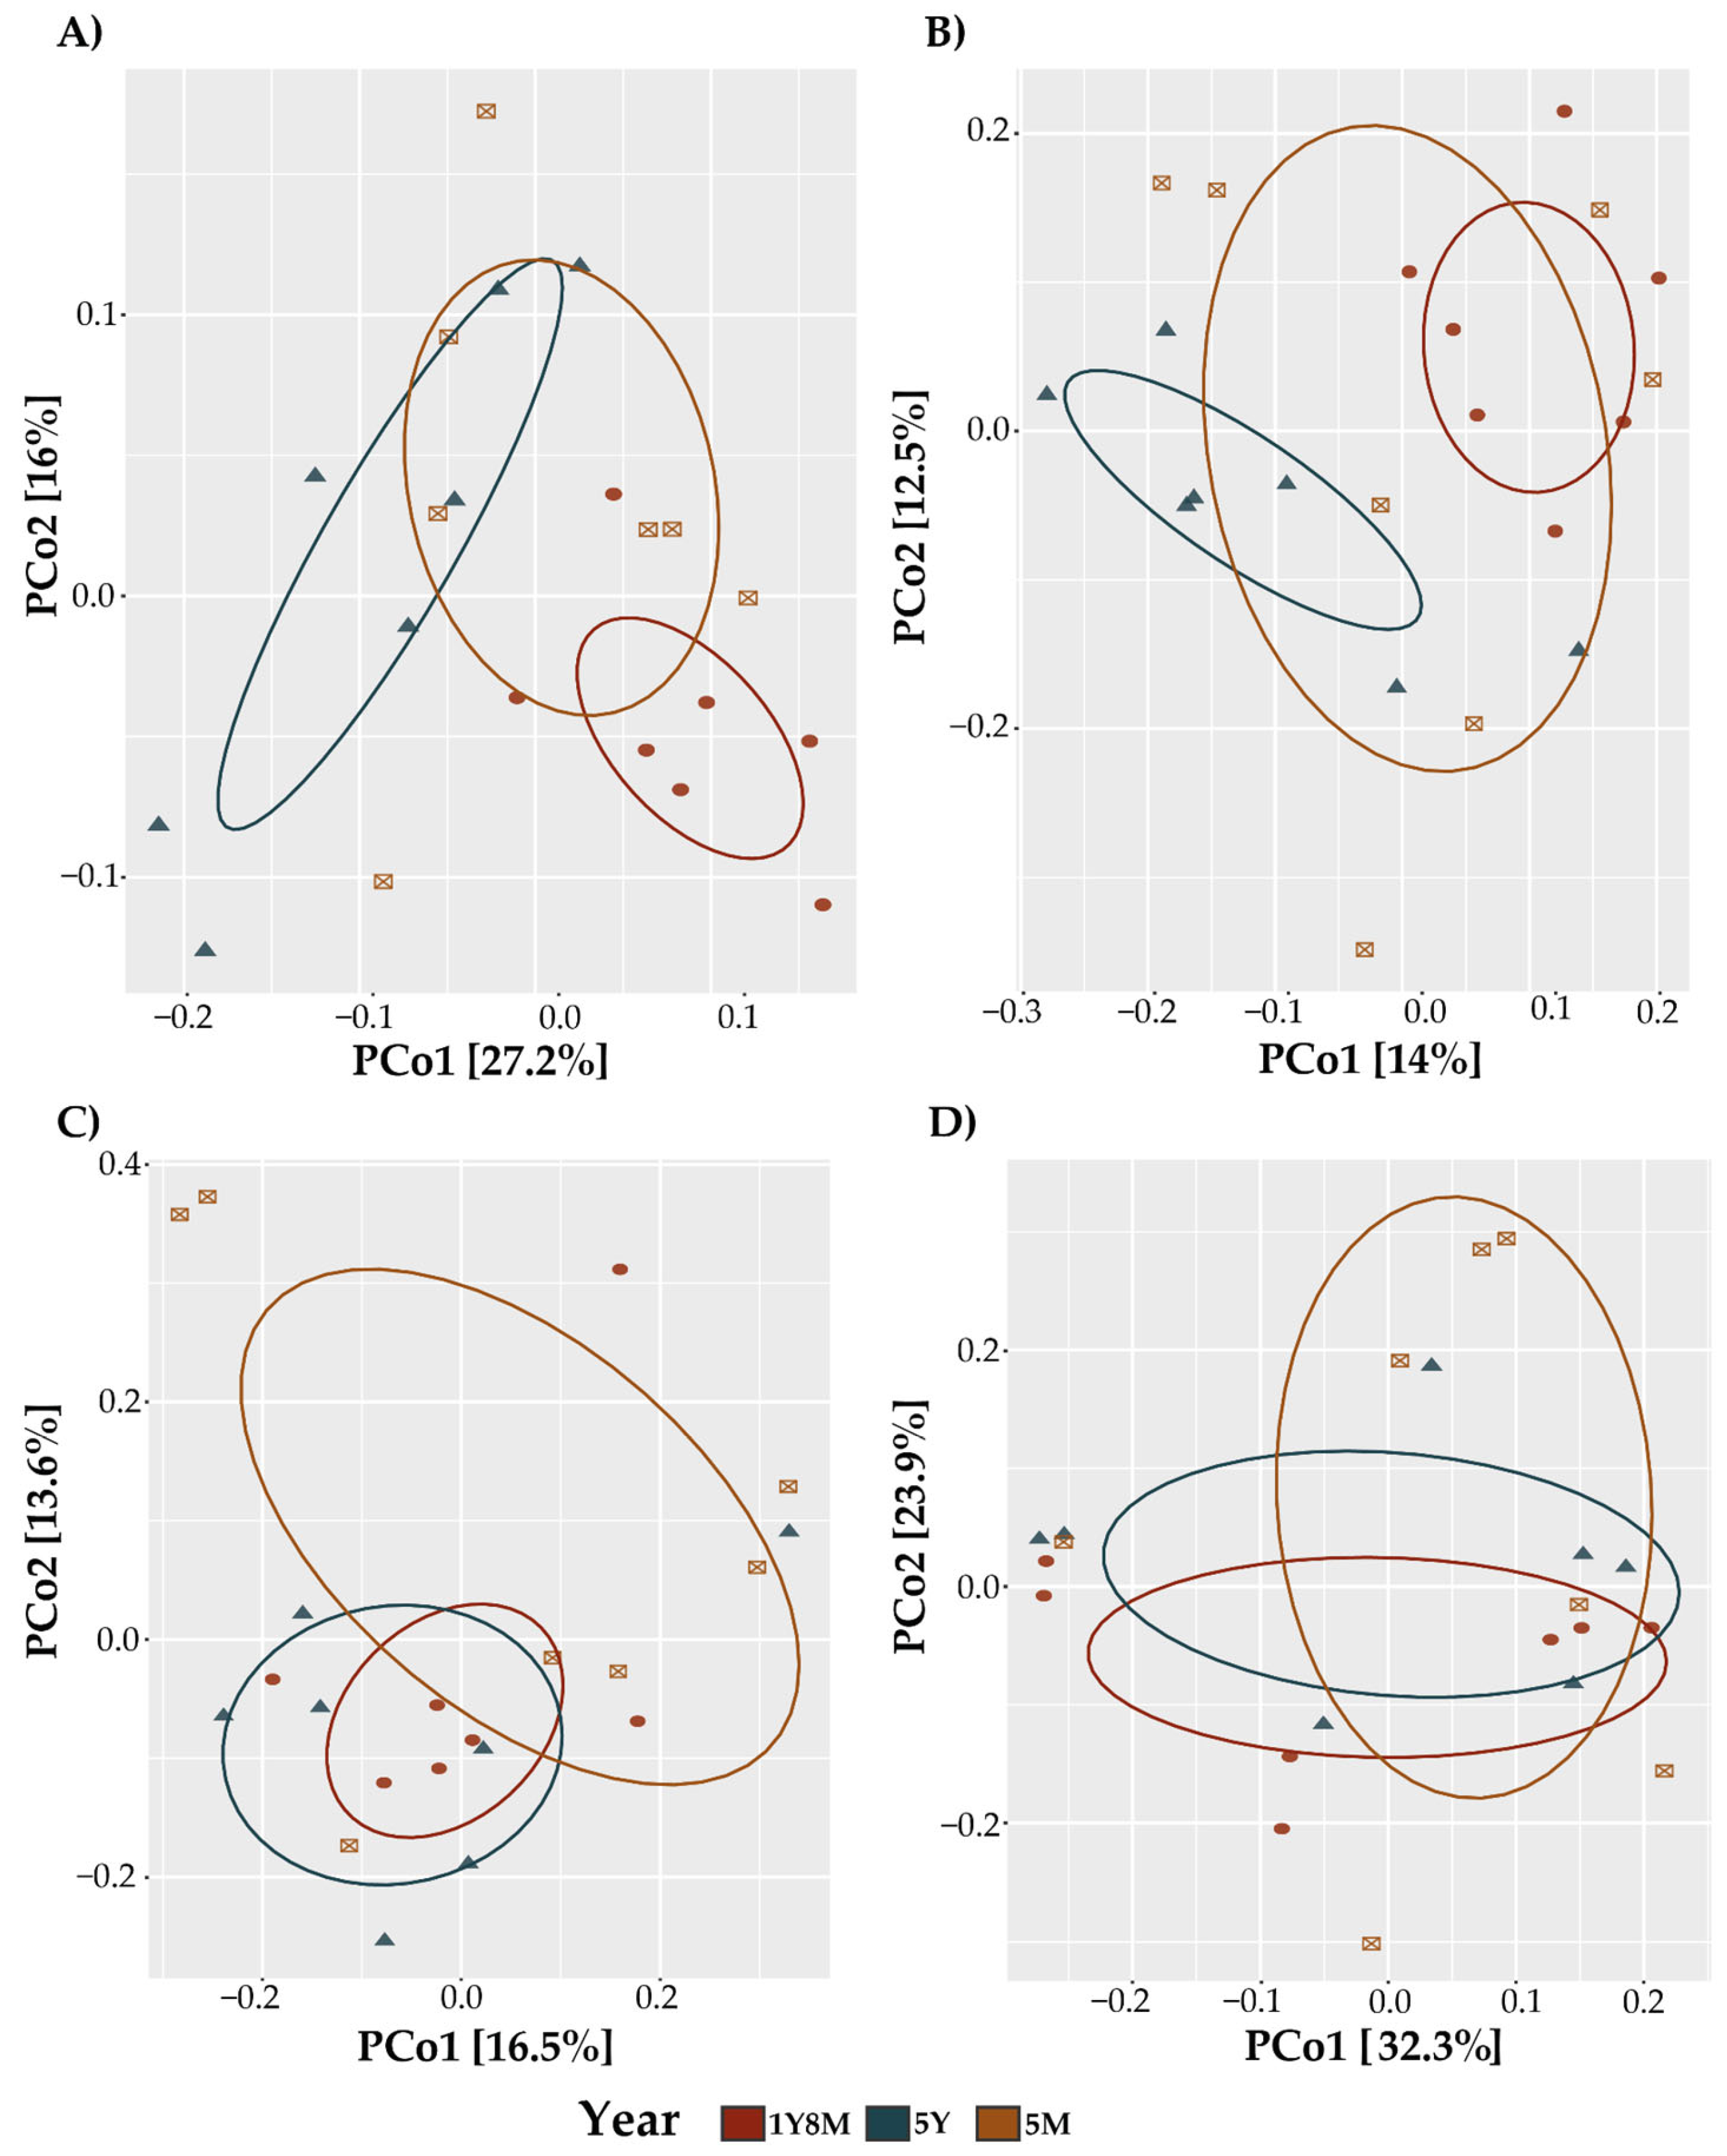
In the analysis of the beta diversity of the fungal communities in cattle, the beta diversity revealed significant patterns influenced by age and the interaction of age and sex. The PCoA plots for both metrics showed distinct clustering of fungal communities across different age groups (Figure 2A,B). The PERMANOVA analysis for Jaccard distances (Table 1) indicated that year (p=0.015) and the interaction of year (p=0.007) significantly influenced the beta diversity. Similarly, the PERMANOVA for Unweighted UniFrac distances (Table 1) showed significant effects of year (p=0.002) and the interaction of year (p=0.002). For the protist community using both the Jaccard index and Unweighted UniFrac, PCoAs were generated to show the similar distribution of the samples across different age groups (Figure 2C,D). The permutational multivariate analysis of variance (PERMANOVA) did not reveal significant differences between the evaluated groups (Table 1).
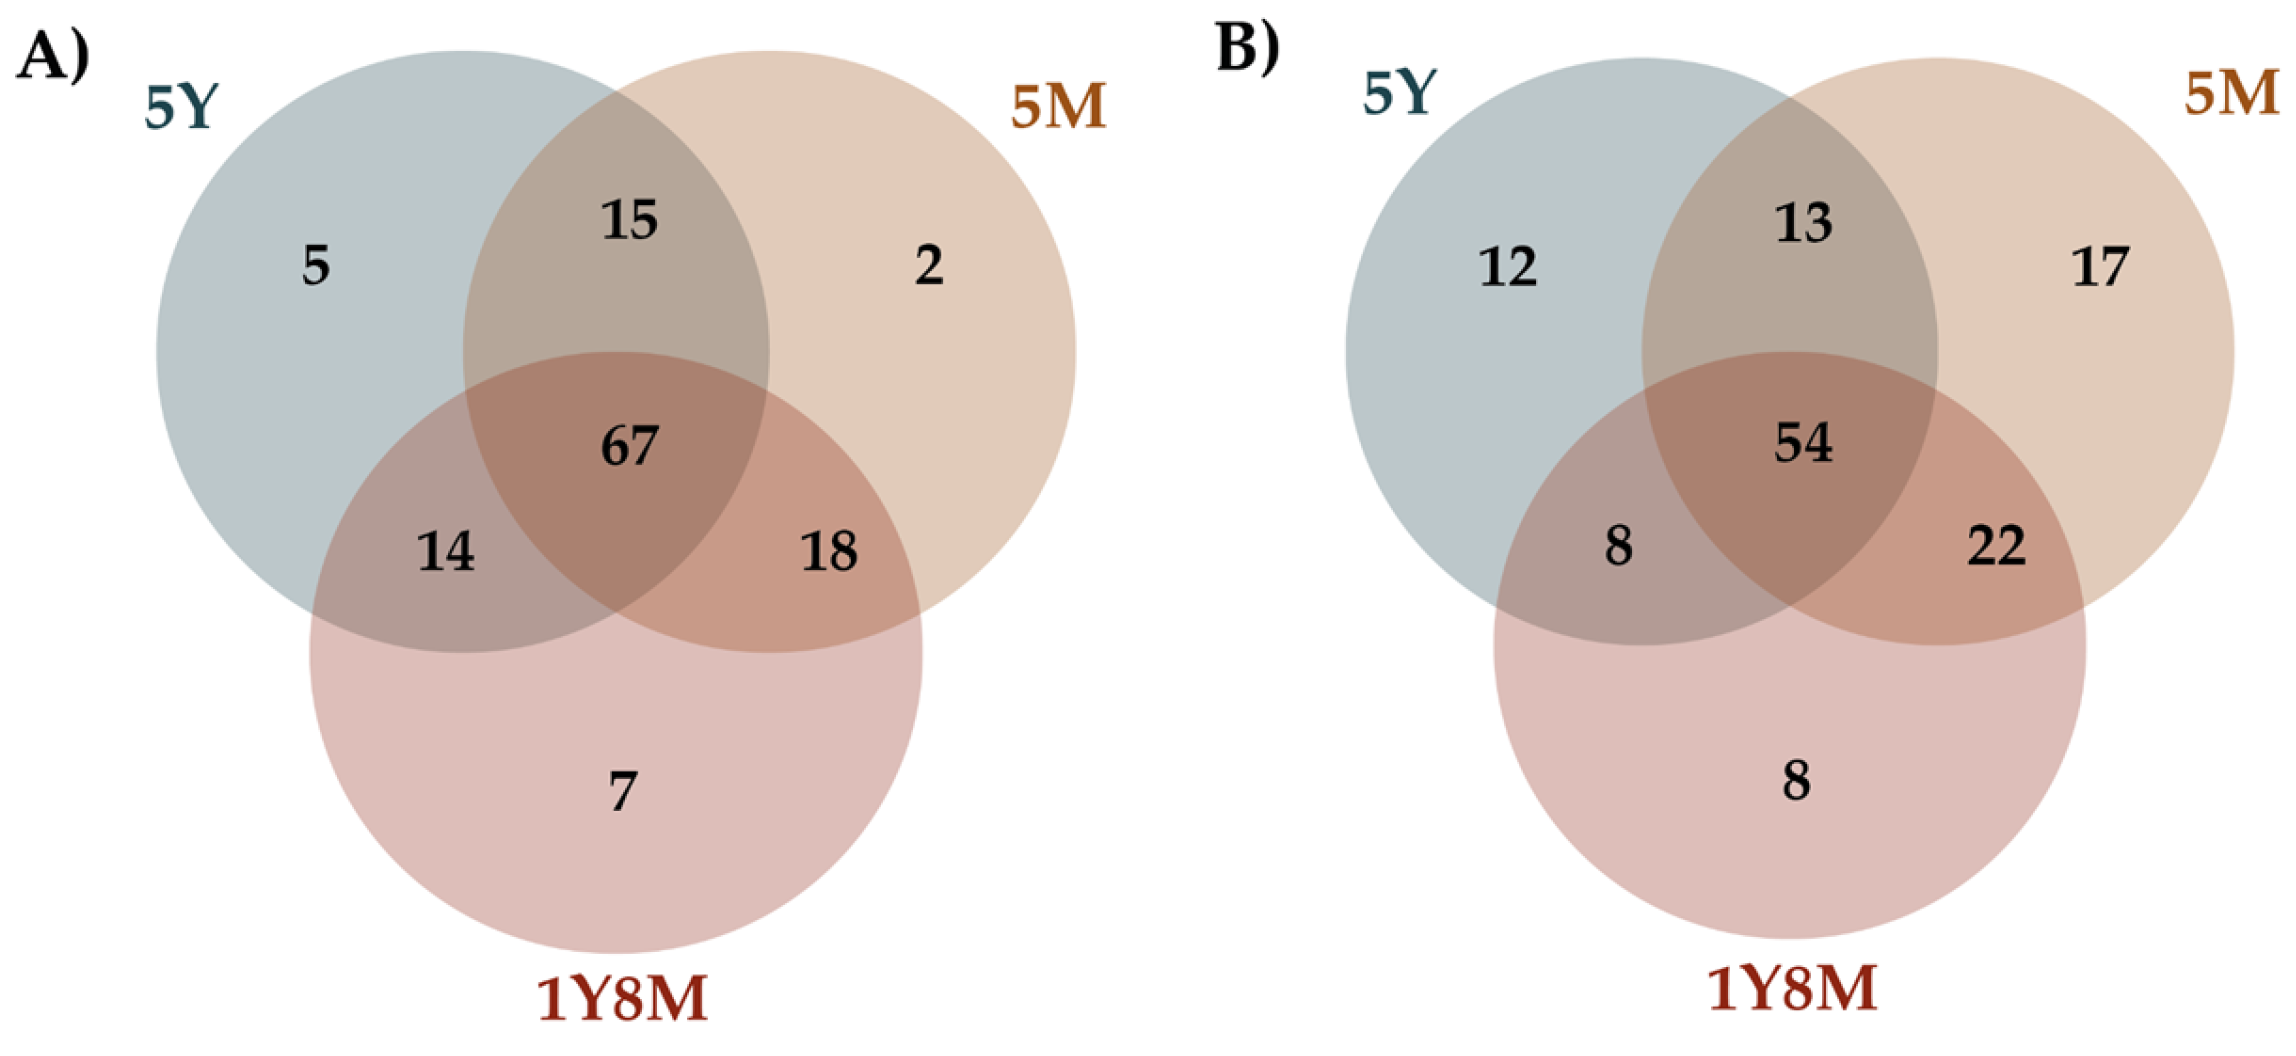
The Venn diagrams illustrated the unique and shared fungal and protist amplicon sequence variants (ASVs) among cattle of different age groups (Figure 3). For fungal ASVs (Figure 3A), 67 are common across all age groups, with 7 unique to the 1Y8M group, 5 to the 5Y group, and 2 to the 5M group. Shared ASVs between two age groups include 14 between 1Y8M and 5Y, 18 between 1Y8M and 5M, and 15 between 5Y and 5M. For protist ASVs (Figure 3B), 54 are common across all age groups, with 8 unique to the 1Y8M group, 12 to the 5Y group, and 17 to the 5M group. Shared ASVs include 8 between 1Y8M and 5Y, 22 between 1Y8M and 5M, and 13 between 5Y and 5M.

3.2. Taxonomic Composition of the Fungal and Protist Communities in the Gut Microbiota

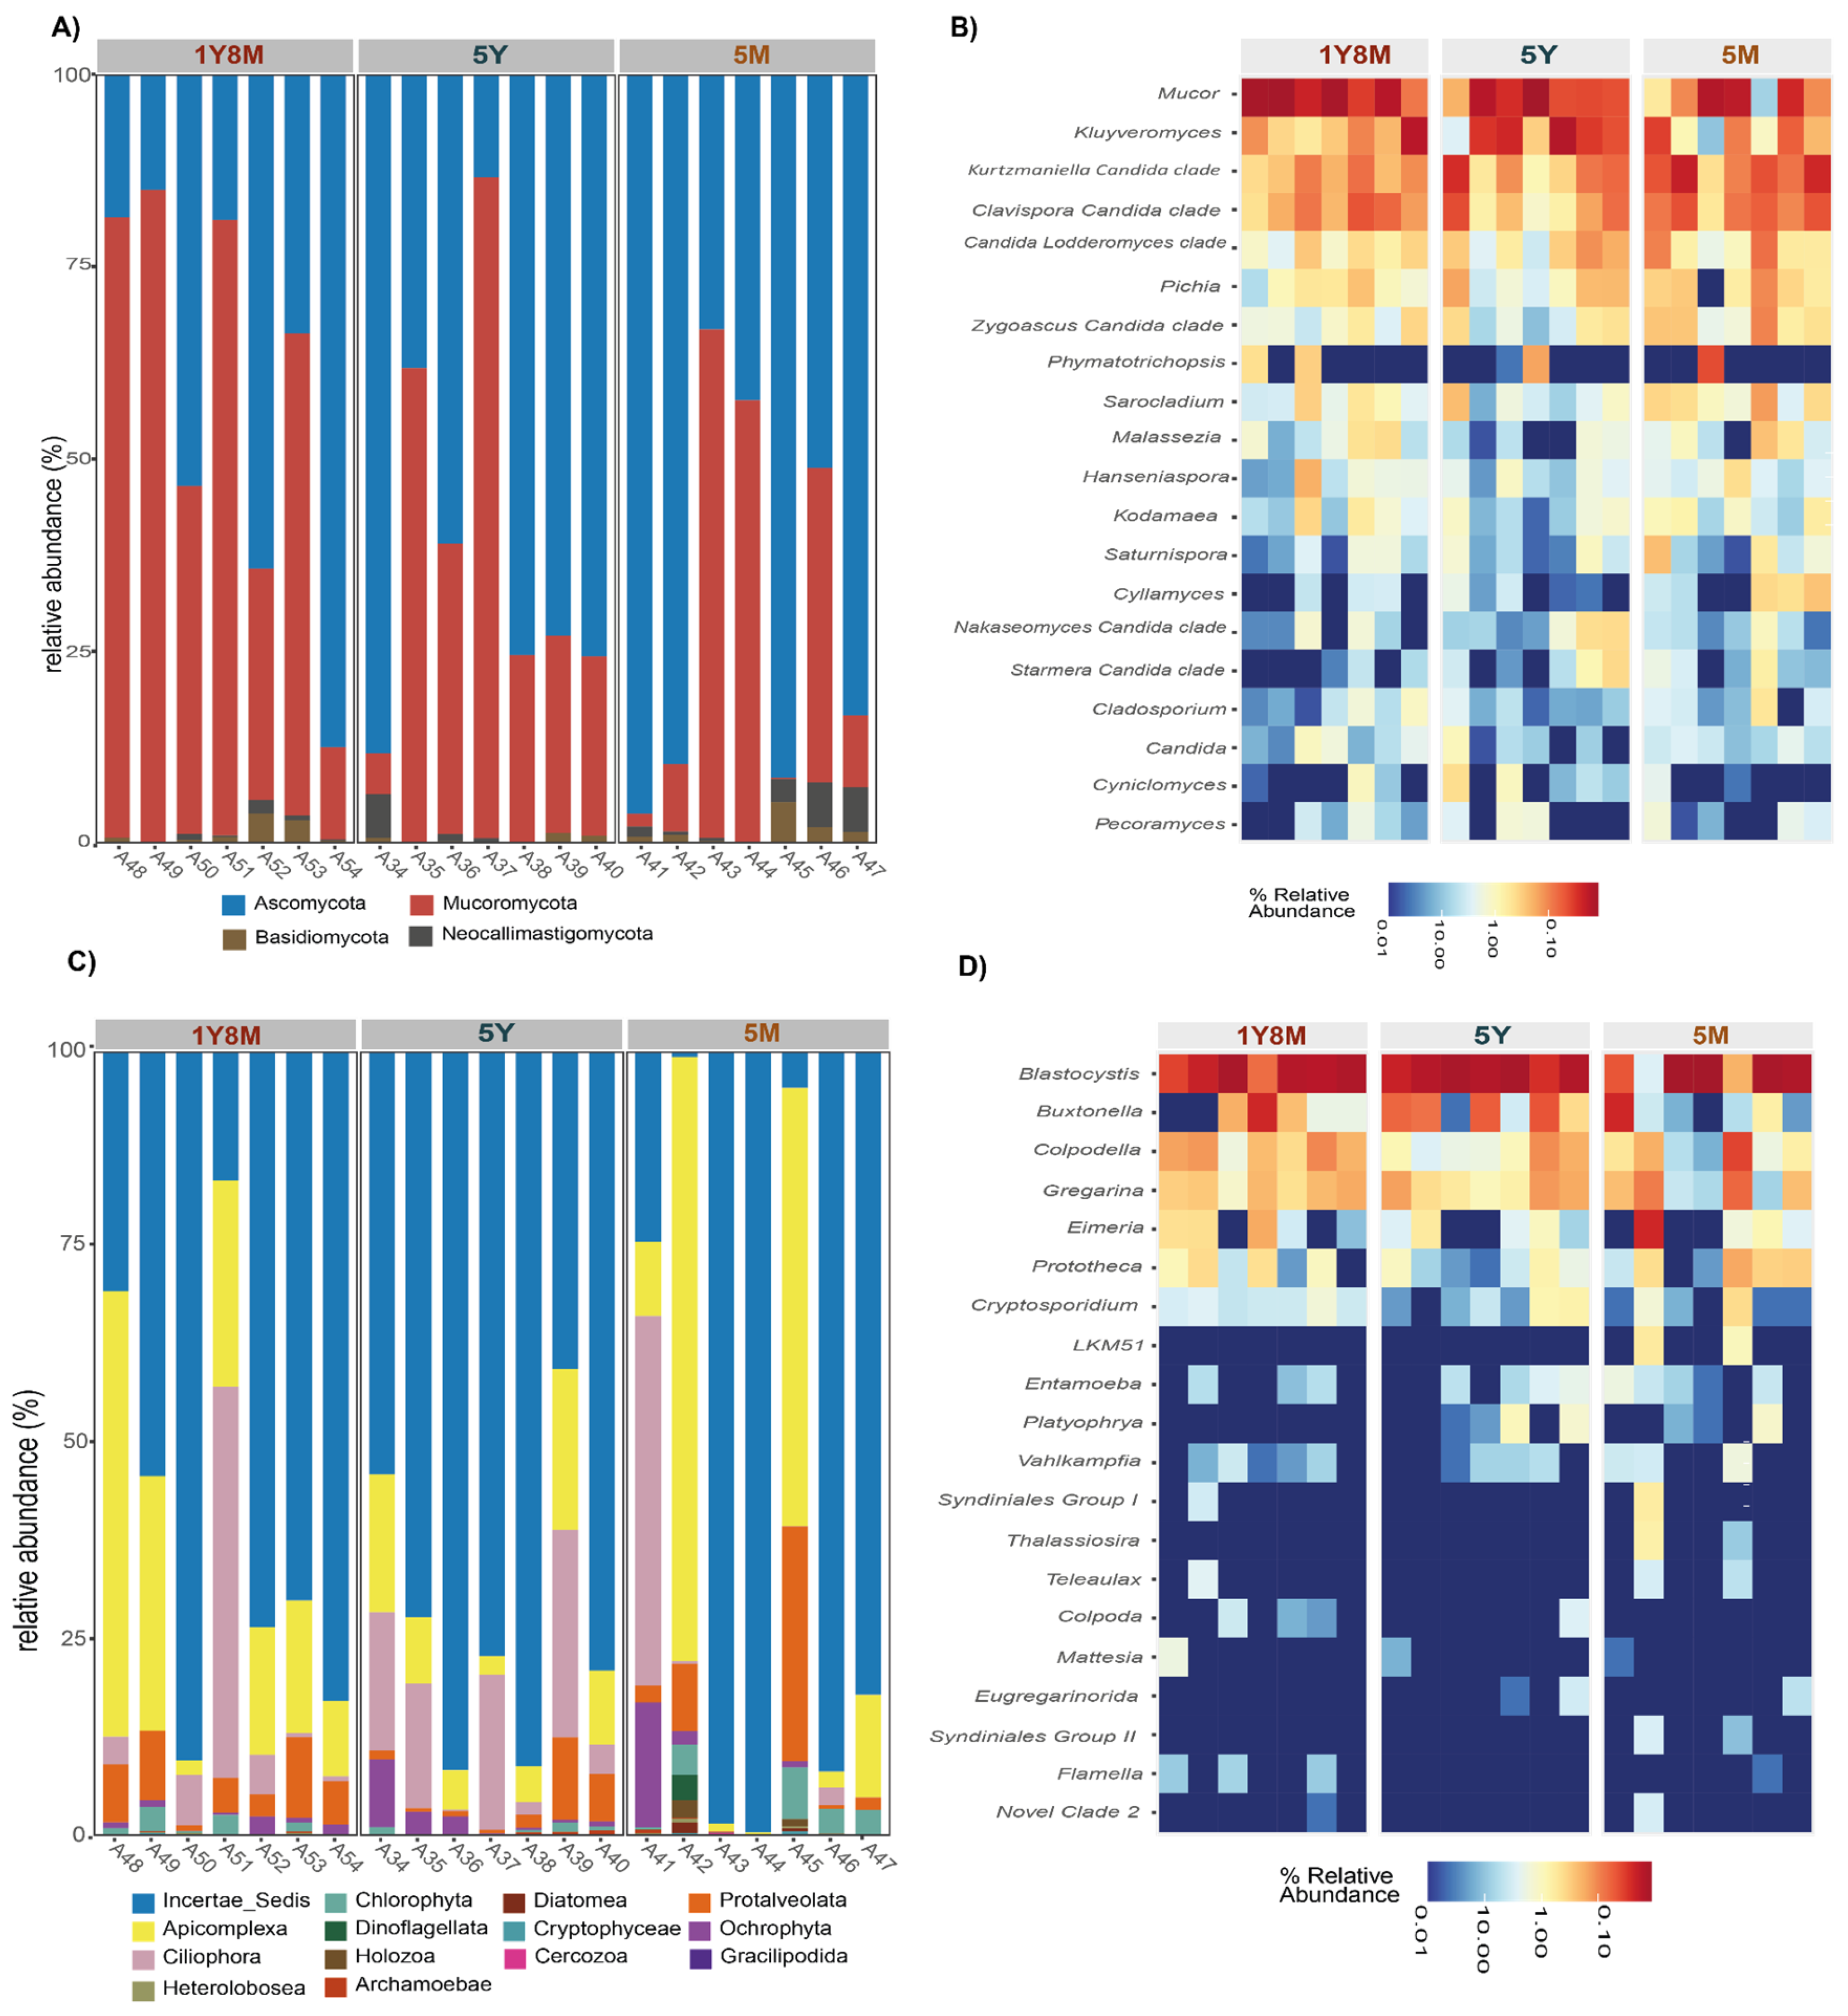
The analysis of the intestinal fungal microbiological structure in cattle revealed a predominance of the phylum Ascomycota and Mucoromycota across different ages (Figure 4A). Ascomycota showed a relative abundance of 75%, 80%, and 80% in cattle 1Y8M, 5Y, 5M, respectively. Mucoromycota had an abundance of 20%, 15%, and 25% at the same ages. Basidiomycota had lower representation with values of 3%, 3%, and 2%, while Neocallimastigomycota showed low percentages of 2%, 2%, and 3%.
Similarly, protists, the intestinal microbiological structure showed significant variations across different ages (Figure 4C). Incertae_Sedis was the predominant phylum at all ages, with relative abundances of 75%, 80%, and 75% in 1Y8M, 5Y, and 5M cattle, respectively. Apicomplexa had relative abundances of 20%, 15%, and 25%, while Ciliophora presented 15%, 10%, and 10%. Other phyla, such as Protalveolata, Chlorophyta, and Ochrophyta, maintained lower percentages, generally below 5%. These results indicate a clear predominance of Incertae_Sedis and a notable presence of Apicomplexa and Ciliophora, with other phyla showing relatively low but consistent abundances across different ages.
The heatmap illustrates the relative abundance of various protist and fungal genera in different samples, highlighting both the most and least abundant genera across different age groups (Figure 4B,D). In the fungi (Figure 4B), Mucor, Kluyveromyces, Kurtzmanella-Candida_clade, Clavispora-Candida_clade, Pichia, and Candida-Lodderomyces_clade were the most abundant genera in the intestinal microbiota of cattle at different ages, showing high relative abundances. In contrast, genera such as Phymatotrichopsis, Sarocladium, Malassezia, Hanseniaspora, Kodamaea, Saturnispora, Cylamyces, Nakaseomyces-Candida_clade, Starmera-Candida_clade, Cladosporium, Candida, Cyniclomyces, and Pecoramyces were the least abundant, with low relative abundances in all age groups. With respect to protists (Figure 4D), Blastocystis, Buxtonella, Colpodella, and Gregarina were the most abundant genera, showing high relative abundances across all age groups. In contrast, genera such as LKM51, Entamoeba, Platyophrya, Vahlkampfia, Syndiniales_Group_I, Thalassiosira, Teleaulax, Colpoda, Mastigina, Eugregarinorida, Syndiniales_Group_II, Flamella, and Novel_Clade_2 were the least abundant, with low relative abundances at all ages.

3.3. Biomarkers Identified Based on Age in Fungal and Protist

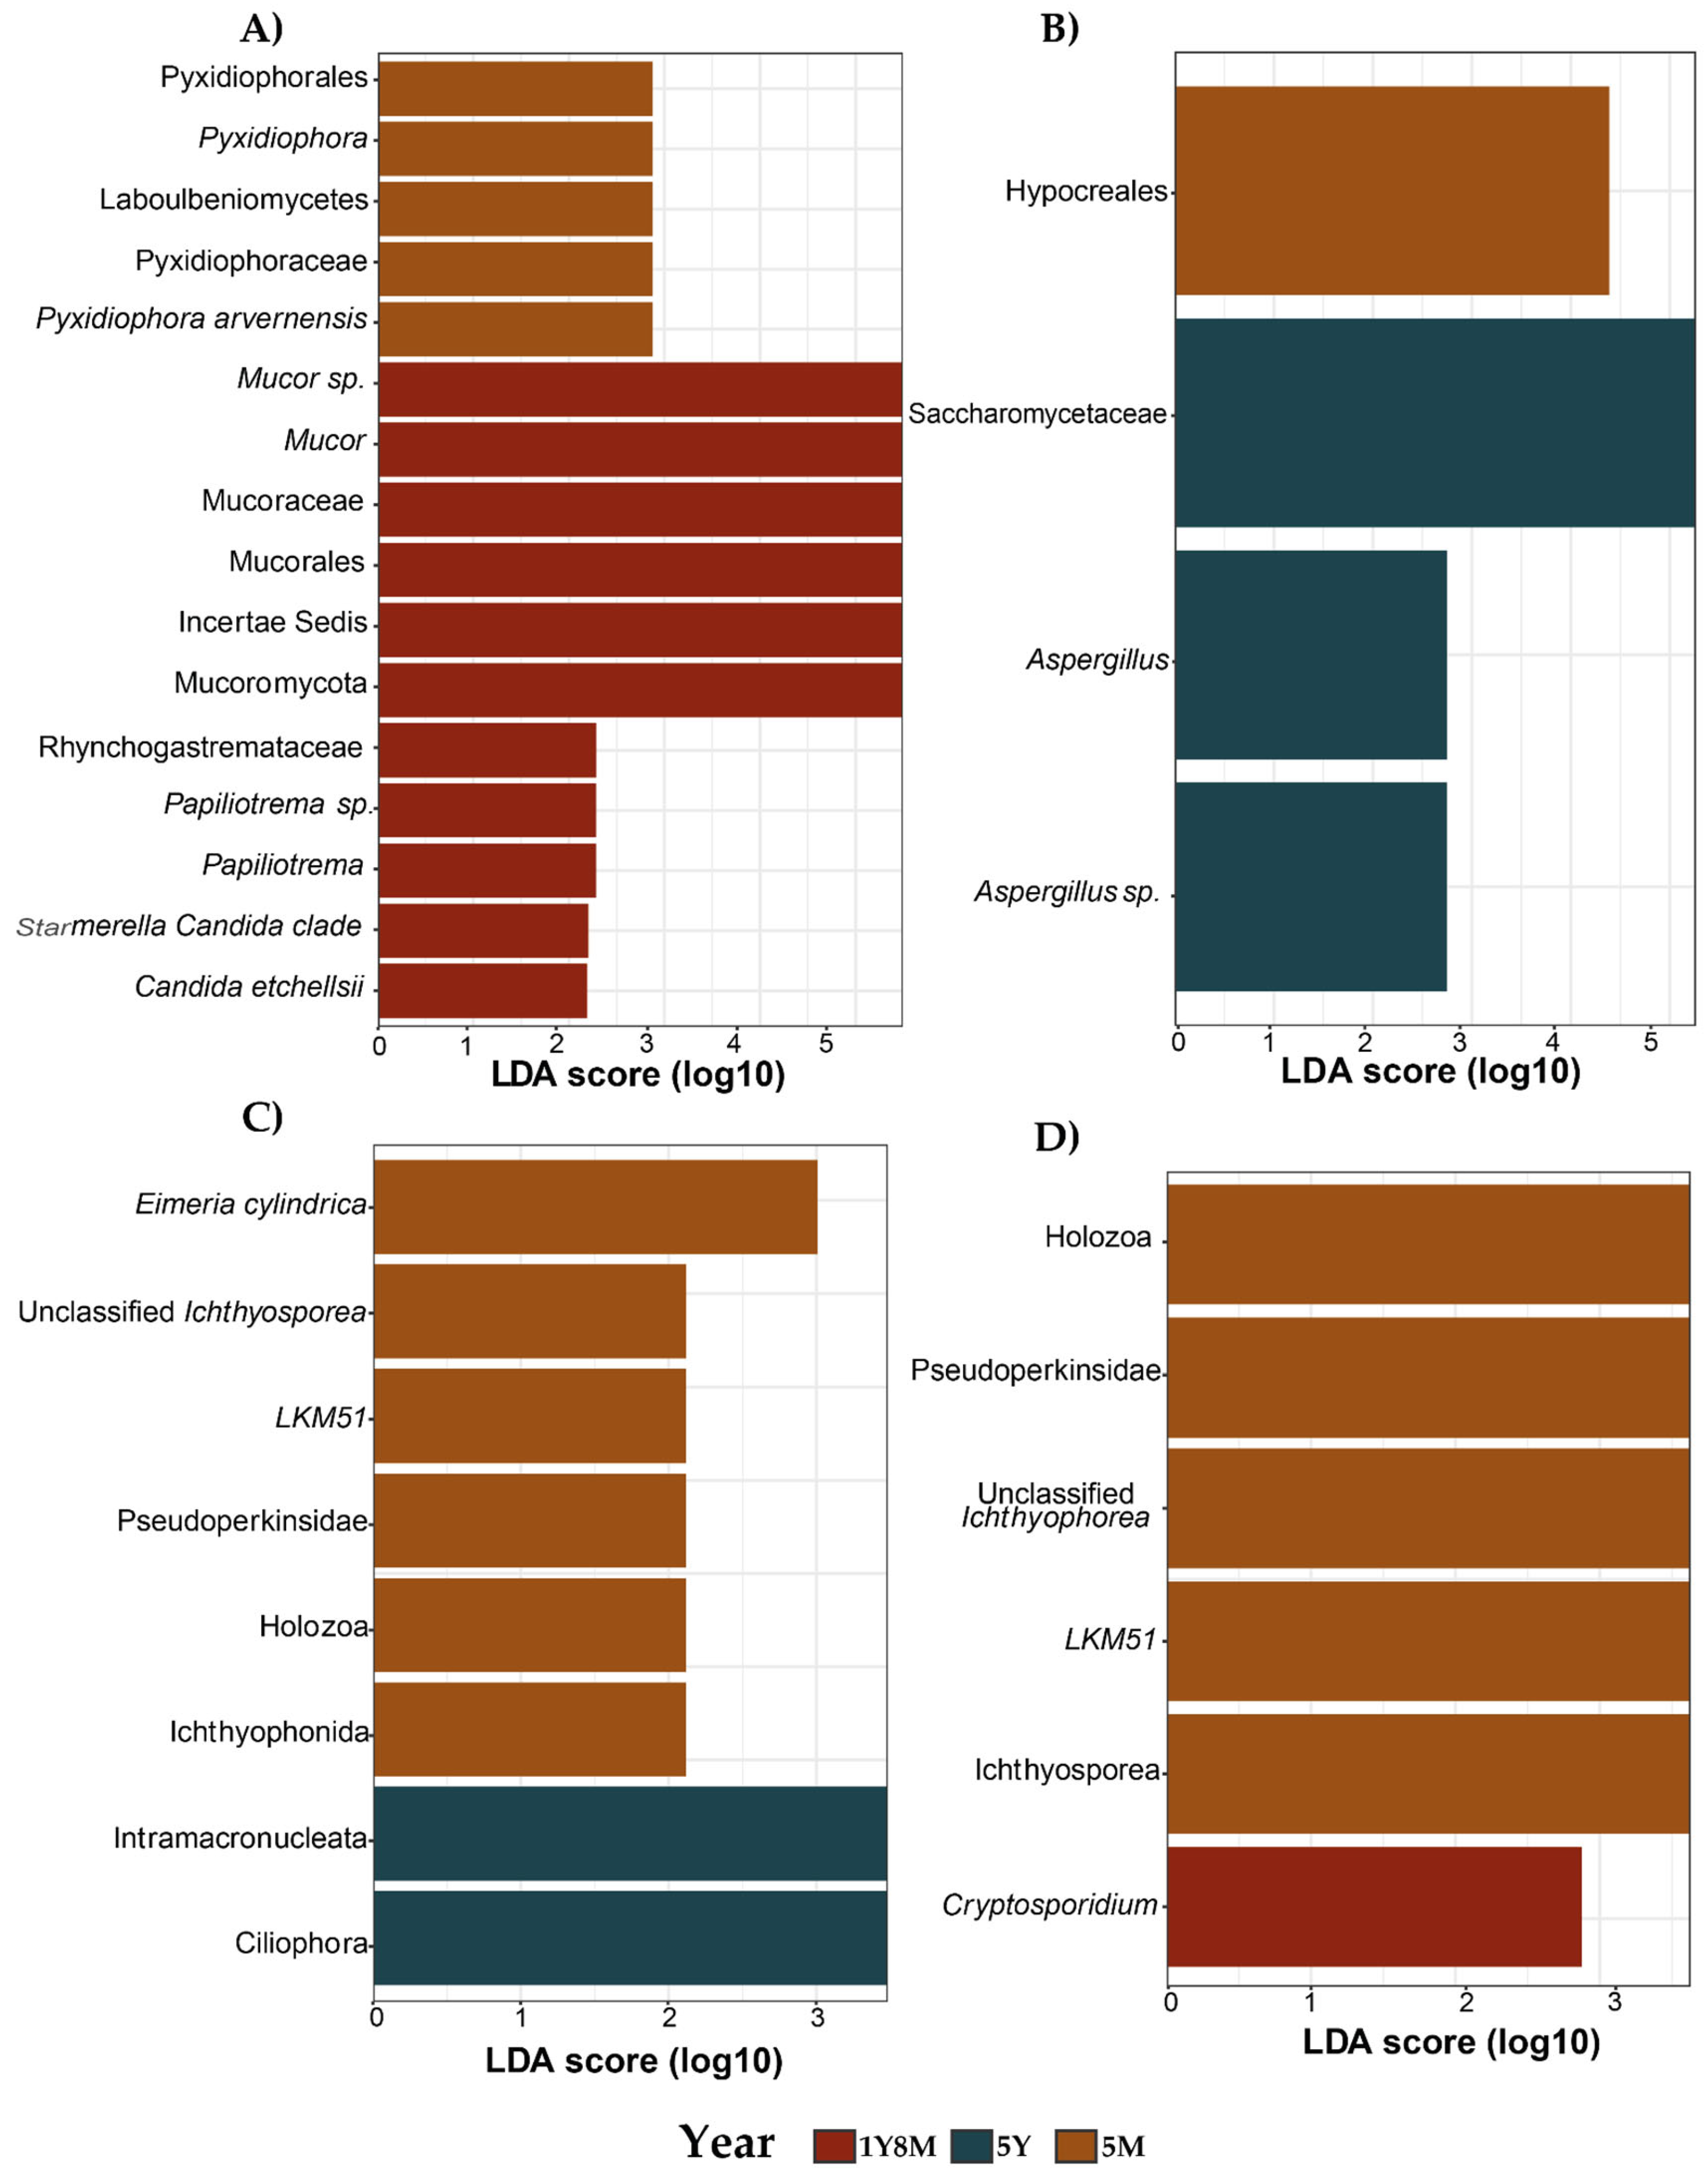
To identify specific fungal and protist taxa associated with different age groups, a comparative analysis of fecal microbiota compositions was conducted using the linear discriminant analysis effect size (LEfSe) approach (Figure 5). The taxa showing the most significant differences, from phylum to genus level, were identified based on their LDA scores. For fungi, the 1Y8M group showed enrichment in two phyla (Incertae Sedis and Mucoromycota); one order (Mucorales); two families (Mucoraceae and Rhynchogastremataceae); two genera (Mucor and Papiliotrema); and four species (Mucor sp., Papiliotrema sp., Candida etchellsii, and Starmerella Candida clade). In 5Y, the analysis indicated enrichment in one order (Pyxidiophorales); one class (Laboulbeniomycetes); one family (Pyxidiophoraceae); one genus (Pyxidiophora); and one species (Pyxidiophora arvernensis) (Figure 5A). For the 5M group, the analysis showed enrichment in one order (Hypocreales). In contrast, the 1Y8M group showed enrichment in one family (Saccharomycetaceae); one genus (Aspergillus); and one species (Aspergillus sp.) (Figure 5B).
For protists, the 5Y group exhibited enrichment in two phyla (Ciliophora and Intramacronucleata). In contrast, 5M group showed enrichment in one family (Pseudoperkinsea); one order (Ichthyophonida); one class (Holozoa); and three genera (Eimeria cylindrica, unclassified Ichthyosporea, and LKM51) (Figure 5C). Additionally, for the 5M group, there was further enrichment in two classes (Holozoa and Ichthyosporea); one family (Pseudoperkinsea); and two genera (unclassified Ichthyophorea and LKM51). In contrast, the 1Y8M group exhibited enrichment in one genus (Cryptosporidium) (Figure 5D).

3.4. Correlation of Alpha and Beta Diversity of Fungi with Clinical Parameters

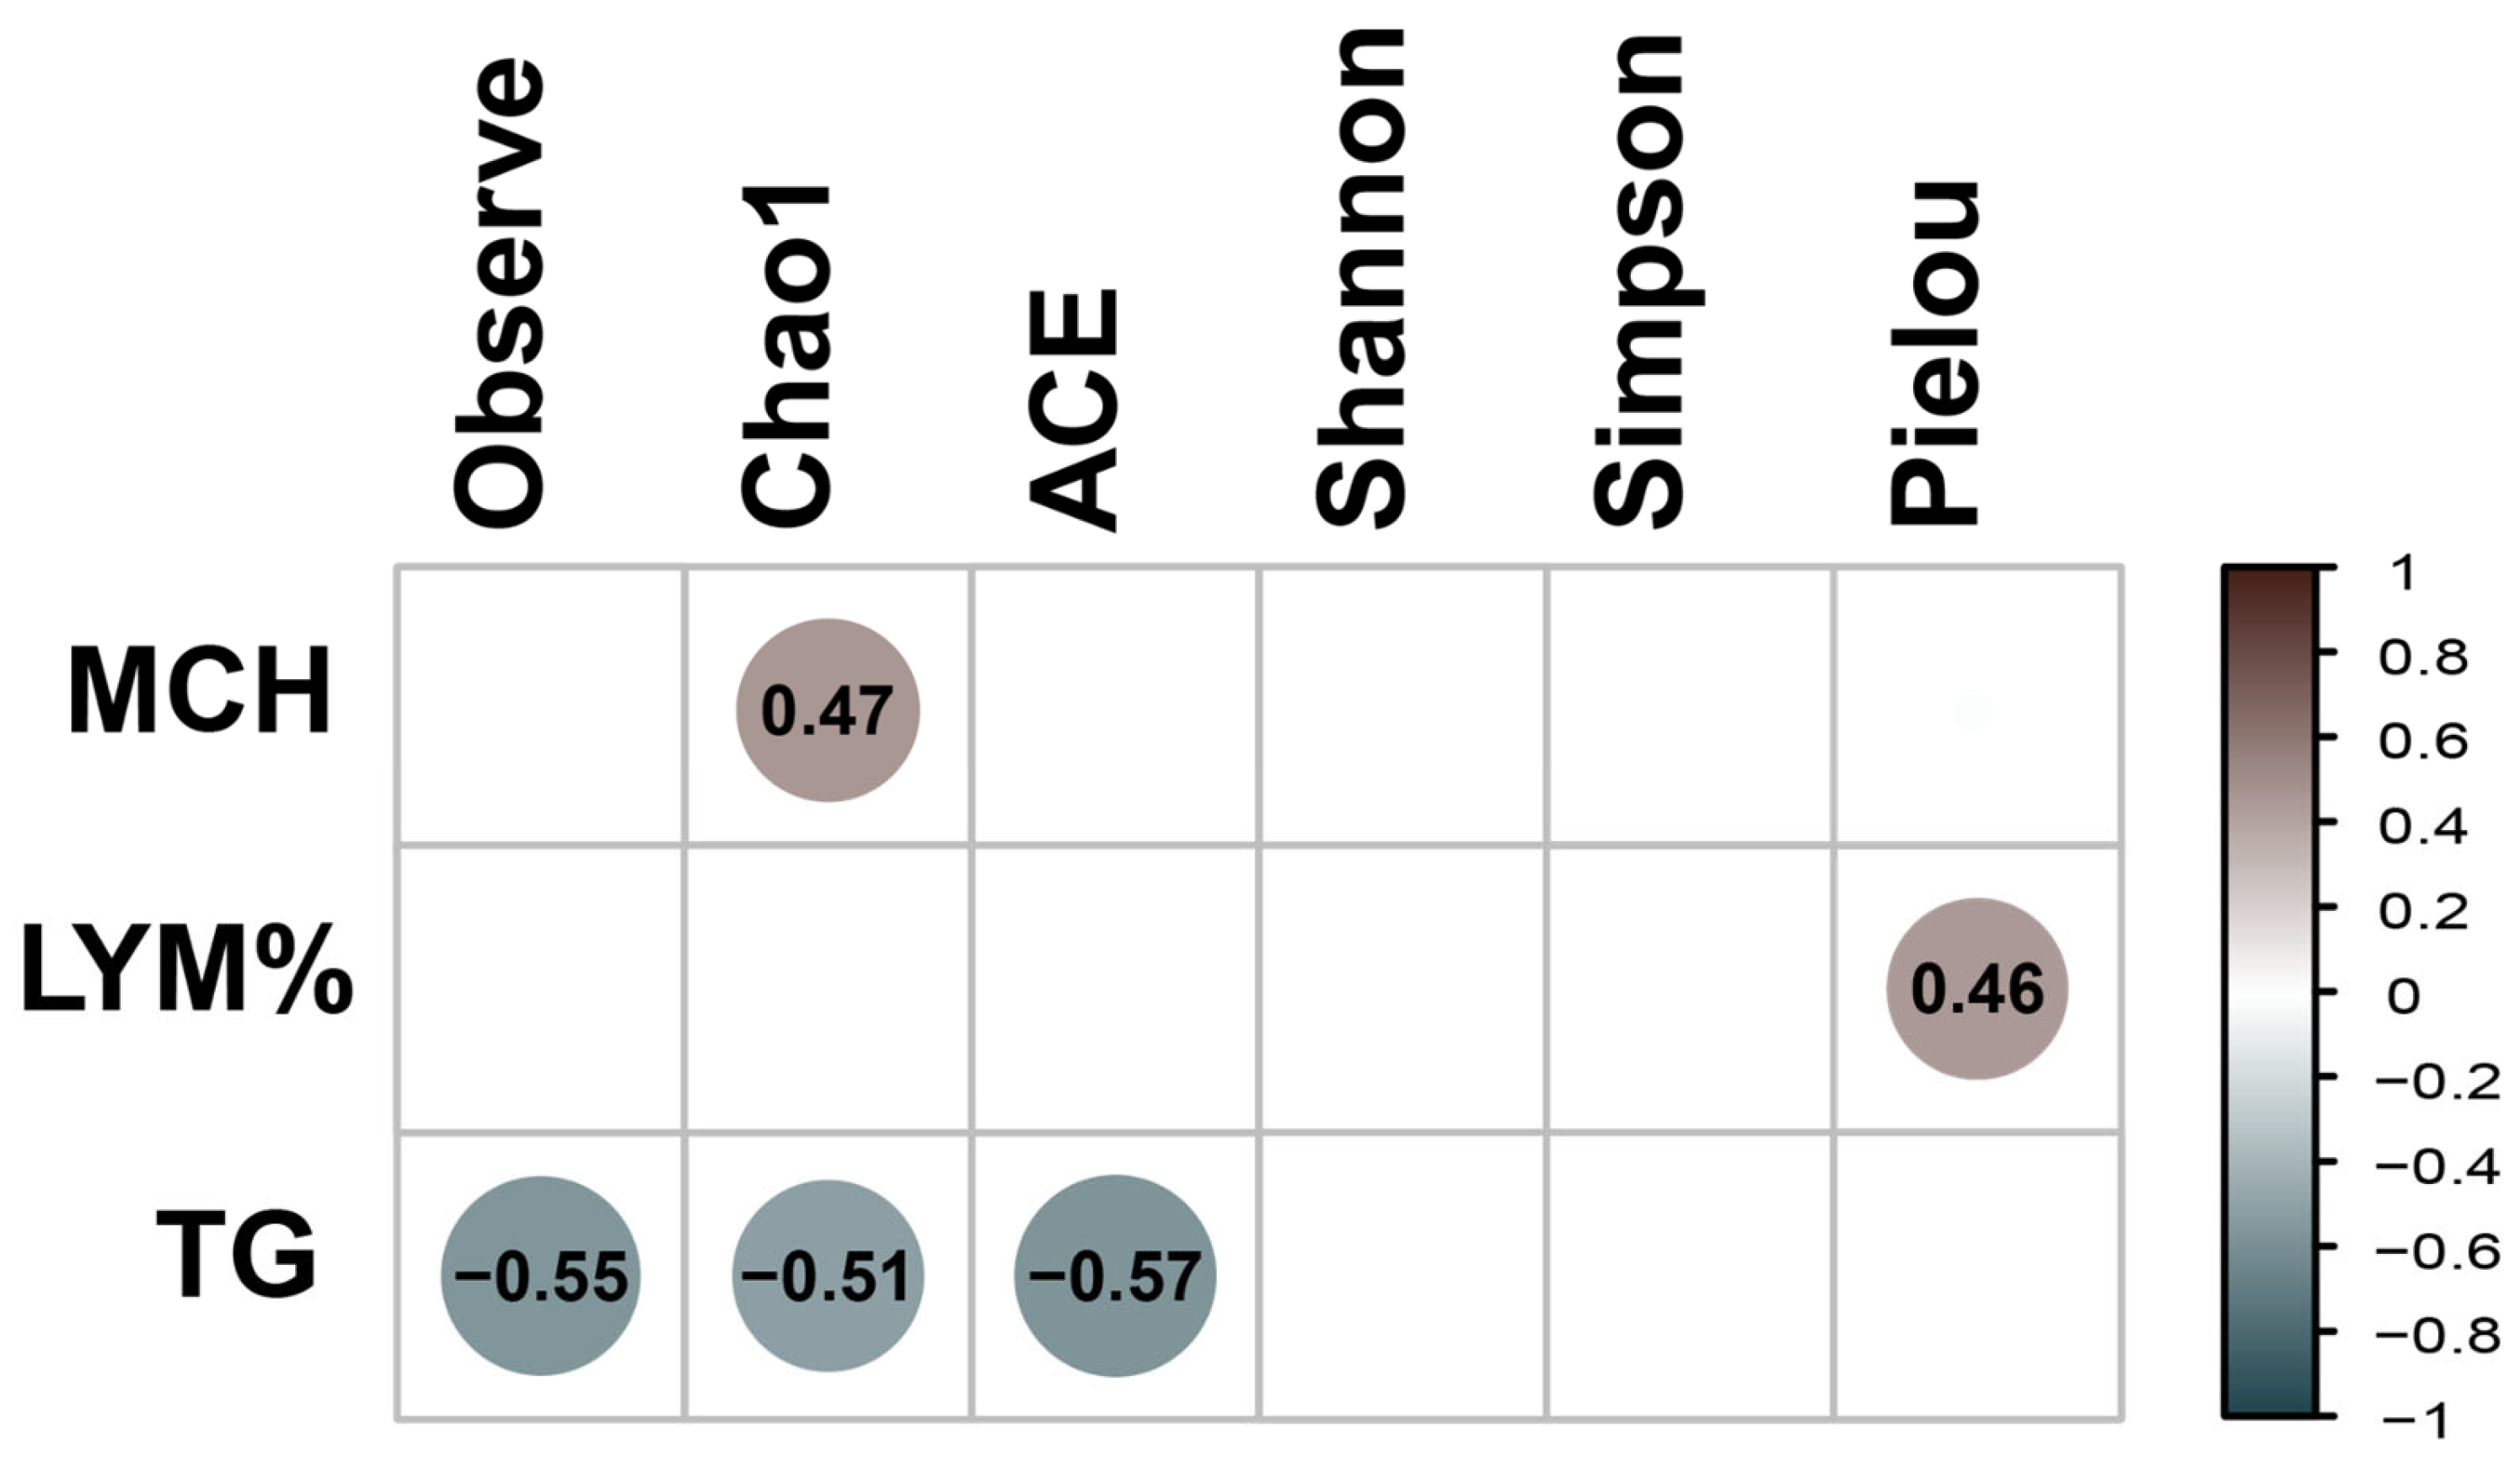
Analyzes of clinical parameters (Table S1) were performed using the Kruskal-Wallis test, considering age as the variable of interest. The parameters that were significant for age were: RBC, MCV, MCHC, MCH, LYM%, NEU SEG, LYM, EOS and TP (Table S2). Subsequently, Bonferroni post-hoc analysis was carried out. In the 5Y-5M comparison, significance was found in RBC, MCV, MCHC, MCH, NEU, SEG, LYM, EOS, LYM% and TP. Similarly, in 1Y8M-5M, significance was found in RBC and TP. Finally, 1Y8M-5Y, significance was found in MCV and MCH (Table S3). A Spearman correlation analysis was performed to examine the relationship between clinical parameters and alpha diversity indices fungus (Figure 6). The Observed, ACE, and Chao1 indices were significantly negatively correlated with TG. The Pielou index was significantly positively correlated with LYM%. The Chao1 index was significantly positively correlated with MCHC.
In the correlation analysis of clinical variables with beta diversity for fungi, several significant results were identified (Table 2). For the Jaccard index in the Mantel test, MCV showed a significant correlation (p = 0.03) and MCH (p = 0.02). In the Partial Mantel test, significant correlations were observed for MCV (p = 0.014) and MCH (p = 0.01). For the Unweighted Unifrac index in the Mantel test, significant correlations were found for MCH (p=0.045) and LYM% (p = 0.048). However, the Partial Mantel test did not show any significant correlations.

4. Discussion

In this study, the relationship between age and microbial diversity in cattle was investigated, finding that protist diversity and the composition of the fungal microbiota change significantly with age. Variations were found in the fungal composition and its relationship with hematological parameters. These findings are crucial as they highlight the dynamic nature of the gut microbiota and its interaction with host physiology over time.
Age did not show a significant correlation with fungal alpha diversity, which is consistent with previous findings in tigers [36] and goats [37]. However, age was significantly correlated with fungal composition, a phenomenon also reported in other mammals, such as humans [38,39] and monkeys [40]. This could be due to the intestine providing a relatively stable niche for fungal colonization [41], where predominant species establish early and maintain their presence throughout the host's life [42]. On the other hand, fungal composition may be more influenced by changes in the host's internal environment as it ages, such as dietary alterations, immune changes, and interactions with other microbiotas [43]. These factors can affect which fungal species are more abundant or dominant at different life stages, without necessarily changing the total number of species present [44].
In the present study, significant differences in alpha protist diversity were found between the three different age groups, highlighting the importance of considering age as an influential factor in microbial composition. However, no significant differences were observed in protist beta diversity. Although specific studies on the relationship between age and alpha protist diversity are scarce, some studies found significant differences in protist microbiota diversity in age-related contexts. For example, lower eukaryotic diversity has been reported in patients with Parkinson's disease [45], and it is suggested that eukaryotic biomass and diversity may be influenced by lifestyle and diet in populations of different ages [46]. Furthermore, a study in alpacas found significant differences in the diversity of alpha protists between different age groups and health states [47]. These findings highlight the need for studies specifically focused on the influence of age on eukaryotic diversity to better understand how this factor can affect the microbiota in different species and contexts.
The three age groups share similar dominant fungal phyla, including Ascomycota, Mucoromycota, Basidiomycota, and Neocallimastigomycota. These findings are consistent with previous studies on cattle and other ruminants, such as bovines [16,48] goats [49], and alpacas [47]. Similarly, in the analysis of protists, the dominant phyla were Incerta Sedis, Apicomplexa, and Ciliophora, which have also been reported in humans [46,50] and primates [51]. In our study, Incertae Sedis includes Blastocystis sp., which is predominant among the identified genera. This finding has also been reported in cattle [52], goats [53], camels [54], and humans [55].
Mucor was the most abundant genus found and it was also identified in the group of 1Y8M cattle as a biomarker, which aligns with studies that indicate that this genus is more prevalent in non-obese individuals and its abundance increases with weight loss, suggesting a favorable metabolic health state [56]. Mucor is also common in the human gastrointestinal tract and is associated with intestinal health [57] and has been reported in a higher proportion in adults than in young people [58]. Furthermore, in yaks with diarrhea, Mucor was not detected, indicating that its growth is restricted in the presence of diarrhea [59]. Blastocystis was the most abundant genus in this study and has been shown to have beneficial effects on the host's immune system, such as stimulating mucus production through the cytokine IL-22, which improves intestinal health and alleviates colitis symptoms [55]. Additionally, recent studies have associated Blastocystis colonization with greater bacterial diversity in the gut microbiota, indicative of a healthy microbiota [55,60]. The presence of Blastocystis correlates negatively with Bacteroides levels and positively with higher bacterial diversity, which is commonly associated with health and a lower incidence of inflammatory diseases [61]. These findings suggest that the high prevalence of Mucor and Blastocystis in the three age groups of healthy cattle could be related to a balanced and beneficial gut microbiome.
Aspergillus was identified as a biomarker in the 5Y group, it is common in the gastrointestinal tract of several animals and has been associated with beneficial roles such as fiber digestion, it also has potential pathogenic implications under certain conditions [62]. Metabolites produced by Aspergillus may play a role in maintaining a beneficial microbial balance in the absence of disease-triggering factors [63]. The presence of Aspergillus in healthy cattle may be related to its ability to interact with other microbial species in a beneficial way, promoting a balanced and healthy intestinal microbiome [63].
Eimeria cylindrica was identified as a biomarker in the 1Y8M group, despite its presence, the animals did not show clinical symptoms, suggesting that under specific conditions, this pathogen can be present without developing the disease [64]. This is in line with other studies that have found Eimeria spp. in cattle without clinical symptoms, indicating that factors such as host immunity and environmental conditions can influence the pathogenicity of these parasites [65,66]. Cryptosporidium was identified as a distinctive biomarker in the 5M group. It is known that Cryptosporidium is generally associated with severe diarrhea in young ruminants [67]. However, its presence in asymptomatic animals has been reported in asymptomatic lambs with Cryptosporidium xiaoi and Cryptosporidium ubiquitum [68]. This highlights the variability in the pathogenicity of Cryptosporidium depending on the species and the host's immune status [69,70]. The detection of Cryptosporidium in asymptomatic individuals underscores the need to interpret its presence in diagnostic and epidemiological studies with caution, as it does not always indicate active disease [71,72].
A significant negative evaluation was identified between alpha diversity indices and triglycerides, suggesting that lower fungal diversity is associated with higher triglyceride levels. Certain fungus can help maintain healthy triglyceride levels [56]. The abundance of Mucor racemosus has also been shown to significantly influence fasting triglyceride levels, suggesting its potential as a biomarker for cardiovascular risk [73]. Furthermore, hypertriglyceridemia in older people has been found to be associated with a reduction in gut mycobiome diversity [74]. A significant positive correlation between fungal alpha diversity and lymphocytes suggests that higher gut fungal diversity is associated with increased lymphocyte counts, highlighting the importance of gut mycobiome homeostasis for host immune functions [75]. For example, it has been shown that colonization of fungi such as Candida albicans can stimulate the proliferation of Th17 cells and IL-17 feedback, helping to fight infections [76]. Furthermore, the reduction of intestinal fungi has been correlated with decreases in immune factors in the blood, such as lymphocytes, underscoring the protective role of symbiotic fungi in calibrating the immune response [77]. Likewise, a significant positive correlation has been found between fungal alpha diversity and MCHC, which is positively associated with DNA levels and intestinal colonization of Candida albicans [78]. Since MCHC reflects the concentration of hemoglobin in red blood cells, these results suggest that greater fungal diversity could be linked to better hematological function.
Correlation analysis revealed that several hematological parameters, such as MCV and MCH, are significantly correlated with fungal beta diversity. These correlations suggest that changes in the composition and hemoglobin content of red blood cells may be associated with alterations in the composition of the intestinal mycobiota. Previous studies demonstrated that hematological health can influence the gut mycobiota, affecting both the diversity and abundance of certain fungal species [79]. Furthermore, fungal dysbiosis has been observed to be linked to inflammatory conditions and hematological diseases, highlighting the interaction between hematological status and intestinal health [80]. This underlines the importance of investigating how variations in hematological parameters influence the diversity and functionality of the intestinal mycobiota, which could have therapeutic implications to improve intestinal homeostasis and systemic health [38,80].
This study does not provide a comprehensive metabolic analysis linking microbiota changes to specific age-related variations in fungi and protists. Additional research is needed to investigate the metabolic pathways and their interactions with these microbiota components across different ages. These aspects highlight important directions for future research to better understand the intricate interactions between microbiota, age, and reproductive status.

5. Conclusions

We investigated the relationship between age and microbial diversity in cattle, revealing significant changes in both protist diversity and fungal microbiota composition with age. Although no significant differences were observed in the beta diversity of protists, variations in fungal composition were notably related to hematological parameters. These findings underscore the dynamic interplay between gut microbiota and host physiology over time. The stability of fungal alpha diversity amidst age-related compositional changes highlights the intestine as a stable niche for microbial colonization, influenced by factors such as diet, clinical parameters, and microbial interactions. All cattle in the study were maintained on a diet with the same components but in different concentrations. This study emphasizes the importance of understanding age-related microbial dynamics to inform livestock management and improve animal health, thereby contributing to broader ecological and biomedical research. However, the scope of the study was limited by the lack of comprehensive metabolic analyzes linking microbiota changes to specific age-related variations, indicating the need for further research in this area.

Supplementary Materials

The following supporting information can be downloaded at the website of this paper posted on Preprints.org., Figure S1: Rarefaction curves of species richness show the sequencing depth of fungi data obtained from gut samples. Figure S2: Rarefaction curves of species richness show the sequencing depth of protist data obtained from gut samples. Table S1: Clinical parameters of three age groups. Table S2: Kruskal-Wallis results for clinical parameters in cattle by age. Table S3: Posthoc Bonferroni results for clinical parameters in cattle by age.

Author Contributions

Conceptualization, R.E, Y.R, C.Q., C.A. and C.I.A.; methodology, R.E, Y.R, C.Q., D.D., D.R.; software, R.E., Y.R. and C.I.A; validation, R.E.,Y.R., S.L., W.A., J.L.M.; formal analysis, R.E., Y.R., C.Q., S.L., C.I.A; investigation, R.E., Y.R., C.Q., D.R. and C.I.A; resources, D.D., S.L., D.R., J.L.M. and C.I.A; data curation, R.E., Y.R., C.Q., C.A.; writing—original draft preparation, R.E., Y.R., C.Q., D.R. and C.I.A.; writing—review and editing, R.E., Y.R., C.A., S.L. and C.I.A.; visualization, R.E., Y.R., D.D., W.A., J.L.M. and C.I.A.; supervision, R.E., Y.R. and C.Q.; project administration, R.E., Y.R., C.Q., S.L., and D.R.; funding acquisition, C.Q., D.R., J.L.M and C.I.A. All authors have read and agreed to the published version of the manuscript.

Funding

This research was funded by the following research project: "Mejoramiento de la disponibilidad de material genético de ganado bovino con alto valor a nivel nacional 7 departamentos" of the Ministry of Agrarian Development and Irrigation (MIDAGRI) of the Peruvian Government, with grant numbers CUI 2432072.

Data Availability Statement

The raw data supporting the conclusions of this article will be made available by the authors on request.

Acknowledgments

We acknowledge the “Promeg Nacional” team for supporting the logistic activities. C.I.A. thanks Vicerrectorado de Investigación of UNTRM.

Conflicts of Interest

The authors declare no conflicts of interest.

References

  1. Sanjorjo, R.A.; Tseten, T.; Kang, M.-K.; Kwon, M.; Kim, S.-W. In Pursuit of Understanding the Rumen Microbiome. Fermentation 2023, 9, 114. [Google Scholar] [CrossRef]
  2. Pérez-Barbería, F.J. The Ruminant: Life History and Digestive Physiology of a Symbiotic Animal. In Sustainable and Environmentally Friendly Dairy Farms; García-Yuste, S., Ed.; Springer International Publishing: Cham, 2020; pp. 19–45. ISBN 978-3-030-46060-0. [Google Scholar]
  3. Negash, A. Gut Microbiota Ecology Role in Animal Nutrition and Health Performance. J. Clin. Microbiol. Antimicrob. 2022, 6, 1–14. [Google Scholar] [CrossRef]
  4. Liu, K.; Zhang, Y.; Yu, Z.; Xu, Q.; Zheng, N.; Zhao, S.; Huang, G.; Wang, J. Ruminal Microbiota–Host Interaction and Its Effect on Nutrient Metabolism. Anim. Nutr. 2021, 7, 49–55. [Google Scholar] [CrossRef]
  5. Noel, S.J.; Olijhoek, D.W.; Mclean, F.; Løvendahl, P.; Lund, P.; Højberg, O. Rumen and Fecal Microbial Community Structure of Holstein and Jersey Dairy Cows as Affected by Breed, Diet, and Residual Feed Intake. Animals 2019, 9, 498. [Google Scholar] [CrossRef] [PubMed]
  6. Wu, C.; Lyu, W.; Hong, Q.; Zhang, X.; Yang, H.; Xiao, Y. Gut Microbiota Influence Lipid Metabolism of Skeletal Muscle in Pigs. Front. Nutr. 2021, 8. [Google Scholar] [CrossRef] [PubMed]
  7. Yin, X.; Ji, S.; Duan, C.; Tian, P.; Ju, S.; Yan, H.; Zhang, Y.; Liu, Y. Age-Related Changes in the Ruminal Microbiota and Their Relationship With Rumen Fermentation in Lambs. Front. Microbiol. 2021, 12. [Google Scholar] [CrossRef] [PubMed]
  8. Guo, W.; Zhou, M.; Ma, T.; Bi, S.; Wang, W.; Zhang, Y.; Huang, X.; Guan, L.L.; Long, R. Survey of Rumen Microbiota of Domestic Grazing Yak during Different Growth Stages Revealed Novel Maturation Patterns of Four Key Microbial Groups and Their Dynamic Interactions. Anim. Microbiome 2020, 2, 23. [Google Scholar] [CrossRef] [PubMed]
  9. Du, Y.; Gao, Y.; Hu, M.; Hou, J.; Yang, L.; Wang, X.; Du, W.; Liu, J.; Xu, Q. Colonization and Development of the Gut Microbiome in Calves. J. Anim. Sci. Biotechnol. 2023, 14, 46. [Google Scholar] [CrossRef] [PubMed]
  10. Henderson, G.; Cox, F.; Ganesh, S.; Jonker, A.; Young, W.; Janssen, P.H. Rumen Microbial Community Composition Varies with Diet and Host, but a Core Microbiome Is Found across a Wide Geographical Range. Sci. Rep. 2015, 5, 14567. [Google Scholar] [CrossRef]
  11. Kyawt, Y.Y.; Aung, M.; Xu, Y.; Sun, Z.; Zhou, Y.; Zhu, W.; Padmakumar, V.; Tan, Z.; Cheng, Y. Dynamic Changes of Rumen Microbiota and Serum Metabolome Revealed Increases in Meat Quality and Growth Performances of Sheep Fed Bio-Fermented Rice Straw. J. Anim. Sci. Biotechnol. 2024, 15, 34. [Google Scholar] [CrossRef]
  12. Martin, C.; Morgavi, D.P.; Doreau, M. Methane Mitigation in Ruminants: From Microbe to the Farm Scale. animal 2010, 4, 351–365. [Google Scholar] [CrossRef]
  13. Lv, Q.-B.; Meng, J.-X.; Ma, H.; Liu, R.; Qin, Y.; Qin, Y.-F.; Geng, H.-L.; Ni, H.-B.; Zhang, X.-X. Description of Gut Mycobiota Composition and Diversity of Caprinae Animals. Microbiol. Spectr. 2023, 11, e0242422. [Google Scholar] [CrossRef]
  14. Chen, X.; An, M.; Zhang, W.; Li, K.; Kulyar, M.F.-E.-A.; Duan, K.; Zhou, H.; Wu, Y.; Wan, X.; Li, J.; et al. Integrated Bacteria-Fungi Diversity Analysis Reveals the Gut Microbial Changes in Buffalo With Mastitis. Front. Vet. Sci. 2022, 9, 918541. [Google Scholar] [CrossRef]
  15. Ramírez, A.L.; Herrera, G.; Muñoz, M.; Vega, L.; Cruz-Saavedra, L.; García-Corredor, D.; Pulido-Medellín, M.; Bulla-Castañeda, D.M.; Giraldo, J.C.; Bernal, M.C.; et al. Describing the Intestinal Microbiota of Holstein Fasciola-Positive and -Negative Cattle from a Hyperendemic Area of Fascioliasis in Central Colombia. PLoS Negl. Trop. Dis. 2021, 15, e0009658. [Google Scholar] [CrossRef]
  16. Gao, L.; Wang, S.; Yang, M.; Wang, L.; Li, Z.; Yang, L.; Li, G.; Wen, T. Gut Fungal Community Composition Analysis of Myostatin Mutant Cattle Prepared by CRISPR/Cas9. Front. Vet. Sci. 2023, 9. [Google Scholar] [CrossRef] [PubMed]
  17. Donati Zeppa, S.; Agostini, D.; Ferrini, F.; Gervasi, M.; Barbieri, E.; Bartolacci, A.; Piccoli, G.; Saltarelli, R.; Sestili, P.; Stocchi, V. Interventions on Gut Microbiota for Healthy Aging. Cells 2023, 12, 34. [Google Scholar] [CrossRef]
  18. Varada, V.V.; Kumar, S.; Chhotaray, S.; Tyagi, A.K. Host-Specific Probiotics Feeding Influence Growth, Gut Microbiota, and Fecal Biomarkers in Buffalo Calves. AMB Express 2022, 12, 118. [Google Scholar] [CrossRef] [PubMed]
  19. Romanzin, A.; Degano, L.; Vicario, D.; Spanghero, M. Feeding Efficiency and Behavior of Young Simmental Bulls Selected for High Growth Capacity: Comparison of Bulls with High vs. Low Residual Feed Intake. Livest. Sci. 2021, 249, 104525. [Google Scholar] [CrossRef]
  20. Doyle, J.L.; Berry, D.P.; Veerkamp, R.F.; Carthy, T.R.; Evans, R.D.; Walsh, S.W.; Purfield, D.C. Genomic Regions Associated with Muscularity in Beef Cattle Differ in Five Contrasting Cattle Breeds. Genet. Sel. Evol. 2020, 52, 2. [Google Scholar] [CrossRef] [PubMed]
  21. Raza, S.H.A.; Khan, S.; Amjadi, M.; Abdelnour, S.A.; Ohran, H.; Alanazi, K.M.; Abd El-Hack, M.E.; Taha, A.E.; Khan, R.; Gong, C.; et al. Genome-Wide Association Studies Reveal Novel Loci Associated with Carcass and Body Measures in Beef Cattle. Arch. Biochem. Biophys. 2020, 694, 108543. [Google Scholar] [CrossRef] [PubMed]
  22. Baldini, M.; Da Borso, F.; Rossi, A.; Taverna, M.; Bovolenta, S.; Piasentier, E.; Corazzin, M. Environmental Sustainability Assessment of Dairy Farms Rearing the Italian Simmental Dual-Purpose Breed. Animals 2020, 10, 296. [Google Scholar] [CrossRef]
  23. Falta, D.; Zapletalová, L.; Hanuš, O.; Kučera, J.; Večeřa, M.; Chládek, G.; Filipčík, R.; Kopec, T.; Lategan, F.S. The Interaction between the Milk Production, Milk Components with a Low Frequency of Analysis and Factors Affecting the Milk Composition in Dual-Purpose Simmental Cows. 2023.
  24. Vaulot, D.; Geisen, S.; Mahé, F.; Bass, D. Pr2-Primers: An 18S rRNA Primer Database for Protists. Mol. Ecol. Resour. 2022, 22, 168–179. [Google Scholar] [CrossRef]
  25. Mishra, P.; Tulsani, N.J.; Jakhesara, S.J.; Dafale, N.A.; Patil, N.V.; Purohit, H.J.; Koringa, P.G.; Joshi, C.G. Exploring the Eukaryotic Diversity in Rumen of Indian Camel (Camelus Dromedarius) Using 18S rRNA Amplicon Sequencing. Arch. Microbiol. 2020, 202, 1861–1872. [Google Scholar] [CrossRef] [PubMed]
  26. Bukin, Y.S.; Mikhailov, I.S.; Petrova, D.P.; Galachyants, Y.P.; Zakharova, Y.R.; Likhoshway, Y.V. The Effect of Metabarcoding 18S rRNA Region Choice on Diversity of Microeukaryotes Including Phytoplankton. World J. Microbiol. Biotechnol. 2023, 39, 229. [Google Scholar] [CrossRef]
  27. Velásquez, A.R.; Burca, C.; Vargas, L. Effects of Salinity on Three Mandarin Cultivars Grafted on Two Different Rootstocks. Peruvian J. Agron. 2022, 6, 114–122. [Google Scholar] [CrossRef]
  28. Latimer, K.S. Duncan and Prasse’s Veterinary Laboratory Medicine: Clinical Pathology; John Wiley & Sons, 2011; ISBN 978-0-8138-2014-9.
  29. Bolyen, E.; Rideout, J.R.; Dillon, M.R.; Bokulich, N.A.; Abnet, C.C.; Al-Ghalith, G.A.; Alexander, H.; Alm, E.J.; Arumugam, M.; Asnicar, F.; et al. Reproducible, Interactive, Scalable and Extensible Microbiome Data Science Using QIIME 2. Nat. Biotechnol. 2019, 37, 852–857. [Google Scholar] [CrossRef]
  30. Callahan, B.J.; McMurdie, P.J.; Rosen, M.J.; Han, A.W.; Johnson, A.J.A.; Holmes, S.P. DADA2: High-Resolution Sample Inference from Illumina Amplicon Data. Nat. Methods 2016, 13, 581–583. [Google Scholar] [CrossRef]
  31. Katoh, K.; Misawa, K.; Kuma, K.; Miyata, T. MAFFT: A Novel Method for Rapid Multiple Sequence Alignment Based on Fast Fourier Transform. Nucleic Acids Res. 2002, 30, 3059–3066. [Google Scholar] [CrossRef] [PubMed]
  32. McMurdie, P.J.; Holmes, S. Phyloseq: An R Package for Reproducible Interactive Analysis and Graphics of Microbiome Census Data. PloS One 2013, 8, e61217. [Google Scholar] [CrossRef]
  33. Liu, C.; Cui, Y.; Li, X.; Yao, M. Microeco: An R Package for Data Mining in Microbial Community Ecology. FEMS Microbiol. Ecol. 2021, 97, fiaa255. [Google Scholar] [CrossRef]
  34. Core team, R. R A Language and Environment for Statistical Computing. Stat. Comput. 2020. [Google Scholar]
  35. Anderson, M.J. Permutational Multivariate Analysis of Variance (PERMANOVA). In Wiley StatsRef: Statistics Reference Online; John Wiley & Sons, Ltd, 2017; pp. 1–15 ISBN 978-1-118-44511-2.
  36. Jiang, H.; Chen, W.; Su, L.; Huang, M.; Lin, L.; Su, Q.; Li, G.; Ahmad, H.I.; Li, L.; Zhang, X.; et al. Impact of Host Intraspecies Genetic Variation, Diet, and Age on Bacterial and Fungal Intestinal Microbiota in Tigers. MicrobiologyOpen 2020, 9, e1050. [Google Scholar] [CrossRef] [PubMed]
  37. Li, A.; Yang, Y.; Qin, S.; Lv, S.; Jin, T.; Li, K.; Han, Z.; Li, Y. Microbiome Analysis Reveals Gut Microbiota Alteration of Early-Weaned Yimeng Black Goats with the Effect of Milk Replacer and Age. Microb. Cell Factories 2021, 20, 78. [Google Scholar] [CrossRef] [PubMed]
  38. Shuai, M.; Fu, Y.; Zhong, H.; Gou, W.; Jiang, Z.; Liang, Y.; Miao, Z.; Xu, J.-J.; Huynh, T.; Wahlqvist, M.L.; et al. Mapping the Human Gut Mycobiome in Middle-Aged and Elderly Adults: Multiomics Insights and Implications for Host Metabolic Health. Gut 2022, 71, 1812–1820. [Google Scholar] [CrossRef] [PubMed]
  39. Al Bataineh, M.T.; Alzaatreh, A.; Hajjo, R.; Banimfreg, B.H.; Dash, N.R. Compositional Changes in Human Gut Microbiota Reveal a Putative Role of Intestinal Mycobiota in Metabolic and Biological Decline during Aging. Nutr. Healthy Aging 2021, 6, 269–283. [Google Scholar] [CrossRef]
  40. Sun, B.; Gu, Z.; Wang, X.; Huffman, M.A.; Garber, P.A.; Sheeran, L.K.; Zhang, D.; Zhu, Y.; Xia, D.-P.; Li, J. Season, Age, and Sex Affect the Fecal Mycobiota of Free-Ranging Tibetan Macaques (Macaca Thibetana). Am. J. Primatol. 2018, 80, e22880. [Google Scholar] [CrossRef] [PubMed]
  41. Kapitan, M.; Niemiec, M.J.; Steimle, A.; Frick, J.S.; Jacobsen, I.D. Fungi as Part of the Microbiota and Interactions with Intestinal Bacteria. In Fungal Physiology and Immunopathogenesis; Rodrigues, M.L., Ed.; Springer International Publishing: Cham, 2019; pp. 265–301. ISBN 978-3-030-30237-5. [Google Scholar]
  42. Bożena, D.-K.; Iwona, D.; Ilona, K. The Mycobiome – a Friendly Cross-Talk between Fungal Colonizers and Their Host. Ann. Parasitol. 2016, 62, 175–184. [Google Scholar] [CrossRef] [PubMed]
  43. Iliev, I.D.; Leonardi, I. Fungal Dysbiosis: Immunity and Interactions at Mucosal Barriers. Nat. Rev. Immunol. 2017, 17, 635–646. [Google Scholar] [CrossRef]
  44. Richard, M.L.; Sokol, H. The Gut Mycobiota: Insights into Analysis, Environmental Interactions and Role in Gastrointestinal Diseases. Nat. Rev. Gastroenterol. Hepatol. 2019, 16, 331–345. [Google Scholar] [CrossRef]
  45. Weis, S.; Meisner, A.; Schwiertz, A.; Unger, M.M.; Becker, A.; Faßbender, K.; Schnell, S.; Schäfer, K.-H.; Egert, M. Association between Parkinson’s Disease and the Faecal Eukaryotic Microbiota. Npj Park. Dis. 2021, 7, 1–7. [Google Scholar] [CrossRef]
  46. Parfrey, L.W.; Walters, W.A.; Lauber, C.L.; Clemente, J.C.; Berg-Lyons, D.; Teiling, C.; Kodira, C.; Mohiuddin, M.; Brunelle, J.; Driscoll, M.; et al. Communities of Microbial Eukaryotes in the Mammalian Gut within the Context of Environmental Eukaryotic Diversity. Front. Microbiol. 2014, 5. [Google Scholar] [CrossRef]
  47. Sanchez, D.; Zapata, C.; Romero, Y.; Flores-Huarco, N.H.; Oros, O.; Alvarado, W.; Quilcate, C.; Guevara-Alvarado, H.M.; Estrada, R.; Coila, P. Parasitism-Induced Changes in Microbial Eukaryotes of Peruvian Alpaca Gastrointestinal Tract. Life 2024, 14, 187. [Google Scholar] [CrossRef]
  48. Wang, Y.; Fu, Y.; He, Y.; Kulyar, M.F.-A.; Iqbal, M.; Li, K.; Liu, J. Longitudinal Characterization of the Gut Bacterial and Fungal Communities in Yaks. J. Fungi 2021, 7, 559. [Google Scholar] [CrossRef]
  49. Zhang, K.; Li, B.; Guo, M.; Liu, G.; Yang, Y.; Wang, X.; Chen, Y.; Zhang, E. Maturation of the Goat Rumen Microbiota Involves Three Stages of Microbial Colonization. Animals 2019, 9, 1028. [Google Scholar] [CrossRef]
  50. Geng, X.; Liu, Y.; Xu, W.; Li, G.; Xue, B.; Feng, Y.; Tang, S.; Wei, W.; Yuan, H. Eukaryotes May Play an Important Ecological Role in the Gut Microbiome of Graves’ Disease. Front. Immunol. 2024, 15. [Google Scholar] [CrossRef]
  51. Mann, A.E.; Mazel, F.; Lemay, M.A.; Morien, E.; Billy, V.; Kowalewski, M.; Di Fiore, A.; Link, A.; Goldberg, T.L.; Tecot, S.; et al. Biodiversity of Protists and Nematodes in the Wild Nonhuman Primate Gut. ISME J. 2020, 14, 609–622. [Google Scholar] [CrossRef]
  52. Fu, Y.; Zhang, K.; Yang, M.; Li, X.; Chen, Y.; Li, J.; Xu, H.; Dhakal, P.; Zhang, L. Metagenomic Analysis Reveals the Relationship between Intestinal Protozoan Parasites and the Intestinal Microecological Balance in Calves. Parasit. Vectors 2023, 16, 257. [Google Scholar] [CrossRef]
  53. Song, J.-K.; Yin, Y.-L.; Yuan, Y.-J.; Tang, H.; Ren, G.-J.; Zhang, H.-J.; Li, Z.-X.; Zhang, Y.-M.; Zhao, G.-H. First Genotyping of Blastocystis Sp. in Dairy, Meat, and Cashmere Goats in Northwestern China. Acta Trop. 2017, 176, 277–282. [Google Scholar] [CrossRef]
  54. Yang, X.; Li, Y.; Wang, Y.; Wang, J.; Lai, P.; Li, Y.; Song, J.; Qi, M.; Zhao, G. Molecular Characterization of Blastocystis Sp. in Camelus Bactrianus in Northwestern China. Animals 2021, 11, 3016. [Google Scholar] [CrossRef] [PubMed]
  55. Lepczyńska, M.; Białkowska, J.; Dzika, E.; Piskorz-Ogórek, K.; Korycińska, J. Blastocystis: How Do Specific Diets and Human Gut Microbiota Affect Its Development and Pathogenicity? Eur. J. Clin. Microbiol. Infect. Dis. 2017, 36, 1531–1540. [Google Scholar] [CrossRef] [PubMed]
  56. Mar Rodríguez, M.; Pérez, D.; Javier Chaves, F.; Esteve, E.; Marin-Garcia, P.; Xifra, G.; Vendrell, J.; Jové, M.; Pamplona, R.; Ricart, W.; et al. Obesity Changes the Human Gut Mycobiome. Sci. Rep. 2015, 5, 14600. [Google Scholar] [CrossRef]
  57. Borges, F.M.; de Paula, T.O.; Sarmiento, M.R.A.; de Oliveira, M.G.; Pereira, M.L.M.; Toledo, I.V.; Nascimento, T.C.; Ferreira-Machado, A.B.; Silva, V.L.; Diniz, C.G. Fungal Diversity of Human Gut Microbiota Among Eutrophic, Overweight, and Obese Individuals Based on Aerobic Culture-Dependent Approach. Curr. Microbiol. 2018, 75, 726–735. [Google Scholar] [CrossRef]
  58. Alonso, R.; Pisa, D.; Fernández-Fernández, A.M.; Carrasco, L. Infection of Fungi and Bacteria in Brain Tissue From Elderly Persons and Patients With Alzheimer’s Disease. Front. Aging Neurosci. 2018, 10. [Google Scholar] [CrossRef]
  59. Liu, J.; Wang, X.; Zhang, W.; Kulyar, M.F.-A.; Ullah, K.; Han, Z.; Qin, J.; Bi, C.; Wang, Y.; Li, K. Comparative Analysis of Gut Microbiota in Healthy and Diarrheic Yaks. Microb. Cell Factories 2022, 21, 111. [Google Scholar] [CrossRef]
  60. Rajamanikam, A.; Isa, M.N.M.; Samudi, C.; Devaraj, S.; Govind, S.K. Gut Bacteria Influence Blastocystis Sp. Phenotypes and May Trigger Pathogenicity. PLoS Negl. Trop. Dis. 2023, 17, e0011170. [Google Scholar] [CrossRef]
  61. Deng, L.; Wojciech, L.; Gascoigne, N.R.J.; Peng, G.; Tan, K.S.W. New Insights into the Interactions between Blastocystis, the Gut Microbiota, and Host Immunity. PLOS Pathog. 2021, 17, e1009253. [Google Scholar] [CrossRef]
  62. Arowolo, F.; Pierre, J.F.; Blaser, M.; Shanmuganayagam, D. Longitudinal Effects of Dietary Oxidized Lipids on the Gut Microbiome and Mycobiome in Pigs. FASEB J. 2020, 34, 1–1. [Google Scholar] [CrossRef]
  63. Summers, K.L.; Arfken, A.M. The Gut Mycobiome and Animal Health. In Gut Microbiota, Immunity, and Health in Production Animals; Kogut, M.H., Zhang, G., Eds.; Springer International Publishing: Cham, 2022; pp. 85–125. ISBN 978-3-030-90303-9. [Google Scholar]
  64. Keomoungkhoun, B.; Arjentinia, I.P.G.Y.; Sangmaneedet, S.; Taweenan, W. First Report on the Molecular Prevalence and Associated Risk Factors of Eimeria Spp. in Dairy Cattle in Khon Kaen, Thailand. Vet. World 2023, 16, 1489–1495. [Google Scholar] [CrossRef]
  65. Lucas, A.S.; Swecker, W.S.; Lindsay, D.S.; Scaglia, G.; Neel, J.P.S.; Elvinger, F.C.; Zajac, A.M. A Study of the Level and Dynamics of Eimeria Populations in Naturally Infected, Grazing Beef Cattle at Various Stages of Production in the Mid-Atlantic USA. Vet. Parasitol. 2014, 202, 201–206. [Google Scholar] [CrossRef]
  66. Hastutiek, P.; Lastuti, N.D.R.; Suwanti, L.T.; Sunarso, A.; Kurniawati, D.A.; Yudhana, A. Occurrence and Biodiversity of Eimeria Spp. (Apicomplexa: Eimeriidae) in Madura Cattle Reared on Kamal Subdistrict, Madura Island, Indonesia. Vet. World 2022, 15, 2084–2088. [Google Scholar] [CrossRef]
  67. Aboelsoued, D.; Abdel Megeed, K.N. Diagnosis and Control of Cryptosporidiosis in Farm Animals. J. Parasit. Dis. 2022, 46, 1133–1146. [Google Scholar] [CrossRef]
  68. Papanikolopoulou, V.; Baroudi, D.; Guo, Y.; Wang, Y.; Papadopoulos, E.; Lafi, S.Q.; Abd El-Tawab, M.M.; Diakou, A.; Giadinis, N.D.; Feng, Y.; et al. Genotypes and Subtypes of Cryptosporidium Spp. in Diarrheic Lambs and Goat Kids in Northern Greece. Parasitol. Int. 2018, 67, 472–475. [Google Scholar] [CrossRef]
  69. Feng, Y.; Ryan, U.M.; Xiao, L. Genetic Diversity and Population Structure of Cryptosporidium. Trends Parasitol. 2018, 34, 997–1011. [Google Scholar] [CrossRef]
  70. Pane, S.; Putignani, L. Cryptosporidium: Still Open Scenarios. Pathogens 2022, 11, 515. [Google Scholar] [CrossRef]
  71. Ahmed, S.A.; Karanis, P. An Overview of Methods/Techniques for the Detection of Cryptosporidium in Food Samples. Parasitol. Res. 2018, 117, 629–653. [Google Scholar] [CrossRef]
  72. Ryan, U.; Hijjawi, N.; Xiao, L. Foodborne Cryptosporidiosis. Int. J. Parasitol. 2018, 48, 1–12. [Google Scholar] [CrossRef]
  73. Chacón, M.R.; Lozano-Bartolomé, J.; Portero-Otín, M.; Rodríguez, M.M.; Xifra, G.; Puig, J.; Blasco, G.; Ricart, W.; Chaves, F.J.; Fernández-Real, J.M. The Gut Mycobiome Composition Is Linked to Carotid Atherosclerosis. Benef. Microbes 2018, 9, 185–198. [Google Scholar] [CrossRef]
  74. Ahmad, H.F.; Castro Mejia, J.L.; Krych, L.; Khakimov, B.; Kot, W.; Bechshøft, R.L.; Reitelseder, S.; Højfeldt, G.W.; Engelsen, S.B.; Holm, L.; et al. Gut Mycobiome Dysbiosis Is Linked to Hypertriglyceridemia Among Home Dwelling Elderly Dane 2020.
  75. Romani, L. Immunity to Fungal Infections. Nat. Rev. Immunol. 2004, 4, 11–24. [Google Scholar] [CrossRef]
  76. Zhang, D.; Wang, Y.; Shen, S.; Hou, Y.; Chen, Y.; Wang, T. The Mycobiota of the Human Body: A Spark Can Start a Prairie Fire. Gut Microbes 2020, 11, 655–679. [Google Scholar] [CrossRef]
  77. Lv, L.; Gu, S.; Jiang, H.; Yan, R.; Chen, Y.; Chen, Y.; Luo, R.; Huang, C.; Lu, H.; Zheng, B.; et al. Gut Mycobiota Alterations in Patients with COVID-19 and H1N1 Infections and Their Associations with Clinical Features. Commun. Biol. 2021, 4, 1–11. [Google Scholar] [CrossRef]
  78. Delavy, M.; Sertour, N.; Patin, E.; Le Chatelier, E.; Cole, N.; Dubois, F.; Xie, Z.; Saint-André, V.; Manichanh, C.; Walker, A.W.; et al. Unveiling Candida Albicans Intestinal Carriage in Healthy Volunteers: The Role of Micro- and Mycobiota, Diet, Host Genetics and Immune Response. Gut Microbes 2023, 15, 2287618. [Google Scholar] [CrossRef] [PubMed]
  79. Zhang, L.; Zhan, H.; Xu, W.; Yan, S.; Ng, S.C. The Role of Gut Mycobiome in Health and Diseases. Ther. Adv. Gastroenterol. 2021, 14, 17562848211047130. [Google Scholar] [CrossRef] [PubMed]
  80. Zhang, F.; Aschenbrenner, D.; Yoo, J.Y.; Zuo, T. The Gut Mycobiome in Health, Disease, and Clinical Applications in Association with the Gut Bacterial Microbiome Assembly. Lancet Microbe 2022, 3, e969–e983. [Google Scholar] [CrossRef]
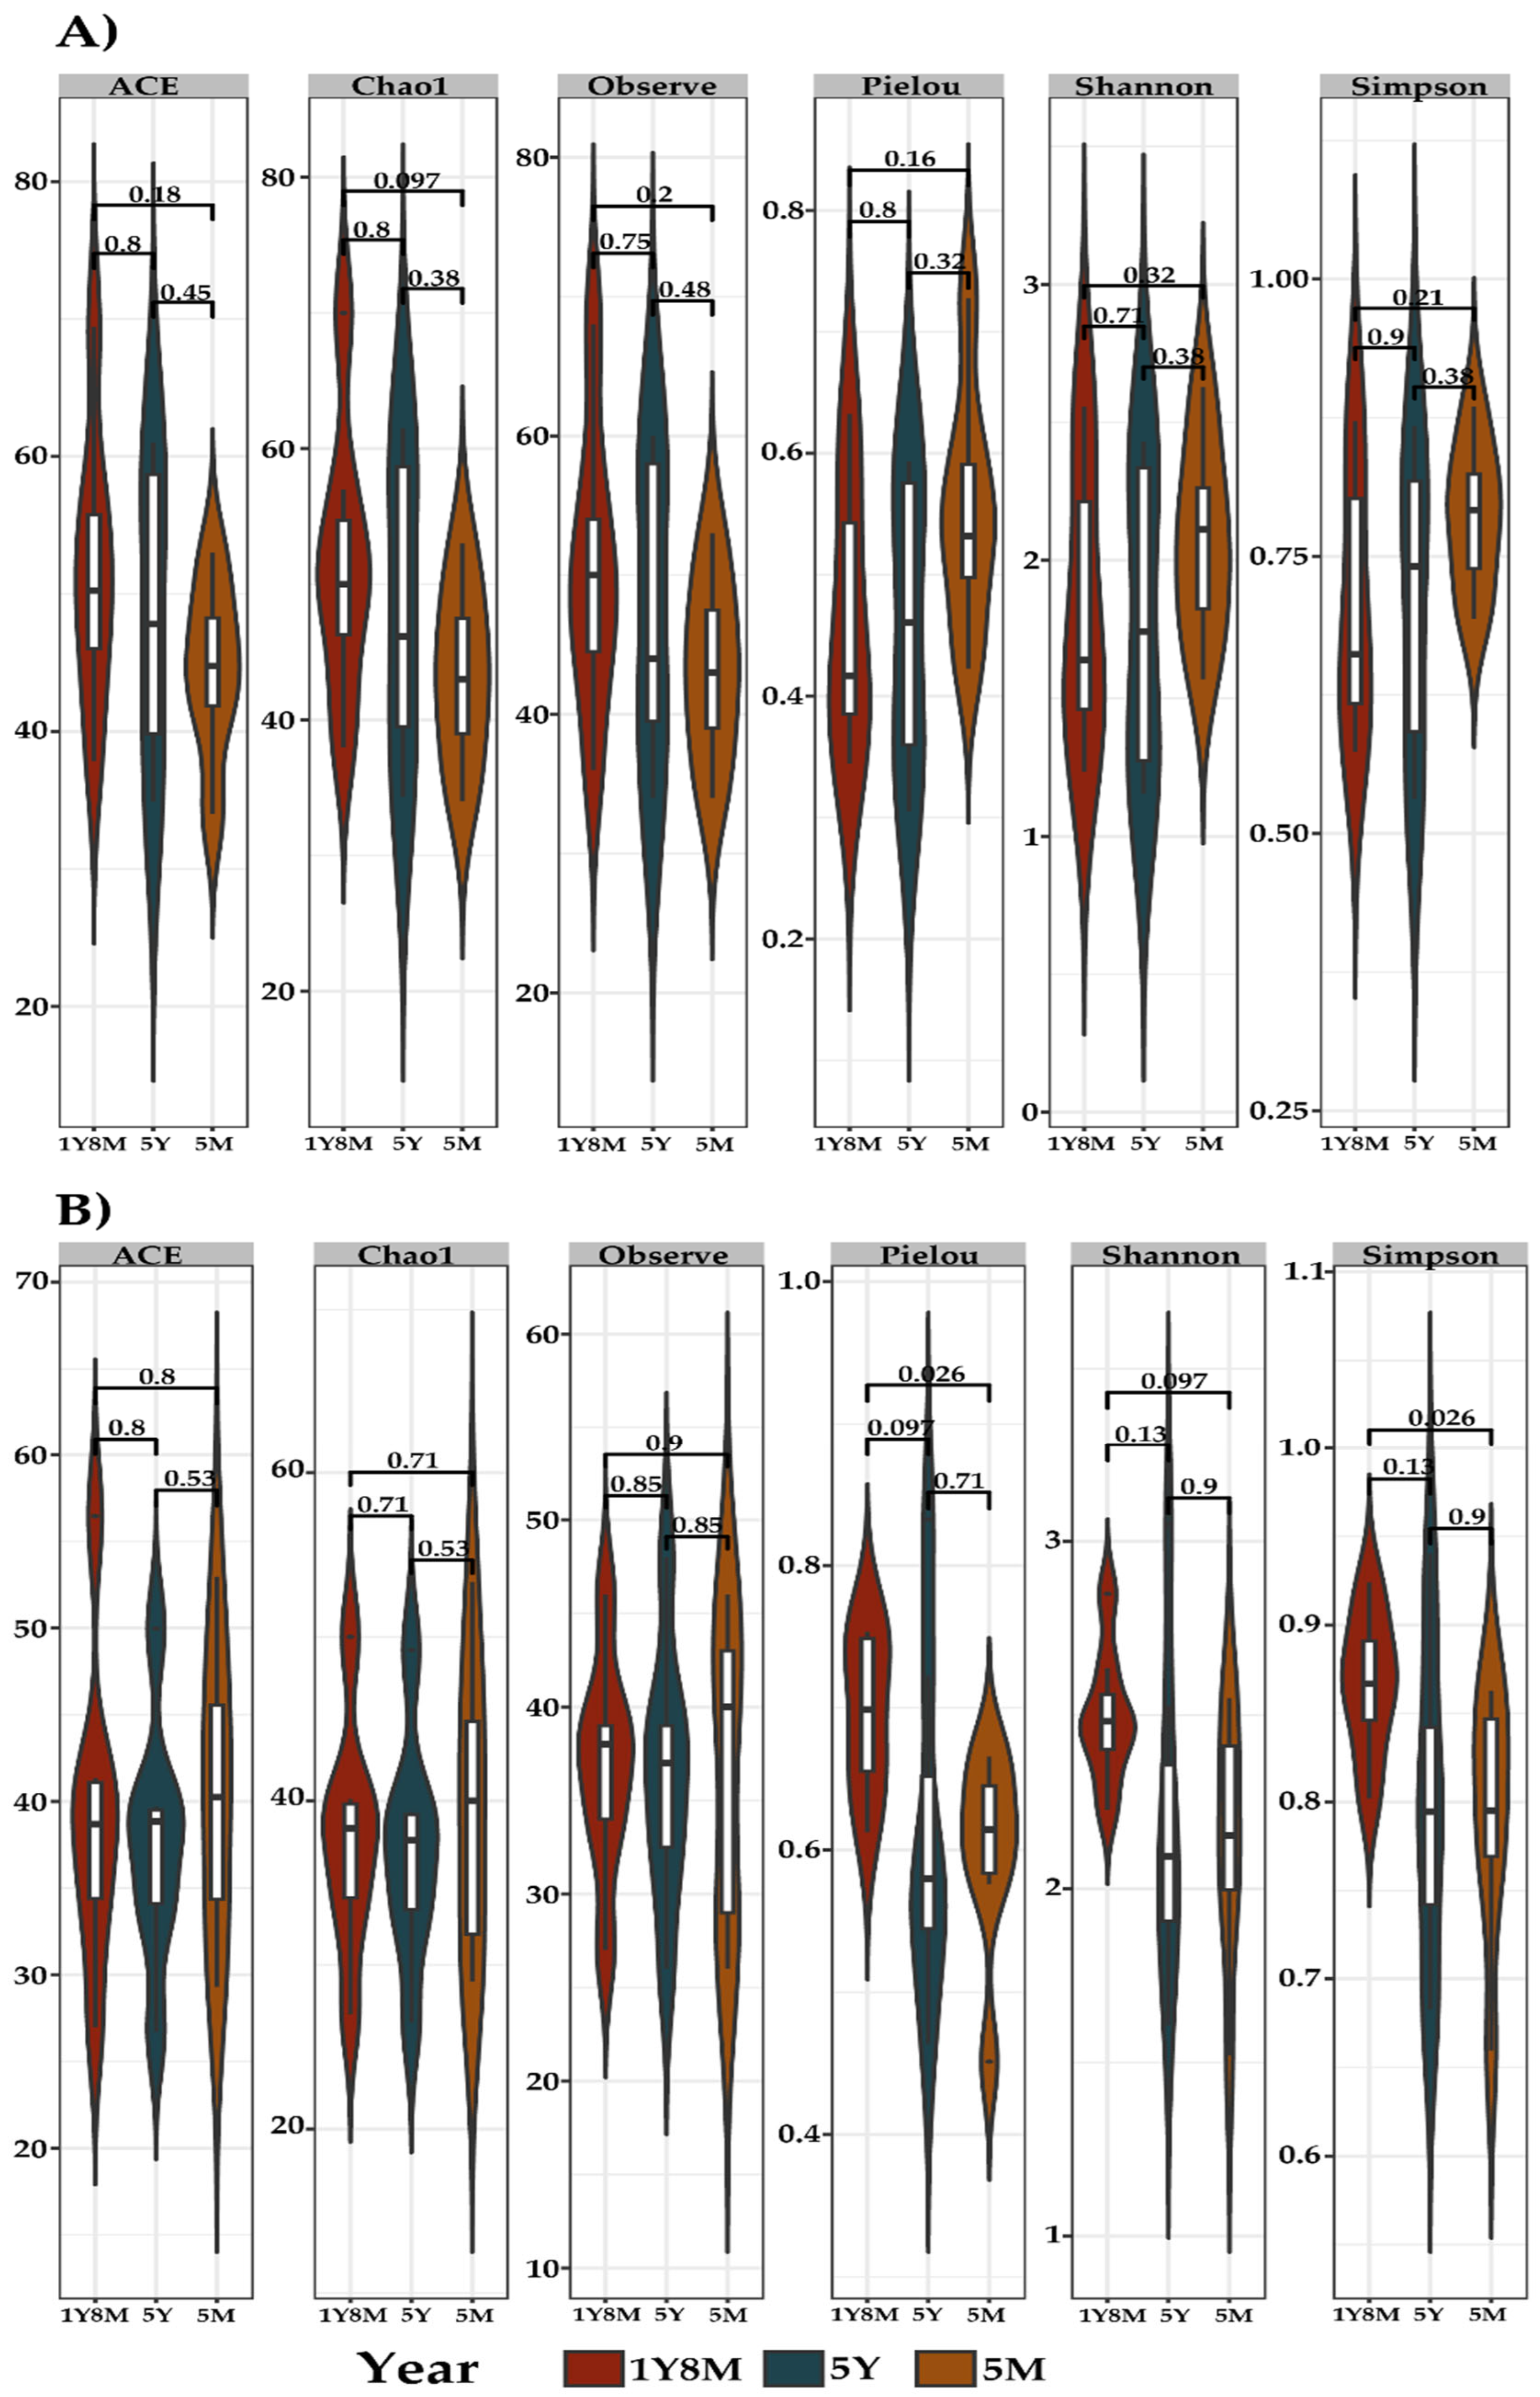
Figure 1. Alpha diversity (Observe, Pielou, Shannon, and Simpson) gut microbiota indices between cattle in three age groups: 1Y80, 5Y, and 5M. A. Gut microbiota index of fungal alpha diversity. B. Protist alpha diversity gut microbiota index.
Preprints 110017 g001
Figure 2. Principal Coordinate Analysis (PCoA) plot of beta diversity based on Jaccard (A,C) and Bray–Curtis (B,D) distance. A. PCoA based on Jaccard distance of fungi. B. PCoA based on Bray-Curtis distance of fungi. C. PCoA based on Jaccard distance of protist. D. PCoA based on Bray-Curtis of protist.
Preprints 110017 g002
Figure 3. Venn diagrams showing the shared and unique taxa among different age groups of cattle. A. Fungal Venn diagram. B. Protist Venn diagram.
Preprints 110017 g003
Figure 4. Comparative analysis of fungal and protist communities across different age groups of cattle. A. Bar plots representing the relative abundance of fungal taxa. B. Heatmaps showing the distribution and abundance of the 20 most abundant fungal genera. C. Bar plots representing the relative abundance of protist taxa. D. Heatmaps showing the distribution and abundance of the 20 most abundant protist genera.
Preprints 110017 g004
Figure 5. Differences in the intestinal fungal (A,B) and protist (C,D) microbiota among different ages in cattle. Bar chart of Linear Discriminant Analysis (LDA) for differentially abundant. A. Differentially abundant fungal taxa in the 1Y8M with 5M group. B. Differentially abundant fungal taxa in the 5Y with 5M group. C. Differentially abundant protist taxa in the 5M with 5Y group. D. Differentially abundant protist taxa in the 5M with 1Y8M group.
Preprints 110017 g005
Figure 6. Spearman correlation between clinical parameters and alpha diversity. Positive correlations are represented in brown, while negative correlations are shown in darker blue. Only significant correlations (with p-values < 0.05), are shown in the matrix.
Preprints 110017 g006
Table 1. PERMANOVA of Jaccard and Unweighted unifrac.
Items Df SumOfSqs R2 F Pr (>F)
Jaccard
Year 2 0.397308 0.130516 1.472821 0.015*
Sex 1 0.197202 0.064781 1.462057 0.055
Year:Sex 2 0.426412 0.140076 1.580706 0.007**
Residual 15 2.023202 0.664625
Total 20 3.044126 1
Unweighted unifrac
Year 2 0.16684 0.20852 2.7976 0.002**
Sex 1 0.04198 0.05247 1.4079 0.168
Year:Sex 2 0.14402 0.18 2.4149 0.002**
Residual 15 0.44728 0.55901
Total 20 0.80012 1
Table 2. Correlation of clinical parameters with Beta diversity (Jaccard and Unweighted Unifrac) using Mantel and Partial Mantel Tests. Only significant variables shown are shown.
Jaccard Unweighted Unifrac
Mantel test Partial Mantel test Mantel test Partial Mantel test
Variables r p r p r p r p
MCV 0.196815555 0.03* 0.209922522 0.014* 0.137675537 0.07 0.104071883 0.124
MCH 0.177721795 0.022* 0.192394859 0.01* 0.149206478 0.045* 0.114890751 0.082
LYM% 0.192477483 0.064 0.194205056 0.068 0.195319744 0.048* 0.178444189 0.094
Disclaimer/Publisher’s Note: The statements, opinions and data contained in all publications are solely those of the individual author(s) and contributor(s) and not of MDPI and/or the editor(s). MDPI and/or the editor(s) disclaim responsibility for any injury to people or property resulting from any ideas, methods, instructions or products referred to in the content.
Copyright: This open access article is published under a Creative Commons CC BY 4.0 license, which permit the free download, distribution, and reuse, provided that the author and preprint are cited in any reuse.
Alerts
Prerpints.org logo

Preprints.org is a free preprint server supported by MDPI in Basel, Switzerland.

Subscribe

© 2025 MDPI (Basel, Switzerland) unless otherwise stated