Highlights
Assessment of different extrapolation wind speed methods for analyzing the wind energy applications using short-and long-term extrapolation methods in Tetouan region.
Statistical analysis of wind speed distribution and wind power density based on Weibull and Rayleigh distributions functions are evaluated in Tetuan area.
The vertical extrapolation of wind speed and the determination of Weibull parameters have been investigated at a height of 60m with the aim of enhancing the wind energy potential.
The wind power density calculations indicated that Tetuan city is a suitable area for wind turbine establishment.
1. Introduction
In recent years, Morocco, a country in North Africa, has made significant progress in the development of renewable energy sources, particularly wind energy. The country’s government has set an ambitious target of generating 52% of its electricity from renewable energy by 2030, with wind power playing a key role in achieving this goal. In 2000, Morocco opened its first wind farm, and since then, the country has been steadily increasing its wind energy capacity. A number of wind farms are operating all over Morocco, with a total installed wind energy capacity of about 1,200 MW as of 2021.
Vertical wind speed extrapolation involves estimating the wind speed at different heights using wind speed measurements at a specific height, along with atmospheric turbulence models. In general, wind speed increases with altitude due to the decrease in surface friction on the ground and the reduction in the effects of surface roughness. Atmospheric turbulence models take these effects into account when estimating wind speed at different heights.
There are several vertical wind speed extrapolation models that are used to study and analyze wind parameters to extract wind power. Some of the more commonly used models include: Logarithmic law, Power law and Monin-Obukhov model. Crippa et al. [
1] proposed a temporal model based on the power law to extrapolate hourly winds to the turbine hub height. The results obtained from this model demonstrated a significant reduction in the absolute bias in capacity factors, with a range of 58-64%. In a similar research context, Al-Shaikhi et al. [
2] introduced the PSO-LSTM method for estimating wind speed at specific heights using measured values at lower heights. The PSO-LSTM was compared to standard LSTM, FFNN, and Log Law methods, and it outperformed them in various performance measures at heights up to 120m. The estimated values were evaluated against actual wind speed using performance metrics such as RMSE, MBE, MAPE, and R2. Also, Optis et al. [
3] developed and validated innovative techniques for vertical extrapolation that provide accurate estimations of wind speed time series at different heights within the rotor-swept area. They explored both the conventional logarithmic profile and three new approaches: a logarithmic profile with a long-term stability correction, a single-column model, and a machine-learning model. Furthermore, Zekai Sen et al. [
4] proposed a straightforward technique using perturbation theory to establish an expanded power law for vertical wind speed extrapolation and Weibull probability distribution parameters. Their findings emphasized the importance of considering variations in means, standard deviations, and cross-correlation coefficients between wind speeds at different elevations, especially when the speeds are not independent.
Thus, the choice of the vertical extrapolation model depends on the desired accuracy, data availability, and computing resources. Generally, more accurate models tend to be more complex and require larger amounts of data and computing resources.
In terms of determining the shape and scale parameters of wind speed data, various numerical methods have been proposed in the literature. For example, Ouahabi et al. [
5] analyzed wind speed data and wind power density in Tetouan, Morocco, using Weibull and Rayleigh distribution functions and adjusted them with measured data. The study confirmed that both Weibull and Rayleigh distribution models provide adequate descriptions of the frequency of actual wind records. Furthermore, Ouahabi et al. [
6] conducted a comparative analysis of five different adjustment methods using the Weibull model to identify the most accurate approach for analyzing annual variations in wind energy in Tetouan, Morocco. The results showed that the moment method (MOM) yielded more precise and efficient estimations compared to the four other methods for evaluating wind energy applications. In a related study, Azad et al. [
7] examined seven methods for establishing Weibull parameters and concluded that the moment method (MOM) and maximum likelihood method (MLM) were the most efficient approaches.
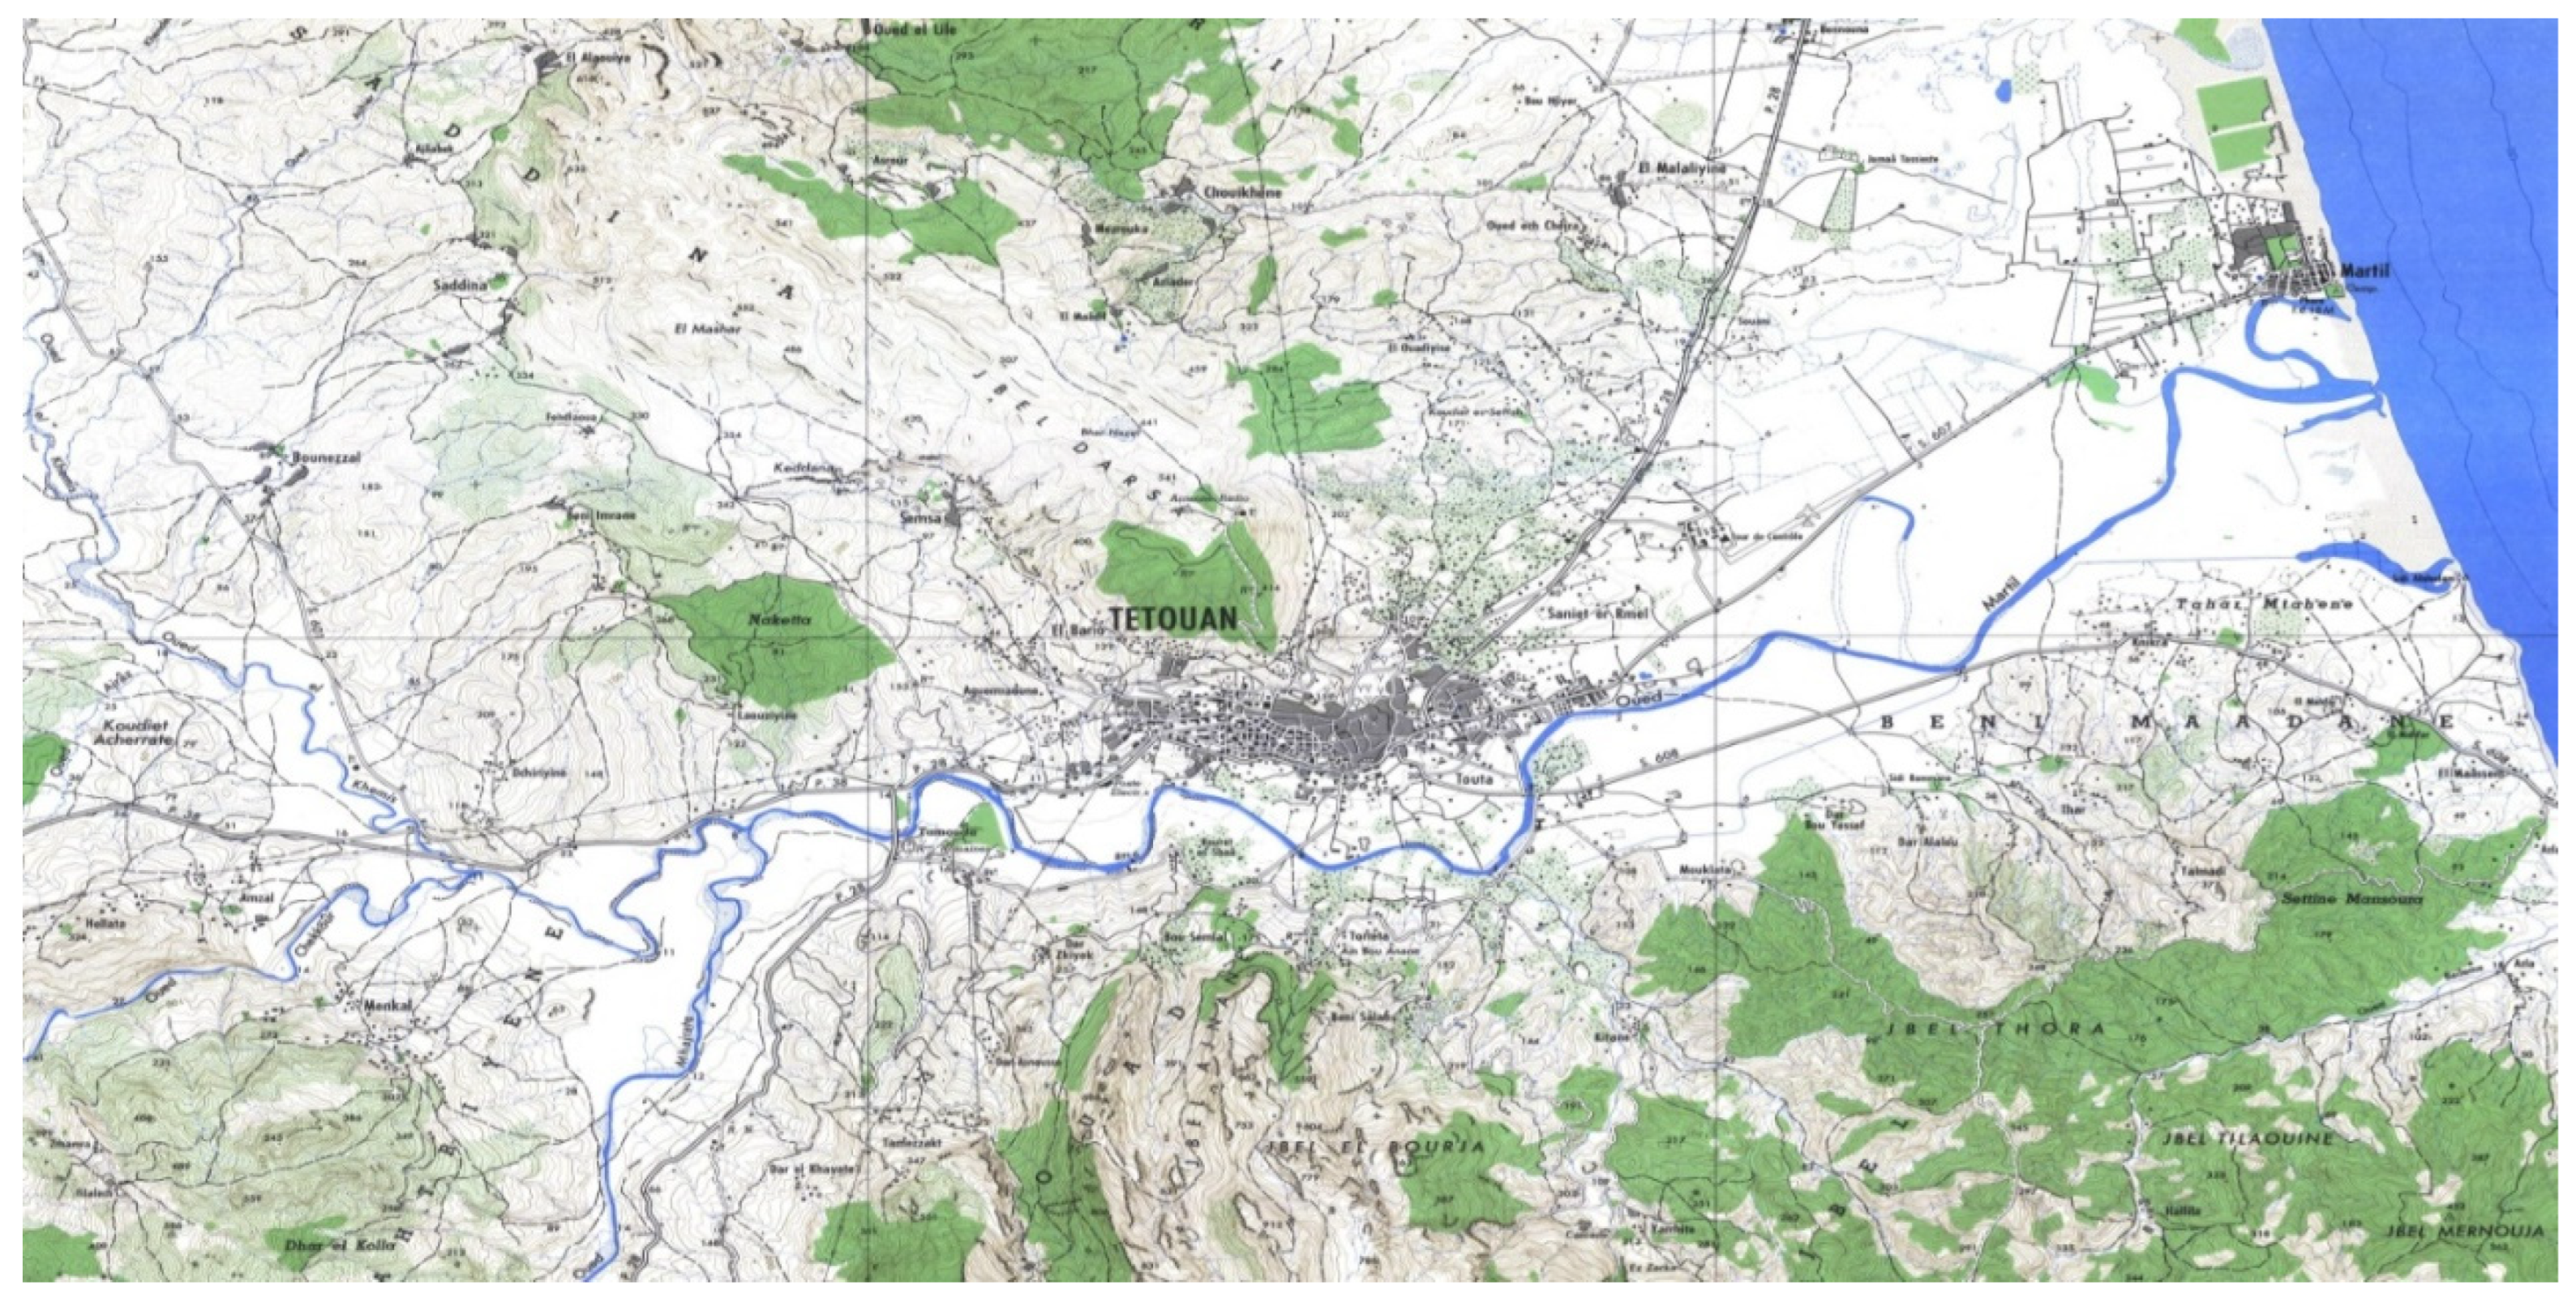
Figure 1.
Geographic location of Tetuan, Morocco.
Figure 1.
Geographic location of Tetuan, Morocco.
This paper is organized as follows:
Section 2.1 introduces the Weibull and Rayleigh distribution functions, followed by the illustration of the methods used in short- and long-term wind speed extrapolation in
Section 2.2.
Section 2.3 introduces the wind power density, and
Section 2.4 shows the performance selection criteria. The results and discussion will be presented in
Section 3, followed by conclusion in
Section 4.
2. Materials and methods
2.1. Weibull and Rayleigh probability density function
Weibull and Rayleigh probability density function are a common method for analyzing wind speed measurements and determining wind energy potential. In this study, we used this two previously mentioned distribution methods in order to analyze the wind characteristics of Tetuan city
. Measurements of wind speed were collected using an Eol2020 mast, which is equipped with two anemometers located at varying heights above ground level (40m and 60m). The data was sampled at 10-minute intervals for a period of one and a half years, ranging from January 2015 to July 2016.The used data are acquired from a wind measurement station in Lafarge cement plant Tetuan. The probability of occurrence for wind speed of the Weibull and Rayleigh distribution function [
8] are respectively expressed as follow:
2.2. Wind speed extrapolation
In general, wind speed increases with altitude due to the decrease in surface friction on the ground and the reduction of surface roughness effects. Atmospheric turbulence models take these effects into account when estimating wind speed at different heights. Thus, extrapolation method enables to get wind speed data that match in general appropriately those at the wind turbine hub height. Accurate estimation of wind energy potential can then be obtained without the need to install an anemometer at the wind turbine hub height during a long period of time. There are several vertical wind speed extrapolation models subdivided between short and long term, used to study and analyze wind parameters to extract wind energy.
2.2.1. Short-term wind speed extrapolation
Short-term extrapolation means the extrapolation of the collected wind measurements to the desired height. Some of the most commonly used models are [
9]:
2.2.1.1. Logarithmic law:
This model is based on atmospheric boundary layer theory and assumes a logarithmic variation of wind speed with altitude [
10]. Such an assumption is frequently utilized to extrapolate wind speed in studies related to atmospheric boundary layers.
2.2.1.2. Power law:
This widely used model extrapolates wind speed by assuming a power law relationship between wind speed and height, where wind speed increases with height. It is commonly applied in the wind energy industry to predict the wind speed at wind turbine hub height [
11].
2.2.2. Long-term wind speed extrapolation
Long-term extrapolation refers to the extrapolation of Weibull parameters characterizing the study site [
12]. The methods used enable the prediction of Weibull parameters beyond the range of available data, allowing for the estimation of wind energy potential and optimization of wind turbine performance. The selected methods are as follows:
2.2.2.1. Justus and Mikhail method:
The Justus and Mikhail logarithmic wind speed extrapolation model [
13] is not only useful for estimating wind speeds in atmospheric studies, but also for long-term wind speed extrapolation. This technique involves estimating wind speeds over a period of several years or more, using wind speed measurements taken at one or more lower heights. The model assumes that the variation of wind speed with height remains constant over time, and extrapolates the measured wind speeds at the lower heights to estimate the wind speed at the desired height. This method has practical applications in a range of fields, including wind energy, atmospheric science, and air pollution studies.
The extrapolation of Weibull parameters (k & c) at the desired height (z) can be estimated using the following equations:
2.2.2.2. Modified Justus method:
This method improves upon the original Justus and Mikhail model by incorporating an empirical coefficient that accounts for the effects of stability on the wind profile [
14]. This results in more accurate wind speed estimates for heights beyond the range of the measured data. The Modified Justus method has been successfully applied in various long-term wind speed extrapolation studies, demonstrating its usefulness in predicting wind speeds over extended periods of time. The equations below can be used to estimate the extrapolation of Weibull parameters (k & c) at the desired height:
2.2.2.3. Modified Mikhail method:
The Modified Mikhail method [
15] is a technique used to extrapolate wind speed data beyond the available time series in long-term wind speed prediction. This method improves the accuracy of wind speed extrapolation by incorporating an empirical correction factor into the original Mikhail method. By using this modified method, it is possible to estimate the long-term wind speed profile of a specific location, which is crucial for wind energy planning.
The extrapolation of Weibull parameters (k & c) at the desired height (z) can be estimated such as:
2.3. Wind power density assessment
The capacity of wind resources at a particular location is indicated by an indicator called wind power density. Additionally, it allows for the evaluation of wind turbine performance and the choice of an appropriate wind turbine for that location. Based on the Weibull and Rayleigh parameters, it is possible to calculate the wind power density as follows [
16,
17]:
2.4. Statistical indicators used for performance evaluation
A number of statistical analyses, including the determination coefficient (R2), root mean square errors (RMSE), and chi-square error (), have been made in order to evaluate the performance of the Weibull & Rayleigh distributions. Furthermore, to assess the performance of used models (short and long term) of wind speed extrapolation with reference to the observed data at 60 m of height.
2.4.1. Determination coefficient (R²)
R² is a statistical tool that measures the proportion of the variance in the dependent variable that can be explained by the independent variables. It is a measure of the goodness of fit of the regression line to the data points. Generally, R² values range from 0 to 1, where 1 indicates a perfect fit of the regression line to the data points, and 0 indicates that the model cannot explain any of the variability in the data. Therefore, a higher R² value indicates a better fit of the regression line to the data points, while a lower R² value indicates a poorer fit. Its equation is written as [
18]:
2.4.2. Root mean square errors (RMSE)
RMSE is a statistical tool that measures the deviation between the predicted and actual values of a variable. It is widely used in regression analysis to assess the accuracy of the model’s predictions. A lower RMSE value implies better predictive performance, as it suggests that the predicted values are closer to the actual values. One of the reasons why RMSE is a popular evaluation metric is because it penalizes significant errors more severely than small ones, and it is sensitive to outliers. Its equation is written as follows [
19]:
2.4.3. Chi-square error (χ²)
χ² is utilized to assess how well an observed data distribution matches a theoretical distribution, indicating the goodness of fit. However, a lower χ² value implies better predictive performance, as it suggests that the predicted values are closer to the actual values. Its equation is written as [
20]:
3. Results and Discussion
3.1. Weibull and Rayleigh distribution
In recent years, numerous studies have been conducted to assess and analyze the wind energy potential in different regions, utilizing various PDFs. These studies have indicated that the Weibull and Rayleigh distributions are effective in describing wind speed probability distribution. Initially, we have commenced the present study by solely utilizing the Weibull distribution, and through statistical analysis of wind speed, discovered that the shape parameter for the Weibull distribution at 40m and 60m were found to be 2.005 and 2.02, respectively. These values were found to be very close to the fixed Rayleigh parameter for the given both dataset. For this reason, we have decided to utilize also the Rayleigh distribution in this study. Furthermore, there are several methods available to determine the two parameters of the Weibull distribution. The method employed in this study is the moment method (MOM), which was chosen based on our previous research findings that MOM yields more precise and effective results compared to the other selected five evaluation methods in the context of wind energy applications in Tetuan city.
The obtained results indicate that the mean wind speed measured throughout the entire measurement period at 40m and 60m were 7.21 m/s and 7.80 m/s, respectively. Additionally, the standard deviation of wind speed was found to be 3.80 m/s and 4.07 m/s for the respective heights.
Figure 2 illustrates the hourly mean wind speed between 10 minute intervals for the entire measurement period.
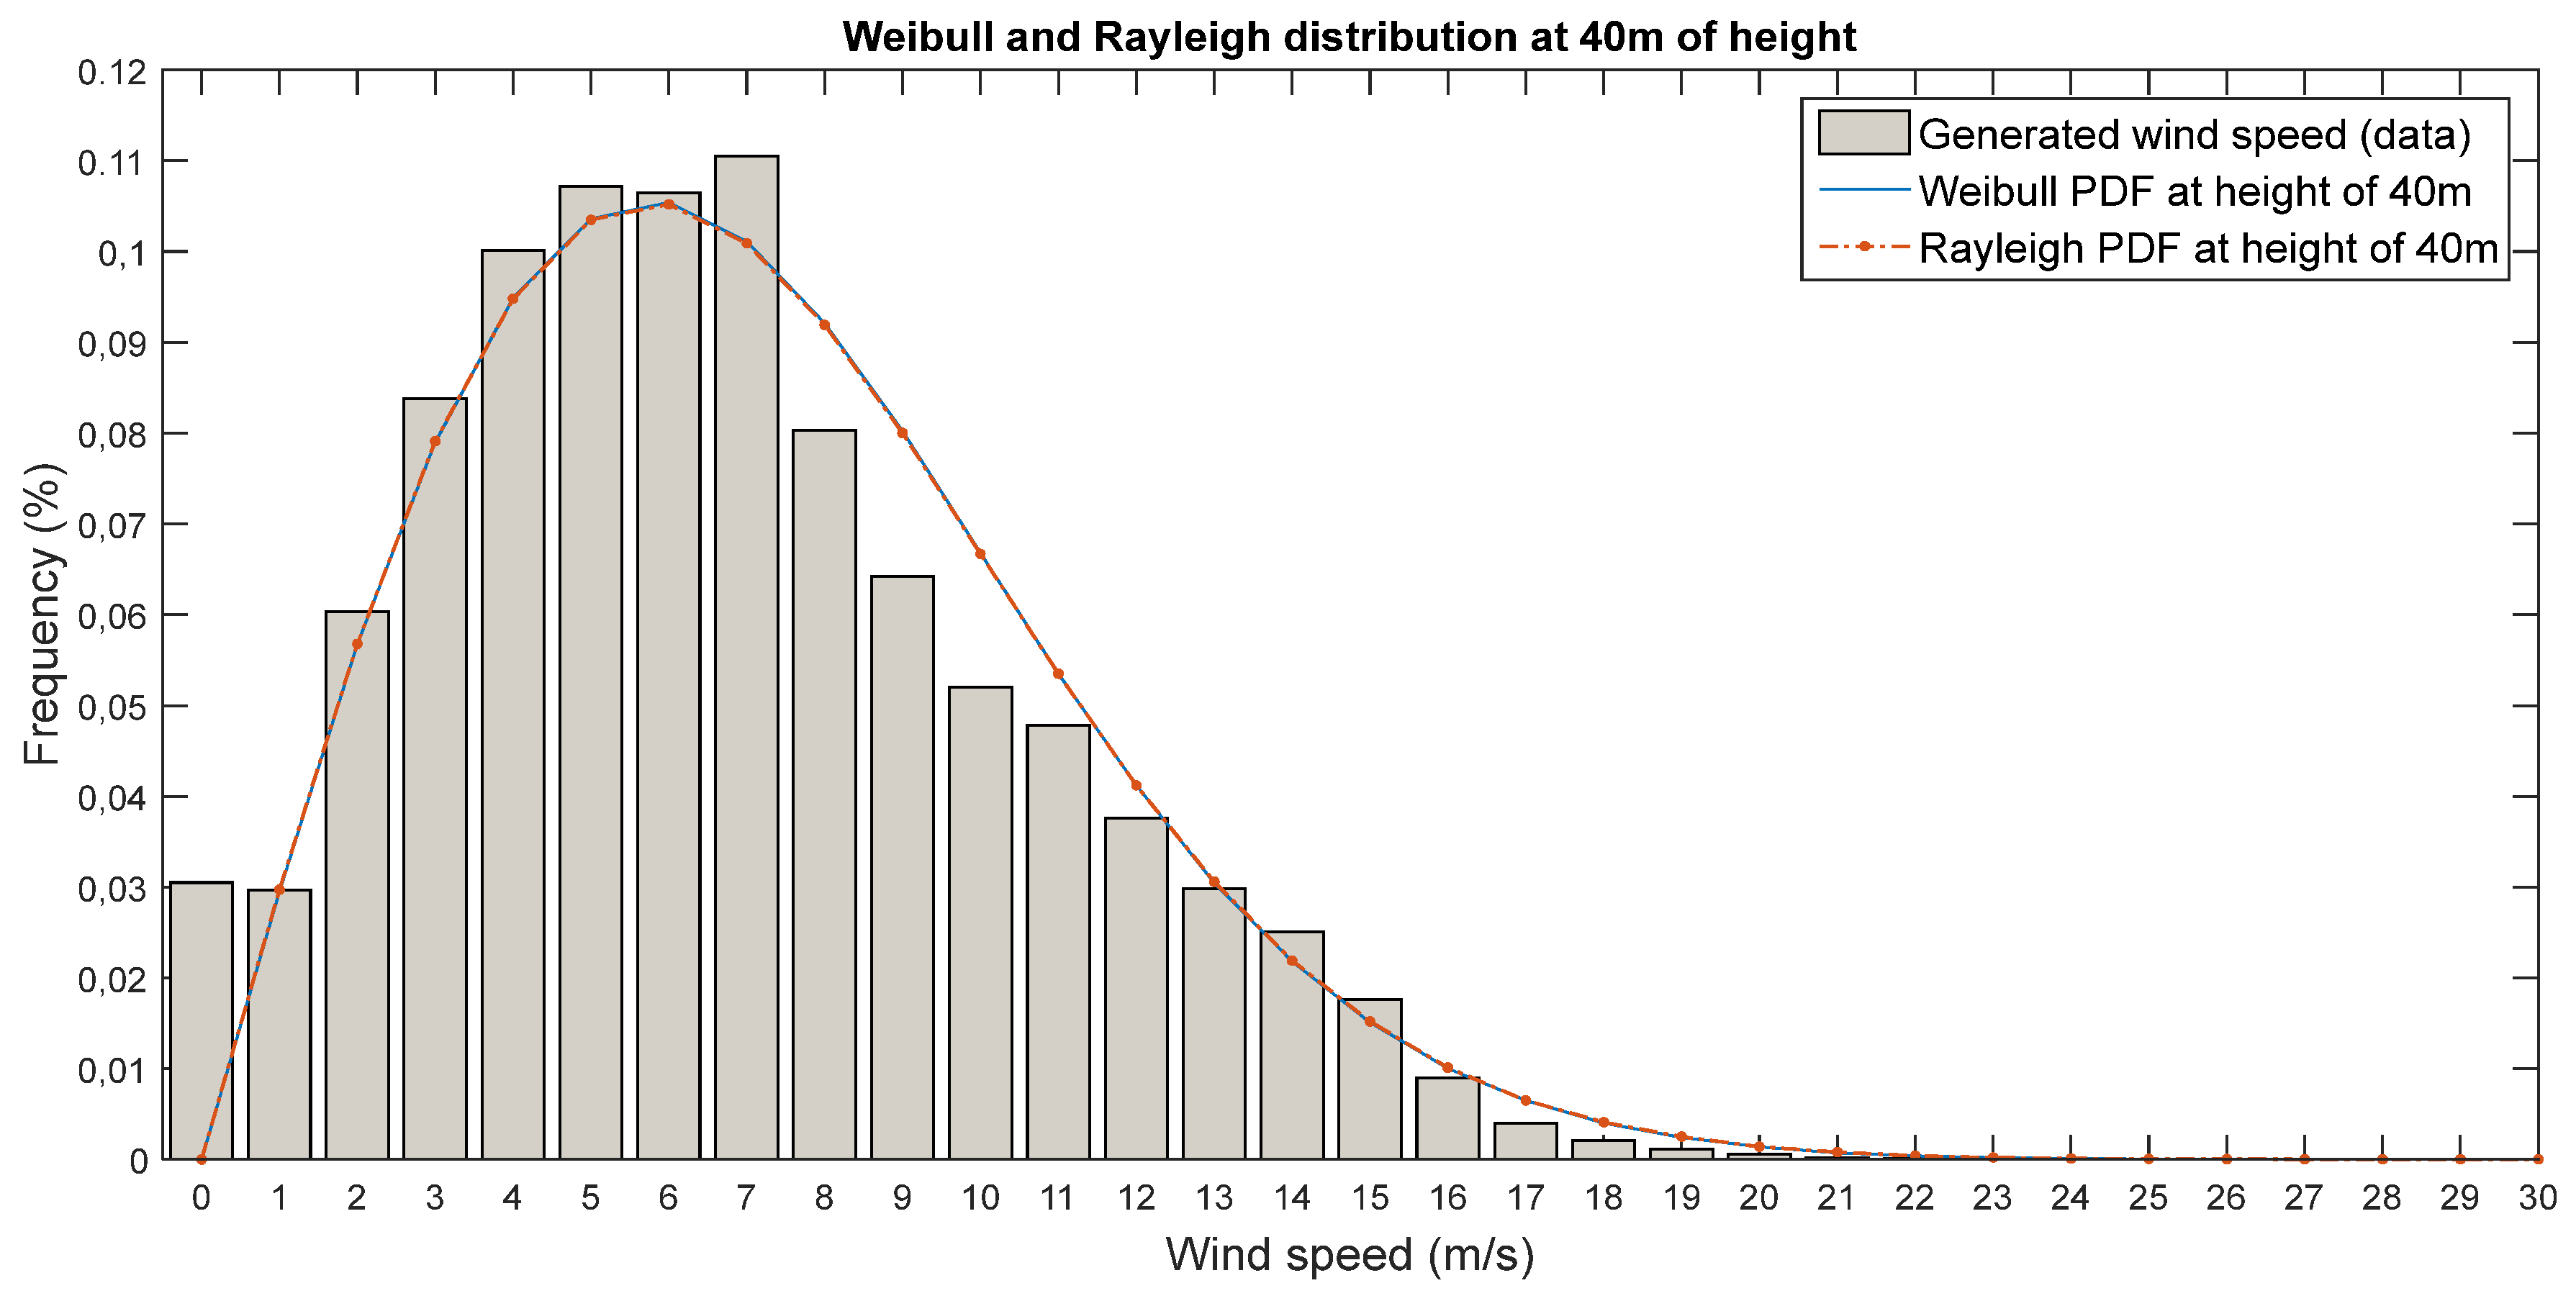
The graphical comparisons between the generated data and simulated wind speed frequencies for the entire measurement period in the Tetuan area, utilizing the Weibull and Rayleigh distribution models at both measured heights (40m & 60m), are presented in
Figure 3 and
Figure 4, respectively. It is clear that both distribution models provided adequate descriptions and more satisfactory representations of the frequencies of actual wind data at two measured heights.
3.2. Wind speed extrapolation
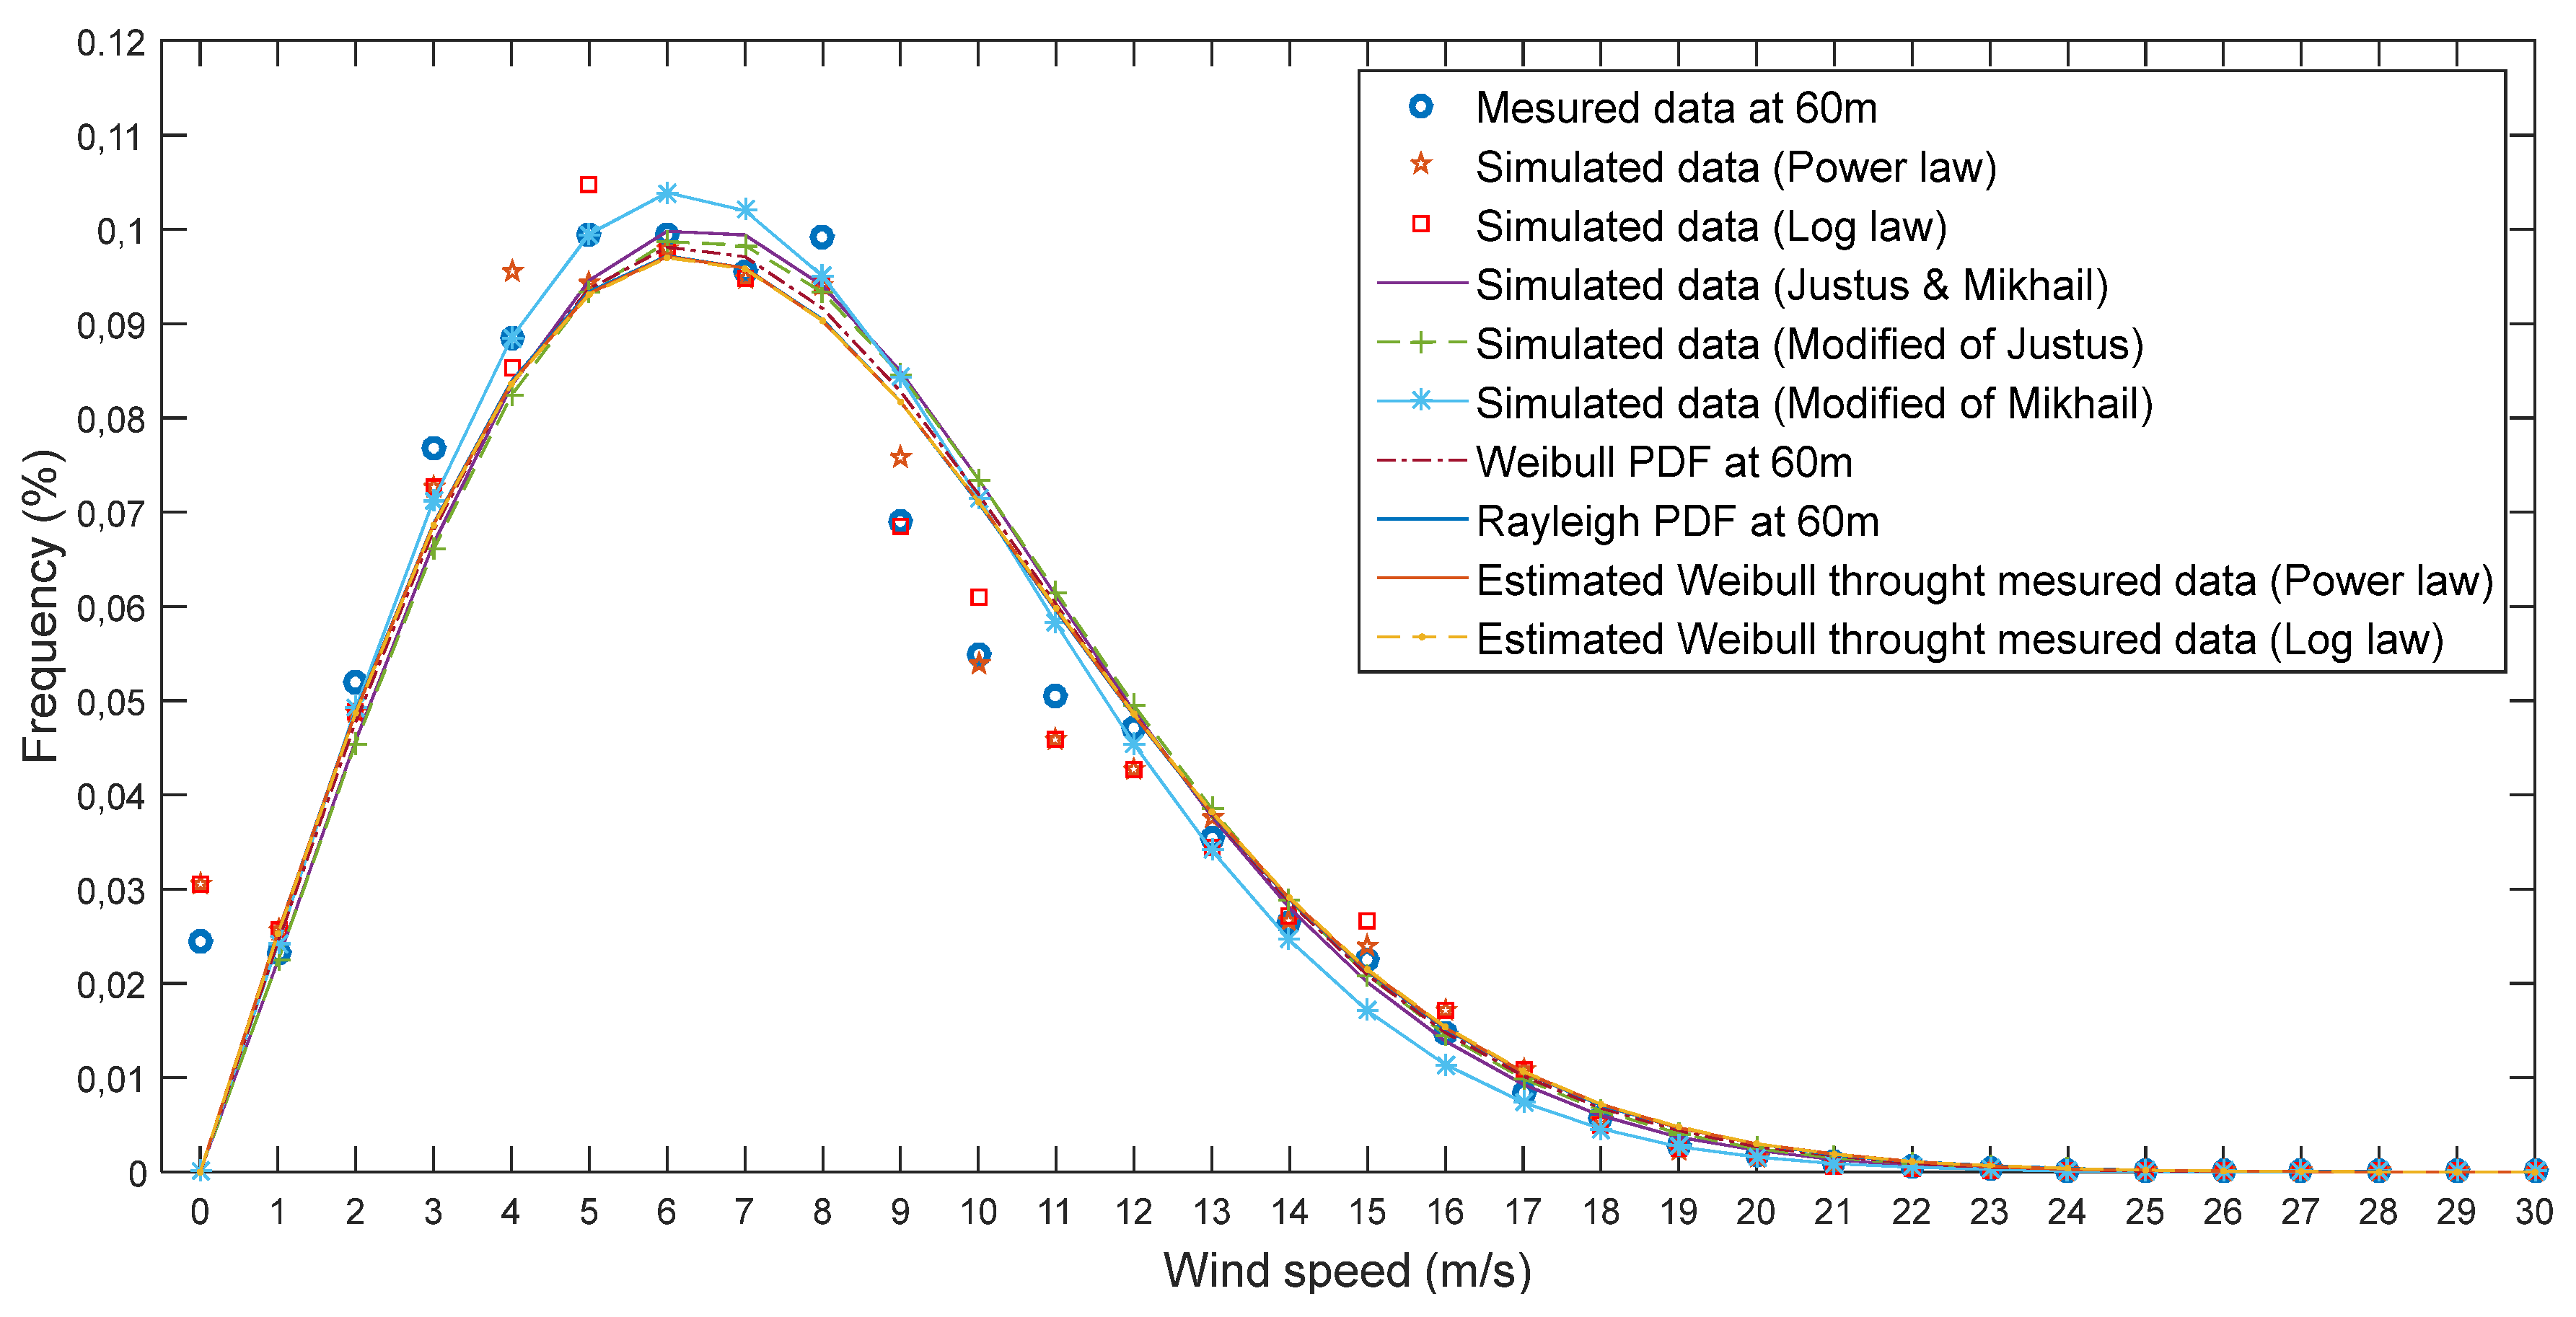
Comparisons of the probability density function of measured data at 60m and extrapolated wind speed data using seven models including short- and long-term methods from 40m to 60m of height, as well as the Weibull and Rayleigh distributions at 60m, are presented in
Figure 5. The detailed wind speed frequency data extracted from all the methods used are given in
Table 1.
Based on the results, it can be concluded that all of the methods used were successful in accurately representing the frequencies of actual wind data at a height of 60m. As a result, we recommend utilizing these methods to estimate wind speed at the Tetuan site.
3.3. Wind power output
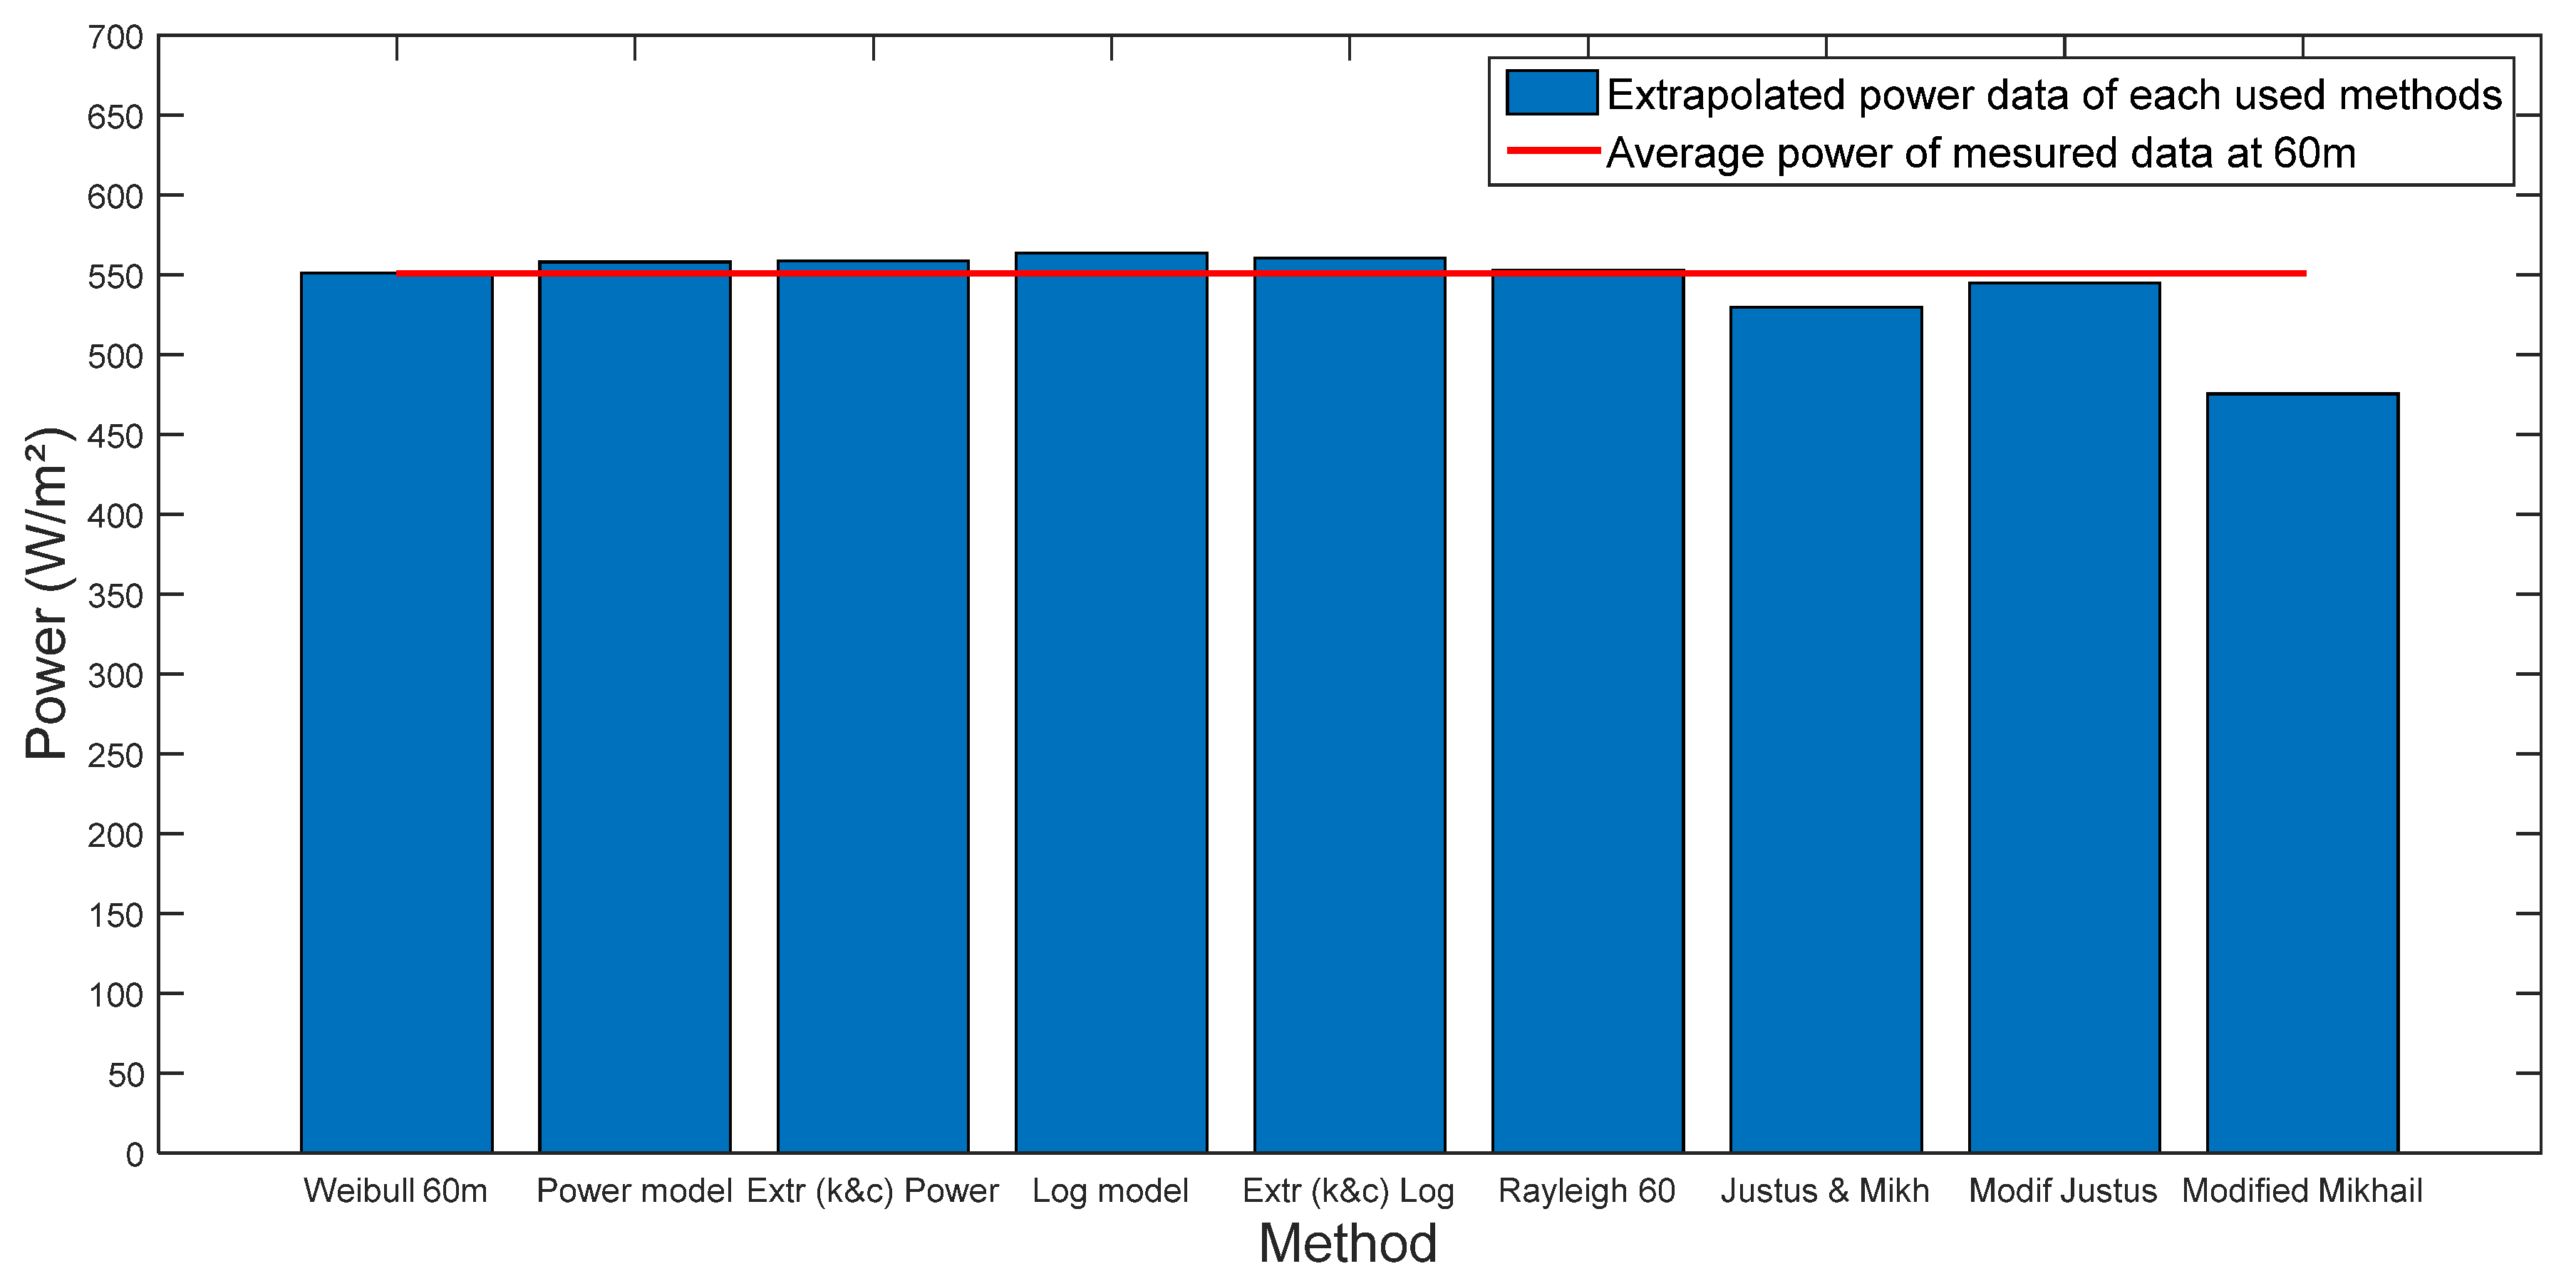
The wind power density extrapolated using all the selected models, including short- and long-term methods, has been compared to the average power of the measured data at 60m to assess the accuracy and effectiveness of these models in predicting wind power output at the study site, as shown in
Figure 6 and
Table 2. The wind power density calculated from the measured data at 60m is 550.96W/m². The results of the distribution functions indicate that the Weibull distribution provides the closest power value of 551.01W/m², compared to the Rayleigh power value of 552.85W/m². According to the extrapolation results, the power law gives the best power value of 558.03W/m² in short-term extrapolation, whereas in the long-term extrapolation, the modified Mikhail model shows the most acceptable value of 544.95W/m². However, the relative variations for both distribution functions are very limited, with a 0.009% variation for the Weibull distribution and a 0.34% variation for the Rayleigh distribution. The power law shows a 1.28% variation, while the modified Mikhail model shows a -1.09% variation. Therefore, this information can be valuable for energy planning and resource assessment purposes in the Tetuan area.
3.4. Performance selection criteria
According to equations (16, 17, and 18) used to calculate the statistical evaluations of the performance between recorded and predicted wind speed for the entire period of measurement based on Weibull & Rayleigh distributions, given in
Table 3, as well as based on extrapolation methods given in
Table 4, all values are found to be very acceptable. Therefore, the results demonstrate the high reliability of all selected methods, whether in terms of distribution functions or extrapolations of wind speed and wind power. On the other hand,
Table 5 shows that the power data at 60m height is more than 1/4 of the power found at 40m height, and all values for measured data and predictions using Weibull and Rayleigh distributions are very close.
4. Conclusion
After conducting the analysis in this paper, it can be concluded that the vertical extrapolation of wind speed using the seven selected methods, namely the power law model, log law model, extrapolation of Weibull parameters from measured data at 40m using power law, extrapolation of Weibull parameters from measured data at 40m using log law, Justus and Mikhail model, modified Justus model, and modified Mikhail model, proved to be effective in estimating wind speed at different heights (Our case study: 60m). The Weibull and Rayleigh parameters estimated at the height of (60m) were compared to those estimated at the initial height (40m) to ensure the accuracy of the extrapolation. Three statistical indicators, including the determination coefficient, root mean square error, and chi-square error, were used to evaluate the performance of the extrapolation models against the observed data at 60m. The results showed that the power law provided the most accurate fit for wind speed and wind power density in short-term extrapolation, while the modified Justus model gave the best performance in long-term extrapolation. In general, this study highlights the usefulness of vertical extrapolation of wind speed in improving the accuracy of wind energy assessments.
Funding
The authors received no financial support of this research, authorship, and/or publication of this article.
Acknowledgements
The authors extend their sincere appreciation to the Lafarge Cement Plant Tetuan for providing the essential field measurements required to achieve this study.
Conflicts of Interest
The authors declared no potential conflicts of interests with respect to the research, authorship, and/or publication of this article.
Nomenclature
| Nomenclature |
|
Scale factor of the Weibull distribution in |
|
Scale parameter at anemometer height in |
|
Scale parameter at height () in |
|
Weibull probability density function |
|
Shape factor of the Weibull distribution |
|
Shape parameter at anemometer height () |
|
Shape parameter at height () |
|
Exponent in the power law |
|
Wind speed sample size |
|
Wind power density in |
|
Statistical determination coefficient |
|
Root mean square error |
|
Wind speed measured at anemometer height |
|
Wind speed in |
|
Mean wind speed of the sample data in |
|
Predicted data |
|
Mean value of observed data. |
| FFNN |
Feedforward neural network |
| J&M |
Justus and Mikhail |
| LSTM |
Standard long short-term memory |
| MJ |
Modified of Justus |
| MM |
Modified of Mikhail |
| PSO-LSTM |
particle swarm optimization and long short-term memory |
| Greek Symbols |
|
Power law exponent |
|
Gamma function |
|
Chi-square error |
|
Air density in |
|
Standard deviation of wind speed data |
References
- P. Crippa, M. Alifa, D. Bolster, M. G. Genton, S. Castruccio. A temporal model for vertical extrapolation of wind speed and wind energy assessment. Applied Energy, 301 July (2021) 117378. [CrossRef]
- Al-Shaikhi A, Nuha H, Mohandes M, Rehman S, Adrian M. Vertical wind speed extrapolation model using long short-term memory and particle swarm optimization. Energy Sci Eng. 2022;10:4580-4594. [CrossRef]
- M. Optis, N. Bodini, M. Debnath, and P. Doubrawa. New methods to improve the vertical extrapolation of near-surface offshore wind speeds. Wind Energ. Sci., 6, 935–948, 2021. [CrossRef]
- Zekai Sen, Abdusselam Altunkaynak, and Tarkan Erdik. Wind Velocity Vertical Extrapolation by Extended Power Law. Volume 2012, Article ID 178623, 6 pages. [CrossRef]
- M. H. Ouahabi, F. Benabdelouahab, A. Khamlichi. Analyzing wind speed data and wind power density of Tetouan city in Morocco by adjustment to Weibull and Rayleigh distribution functions. Wind Engineering, 2017; 41(3):174-184. [CrossRef]
- M. H. Ouahabi, H. El khachine, F. Benabdelouahab and A. Khamlichi. Comparative study of five different methods of adjustment by the Weibull model to determine the most accurate method of analyzing annual variations of wind energy in Tetouan—Morocco. Procedia manufacturing-Elsevier, vol. 46c, pp. 698-707, May 2020. [CrossRef]
- Azad AK, Rasul GM, Yusaf T. Statistical diagnosis of the best Weibull methods for wind power assessment for agricultural applications. Energies 2014;7: 3056-85. [CrossRef]
- Carrasco-Díaz M, Rivas D, Orozco-Contreras M, Anchez-Montante OS. An assessment of wind power potential along the coast of Tamaulipas, northeastern Mexico. Renew Energy 2015;78:295-305. [CrossRef]
- Gupta D, Kumar V, Ayus I, Vasudevan M, Natarajan N. Short-term prediction of wind power density using convolutional PSO-LSTM network. FME Trans. 2021;49(3):653-663. [CrossRef]
- C. A. Paulson. The mathematical representation of wind speed and temperature profiles in the unstable atmospheric surface layer. Journal of applied meteorology (1970).
- Islam MS, Mohandes M, Rehman S. Vertical extrapolation of wind speed using artificial neural network hybrid system. Neural Comput Appl 2017;28(8):2351–61. [CrossRef]
- Ehsan MA, Shahirinia A, Zhang N, Oladunni T. Wind speed prediction and visualization using long short-term memory networks (LSTM). 2020 10th International Conference on Information Science and Technology (ICIST). IEEE; 2020:234-240.
- C. G. Justus and A. Mikhail. Height variation of wind speed and wind distributions statistics. Geophysical research letters, vol 3:261-4 (1976). [CrossRef]
- Hochreiter S, Schmidhuber J. Long short-term memory. Neural Comput. 1997;9(8):1735-1780. [CrossRef]
- A. S. Mikhail. Height extrapolation of wind data. Transaction of ASME, vol 107, pp 10-14, (1985). [CrossRef]
- Shu ZR, Li QS, Chan PW. Statistical analysis of wind characteristics and wind energy potential in Hong Kong. Energy Convers Manage 2015;101:644-57. [CrossRef]
- Pishgar-Komleh SH, Keyhani A, Sefeedpari P. Wind speed and power density analysis based on weibull and rayleigh distributions (a case study: Firouzkooh County of Iran). Renew Sustain Energy Rev 2015;42:313–22. [CrossRef]
- Kavak Akpinar E, Akpinar S. A statistical analysis of wind speed data used in installation of wind energy conversion systems. Energy Convers Manage 2005;46:515-32. [CrossRef]
- Fyrippis I, Axaopoulos PJ, Panayiotou G. Wind energy potential assessment in Naxos Island,Greece.ApplEnergy2010;87:577-86. [CrossRef]
- Akpınar EK. A statistical investigation of wind energy potential. Energy Sources, Part A: Recov, Util Environ Effects 2006;28:807-20. [CrossRef]
|
Disclaimer/Publisher’s Note: The statements, opinions and data contained in all publications are solely those of the individual author(s) and contributor(s) and not of MDPI and/or the editor(s). MDPI and/or the editor(s) disclaim responsibility for any injury to people or property resulting from any ideas, methods, instructions or products referred to in the content. |
© 2024 by the authors. Licensee MDPI, Basel, Switzerland. This article is an open access article distributed under the terms and conditions of the Creative Commons Attribution (CC BY) license (http://creativecommons.org/licenses/by/4.0/).


