Preprint
Article

Rice Growth and Leaf Physiology in Response to Four Levels of Continuous Drought Stress in Southern China

Altmetrics

Downloads

111

Views

54

Comments

0

A peer-reviewed article of this preprint also exists.

Submitted:

22 June 2024

Posted:

24 June 2024

You are already at the latest version

Alerts
Abstract
Exploring the growth and physiological response mechanisms of rice under continuous drought stress circumstances can provide a significant scientific foundation and technological assistance for meeting drought difficulties, improving drought resistance and rice (Oryza sativa L.) output, and ensuring food security. In this study, a rice field experiment was conducted under a rain shelter with five different treatments set up: P1 (drought stress from tillering stage), P2 (drought stress from jointing-booting stage), P3 (drought stress from heading-flowering stage), P4 (drought stress from grain filling stage), and CK (adequate water management throughout the growth stage). Continuous drought stress from different growth stages with four levels (mild, medium, serious, and extreme). The results showed that the effects of different drought stress treatments on rice growth varied significantly. Compared with the CK treatment, plant height was reduced by 12.10%, 8.14%, 3.83%, and 1.06% in the P1, P2, P3, and P4 treatments, respectively; and the number of tillers was reduced by 23.83%, 18.91%, 13.47%, and 8.68%, respectively. With the increase in drought stress levels, SPAD values and Rubisco activity of rice leaf continued to decrease; SOD activity showed a decreasing trend, but the decreasing trend of POD and CAT activities was not significant, while MDA content showed an increasing trend. For yield components, continuous drought stress significantly reduced spike length, effective number of spikes, thousand grain weight, grain number per spike, and fruiting rate of rice compared to CK treatments during the growth period. In general, continuous drought stress during the early growth period affected the effective spike number and the grain number per spike. Continuous drought stress after the grain filling stage had the least effect on yield and water use efficiency was much higher than other treatments. The results of these studies reveal the response of rice growth and physiology to continuous drought stress, which is important for agricultural practices.
Keywords: 
Subject: Biology and Life Sciences  -   Agricultural Science and Agronomy

1. Introduction

Drought stress is one of the most important abiotic stresses suffered by plants and one of the main factors affecting plant growth and development[1]. Under the influence of climate change, the frequency, severity, and duration of droughts are expected to increase globally, aggravating their impacts on the environment, society, and economy[2,3]. Rice (Oryza sativa L.), the staple food for the majority of the world’s population[4], requires large amounts of freshwater resources to grow, and this high-water demand makes it particularly vulnerable to drought stress[5]. According to statistics, about 42 million hectares of rice-producing regions in Asia were exposed to the risk of drought stress[6]. The reduction in rice yields caused by drought stress poses a major and growing threat to global food security[7]. Understanding the drought responsiveness of crops can help to maintain or improve yield and quality in regions exposed to drought stress.
Rice is very sensitive to drought stress, however, when exposed to drought stress at different growth periods, rice responds with different characteristics, which of course may all ultimately lead to yield loss[8]. Studies have shown that lack of water during the pre-growth period of rice reduces the number of tillers, and the a lack of tillers directly affects the final rice yield[9]. Rice is most sensitive to the effects of drought stress on yield at the jointing-booting stage[10]. It has been shown that drought stress in rice at the flowering stage causes poor pollination and pollen abortion, leading to an increase in the number of empty shelled grains in the rice panicle[11]. The filling stage is considered by many researchers to be a critical stage in growth and development when the grain begins to accumulate starch and protein, which directly affects the final rice grain quality and yield[12]. Drought stress in rice during the filling stage reduces the assimilates available for grain filling, resulting in incomplete grain morphology[13].
The rice root system is the first organ to sense the drought stress signal, regardless of the growth period in which it is exposed to drought stress[14]. When this signal is transmitted through the stem to the leaves of the plant, the leaf cells regulate the activity of enzymes and compounds related to physiological processes to reduce stomatal conductance and water loss[15]. Superoxide dismutase (SOD) is the first line of defense in the plant antioxidant system, and under continuous drought stress, SOD activity usually rises in response to drought-induced oxidative stress to protect cells from oxidative damage[16]. The activities of peroxidase (POD) and catalase (CAT) are also increased under drought stress for decomposition and scavenging of hydrogen peroxide, reducing its accumulation in cells, mitigating oxidative damage, and enhancing plant resilience[17]. Malondialdehyde (MDA) is commonly used as a measure of cell membrane damage, and MDA levels usually increase under continuous drought conditions, with high MDA levels reflecting the extent of drought damage to cell membranes[18]. The photosynthetic rate of rice is significantly affected by the activity of ribulose diphosphate carboxylase (Rubisco), which may be reduced under drought stress, leading to stomatal closure and limiting CO2 absorption, which in turn inhibits photosynthesis and assimilate accumulation[19]. However, drought stress at different growth stages and at different drought stress levels had various effects on antioxidant enzymes activities.
In this study, four drought stress levels were simulated at four different rice growth stages to explore the response mechanisms of rice growth and physiology under continuous drought stress. The effects of continuous drought stress at different growth stages of rice on plant height, tiller dynamics, relative chlorophyll content (SPAD value), SOD, POD, CAT, MDA, Rubisco, yield, and the composition were investigated. Our results will help to assess rice’s ability to respond to adversity and provide a scientific basis for the improvement of drought tolerance and production in rice.

2. Materials and Methods

2.1. Experimental Site Description

A rice field trial was conducted from July 28 to November 4, 2023 at the Jiangxi Provincial Irrigation Experimentation Center Station (116°00′E, 28°26′N) in the Ganfu Plain Irrigation Zone, Jiangxi Province, which is a typical subtropical humid monsoon climate zone. Over the past 46 years (1978–2023), the mean annual temperature, rainfall, sunshine hours and pan evaporation in the study area were 17.6°C, 1508.5 mm, 1700 h and 917.5 mm, respectively. The daily maximum and minimum temperatures and rainfall during the experimental period were obtained from the Jiangxi Provincial Irrigation Experimentation Center Station Research Base weather station observations (Figure 1). Rainfall is unevenly distributed throughout the year, with rainfall mainly concentrated in March-July, accounting for 66% of the annual average; September-December rainfall accounts for only 15% of the year. The experimental soil was a red loamy rice soil with an average soil organic matter content of 20.0 g kg–1 in the 0–50 tillage layer, total nitrogen of 1.6 mg kg–1, total phosphorus of 0.5 mg kg–1, total potassium of 6.4 mg kg–1, effective phosphorus of 24.5 mg kg–1, available potassium of 81.3 mg kg–1, pH value of 5.6, soil capacity of 1.5 g cm–3, and field water holding capacity of 29.7% (gravimetric).

2.2. Experimental Design

To better simulate rice drought stress, the field study was conducted under a 36 m (L) × 11 m (W) × 2.5 m (H) mobile waterproof shed to manage natural rainfall. According to the characteristics of drought stress in southern China, drought stress experiments were conducted at the beginning of each growth stage of rice. There were five treatments in this study (Table 1): P1 (drought stress from tillering stage), P2 (drought stress from jointing-booting stage), P3 (drought stress from heading-flowering stage), P4 (drought stress from grain filling stage), and CK (adequate water management throughout the growth stage). Continuous drought stress from different growth stages with four levels (mild, medium, serious, and extreme). Each treatment had three replications and 15 experimental plots (4.5 m × 3 m). Two layers of plastic mulch buried below the soil surface (at a depth of 10 cm) were applied to the ridges to reduce water infiltration between the test plots, and the mobile waterproof shelter was closed when it rained. The experimental rice variety was “Huanghuazhan”, and seedlings with similar growth conditions were selected for transplanting on 28 July, 2023, with a planting density of 26.9 cm × 13.3 cm. Rice was fertilized with basal fertilizer before transplanting, and fertilizer was applied at the tillering stage and spike stage respectively, with a total amount of nitrogen fertilizer for each treatment of 180 kg ha–1, phosphorus fertilizer of 67.5 kg ha–1, and potassium fertilizer of 150 kg ha–1. Intermittent irrigation (Table 2) was used for watering, agrochemicals and weed control measures were used for pest and weed management during the growing season, and other management measures were in accordance with local traditional practices.

2.3. Sampling and Measurements

2.3.1. Field Water Balance

During the rice growth period, the depth of the field water layer in each plot was observed at 8:00 a.m. every day using a ZHD-60 type electric stylus. When the depth of the water layer at the field surface drops to 0, water consumption is calculated by the deviation between the irrigation amount and the depth of the water layer at the field surface after watering. The water balance was calculated as shown below:
W = h 1 h 2 + θ 1 θ 2 + P + I D  
where W (mm) is the actual water consumption; h 1 and h 2 (mm) are the depths of the water layer at the beginning and end of the observation interval; θ 1 and θ 2 (mm) are the soil water storage at the beginning and end of the observation interval; P (mm) is the rainfall; I (mm) is the irrigation amount; D (mm) is the drainage amount.

2.3.2. Classification of Drought Stress Level

The relative soil moisture index[20] (RSM, the ratio of soil water content to field capacity, %) was selected to classify the drought stress level, where mild drought was 55 < RSM < 65, medium drought was 45 < RSM < 55, serious drought was 35 < RSM < 45, and extreme drought was RSM < 35. Using a hand-held soil auger, in each plot, one soil sample was taken at each 10 cm within the 0–50 cm soil layer. The soil samples were then weighed and dried in an oven at 105°C for 8 hours to calculate soil moisture.
R S M = α × θ / f c × 100 %  
θ = m w m d / m d × 100 %  
where α is the crop growth stage adjustment factor, which is 1.1 for the seedling stage, 0.9 for the water critical stage, and 1 for the other growth stages; θ (%) is the soil moisture content; f c (%) is the field capacity; m w (g) is the weight of wet soil; m d (g) is the weight of dry soil.

2.3.3. Rice Growth and Leaf Physiology

Starting from the tillering stage, 10 fixed observation points were selected in each plot and the plant height and number of tillers were measured at 7-day intervals.
The relative chlorophyll content (SPAD value) of rice leaves was measured by a chlorophyll meter (SPAD-502 Plus, Konica Minolta Optics, Inc., Japan) in each treatment from before exposure to drought stress to the end of drought exposure (for rewatering). Ten rice flag leaves were selected from each plot for measurement, and three SPAD values were measured for each leaf (including the upper, middle and lower parts of the leaves), and the mean value was calculated as the leaf SPAD value.
On the same day that the SPAD value was measured, three leaf samples were selected from each treatment to determine the content of superoxide dismutase (SOD), peroxidase (POD), catalase (CAT), malondialdehyde (MDA), and ribulose diphosphate carboxylase (Rubisco) in the leaves. SOD was determined by the water-soluble tetrazolium monosodium salt (WST-8) method[21]; POD was determined using POD-catalyzed hydrogen peroxide (H2O2) oxidation of specific substrates[22]; CAT was determined using a colorimetric method using ammonium molybdate[23]; MDA was determined by a thiobarbituric acid (TBA) colorimetric assay[22]; Rubisco was determined by spectrophotometric [24].

2.3.4. Yield and Its Composition

After rice matured, each plot manually collected rice plants within 0.25 m2 (0.5 m × 0.5 m) for natural air-drying. Then the average effective number of spikes, spike length, number of grains per spike, seed setting rate, and thousand grain weight were calculated for each plot. All remaining rice plants within the plot were harvested for yield calculation.

2.4. Statistical Analysis

Analysis of variance (ANOVA) was performed using IBM SPSS software (SPSS Inc., Chicago, IL, USA), and in this study, the least significant difference test (LSD) (p < 0.05) was used for ANOVA. Microsoft Excel (Microsoft Cooperation, Redmond, WA, USA) was used to process the data and represent them as means of different replications. Figures were plotted using Microsoft Excel and Origin2021 software (Northampton, MA, USA).

3. Results

3.1. Four Levels of Continuous Drought Stress Process

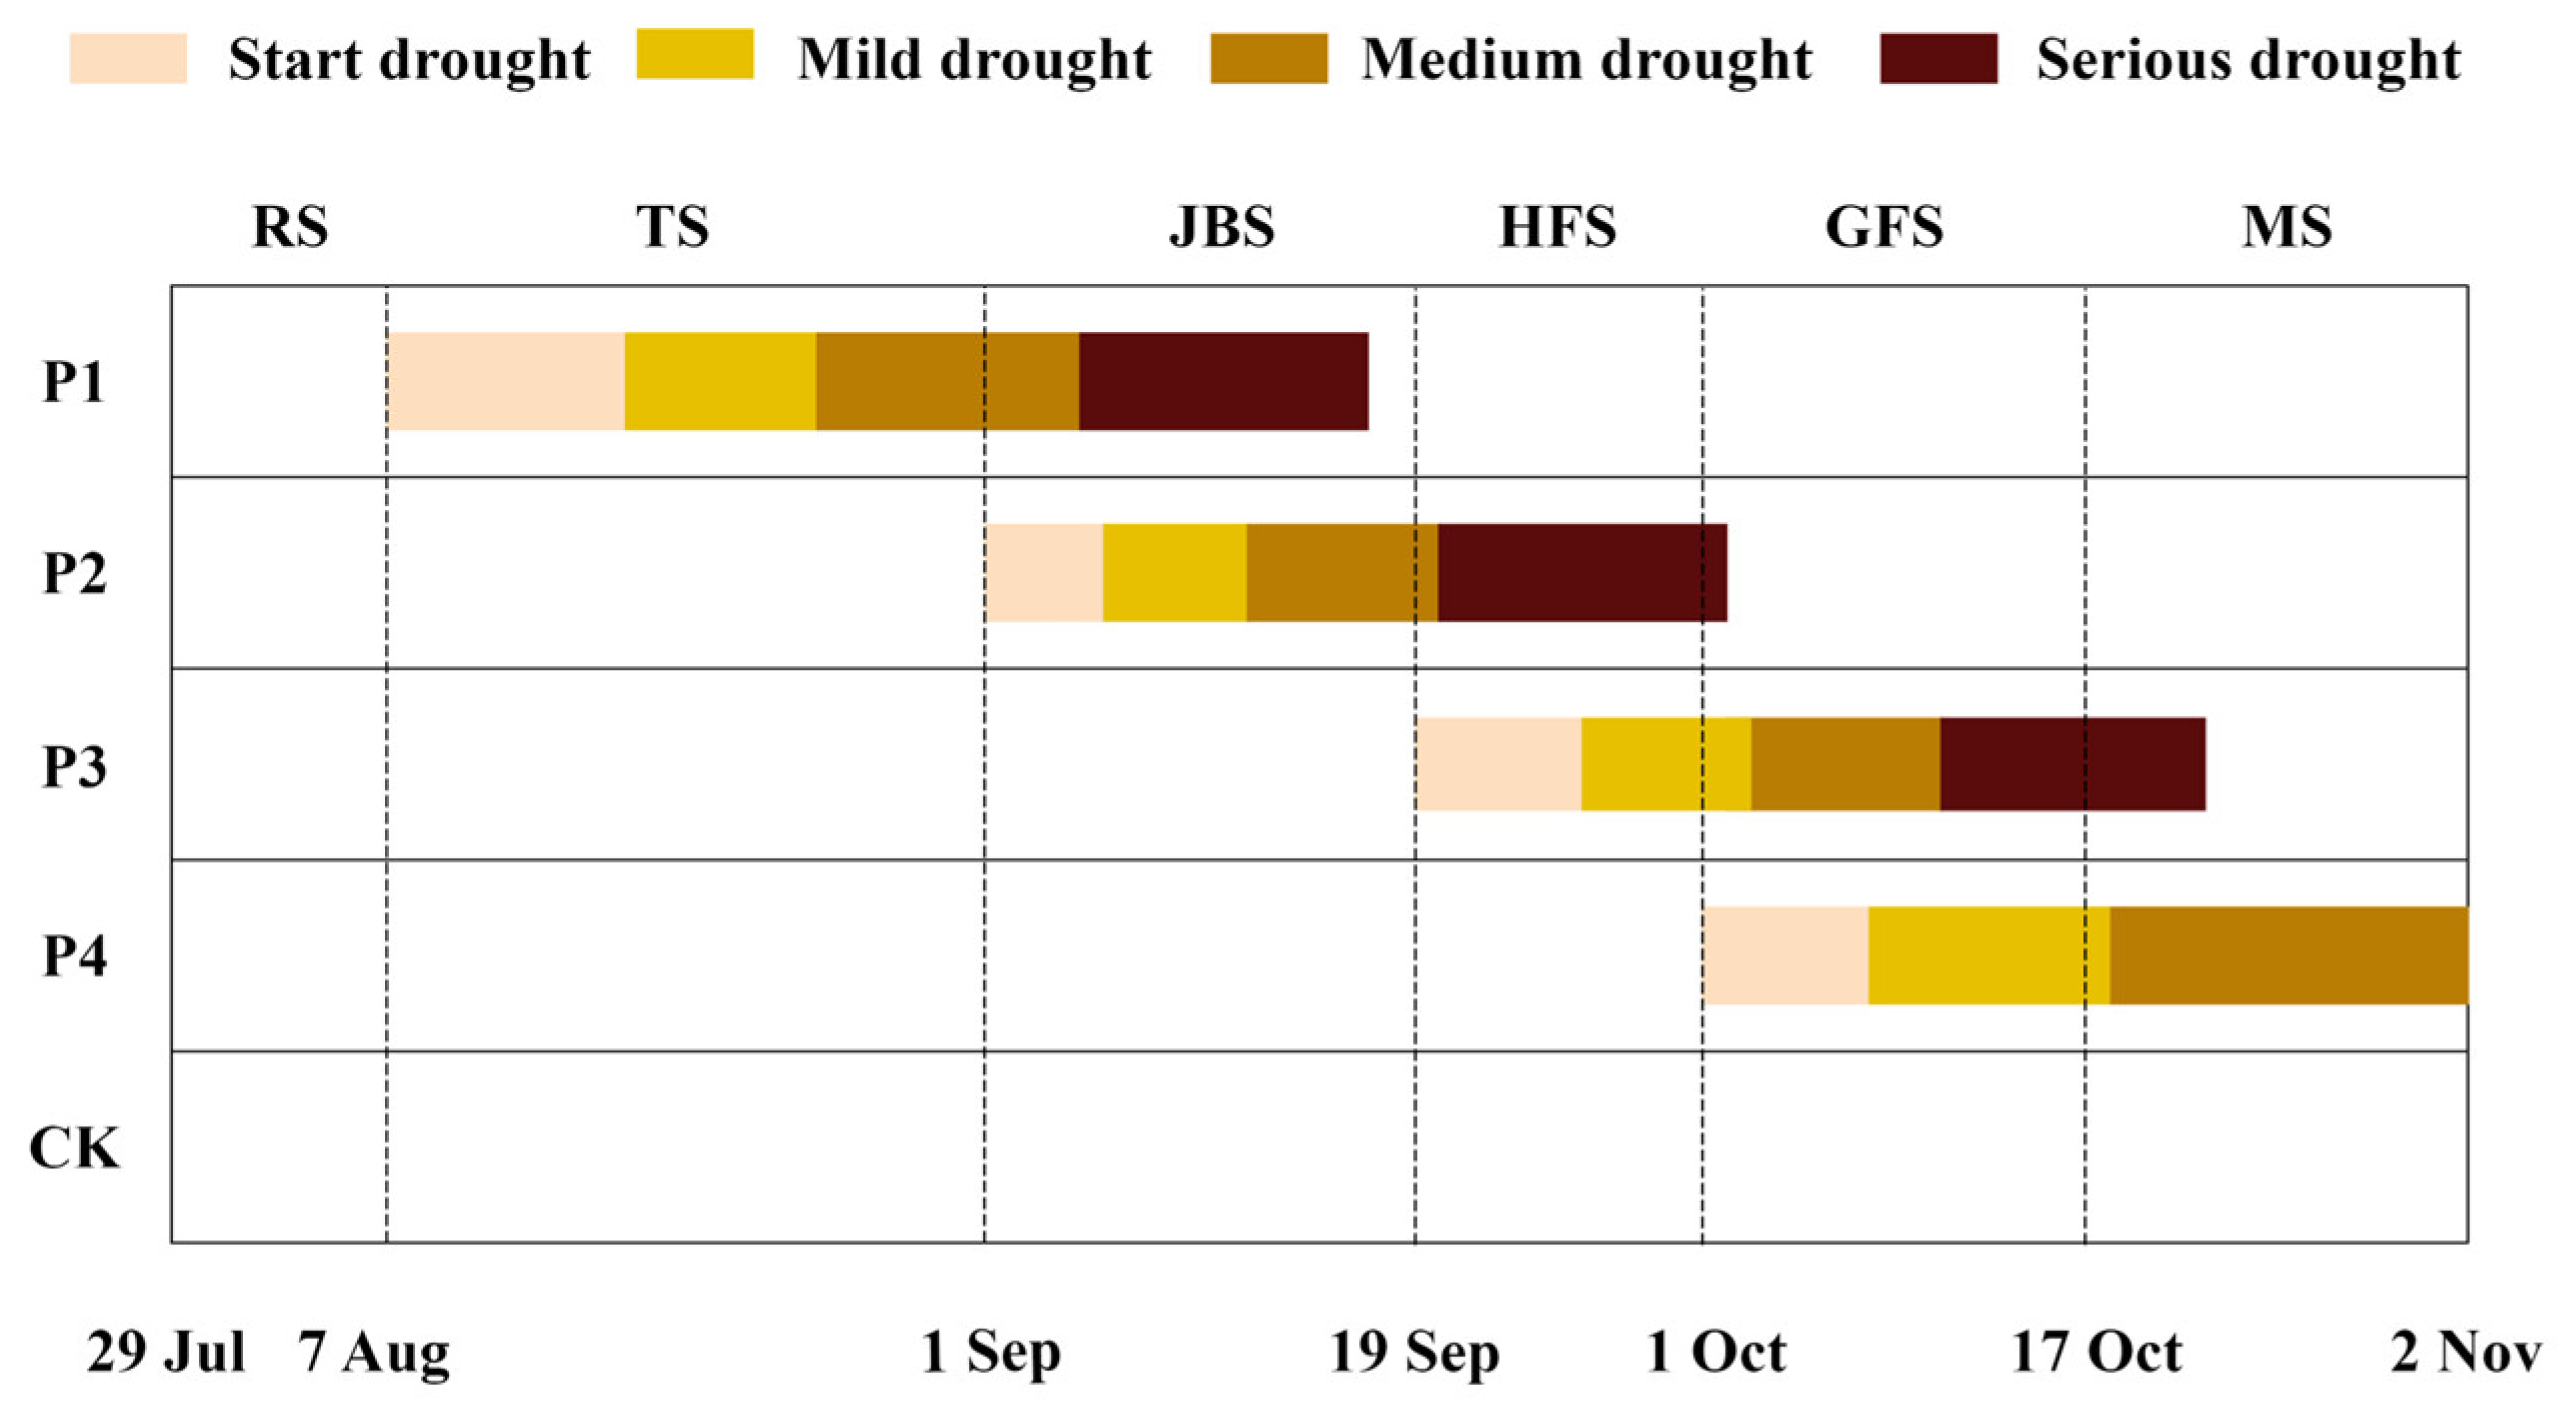
The continuous drought stress process for each treatment was at different growth stages (Figure 2). The continuous drought stress process of P1 treatment was from August 7 to September 17 (cumulative 41 days), and it has taken 10, 8, 11, and 12 days to reach the mild, medium, serious, and extreme drought stress levels, respectively. The continuous drought stress process of P2 treatment was from September 1 to October 2 (cumulative 31 days), and it has taken 5, 6, 8, and 12 days to reach the mild, medium, serious, and extreme drought stress levels, respectively. The continuous drought stress process of P3 treatment was from September 19 to October 24 (cumulative 35 days), and it has taken 7, 7, 10, and 11 days to reach the mild, medium, serious, and extreme drought stress levels, respectively. The P4 treatment started continuous drought stress from the filling stage and did not reach the serious and extreme drought stress levels due to the low temperatures and rainfall in the locality. Its drought stress process was from October 1 to November 2, and it has taken 7 and 11 days to reach the mild and medium drought stress levels, respectively.

3.2. Effects of Four Levels of Continuous Drought Stress on Water Consumption and Utilization

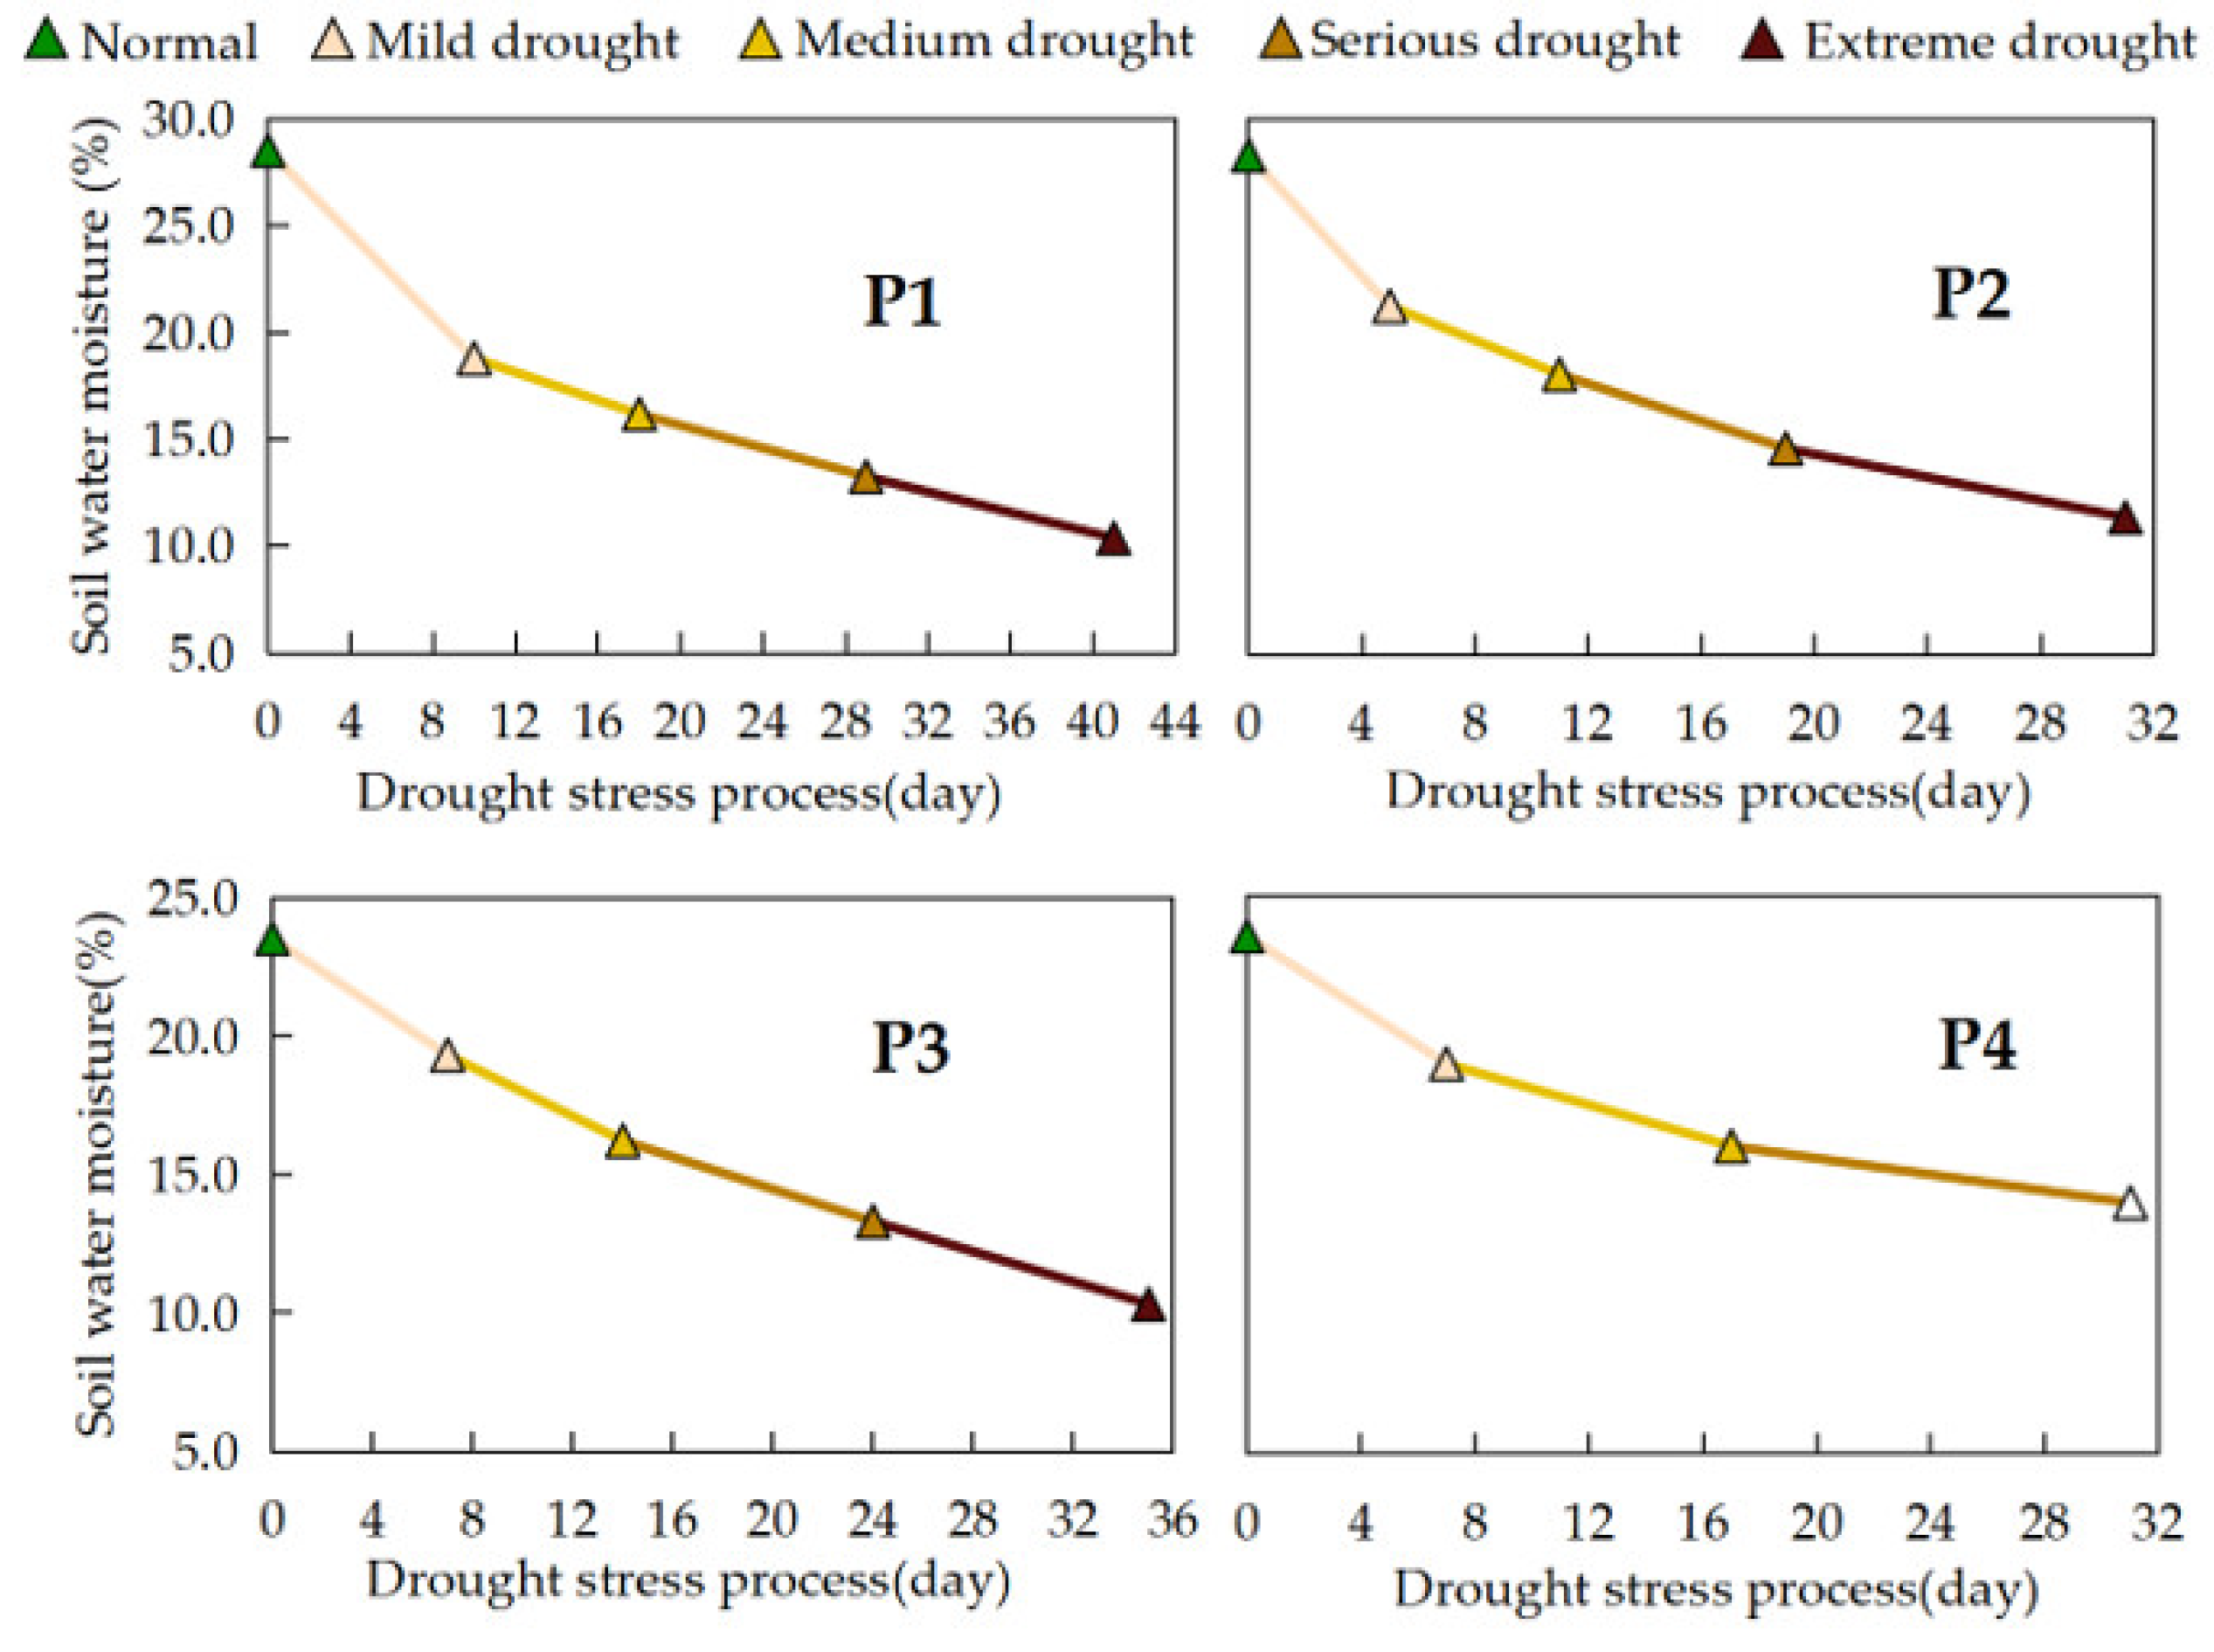
The soil water content of the CK treatment fluctuated slightly with the growth process and irrigation time, keeping the field water amount appropriate according to the rice growth demand. The soil water moisture of the continuous drought stress treatments at different growth stages showed a continuous decrease with the duration of drought stress (Figure 3). The magnitude of change in soil water content during drought stress in each treatment showed that P1 > P2 > P3 > P4, and the daily change showed that P2 > P3 > P1 > P4. Daily variations in water content were 0.54%, 0.44%, 0.38% and 0.31%, respectively. The effects of different drought stress treatments on water consumption in rice were significantly different (P < 0.05). The CK treatment had the highest water consumption, which was reduced by 22.37%, 14.23%, 14.84%, and 21.69% for the P1, P2, P3, and P4 treatments, respectively. In this study, the water use efficiency (WUE) of each treatment is in the order of P4 > CK > P1 > P3 > P2 (Table 3). The WUE of the P4 treatment was 5.2% higher than that of the CK treatment. P1, P2 and P3 treatments reduced WUE by 14.52%, 22.71% and 14.70%, respectively, compared to the CK treatment.

3.3. Effects of Four Levels of Continuous Drought Stress on Plant Height and Tillering

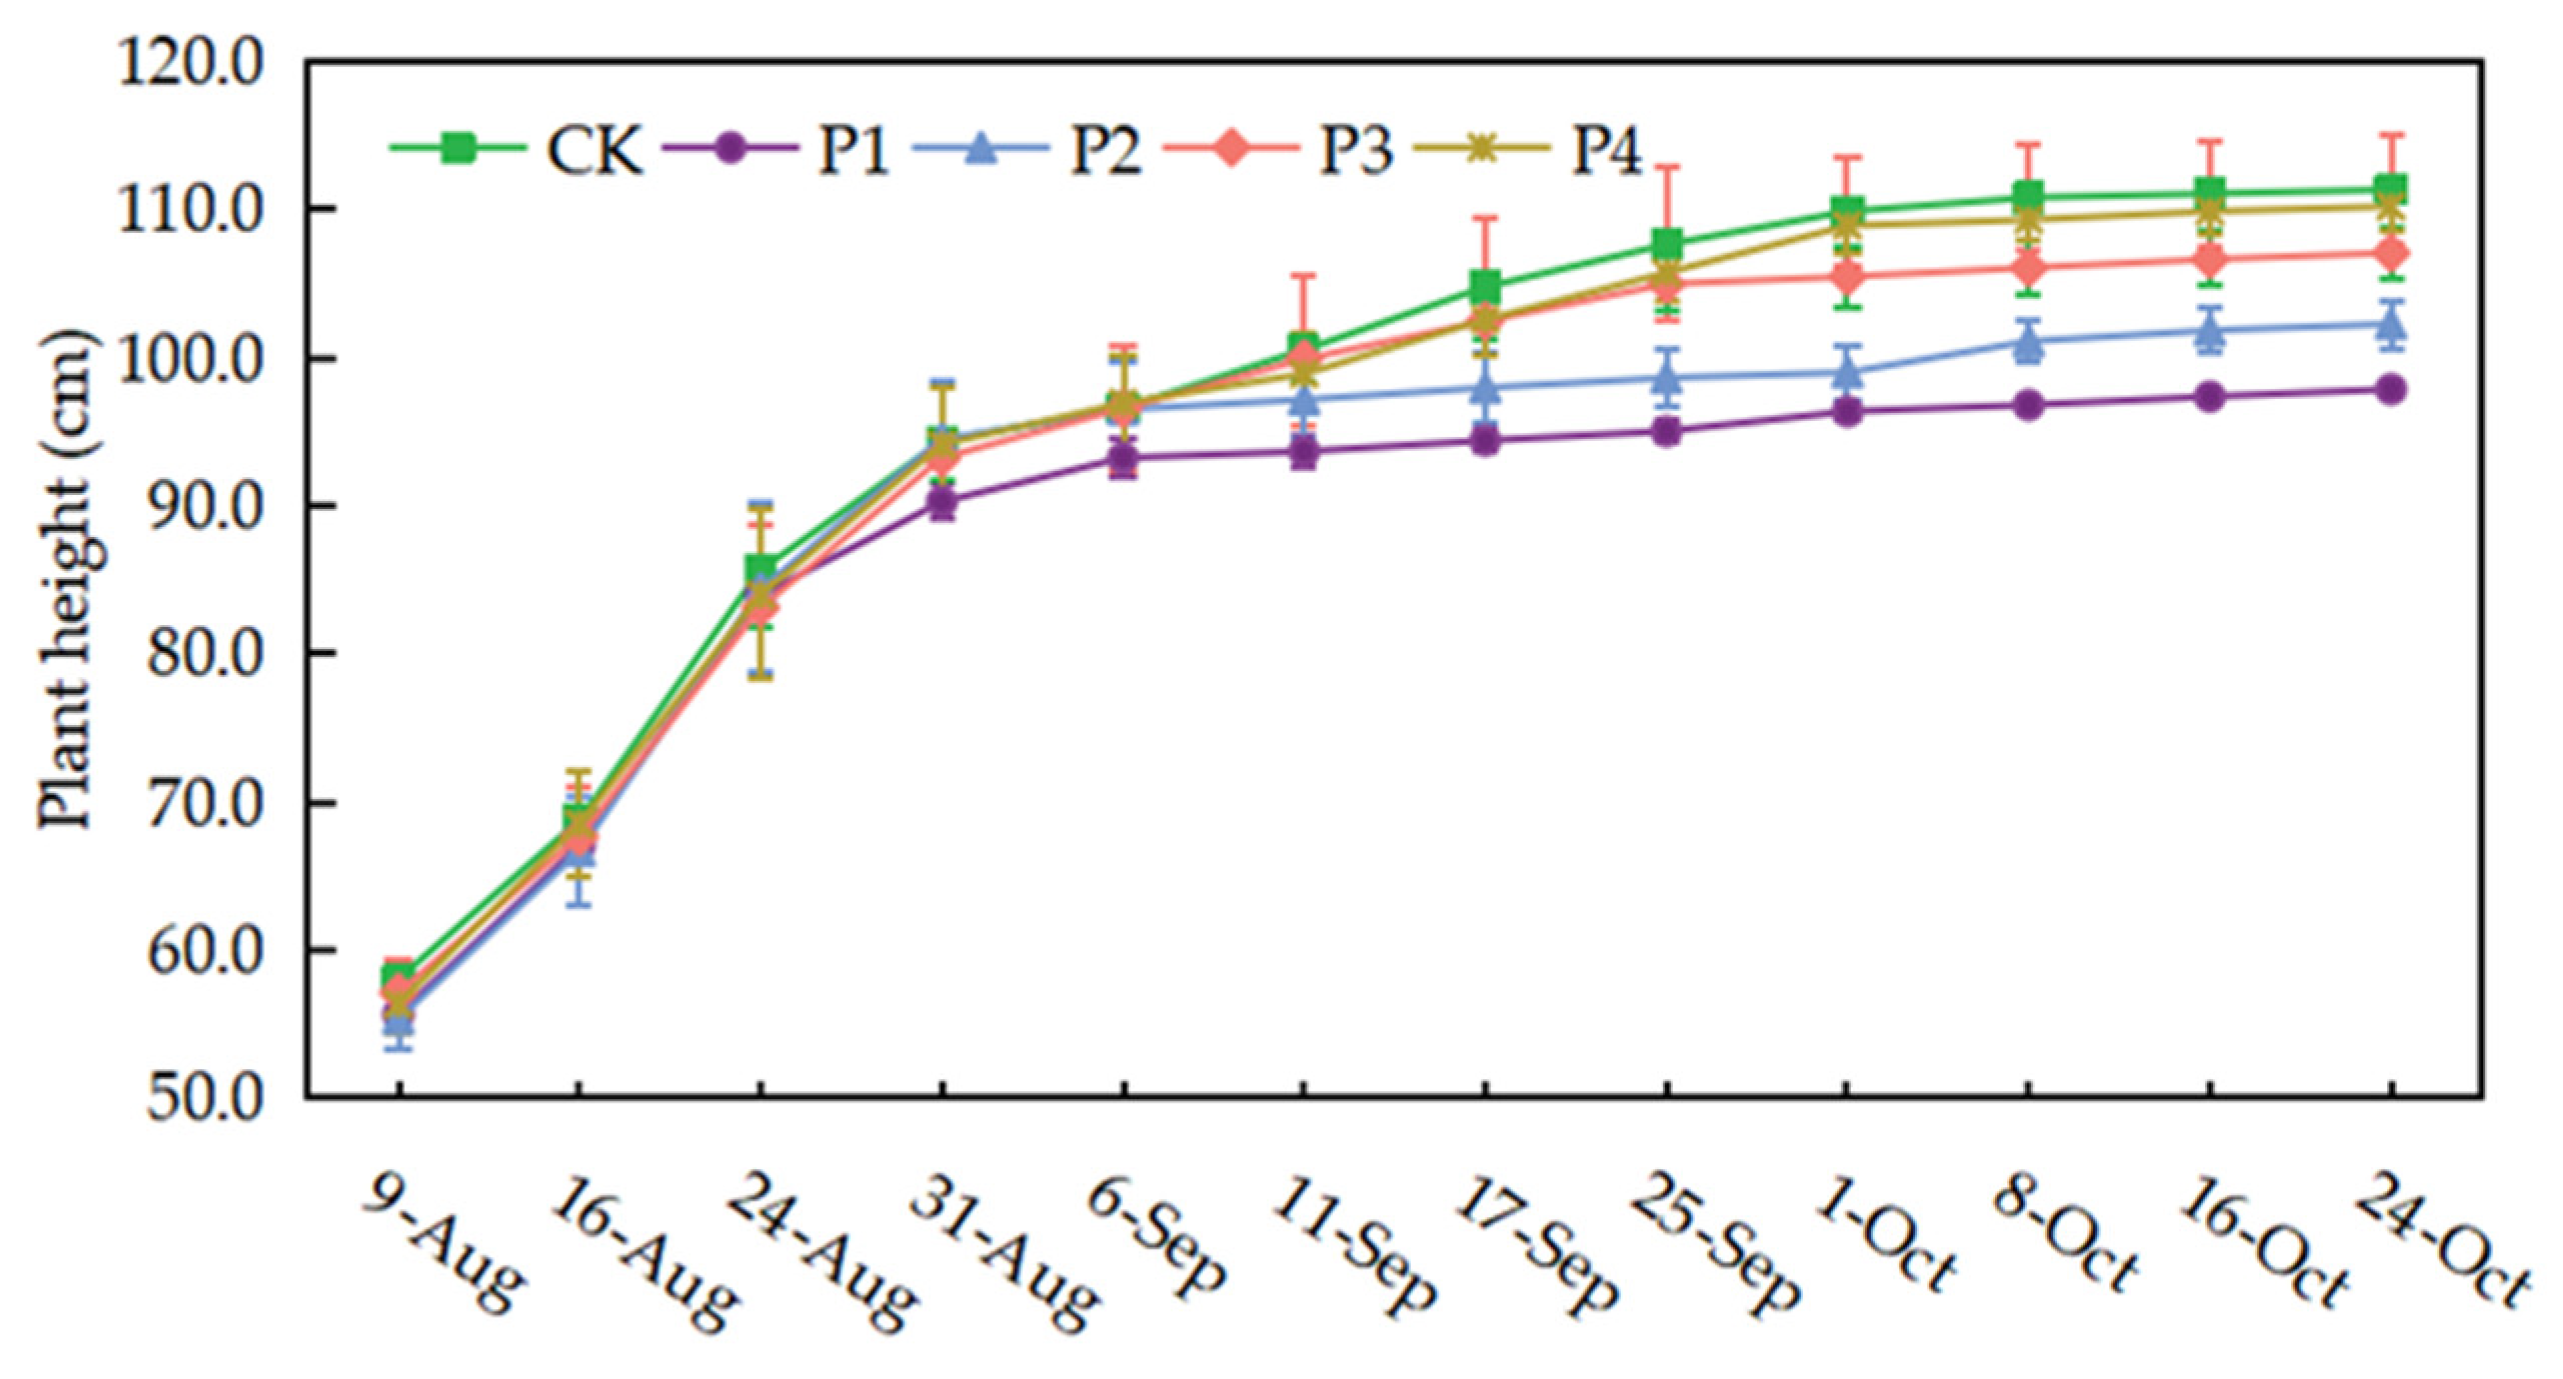
Continuous drought stress had an inhibitory effect on rice plant height, which followed the order of CK > P4 > P3 > P2 > P1 under different treatments (Figure 4). Plant height was reduced by 12.10%, 8.14%, 3.83%, and 1.06% in the P1, P2, P3, and P4 treatments, respectively, compared to the CK treatment. The P1 treatment was not significantly affected by mild and medium drought stress, but its plant height growth became slow after reaching serious and extreme drought, and the growth was only 54.45% of the CK treatment. Similarly, the P2 treatment showed a similar trend in plant height when drought stress was initiated at the jointing-booting stage, and the plant height growth during drought stress was only 29.14% of that in the CK treatment. The P3, P4, and CK treatments showed greater variation in plant height before September 25. The change in plant height of the P4 treatment was not significant after the heading stage. Plant height recovered in all treatments after rewatering, but the final plant heights of P1 and P2 treatments remained low due to the continuous drought stress at the tillering and jointing-booting stages.
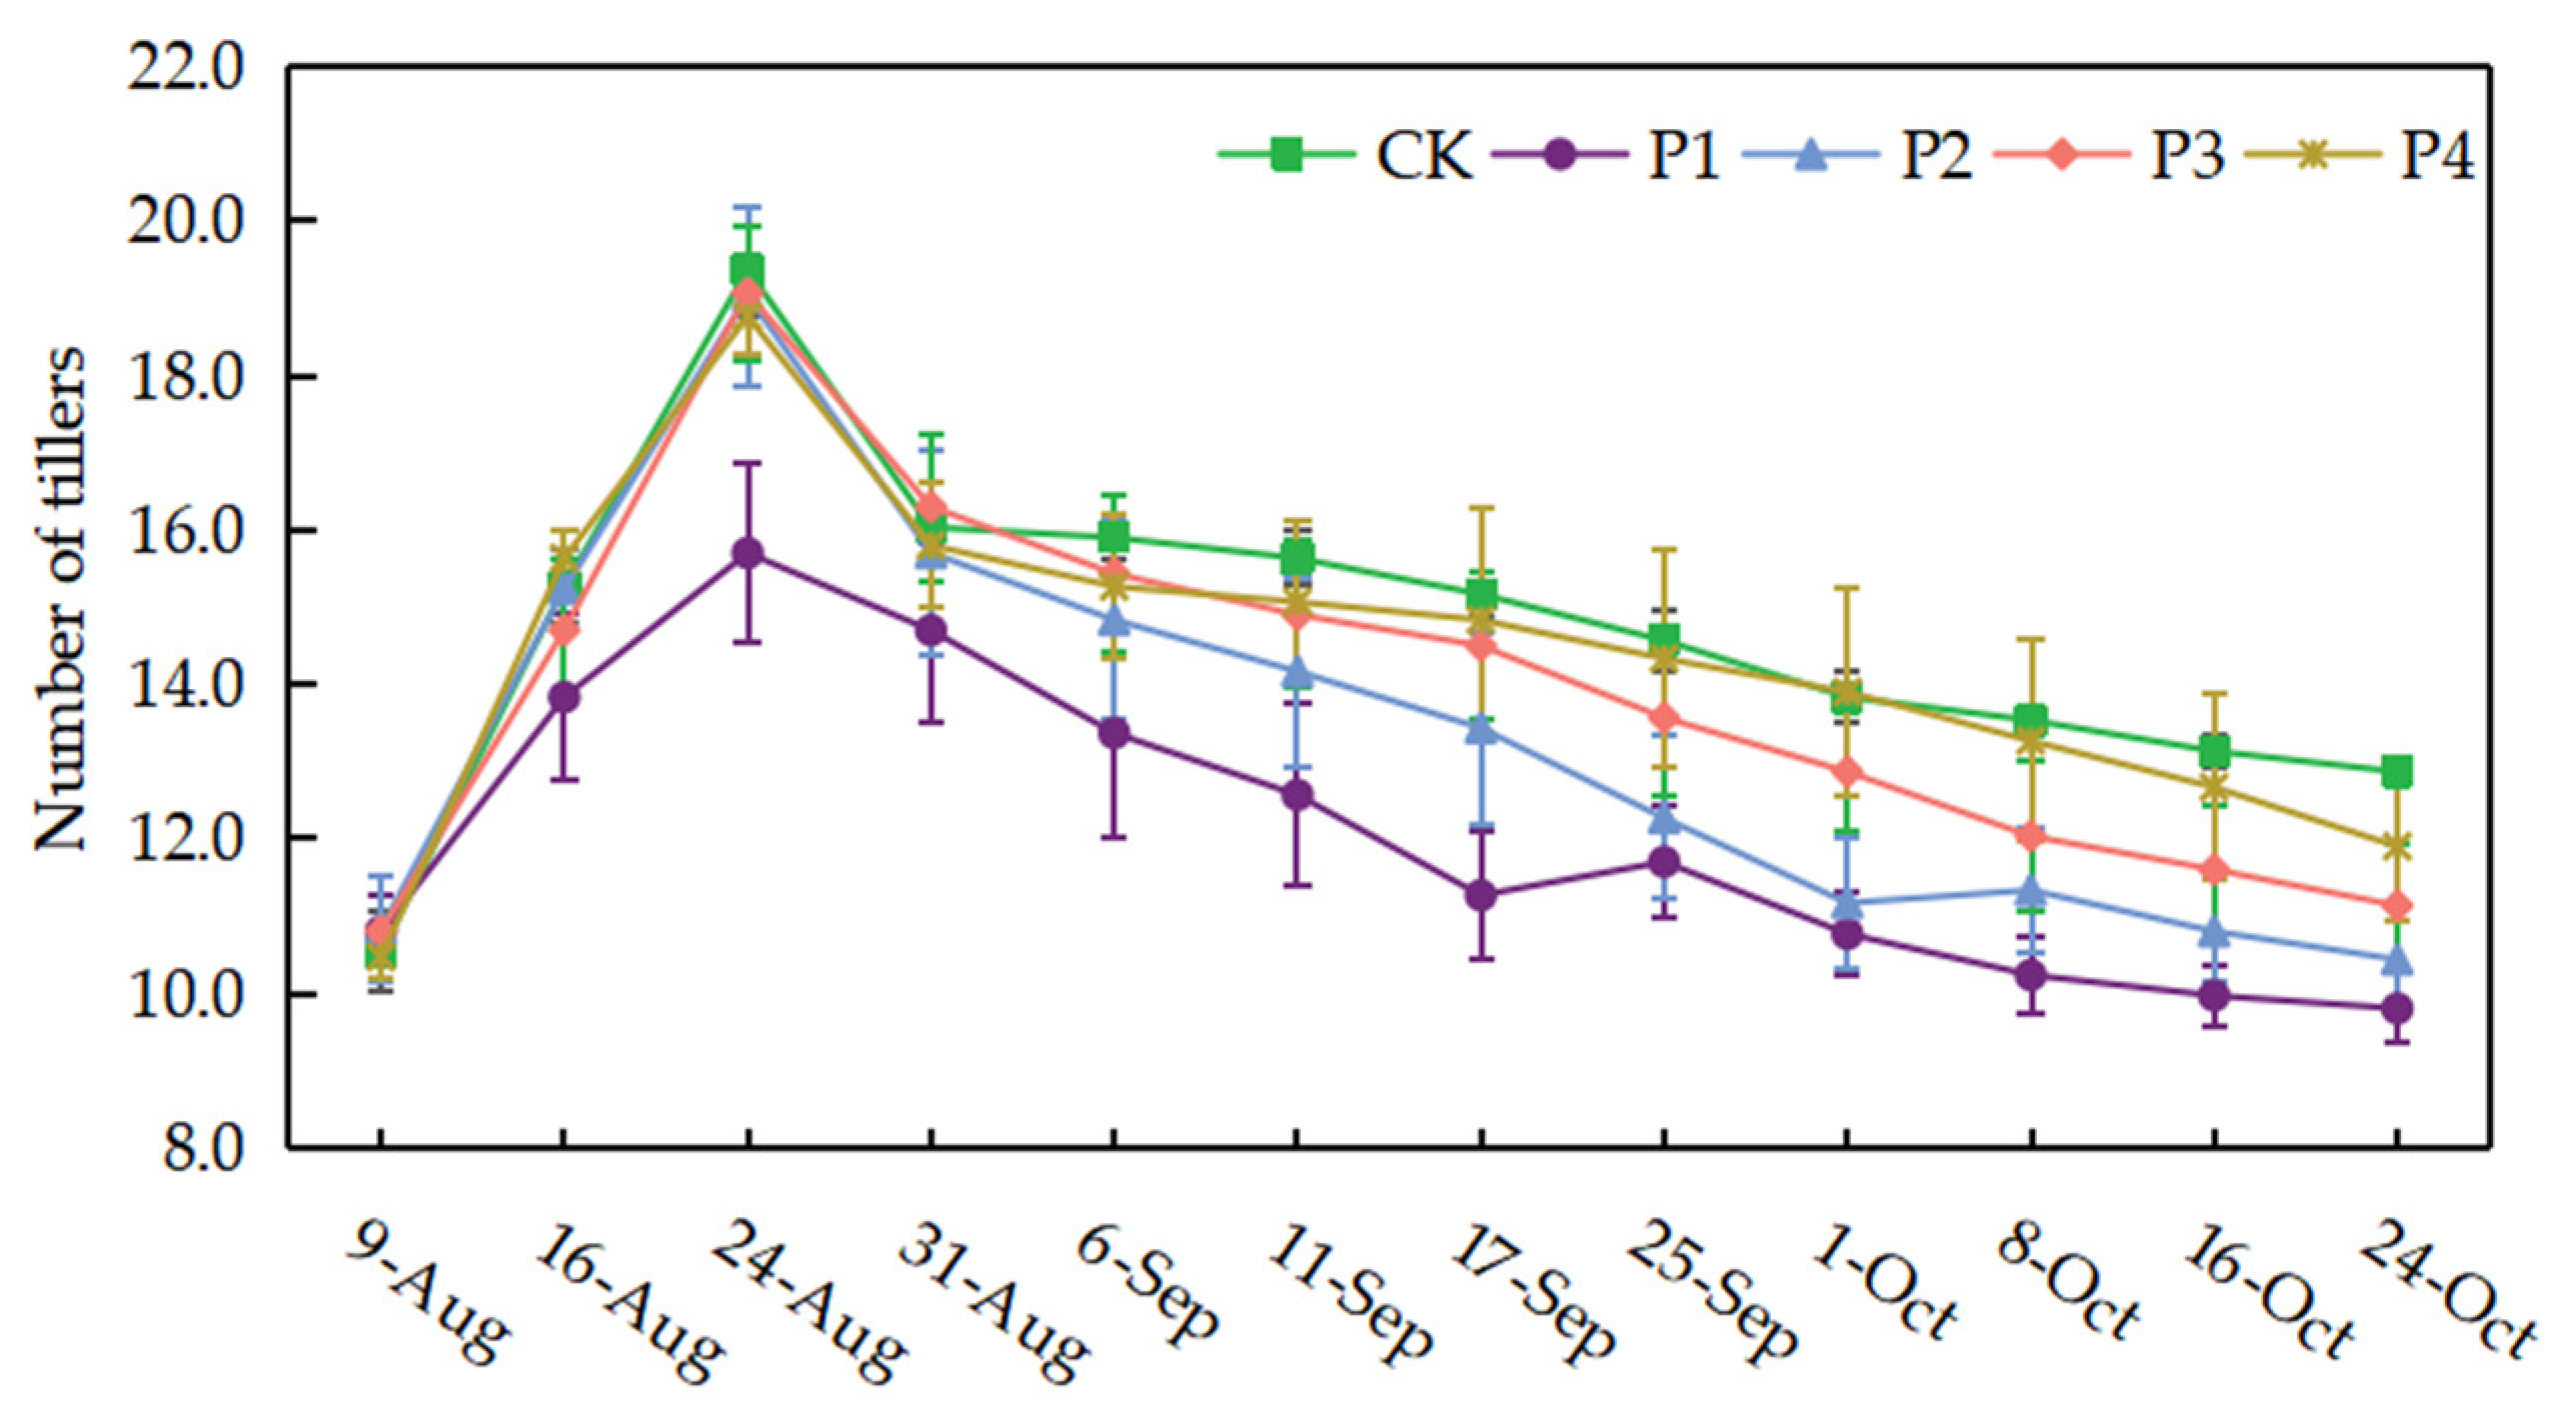
The number of rice tillers was obviously reduced under continuous drought stress conditions, which followed the order of CK > P4 > P3 > P2 > P1 under different treatments (Figure 5). The number of tillers was reduced by 23.83%, 18.91%, 13.47%, and 8.68% in P1, P2, P3, and P4 treatments, respectively, compared to CK treatment. Continuous drought stress from the tillering stage had the greatest effect on tiller number (p < 0.05). The average number of rice tillers in the P1 treatment was 11.27, which was 25.71% lower than the CK treatment. P2 and P3 treatments showed a significant decrease in tiller number during continuous drought stress. The effect of continuous drought stress on the number of tillers was not significant after the heading-flowering stage, so the difference between CK and P4 treatments was not significant. After rewatering, the P1 and P2 treatments showed an increase in tiller number, but the final tiller number remained low.

3.4. Effects of Four Levels of Continuous Drought Stress on Physiological Parameters

3.4.1. Relative Chlorophyll Content (SPAD Value)

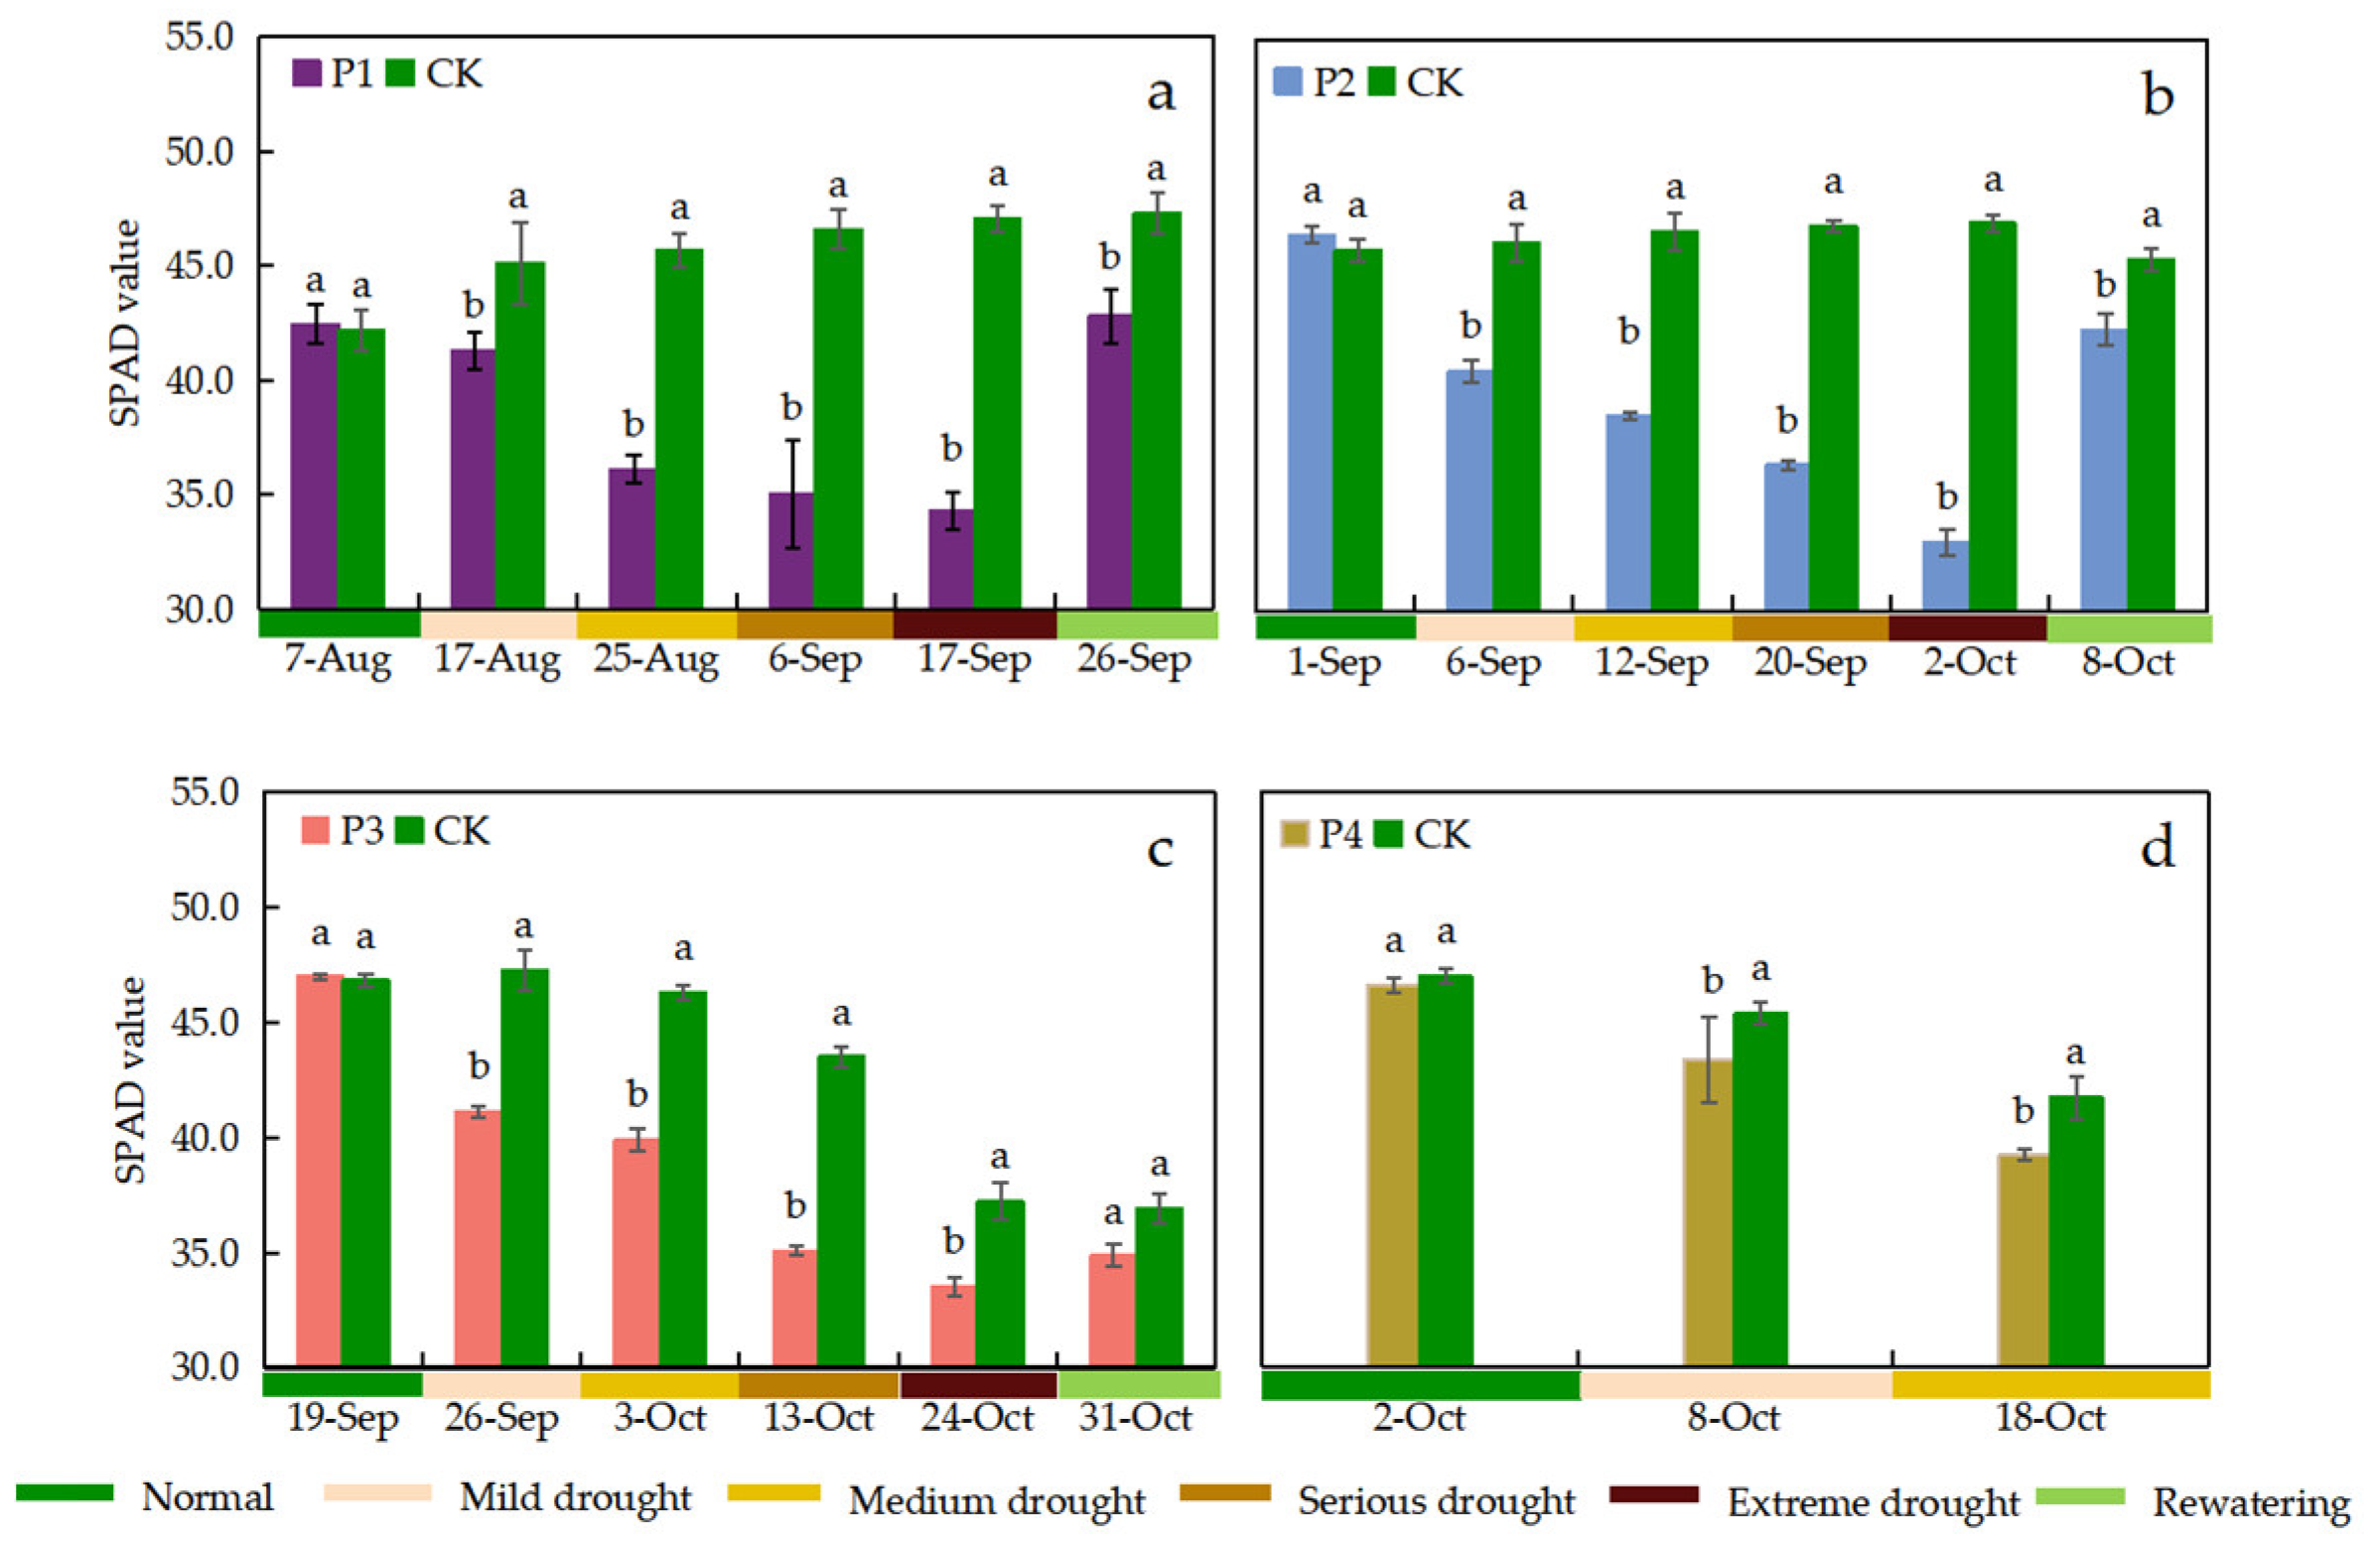
Leaf SPAD values were measured once before the start of drought stress in the P1, P2, and P3 treatments, once after rewatering, and once each during the period when different drought stress levels were reached, respectively (Figure 6). The continuous drought stress process for the P4 treatment occurred at a late growth stage of the rice, when only mild and moderate drought stress levels were reached, and thus only four observations were available (Figure 6). The CK treatment of rice leaf SPAD values showed an increasing and then decreasing trend during the growth period. Leaf SPAD values of drought stress treatments gradually decreased with increasing drought stress levels. Except for P4 treatment, leaf SPAD values of P1, P2 and P3 treatments showed an increase after rewatering. Compared with the CK treatment, each drought stress treatment significantly reduced leaf SPAD values when different drought stress levels were reached, respectively. When the drought stress level reached extreme drought, the SPAD values of the P1, P2, and P3 treatments decreased by 27.06%, 29.68% and 9.94%, respectively, compared with the CK treatment. In addition, the SPAD values of the treatments after rewatering increased but still did not return to normal levels.

3.4.2. Activity of Rubisco

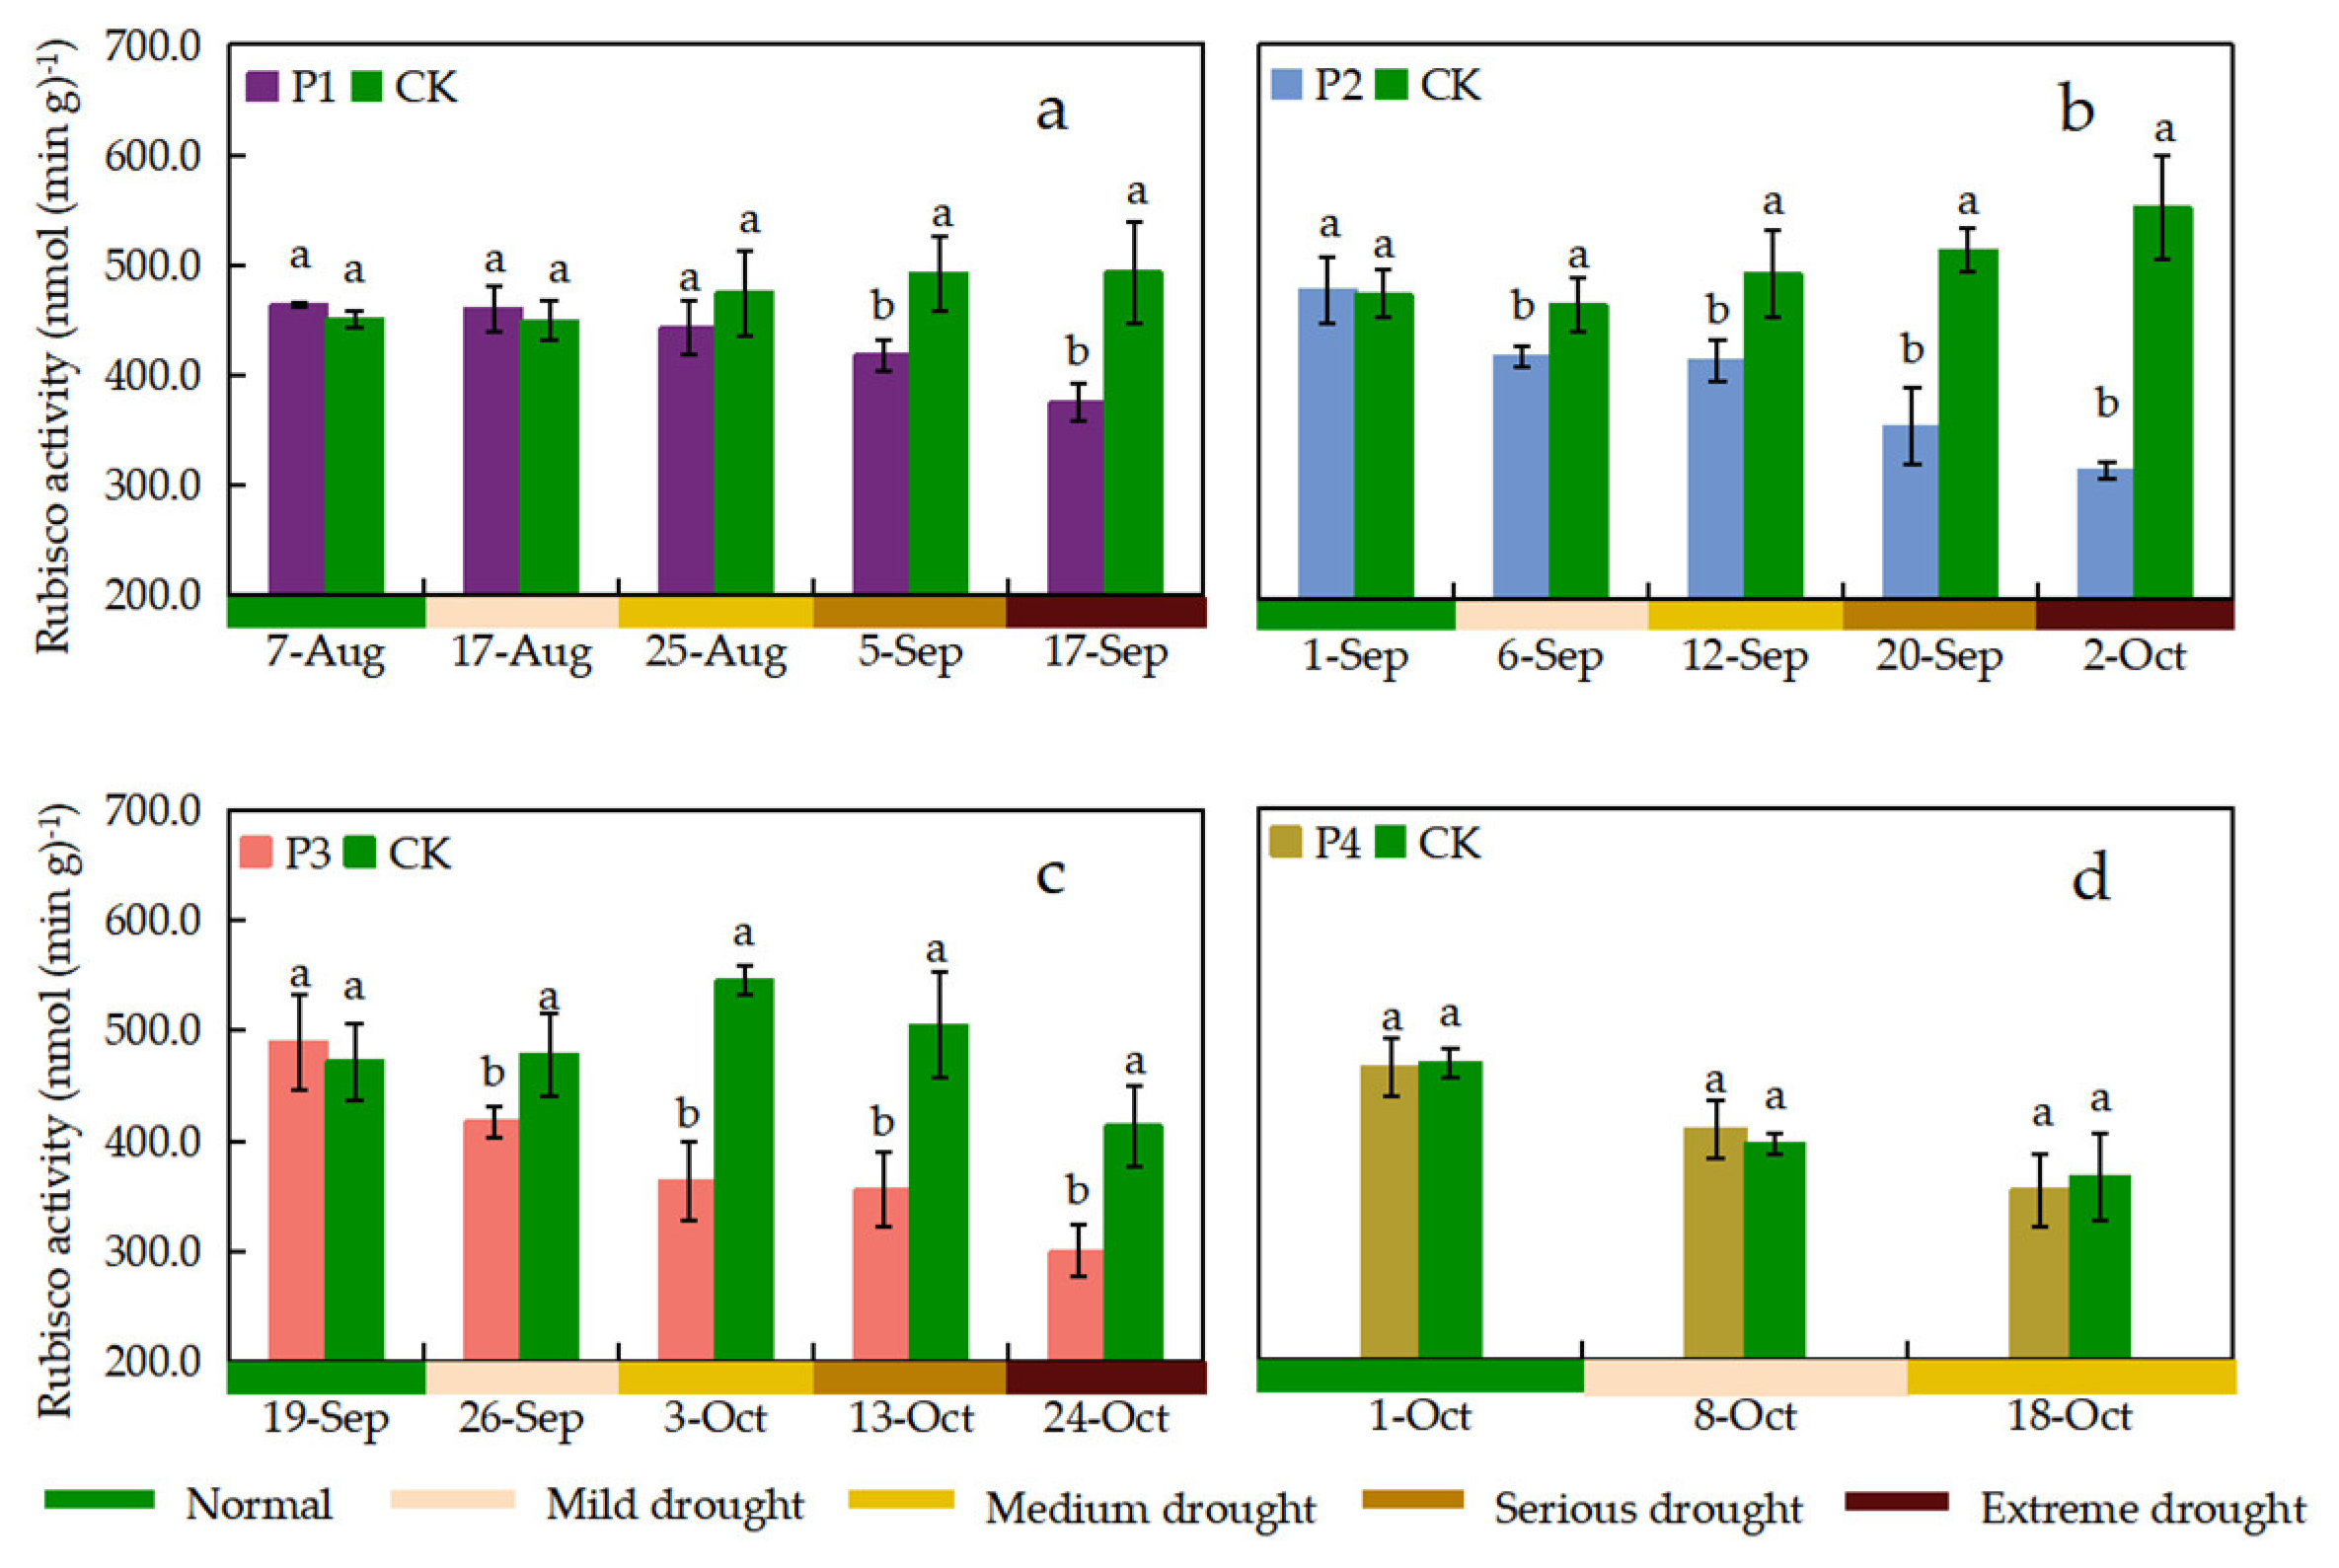
Leaf Rubisco activity was observed once before the start of drought stress and once during the period when different drought stress levels were reached for the P1, P2, and P3 treatments, respectively (Figure 7). The drought stress process for the P4 treatment occurred at a late growth stage of the rice, when only mild and moderate drought stress levels were reached, and thus only three observations were available. The leaf Rubisco activity of CK treatment showed a trend of increasing and then decreasing, with the Rubisco activity reaching its maximum value at the heading-flowering stage and decreasing to the minimum value at the maturity stage (Figure 7). The P1 and P4 treatments were not significantly different from the CK treatment when they were under mild and medium drought stress. The leaf Rubisco activity of the P2, and P3 treatments was significantly lower than that of the CK treatment throughout the drought stress period. The Rubisco activity of rice leaves continued to decreased with increasing drought stress levels. The differences in leaf Rubisco activity under the P2 and P3 treatments were more significant than those under the CK treatment. Compared with the CK treatment, the P2 treatment showed a 42.91% decrease in leaf Rubisco activity when the drought stress level reached extreme drought, which was the largest decrease among the treatments. Rubisco activity decreased by 23.82%, 42.91%, and 27.46% in P1, P2, and P3 treatments compared to CK at mild drought to extreme drought, respectively. Notably, leaf Rubisco activity was higher in the P1 and P4 treatments than in the CK treatment when the drought stress level reached mild drought stress, but it was not statistically significant.

3.4.3. Activities of SOD, POD and CAT

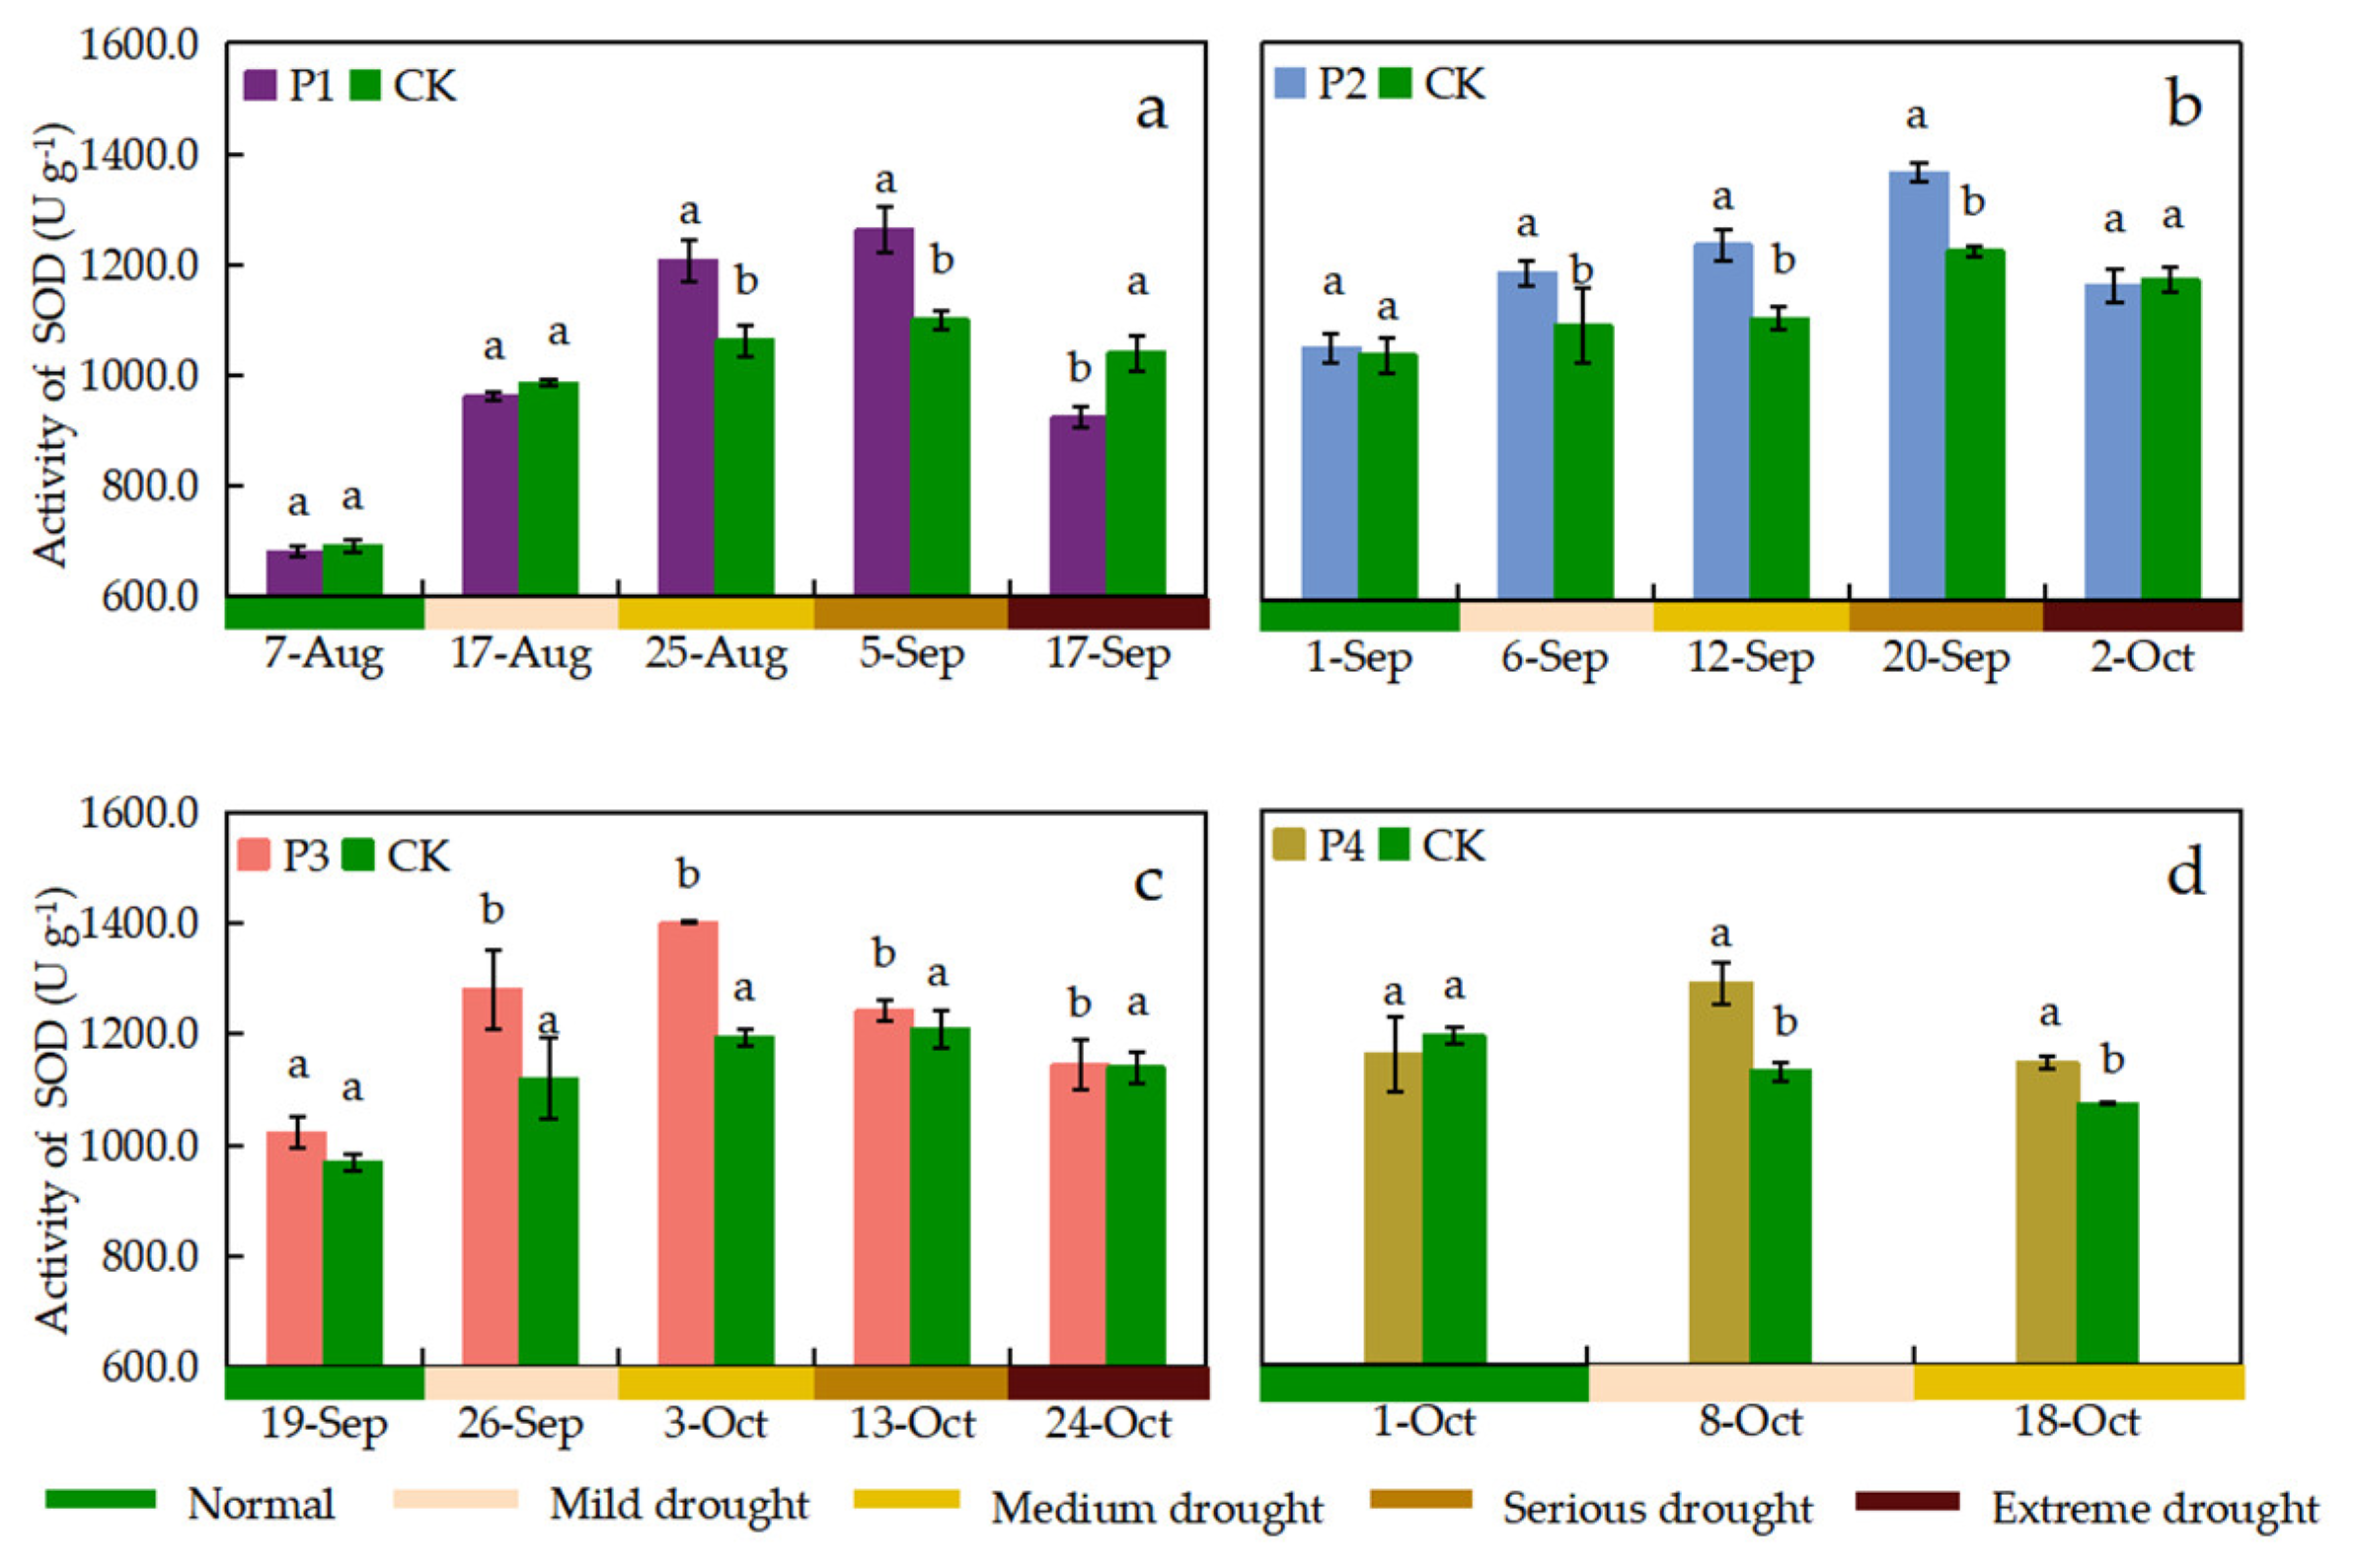
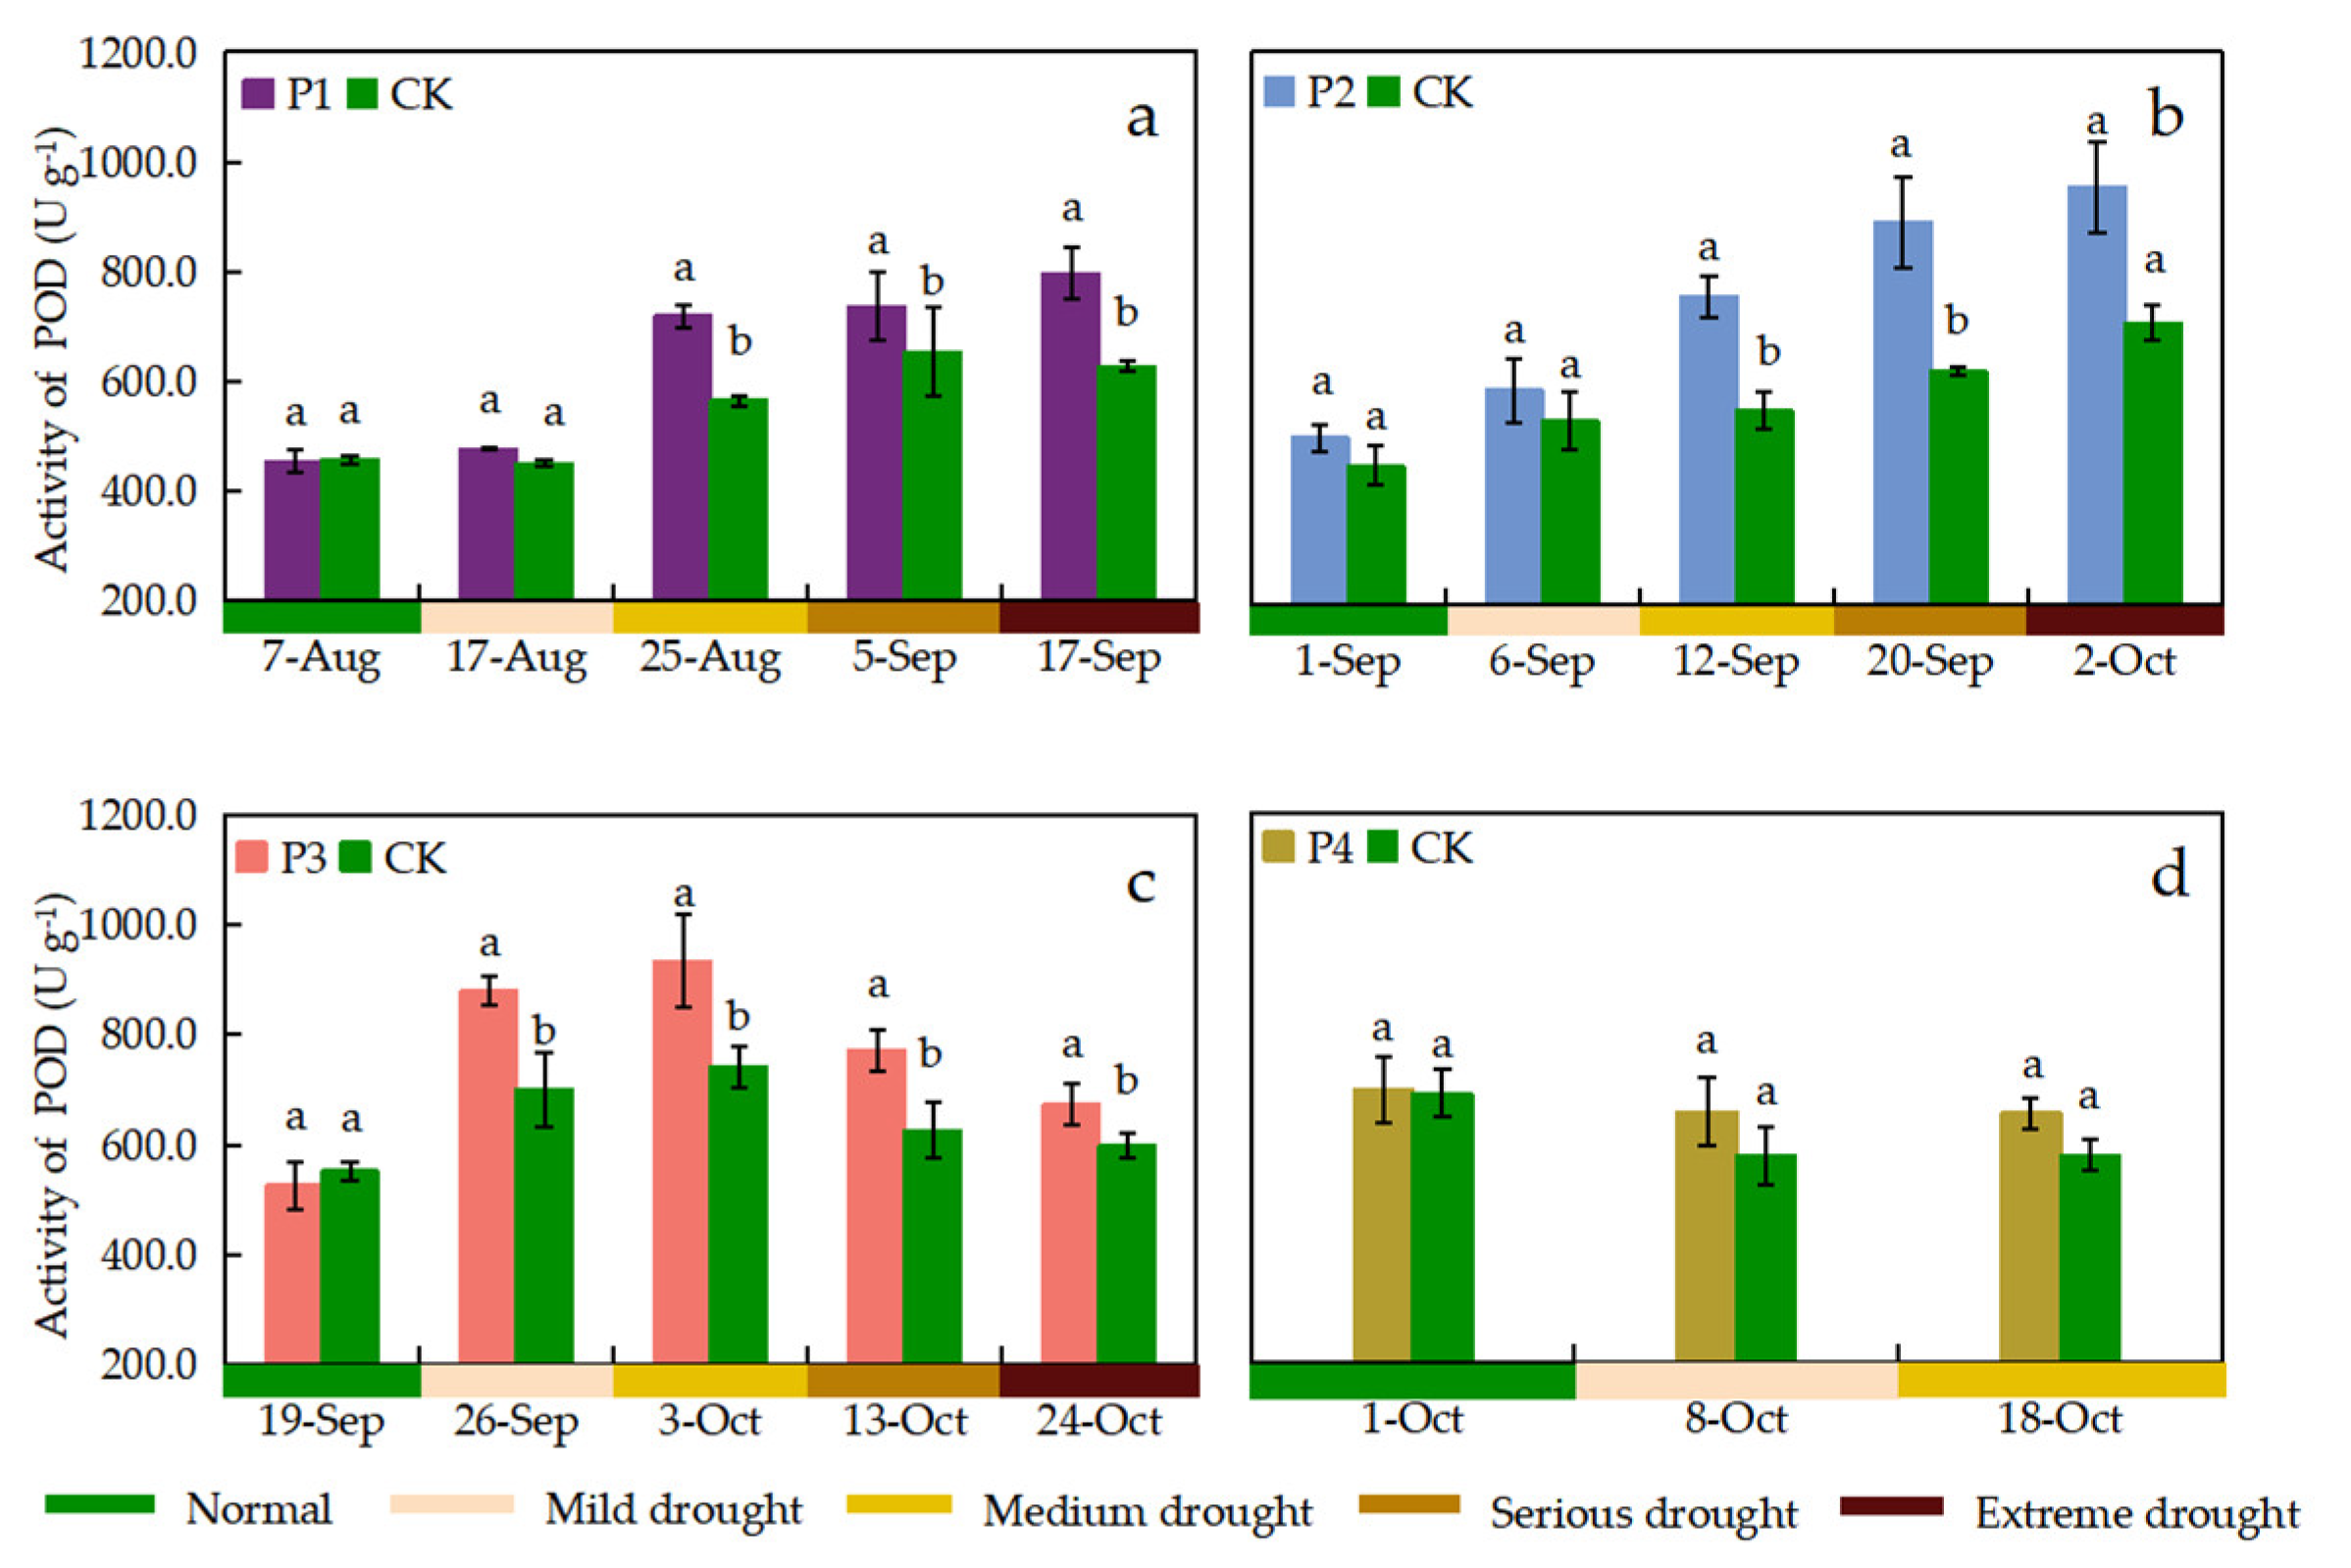
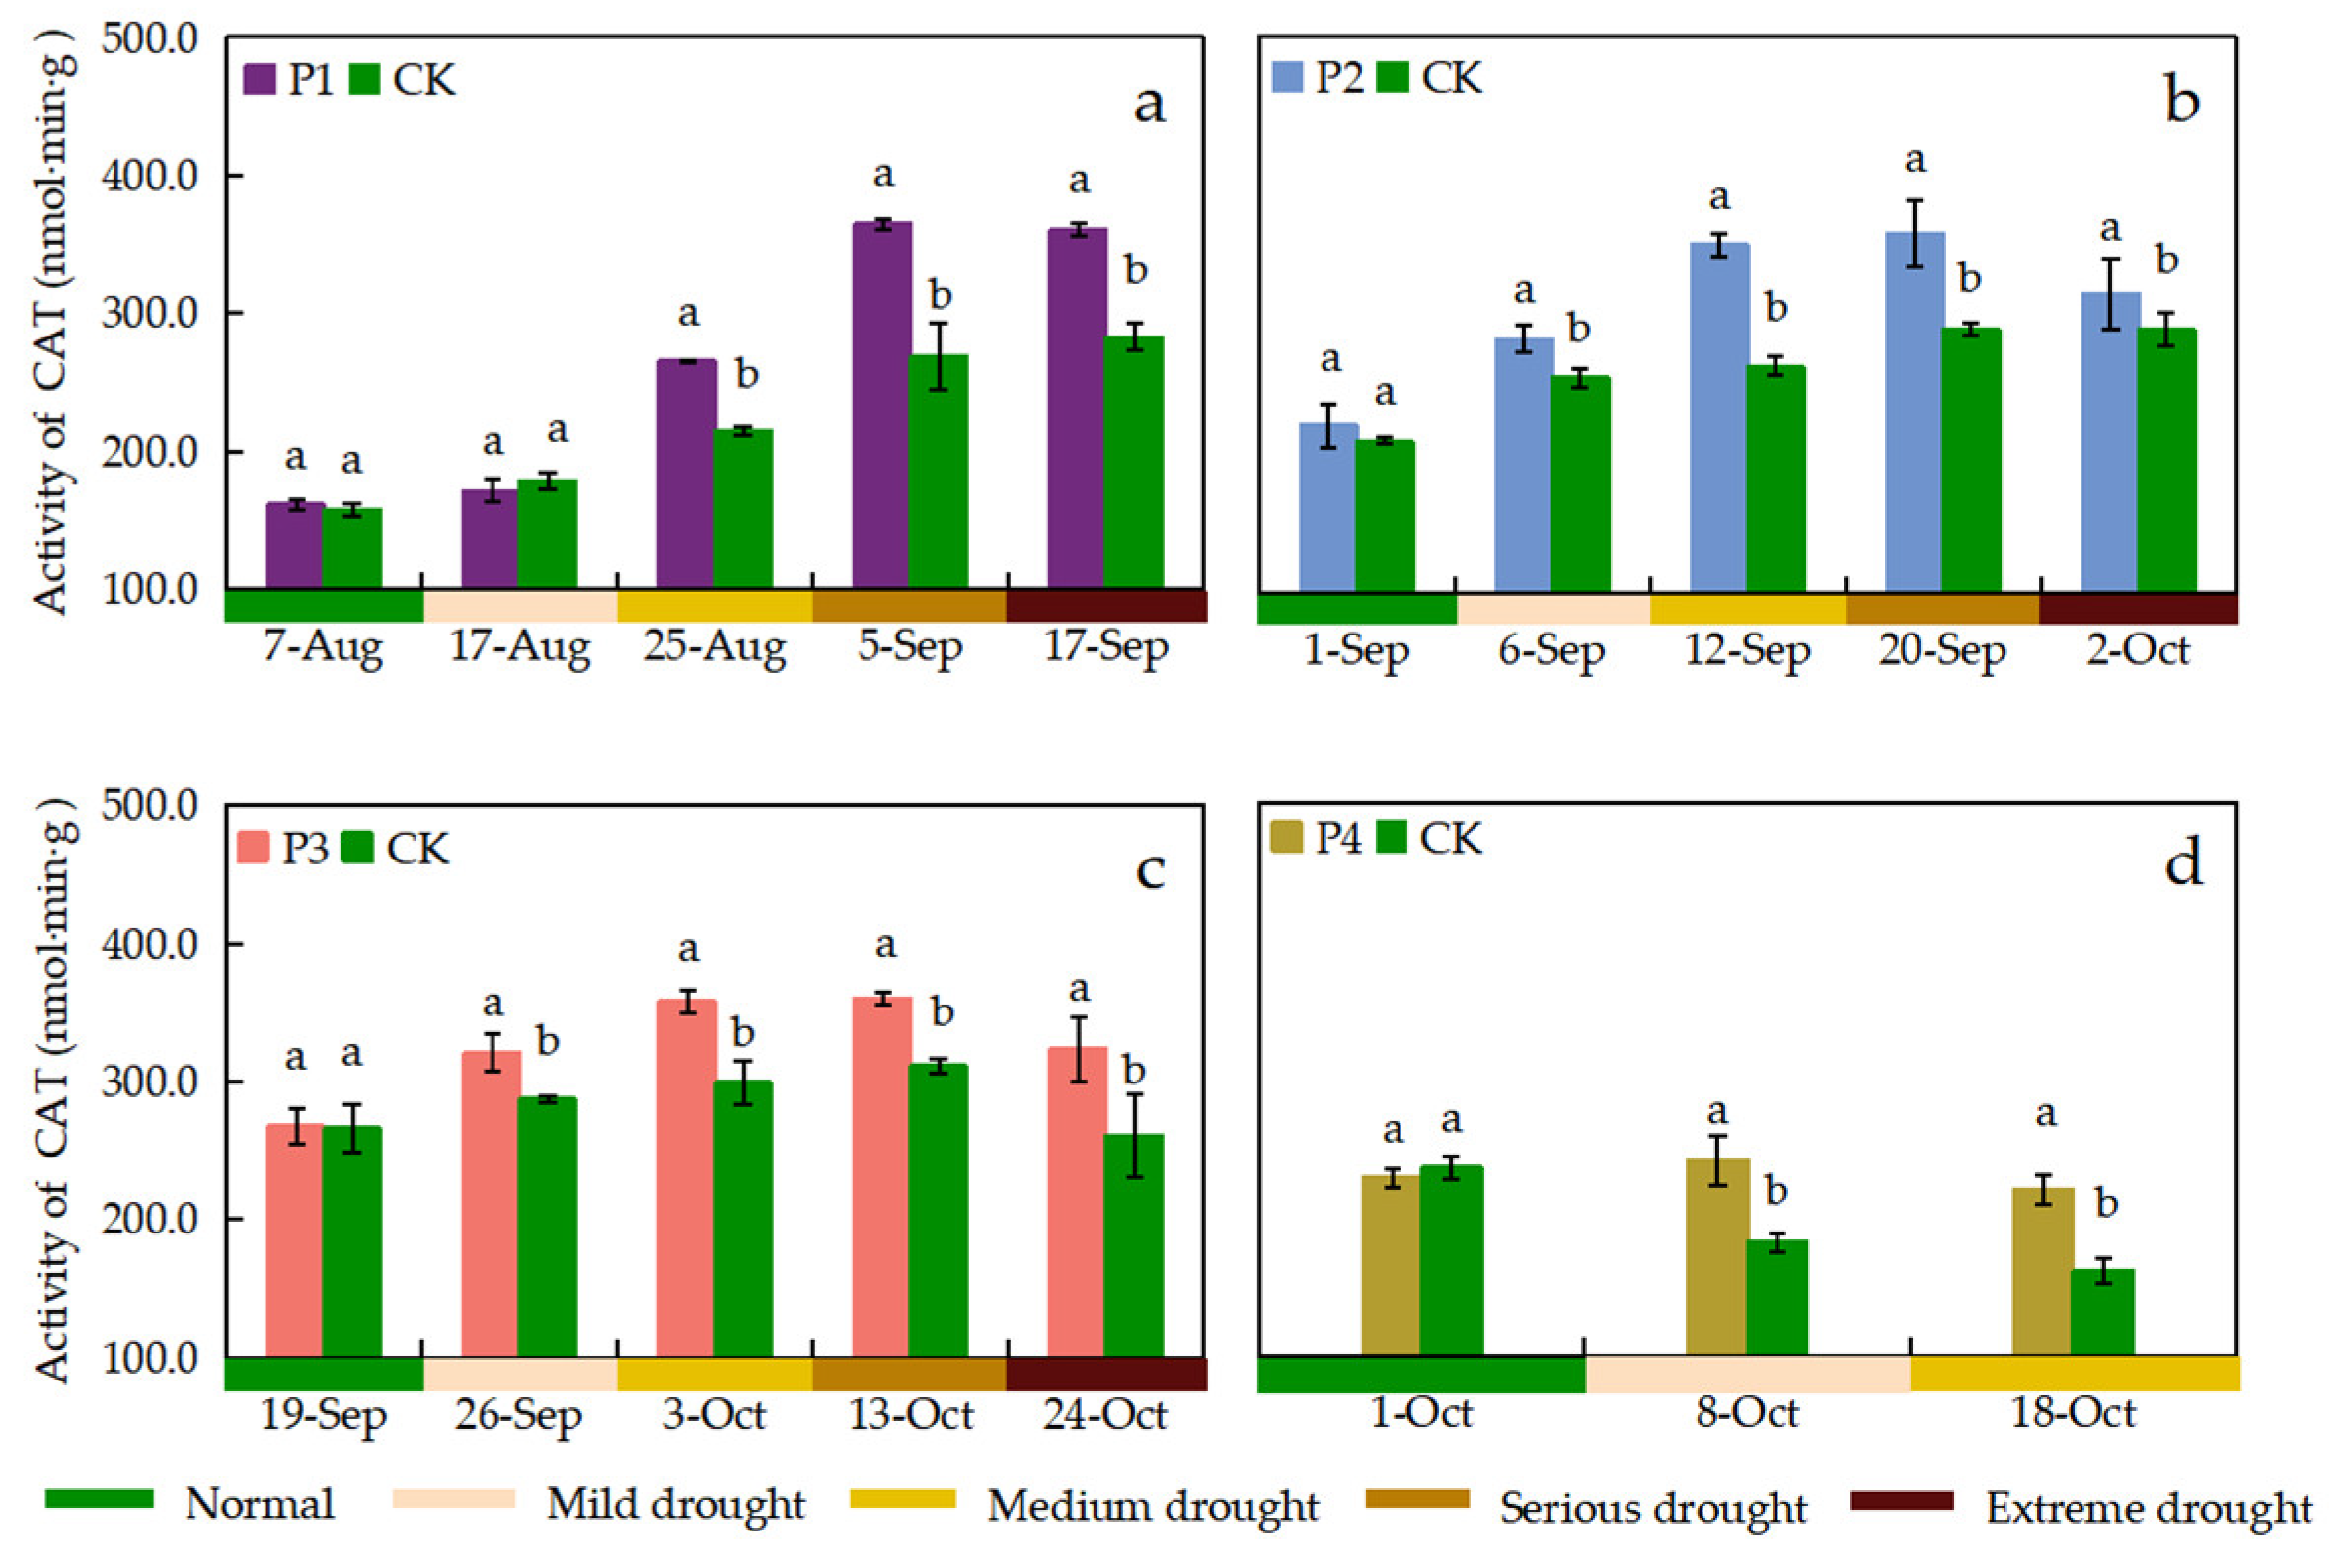
The activity of SOD, POD, and CAT was observed once before the start of drought stress and once during the period when different drought stress levels were reached for the P1, P2, and P3 treatments, respectively. The effects of continuous drought stress on leaf SOD, POD, and CAT activities were different at different growth stages. The SOD activity of leaves in each treatment showed a trend of increasing and then decreasing with the process of continuous drought stress (Figure 8). P1 and P2 treatments showed maximum leaf SOD activity when the drought stress level reached serious drought, which was 14.95% and 11.53% higher than that of the CK treatment, respectively. The SOD activity was maximized when the P3 treatment reached medium drought stress and the P4 treatment reached mild drought stress with 1401.78 U g–1 and 1289.16 U g–1, respectively. The leaf POD activity of P1 and P2 treatments showed an increasing trend with the drought stress process, and the POD activity was maximum when reaching extreme drought stress, which was higher than the CK treatment by 26.97% and 34.40%, respectively (Figure 9). The POD activity of P3 treatment showed an increasing and then decreasing trend with the drought stress process, whereas the POD activity of P4 treatment showed insignificant changes. The difference in CAT activity between the P1 treatment and the CK treatment was not significant when reaching mild drought stress. All other treatments had significantly higher CAT activity than the CK treatment when subjected to drought stress (Figure 10). The CAT activities of P1, P2, and P3 treatments reached its maximum when reaching serious drought stress, which were 36.01%, 23.71%, and 15.78% higher than those of the CK treatment, respectively. The P1 treatment showed the greatest increase in CAT activity (55.00%) during medium drought stress. The SOD activity tended to decrease when the drought stress level increased, but this trend was not significant for the POD and CAT activities.

3.4.4. MDA Content

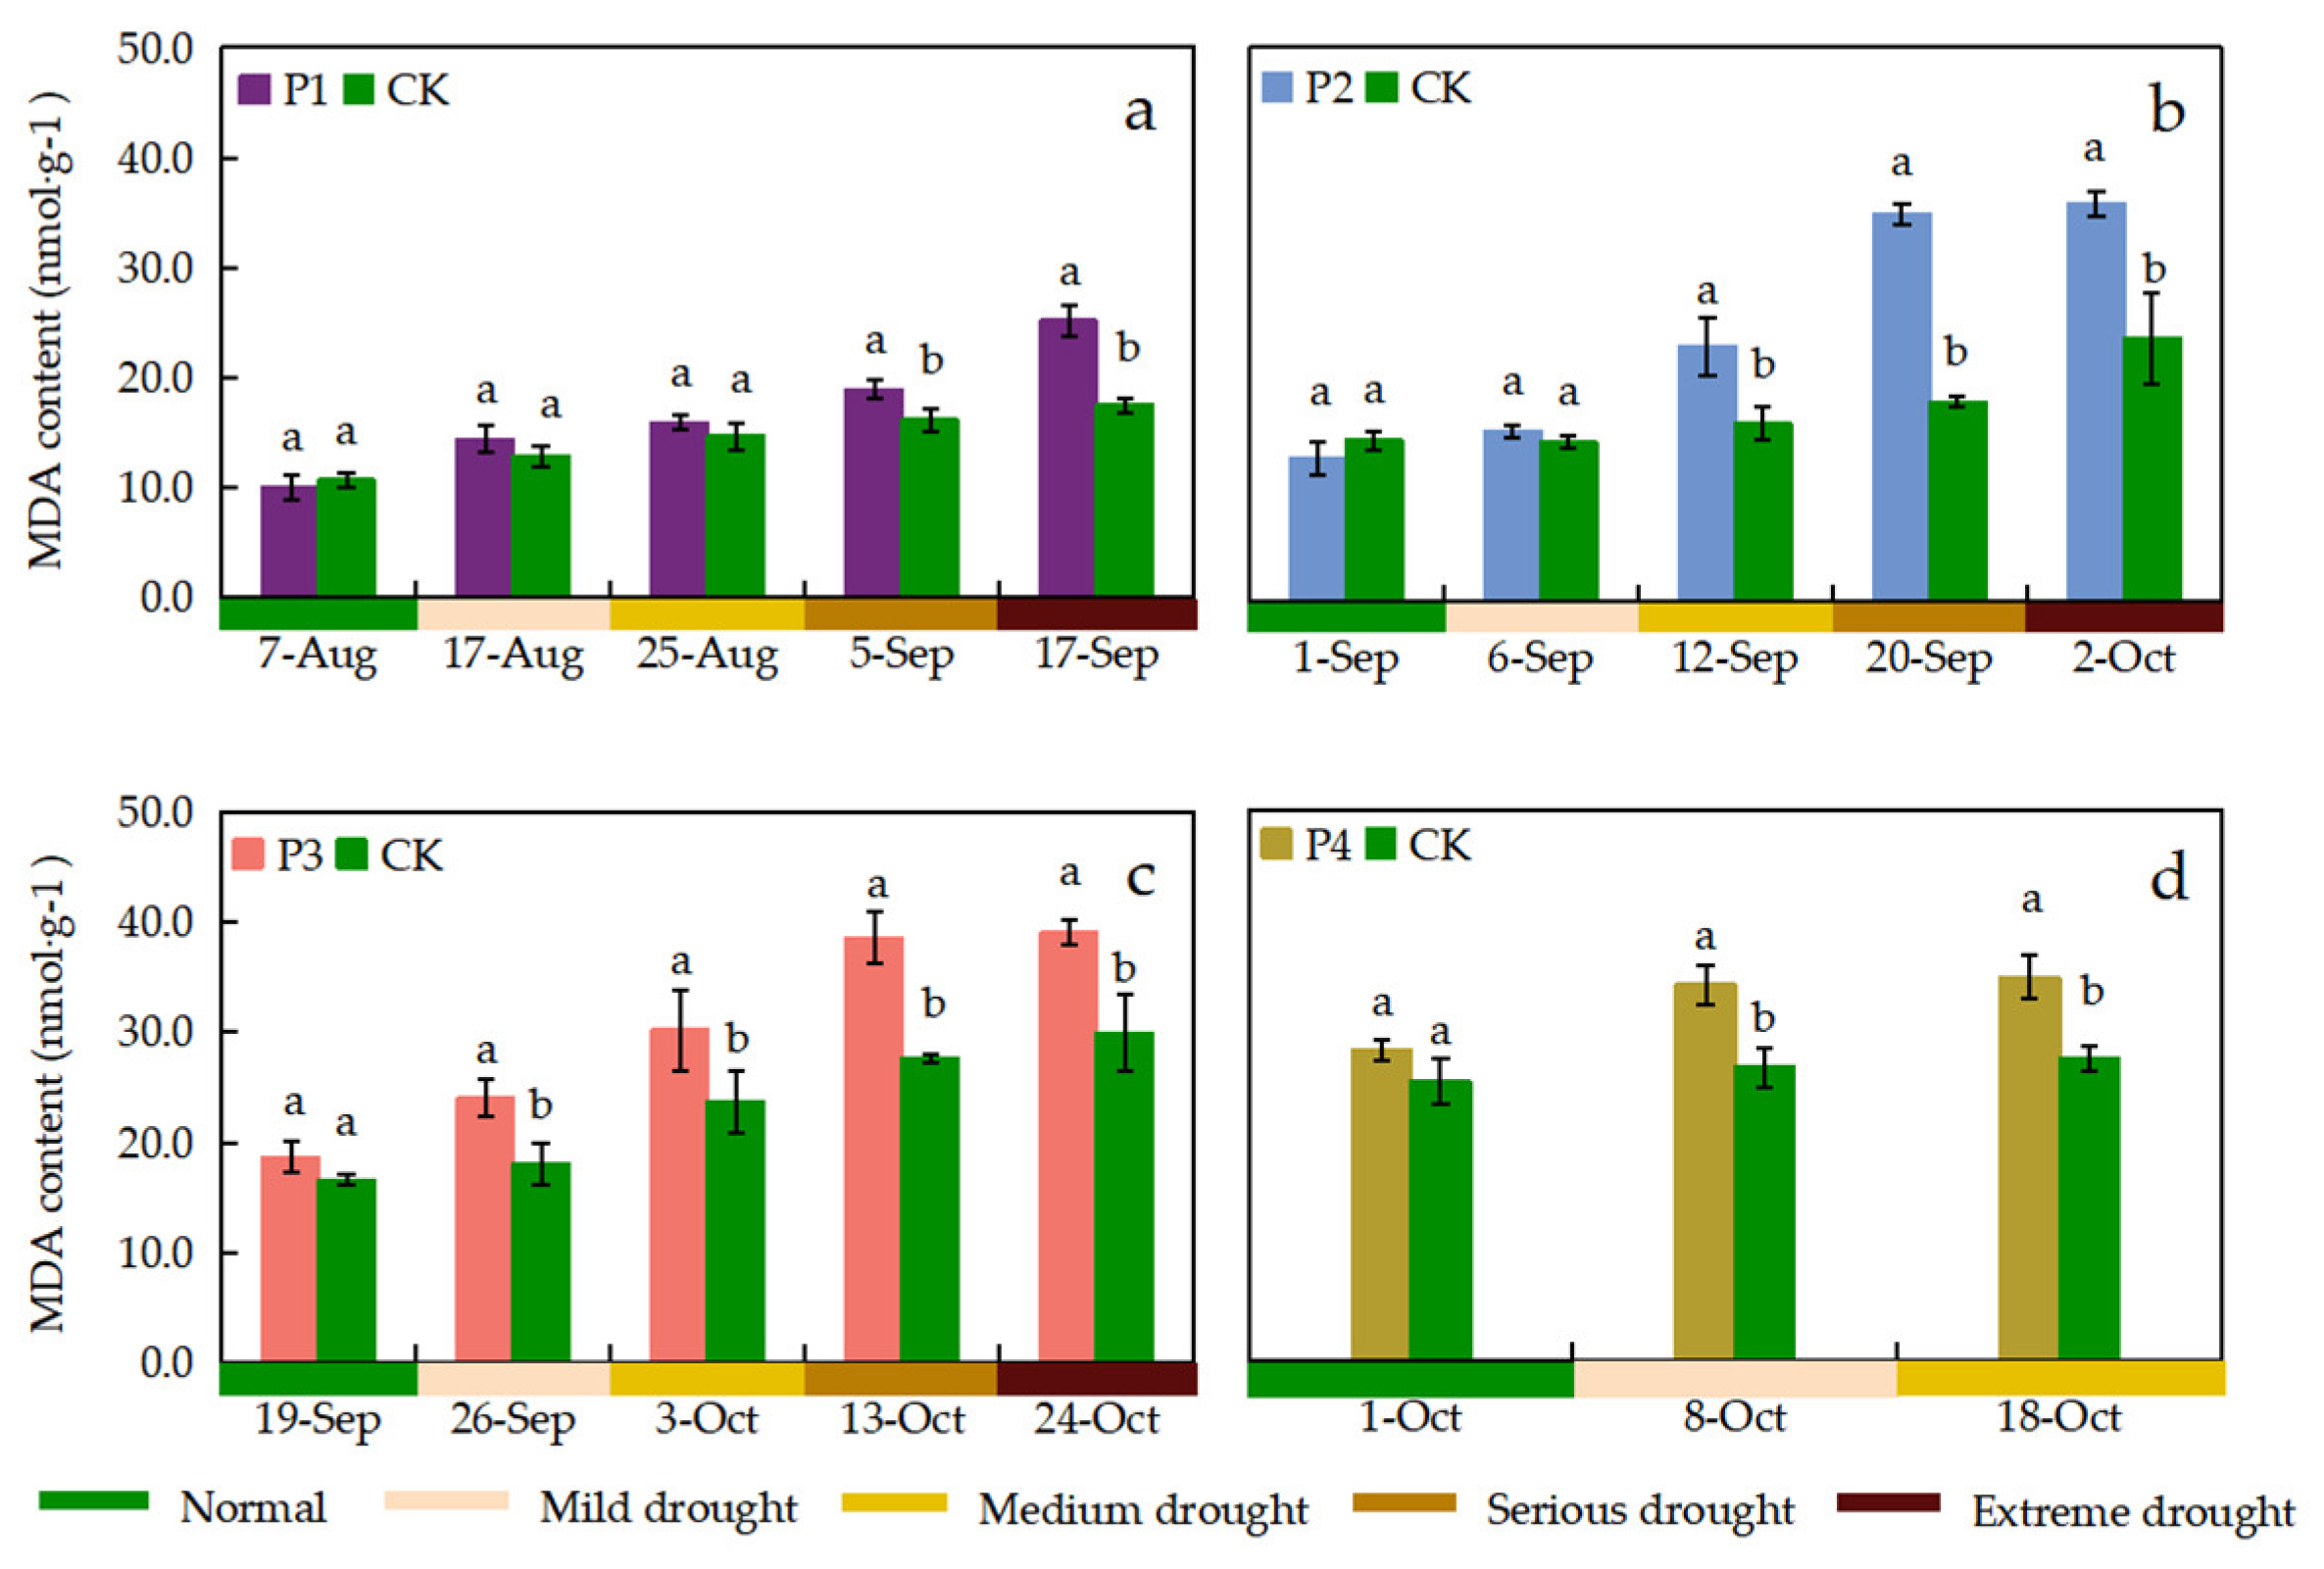
MDA is the final breakdown product of membrane lipid peroxidation in plant cells, indirectly reflecting the degree of damage to cells subjected to adversity. The MDA content of rice leaves in the CK treatment gradually increased during the growth period, and the P1, P2, P3 and P4 treatments showed different changes in MDA content after drought stress (Figure 11). The MDA content of rice leaves under all drought stress treatments increased with increasing drought stress levels. It reached its maximum value before the end of drought stress, which was 44.00%, 50.87%, 30.40%, and 27.09% higher than that of CK treatment, respectively. The P1 treatment was not significantly different from the CK treatment in reaching mild and medium drought stress, while it was significantly higher than the CK treatment in reaching serious and extreme drought stress. The P2 treatment showed the greatest increase in leaf MDA content when reaching serious drought stress, which was 1.94 times higher than that of the CK treatment. The MDA content of the P3 treatment reached its maximum among all treatments at 39.07 µmol g–1 when reaching extreme drought stress.

3.5. Effects of Four Levels of Continuous Drought Stress on Yield and Its Components

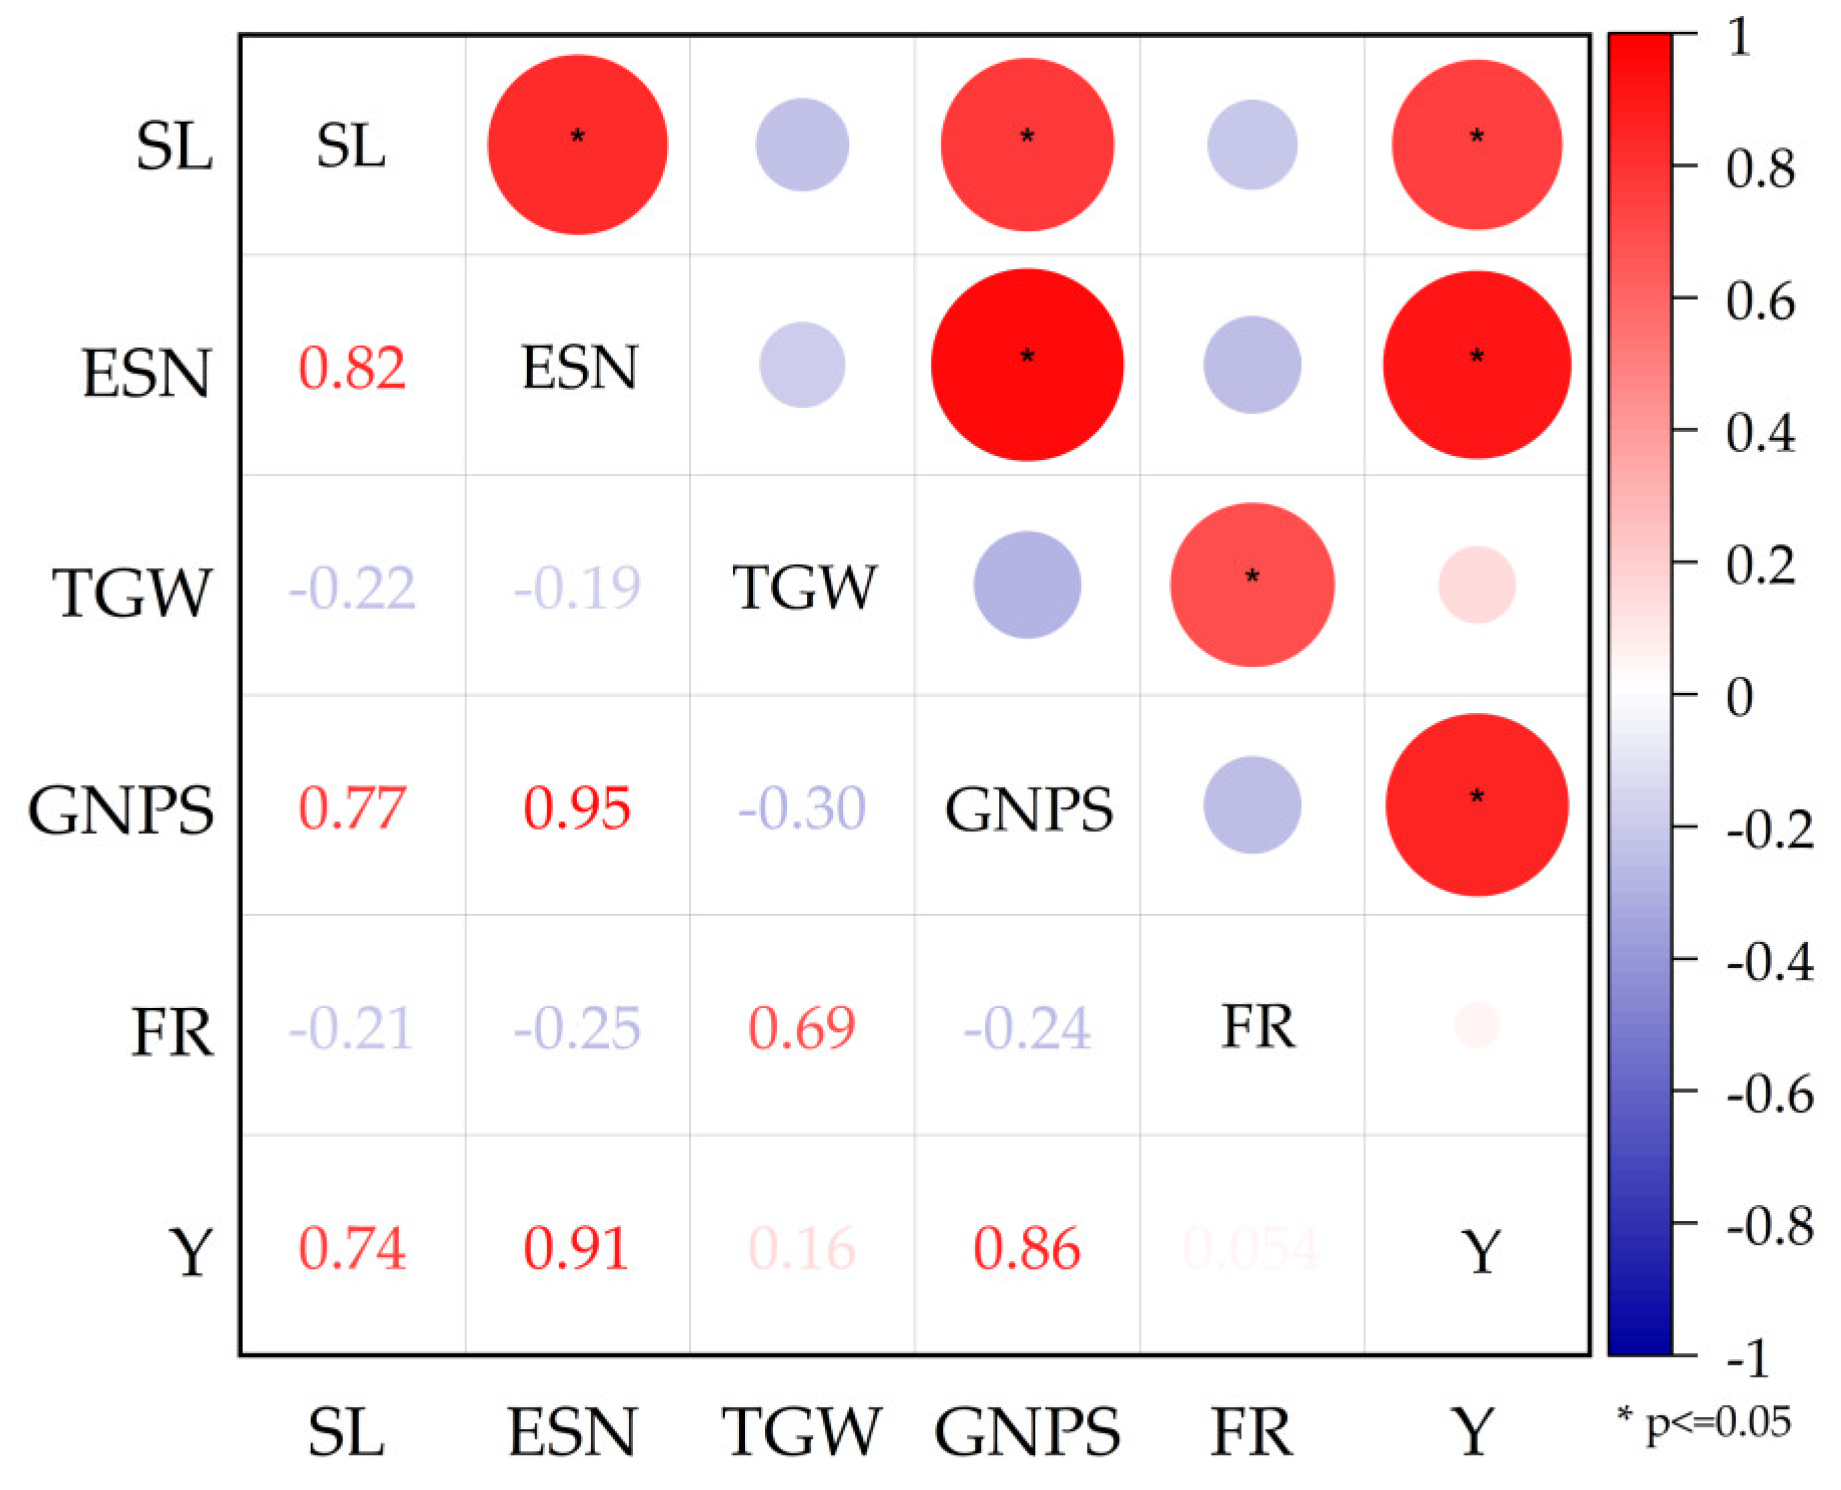
Continuous drought stress from the jointing-booting stage (P2 treatment) had the greatest negative effect on rice yield, with an average yield reduction of 33.74% (Table 3). Continuous drought stress from the grain filling stage (P4 treatment) had the least negative effect on rice yield, with an average yield reduction of 17.65% (Table 3). The effect of continuous drought stress on yield varied at different growth stages, and the yields of each treatment followed the order of CK > P4 > P3 > P1 > P2. For yield components, drought stress significantly (P < 0.05) reduced spike length, effective number of spikes, thousand grain weight, grain number per spike, and fruiting rate of rice compared to CK treatments during the growth period. The P1 treatment had the greatest negative effect on spike length, effective spike number and grain number per spike, which were significantly (P < 0.05) reduced by 1.42 cm, 29.24% and 18.27%, respectively, compared to the CK treatment. The spike length, effective spike number and grain number per spike of each treatment followed the order of CK > P4 > P3 > P2 > P1. The P3 treatment had the greatest negative effect on thousand grain weight, which was in the order of CK > P1 > P2 > P4 > P3 for each treatment. The P1, P2, P4 and P3 treatments reduced thousand grain weight by 0.15%, 1.75%, 5.54% and 7.05%, respectively, compared to the CK treatment, and the results of P1 and P2 treatments were not significant. The P3 treatment had the greatest negative effect on the fruiting rate, with the order of the treatments being P1 > CK > P4 > P2 > P3. Compared with the CK treatment, the P1 treatment significantly increased the fruiting rate by 3.48%, while the P2, P3 and P4 treatments reduced the seed setting rate by 3.41%, 4.61% and 2.51%, respectively. The sizes of correlation between each component and yield showed that effective spike number > spike grain number > spike length > thousand grain weight > fruiting rate (Figure 12). In this study, the correlation between rice yield and the effective number of spikes was most significant for the different treatments.
Table 4. Rice yield and its components under different treatments.
Treatment Spike length (cm) Effective spike number (104 hm−2) Thousand grain weight (g) Grain number per spike Fruiting rate (%) Yield (kg·hm-2) Yield reduction (%)
CK 23.86±0.22a 262.51±7.44a 21.98±0.05a 161.13±4.13a 87.55±0.50b 10778.36±363.24a ——
P1 22.44±0.67b 185.76±5.37b 21.95±0.24a 131.69±3.94c 90.6±0.30a 7154.97±155.93d 33.62
P2 22.85±0.34b 196.76±4.34c 21.56±0.60a 134.31±7.11c 84.56±0.77c 7141.46±107.05d 33.74
P3 23.09±0.51ab 225.97±12.37d 20.43±0.09b 149.62±0.77b 83.52±0.28d 7815.67±199.81c 27.49
P4 23.68±0.13a 243.30±4.11d 20.76±0.24b 154.43±6.15ab 85.35±0.90c 8875.99±63.06b 17.62
F 5.28* 83.71** 12.81** 23.69** 70.64** 174.64** ——
Different letters indicate significant differences between means at the p < 0.05 level. ** Significant at the 0.01 probability levels. Standard deviations were calculated with three independent experiments.

4. Discission

Among the drought stress treatments at four different growth stages, drought stress at the grain filling stage resulted in the lowest total water consumption but the highest yield. This was due to drought stress during the grain filling period, which limited rice grain filling and maturation, resulting in reduced yields and stunted grains. The tillering stage is one of the critical periods of rice growth, and plants require large amounts of water and nutrients to support tillering and stem growth[25]. Studies have shown that drought stress, in addition to directly enhancing soil evaporation and reducing soil moisture, will also affect soil microbial activity and change the structure of soil microbial communities[26]. These will directly or indirectly affect the root environment of the crop, which in turn affects the absorption and utilization of water and nutrients by the root system[14]. The results of this study showed that the effect of drought stress on plant height was significantly greater in rice at the tillering and jointing-booting stages than at the heading-flowering and grain filling stages. Severe drought stress leads to insufficient water in the soil, which affects root growth and water uptake of the plant, and also leads to massive water loss through the transpiration pathway, which increases the overall water consumption of the plant[27]. Thus, limiting the normal growth of tillers and stalks, results in reduced plant height and weak stalks, which in turn affect yield and quality[28,29]. It has also been shown that mild drought stress favors plant elongation but suppresses plant height as the drought stress level increases[30]. In the results of this study, the P1 treatment had higher plant height than the other treatments at the beginning of drought stress, but the results were not significant. Previous studies have concluded that the negative impacts of drought stress in the early growth stages were greater than those of drought stress during the filling stage, because the components of yield were mostly in place (except for the thousand grain weight) before grain filling begins[8,25,31].
Chlorophyll is a key pigment in photosynthesis, which directly affects the efficiency of light energy utilization and the growth of plants[32,33]. Rice, as one of the crops with high photosynthetic efficiency, has its growth and yield significantly affected by photosynthesis[34]. It has been reported that the duration and intensity of drought stress determine the changes in chlorophyll content when crops are subjected to drought stress[35]. In this study, we analyzed the chlorophyll content of rice leaves among different treatments by measuring the SPAD values of rice leaves. The results showed that rice SPAD values steadily dropped under mild drought stress, regardless of the growth stage at when the drought began. It is noteworthy that SPAD values were sensitive to drought stress, except for the P4 treatment, which showed a significant increase in SPAD values after rewatering. The same phenomenon was observed in other crops such as wheat, maize, cotton, and soybean[36,37,38,39]. It was found that rewatering after the short, periodic drought stress resulted in significant growth compensation in plant height and leaf area[39]. This is inconsistent with the results of our study because we conducted rewatering from mild drought stress that lasted until after extreme drought stress, at which stage the crop was already irreversibly damaged.
Ribulose diphosphate carboxylase (Rubisco) is often referred to as the rate-limiting enzyme of photosynthesis and plays a role in determining the rate of plant photosynthesis[40]. It has been shown that a decrease in Rubisco enzyme activity when plants are subjected to drought stress decreases the rate of photosynthesis, which reduces the synthesis of photosynthetically produced products and consequently causes yield loss in rice[41]. In this study, rice leaf Rubisco activity was significantly and positively correlated with SPAD values, decreasing with increasing levels of drought stress and increasing again after rewatering. The rate of Rubisco degradation was significantly accelerated when the leaves were senescent or when the plants were subjected to stress, and the Rubisco content and activity decreased under serious drought stress[40], which is consistent with the results of this study. In addition, the longer the duration of drought stress, i.e., from mild drought stress to extreme drought stress, the greater the differences in SPAD values and Rubisco activity between the treatments and the CK treatment.
Reactive oxygen species (ROS) are produced in rice plants under drought stress, which are highly responsive and can cause oxidative damage to cells[42]. SOD, POD, and CAT activities are important indicators to characterize the strength of plants’ ability to scavenge reactive oxygen species and to resist senescence, as well as to characterize the sensitivity of crop responses to adversity stress. That is, plants can avoid damage from reactive oxygen species by balancing the rate of ROS production and antioxidant enzyme activity to ensure normal cellular function[43]. Our results showed that when rice was under mild drought stress, the activities of POD and CAT did not differ significantly from those of CK treatment. Under drought stress, the production of H2O2 may increase and the activity of POD may increase accordingly to help scavenge the excess H2O2[44], which is consistent with the results of this study. It was concluded that too high or too low SOD, POD and CAT activities may lead to oxidative stress or other physiological abnormalities affecting normal growth and yield of rice[45]. The ROS react with unsaturated fatty acids in the cell membrane to form lipid peroxides, and these peroxides produce MDA during further decomposition[43]. In response to oxidative damage caused by drought stress, plants activate antioxidant defense systems to reduce MDA production[42]. Thus, an increase in MDA content may result under mild drought stress, but usually not to the level of severe damage[46]. Under severe drought stress, the MDA content usually increases significantly, reflecting the increased degree of lipid peroxidation and severe damage to the cell membrane structure[47]. This is consistent with the results of the present study, which found that leaf MDA content under drought stress increased with increasing drought stress levels.
Rice yields are susceptible to drought, and continuous drought stresses from various growth stages have resulted in yield declines, although the reasons may be different. According to literature, at the tillering, drought stress has the greatest effect on the number of tillers in rice[48]. The reduction in the number of tillers and the number of grains in the spike resulted in yield loss, which is consistent with the results of this study. Studies have reported that drought stress at the jointing-booting stage can lead to stagnant growth, limited photosynthesis, reduced accumulation of photosynthetically active products, and impeded nutrient translocation, thereby reducing rice yield and quality[8,49]. In this study, the P3 treatment had the lowest thousand grain weight and fruiting rate because continuous drought stress from the heading-flowering stage affects the development and functioning of the reproductive organs of rice[50]. It leads to the limitation of seed formation and filling, which will directly affect rice yield and seed quality[12]. In the present study, rice under continuous drought stress from the grain filling stage (P4 treatment) showed the least yield loss (17.62% reduction) and significantly higher water use efficiency (1.76 kg m–3) than the other treatments. When subjected to drought stress during the grain filling period, rice prioritizes water and nutrients for the maintenance of growth and survival and reduces the supply to the kernels[51]. This would result in uneven grain size and significantly reduced thousand grain weight, which is consistent with the results of this study. In addition, the P4 treatment drought stress in this experiment started late and reached only medium drought stress before rice harvest, which may have had some impact on the final yield results. In general, drought stress in rice during the pre-growth period (e.g., P1 and P2 treatments) significantly (P < 0.05) reduced the effective number of spikes and the grain number per spike, while drought stress during the late growth period (e.g., P3 and P4 treatments) significantly (P < 0.05) reduced the thousand grain weight and the fruiting rate. In this study, the correlation between yield size and the effective spike number and the grain number per spike were more significant, which also proved that drought stress caused greater yield loss in rice during the pre-growth period.

5. Conclusion

The response of rice to continuous drought stress varies from different fertility stages, but in general, drought stress causes significant adverse effects on growth, physiology and yield. Reductions in yield and its components were observed under different continuous drought stress treatments compared to CK treatment, where yield was reduced by 17 to 33%. Continuous drought stress from the tillering stage had the greatest effect on rice plant height and tiller number, which were reduced by 12.10% and 23.83%, respectively. Total water consumption was lowest in continuous drought stress from the grain filling stage, and yield and water use efficiency were also higher than those of other drought stress treatments. The SPAD values of rice were sensitive to drought stress, with a significant decrease in SPAD values after drought stress initiation and a significant increase in SPAD values after rewatering. Rice leaf Rubisco activity, decreased with increasing drought stress levels, and the longer the duration of drought stress, the greater the change in Rubisco activity. Antioxidant enzyme activity (SOD, POD and CAT) and MDA content increased significantly under continuous drought stress, reflecting the increased degree of oxidative stress and oxidative damage to cell membranes. Overall, continuous drought stress from the pre-reproductive stage of rice significantly reduces the number of effective spikes and the number of grains per spike, resulting in greater yield losses. Continuous drought stress at the grain filling stage had the least effect on yield and water use efficiency was significantly higher than other treatments. Although simulated drought stress can only simulate a part of the drought stress factors (soil moisture can be controlled, but not air temperature and humidity), it is still one of the important ways to understand the drought resistance mechanism of crops. Understanding rice growth and physiological changes is important for revealing the mechanisms of drought tolerance in rice, as well as for guiding rice variety improvement and agricultural production practices.

Author Contributions

Conceptualization, S.C. and Q.G.; methodology, W.Z. and H.S.; software, Y.D.; formal analysis, W.Z.; investigation, W.Z., S.W., H.W., and Y.Y.; data curation, W.Z.; writing—original draft preparation, W.Z.; writing—review and editing, S.C. and Y.D.; visualization, W.Z.; supervision, S.C.; funding acquisition, S.C. All authors have read and agreed to the published version of the manuscript.”

Funding

This research was funded by the projects of Water Science and Technology of Jiangxi Province (202325ZDKT01, 202425TGKT04, 202124ZDKT29).

Data Availability Statement

Data will be made available from the corresponding author upon request.

Conflicts of Interest

The authors declare no conflicts of interest.

References

  1. Li, J.; Zhang, M.; Yang, L.; Mao, X.; Li, J.; Li, L.; Wang, J.; Liu, H.; Zheng, H.; Li, Z.; et al. OsADR3 Increases Drought Stress Tolerance by Inducing Antioxidant Defense Mechanisms and Regulating OsGPX1 in Rice (Oryza Sativa L.). The Crop Journal 2021, 9, 1003–1017. [Google Scholar] [CrossRef]
  2. Rahman, K.U.; Hussain, A.; Ejaz, N.; Shang, S.; Balkhair, K.S.; Khan, K.U.J.; Khan, M.A.; Rehman, N.U. Analysis of Production and Economic Losses of Cash Crops under Variable Drought: A Case Study from Punjab Province of Pakistan. International Journal of Disaster Risk Reduction 2023, 85, 103507. [Google Scholar] [CrossRef]
  3. Dai, Y.; Liao, Z.; Lai, Z.; Bai, Z.; Zhang, F.; Li, Z.; Fan, J. Interactive Effects of Planting Pattern, Supplementary Irrigation and Planting Density on Grain Yield, Water-Nitrogen Use Efficiency and Economic Benefit of Winter Wheat in a Semi-Humid but Drought-Prone Region of Northwest China. Agricultural Water Management 2023, 287. [Google Scholar] [CrossRef]
  4. Yang, W.; Ren, S.; Zhang, X.; Gao, M.; Ye, S.; Qi, Y.; Zheng, Y.; Wang, J.; Zeng, L.; Li, Q.; et al. BENT UPPERMOST INTERNODE1 Encodes the Class II Formin FH5 Crucial for Actin Organization and Rice Development. The Plant Cell 2011, 23, 661–680. [Google Scholar] [CrossRef] [PubMed]
  5. Khan, M.I.R.; Palakolanu, S.R.; Chopra, P.; Rajurkar, A.B.; Gupta, R.; Iqbal, N.; Maheshwari, C. Improving Drought Tolerance in Rice: Ensuring Food Security through Multi-dimensional Approaches. Physiologia Plantarum 2021, 172, 645–668. [Google Scholar] [CrossRef] [PubMed]
  6. Rasheed, A.; Hassan, M.U.; Aamer, M.; Batool, M.; Sheng, F.; Ziming, W.; Huijie, L. A Critical Review on the Improvement of Drought Stress Tolerance in Rice (Oryza Sativa L.). Notulae Botanicae Horti Agrobotanici Cluj-Napoca 2020, 48, 1756–1788. [Google Scholar] [CrossRef]
  7. Hornai, E.M.L.; Aycan, M.; Mitsui, T. The Promising B− Type Response Regulator Hst1 Gene Provides Multiple High Temperature and Drought Stress Tolerance in Rice. International Journal of Molecular Sciences 2024, 25, 2385. [Google Scholar] [CrossRef] [PubMed]
  8. Cheng-ai, W.; Bo-lun, W.; Wen-xiang, Z.; Lei, Z.; Xiu-zhe, Z.; Lian-wen, G.; Wen-ping, H. Effects of Drought Stress at Different Growth Stages on Grain Yield and Milling Quality of Rice. Chinese Journal of Rice Science 2007, 21, 643. [Google Scholar]
  9. Farooq, M.; Kobayashi, N.; Ito, O.; Wahid, A.; Serraj, R. Broader Leaves Result in Better Performance of Indica Rice under Drought Stress. Journal of plant physiology 2010, 167, 1066–1075. [Google Scholar] [CrossRef]
  10. Qian, Y.; Guan, X.; Shao, C.; Qiu, C.; Chen, X.; Chen, J.; Xie, J.; Deng, G.; Peng, C. Effects of Drought Stress at Different Growth Stages on Yield and Water Use Efficiency of Double-Cropping Rice. Acta Agriculturae Jiangxi 2016, 28, 6–14. [Google Scholar]
  11. Nguyen, G.; Hailstones, D.; Wilkes, M.; Sutton, B. Drought-induced Oxidative Conditions in Rice Anthers Leading to a Programmed Cell Death and Pollen Abortion. Journal of Agronomy and Crop Science 2009, 195, 157–164. [Google Scholar] [CrossRef]
  12. Lawas, L.M.F.; Shi, W.; Yoshimoto, M.; Hasegawa, T.; Hincha, D.K.; Zuther, E.; Jagadish, S.K. Combined Drought and Heat Stress Impact during Flowering and Grain Filling in Contrasting Rice Cultivars Grown under Field Conditions. Field Crops Research 2018, 229, 66–77. [Google Scholar] [CrossRef]
  13. Wang, G.; Zhang, J. Carbohydrate, Hormone and Enzyme Regulations of Rice Grain Filling under Post-Anthesis Soil Drying. Environmental and experimental botany 2020, 178, 104165. [Google Scholar] [CrossRef]
  14. Rasheed, S.; Bashir, K.; Matsui, A.; Tanaka, M.; Seki, M. Transcriptomic Analysis of Soil-Grown Arabidopsis Thaliana Roots and Shoots in Response to a Drought Stress. Frontiers in plant science 2016, 7, 183475. [Google Scholar] [CrossRef] [PubMed]
  15. Zargar, S.M.; Gupta, N.; Nazir, M.; Mahajan, R.; Malik, F.A.; Sofi, N.R.; Shikari, A.B.; Salgotra, R. Impact of Drought on Photosynthesis: Molecular Perspective. Plant gene 2017, 11, 154–159. [Google Scholar] [CrossRef]
  16. Evaristo de Deus, K.; Lanna, A.C.; Abreu, F.R.M.; Dias Silveira, R.D.; Jacinto Pereira, W.; Brondani, C.; Pereira Vianello, R. Molecular and Biochemical Characterization of Superoxide Dismutase (SOD) in Upland Rice under Drought. Australian Journal of Crop Science 2015, 9. [Google Scholar]
  17. Gusain, Y.S.; Singh, U.; Sharma, A. Bacterial Mediated Amelioration of Drought Stress in Drought Tolerant and Susceptible Cultivars of Rice (Oryza Sativa L.). African Journal of Biotechnology 2015, 14, 764–773. [Google Scholar]
  18. Farooq, M.; Wahid, A.; Lee, D.; Cheema, S.; Aziz, T. Drought Stress: Comparative Time Course Action of the Foliar Applied Glycinebetaine, Salicylic Acid, Nitrous Oxide, Brassinosteroids and Spermine in Improving Drought Resistance of Rice. Journal of Agronomy and Crop Science 2010, 196, 336–345. [Google Scholar] [CrossRef]
  19. Ji, K.; Wang, Y.; Sun, W.; Lou, Q.; Mei, H.; Shen, S.; Chen, H. Drought-Responsive Mechanisms in Rice Genotypes with Contrasting Drought Tolerance during Reproductive Stage. Journal of plant physiology 2012, 169, 336–344. [Google Scholar] [CrossRef]
  20. Zhu, P.; Jia, X.; Zhao, C.; Shao, M. Long-Term Soil Moisture Evolution and Its Driving Factors across China’s Agroecosystems. Agricultural Water Management 2022, 269, 107735. [Google Scholar] [CrossRef]
  21. Liu, Y.; Zhang, Y.; Liu, Q.; Wang, Q.; Lin, A.; Luo, J.; Du, Y.; Lin, Y.-W.; Wei, H. In Vitro Measurement of Superoxide Dismutase-like Nanozyme Activity: A Comparative Study. Analyst 2021, 146, 1872–1879. [Google Scholar] [CrossRef] [PubMed]
  22. Senthilkumar, N.A.M.; Sankaranarayanan, A.; Senthilkumar, M. Plant-Microbe Interactions; Springer, 2021; ISBN 1-07-161079-1. [Google Scholar]
  23. Sinha, A.K. Colorimetric Assay of Catalase. Analytical biochemistry 1972, 47, 389–394. [Google Scholar] [CrossRef] [PubMed]
  24. Qu, Y.; Sakoda, K.; Fukayama, H.; Kondo, E.; Suzuki, Y.; Makino, A.; Terashima, I.; Yamori, W. Overexpression of Both Rubisco and Rubisco Activase Rescues Rice Photosynthesis and Biomass under Heat Stress. Plant, Cell & Environment 2021, 44, 2308–2320. [Google Scholar]
  25. Fageria, N. Yield Physiology of Rice. Journal of plant nutrition 2007, 30, 843–879. [Google Scholar] [CrossRef]
  26. Bogati, K.; Walczak, M. The Impact of Drought Stress on Soil Microbial Community, Enzyme Activities and Plants. Agronomy 2022, 12, 189. [Google Scholar] [CrossRef]
  27. Ahanger, M.A.; Morad-Talab, N.; Abd-Allah, E.F.; Ahmad, P.; Hajiboland, R. Plant Growth under Drought Stress: Significance of Mineral Nutrients. Water stress and crop plants: a sustainable approach 2016, 2, 649–668. [Google Scholar]
  28. Prasad, P.; Staggenborg, S.; Ristic, Z. Impacts of Drought and/or Heat Stress on Physiological, Developmental, Growth, and Yield Processes of Crop Plants. Response of crops to limited water: Understanding and modeling water stress effects on plant growth processes 2008, 1, 301–355. [Google Scholar]
  29. Cai, T.; Xu, H.; Peng, D.; Yin, Y.; Yang, W.; Ni, Y.; Chen, X.; Xu, C.; Yang, D.; Cui, Z.; et al. Exogenous Hormonal Application Improves Grain Yield of Wheat by Optimizing Tiller Productivity. Field Crops Research 2014, 155, 172–183. [Google Scholar] [CrossRef]
  30. Farooq, M.; Wahid, A.; Kobayashi, N.; Fujita, D.; Basra, S.M. Plant Drought Stress: Effects, Mechanisms and Management. Sustainable agriculture 2009, 153–188. [Google Scholar]
  31. Moonmoon, S.; Islam, M.T. Effect of Drought Stress at Different Growth Stages on Yield and Yield Components of Six Rice (Oryza Sativa L.) Genotypes. Fundamental and Applied Agriculture 2017, 2, 285–289. [Google Scholar] [CrossRef]
  32. Simkin, A.J.; Kapoor, L.; Doss, C.G.P.; Hofmann, T.A.; Lawson, T.; Ramamoorthy, S. The Role of Photosynthesis Related Pigments in Light Harvesting, Photoprotection and Enhancement of Photosynthetic Yield in Planta. Photosynthesis Research 2022, 152, 23–42. [Google Scholar] [CrossRef]
  33. Dai, Y.; Fan, J.; Liao, Z.; Zhang, C.; Yu, J.; Feng, H.; Zhang, F.; Li, Z. Supplemental Irrigation and Modified Plant Density Improved Photosynthesis, Grain Yield and Water Productivity of Winter Wheat under Ridge-Furrow Mulching. Agricultural Water Management 2022, 274, 107985. [Google Scholar] [CrossRef]
  34. Gu, J.; Zhou, Z.; Li, Z.; Chen, Y.; Wang, Z.; Zhang, H. Rice (Oryza Sativa L.) with Reduced Chlorophyll Content Exhibit Higher Photosynthetic Rate and Efficiency, Improved Canopy Light Distribution, and Greater Yields than Normally Pigmented Plants. Field Crops Research 2017, 200, 58–70. [Google Scholar] [CrossRef]
  35. Kyparissis, A.; Petropoulou, Y.; Manetas, Y. Summer Survival of Leaves in a Soft-Leaved Shrub (Phlomis Fruticosa L., Labiatae) under Mediterranean Field Conditions: Avoidance of Photoinhibitory Damage through Decreased Chlorophyll Contents. Journal of Experimental Botany 1995, 46, 1825–1831. [Google Scholar] [CrossRef]
  36. Izanloo, A.; Condon, A.G.; Langridge, P.; Tester, M.; Schnurbusch, T. Different Mechanisms of Adaptation to Cyclic Water Stress in Two South Australian Bread Wheat Cultivars. Journal of experimental botany 2008, 59, 3327–3346. [Google Scholar] [CrossRef] [PubMed]
  37. Li, Y.; Song, H.; Zhou, L.; Xu, Z.; Zhou, G. Tracking Chlorophyll Fluorescence as an Indicator of Drought and Rewatering across the Entire Leaf Lifespan in a Maize Field. Agricultural Water Management 2019, 211, 190–201. [Google Scholar] [CrossRef]
  38. Brito, G.G. de; Sofiatti, V.; Lima, M.M. de A.; Carvalho, L.P. de; Silva Filho, J.L. da Physiological Traits for Drought Phenotyping in Cotton. Acta Scientiarum. Agronomy 2011, 33, 117–125. [Google Scholar] [CrossRef]
  39. Dong, S.; Jiang, Y.; Dong, Y.; Wang, L.; Wang, W.; Ma, Z.; Yan, C.; Ma, C.; Liu, L. A Study on Soybean Responses to Drought Stress and Rehydration. Saudi Journal of Biological Sciences 2019, 26, 2006–2017. [Google Scholar] [CrossRef]
  40. Carmo-Silva, A.E.; Salvucci, M.E. The Regulatory Properties of Rubisco Activase Differ among Species and Affect Photosynthetic Induction during Light Transitions. Plant physiology 2013, 161, 1645–1655. [Google Scholar] [CrossRef]
  41. Carmo-Silva, A.E.; Gore, M.A.; Andrade-Sanchez, P.; French, A.N.; Hunsaker, D.J.; Salvucci, M.E. Decreased CO2 Availability and Inactivation of Rubisco Limit Photosynthesis in Cotton Plants under Heat and Drought Stress in the Field. Environmental and Experimental Botany 2012, 83, 1–11. [Google Scholar] [CrossRef]
  42. Anjum, S.A.; Xie, X.; Wang, L.; Saleem, M.F.; Man, C.; Lei, W. Morphological, Physiological and Biochemical Responses of Plants to Drought Stress. African journal of agricultural research 2011, 6, 2026–2032. [Google Scholar]
  43. Møller, I.M.; Jensen, P.E.; Hansson, A. Oxidative Modifications to Cellular Components in Plants. Annu. Rev. Plant Biol. 2007, 58, 459–481. [Google Scholar] [CrossRef] [PubMed]
  44. Shigeoka, S.; Ishikawa, T.; Tamoi, M.; Miyagawa, Y.; Takeda, T.; Yabuta, Y.; Yoshimura, K. Regulation and Function of Ascorbate Peroxidase Isoenzymes. Journal of experimental botany 2002, 53, 1305–1319. [Google Scholar] [CrossRef] [PubMed]
  45. Wu, P.; Liu, F.; Chen, G.; Wang, J.; Huang, F.; Cai, T.; Zhang, P.; Jia, Z. Can Deep Fertilizer Application Enhance Maize Productivity by Delaying Leaf Senescence and Decreasing Nitrate Residue Levels? Field Crops Research 2022, 277, 108417. [Google Scholar] [CrossRef]
  46. Zhang, J.; Kirkham, M. Drought-Stress-Induced Changes in Activities of Superoxide Dismutase, Catalase, and Peroxidase in Wheat Species. Plant and cell physiology 1994, 35, 785–791. [Google Scholar] [CrossRef]
  47. Türkan, I.; Bor, M.; Özdemir, F.; Koca, H. Differential Responses of Lipid Peroxidation and Antioxidants in the Leaves of Drought-Tolerant P. Acutifolius Gray and Drought-Sensitive P. Vulgaris L. Subjected to Polyethylene Glycol Mediated Water Stress. Plant science 2005, 168, 223–231. [Google Scholar] [CrossRef]
  48. Okami, M.; Kato, Y.; Kobayashi, N.; Yamagishi, J. Morphological Traits Associated with Vegetative Growth of Rice (Oryza Sativa L.) during the Recovery Phase after Early-Season Drought. European Journal of Agronomy 2015, 64, 58–66. [Google Scholar] [CrossRef]
  49. Wang, X.; Fu, J.; Min, Z.; Zou, D.; Liu, H.; Wang, J.; Zheng, H.; Jia, Y.; Yang, L.; Xin, W. Response of Rice with Overlapping Growth Stages to Water Stress by Assimilates Accumulation and Transport and Starch Synthesis of Superior and Inferior Grains. International Journal of Molecular Sciences 2022, 23, 11157. [Google Scholar] [CrossRef] [PubMed]
  50. Zhao, W.; Liu, L.; Shen, Q.; Yang, J.; Han, X.; Tian, F.; Wu, J. Effects of Water Stress on Photosynthesis, Yield, and Water Use Efficiency in Winter Wheat. Water 2020, 12, 2127. [Google Scholar] [CrossRef]
  51. Venuprasad, R.; Lafitte, H.R.; Atlin, G.N. Response to Direct Selection for Grain Yield under Drought Stress in Rice. Crop Science 2007, 47, 285–293. [Google Scholar] [CrossRef]
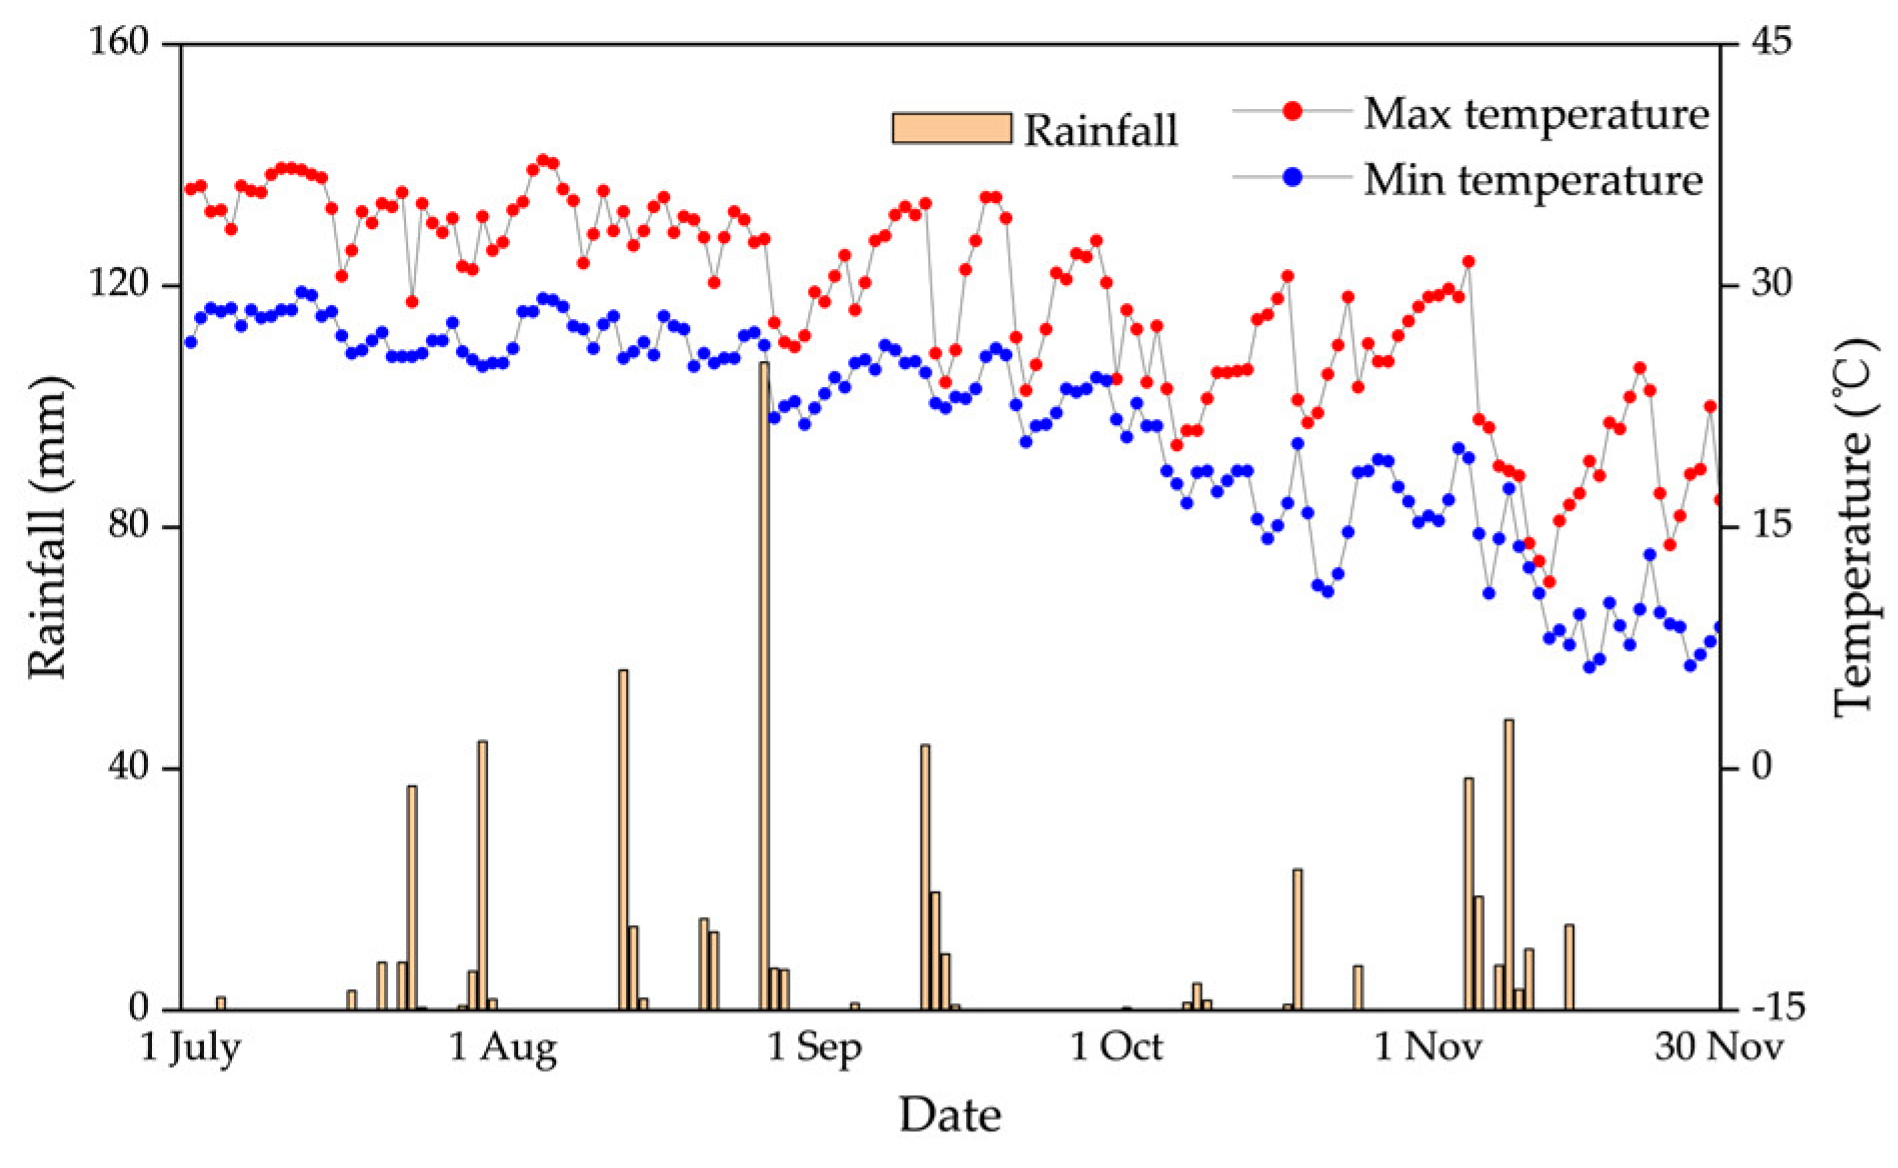
Figure 1. Daily maximum and minimum temperatures, and rainfall for July-November 2023.
Preprints 110073 g001
Figure 2. Process of continuous drought stress under different treatments. RS: regreening stage; TS: tillering stage; JBS: jointing-booting stage; HFS: heading-flowering stage; GFS: grain filling stage; MS: maturity stage.
Preprints 110073 g002
Figure 3. Changes in soil water content of different treatments during continuous drought stress.
Preprints 110073 g003
Figure 4. Plant height dynamics under different treatments. Data show the means ± standard deviation of ten independent samples.
Preprints 110073 g004
Figure 5. Dynamics of tiller number under different treatments. Data show the means ± standard deviation of ten independent samples.
Preprints 110073 g005
Figure 6. Relative chlorophyll content (SPAD value) under different treatments. Data show the means ± standard deviation of three independent samples. Different letters above vertical bars indicate significant differences between means at a p < 0.05 level.
Preprints 110073 g006
Figure 7. Leaf Rubisco activity under different treatments. Data show the means ± standard deviation of three independent samples. Different letters above vertical bars indicate significant differences between means at a p < 0.05 level.
Preprints 110073 g007
Figure 8. Leaf SOD activity under different treatments. Data show the means ± standard deviation of three independent samples. Different letters above vertical bars indicate significant differences between means at a p < 0.05 level.
Preprints 110073 g008
Figure 9. Leaf POD activity under different treatments. Data show the means ± standard deviation of three independent samples. Different letters above vertical bars indicate significant differences between means at a p < 0.05 level.
Preprints 110073 g009
Figure 10. Leaf CAT activity under different treatments. Data show the means ± standard deviation of three independent samples. Different letters above vertical bars indicate significant differences between means at a p < 0.05 level.
Preprints 110073 g010
Figure 11. Leaf MDA content under different treatments. Data show the means ± standard deviation of three independent samples. Different letters above vertical bars indicate significant differences between means at a p < 0.05 level.
Preprints 110073 g011
Figure 12. Correlation analysis of rice yield and component factors. SL: spike length; ESN: effective spike number; TGW: thousand grain weight; GNPS: grain number per spike; FR: fruiting rate; Y: yield.
Preprints 110073 g012
Table 1. Continuous drought stress periods and rewatering schedules for different treatments.
Treatments Drought stress at different growth stages
TS JBS HFS GFS MS
CK Normal Normal Normal Normal Normal
P1 Drought stress Rewatering after extreme drought stress
P2 Normal Drought stress Rewatering after extreme drought stress
P3 Normal Normal Drought stress Rewatering after extreme drought stress
P4 Normal Normal Normal Drought stress Persistent to extreme drought
TS: tillering stage; JBS: jointing-booting stage; HFS: heading-flowering stage; GFS: grain filling stage; MS: maturity stage.
Table 2. Water layer control standards of rice in different growth stages.
Growth stage RS ETS LTS JBS HFS GFS MS
Water layer control standards 0-20-40 0-20-50
Drying for 3 days
0-20-50 0-20-50
Drying for 3 days
0-20-50
Drying for 3 days
0-20-50
Drying for 3 days
0-20-30
Late paddy sunning Late drying
RS: regreening stage; ETS: early tillering stage; LTS: late tillering stage; JBS: jointing-booting stage; HFS: heading-flowering stage; GFS: grain filling stage; MS: maturity stage.
Table 3. Water consumption and water use efficiency under different treatments.
Treatment Water consumption (W, mm) Water use efficiency (WUE, kg m–3)
CK 643.91±7.70a 1.673±0.042b
P1 499.83±9.97c 1.430±0.053c
P2 552.30±2.15b 1.293±0.021d
P3 548.32±5.34b 1.427±0.025c
P4 504.24±4.29c 1.760±0.010a
Disclaimer/Publisher’s Note: The statements, opinions and data contained in all publications are solely those of the individual author(s) and contributor(s) and not of MDPI and/or the editor(s). MDPI and/or the editor(s) disclaim responsibility for any injury to people or property resulting from any ideas, methods, instructions or products referred to in the content.
Copyright: This open access article is published under a Creative Commons CC BY 4.0 license, which permit the free download, distribution, and reuse, provided that the author and preprint are cited in any reuse.
Prerpints.org logo

Preprints.org is a free preprint server supported by MDPI in Basel, Switzerland.

Subscribe

© 2024 MDPI (Basel, Switzerland) unless otherwise stated