Preprint
Article

Central Composite Design for Formulation and Optimization of Rifampicin Loaded Polylactide-Co-Glycolide Nanoparticles

Altmetrics

Downloads

92

Views

38

Comments

0

A peer-reviewed article of this preprint also exists.

Submitted:

21 June 2024

Posted:

24 June 2024

You are already at the latest version

Alerts
Abstract
The aim of this study was to synthesize and optimize polylactide-co-glycolide (PLGA) nanoparticles loaded with rifampicin (RIF), with a given size and high loading rate, using the central composite design (CCD) method. CCD was used to investigate the influence of independent factors such as PLGA:RIF ratio, type of PLGA, type and concentration of surfactants, power and duration of homogenization, and type of organic solvent and its ratio to the aqueous phase on the dependent physicochemical characteristics of the nanoparticles. The optimized nanoparticles were investigated using scanning electron microscope (SEM), Fourier transform infrared spectroscopy (FTIR), thermogravimetric analysis (TGA) and differential scanning calorimetry (DSC). Comparative evaluation of the drug release kinetics was carried out using different pH and different setups: flow cuvette (USP 4 apparatus) and Franz diffusion cuvette. In addition, the mucoadhesive properties and mycobacterial activity of PLGA-RIF NPs were studied.
Keywords: 
Subject: Chemistry and Materials Science  -   Polymers and Plastics

1. Introduction

Tuberculosis (TB) is an infectious disease caused by the bacillus Mycobacterium tuberculosis, which is spread by the release of these bacteria into the air by patients [1,2]. Prior to the COVID-19 pandemic, tuberculosis (TB) remained the leading cause of death from infectious diseases, surpassing even HIV/AIDS [3]. It is estimated that in 2022, the number of new TB cases will reach a record high of 7.5 million, the highest number since WHO global monitoring began in 1995. This figure surpassed the previous historical peak of 7.1 million recorded in 2019 during the COVID-19 pandemic [4].
Drugs such as rifampicin and isoniazid are key in the treatment of tuberculosis, but the use of these drugs is limited due to side effects. These include poor solubility and low bioavailability [5,6], alteration of the skin microbiome and hepatotoxicity [6,7]. Moreover, as the drugs are used for prolonged periods of time, there is a threat of drug resistance developing in the causative agent of tuberculosis, making treatment even more challenging [2,6,7]. Between 2020 and 2021 there has been an increase in the number of drug resistant TB cases, for example 2021 saw 450,000 new cases of rifampicin resistant TB [4]. Therefore, the development of new dosage forms for TB therapy becomes the most important area of modern medical science.
The use of nanoparticles to delivery anti-TB drugs, particularly rifampicin, is a promising approach to treating drug-resistant TB. By immobilizing the drug in nanoparticles, the efficacy of the drug can be improved and the drug can be delivered directly to the site of infection. In addition, this method allows controlled drug release, ensuring a more stable concentration of the drug in the body and minimizing its side effects [2,8].
One of the polymers used in this application is polylactide-co-glycolide (PLGA). PLGA is a copolymer of lactic acid and glycolic acid, it is well tolerated and harmless to human health and has been approved by the Food and Drug Administration (FDA) for medical use [9]. Its use for the transport of anti-TB drugs is particularly important. PLGA has unique properties such as biocompatibility, biodegradability and the ability to control the rate of drug release [9,10,11]. These characteristics make it an ideal material for the development of drug carriers capable of providing stable and controlled delivery of rifampicin into the body, which is critical for effective treatment of tuberculosis.
The average size of PLGA nanoparticles plays a key role in successful drug delivery, especially in the development of delivery systems for inhalation applications [12,13]. For example, for effective drug delivery to alveolar macrophages, a particle size of about 200 nm is considered optimal, which significantly affects their absorption capacity [13,14].
Various factors can affect the average size of PLGA nanoparticles: type of PLGA, polymer to drug ratio, type and concentration of surfactants, type of organic solvent, its ratio to the aqueous phase, as well as the power and duration of the homogenization process [9,10,11]. Determining the optimum conditions for the synthesis of these nanoparticles requires careful investigation and selection of the desired parameters, subsequently studying all the above process parameters. In this context, the central composite design (CCD) method is an effective tool for optimization and improvement of the nanoparticle production process, allowing to consider the influence of more factors with fewer tests [15].
In this study, for the first time, the central composite design (CCD) method was used to optimize the synthesis of PLGA nanoparticles immobilized with rifampicin and an ultrasonic homogenizer was used for the synthesis to produce smaller size nanoparticles. Thus, the main objective of this study is to optimize the parameters for the preparation of PLGA nanoparticles with rifampicin to ensure stable drug delivery and minimize its side effects. The study aims to obtain nanoparticles with the smallest size and maximum drug loading to improve the efficacy of tuberculosis treatment.

2. Materials and Methods

2.1. Materials

Poly (D,L-lactide-co-glycolide) (50:50), ester terminated MW 30 000-60 000, 24 000-38 000, 7 000-17 000, Pluronic F-127 powder, Poly (vinyl alcohol) (MW 9 000-10 000, 80% hydrolyzed), Rifampicin with indicated purity over 99%, Twin 80, Dimethyl sulfoxide, Ethyl acetate (≥99.5), Dichloromethane (≥99.5) were purchased from Sigma Aldrich.

2.2. Preparation of Rifampicin Loaded PLGA Nanoparticles

PLGA nanoparticles containing rifampicin were prepared by simple emulsion and solvent evaporation method [8,9]. The procedure can be described as follows: a given amount of rifampicin and PLGA was dissolved in an organic solvent (DMSO, DCM, EA), then this solution was emulsified for 1 minute on an ultrasonic homogeniser (Bandelin Sonopuls HD 2070, Bandelin Elec., Germany). Then different concentrations of surfactants (PVA, Tween80 or Pluronic F127) were added to the produced solution and homogenised on an ultrasonic homogeniser at a given power (15-70W). Finally, the prepared dispersion was subjected to magnetic stirring (400 rpm) to evaporate the organic solvent at room temperature. After evaporation of the solvent, the nanosuspension was centrifuged (Centrifuge 5420, Eppendorf, Hamburg, Germany) at 15,000 rpm for 20 minutes, then the produced nanoparticles were washed with distilled water to remove surfactant residues and dried at room temperature.

2.3. Experimental Design of Central Composite Design

Optimization of RIF-loaded PLGA NPs synthesis was performed using central composite design (CCD) to investigate how various key parameters - PLGA type, PLGA:RIF ratio, surfactant type, surfactant concentration, organic solvent type, organic to aqueous phase ratio, duration and power of homogenization - affect both particle size and degree of rifampicin loading. Design Expert® software (version 13, Stat-Ease, Minneapolis, MN, USA) was used to create a CCD array of eight factors at three levels each (Table 1).

2.4. Measurement of Particle Size, Polydispersity and ζ Potential

Nanoparticle diameter and polydispersity index were measured by Dynamic Light Scattering by Zetasizer Nano S90 device manufactured by Malvern Instruments Ltd. For this purpose, 5-8 drops of nanoparticle suspension were dissolved in 1.5-2 mL of distilled water. Analyses were carried out at 25°C with 90° angle determination. The ζ-potential was determined with a ζ-potential analyzer (NanoBrook ZetaPALS, USA) using electrophoretic laser Doppler anemometry. In addition, scanning electron microscopy (MIRA 3LMTESCAN, Brno, Czech Republic, EU) was used to investigate the size, shape and surface morphology of the nanoparticles.

2.5. Determination of Drug Loading and Nanoparticle Yield

To determine the amount of drug encapsulated in the polymer matrix, the mass of unencapsulated drug in the supernatant was calculated. For this purpose, high performance liquid chromatography (HPLC) using Shimadzu LC-20 Prominence equipment at 475 nm wavelength was used. Acetonitrile-water eluent (60-40) at a flow rate of 0.8 mL/min through a Promosil C18 column (Agela Technologies) (sorbent grain size 5 μm, 100 Å, 4.6×150 mm) was used for separation of the components. The column temperature was maintained at 40 °C. Quantification was performed by normalization by internal area. The injection volume was 10 μL (loop injection). The loading rate was calculated according to the formula below:
D r u g   l o a d i n g   % = T o t a l   m a s s   o f   R I F m a s s   o f   f r e e R I F M a s s   o f   N P s × 100 %
N a n o p a r t i c l e s   y i e l d   % = M a s s   o f   N P s T o t a l   m a s s   o f   R I F + m a s s   o f   P L G A × 100 %

2.6. In Vitro Release of Drug from Polymer Nanoparticles

Two methods were used to evaluate drug release in vitro: the flow cell method on a CE 7Smart (Sotax, Aesch, Switzerland) and the vertical diffusion method on a Franz PHOENIX™ DB-6 cell (Telodyne Hanson Research, Chatsworth, Georgia, USA) [16,17]. Experiments were performed at 37 ± 0.5 °C, using buffer solutions of three selected pH values to mimic human body conditions: pH 1.2 to mimic the gastric environment; pH 6.8 to mimic the intestinal environment; and pH 7.4 to mimic blood plasma pH.
In the process of flow cell method on a CE 7Smart instrument, the flow rate of the solution was maintained at 2 mL/min in a closed-loop configuration, utilizing a dialysis membrane featuring pores with a diameter ranging from 8000 to 10,000 kDa in the form of Float-A-Lyzer® G2 nanoadapters (MerckKGaA, Germany). The duration of the experiment spanned 48 hours.
Utilizing the vertical diffusion approach within a Franz cell setup, polymeric nanoparticles containing an anti-tuberculosis agent were positioned on the surface of a dialysis membrane (MWCO = 8000 kDa, Medicell International Ltd., London, UK) while maintaining a mixer speed of 200 rpm. The experiment sustained for a period of 48 hours.
Every 0.5;1;2;4;8;24;48 h, portions of the medium were extracted and analyzed using a UV/Vis spectrophotometer Lambda 25 (PerkinElmer, USA) at 475nm. Subsequently, the extracted portions were reintroduced. The findings were then systematically juxtaposed with the calibration graph derived from various concentration standard solutions. The rate of drug release was determined utilizing the subsequent equation.
The amount of released drug was calculated using the formula below:
D r u g   r e l e a s e % = M a s s   o f   r e l e a s e d   R I F M a s s   o f   t o t a l   R I F   i n   n a n o p a r t i c l e s × 100 %

2.7. Thermogravimetric Analysis and Differential Scanning Calorimetry

Thermogravimetric and differential scanning calorimetry analyses were performed on a LabSYS evo TGA/DTA/DSC analyzer from Setaram (France). The temperature spectrum was varied from 30 to 550°C, employing an aluminum oxide crucible. The sample was heated at 10°C/min in a nitrogen atmosphere at a flow rate of 30.

2.8. Study of Prepared Nanoparticles by Infrared Spectroscopy

The samples were analyzed using infrared spectroscopy with the FSM 1202 spectrometer from Infraspek Ltd. (Saint Petersburg, Russia). Fourier-transform infrared (FTIR) spectra were obtained using the KBr method. A pellet was prepared by blending around 3 mg of the sample with 100 mg of KBr. The scanning range was set from 4000 to 400 cm−1, with a resolution of 8 cm−1.

2.9. In Vitro Study of Nanoparticle Mucoadhesion

To evaluate the mucoadhesive properties of nanoparticles in-vitro, a turbidimetric method was used. For this purpose, the absorbance of PLGA-RIF NPs with mucin dispersion was measured at 258nm on a UV-visible spectrophotometer. Mucin in PBS 6.4 (with a concentration of 0.125 mg/mL) and nanoparticles were mixed and incubated at 37°C with constant stirring for 1, 2, 3, and 4 hours [18]. Before starting each experiment, the turbidity of the NPs was determined as a baseline.

2.10. Statistical Processing of the Produced Data

All studies were carried out at least three times. The results are presented as mean value with standard deviation. In order to compare the independent groups, one-way ANOVA was performed using Minitab19 software.

3. Results and Discussion

3.1. Optimization of the PLGA-RIF NPs by the CCD Method

The effect of various factors (type of PLGA, PLGA:RIF ratio, type of surfactant, surfactant concentration, type of organic solvent, organic to aqueous phase ratio, duration and power of homogenization) on the dependent physicochemical characteristics, nanoparticle diameter and degree of drug loading was studied using the central composite design method. With CCD, the interactive effect of a large number of variables affecting product outcomes/quality can be determined by performing a limited number of experiments. Moreover, CCD was successfully used in our previous study to optimize and develop a method for the synthesis of HSA NPs loaded with anti-TB drugs, and the data produced by CCD showed good and reliable predictions [19]. The variables in Table 1 were selected based on our initial studies [11,20].
Table 2 shows the results of the effect of the estimated variables on the degree of drug loading and average particle size.
According to the data shown in Table 2, the diameter of PLGA NPs varied between 93±2 nm and 452±3 nm, and the polydispersity index varied between 0.046±0.003 and 0.556±0.039. The NPs with the smallest diameter were formed at NP35, but in this case the drug loading degree and nanoparticle yield have low value. The values of drug loading degree and nanoparticle yield were in the range of 4% to 88.2% and 3.4% to 75.2% respectively. The value of zeta potential of nanoparticles varied from -31±3 to -0.6±2 mV. The lowest value of zeta potential (-30.9±3.4 mV) was recorded at NP1, in this case the system is stable in terms of electrostatic interaction, as charged particles repel each other, reducing the probability of their aggregation [19,21].
PLGA7 is for Poly (D,L-lactide-co-glycolide) (50:50),ester terminated with molecular weight 7 000-17 000
PLGA24 is for Poly (D,L-lactide-co-glycolide) (50:50),ester terminated with molecular weight 24 000-38 000
PLGA30 is for Poly (D,L-lactide-co-glycolide) (50:50),ester terminated with molecular weight 30 000-60 000
Analysis of variance (ANOVA) was used to assess the suitability and significance of the mathematical model in predicting particle size and loading degree (see Table 3). The multiple regression results indicated that quadratic terms should be considered in the mathematical model for reliable determination of responses.
Based on the data presented in Table 3, a p-value for both responses (mean NP size and drug loading) below 0.0500 confirms the significance of the model conditions. For the mean NPs size, the model F-value of 3.33 indicates the significance of the model, with only 0.71% probability of noise occurrence. Similarly, the model F-value of 8.98 for the degree of drug loading emphasizes its significance, with only 0.01% probability of occurrence due to noise.
Below is the model created using CCD to estimate the particle size and degree of drug loading. In these formulas: A -PLGA:RIF ratio, B - PLGA type, C -Type of surfactant, D - concentration of surfactant, E - organic solvent, F - Homogenization power, G - Homogenization time, H - Organic phase: Aqueous phase ratio.
Size = 207.83+40.46A+3.61B+1,68C+5,68D – 30,75E – 19,91F+7,94G+10,57H+8,52AB–10,64AC+4,71AD–5,18AE–24,24AF+18,82AG+13,41AH–2,55BC+7,73BD–7,93BE–8,34BF+0,1857BG+12,66BH+0,0634CD–2,56CE–0,4044CF+12,64CG+20,98CH+4,23DE–7,49DF+12,88DG+8,46DH+29,07EF–2,91EG+48,13EH–15,09FG + 8,38FH – 14,40GH – 33,54A² – 9,29B² – 8,79C² + 47,71D² + 78,96E² – 14,79F² – 35,19 G² + 24,01 H²
Drug loading = 37,23 + 4,21A – 0,3393B + 0,6190C – 2,56D – 4,46E + 6,99F – 3,05G – 16,49H + 1,76AB + 0,6751AC + 4,76AD +4,70AE – 5,55AF – 1,31AG+6,12AH – 1,35BC+2,66BD – 3,65BE – 2,81BF+2,23BG+3,76BH+2,36CD – 1,53CE+4,78CF+1,29CG – 0,6921CH – 1,33DE – 2,73DF+1,06DG – 1,49DH+4,83EF – 6,05EG – 2,47EH+1,12FG – 1,23FH+2,54GH
The effect of various factors on nanoparticle size and drug loading rate was depicted using three dimensional (3D) diagram (Figure 1 and 2).
Figure 1(a) shows an increasing trend of average nanoparticle size with increasing ratio of rifampicin (RIF) and polylactide-co-glycolide polymer (PLGA). The type of PLGA did not significantly affect the size of nanoparticles. The smallest nanoparticle size is achieved when using the highest power and longer homogenization time (according to Design Expert calculations, the average nanoparticle size will be 138 nm at 70 W and homogenization duration of 15 min), while the average values of both parameters result in the maximum nanoparticle size (Figure 1(b)). When PVA is used as surfactant and its concentration of 1%, the average size of nanoparticles is minimum (231 nm). By increasing or decreasing the surfactant concentrations and using other surfactants (tween 80 or Pluronic) the average size of nanoparticles increases (Figure 1c). Also, smaller nanoparticle size is also achieved when DMSO is used as organic solvent and the ratio of organic to aqueous phase is 1:5, compared to the use of other organic solvents and ratios (Figure 1d).
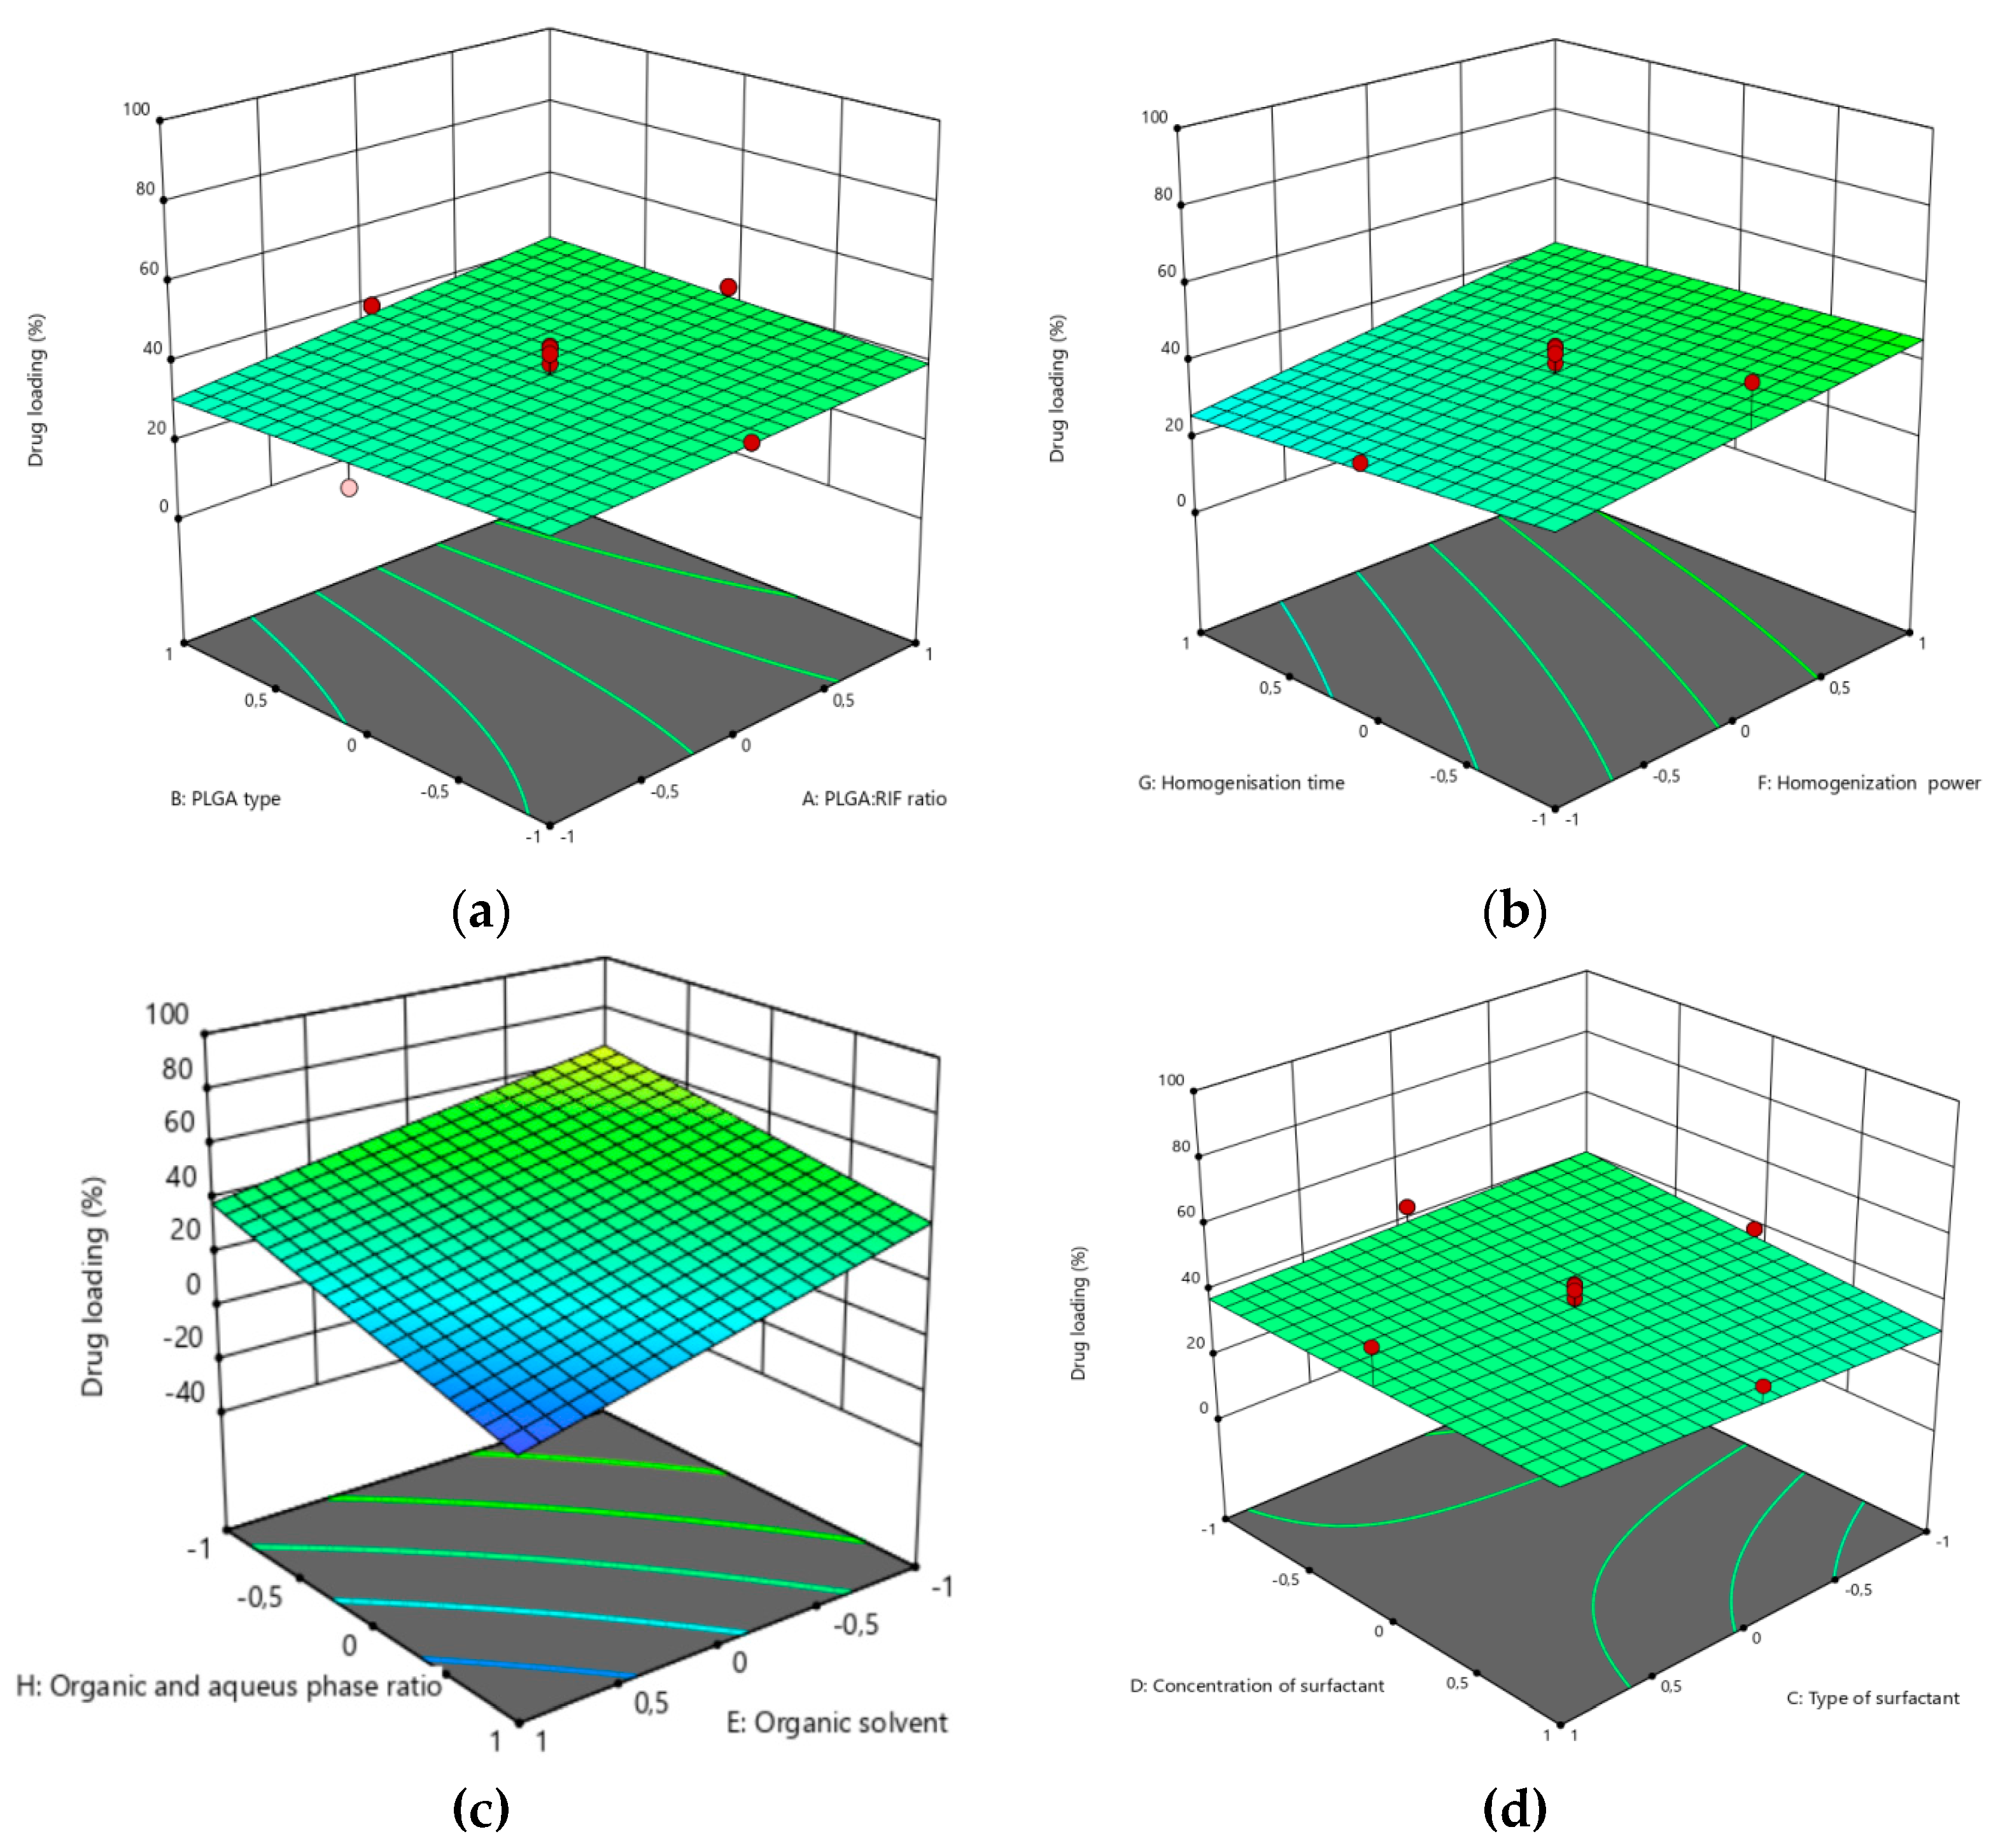
From the graphs shown in Figure 2, the drug loading degree increases as the ratio of PLGA to RIF increases (Figure 2 a). Regarding the type of PLGA, it has negligible effect on the loading degree of rifampicin: using PLGA with molecular weight of 7,000- 17,000, the loading degree of rifampicin has a higher value than in other cases (Figure 2 a). As the homogeniser power increases from 15 W to 70 W, the rifampicin loading degree increases from 30% to 46% (Figure 2b), but decreases with longer homogenisation times (50% for 5 minutes, and 45% for 15 minutes). With an organic to aqueous phase ratio of 1:1 and using dichloromethane as solvent, the loading rate is 63%, compared to when the loading rate of rifampicin was equated to 6% with an organic to aqueous phase ratio of 1:10 and using ethyl acetate as solvent (Figure 2c). Regarding the effect of surfactant type and concentration, when the surfactant concentration was increased from 0.5% to 1.5%, the rifampicin loading degree decreased from 40% to 32%. Nanoparticles have a higher loading degree when Pluronic is used as a surfactant (Figure 2d).
Using Design Expert software, the parameters for computer-aided optimization were selected. Table 4 shows which criteria were used for optimization to obtain PLGA-RIF NPs with minimum size and maximum drug loading and NPs yield.
Based on the results produced by ANOVA, DesignExpert software suggested the best parameters for obtaining PLGA-RIF nanoparticles, minimum size and maximum loading. The optimum parameters for obtaining PLGA-RIF nanoparticles were determined as follows: PLGA:RIF ratio - 1:1, PLGA type - 30,000-60,000, Type of surfactant - PVA, Organic solvent - DCM, Homogenisation power - 70 W, Homogenisation time - 15 min, Organic and aqueous phase ratio 1:1. The synthesis of PLGA NPs with the proposed parameters produced by CCD approach was carried out to compare the predicted data with experimental data. A significant agreement between the predicted and experimental data was observed (Table 5). Consequently, the CCD method is effective for the optimization of PLGA-RIF NPs synthesis process.

3.2. Physicochemical Characterisation of PLGA-RIF Nanoparticles

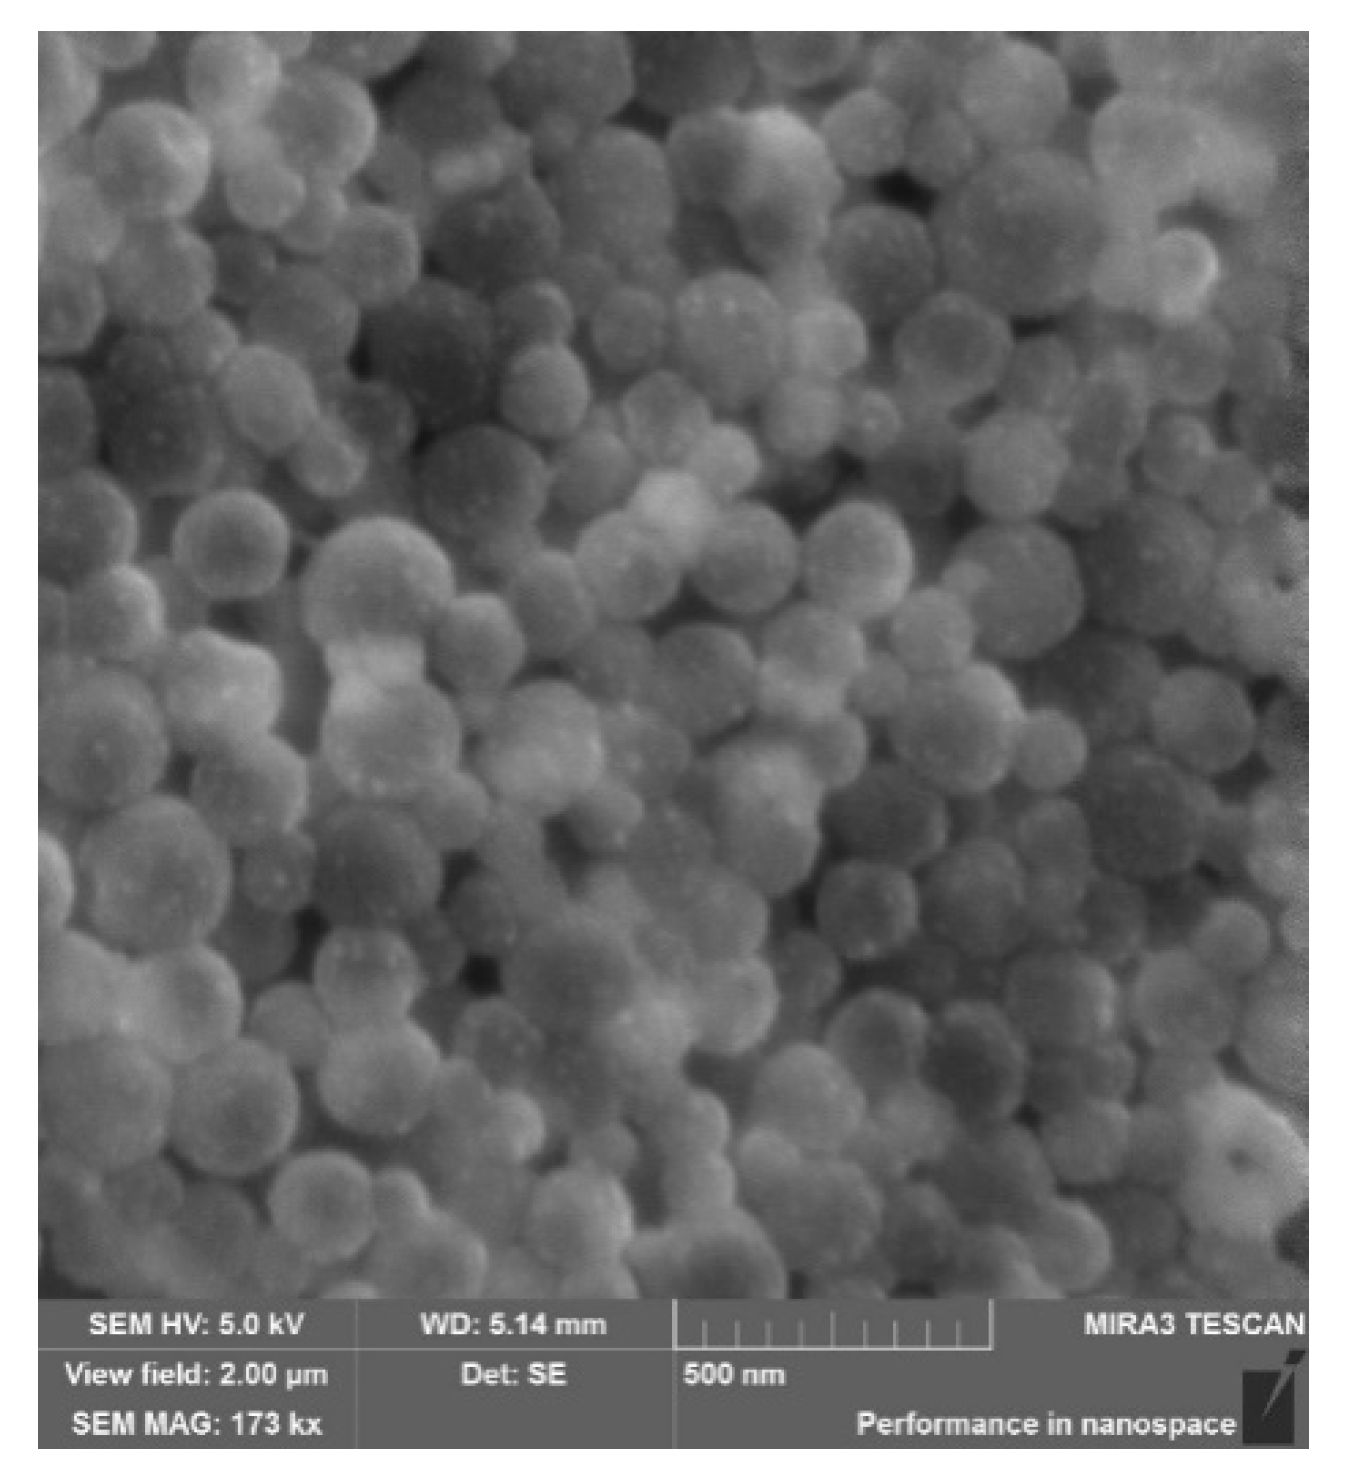
Figure 3 demonstrates the morphology of PLGA nanoparticles containing rifampicin. These nanoparticles are spherical in shape and have an average size not exceeding 200 nm. Possible aggregation of the particles may be due to residual surfactants that were removed by performing 2-3 washes of the nanoparticles with distilled water. In addition, nanoparticle aggregation may be caused by the high-energy centrifugal force applied during particle extraction from the dispersion [22]. This force may act as a contributing factor to particle aggregation.
Thermogravimetric analysis (TGA) and differential scanning calorimetry (DSC) curves of rifampicin, PLGA NPs and PLGA-RIF NPsare presented in Figure 4.
The DSC curve of rifampicin shows several peaks reflecting physicochemical changes of the substance upon heating. The first endothermic peak recorded at 186 °C corresponds to the melting point of rifampicin and the transition of the substance from the solid phase to the liquid phase [23]. The next exothermic peak recorded at 196 °C is probably related to the process of recrystallisation and change of polymorphic form. Part of the heat released during recrystallisation triggers the decomposition process, with a mass loss of 10% [24]. This is followed by an exothermic peak at 252 °C, which is accompanied by another 10% mass loss, corresponding to the second stage of rifampicin decomposition. And then follows the third stage the last peak at 422 °C may indicate further changes in the chemical structure of rifampicin and subsequent mass loss, which presumably corresponds to the second stage of decomposition [23,24].
Two endothermic peaks can be observed on the curve that corresponds to empty PLGA nanoparticles. The first peak observed at 360 °C may reflect the beginning of the thermal decomposition or degradation process of PLGA. Since the percentage of mass loss of the polymer at this point is 77%, this may indicate the onset of significant polymer degradation. The second peak, which appears at 420 °C with slight mass loss, may indicate more complex processes such as the subsequent degradation of residual polymer parts [11,20,25,26]. As for rifampicin-loaded PLGA nanoparticles, no new endothermic peaks are observed in the DSC curve. Only one endothermic peak at 357 °C is detected. Therefore, rifampicin was successfully immobilized into PLGA nanoparticles, which did not lead to chemical interaction between the drug and the polymer [11,20].
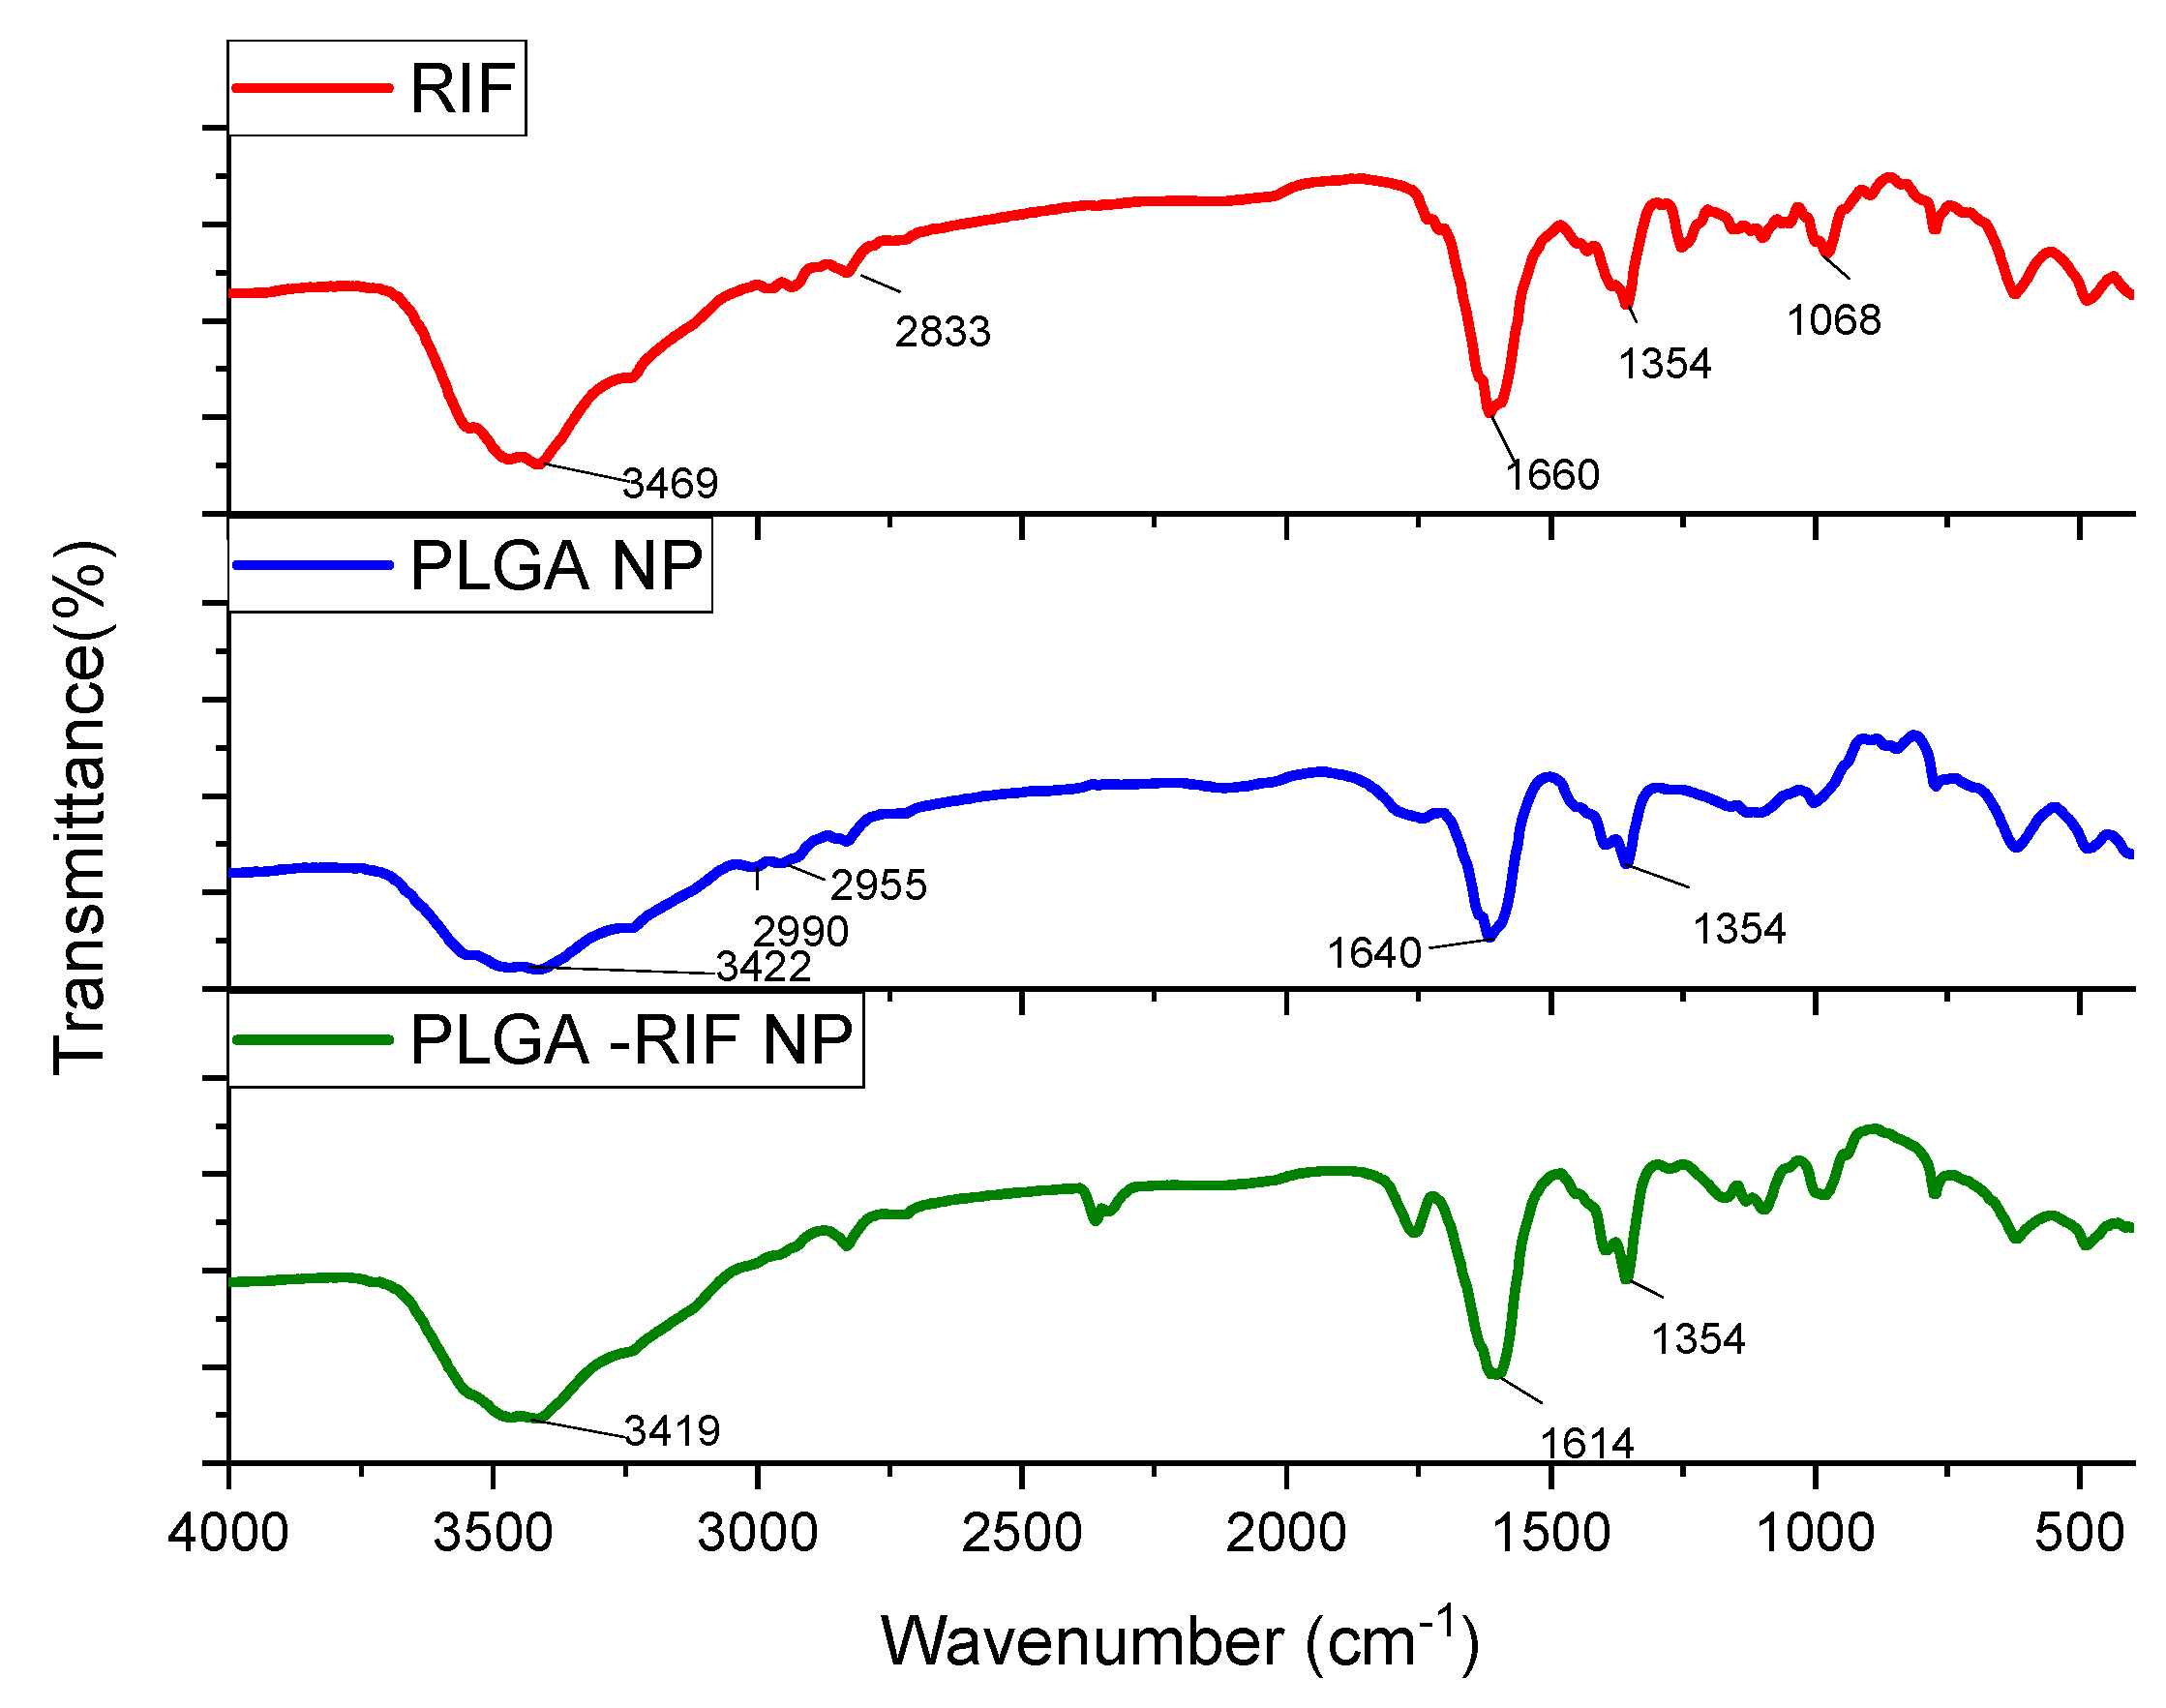
IR spectroscopy of the produced nanoparticles and drug was carried out to verify the incorporation of rifampicin into the polymer matrix. The IR spectra of rifampicin, PLGA nanoparticles with and without rifampicin are shown in Figure 5.
Characteristic absorption patterns of rifampicin include distinct peaks at certain frequencies. Strong absorption at 3469 cm-1 corresponds to stretching of the NH. The peak at 2833 cm-1 indicates the presence of a C-H bond. The peak recorded at 1660 cm-1 represents the C=O group. The peak observed at 1354 cm-1 is associated with both CH2 and C=C. The absorption band observed at 1068 cm-1 usually corresponds to -CH, CO, and C-H [16,27,28,29].
From the analysis of PLGA spectra, the following characteristic signals were identified: the peak at 3422 cm-1 is associated with OH and NH stretching, at 1640 cm-1 corresponds to the stretching vibration of the carbonyl C=O, the peaks at 2955 cm-1 and 2990 cm-1 represent the vibrations of CH2 and CH3 respectively, the peak at 1354 cm-1 is due to the bending of CH3 [30,31]. The spectrum of PLGA-RIF NPs shows distinct peaks characteristic of both the polymer and rifampicin structure, indicating that there is no chemical interaction between PLGA NPs and rifampicin.

3.3. In Vitro Release Profile of PLGA-RIF NPs

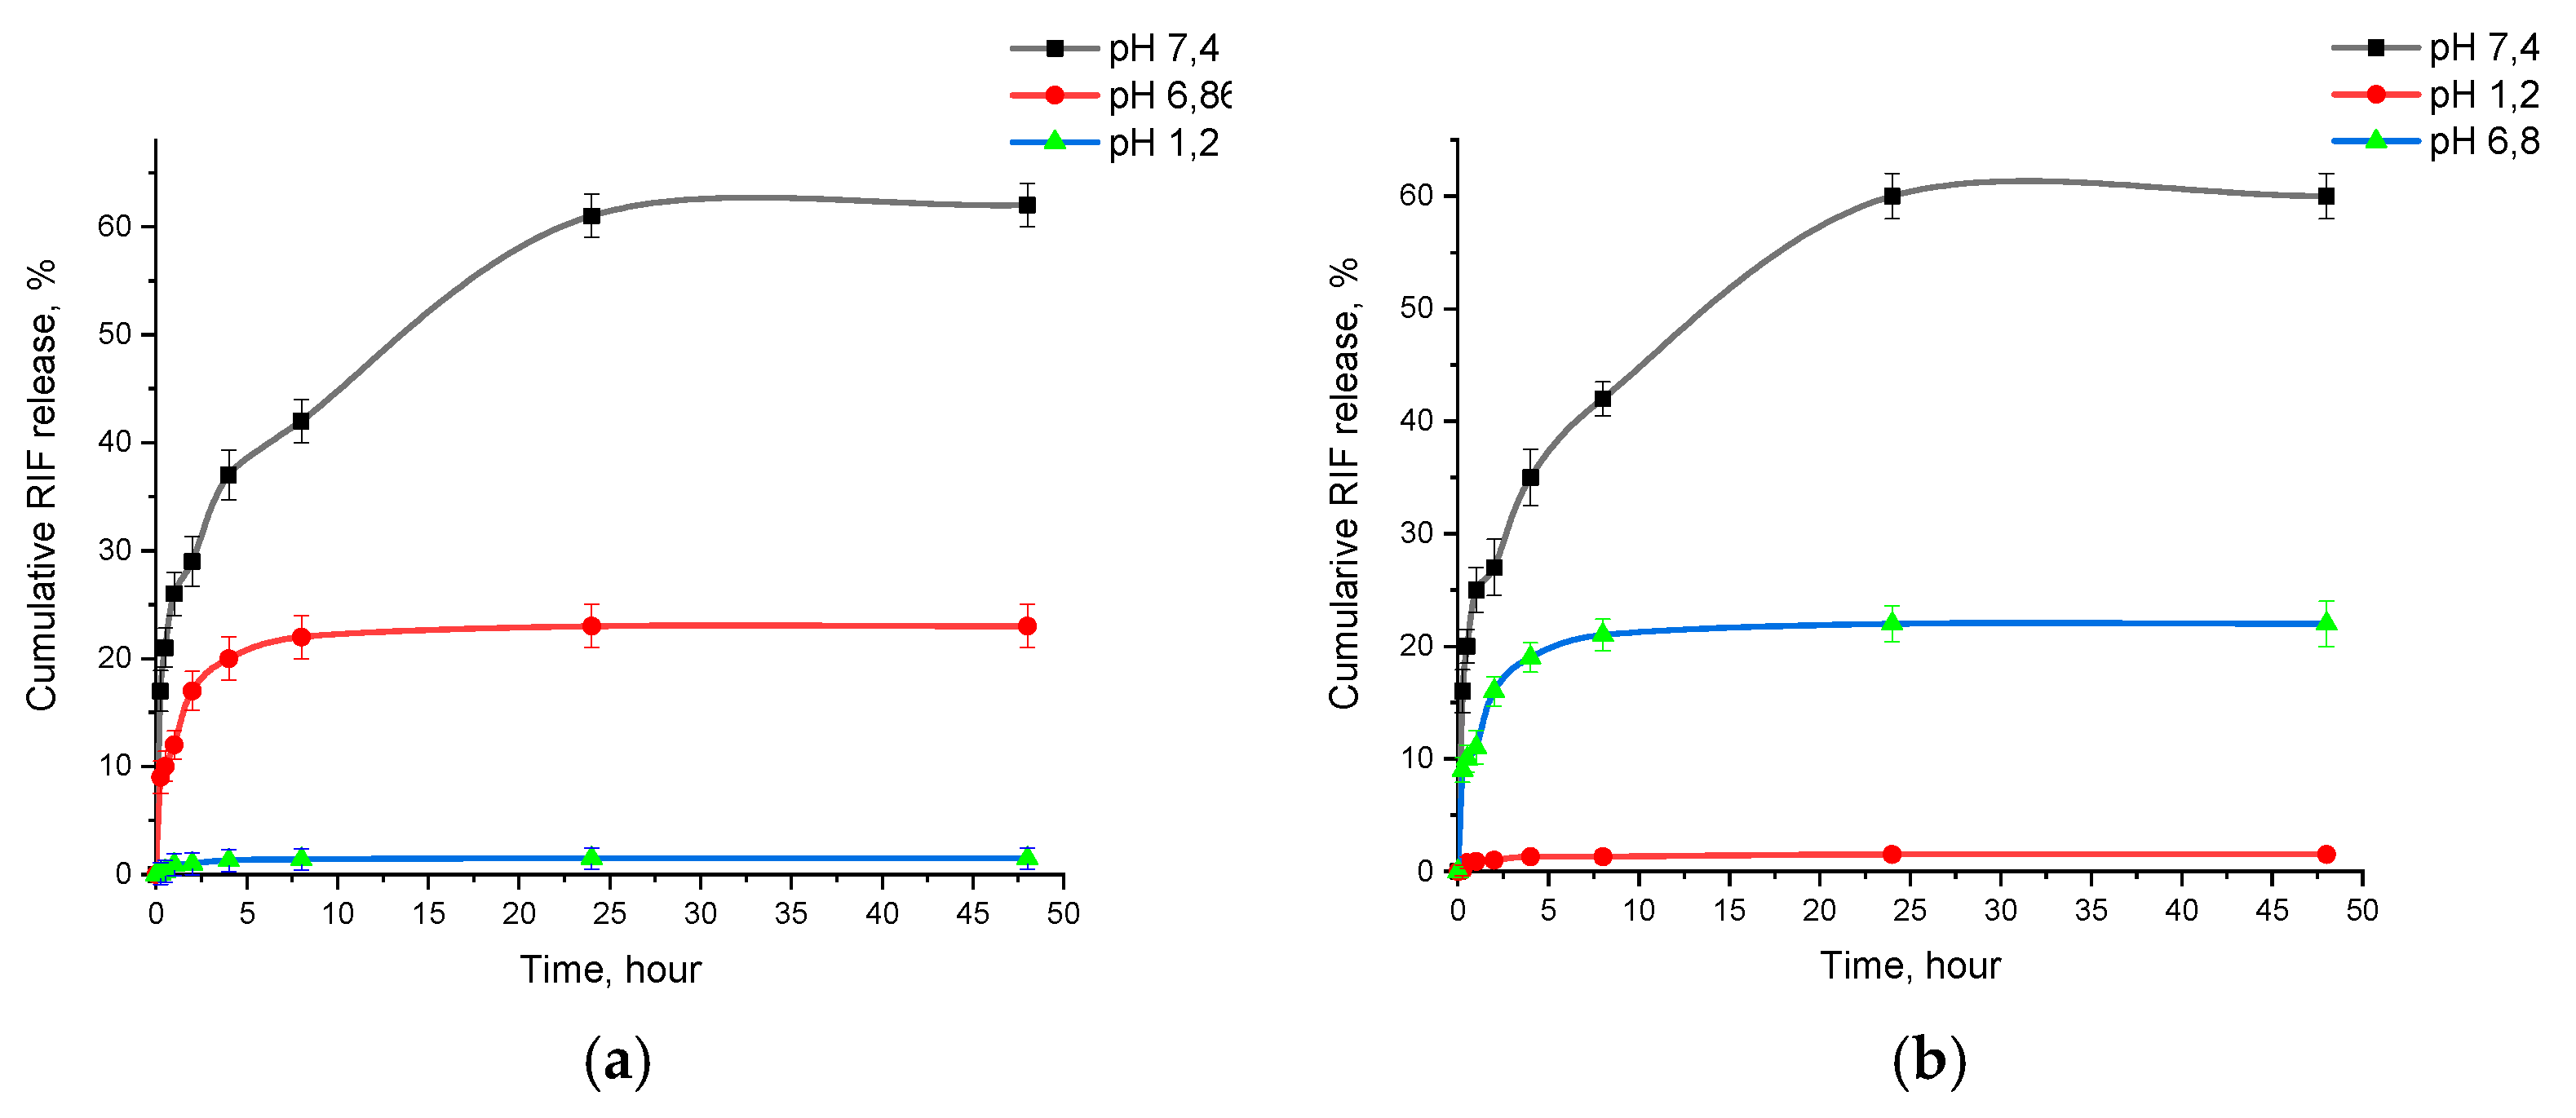
The investigation of rifampicin release from PLGA nanoparticles represents an important aspect of the study, since the determination of the release efficiency of the drug has a direct bearing on its potential therapeutic efficacy. For this purpose, two methods were used in this study: the flow cell method on a CE 7Smart apparatus and the vertical diffusion method on a Franz PHOENIX™ DB-6 cell. Both methods have their advantages and can further validate the results of the study, providing a more complete understanding of rifampicin release processes from PLGA nanoparticles. Despite the difference in the methods used, the results of rifampicin release matched by 98%, which confirms the reliability of the study and the suitability of the chosen methods for the study objectives (Figure 6).
From the obtained Sotax cell data, it can be seen that the release of rifampicin from the polymer matrix is most efficient under simulated blood plasma conditions (pH 7.4), where a release of approximately 60% in 48 hours was achieved. In comparison, under conditions simulating gastric (pH 1.2) and intestinal (pH 6.8) environments, rifampicin release was significantly less efficient (rifampicin release was approximately 1.5% and 23%, respectively), which may be due to low drug solubility or changes in polymer properties at different pH [32]. Based on the obtained data, it can be concluded that pH has a significant effect on drug release and the use of injectable dosage form of the drug, which provides direct administration of the drug into the bloodstream, is the preferred option. This method of delivery ensures optimal blood levels of the drug, which maximises therapeutic efficacy with minimal side effects.
The study of rifampicin release from optimised PLGA-NPs showed a stable process. Drug release is characterised by an initial burst release followed by a slow or sustained release. The initial rapid release of RIF may be due to release from the surface of PLGA-NPs and then the drug is gradually released from the core of NPs nanoparticles due to hydration and swelling of PLGA [33,34,35]. RIF release study showed the highest release of 62 ± 3.8% with the phenomenon of sustained release from PLGA-RIFNPs after 48 h. (Figure 5b). This process is important to ensure controlled and gradual release of the drug, which may be critical for its therapeutic efficacy [36].

3.4. In Vitro Mucoadhesion of PLGA-RIF NPs

The study of the mucoadhesive properties of nanoparticles is of key importance for the development of effective dosage forms (Figure 7). Mucoadhesive nanoparticles can increase the contact time of the drug with mucosal sites, which improves bioavailability, targeted delivery and controlled release of active ingredients. This is particularly important for drugs that need to be delivered to specific parts of the gastrointestinal (GIT) tract [37,38,39,40,41].
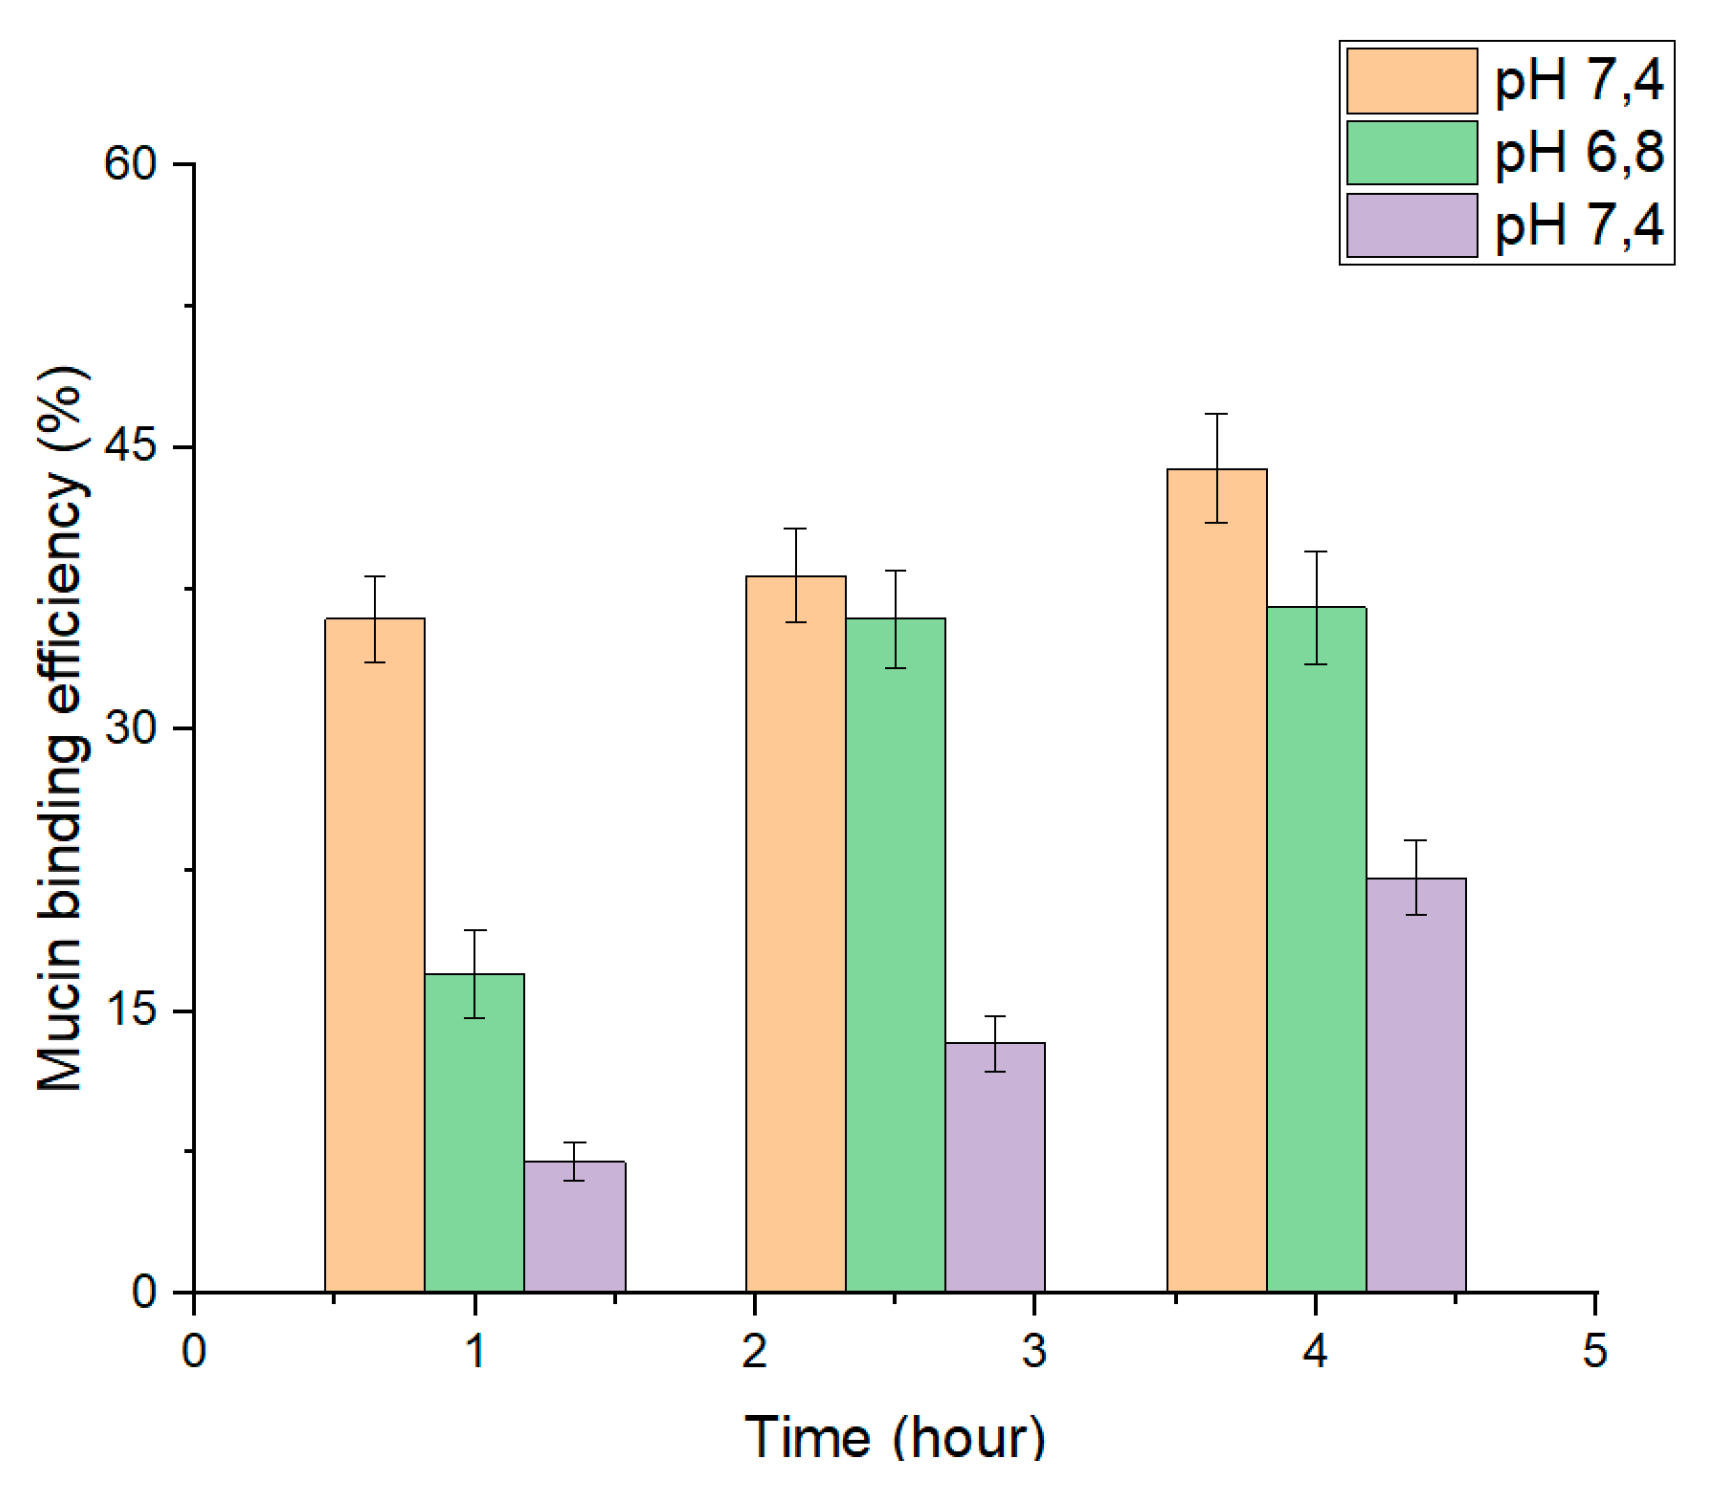
In the study of mucoadhesive properties of PLGA nanoparticles, the turbidity of NP-mucin dispersion was evaluated at different pH simulating the GIT environment. An increase in the conjugation of mucin to the nanoparticle surface was observed over time in all three media. The highest binding of mucin to the nanoparticles occurred at pH 7.4, where the efficiency reached 44% after 4 hours. At pH 6.8, the binding efficiency was 37% over the same period, showing a more rapid attainment of stable levels. The lowest binding was observed at pH 1.2, with a maximum efficiency of 22% after 4 hours.

3.5. In Vitro Efficacy of PLGA-RIF NPs against Strain H37Rv

Studies of antituberculosis activity of nanoparticles were carried out on antituberculosis-sensitive wild strain MTB H37Rv produced from the pulmonology clinic of Asklepios Gauting (Germany). Determination of bacteriostatic activity of nanoparticles in vitro was evaluated by growth of MTB strain on dense nutrient medium Lowenstein-Jensen.
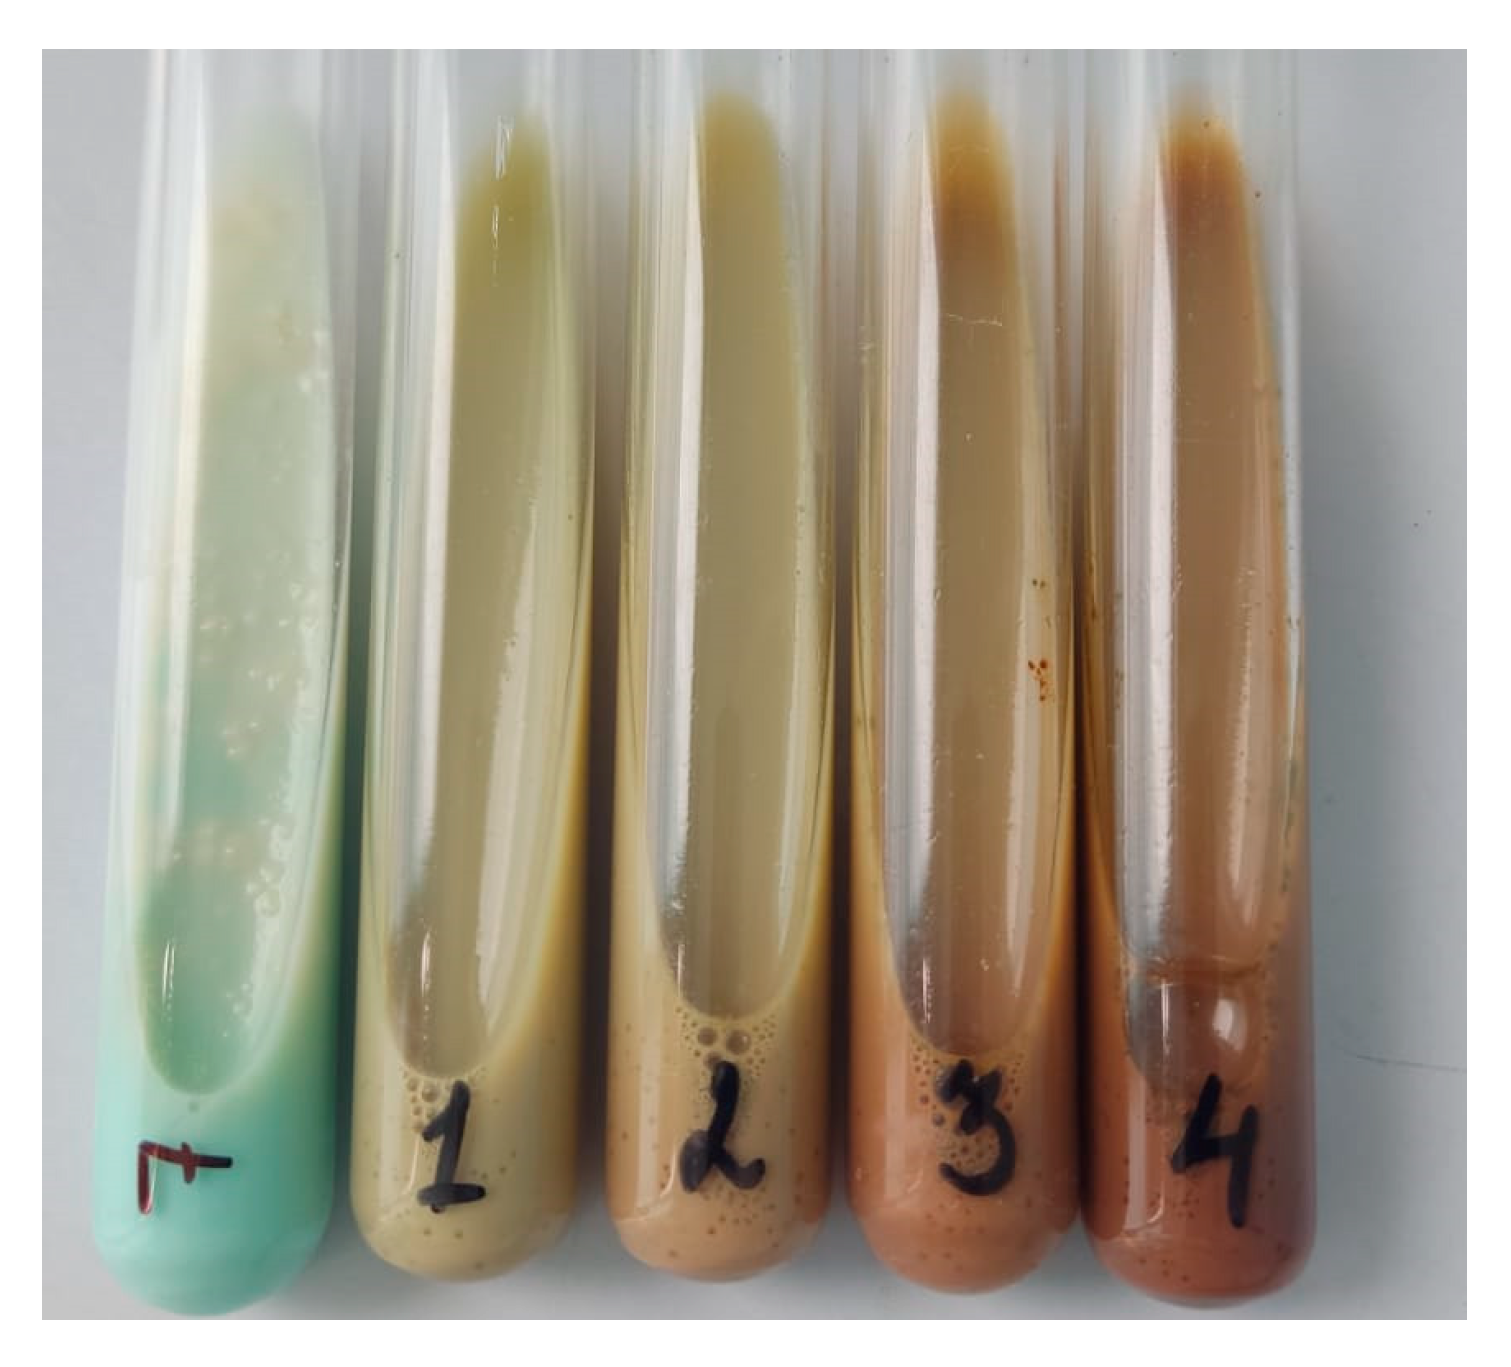
To study the mycobacterial activity of nanoparticles, PLGA nanoparticles were synthesised without drug and with different concentrations of rifampicin (5, 10, 20 and 40 mg/mL). The culture tubes were incubated for 4 weeks, after which the results were recorded. The data on the effect on the growth of wild strain MTB H37Rv are presented in Figure 8.
After incubation at 37°C, drug-free PLGA NPs showed antimicrobial resistance, indicating that without any treatment, PLGA NPs had no effect on inhibiting the growth of MTB strain H37Rv. PLGA-RIF NPs were sensitive to mycobacteria and completely inhibited the growth of H37Rv strain. Since the polymeric matrix of the nanoparticles provides prolonged release of rifampicin, it maintains therapeutic concentrations of the drug for a long time, which is important for complete eradication of slow-growing and latent forms of MTB. Based on the obtained results on mycobacterial activity, there is hope for further application of polymeric NPs with antituberculosis drug for the treatment of tuberculosis. Thus, the use of NPs with prolonged action will help to solve such problems as non-compliance with the dosage and frequency of drug administration, reduce side effects and overcome multidrug resistance of mycobacteria to isoniazid.

4. Conclusions

Therefore, in this study, we have performed the synthesis and optimization of rifampicin-loaded polylactide-co-glycolide nanoparticles using the central composite design method. This method provides efficient optimization, allowing the selection of the most suitable compositions to achieve the objectives with a minimum number of experiments. The results of this study confirm the significant advantages of using the CCD method in formulation optimization for the development of drug delivery systems. The nanoparticles synthesised as a result of optimization had a desired size of 223±2 nm, a fairly high loading rate of 67±1%. The in vitro drug release study showed that the release of rifampicin was prolonged in nature. This confirms that the produced system will be effective in the treatment of tuberculosis. Moreover, the stability and controlled release of the drug make these nanoparticles a promising tool to increase the bioavailability and efficacy of antibiotic therapy. This approach opens new opportunities in the development of advanced drug delivery systems aimed at improving therapeutic outcomes.

Author Contributions

The manuscript was written through contributions of all authors. A.R.G. conceptualization, data curation, methodology; writing—review and editing; N.A.Y. writing original draft, writing-review and editing, investigation, data curation; Y.M. T. was responsible for conceptualization and research methodology, as well as reviewed and corrected the article; A.T. D. and D.T.S. was responsible for investigation. All authors have given approval to the final version of the manuscript.

Funding

This research was funded by the Ministry of Education and Science of the Republic of Kazakhstan under Grant No. AP14871344, titled “Development of colloidal drug delivery systems based on biopolymers for tuberculosis chemo-therapy”.

Institutional Review Board Statement

Not applicable.

Informed Consent Statement

Not applicable.

Data Availability Statement

Data is contained within the article.

Conflicts of Interest

The authors declare no conflict of interest.

References

  1. Iacobino, A.; Fattorini, L.; Giannoni, F. Drug-Resistant Tuberculosis 2020: Where We Stand. Appl. Sci. 2020, 10, 2153. [Google Scholar] [CrossRef]
  2. Tazhbayev, Y.; Galiyeva, A.; Zhumagaliyeva, T.; Burkeyev, M.; Karimova, B. Isoniazid—Loaded Albumin Nanoparticles: Taguchi Optimization Method. Polymers 2021, 13, 3808. [Google Scholar] [CrossRef]
  3. World Health Organization. Global Tuberculosis Report 2022; World Health Organization: Geneva, Switzerland, 2022. [Google Scholar]
  4. World Health Organization. Global Tuberculosis Report 2023; World Health Organization: Geneva, Switzerland, 2023. [Google Scholar]
  5. Chen, W.; Glackin, C.A.; Horwitz, M.A.; Zink, J.I. Nanomachines and other caps on mesoporous silica nanoparticles for drug delivery. Acc. Chem. Res. 2019, 52, 1531–1542. [Google Scholar] [CrossRef] [PubMed]
  6. Motiei, M.; Pleno de Gouveia, L.; Šopík, T.; Vícha, R.; Škoda, D.; Císař, J.; Khalili, R.; Domincová Bergerová, E.; Münster, L.; Fei, H.; et al. Nanoparticle-Based Rifampicin Delivery System Development. Molecules 2021, 26, 2067. [Google Scholar] [CrossRef] [PubMed]
  7. Hakkimane, S.S.; Shenoy, V.P.; Gaonkar, S.L.; Bairy, I.; Guru, B.R. Antimycobacterial susceptibility evaluation of rifampicin and isoniazid benz-hydrazone in biodegradable polymeric nanoparticles against Mycobacterium tuberculosis H37Rv strain. Int. J. Nanomed. 2018, 13, 4303–4318. [Google Scholar] [CrossRef]
  8. Rather, M.A.; Amin, S.; Maqbool, M.; Bhat, Z.S.; Gupta, P.N.; Ahmad, Z. Preparation and in vitro characterization of albumin nanoparticles encapsulating an anti-tuberculosis drug-levofloxacin. Adv. Sci. Eng. Med. 2016, 8, 912–917. [Google Scholar] [CrossRef]
  9. Keum, C.G.; Noh, Y.W.; Baek, J.S.; Lim, J.H.; Hwang, C.J.; Na, Y.G.; Shin, S.C.; Cho, C.W. Practical preparation procedures for docetaxel-loaded nanoparticles using polylactic acid-co-glycolic acid. Int. J. Nanomed. 2011, 6, 2225–2234. [Google Scholar] [CrossRef]
  10. Turk, T.S.; Bayindir, Z.S.; Badilli, U. Preparation of polymeric nanoparticles using different stabilizing agents. J. Fac. Pharm. Ank. Univ. 2009, 38, 257–268. [Google Scholar] [CrossRef]
  11. Galiyeva, A.R.; Tazhbayev, Y.M.; Zhumagaliyeva, T.S.; Sadyrbekov, D.T.; Kaikenov, D.A.; Karimova, B.N.; Shokenova, S.S. Polylactide-co-glycolide nanoparticles immobilized with isoniazid: Optimization using the experimental Taguchi method. Bull. Karaganda University. “Chem. ” Ser. 2022, 105, 69–77. [Google Scholar] [CrossRef]
  12. Sung, J.C.; Pulliam, B.L.; Edwards, D.A. Nanoparticles for drug delivery to the lungs. Trends Biotechnol. 2007, 25, 563–570. [Google Scholar] [CrossRef]
  13. Costa, A.; Pinheiro, M.; Magalhães, J.; Ribeiro, R.; Seabra, V.; Reis, S.; Sarmento, B. The formulation of nanomedicines for treating tuberculosis. Adv. Drug Deliv. Rev. 2016, 102, 102–115. [Google Scholar] [CrossRef] [PubMed]
  14. Shegokar, R.; Al Shaal, L.; Mitri, K. Present status of nanoparticle research for treatment of Tuberculosis. J. Pharm. Pharm. Sci. 2011, 14, 100–116. [Google Scholar] [CrossRef] [PubMed]
  15. Politis, S.N.; Colombo, P.; Colombo, G.; Rekkas, D.M. Design of experiments (DoE) in pharmaceutical development. Drug Dev. Ind. Pharm. 2017, 43, 889–901. [Google Scholar] [CrossRef]
  16. Gordeeva, D.S.; Sitenkova, A.V.; Moustafine, R.I. New Carriers for Bioadhesive Gastroretentive Drug Delivery Systems Based on EudragitR EPO/EudragitR L100 Interpolyelectrolyte Complexes. Sci. Pharm. 2024, 92, 14. [Google Scholar] [CrossRef]
  17. Timergalieva, V.R.; Gennari, C.G.M.; Cilurzo, F.; Selmin, F.; Moustafine, R.I. Comparative Evaluation of Metformin and Metronidazole Release from Oral Lyophilisates with Different Methods. Sci. Pharm. 2023, 91, 23. [Google Scholar] [CrossRef]
  18. Samprasit, W.; Opanasopit, P.; Chamsai, B. Alpha-mangostin and resveratrol, dual-drugs-loaded mucoadhesive thiolated chitosan-based nanoparticles for synergistic activity against colon cancer cells. J. Biomed. Mater. Res. Part B Appl. Biomater. 2021, 110, 1221–1233. [Google Scholar] [CrossRef] [PubMed]
  19. Galiyeva, A.; Daribay, A.; Zhumagaliyeva, T.; Zhaparova, L.; Sadyrbekov, D.; Tazhbayev, Y. Human Serum Albumin Nanoparticles: Synthesis, Optimization and Immobilization with Antituberculosis Drugs. Polymers 2023, 15, 2774. [Google Scholar] [CrossRef] [PubMed]
  20. Tazhbayev, Y.M.; Galiyeva, A.R.; Zhumagaliyeva, T.S.; Burkeyev, M.Z.; Kazhmuratova, A.T.; Zhakupbekova, E.Z.; Zhaparova, L.Z.; Bakibayev, A.A. Synthesis and characterization of isoniazid immobilized polylactide-co-glycolide nanoparticles. Bull. Karaganda University. “Chem. ” Ser. 2021, 101, 61–70. [Google Scholar] [CrossRef]
  21. Fernandes, H.P.; Cesar, C.L.; Barjas-Castro, M. de L.Electrical properties of the red blood cell membrane and immunohematological investigation. Rev. Bras. De Hematol. E Hemoter. 2011, 33, 297–301. [Google Scholar] [CrossRef] [PubMed]
  22. Ahmad, N.; Ahmad, R.; Al Qatifi, S.; Alessa, M.; Al Hajji, H.; Sarafroz, M. A bioanalytical UHPLC based method used for the quantification of Thymoquinone-loaded-PLGA-nanoparticles in the treatment of epilepsy. BMC Chem. 2020, 14. [Google Scholar] [CrossRef]
  23. Agrawal, S.; Ashokraj, Y.; Bharatam, P.V.; Pillai, O.; Panchagnula, R. Solid-state characterization of rifampicin samples and its biopharmaceutic relevance. Eur. J. Pharm. Sci. 2004, 22, 127–144. [Google Scholar] [CrossRef] [PubMed]
  24. Alves, R.; Reis, T.V.d.S.; da Silva, L.C.C.; Storpírtis, S.; Mercuri, L.P.; Matos, J.d.R. Thermal behavior and decomposition kinetics of rifampicin polymorphs under isothermal and non-isothermal conditions. Braz. J. Pharm. Sci. 2010, 46, 343–351. [Google Scholar] [CrossRef]
  25. Qi, J.; Feng, S.; Liu, X.; Xing, L.; Chen, D.; Xiong, C. Morphology, thermal properties, mechanical property and degradation of PLGA/PTMC composites. J. Polym. Res. 2020, 27, 387. [Google Scholar] [CrossRef]
  26. Silva, A.T.C.R.; Cardoso, B.C.O.; e Silva, M.E.S.R.; Freitas, R.F.S.; Sousa, R.G. Synthesis, Characterization, and Study of PLGA Copolymer In Vitro Degradation. J. Biomater. Nanobiotechnology 2015, 6, 8–19. [Google Scholar] [CrossRef]
  27. Yessentayeva, N.A.; Galiyeva, A.R.; Daribay, A.T.; Sadyrbekov, D.T.; Zhumagalieva, T.S.; Marsel, D.T. Synthesis and Optimization of Bovine Serum Albumin Nanoparticles Immobilized with Antituberculosis Drugs. EURASIAN JOURNAL OF CHEMISTRY 2024, 29, 33–42. [Google Scholar] [CrossRef]
  28. Sharma, A.; Puri, V.; Kumar, P.; Singh, I.; Huanbutta, K. Development and Evaluation of Rifampicin Loaded Alginate–Gelatin Biocomposite Microfibers. Polymers 2021, 13, 1514. [Google Scholar] [CrossRef] [PubMed]
  29. Ivashchenko, O.; Tomila, T.; Ulyanchich, N.; Yarmola, T.; Uvarova, I. Fourier-Transform Infrared Spectroscopy of Antibiotic Loaded Ag-Free and Ag-Doped Hydroxyapatites. Adv. Sci. Eng. Med. 2014, 6, 193–202. [Google Scholar] [CrossRef]
  30. Portaccio, M.; Menale, C.; Diano, N.; Serri, C.; Mita, D.G.; Lepore, M. Monitoring production process of cisplatin-loaded PLGA nanoparticles by FT-IR microspectroscopy and univariate data analysis. J. Appl. Polym. Sci. 2014, 132. [Google Scholar] [CrossRef]
  31. Anwer, M.K.; Al-Mansoor, M.A.; Jamil, S.; Al-Shdefat, R.; Ansari, M.N.; Shakeel, F. Development and evaluation of PLGA polymer based nanoparticles of quercetin. Int. J. Biol. Macromol. 2016, 92, 213–219. [Google Scholar] [CrossRef]
  32. Devi, M.G.; Dutta, S.; Al Hinai, A.T.; Feroz, S. Studies on encapsulation of Rifampicin and its release from chitosan-dextran sulfate capsules. Korean J. Chem. Eng. 2014, 32, 118–124. [Google Scholar] [CrossRef]
  33. Ahmad, N. Rasagiline-encapsulated chitosan-coated PLGA nanoparticles targeted to the brain in the treatment of parkinson’s disease. J. Liq. Chromatogr. Amp; Relat. Technol. 2017, 40, 677–690. [Google Scholar] [CrossRef]
  34. Ahmad, N.; Alam, M.A.; Ahmad, R.; Naqvi, A.A.; Ahmad, F.J. Preparation and characterization of surface-modified PLGA-polymeric nanoparticles used to target treatment of intestinal cancer. Artif. Cells Nanomed. Biotechnol. 2017, 46, 432–446. [Google Scholar] [CrossRef] [PubMed]
  35. Ahmad, N.; Alam, M.A.; Ahmad, R.; Umar, S.; Jalees Ahmad, F. Improvement of oral efficacy of Irinotecan through biodegradable polymeric nanoparticles through in vitro and in vivo investigations. J. Microencapsul. 2018, 35, 327–343. [Google Scholar] [CrossRef]
  36. Galiyeva, A.R.; Tazhbayev, Y.M.; Yessentayeva, N.A.; Daribay, A.T.; Marsel, D.T.; Sadyrbekov, D.T.; Zhaparova, L.Z.; Arystanova, Z.T. PEGylation of Albumin Nanoparticles Immobilized with the Anti-Tuberculosis Drug “Isoniazid”. Eursian J. Chem. 2023, 110, 42–50. [Google Scholar] [CrossRef]
  37. Donnelly, R.; Shaikh, R.; Raj Singh, T.; Garland, M.; Woolfson, A. Mucoadhesive drug delivery systems. J. Pharm. Bioallied Sci. 2011, 3, 89. [Google Scholar] [CrossRef] [PubMed]
  38. Boddupalli, B.; Mohammed Zulkar, N.K.; Nath, R.; Banji, D. Mucoadhesive drug delivery system: An overview. J. Adv. Pharm. Technol. Res. 2010, 1, 381. [Google Scholar] [CrossRef] [PubMed]
  39. Brannigan, R.P.; Khutoryanskiy, V.V. Progress and Current Trends in the Synthesis of Novel Polymers with Enhanced Mucoadhesive Properties. Macromol. Biosci. 2019, 19. [Google Scholar] [CrossRef] [PubMed]
  40. Kaldybekov, D.B.; Tonglairoum, P.; Opanasopit, P.; Khutoryanskiy, V.V. Mucoadhesive maleimide-functionalised liposomes for drug delivery to urinary bladder. Eur. J. Pharm. Sci. 2018, 111, 83–90. [Google Scholar] [CrossRef]
  41. Khutoryanskiy, V.V. Advances in Mucoadhesion and Mucoadhesive Polymers. Macromol. Biosci. 2010, 11, 748–764. [Google Scholar] [CrossRef]
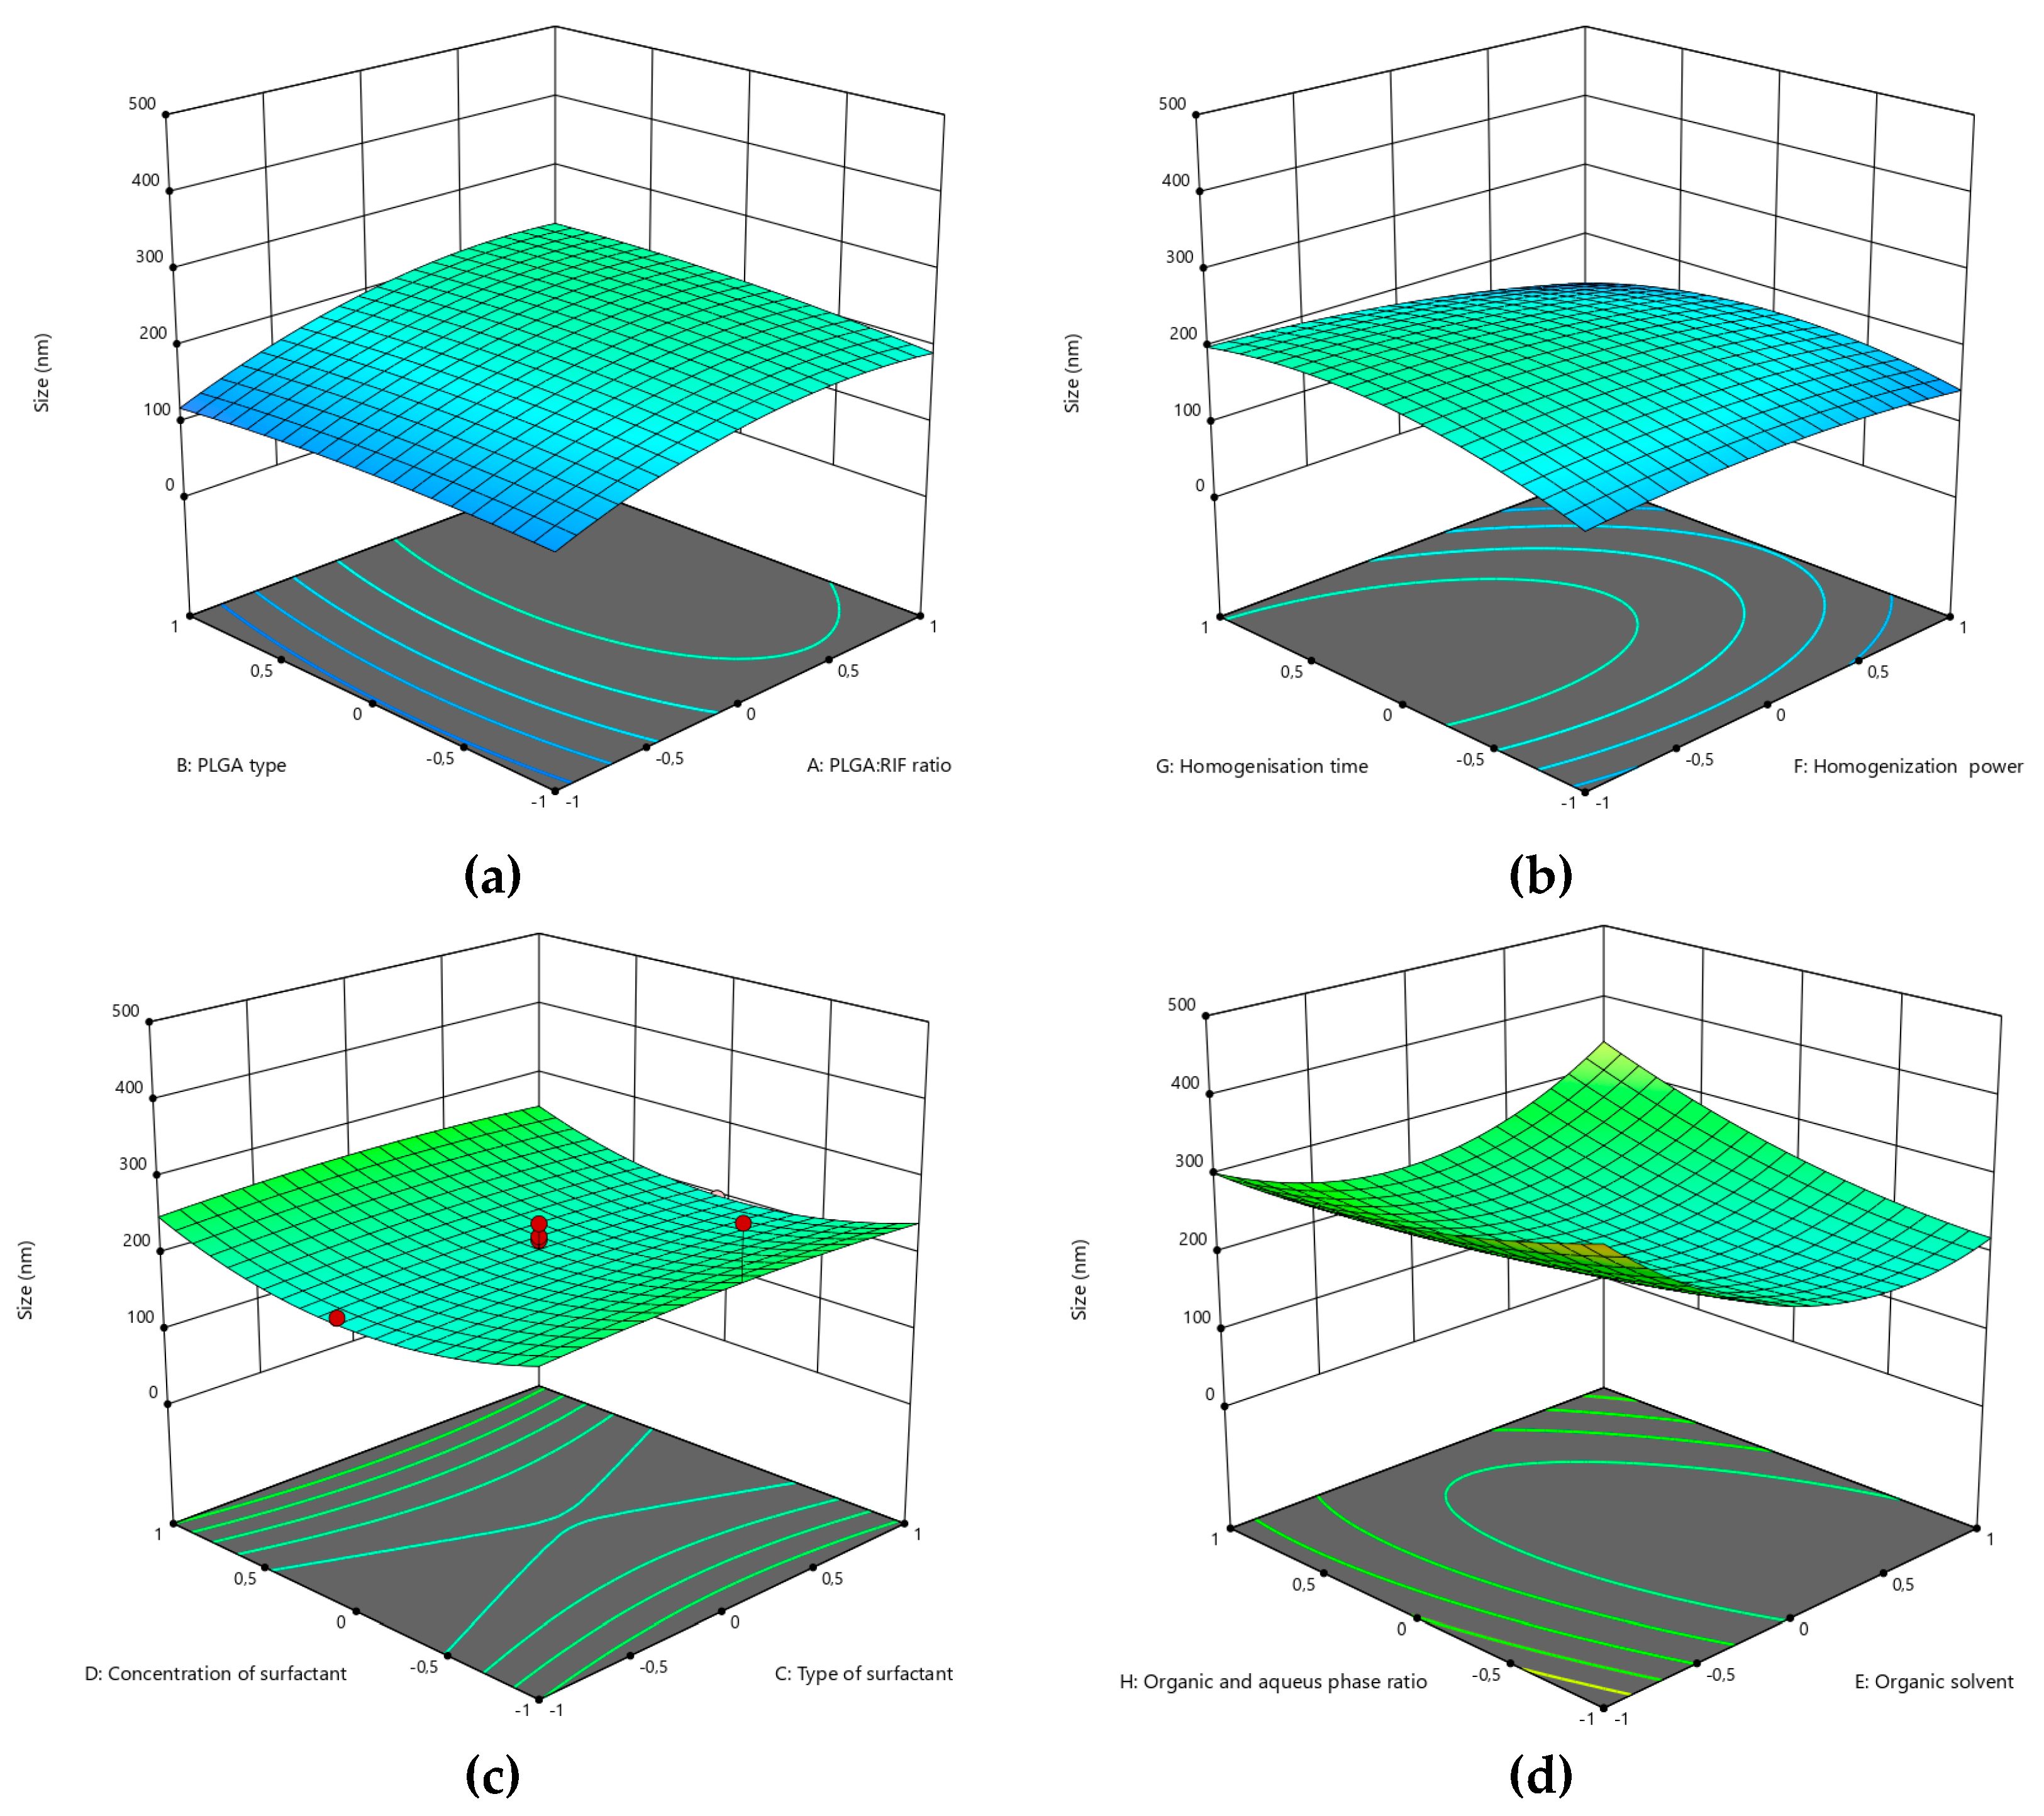
Figure 1. Three-dimensional (3D) response surface diagrams of the impact of independent factors on average particle size: (a) type of PLGA–PLGA:RIF ratio; (b) Homogenization Power–Homogenization time; (c) Surfactant concentration–Type of surfactant; (d) Organic solvent – organic phase: aqueous phase.
Preprints 109986 g001
Figure 2. Three-dimensional (3D) response surface diagrams of the impact of independent factors on drug loading: (a) type of PLGA–PLGA:RIF ratio; (b) Homogenization Power–Homogenization time; (c) organic phase: aqueous phase ratio – Organic solvent; (d) Surfactant concentration– type of surfactant.
Preprints 109986 g002
Figure 3. SEM image of PLGA nanoparticles immobilized with rifampicin.
Preprints 109986 g003
Figure 4. Thermogravimetric analysis and differential scanning calorimetry of a) Rifampicin b) PLGA NPs c) PLGA-RIF NPs.
Preprints 109986 g004
Figure 5. IR spectra for rifampicin, PLGA-NPs and PLGA-RIF NPs.
Preprints 109986 g005
Figure 6. Cumulative release of rifampicin from PLGA-RIF nanoparticles (a) – Sotax cell, (b) – Franz cell.
Preprints 109986 g006
Figure 7. Investigation of mucoadhesive properties of PLGA-RIF nanoparticles.
Preprints 109986 g007
Figure 8. In vitro mycobacterial activity of PLGA-RIF nanoparticles.
Preprints 109986 g008
Table 1. Experimental factors for PLGA-RIF NPs synthesis and corresponding levels.
Independent variable Variable level
Low
-1
Center
0
High
1
PLGA:RIF 1:1 2:1 3:1
Type of PLGA Mw 7 000-17 000 Mw 24 000-38 000 Mw 30 000-60 000
Surfactant type PVA Tween 80 Pluronic F127
Concentration of surfactant 0,5% 1% 2%
Organic solvent DCM DMSO EA
Organic phase: aqueous phase 1:1 1:5 1:10
Homogenization power 15 W 35 W 70 W
Homogenization time 5 min 10 min 15 min
Table 2. Development of PLGA-RIF nanoparticles formulations utilizing central composite design and the parameters for their evaluation.
NPs PLGA:RIF PLGA type Surfactant type Surfactant concentration, % Organic solvent Organic phase: aqueous phase Homogenization power, W Homogenization time, min Average size of NP, nm PDI Z potential, mV Drug loading, % NPs yield, %
1 2 3 4 5 6 7 8 9 10 11 12 13 14
NP1 3:1 PLGA30 PVA 0,5 EA 1:1 15 5 189±2 0.046±0.003 -30.9±3.4 58 75
NP2 3:1 PLGA30 PVA 2 DCM 1:1 15 5 422±2 0.280±0.013 -13.1±1.8 64 59
NP3 3:1 PLGA7 Pluronic 2 EA 1:10 15 5 316±2 0.349±0.051 -28.2±3.3 24 22
NP4 2:1 PLGA24 Tween 80 1 DMSO 1:5 35 10 220±2 0.177±0.023 -20.1±0.6 45 33
NP5 3:1 PLGA7 Pluronic 2 EA 1:1 70 5 94±1 0.285±0.067 -22.8±2.3 88 26
NP6 1:1 PLGA7 PVA 0,5 EA 1:1 70 15 219±2 0.489±0.035 -0.61±2.1 78 41
NP7 2:1 PLGA24 Tween 80 1 DMSO 1:5 35 15 175±2 0.191±0.046 -15.6±3.7 29 67
NP8 3:1 PLGA30 PVA 2 EA 1:10 15 15 452±3 0.499±0.086 -15.8±2.9 31 66
NP9 2:1 PLGA24 Tween 80 1 DMSO 1:5 35 10 170±2 0.358±0.008 -23.2±4.2 40 34
NP10 2:1 PLGA24 Tween 80 1 DMSO 1:5 35 10 172±2 0.178±0.008 -21.6±2.8 37 37
NP11 3:1 PLGA7 PVA 0,5 DCM 1:1 15 5 443±3 0.261±0.034 -14.5±3.4 52 69
NP12 1:1 PLGA30 Pluronic 0,5 DCM 1:10 70 5 260±2 0.262±0.045 -24.3±2.2 30 33
NP13 2:1 PLGA24 Tween 80 1 DMSO 1:5 35 10 184±2 0.186±0.08 -23.2±2.1 33 31
NP14 3:1 PLGA7 Pluronic 2 DCM 1:10 70 5 219±2 0.248±0.065 -20.3±3.1 23 36
NP15 1:1 PLGA7 PVA 2 EA 1:1 15 5 119±2 0.217±0.013 -11.2±2.7 44 41
NP16 1:1 PLGA7 Pluronic 2 EA 1:1 15 15 166±3 0.556±0.039 -20.1±1.4 16 3
NP17 3:1 PLGA7 PVA 0,5 EA 1:10 70 5 356±3 0.474±0.023 -12.8±1.3 48 68
NP18 2:1 PLGA24 Tween 80 1 DMSO 1:1 35 10 291±2 0.373±0.034 -15.4±0.3 37 55
NP19 2:1 PLGA24 PVA 1 DMSO 1:5 35 10 206±3 0.135±0.023 -13.2±1.3 39 33
NP20 1:1 PLGA30 Pluronic 2 DCM 1:10 15 15 271±1 0.508±0.056 -9.5±1.5 27 31
1 2 3 4 5 6 7 8 9 10 11 12 13 14
NP21 1:1 PLGA30 PVA 0,5 DCM 1:1 70 5 282±2 0.145±0.034 -16.4±2.3 65 61
NP22 2:1 PLGA24 Tween 80 2 DMSO 1:5 35 10 193±4 0.224±0.006 -18.5±3.3 40 28
NP23 2:1 PLGA24 Tween 80 1 DMSO 1:5 70 10 167±3 0.276±0.013 -15,6±1.3 41 17
NP24 1:1 PLGA7 Pluronic 0,5 EA 1:1 15 5 94±2 0.206±0.043 -13.9±1.6 48 32
NP25 1:1 PLGA30 Pluronic 0,5 EA 1:1 70 15 95±3 0.238±0.023 -20.7±3.1 55 30
NP26 3:1 PLGA7 Pluronic 0,5 DCM 1:1 70 15 271±4 0.116±0.032 -17.5±0,7 53 65
NP27 3:1 PLGA7 Pluronic 2 EA 1:10 70 15 377±4 0.393±0.051 -23.9±1.9 31 35
NP28 2:1 PLGA24 Tween 80 1 EA 1:5 35 10 225±2 0.269±0.042 -17.8±1.7 41 49
NP29 2:1 PLGA7 Tween 80 1 DMSO 1:5 35 10 182±3 0.157±0.023 -15.7±2.3 38 30
NP30 1:1 PLGA7 PVA 2 DCM 1:10 15 15 165±4 0.263±0.015 -12.5±0.4 4 6
NP31 1:1 PLGA7 Pluronic 2 EA 1:10 70 5 345±3 0.393±0.045 -12.1±1.1 13 28
NP32 3:1 PLGA24 Tween 80 1 DMSO 1:5 35 10 202±2 0.179±0.035 -22.6±3.9 44 37
NP33 1:1 PLGA7 Pluronic 0,5 DCM 1:10 15 15 232±2 0.198±0.024 -23.5±1.2 14 26
NP34 3:1 PLGA30 PVA 0,5 EA 1:1 70 15 173±3 0.118±0.021 -9.2±1.1 36 57
NP35 1:1 PLGA30 Pluronic 2 EA 1:1 15 5 93±2 0.275±0.053 -7.9±1.4 24 17
NP36 1:1 PLGA24 Tween 80 1 DMSO 1:5 35 10 152±3 0.235±0.014 -16.7±1.2 27 9
NP37 3:1 PLGA7 PVA 0,5 EA 1:10 15 15 239±2 0.164±0.032 -9.1±0.3 11 65
NP38 2:1 PLGA24 Tween 80 1 DMSO 1:10 35 10 178±2 0.226±0.035 -13.3±2.5 15 29
NP39 1:1 PLGA30 PVA 2 DCM 1:10 70 5 221±2 0.164±0.003 -13.5±1.9 8 29
NP40 1:1 PLGA30 PVA 2 EA 1:1 70 15 118±3 0.187±0.013 -8.1±0.9 35 25
NP41 3:1 PLGA7 Pluronic 2 DCM 1:10 15 15 418±5 0.468±0.022 -11.4±4.1 32 38
NP42 3:1 PLGA30 Pluronic 0,5 DCM 1:1 15 5 337±4 0.144±0.006 -21.3±1.1 37 55
NP43 2:1 PLGA24 Tween 80 1 DMSO 1:5 35 10 242±2 0.238±0.011 -20.1±0.9 43 44
NP44 3:1 PLGA30 Pluronic 2 EA 1:10 70 5 315±3 0.473±0.018 -16.4±0.4 35 36
NP45 2:1 PLGA24 Tween 80 1 DMSO 1:5 35 5 175±2 0.184±0.023 -20.2±0.6 52 23
NP46 3:1 PLGA30 PVA 0,5 DCM 1:10 70 15 216±3 0.155±0.046 -9.7±1.1 36 52
1 2 3 4 5 6 7 8 9 10 11 12 13 14
NP47 3:1 PLGA30 Pluronic 2 DCM 1:1 70 15 327±2 0.271±0.007 -3.4±1.4 66 35
NP48 1:1 PLGA7 PVA 0,5 DCM 1:10 70 5 162±2 0.288±0.016 -16.7±5.6 30 8
NP49 2:1 PLGA24 Tween 80 1 DMSO 1:5 15 10 225±3 0.205±0.018 -15.7±1.6 32 27
NP50 2:1 PLGA24 Tween 80 1 DCM 1:5 35 10 354±4 0.416±0.023 -19.9±1.5 34 43
NP51 2:1 PLGA30 Tween 80 1 DMSO 1:5 35 10 220±2 0.175±0.018 -24.5±1.1 39 37
NP52 1:1 PLGA30 PVA 0,5 DCM 1:10 15 5 209±3 0.212±0.024 -16.9±0.6 25 49
NP53 2:1 PLGA24 Tween 80 0,5 DMSO 1:5 35 10 323±4 0.248±0.017 -16.1±4.7 45 45
NP54 3:1 PLGA7 PVA 2 DCM 1:1 70 15 302±5 0.166±0.05 -15.0±2.1 34 59
NP55 1:1 PLGA30 PVA 0,5 EA 1:10 70 15 163±3 0.234±0.08 -17.1±1.1 16 22
NP56 1:1 PLGA7 Pluronic 2 DCM 1:1 15 5 257±2 0.176±0.02 -17.8±2.1 50 20,6
NP57 2:1 PLGA24 Pluronic 1 DMSO 1:5 35 10 197±4 0.212±0.03 -15.6±4.6 49 55
NP58 3:1 PLGA30 Pluronic 0,5 EA 1:10 15 15 373±3 0.479±0.05 -24.5±2.3 6 20
NP59 2:1 PLGA24 Tween 80 1 DMSO 1:5 35 10 225±3 0.207±0.03 -22.4±2.9 44 30
NP60 1:1 PLGA30 PVA 0,5 DCM 1:1 15 15 311±3 0.15±0.05 -18.2±1.6 63 67
Table 3. ANOVA results for mean NPs size and drug loading degree.
Response Source Sum of Squares Degree of Freedom Mean Square F-Value p-Value
Size Model 4.293E+05 44 9757.75 3.33 0.0071 significant
Pure error 4664.39 5 932.88
Residual 43955.54 15 2930.37
Lack of fit 39291.15 10 3929.11 4.21 0.0630
Cor total 4.733E+05 59
Drug loading Model 15793.89 36 438.72 8.98 < 0.0001 significant
PureError 100.33 5 20.07
Residual 1124.08 23 48.87
LackofFit 1023.75 18 56.88 2.83 0.1263
CorTotal 16917.98 59
Table 4. Limitations on independent variables and outcomes.
Name Goal Lower Limit Upper Limit
PLGA:RIF ratio Is in range 1:1 1:3
PLGA type Is in range 7 000-17 000 30 000-60 000
Type of surfactant Is in range PVA Tween80
Organic solvent Is equal to DCM DCM EA
Homogenization power Is equal to 70 W 15W 70W
Homogenization time Is in range 5 min 15 min
Organic and aqueous phase ratio Is equal to 1:1 1:1 1:10
Size minimize 93,4 451,8
Drug loading maximize 4 88,2
Table 5. Predicted and experimental results for PLGA-RIF nanoparticles.
Size, nm PDI Zeta potencial, mV Encapsulation efficiency, % Drug loading, % Yield, %
Predicted 228 0,120 -24 93 70 45
Experimental 223±2 0,110±0,01 -26±2 91±2 67±1 47±2
Error, % 2,2 8,3 8,3 2,2 4,3 4,4
Disclaimer/Publisher’s Note: The statements, opinions and data contained in all publications are solely those of the individual author(s) and contributor(s) and not of MDPI and/or the editor(s). MDPI and/or the editor(s) disclaim responsibility for any injury to people or property resulting from any ideas, methods, instructions or products referred to in the content.
Copyright: This open access article is published under a Creative Commons CC BY 4.0 license, which permit the free download, distribution, and reuse, provided that the author and preprint are cited in any reuse.
Prerpints.org logo

Preprints.org is a free preprint server supported by MDPI in Basel, Switzerland.

Subscribe

© 2024 MDPI (Basel, Switzerland) unless otherwise stated