1. Introduction
Ulcerative colitis (UC) is a chronic inflammatory disease affecting the colon [
1,
2]. It manifests clinically as ulcerative lesions in the colon [
3], with mucosal and submucosal edema and continuous infiltration of inflammatory cells [
4]. Lesions typically develop in the sigmoid colon and gradually disseminate into the descending, transverse, and ascending colon as the condition progresses. Severe cases can involve the entire colon in a continuous distribution [
1,
5]. Symptoms include weight loss, changes in bowel habits, recurrent bloody diarrhea, and abdominal pain [
6]. Epidemiological data have revealed that UC is prevalent in developed regions, such as Europe and the United States, and that its incidence in China is increasing annually. Although the mortality rate of UC is low, long-term chronic inflammation increases the risk of colorectal cancer, other gastrointestinal diseases, infections, and respiratory diseases [
7,
8,
9]. The etiology and pathogenesis of UC remain unclear, resulting in a lack of treatment options, although newly developed drugs have brought relief to some patients with UC. Studying the pathogenesis of UC may provide a theoretical basis for the development of novel therapeutic strategies.
Damage to the colonic mucosa results in the immediate recruitment and activation of polymorphonuclear neutrophils (PMNs). Activated PMNs secrete reactive oxygen species (ROS) and inflammatory factors, inducing further tissue damage [
10], which often presents as acute ulcers. The average lifespan of PMNs following tissue infiltration is 24–48 h. However, production of inflammatory factors such as tumor necrosis factor (TNF)-α, interleukin (IL)-8, and IL-1 in the colon leads to the continuous recruitment and activation of PMNs. This results in the main pathological feature of UC: chronic ulcerative damage to the colonic mucosa. Previous studies have confirmed the uncontrolled accumulation and persistence of PMNs in damaged mucosal lamina propria [
11]. A vicious cycle is formed, in which infiltrating PMNs damage the mucosa, which in turn leads to further PMN infiltration. This is the foundation of the development of clinicopathological changes in patients with UC. Therefore, some scholars regard the degree of neutrophil infiltration in the lamina propria of the intestinal mucosa, the degree of accumulation in the crypt, the destruction of the crypt, and the formation of crypt abscesses as morphological markers and severity indicators of active UC [
12,
13,
14,
15].
PMNs constitute the first line of immune defense, with their primary role involving phagocytosis of pathogenic microorganisms. Inside PMNs, phagosomes are fused with intracellular lysosomes to form phagocytic lysosomes, which kill and degrade encapsulated pathogens using lysosomal enzymes. This method does not result in tissue damage; however, it is limited by the number of PMNs available. PMNs can also kill pathogenic microorganisms by releasing antimicrobial factors, including granular enzymes, ROS, and neutrophil elastase (ELANE). Cui et al. [
16] showed that PMNs release a large amount of granular proteins and ELANE into the extracellular space, inducing tumor cell apoptosis. ELANE exists only in neutrophils and can hydrolyze fibronectin, proteoglycans, type IV collagen, and extracellular matrix proteins, causing tissue damage, prolonging the inflammatory response time, and preventing wound healing. However, the various enzymes released are rapidly diluted by the large amount of exudate in the inflamed area, decreasing their effectiveness, and they subsequently undergo rapid and complete neutralization by anti-proteases. Neither phagocytosis nor the secretion of antimicrobial factors can explain the relationship between infiltrating PMNs and inflammation. However, another PMN mechanism of action has been identified. PMNs release neutrophil extracellular traps (NETs), a DNA network fiber structure that combines various proteins such as histones, ELANE, and myeloperoxidase (MPO), maintaining them at high concentrations at the inflammatory site to resist neutralization. The DNA network fiber structure also entraps pathogenic microorganisms, exerting a powerful killing effect but also causing severe tissue damage, playing a key role in the development of UC [
17,
18,
19,
20].
We have previously demonstrated that BEPD exerts a therapeutic effect on UC by inhibiting PMN infiltration and the release of pro-inflammatory cytokines. In this study, we investigated the impact of BEPD on PMNs and NETs, to determine whether this mechanism underlies the therapeutic effect of BEPD on UC.
2. Results
2.1. Main Components of BEPD
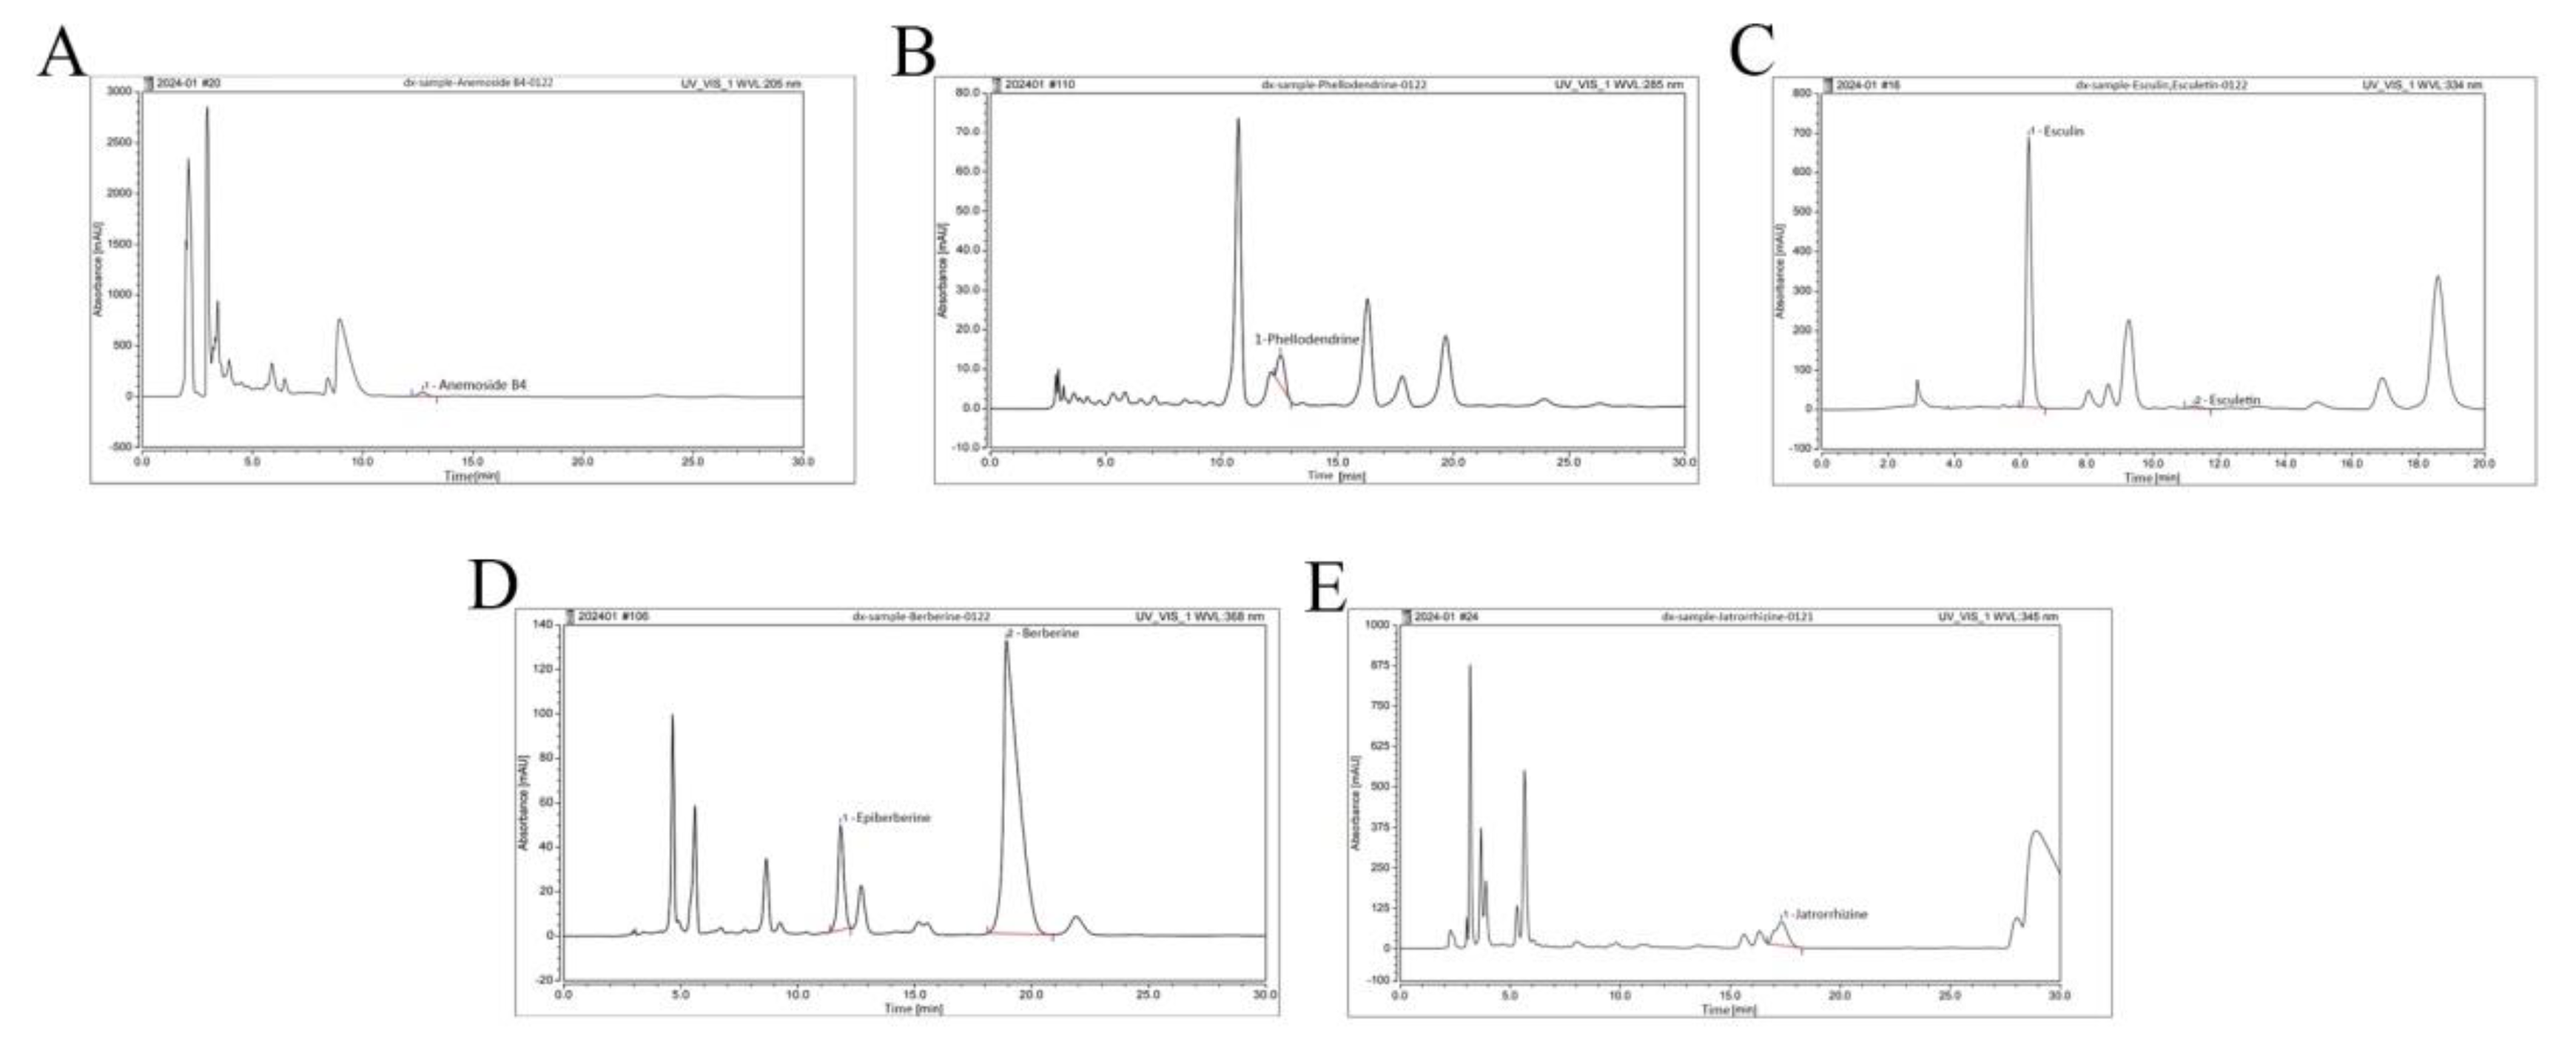
We examined BEPD using HPLC (
Figure 1). The retention times, peak areas, and contents are listed in
Table 4. Among these constituents, anemoside B4, berberine and esuclin were the most abundant.
2.2. BEPD Significantly Improves the General Condition and DAI Scores of Mice with UC
The UC mouse model was successfully established. Compared with control mice, model group mice began to lose weight on day 4 (
Figure 2A), developing loose and then bloody stools. These changes occurred alongside increased DAI scores (
P<0.05) (
Figure 2B). From day 9, the trend of weight loss slowed, consistent with the self-healing characteristics of DSS-induced UC [
21], but weight loss continued until the end of the experiment. The weight of all treated mice began to increase and the DAI score began to decrease from the second day of treatment. By the third day of treatment, there was a significant difference between the treatment and model groups (
P<0.05). At the end of the experiment, the DAI score in the BEPD-H group was significantly lower than that in the BEPD-M, BEPD-L, and Mes groups, indicating superior treatment efficacy (
P<0.05). The effect in the Mes group was greater than that in the BEPD-M and BEPD-L groups.
2.3. Impact of BEPD on UC Lesions
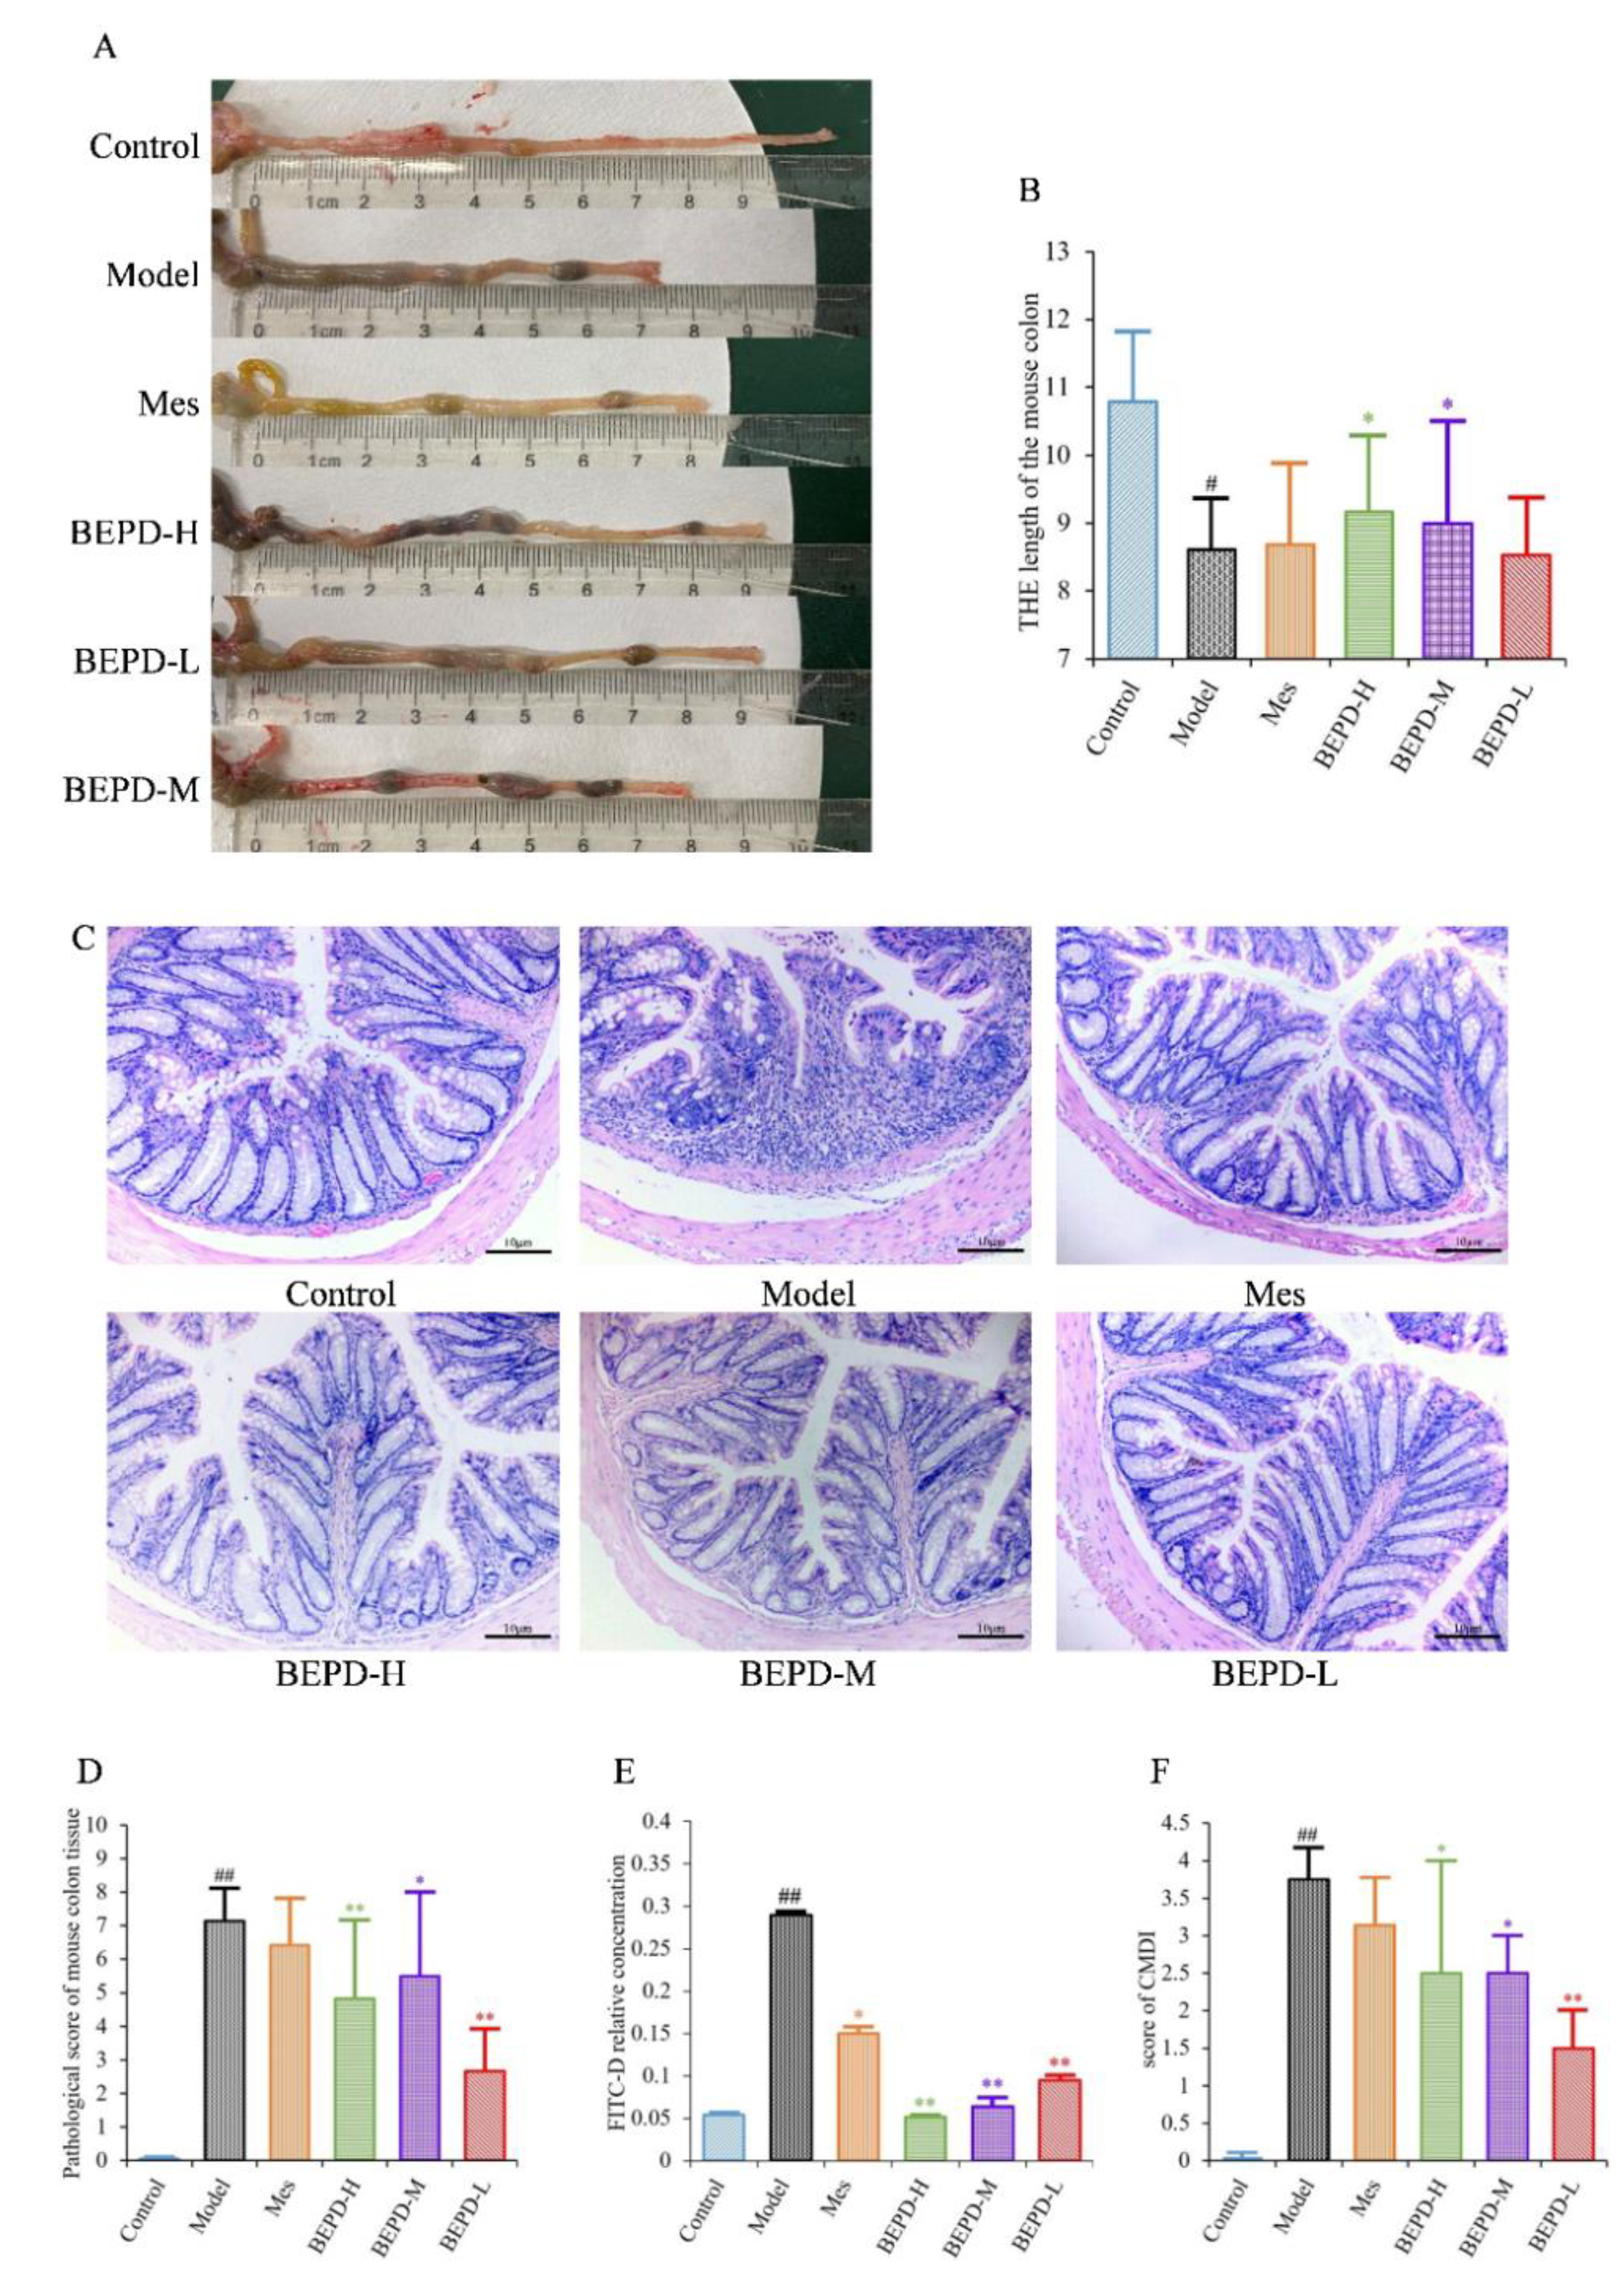
UC is accompanied by the formation of chronic ulcers in the colonic mucosa, as well as changes in colon length and histopathological and CMDI scores. Compared with control mice, model mice had significantly shorter colons (
P<0.01). After one week of treatment, the colon length of the Mes and BEPD-L groups did not differ significantly compared with the model group, whereas the BEPD-H and BEPD-M groups showed a significant recovery in colon length (
P<0.05), with the greatest effect in the BEPD-H group (
Figure 3A,B).
HE staining of colon tissue revealed that, compared to control group mice, model group mice exhibited obvious signs of colonic mucosal edema, erosion, ulceration, mucosal layer damage, and inflammatory cell infiltration (
Figure 3C), with higher histopathological (
Figure 3D) and CMDI scores (
P<0.01) (
Figure 3F). Colonic mucosal edema, erosion, ulceration, mucosal layer damage, and inflammatory cell infiltration were reduced in all treated mice compared with model mice, and histopathological and CMDI scores decreased. However, there were no significant differences between the Mes and model groups, whereas there were significant differences between all BEPD treatment groups and the model group.
Colonic mucosal permeability was significantly increased in model group mice, consistent with the mucosal damage observed with HE staining (
Figure 3E). Mice treated with Mes (
P<0.05) or BEPD (
P<0.01) showed a decrease in colonic mucosal permeability, with the effect of BEPD significantly greater than that of Mes (
P<0.05). BEPD exhibited a dose-dependent effect, with BEPD-H having the greatest impact.
2.4. Effects of BEPD on Cytokine Production
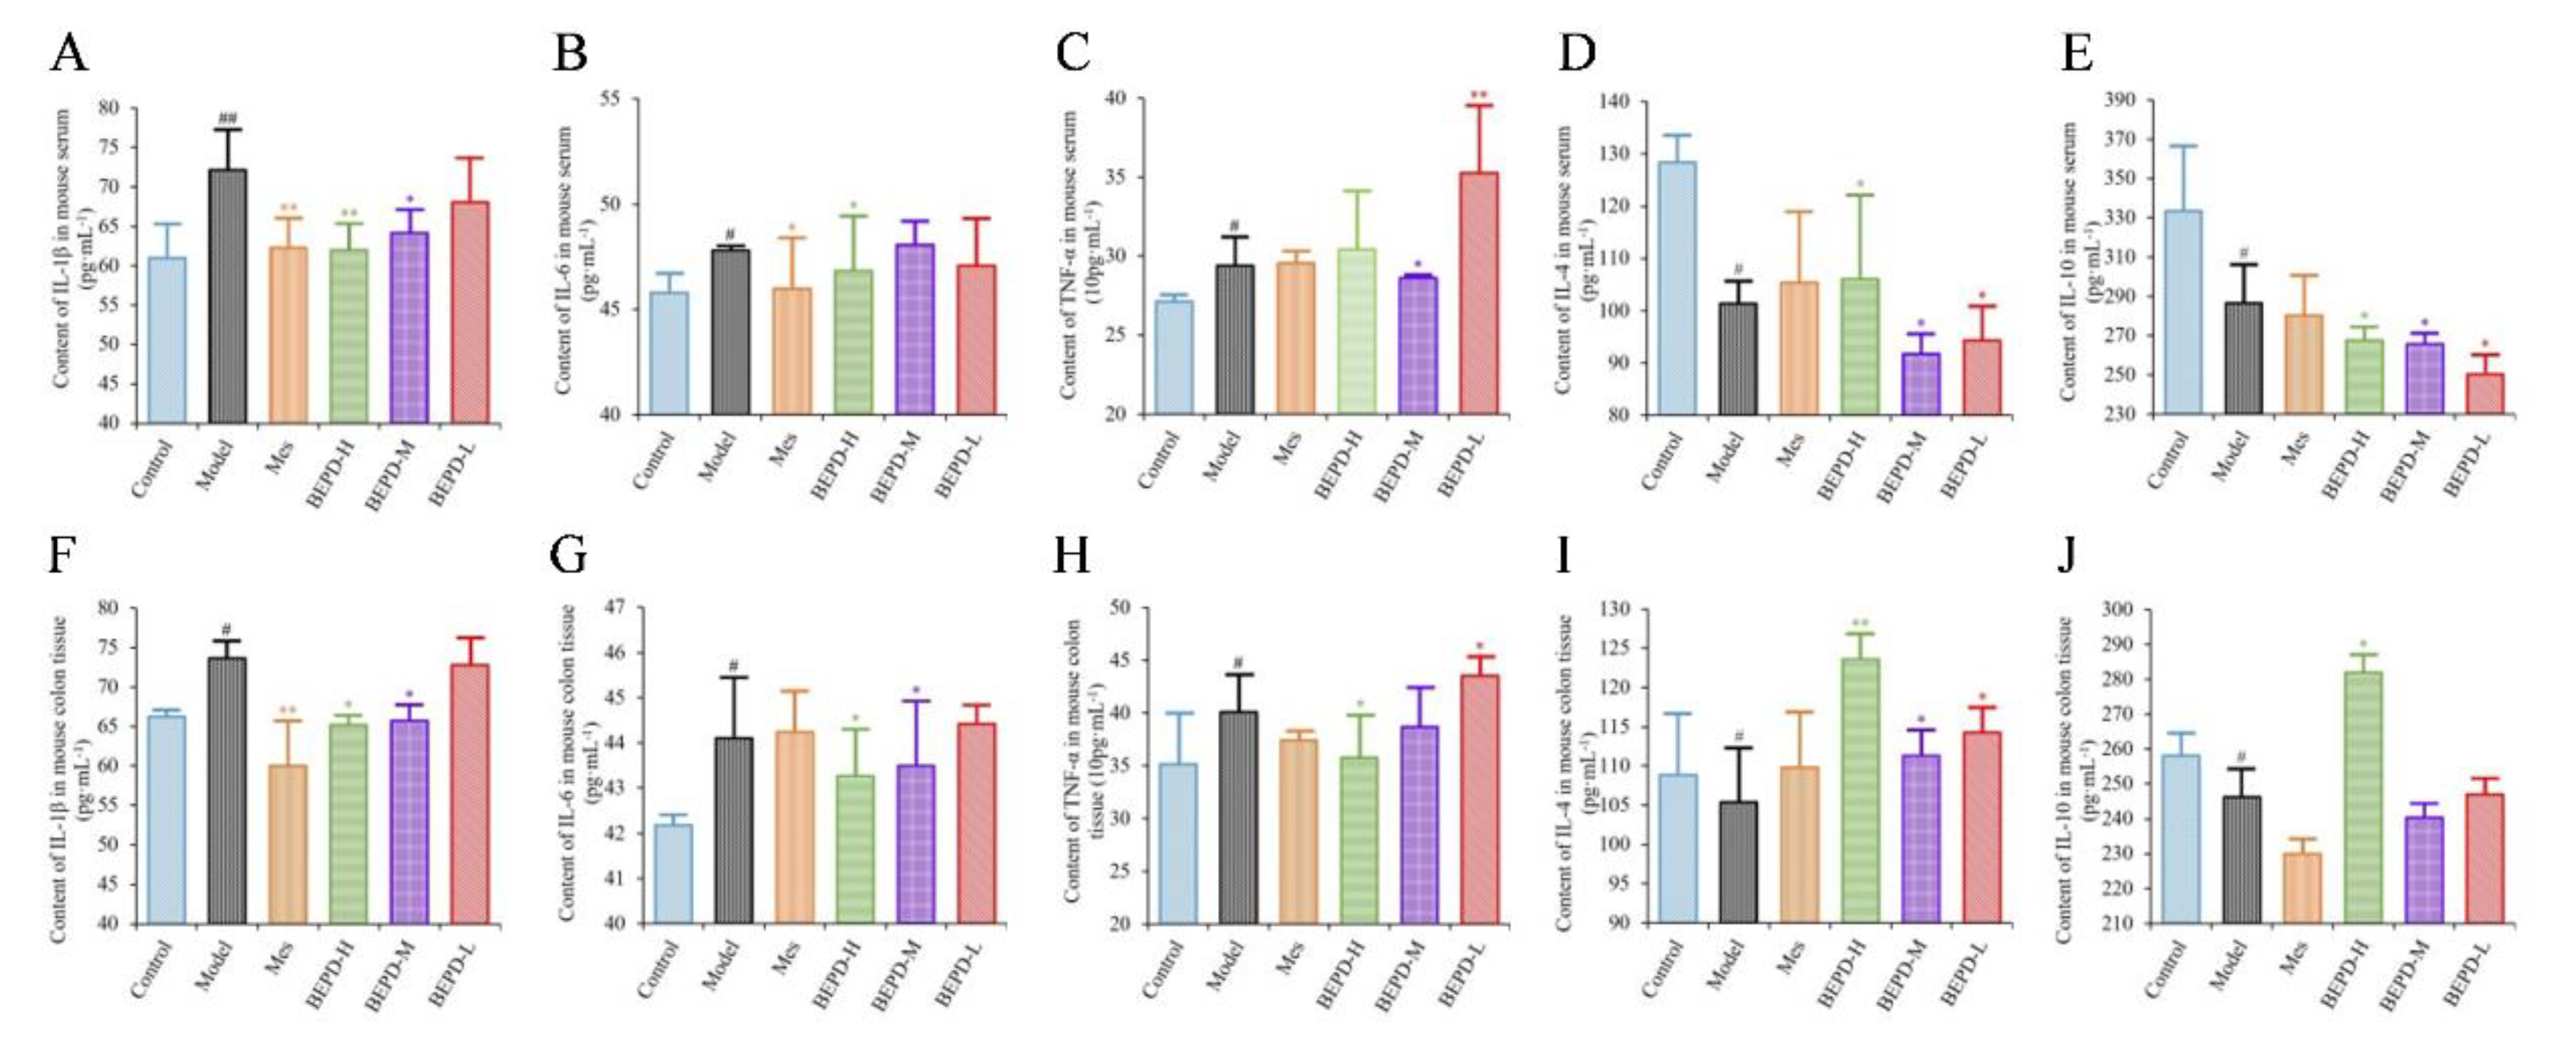
ELISA results showed that the levels of pro-inflammatory cytokines (IL-1β, IL-6, and TNF-α) were significantly increased in the colon tissues and serum of model mice, whereas the levels of anti-inflammatory cytokines (IL-4 and IL-10) were decreased, consistent with the disease manifestations of UC. In mice treated with Mes, IL-1β levels in the colon tissues and serum (
P<0.01), IL-6 levels in the serum, and TNF-α levels in colon tissues decreased (
P<0.05), while IL-10 levels decreased (
P<0.05) and IL-4 levels increased (
P<0.05). This suggests that Mes mainly exerts its therapeutic effect on UC through effects on IL-1β and IL-4. BEPD-H group mice showed a significant decreases in the levels of IL-1β, IL-6, and TNF-α in the colon tissues (
P<0.05), which returned to the levels seen in control mice. Serum TNF-α levels did not differ significantly between BEPD and model group mice. However, anti-inflammatory cytokine levels in colon tissues increased significantly in BEPD group mice, exceeding the levels seen in control mice (
P<0.05) (
Figure 4). This indicates that BEPD plays a therapeutic role in UC by inhibiting the release of pro-inflammatory cytokines and promoting the release of anti-inflammatory cytokines in colon tissues to alleviate the inflammatory response.
2.5. Effects of BEPD on Chemokine Production and PMN Infiltration and Activation
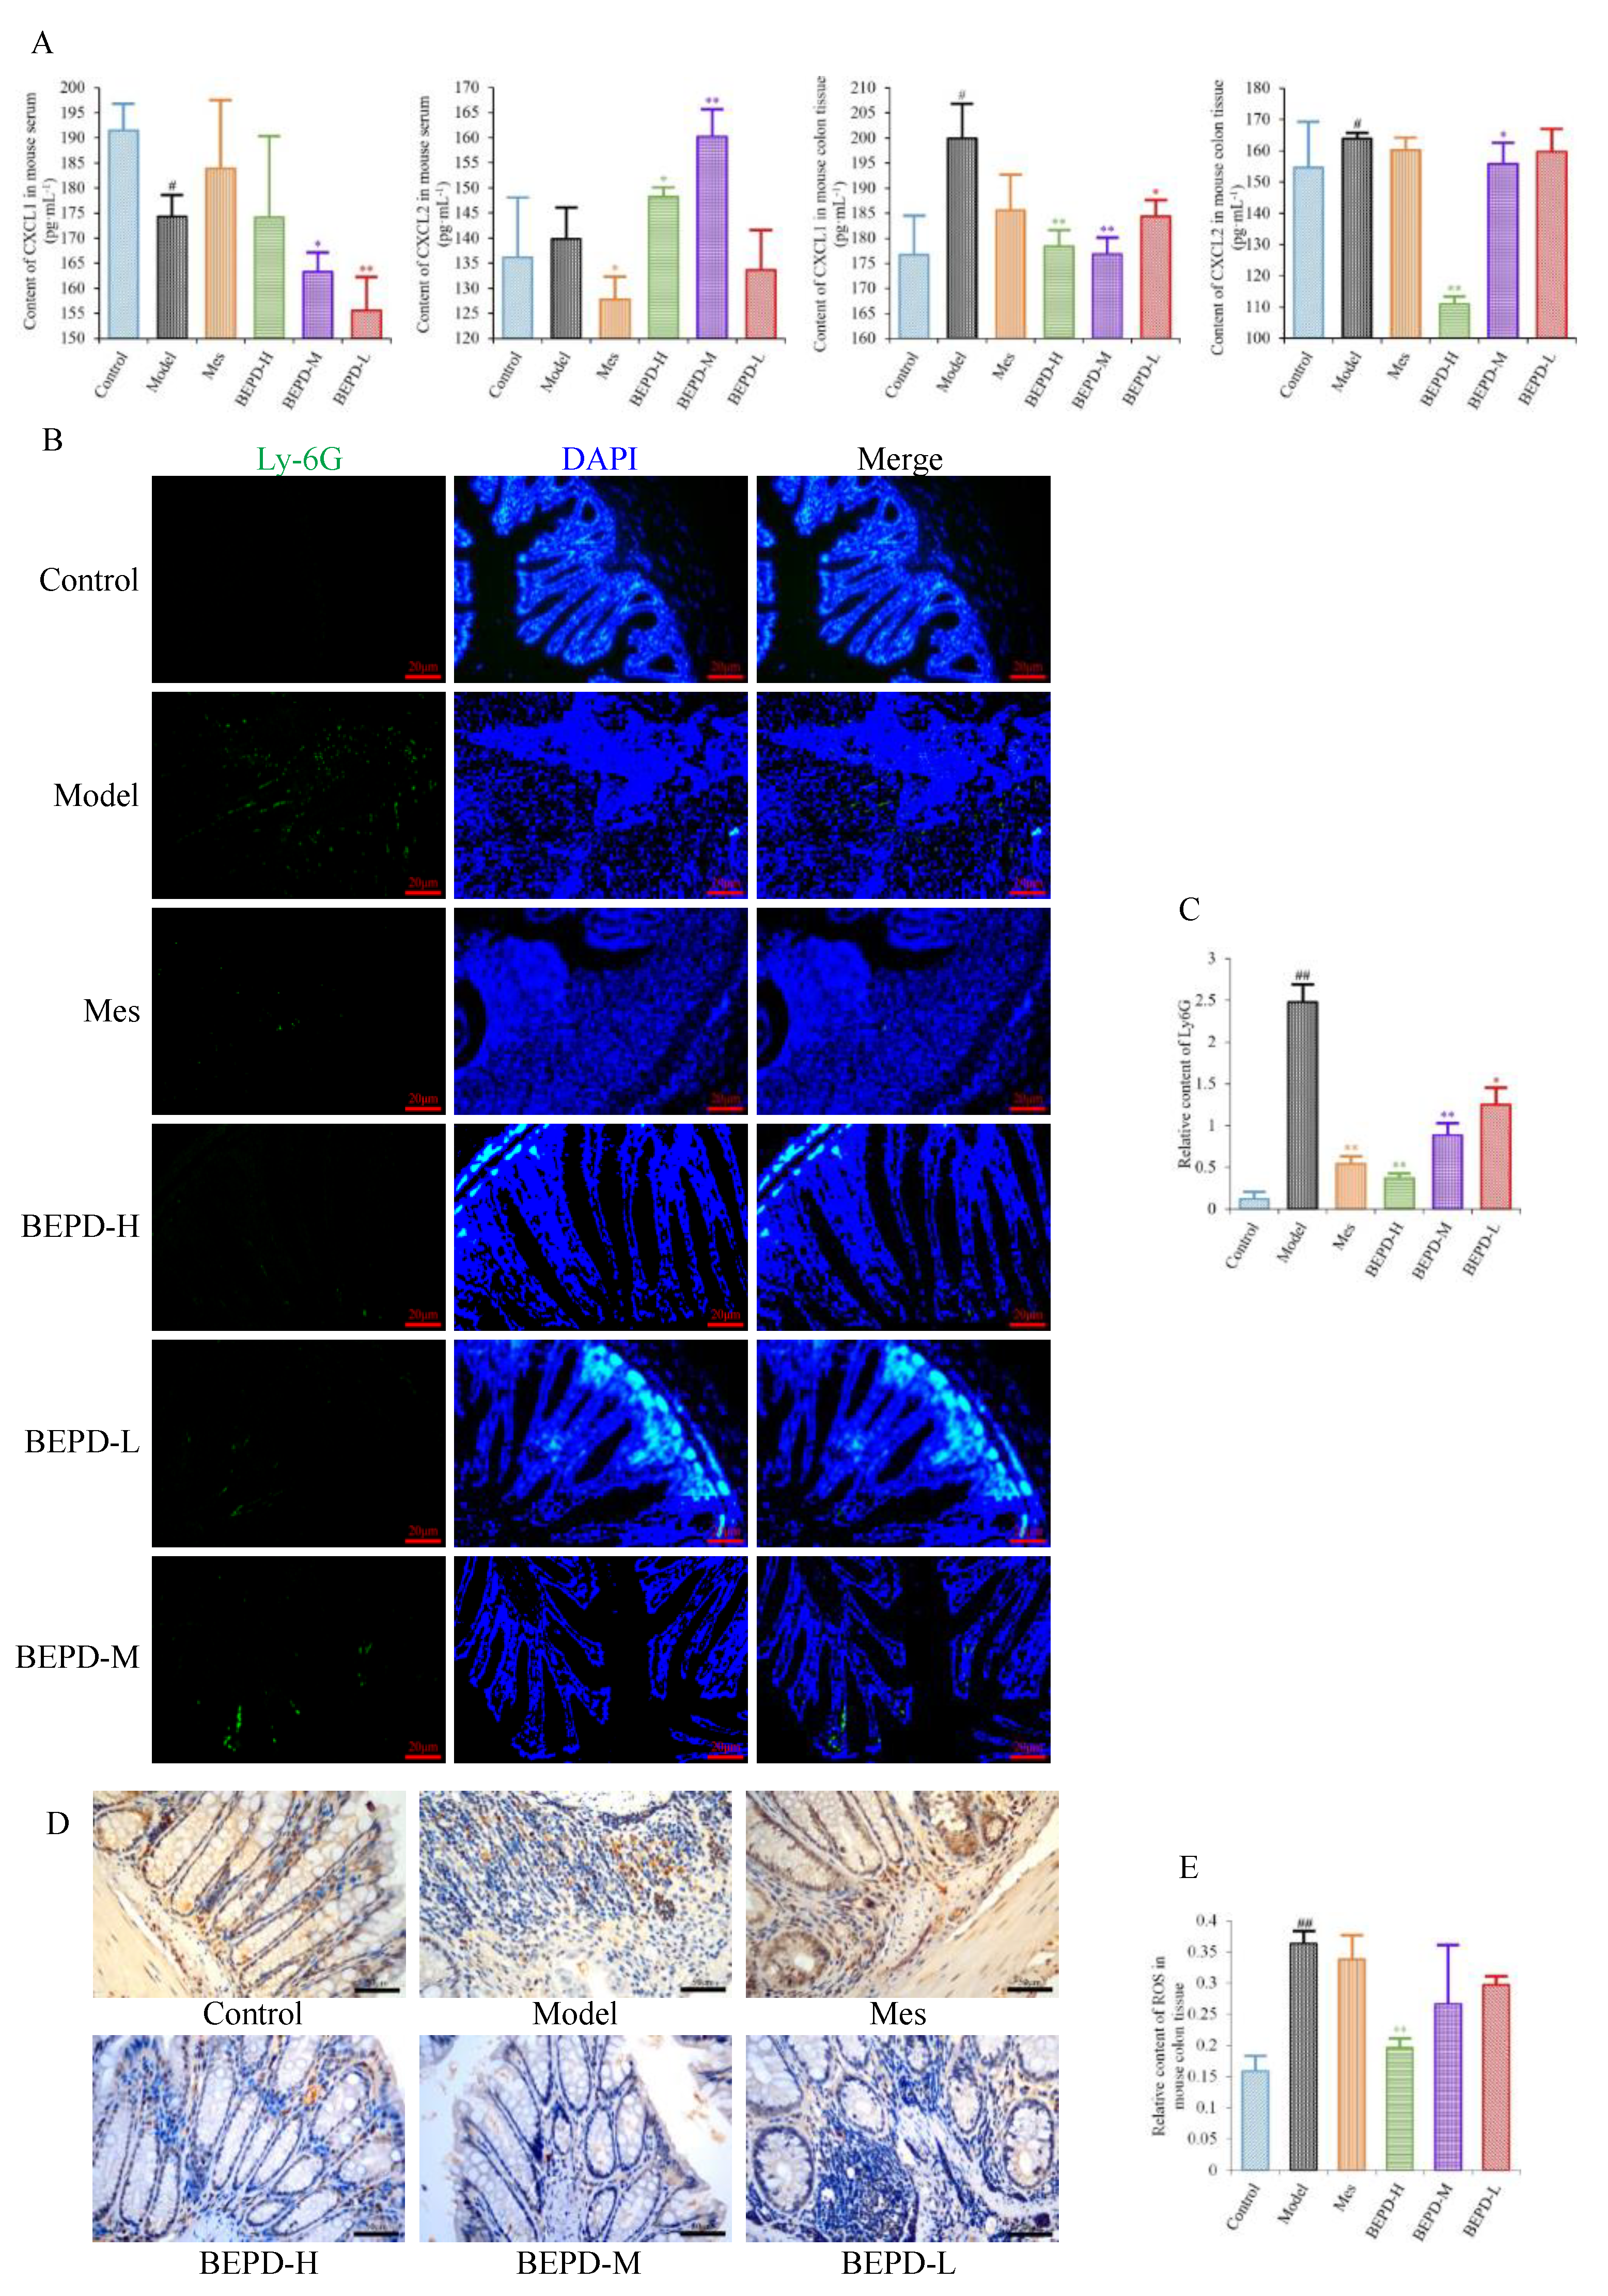
Since PMNs play an important role in the development of UC, it has been speculated that BEPD has therapeutic effects on PMNs in UC. We therefore analyzed the effect of BEPD on PMNs. Levels of the PMN chemokines CXCL1 and CXCL2 were decreased in colon tissues of all treated mice compared with model mice, especially those treated with high- and medium-dose BEPD (
P<0.01) (
Figure 5A).
Immunofluorescence staining of Ly6G, a PMN-specific marker, revealed large numbers of infiltrating PMNs in the colonic mucosa of model mice (
P<0.01), which were reduced to varying degrees by treatment (
P<0.01) (
Figure 5B,C). BEPD treatment showed a certain dose-dependent manner; BEPD-H was more effective at reducing PMN infiltration than Mes (
P<0.05).
PMN activation was evaluated by staining for ROS. ROS cytoplasmic staining significantly increased in the colon tissues of model mice (
P<0.01), and decreased in all treated mice (
P<0.05), with BEPD-H treatment showing the most significant effect (
P<0.01), and BEPD-M and BEPD-L treatment showing similar effects to Mes (
Figure 5D,E). These results indicate that the effects of BEPD on UC are related to the infiltration and activation of PMNs.
2.6. Effects of BEPD on the Formation and Release of NETs
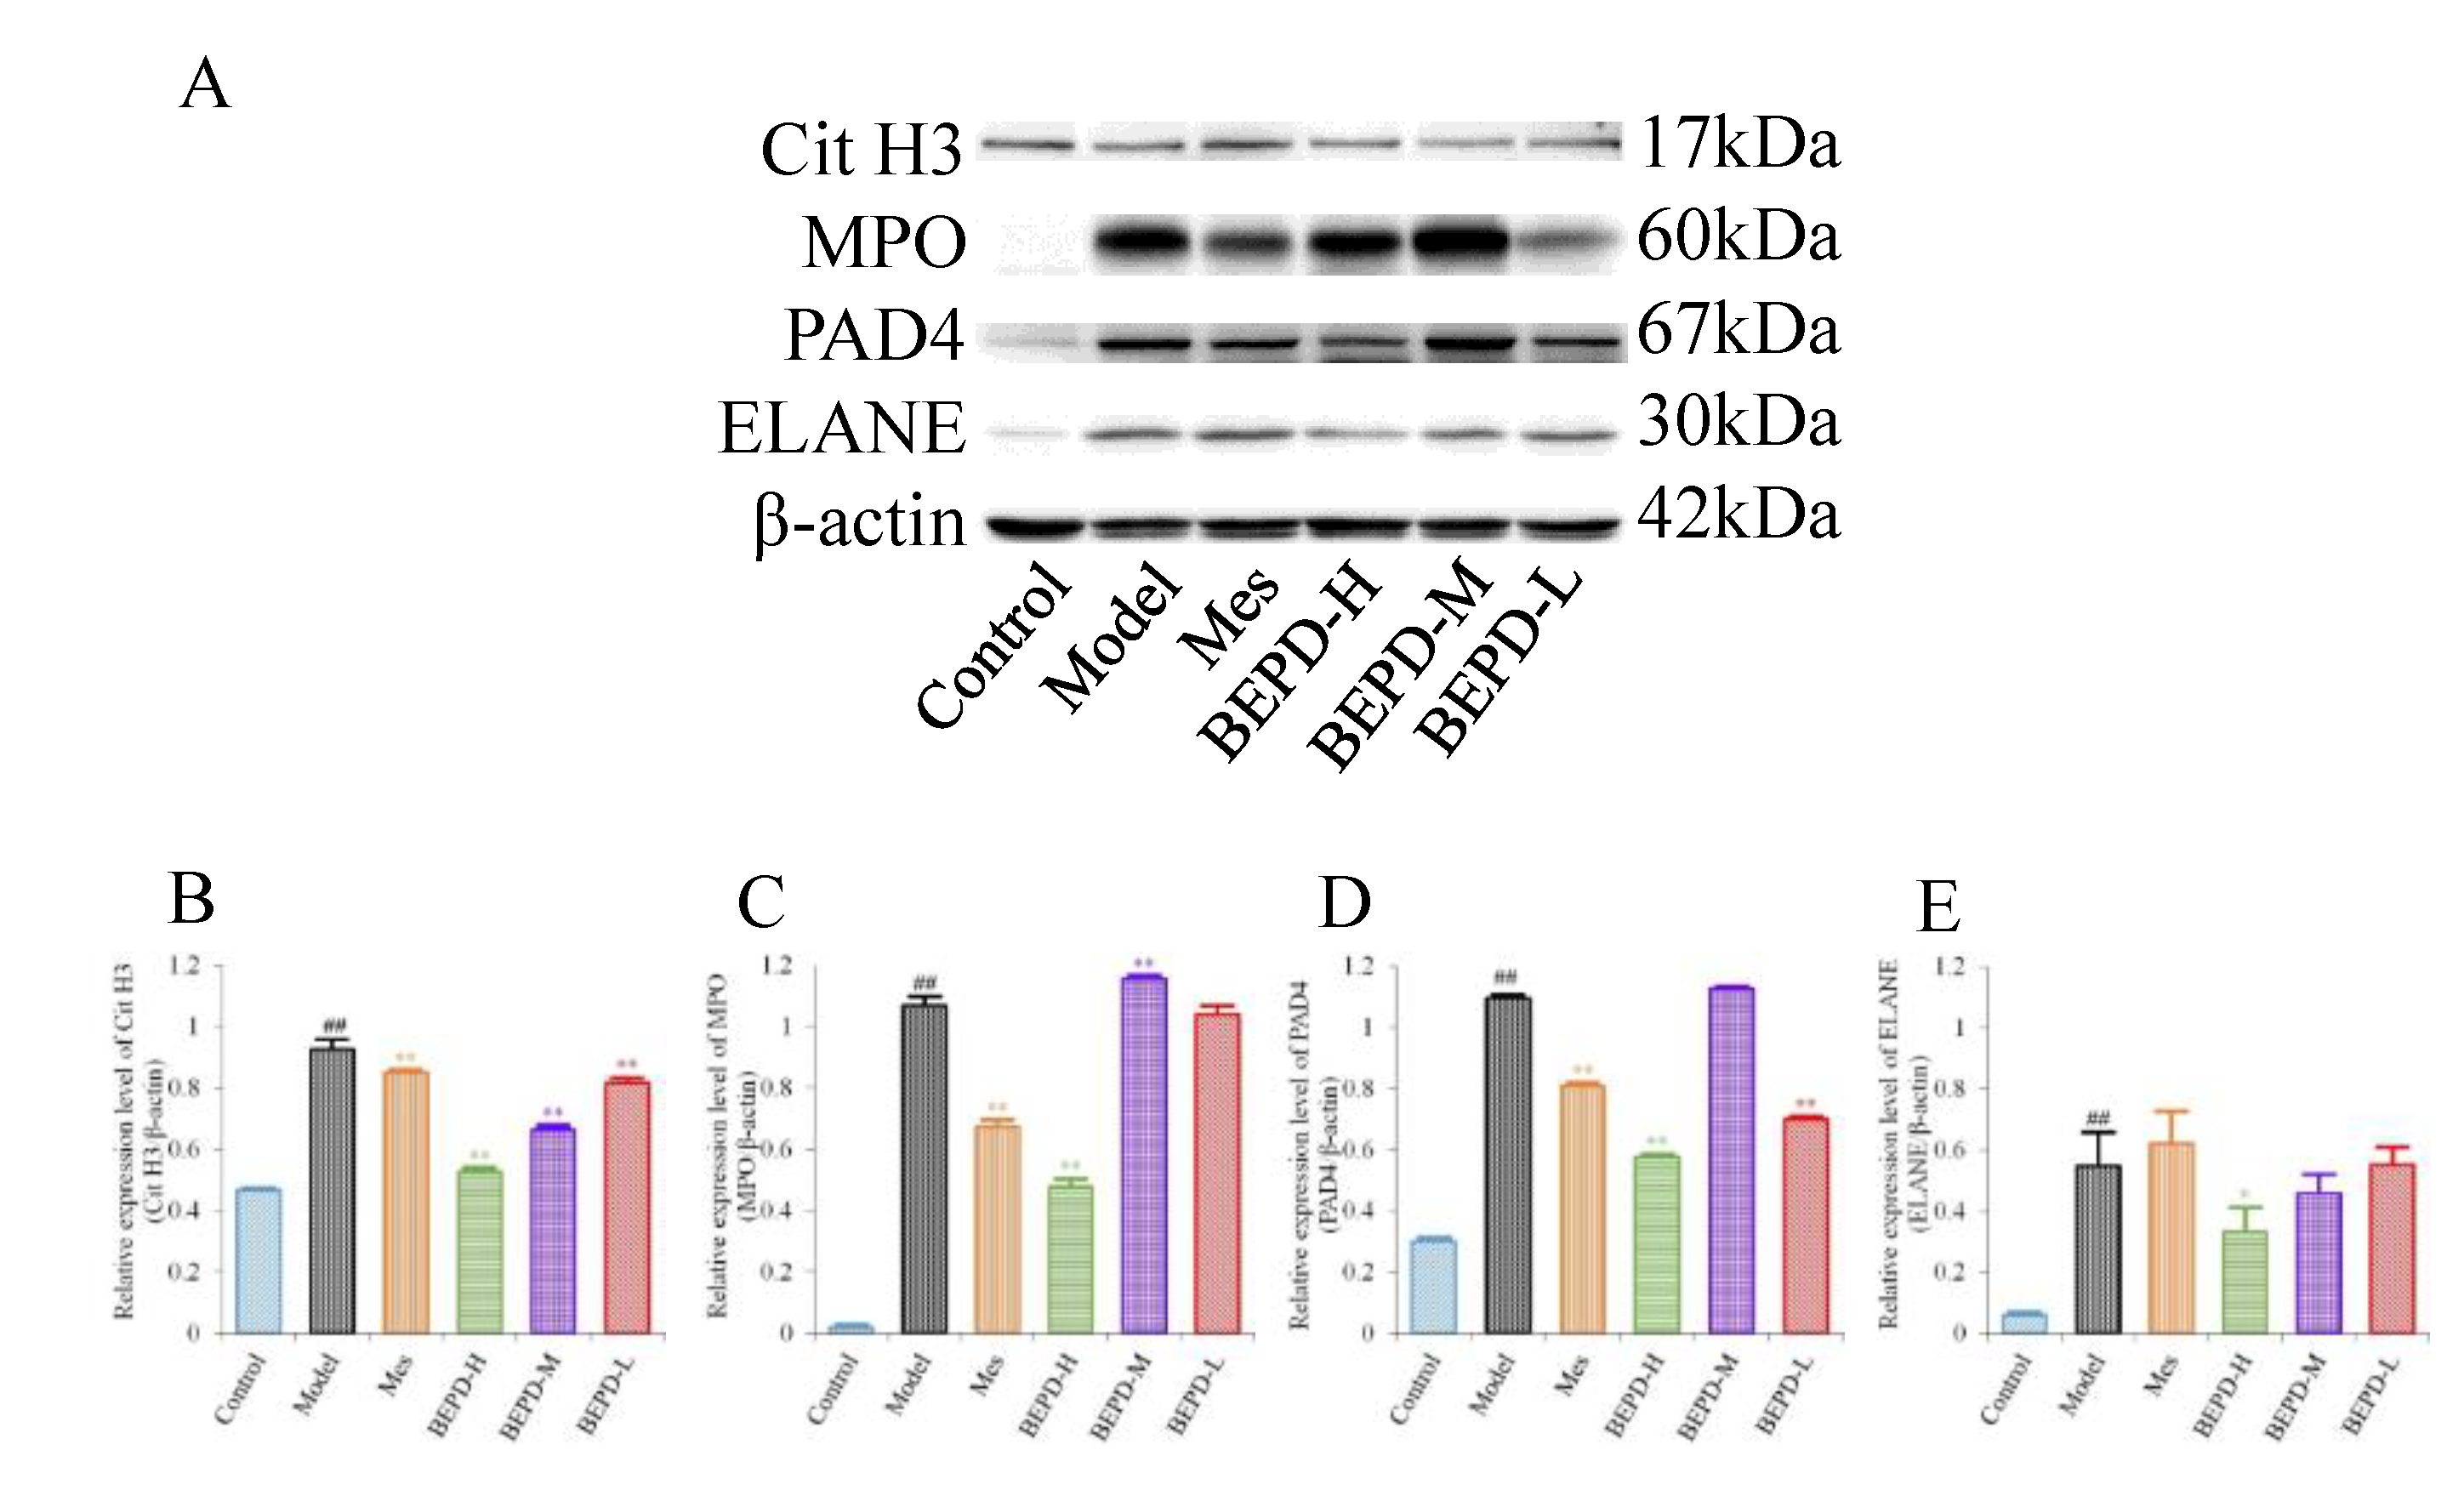
Western blotting showed that, compared with control mice, the expression levels of key proteins involved in NET formation (PAD4, ELANE, MPO, and Cit H3) were significantly increased in the colonic mucosa of model mice (
P<0.01). Treatment partially reversed these changes. In Mes group mice, the expression levels of PAD4, MPO, and Cit H3 decreased to varying degrees compared with those in model mice (
P<0.05), but remained significantly higher than those in control mice (
P<0.01). Mes showed no effect on the levels of ELANE. This indicates that although Mes can reduce the transcriptional and translational activities of ELANE, MPO, and PAD4 in model mice, chromatin decondensation is still active. Mice treated with high-dose BEPD showed a significant decrease in the expression levels of ELANE (
P<0.05), PAD4(
P<0.01), MPO(
P<0.01) and Cit H3(
P<0.01) compared with model and Mes group mice. ELANE and Cit H3 expression levels in the low-dose group were similar to those in the Mes treatment group, and in the medium-dose group were intermediate between those in the high- and low-dose groups; the expression levels of PAD4 and MPO did not differ from those in model mice (
Figure 6).
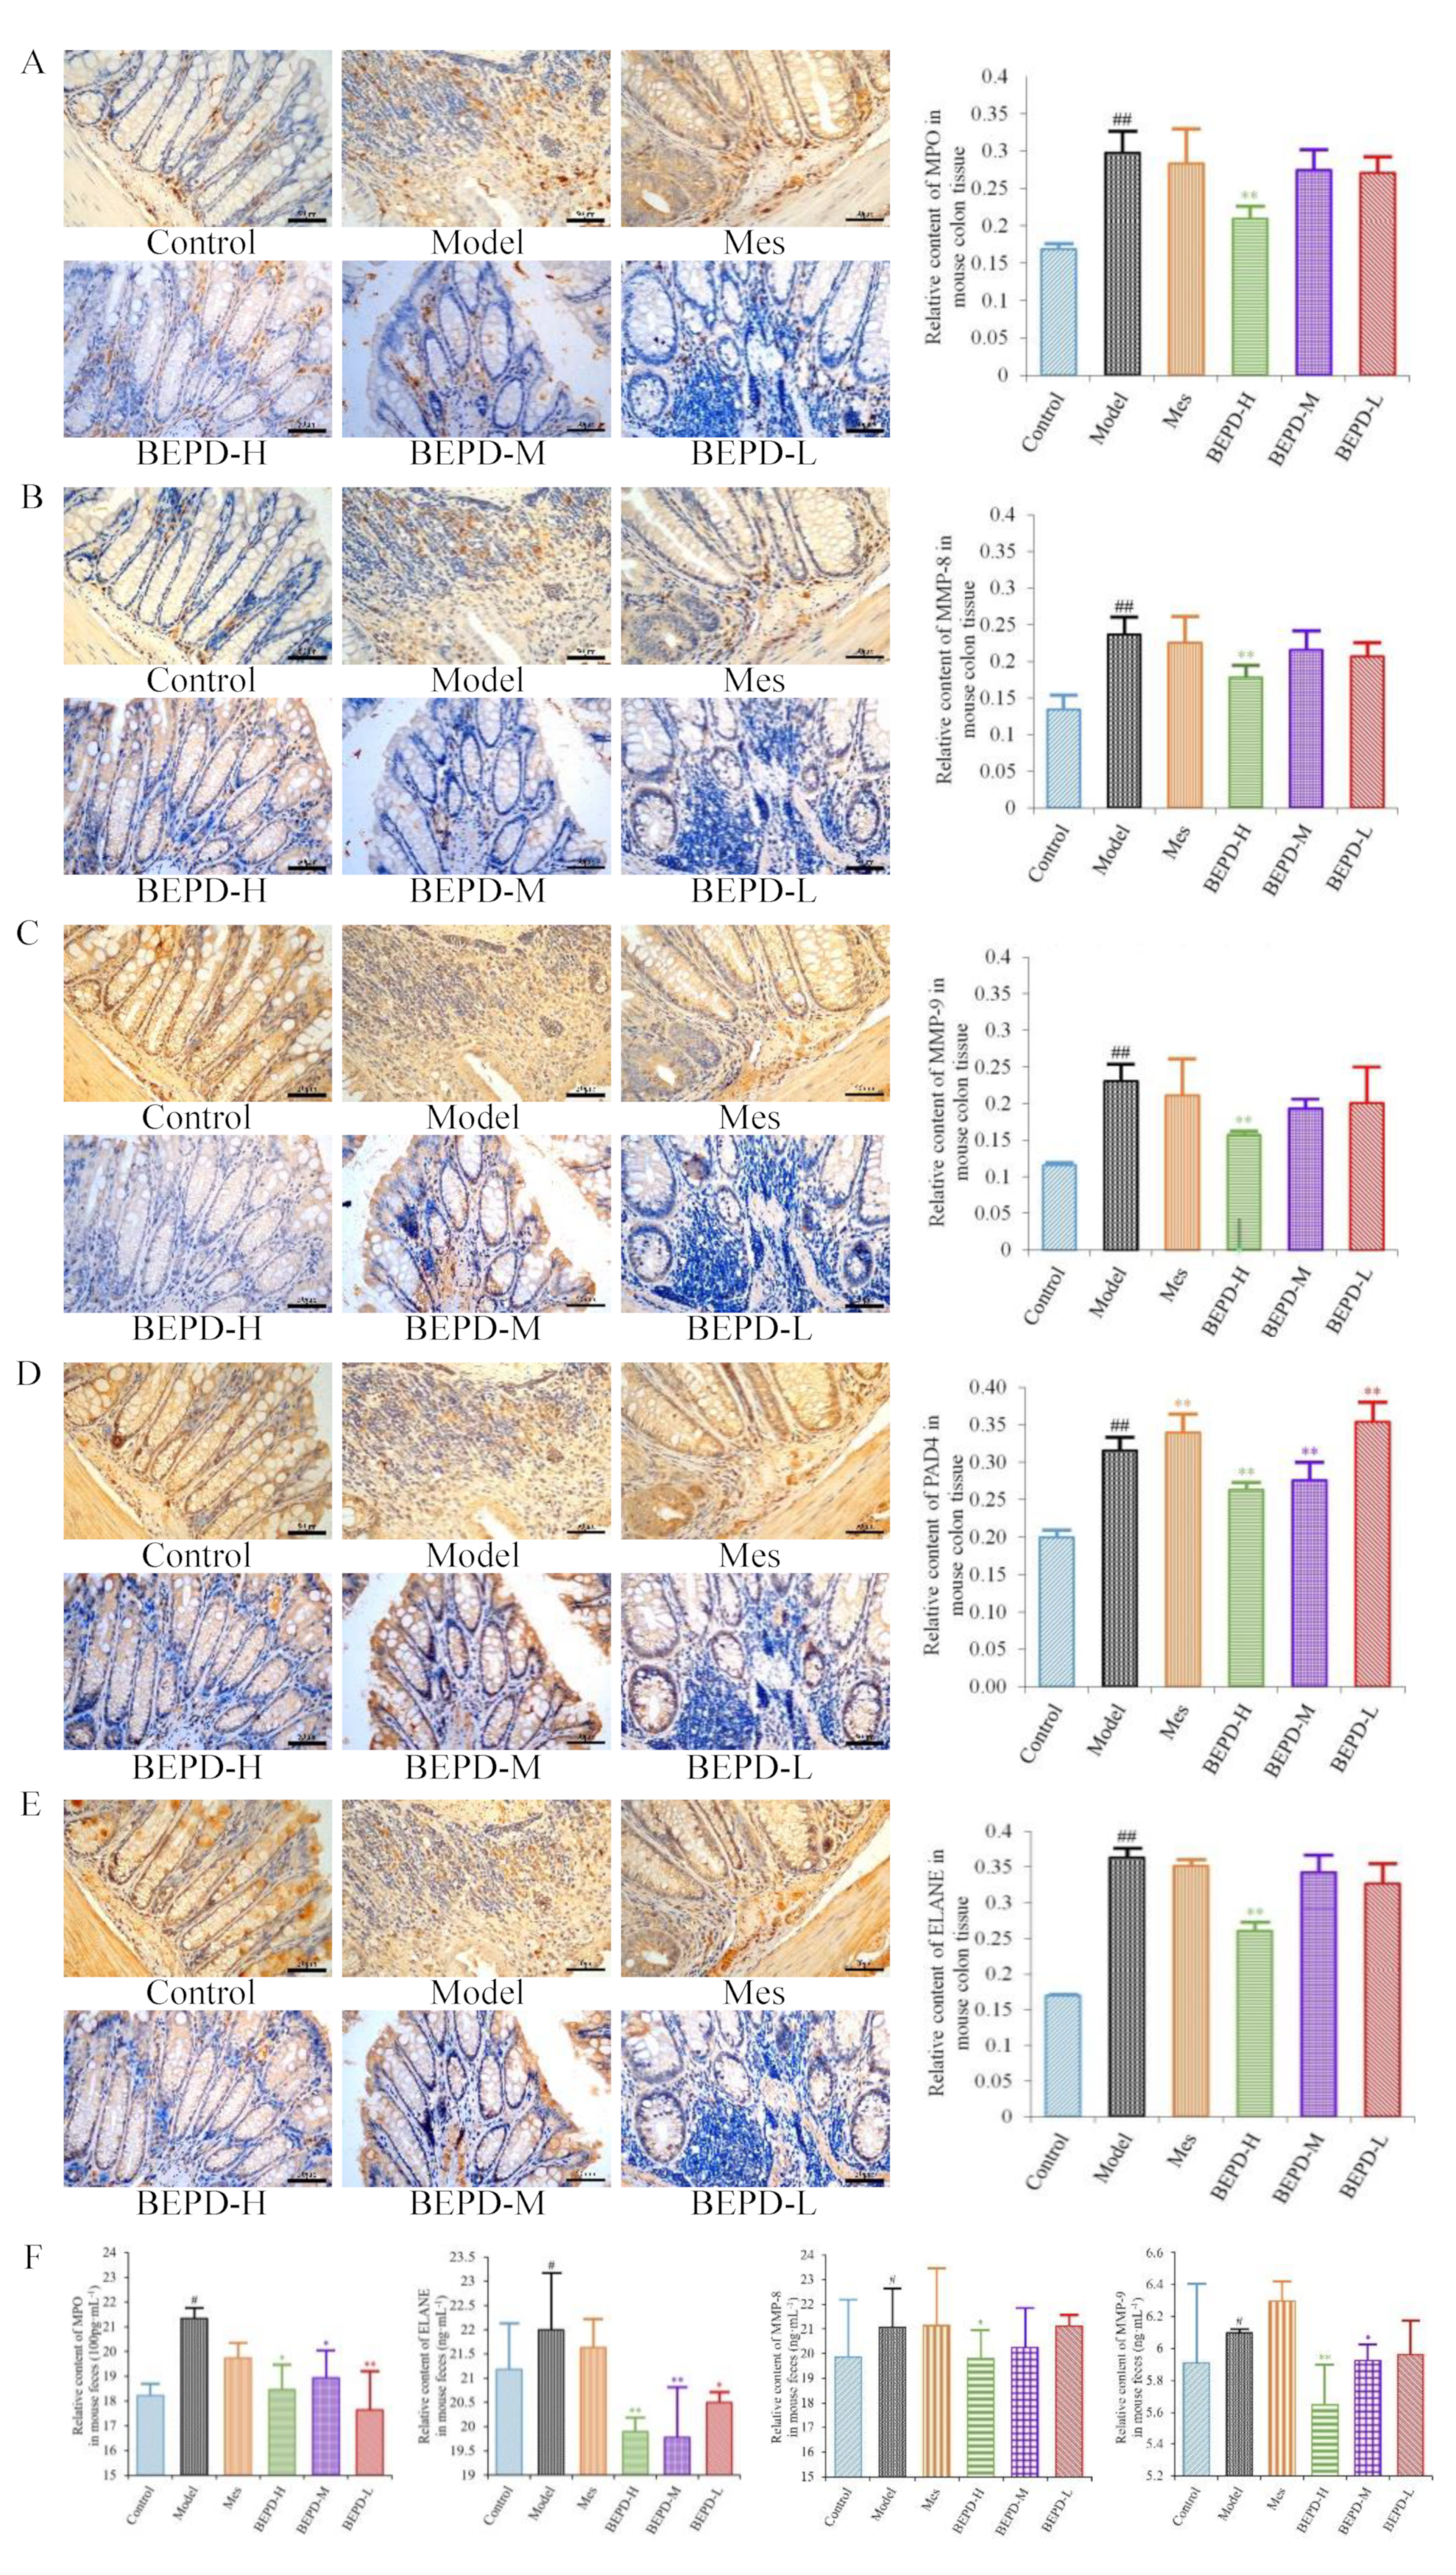
Immunohistochemistry showed that staining of these key proteins increased significantly in model mice, as did staining of the NET-associated components MMP-8 and -9 (
P<0.01). MMP-8 and -9 were expressed in the cytoplasm, while the key proteins involved in NETosis, PAD4, ELANE, and MPO, were expressed in both the cytoplasm and the nucleus (
Figure 7A–E), indicating the involvement of these proteins in NET formation. Compared with model mice, staining of MMP-8, MMP-9, PAD4, ELANE, and MPO decreased following BEPD-H treatment (
P <0.01). The high-dose group showed the most significant effect, indicating a dose-dependent response.
After NET formation, these proteins are released into the extracellular space and enter the intestinal cavity as a result of mucosal damage, eventually being excreted from the body in the feces. Therefore, we analyzed fecal samples to detect NET-associated proteins. Compared with control mice, the protein expression levels of MPO, ELANE, and MMP-8 and -9 increased significantly in the feces of model mice (
P<0.05) (
Figure 7F). The protein expression levels of ELANE and MPO decreased in Mes group mice compared with model mice (
P<0.05), while the expression level of MMP-9 increased slightly (
P<0.05). There was no difference in MMP-8 expression levels. This suggests that treatment of UC with Mes does not greatly impact NET formation. BEPD group mice showed significantly decreased protein expression levels of MPO (
P<0.05), ELANE (
P<0.01), and MMP-8 (
P<0.05) and -9(
P<0.01). compared with those in model and Mes group mice, with the high-dose group exhibiting the greatest effects. This indicates that BEPD may alleviate UC through effects on NET formation.
2.7. Effect of BEPD on Extracellular NET
The transcription and translation of ELANE, MPO, and PAD4 are enhanced, and PAD4 is activated and incorporated into the nucleus, in response to ROS, which degrades nucleosome histones and uncoils chromatin. Therefore, we speculated that there may be a correlation between the expression of ROS and Cit H3 during NET formation. A Pearson correlation analysis between the western blotting data of Cit H3 and the immunohistochemical quantitative data of ROS showed a strong correlation between ROS and Cit H3 (rs=0.989, P<0.001).
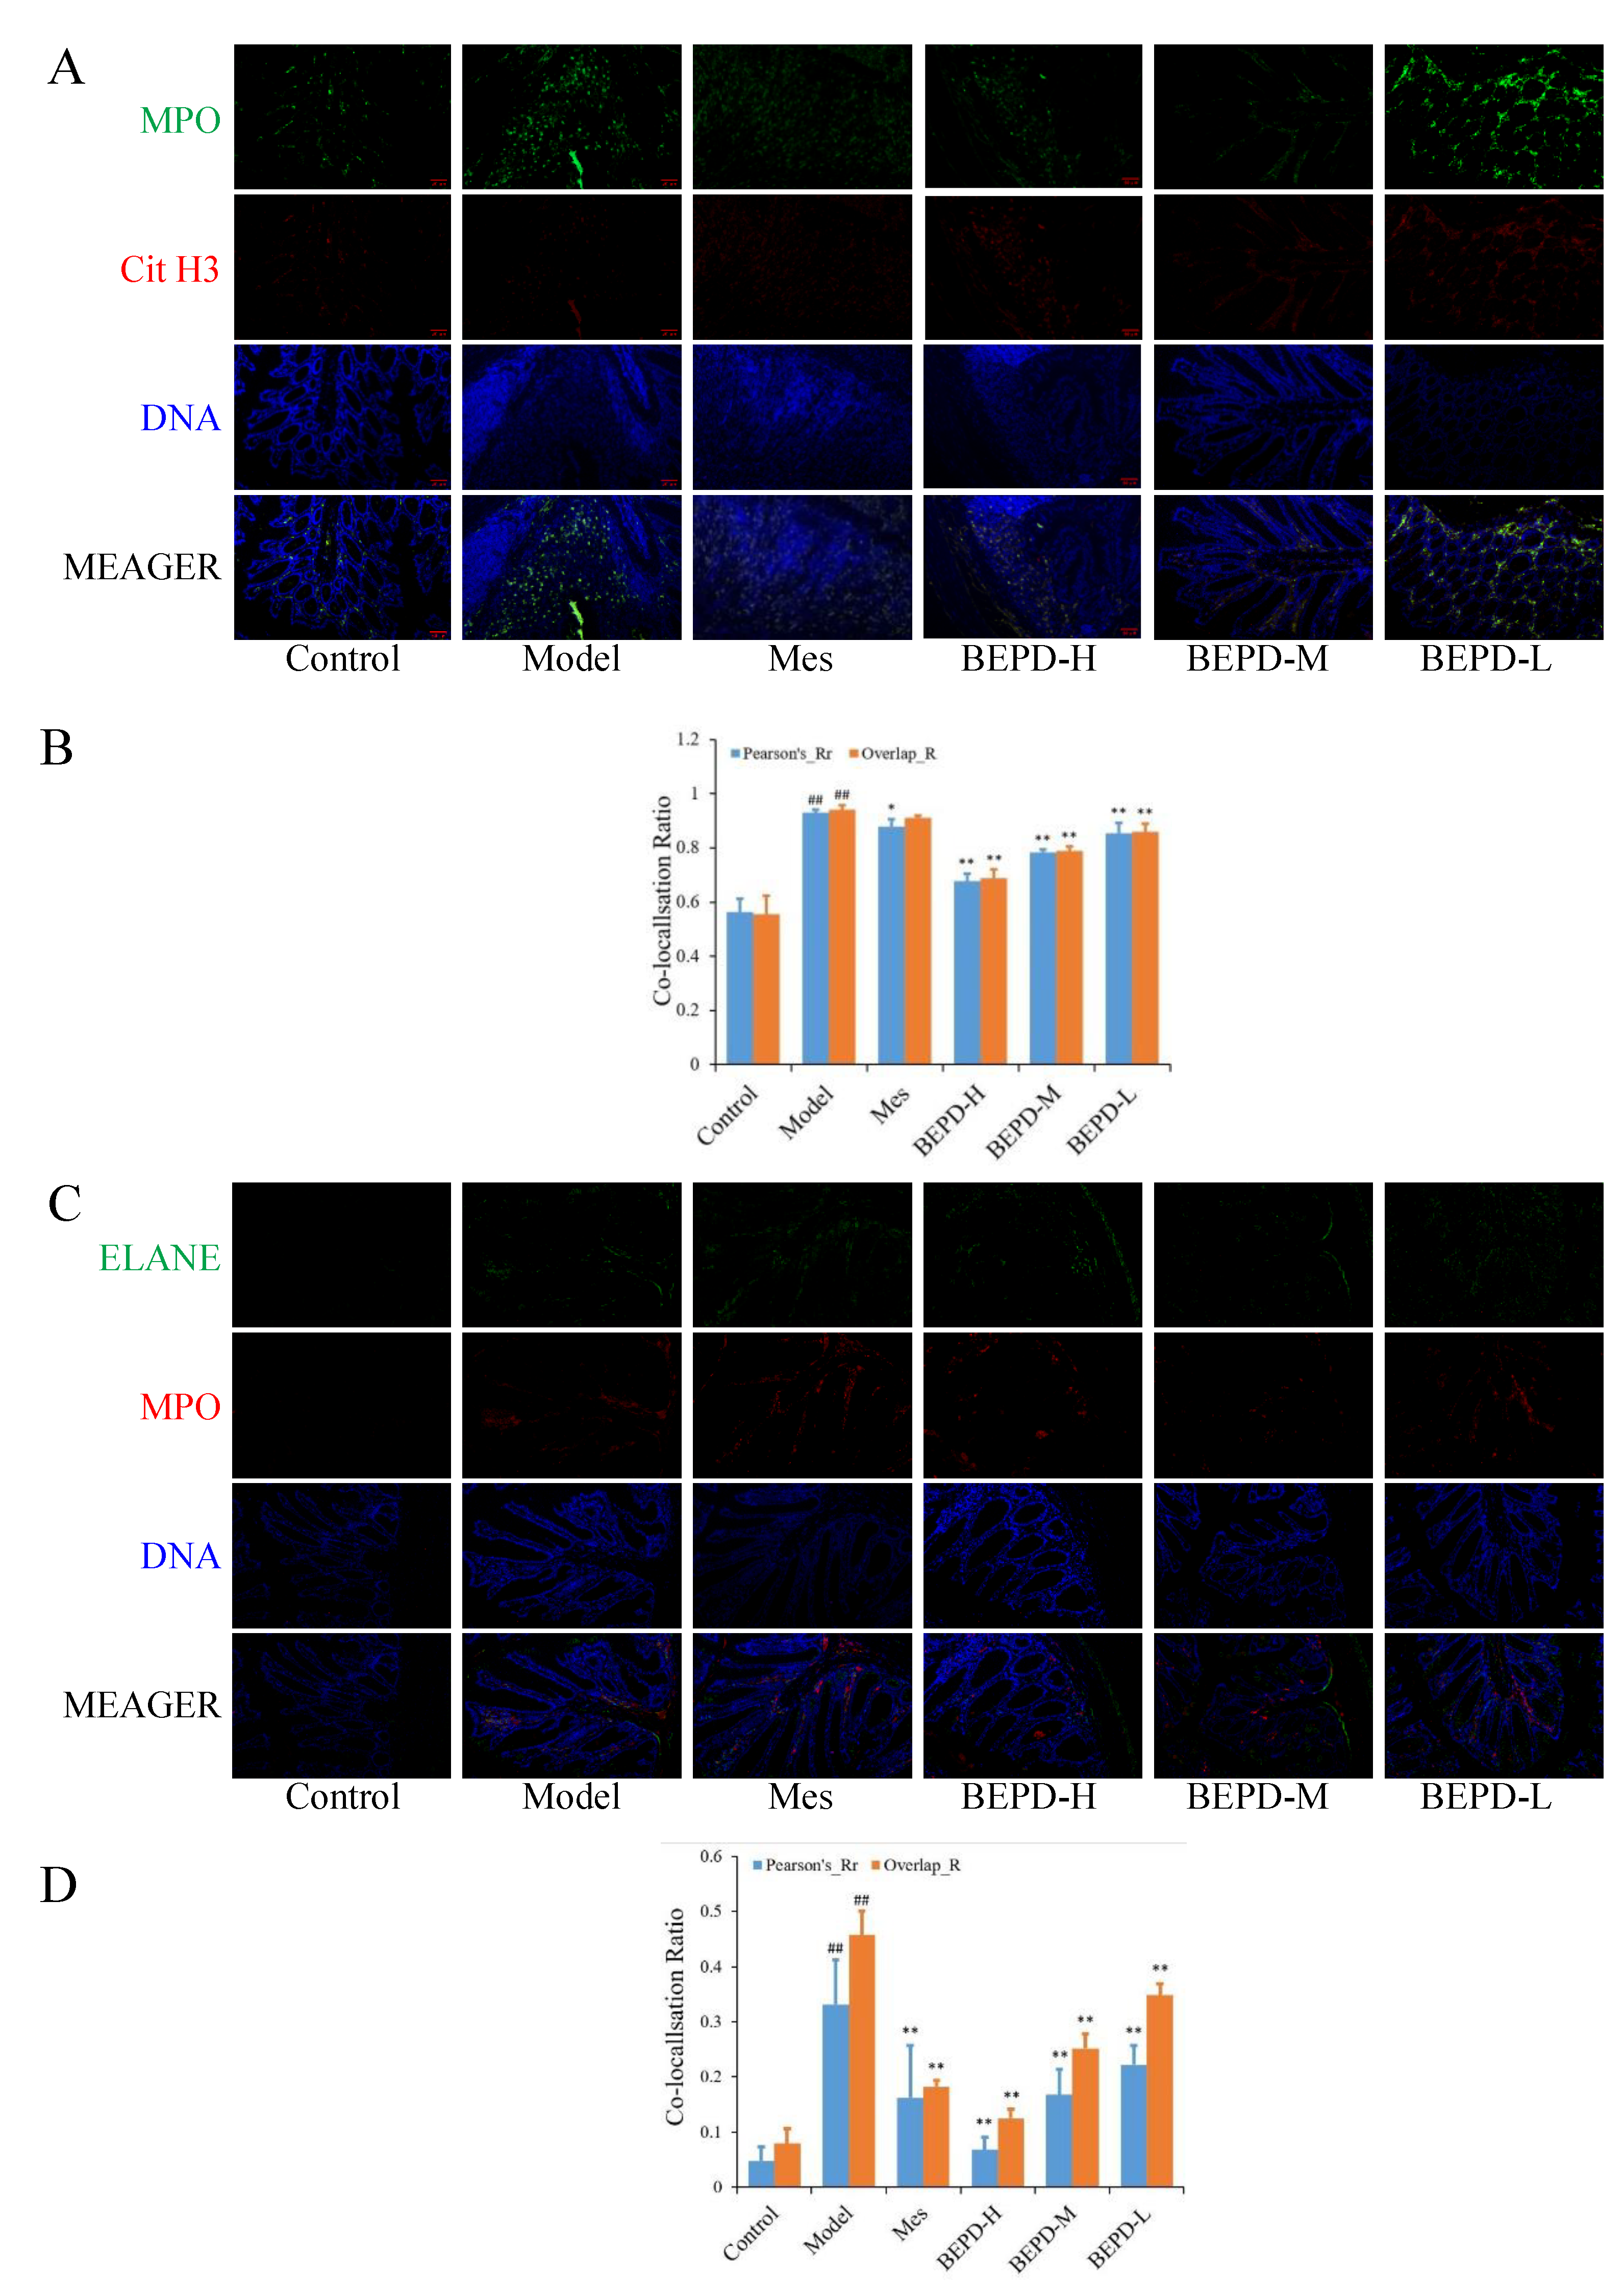
We used immunofluorescence colocalization to demonstrate the formation of extracellular NET. By comparing Pearson's and overlap, we observed differences in NET formation in the colon tissues of mice. MPO and Cit H3 co-located with DNA is a NET marker (
Figure 8A), significantly increased NET formation was observed in the colon tissues of model mice compared with control mice (P<0.01). Compared with model mice, Mes group mice showed a decrease in NET formation (P<0.05), which was still significantly greater than that in control mice (P<0.01), consistent with the decrease in PMN infiltration after treatment; BEPD group mice showed a dose-dependent decrease in NET formation (P<0.01) (
Figure 8B). As is ELANE and MPO co-located with DNA (
Figure 8C), significantly increased NET formation was observed in the colon tissues of model mice compared with control mice (P<0.01). Compared with model mice, Mes group mice showed a decrease in NET formation (P<0.01), which was still significantly greater than that in control mice (P<0.01); BEPD group mice showed a dose-dependent decrease in NET formation (P<0.01) (
Figure 8D). Combined with the changes in PMN infiltration in the colonic mucosal tissue, this indicates that BEPD can inhibit extracellular NET formation.
3. Discussion
The results of the in vivo experiments conducted in this study showed that in the DSS-induced UC mouse model, the expression of CXCL1 and CXCL2 is increased in the intestinal mucosal tissue, there is extensive infiltration of PMNs, the production of pro-inflammatory factors in colon tissue and serum is increased, the production of anti-inflammatory factors is decreased, mucosal barrier disruption and permeability is increased, and the crypt structure is destroyed. These findings are consistent with the results of previous studies on the pathogenesis of UC. Disruption of the intestinal mucosal barrier causes gut microbiota to penetrate the intestinal wall, and activate PMNs [
6]. PMNs exhibit a respiratory burst when exerting immune bactericidal effects, consuming a large amount of oxygen. However, under normal circumstances, the intestinal system tends to be hypoxic and a large number of infiltrating PMNs exacerbate local oxygen deficiency. At this point, NETosis, another important feature of PMNs, becomes activated, inevitably resulting in large-scale tissue damage. In this study, western blot analysis of colon tissues of mice with UC induced by DSS revealed a significant increase in the expression of key proteins involved in NET formation: ELANE, PAD4, Cit H3, and MPO. This is consistent with the results of previous studies. ELISA quantification and analysis of fecal samples showed a significant increase in the expression of NET-related proteins, indicating a significant release of NET from mice with UC. After BEPD treatment, the levels of the pro-inflammatory cytokines IL-1β, IL-6, and TNF-α decreased in the colon tissue of mice, the levels of the anti-inflammatory cytokines IL-4 and IL-10 increased, CXCL1 and CXCL2 levels decreased, PMN infiltration decreased, colonic mucosal permeability decreased, mucosal repair was initiated, the expression of the NET-related proteins ELANE, MPO, and MMP-8 and -9 in colon tissues and fecal samples decreased, and the expression of PAD4 and Cit H3 decreased. Simultaneously, the DAI and CMDI scores of mice decreased.
4. Materials and Methods
4.1. Experimental Animals
A total of 72 healthy specific pathogen-free female Kunming mice (aged 6–8 weeks, weighing 18–20g) were purchased from Jiangsu Huachuang Xinnuo Pharmaceutical Technology Co., Ltd. (Jiangsu, China; license number SCXK [Su] 2020–0009). The mice were housed in a disease-free environment, with a humidity of 50–55%, a temperature of 22 ± 2°C, a 12-h light/dark cycle, and free access to food and water. The animal experiments were approved by the Experimental Animal Ethics Committee of Anhui University of Traditional Chinese Medicine (permit number 2023007) and were conducted in accordance with Chinese legislation on the ethical use and care of laboratory animals.
4.2. Qualitative Analysis of BEPD Extract via HPLC
BEPD was prepared as previously described [
22]. To identify the main active compounds in BEPD, we selected esuclin, aescin, epiberberine, berberine, phellodendrine, japonin, and anisidin B4 for analysis. High performance liquid chromatography (HPLC) was performed to determine the main active compounds in BEPD. A Syncronic C18, 250 × 4.6 mm, 5 μm chromatographic column was used. Octadecylsilane-bonded silica gel was used as the stationary phase and the mobile phase was composed of acetonitrile and 0.05 mol/L potassium dihydrogen phosphate solution in a 50:50 ratio.
4.3. Establishment and Treatment of the UC Model
The 72 female Kunming mice were randomly divided into six groups, using the method developed by Ma et al. [
23,
24]. UC was induced in all mice except those in the control group by replacing drinking water with 3.0% dextran sodium sulfate (DSS) aqueous solution for seven days. Mice in the control group drank distilled water for seven days. After UC induction, the 60 mice with UC were divided into five groups according to body weight: model, mesalazine (Mes), high-dose BEPD (BEPD-H), medium-dose BEPD (BEPD-M), and low-dose BEPD (BEPD-L). Mice in the control and model groups were administered with 0.5 mL•kg
-1 normal saline, mice in the Mes group were administered with 200 mg•kg
-1 Mes [
25], and mice in the BEPD-H, BEPD-M, and BEPD-L groups were administered with 80, 40, and 20 mg•kg
-1 BEPD, respectively. All solutions were administered by gavage once daily for seven days.
4.4. General Condition of Mice and Disease Activity Index Scores
The general health of mice, including their mental state, diet, activity, and fur condition, was monitored every day. Daily food intake, body mass, bowel movements, fecal blood, and mortality were recorded for each group. The disease activity index (DAI) [
26] score was calculated based on the criteria listed in
Table 1.
4.5. Colonic Mucosal Permeability Detection
After a 12-h fast, 200 ml fluorescein isothiocyanate-dextran (FITC-dextran; 500 mg/kg; Sigma-Aldrich, St. Louis, MO, USA) was administered to each mouse by oral gavage. Mice were euthanized 4 h later and venous blood was collected. Serum was obtained through centrifugation and its absorbance was measured using a fluorescence spectrophotometer (excitation wavelength, 490 nm; emission wavelength, 520 nm). The serum concentration of FITC-dextran was calculated using a standard curve.
4.6. Histopathology
After mice were euthanized and blood was collected, a segment of colon approximately 0.5 cm long was cut 1 cm from the anus and immediately immersed in a 4% paraformaldehyde solution for 48 h to fix the tissue. The tissue was then dehydrated, embedded in paraffin, sectioned, and stained with hematoxylin and eosin (HE) to facilitate microscopic observation of the pathological changes in the mouse colon [
27]. The colonic mucosa damage index (CMDI) score was calculated [
28] and images were captured.
Table 2 and
Table 3 list these criteria.
4.7. Enzyme-Linked Immunosorbent Assay
The expression levels of IL-1β, IL-6, TNF-α, IL-4, IL-10, chemokine (C-X-C motif) ligand (CXCL)1, and CXCL2 in serum and colon tissue samples were detected using enzyme-linked immunosorbent assay (ELISA) kits (Shanghai Jianglai Industrial Co., Ltd., Shanghai, China). Absorbance was measured at a wavelength of 450 nm using a microplate reader and a standard curve was used for concentration conversion. The expression levels of MPO, ELANE, matrix metalloproteinase (MMP)-8, and MMP-9 in feces were also detected using ELISA kits (Shanghai Jianglai Industrial Co., Ltd., Shanghai, China).
4.8. Immunohistochemistry
Paraffin-embedded colon tissue samples were sectioned, dewaxed, rehydrated with gradient ethanol, and treated with sodium citrate buffer (10 mM, pH 6.0) for 20 min, followed by 3% hydrogen peroxide for 10 min to inactivate endogenous peroxidase. The sections were incubated with polyclonal antibodies recognizing MMP-8 (1:200; catalog number M09JA12; Chengdu Zhengneng Biotechnology Co., Ltd., Chengdu, China), MMP-9 (1:200; catalog number L05DE16; Chengdu Zhengneng Biotechnology Co., Ltd.), MPO (1:200; catalog number M05JA20; Chengdu Zhengneng Biotechnology Co., Ltd.), protein arginine deiminase (PAD)4 (1:5000; catalog number 00102732; Proteintech Group, Rosemont, IL, USA), ELANE (1:200; catalog number M05JA20; Chengdu Zhengneng Biotechnology Co., Ltd.), and ROS (1:200; catalog number 53q9220; Affinity Biosciences, Cincinnati, OH, USA) at 4°C overnight. They were then incubated with the secondary antibody for 20 min, following which the color was developed with 3,3-diaminobenzidine. Sections were counterstained with hematoxylin, sealed with neutral resin, and observed under a light microscope (Olympus BX51; Fulai Optical Technology Co. Ltd., Shanghai, China). Image analysis was performed using Image J software.
4.9. Immunofluorescence
Paraffin-embedded colon tissue samples were sectioned, dewaxed, rehydrated with gradient ethanol, and treated with sodium citrate buffer (10 mM, pH 6.0) for 20 min, followed by 3% hydrogen peroxide for 10 min to inactivate endogenous peroxidase. The sections were incubated with a rabbit anti-mouse Ly6G polyclonal antibody (1:500; catalog number M09JA12; Chengdu Zhengneng Biotechnology Co., Ltd.) overnight at 4 °C followed by a goat anti-rabbit IgG (Alexa Fluor 488) fluorescent secondary antibody (1:500; catalog number L08AU3A; Chengdu Zhengneng Biotechnology Co., Ltd.) for 20 min. The nucleus was stained with DAPI (Shandong Sijie Biotechnology Co., Ltd., Shandong, China) for 5 min, and sections were observed under a fluorescence microscope within 1 h.
4.10. Western Blotting
Protein was extracted from colon tissue using phenylmethylsulfonyl fluoride (catalog number 23184510; Biosharp, Hefei, China). Protein separation was performed using sodium dodecyl-sulfate polyacrylamide gel electrophoresis and proteins were transferred onto a polyvinylidene fluoride membrane using electroblotting. The membrane was blocked with 5% non-fat milk powder for 2 h and then the membranes were incubated with rabbit anti-mouse PAD4 (1:1000), rabbit anti-mouse citrullinated histone H3 (Cit H3; 1:1000; catalog number 00057440; Proteintech Group), rabbit anti-mouse MPO (1:5000), and rabbit anti-mouse β-actin (1:10000; catalog number 380624; Chengdu Zhengneng Biotechnology Co., Ltd.) antibodies overnight at 4 °C. Subsequently, the membrane was incubated with secondary antibodies for 1 h and proteins were detected with enhanced chemiluminescence.
4.11. NET Visualization
We detected extracellular NETs using immunofluorescence co-localization. Paraffin-embedded colon tissue samples were sectioned, dewaxed, rehydrated with gradient ethanol, and treated with sodium citrate buffer (10 mM, pH 6.0) for 20 min, followed by 3% hydrogen peroxide for 15 min in the dark to inactivate endogenous peroxidase. Then, sections were incubated with 3% BSA-PBS solution for 30 min at room temperature, followed by rabbit anti-mouse ELANE (1:200) and rabbit anti-mouse MPO (1:100) polyclonal antibodies overnight at 4 °C. A goat anti-mouse/rabbit HRP polymer from the goat anti-mouse/rabbit multiplex IHC detection kit (double) (Zen-Bio Inc., Durham, NC, USA) was then added to sections, which were incubated at room temperature for 1 h in the dark. After washing with PBS (pH 7.4), TSA-520 was added and sections were incubated at room temperature for 15 mins. Antigen retrieval was repeated, and sections were then incubated with rabbit anti-mouse MPO (1:100) and rabbit anti-mouse Cit H3 (1:100) polyclonal antibodies overnight at 4 °C. A goat anti-mouse/rabbit HRP polymer was added and incubated at room temperature for 1 h in the dark. TSA-570 was added and sections were incubated at room temperature for 15 mins. Sections were counterstained with DAPI, incubated in the dark at room temperature for 5 mins, mounted, and observed under a fluorescence microscope within 1 h.
4.12. Statistical Analysis
All data were analyzed using SPSS software version 23.0 (IBM Corp., Armonk, NY, USA). Measurement data are expressed as mean ± standard deviation, and differences between groups were compared using one-way analysis of variance, with P<0. 05 considered to indicate a statistically significant difference. The experiments were repeated three times.
5. Conclusions
The release of NETs by PMNs may be a major factor in the pathogenesis of UC. NETs are formed through a variety of factors and respond to a variety of stimuli, which makes it difficult for the single-component drugs currently used in clinical practice to play an effective role in the treatment of UC by regulating the release of NETs from PMNs. Our findings suggest that BEPD regulates NET formation in PMNs through multiple targets and pathways to play a therapeutic role in UC.
List of abbreviations: BEPD, n-butanol extract of Pulsatilla decoction; BEPD-H, high-dose n-butanol extract of Pulsatilla decoction; BEPD-L, low-dose n-butanol extract of Pulsatilla decoction; BEPD-M, medium-dose n-butanol extract of Pulsatilla decoction; Cit H3, citrullinated histone H3; CMDI, colonic mucosal damage index; CXCL, CXC motif chemokine ligand; DAI, disease activity index; DSS, dextran sulfate sodium; ELANE, neutrophil elastase; ELISA, enzyme-linked immunosorbent assay; FITC-dextran, fluorescein isothiocyanate-dextran; HE, hematoxylin and eosin; HRP, horseradish peroxidase; IL, interleukin; KM, Kunming; Mes, mesalazine; MMP, matrix metalloproteinase; MPO, myeloperoxidase; NET, neutrophil extracellular trap; PAD, protein arginine deiminase; PMN, polymorphonuclear neutrophil; ROS, reactive oxygen species; TNF, tumor necrosis factor; UC, ulcerative colitis.
Author Contributions
Yadong Wang: Investigation, Writing - original draft and review &editing; Juan Sun, Hui Wu and Can Li: Investigation, Visualization, and Validation; Changzhong Wang: Conceptualization, Project administration, Methodology, Funding quisition, and Writing - original draft and review &editing; Gaoxiang Shi and Ying Fang: Software and Validation; Kelong Ma and Daqiang Wu: Data analysis and supervision; Jing Shao: Validation and Supervision. Tianming Wang: Resources.
Funding
This work was supported by the National Science Foundation of China (grant numbers 82374173, 81774034, 81573725); the Anhui Provincial Key Research and Development Plan (grant number 202104a07020020); and Key Scientific Research Projects of Anhui Provincial Department of Education (grant number KJ2021A0590, 2022AH050500).
Informed Consent Statement
Not applicable.
Data Availability Statement
The authors confirm that the data supporting the findings of this study are available within the article.
Conflicts of Interest
The authors declare no conflict of interest.
References
- Patnaude, L., Mayo, M., Mario, R., Wu, X.M., Knight, H., Creamer, K., Wilson, S., Pivorunas, V., Karman, J., Phillips, L., Dunstan, R., Kamath, R.V., McRae, B., Terrillon, S., 2021. Mechanisms and regulation of IL-22-mediated intestinal epithelial homeostasis and repair. LIFE SCI. 271, 119195. [CrossRef]
- Xu, N., Bai, X.L., Cao, X.L., Yue, W.J., Jiang, W.W., Yu, Z.H., 2021. Changes in intestinal microbiota and correlation with TLRs in ulcerative colitis in the coastal area of northern China. MICROB PATHOGENESIS. 150, 104707. [CrossRef]
- Ye, B., Lai, L.Q., 2021. Yu Shi An Chang Fang Ameliorates TNBS-Induced Colitis in Mice by Reducing Inflammatory Response and Protecting the Intestinal Mucosal Barrier. EVID-BASED COMPL ALT. 2021, 8870901. [CrossRef]
- Formiga, R.d.O., Alves Júnior, E.B., Vasconcelos, R.C., Guerra, G.C.B., Antunes de Araújo, A., Carvalho, T.G.d., Garcia, V.B., de Araújo Junior, R.F., Gadelha, F.A.A.F., Vieira, G.C., et al., 2020. p-Cymene and Rosmarinic Acid Ameliorate TNBS-Induced Intestinal Inflammation Upkeeping ZO-1 and MUC-2: Role of Antioxidant System and Immunomodulation. INT J MOL SCI. 21(16), 5870. [CrossRef]
- Pavel FM, Vesa CM, Gheorghe G., Diaconu, C.C., Stoicescu, M., Munteanu, M.A., Babes, E.E., Tit, D.M., Toma, M.M., Bungau, S., 2021. Highlighting the Relevance of Gut Microbiota Manipulation in Inflammatory Bowel Disease. DIAGNOSTICS. 11(6), 1090. [CrossRef]
- Nyström, E.E.L., Martinez-Abad, B., Arike, L., Birchenough, G.M.H., Nonnecke, E.B., Castillo, P.A., Svensson, F., Bevins, C.L., Hansson, G.C., Johansson, M.E.V., 2021. An intercrypt subpopulation of goblet cells is essential for colonic mucus barrier function. SCIENCE. 372(6539), 257-286. [CrossRef]
- Lee, H.S., Choe, J., Kim, S.O., Lee, S.H., Lee, H.J., Seo, H., Kim, G.U., Seo, M., Song, E.M., Hwang, S.W., Park, S.H., Yang, D.H., Kim, K.J., Ye, B.D., Byeon, J.S., Myung, S.J., Yoon, Y.S., Yu, C.S., Kim, J.H., Yang, S.K., 2017. Overall and cause-specific mortality in Korean patients with inflammatory bowel disease: a hospital-based cohort study. J GASTROEN HEPATOL. 32(4), 782-788. [CrossRef]
- Kassam, Z., Belga, S., Roifman, I., Hirota, S., Jijon, H., Kaplan, G.G., Ghosh, S., Beck, P.L., 2014. Inflammatory Bowel Disease Cause-specific Mortality: A Primer for Clinicians. INFLAMM BOWEL DIS. 20(12), 2483-2492. [CrossRef]
- Witte, J., Shivananda, S., Lennard-Jones, J.E., Beltrami, M., Politi, P., Bonanomi, A., Tsianos, E.V., Mouzas, I., Schulz, T.B., Monteiro, E., Clofent, J., Odes, S., Limonard, C.B., Stockbrügger, R.W., Russel, M.G., 2000. Disease outcome in inflammatory bowel disease: mortality, morbidity and therapeutic management of a 796-person inception cohort in the European Collaborative Study on Inflammatory Bowel Disease (EC-IBD). SCAND J GASTROENTERO. 35(12), 1272-1277. [CrossRef]
- Lavie, L; Dyugovskaya, L; Polyakov, A., Rogovoy, O., Leder, E., 2017. Development and Identification of a Novel Subpopulation of Human Neutrophil-derived Giant Phagocytes In Vitro. JOVE-J VIS EXP. (119), e54826. [CrossRef]
- Ren, J., Yan, D., Wang, Y., Zhang, J., Li, M., Xiong, W., Jing, X., Li, P., Zhao, W., Xiong, X., Wu, M., Zhong, G., 2021. Inhibitor of Differentiation-2 Protein Ameliorates DSS-Induced Ulcerative Colitis by Inhibiting NF-κB Activation in Neutrophils. FRONT IMMUNOL. 12:760999. [CrossRef]
- Angelidou, I., Chrysanthopoulou, A., Mitsios, A., Arelaki, S., Arampatzioglou, A., Kambas, K., Ritis, D., Tsironidou, V., Moschos, I., Dalla, V., Stakos, D., Kouklakis, G., Mitroulis, I., Ritis, K., Skendros, P., 2018. REDD1/Autophagy Pathway Is Associated with Neutrophil-Driven IL-1β Inflammatory Response in Active Ulcerative Colitis. J IMMUNOL. 200(12), 3950-3961. [CrossRef]
- Abd El Hafez, A., Mohamed, A.S., Shehta, A., Sheta, H., 2020. Neutrophil extracellular traps-associated protein peptidyl arginine deaminase 4 immunohistochemical expression in ulcerative colitis and its association with the prognostic predictors. PATHOL RES PRACT. 216(10), 153102. [CrossRef]
- Wechsler, J.B., Szabo, A., Hsu, C.L., Krier-Burris, R.A., Schroeder, H.A., Wang, M.Y., Carter, R.G., Velez, T.E., Aguiniga, L.M., Brown, J.B., Miller, M.L., Wershil, B.K., Barrett, T.A., Bryce, P.J., 2018. Histamine drives severity of innate inflammation via histamine 4 receptor in murine experimental colitis. MUCOSAL IMMUNOL. 11(3) 861-870. [CrossRef]
- Zhang, Y., Wang, Z.Q., Liu, J., Zhang, S.H., Fei, J.X., Li, J., Zhang, T., Wang, J.D., Park, P.W., Chen, Y., 2017. Cell surface-anchored syndecan-1 ameliorates intestinal inflammation and neutrophil transmigration in ulcerative colitis. J CELL MOL MED. 21(1), 13-25. [CrossRef]
- Cui, C., Chakraborty, K., Tang, X.A., Zhou, G., Schoenfelt, K.Q., Becker, K.M., Hoffman, A., Chang, Y.F., Blank, A., Reardon, C.A., Kenny, H.A., Vaisar, T., Lengyel, E., Greene, G., Becker, L., 2021. Neutrophil elastase selectively kills cancer cells and attenuates tumorigenesis. CELL. 184(12), 3163-3177.e21. [CrossRef]
- Muthas, D., Reznichenko, A., Balendran, C.A., Bottcher, G., Clausen, I.G., Karrman Mardh, C., Ottosson, T., Uddin, M., MacDonald, T.T., Danese, S., Hansen, M.B., 2017. Neutrophils in ulcerative colitis: a review of selected biomarkers and their potential therapeutic implications. SCAND J GASTROENTERO. 52(2), 125-135. [CrossRef]
- Dong, W.F., Liu, D., Zhang, T.T., You, Q., Huang, F.J., Wu, J., 2021. Oral delivery of staphylococcal nuclease ameliorates DSS induced ulcerative colitis in mice via degrading intestinal neutrophil extracellular traps. ECOTOX ENVIRON SAFE. 215(1),112161. [CrossRef]
- Brinkmann, V., Reichard, U., Goosamnn, C., Fauler, B., Uhlemann, Y., Weiss, D., Weinrauch, Y., Zychlinsky, A., 2004. Neutrophil extracellular traps kill bacteria. Science. 303(5663), 1532-153. [CrossRef]
- Ramos, A.D., Viana, G.C.S., Brigido, M.M., Almeida, J.F., 2021. Neutrophil extracellular traps in inflammatory bowel diseases: Implications in pathogenesis and therapeutic targets. PHARMACOL RES. 171, 105779. [CrossRef]
- Kim, J.J., Shajib, M.S., Manocha, M.M., Khan, W.I., 2012. Investigating Intestinal Inflammation in DSS-induced Model of IBD. JOVE-J VIS EXP. (60), e3678. [CrossRef]
- Hu, K.F., Zhang, H., Shi, G.X., Wang, B.F., Wu, D.Q., Shao, J., Wang, T.M., Wang, C.Z., 2023. Effects of n-butanol extract of Pulsatilla decoction on the NLRP3 inflammasome in macrophages infectedwith Candida albicans. J ETHNOPHARMACOL. 304, 116041. [CrossRef]
- Ma, K.L., Han, Z.J., Pan, M., Chen, M.L., Ge, Y.Z., Shao, J., Wu, D.Q., Wang, T.M., Yan, G.M., Wang, C.Z., 2020. Therapeutic effect of cinnamaldehyde on ulcerative colitis in mice induced bydextran sulfate sodium with Candida albicans colonization and its effect ondectin-1/TLRs/NF-κB signaling pathway. China Journal of Chinese Materia Medica. 45(13), 3211-3219. [CrossRef]
- Choteau, L., Vancraeyneste, H., le Roy, D., Dubuquoy, L., Romani, L., Jouault, T., Poulain, D., Sendid, B., Calandra, T., Roger, T., Jawhara, S., 2017. Role of TLR1, TLR2 and TLR6 in the modulation of intestinal inflammation and Candida albicans elimination. GUT PATHOG. 9, 9. [CrossRef]
- Wang, X.M., Tian, G., Duan, Q.J., Wu, D.Q., Shao, J., Wang, T.M., Wang, C.Z., 2018. Therapeutic potential of n-butanol extract of Pulsatilla decoction in a murine model of ulcerative colitis induced by DSS combined with Candida albicans colonization. China Journal of Chinese Materia Medica. 43(14),2979-2984. [CrossRef]
- Guo, W.J., Liu, W., Jin, B., Geng, J., Li, J., Ding, H.Q., Wu, X.F., Xu, Q., Sun, Y., Gao, J., 2015. Asiatic acid ameliorates dextran sulfate sodium-induced murine experimental colitis via suppressing mitochondria-mediated NLRP3 inflammasome activation. INT IMMUNOPHARMACOL. 24(2), 232-238. [CrossRef]
- Du, L.D., Ma, Q.L., Wu, G.T., Shao, J., Cao, R.B., Zang, K.H., Ren, Y., 2021. Mechanism Study of Wumeiwan in the Treatment of Ulcerative Colitis ViaIKKα/NF-κB/COX-2 Signaling Pathways in the Colon tissue of Rats. Pharmacology and Clinics of Chinese Materia Medica. 37(2), 3-7. [CrossRef]
- Yu, Z.Y., Xu, Y.S., Tang, M., Xin, W.F., 2023. The effect of olsalazine of chinese generic drugs on ulcerative colitis induced by dextran sulfate sodium salt in BALB/c mice. ACTA CIR BRAS. 38, e382923. [CrossRef]
Figure 1.
HPLC fingerprint of major components of BEPD. (A-E) HPLC fingerprint of the anemoside B4, phellodendrine, esculin, esculetin, epiberberine, berberine and jatrorrhizine of BEPD.
Figure 1.
HPLC fingerprint of major components of BEPD. (A-E) HPLC fingerprint of the anemoside B4, phellodendrine, esculin, esculetin, epiberberine, berberine and jatrorrhizine of BEPD.
Figure 2.
A. Body weight changes. B. Effect of BEPD on DAI score in UC mice induced by DSS.
Figure 2.
A. Body weight changes. B. Effect of BEPD on DAI score in UC mice induced by DSS.
Figure 3.
Anti-UC effects of BEPD against DSS-induced UC mice. (A B) Representative pictures of colons from each group and the length of the mouse colon. (C) Representative HE staining of distal colon tissues. (200× magnification). (D) Pathological score of mouse colon tissue. (E) In the colon mucosal permeability experiment. (F) Score of CMDI. ( # P<0.05 vs control group, ## P<0.01 vs control group, * P<0.05 vs model group, ** P<0.01 vs model group. *P<0.05 indicates statistically significant.).
Figure 4.
Effects of BEPD on cytokine production. (A-C) The levels of pro-inflammatory cytokines IL-1β, IL-6 and TNF-α in serum of UC mice. (D-E) The levels of anti-inflammatory cytokines IL-4 and IL-10 in serum of UC mice. (F-H) The levels of pro-inflammatory cytokines IL-1β, IL-6 and TNF-α in colon tissues of UC mice. (I-J) The levels of anti-inflammatory cytokines IL-4 and IL-10 in colon tissues of UC mice. ( # P<0.05 vs control group, ## P<0.01 vs control group, * P<0.05 vs model group, ** P<0.01 vs model group. *P<0.05 indicates statistically significant.).
Figure 5.
Effects of BEPD on chemokine production and PMN infiltration and activation. (A) The levels of neutrophil chemokines CXCL1 and CXCL2 in serum and colon tissues of UC mice. (B, C) Effects of BEPD on PMN infiltration in the colon mucosal tissues (400 × magnification). (D) IHC staining of colon ROS of mice in each group (400 × magnification). (E) Semi-quantitative results of IHC staining analysis for ROS. ( # P<0.05 vs control group, ## P<0.01 vs control group, * P<0.05 vs model group, ** P<0.01 vs model group. *P<0.05 indicates statistically significant.).
Figure 6.
Effects of BEPD on the formation of NETs. (A-E) Western blot results of key proteins involved in NET formation, Cit H3, MPO, PAD4 and ELANE. ( # P<0.05 vs control group, ## P<0.01 vs control group, * P<0.05 vs model group, ** P<0.01 vs model group. *P<0.05 indicates statistically significant.).
Figure 7.
Effects of BEPD on the release of NETs. (A-E) IHC staining and semi-quantitative results of colon MPO, MMP-8, MMP-9, PAD4 and ELANE of mice in each group (400 × magnification). (F) Relative content of MPO, MMP-8, MMP-9 and ELANE in mouse feces. ( # P<0.05 vs control group, ## P<0.01 vs control group, * P<0.05 vs model group, ** P<0.01 vs model group. *P<0.05 indicates statistically significant.).
Figure 8.
Effect of BEPD on extracellular NET. (A, B) MPO and Cit H3 co-located with DNA. (C, D) ELANE and MPO co-located with DNA. ( # P<0.05 vs control group, ## P<0.01 vs control group, * P<0.05 vs model group, ** P<0.01 vs model group. *P<0.05 indicates statistically significant.).
Figure 8.
Effect of BEPD on extracellular NET. (A, B) MPO and Cit H3 co-located with DNA. (C, D) ELANE and MPO co-located with DNA. ( # P<0.05 vs control group, ## P<0.01 vs control group, * P<0.05 vs model group, ** P<0.01 vs model group. *P<0.05 indicates statistically significant.).
Table 4.
The retention time, peak areas, and contents of Esuclin, Aescin, Epiberberine, Berberine, Phellodendrine, Japonin, and Anisidin B4 in BEPD.
Table 4.
The retention time, peak areas, and contents of Esuclin, Aescin, Epiberberine, Berberine, Phellodendrine, Japonin, and Anisidin B4 in BEPD.
| Main components |
Retention Time
(min) |
|
Peak Area
(mAU×min) |
Content
(ug/g) |
| Anemoside B4 |
12.711 |
|
17.506 |
78116.5286 |
| Phellodendrine |
12.530 |
|
2.828 |
3294.2359 |
| Berberine |
18.913 |
|
99.167 |
65110.3513 |
| Epiberberine |
11.833 |
|
13.923 |
4177.7388 |
| Esculin |
6.238 |
|
124.418 |
59261.4560 |
| Esculetin |
11223 |
|
1.531 |
514.8837 |
| Jatrorrhizine |
17.328 |
|
47.883 |
14949.7155 |
Table 1.
Scoring criteria of DAI.
Table 1.
Scoring criteria of DAI.
| score |
Weight loss
(%) |
Stool condition |
Fecal blood |
| 0 |
n≤1% |
formed, moderate hardness |
no abnormalities |
| 1 |
1%<n≤5% |
formed, soft, not adhering to the perianal area |
faeces with dark red spots |
| 2 |
5%<n≤10% |
soft and sticky around the anus |
faeces with dark red spots and visible bleeding around the anus |
| 3 |
n>10% |
unformed, adhering to the perianal area, diarrhea |
deep red feces with adhesion of perianal blood |
Table 2.
Scoring criteria of colonic histopathology.
Table 2.
Scoring criteria of colonic histopathology.
| score |
severity of inflammation |
range of inflammation |
amount of crypt damage |
| 0 |
none |
none |
none |
| 1 |
mild |
mucosa |
1/3 damaged |
| 2 |
moderate |
mucosa and submucosa |
2/3 damaged, and epithelial surface present |
| 3 |
severe |
transmural |
crypts and epithelial surface lost |
Table 3.
Scoring criteria of CMDI.
Table 3.
Scoring criteria of CMDI.
| score |
mucosal injury degree |
| 0 |
normal intestinal mucosa |
| 1 |
mucosa congestion without ulcer lesions and bleeding |
| 2 |
sporadic mucosal ulcer or slight bleeding |
| 3 |
extensive ulcer necrosis or adhesion of intestinal mucosa and bleeding |
| 4 |
severe bleeding and megacolon or stenosis or perforation |
|
Disclaimer/Publisher’s Note: The statements, opinions and data contained in all publications are solely those of the individual author(s) and contributor(s) and not of MDPI and/or the editor(s). MDPI and/or the editor(s) disclaim responsibility for any injury to people or property resulting from any ideas, methods, instructions or products referred to in the content. |
© 2024 by the authors. Licensee MDPI, Basel, Switzerland. This article is an open access article distributed under the terms and conditions of the Creative Commons Attribution (CC BY) license (http://creativecommons.org/licenses/by/4.0/).
