1. Introduction
The W-beam barrier is a semi-rigid barrier that combines both rigidity and flexibility, effectively absorbing and dissipating impact energy, thereby reducing vehicle damage and occupant injuries. Its ease of installation and low maintenance costs make it widely applicable in highways, bridges, and urban roads [
1]. The separated central median W-beam barrier is a commonly used structure for highway central medians, consisting typically of two parallel barriers spaced apart to better absorb and dissipate collision energy, thereby enhancing protective performance [
2]. This type of barrier not only improves road safety but also reduces secondary injuries post-accident to a certain extent, making it prevalent on high-traffic, high-speed highways [
3].
With the rapid development of highways in China, traffic volume and composition have changed significantly, and updates in national standards have imposed higher safety requirements [
4]. barriers designed and used under older standards now face numerous challenges [
5,
6,
7,
8], particularly in central medians that include communication pipelines and green spaces. Such designs complicate the compaction of backfill and planting soils, directly affecting the load-bearing capacity of the barrier posts [
9,
10]. This can lead to inadequate load-bearing capacity of the barrier system, allowing out-of-control vehicles to breach or overrun the central median, resulting in severe accidents [
11].
Currently, research on W-beam barriers mainly focuses on roadside barriers [
12,
13,
14,
15]. Improvement methods include increasing the number of W-beam panels [
16,
17], post densification [
18,
19], changing connection methods [
20], and increasing barrier height [
21,
22] to meet current protective standards. In new construction scenarios, strategies often involve enhancing the strength of barrier materials [
23]and optimizing structural design [
24]. However, these studies presuppose that the environmental conditions for using W-beam barriers, especially the foundation strength, meet the specified requirements. Although standards recommend various reinforcement solutions to address insufficient soil compaction (not less than 90%) [
25], the actual protective effects of these solutions have yet to be fully validated.
The methodologies for studying safety barriers encompass several aspects: data collection and accident analysis, which involve gathering and analyzing traffic accident data to study the actual performance of barriers in accidents and summarize their protective effects and existing issues [
26]; structural mechanics analysis, using mechanical theory to analyze the structural strength and stability of barriers to establish reasonable design parameters [
27]; computer simulation and modeling, which involve creating mathematical models of barriers and vehicles, using specialized software (such as LS-DYNA, ABAQUS) to simulate vehicle-barrier collisions and evaluate barrier performance and propose improvements [
28,
29,
30,
31,
32]; laboratory-scale model testing, where scaled-down models are used in laboratory settings to conduct crash tests and validate the design’s rationality and effectiveness [
33]; and full-scale crash testing, where real-world crash tests are conducted to obtain performance data of barriers under actual crash conditions, assessing their protective capabilities and improvement effects [
34,
35,
36].
In current research on W-beam barriers, commonly used methods typically simplify the treatment of the central median foundation. For instance, simulation methods usually treat the foundation as rigid, while full-scale vehicle crash tests generally ensure that the soil compaction meets or exceeds the standard (>90%). These studies lack exploration of W-beam barriers under low foundation strength conditions. This study employed full-scale vehicle crash tests to verify the actual protective capability of A-level separated central median W-beam barriers, recommended by standard [
25], under low compaction conditions, reinforced through post-densification measures.
2. Experimental Design
2.1. Central Median Foundation Setting Conditions
To scientifically validate the effect of post densification on enhancing the protective capabilities of barriers, this study employed a comprehensive scene reconstruction approach to accurately replicate the design and construction conditions of the central median. Measures were implemented to ensure the stability of soil compaction across parallel tests. Specifically, the central median was designed with a width of 2.5 meters. According to the design requirements (
Figure 1), foundation excavation, pipeline installation, backfilling, compaction, tree pit excavation, tree planting, and soil backfilling were carried out. The tree pits were sized at 80 cm in diameter and 60 cm in depth, spaced 1.5 meters apart. Curbstones were installed on the impact side of the central median (
Figure 2). Soil density parameters were obtained through compaction tests [
37], and the soil compaction of the central median was measured using the ring knife method [
38].The measured data indicates that the maximum dry density of the foundation soil in the impact area is 1.72 g·cm
-3. Prior to the tests with the small passenger car, medium bus, and medium truck, samples were taken from the central median, revealing dry densities of 1.43 g·cm
-3, 1.32 g·cm
-3, and 1.39 g·cm
-3, respectively. The corresponding compaction degrees were 83%, 77%, and 81%.
2.2. Barrier Materials and Structural Dimensions
The barrier is fabricated using Q235 steel, with its structural dimensions detailed in
Table 1. The installation process involves driving the posts to the designed depth of 1490 mm. Subsequently, the “densified posts” reinforcement method is employed, where an additional post is installed between each original post, ensuring that the depth of insertion matches that of the original posts. All posts are connected to the barrier beams anti-blocking blocks, while the barrier beams themselves are joined together using splice bolts to form an integrated structure. For the experiment, the barrier is set to a length of 70 meters, installed on both sides, with the predefined collision point located at one-third of the total barrier length.
2.3. Full-Scale Vehicle Acceleration System
In this study, a drop weight traction vehicle acceleration system was employed to accelerate the test vehicles. This system consists of a gravitational potential energy tower, an acceleration runway, an acceleration traction vehicle, a braking system, and a test vehicle traction system. The acceleration traction vehicle is fixed on a track and connected to the drop weight via a steel cable of specific specifications. The drop weight is elevated to a predetermined height on the gravitational potential energy tower to provide potential energy. At the start of the test, the drop weight is released, and its falling kinetic energy is transmitted to the acceleration traction vehicle through the steel cable, which in turn accelerates the test vehicle. Once the test vehicle reaches the set speed, the acceleration traction vehicle disengages from the test vehicle, allowing the test vehicle to freely travel and impact the test barrier at the predetermined angle (
Figure 3)
2.4. Test Conditions
The protection level of the barrier is classified as Level 3 (A), and the full-scale vehicle test conditions were set according to the standards specified in [
39].
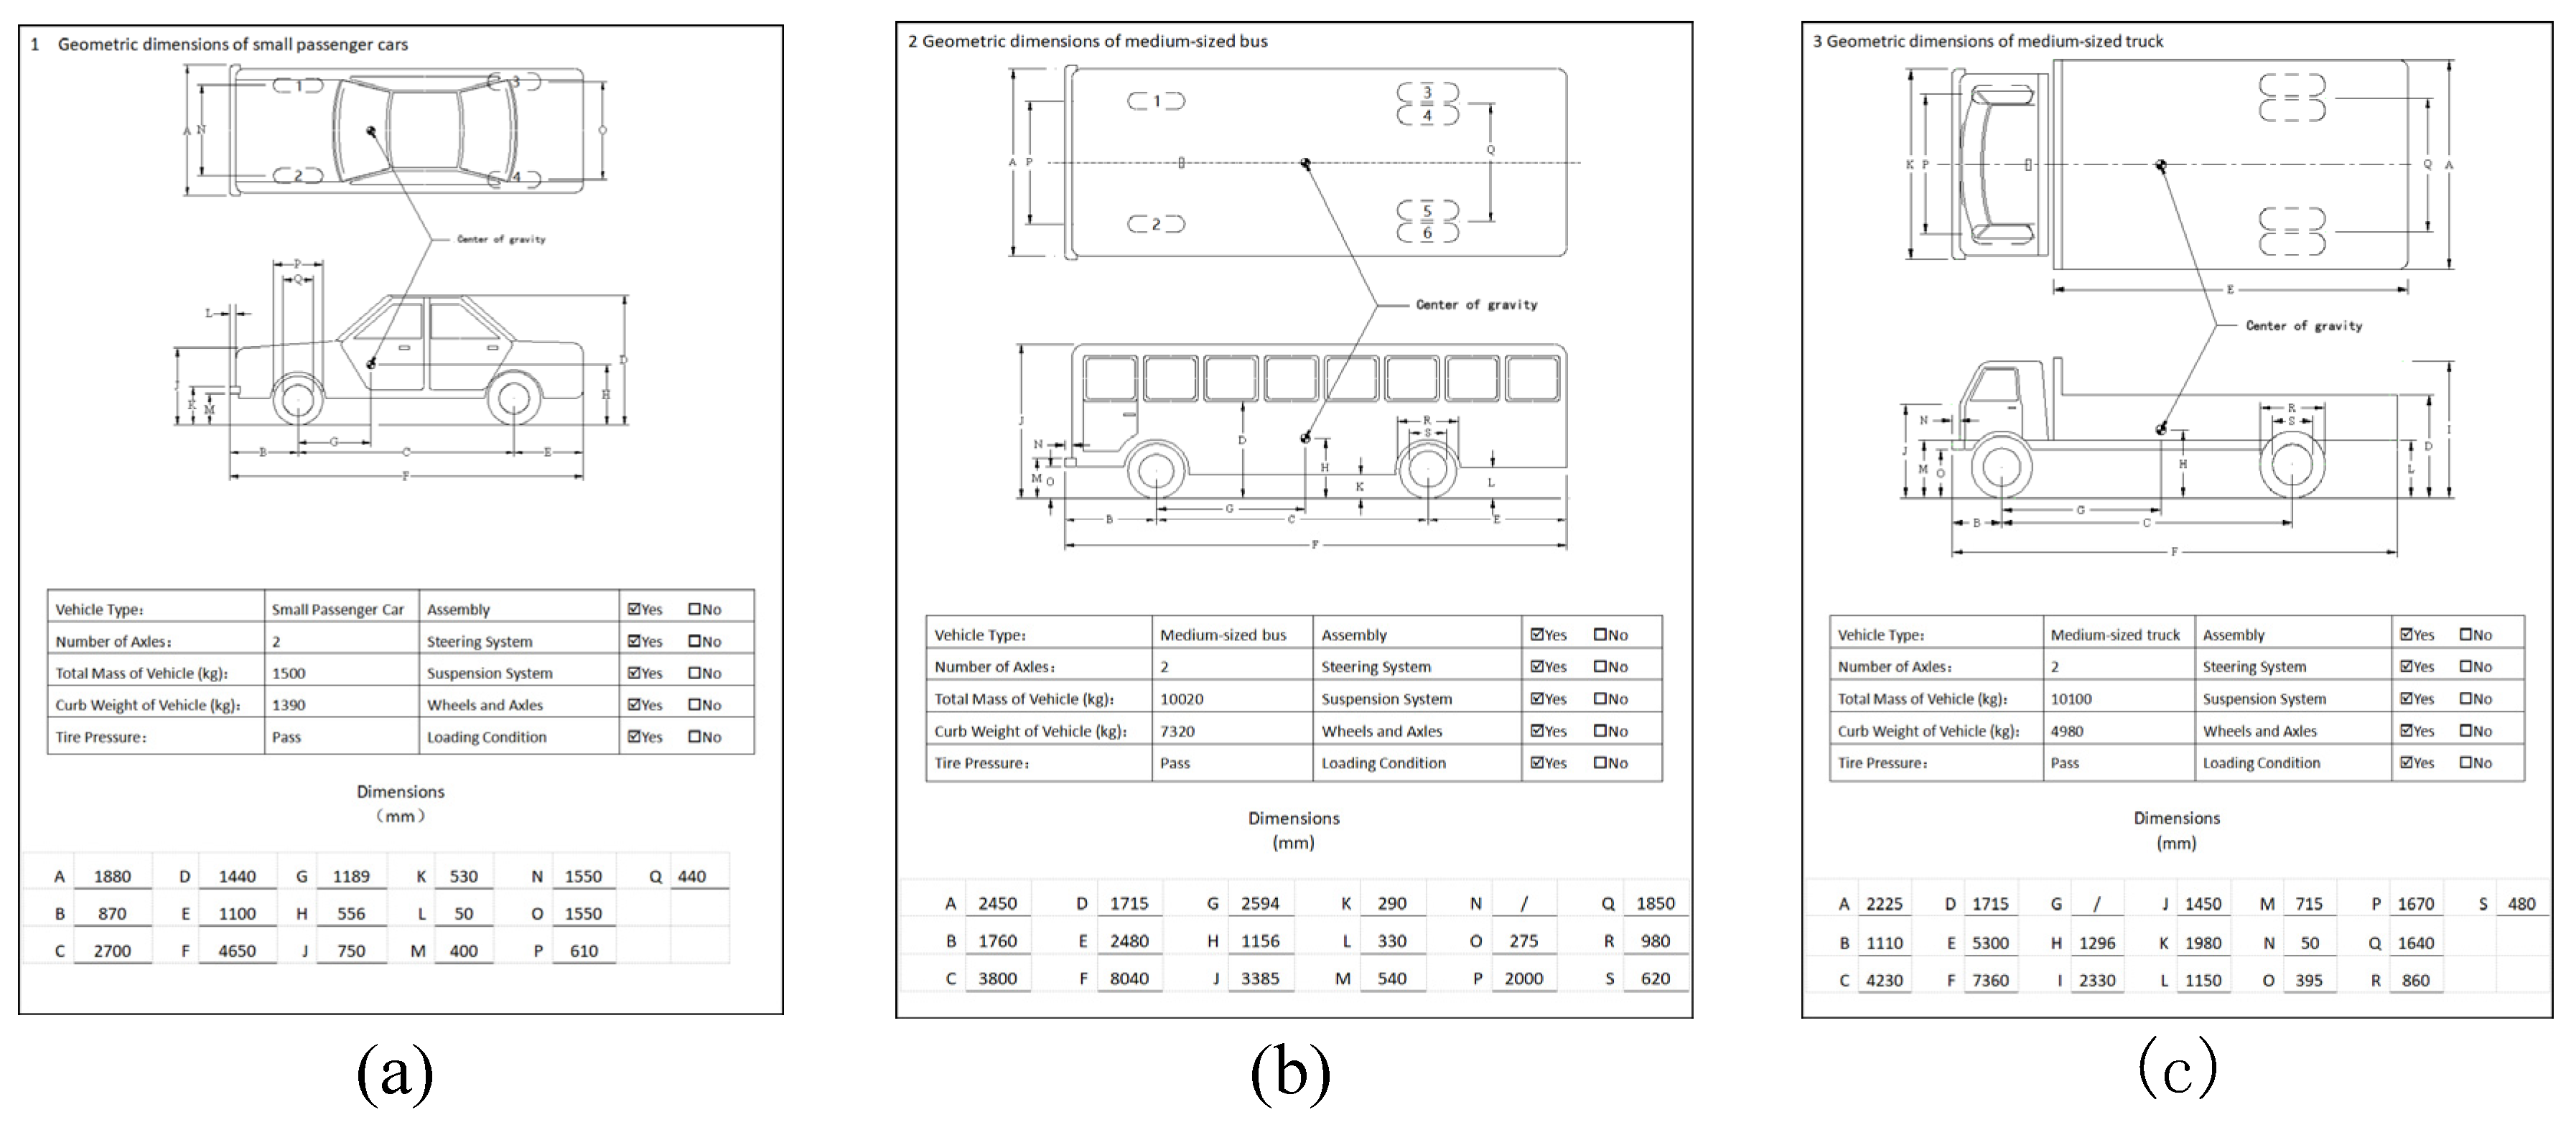
Table 2 details the collision conditions for Level A barriers. To effectively compare and analyze the differences between the two schemes, this study selected several key performance indicators: redirection performance, containment performance, buffering performance, deformation of the barrier and vehicle, and the anti-intrusion resistance of the barrier. These indicators were used to conduct both qualitative and quantitative analyses of the performance of the post-densification scheme in full-scale vehicle tests. During the medium bus test, extensive water spraying was conducted in the central median to simulate long-term rainfall conditions, thus analyzing the impact of rainfall on the performance of the divided central median barrier under low compaction conditions.Detailed information on the three vehicle types used in the full-scale tests can be found in
Figure 4.
2.5. Data Collection
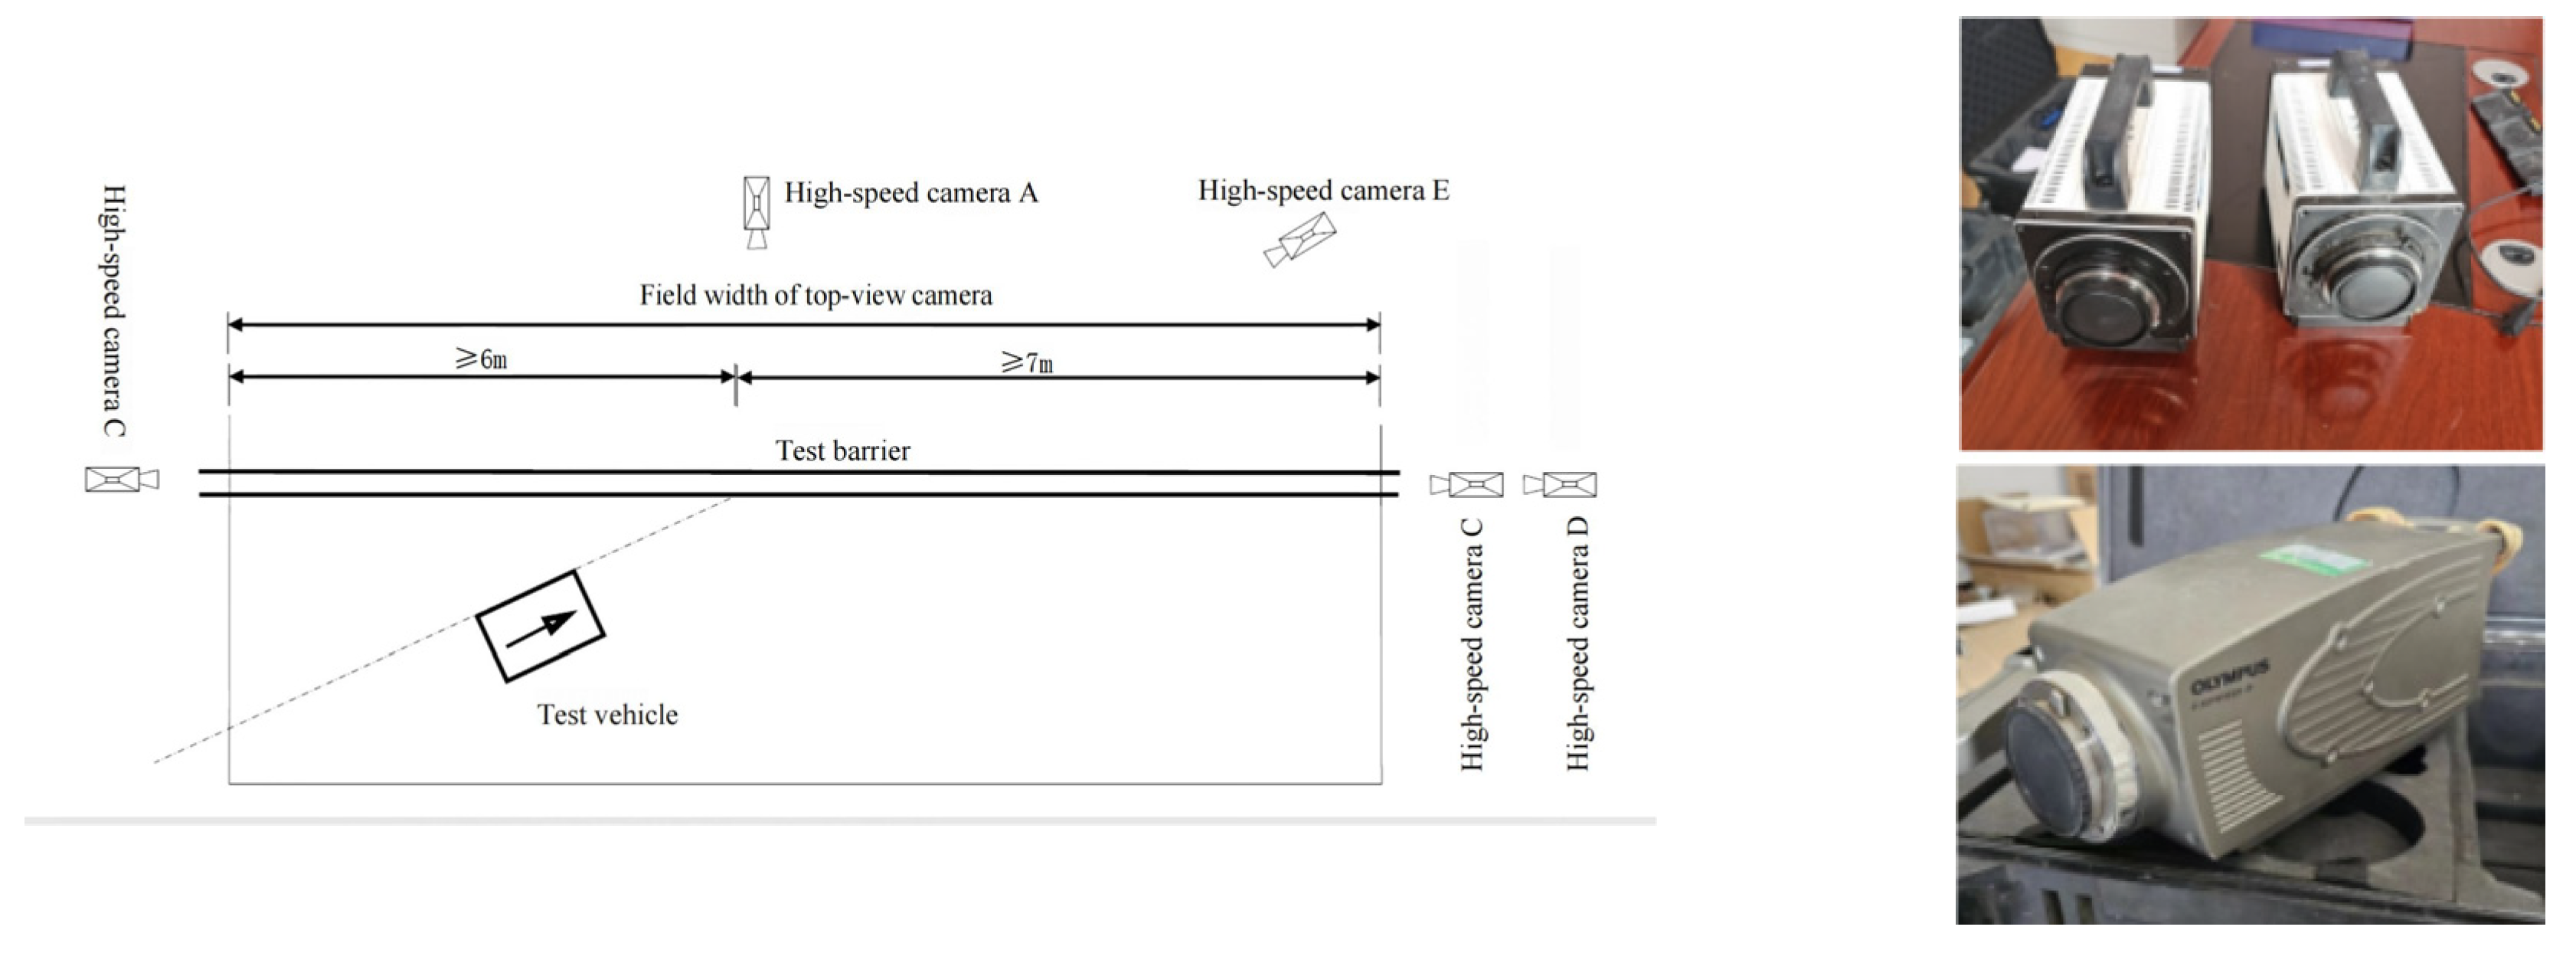
In this study, high-speed cameras (
Figure 5) were utilized to capture footage of each critical moment during vehicle-barrier collisions. The cameras operated at a frame rate of 500 frames per second, providing clear images and detailed observations. This allowed for thorough analysis of the vehicle’s motion and the deformation behavior of the test barriers.
Accelerometers were installed at the vehicle’s center of gravity to measure acceleration in both the longitudinal (X) and lateral (Y) directions. A dynamic data acquisition system was utilized to collect longitudinal and lateral acceleration data during the collision. This data was used to obtain and analyze technical indicators related to the buffering performance of the barrier during the collision. (
Figure 6)
2.6. Evaluation Parameters for Full-Scale Crash Tests
In this study, the safety performance of the barrier was analyzed and evaluated using the following indicators:
(1) Redirection Performance: This determines whether the test vehicle overturns and whether the vehicle’s wheel tracks upon exiting the collision meet the requirements of the standardized redirective exit box, as illustrated in
Figure 7.
Note:
(2) Containment Performance: This evaluates whether the test vehicle penetrates, overrides, or straddles the barrier during the collision. Additionally, it assesses whether any barrier components or dislodged parts intrude into the vehicle occupant compartment.
(3) Buffering Performance: The buffering performance of a barrier refers to its ability to mitigate the impact on the colliding vehicle and its occupants. This is typically evaluated using Occupant Impact Velocity (OIV) and Occupant Ridedown Acceleration (ORA). Initially, acceleration data at the center of gravity of the small passenger car were collected and processed using a CFC-60 low-pass filter to obtain the acceleration curve at the vehicle’s center of gravity. According to standard requirements, the filtered acceleration data were integrated once to obtain the occupant impact velocity curve. A second integration provided the theoretical displacement curve of the assumed occupant’s head relative to the vehicle’s coordinate system. The time of collision was determined by selecting the lesser value between a 0.6-meter movement along the longitudinal axis (x-direction) and a 0.3-meter movement along the lateral axis (y-direction) of the occupant compartment. The value of the OIV was taken from the occupant impact velocity curve at this time. Following the assumed collision of the occupant’s head with the interior of the occupant compartment, the ORA values in both directions were determined by calculating the average maximum acceleration at the vehicle’s center of gravity over 10-millisecond intervals.
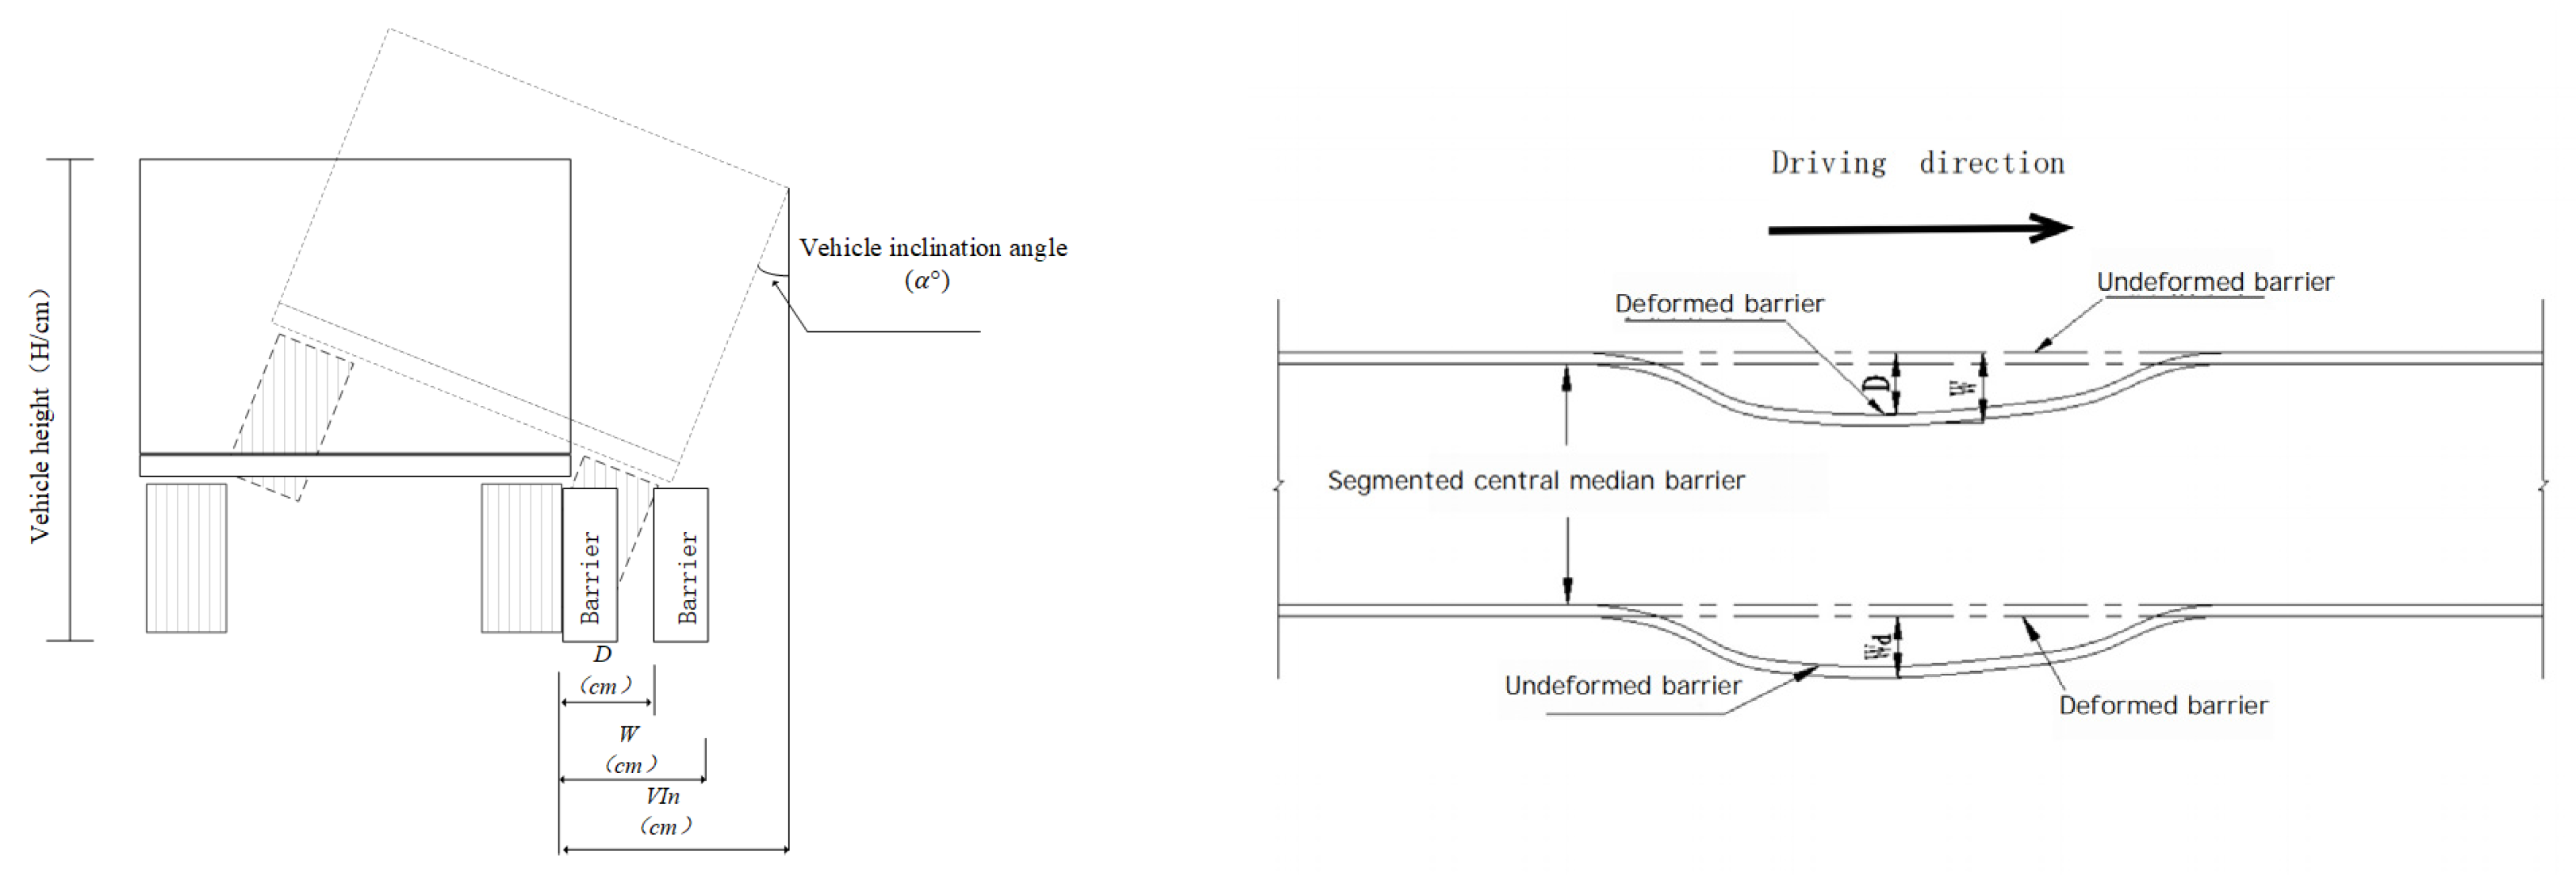
(4) Barrier Anti-intrusion Resistance: The barrier’s ability to prevent out-of-control vehicles from colliding with obstacles within the central median or from intruding into the opposite traffic lane (
Figure 8). The control indicators include:
Maximum dynamic lateral deflection of highway barrier (D): During the vehicle collision test, this is the maximum lateral horizontal displacement of the impacted face of the barrier relative to its initial position.
Maximum dynamic widening distance of lateral deflection of highway barrier (W): During the vehicle collision test, this is the maximum lateral horizontal distance from the outermost edge of the deformed barrier to the innermost edge of the barrier before the collision.
Maximum dynamic vehicle incline-out distance (VI): During the collision test, this is the maximum lateral horizontal distance from the outermost edge of the vehicle to the innermost edge of the barrier before the collision, observed when medium and large vehicles (including extra-large buses) overhang.
Normalized maximum dynamic vehicle incline-out distance (VIn): The maximum dynamic overhang value of the vehicle measured in full-scale crash tests, converted based on a total vehicle height of 4.2 meters.
Barrier intrusion distance (Wd): During the vehicle-barrier collision process, this is the maximum lateral horizontal distance of the outermost edge of the opposite barrier of the divided central median barrier after deformation, relative to its outermost edge before the collision.
3. Results and Discussion
3.1. Redirection Performance and Containment Performance
In this small passenger car test, the measured soil compaction degree of the central median in the barrier installation area was 83%. The vehicle collided with the barrier panel between posts 13th and 14th, resulting in significant horizontal displacement near the ground end of the barrier panel. Subsequently, the vehicle’s right front wheel hit posts 14th and 15th. After the front of the vehicle passed post 16th, the vehicle’s direction became parallel to the barrier. The test vehicle disengaged from the barrier at post 17th; after disengagement, the test vehicle continued to travel without being affected by the curbv (
Figure 9). Throughout the collision process, the near-ground ends of posts 13th to 17thexperienced significant lateral displacement due to soil compression, with the collision causing a barrier deformation length of 8 meters. The vehicle’s speed was 104 km·h
-1 at the time of collision and 60.1 km·h
-1 at the time of disengagement, resulting in a kinetic energy loss of 67%.
In the medium bus test, the measured soil compaction degree of the central median in the barrier installation area was 77%. Subsequently, the soil was soaked with water to ensure that the soil moisture content within the tree pit depth range (60 cm) exceeded 20%. During the test, the vehicle first collided with post 13th and then post 15th, after which its direction became parallel to the barrier. The rear of the vehicle then fishtailed, hitting the barrier panel between posts 13th and 14th. The test vehicle disengaged from the barrier at post 17th. After disengagement, the right wheels of the test vehicle were affected by the curb, causing the vehicle to travel closely along the barrier, with mutual friction leading to deceleration until the vehicle came to a stop (
Figure 10).The entire collision process resulted in significant horizontal displacement of posts 12th to 25th, with posts 14th to 18th leaning against the opposite barrier panel, causing a barrier deformation length of 26 meters. The vehicle’s initial collision speed was 61.3 km·h
-1, and the disengagement speed was 30.6 km·h
-1, resulting in a kinetic energy loss of 75%.
In the medium truck test, the measured soil compaction degree of the central median in the barrier installation area was 81%. The vehicle initially collided with the barrier panel between posts 13th and 14th. After the vehicle’s front end passed post 16th, its direction became parallel to the barrier. Subsequently, the rear of the vehicle fishtailed, hitting the barrier panel between posts 14th and 15th. The test vehicle disengaged from the barrier at post 18th. After disengagement, the test vehicle was influenced by the curb, causing it to travel closely along the barrier. Due to the limited length of the curb installation, the test vehicle eventually disengaged in an area without curb installation and exited the barrier zone (
Figure 11). The entire collision process resulted in significant horizontal displacement of posts 12th to 19th, with the affected barrier length being 14 meters. The vehicle’s collision speed was 61 km·h
-1, and the disengagement speed was 33.2 km·h
-1, resulting in a kinetic energy loss of 70%.
During the full-scale crash tests of the three vehicle types, no incidents of vehicles breaching, overriding, or straddling the barrier occurred. The test barrier components and any detached parts did not intrude into the vehicle occupant compartments, demonstrating that the barrier’s containment performance met design requirements. Additionally, none of the three vehicle types experienced rollover during the tests, and the wheel tracks after exiting the impact point met the technical requirements of the standard redirective exit box, indicating that the barrier’s redirection performance was also in compliance with the standards.
3.2. Barrier Deformation
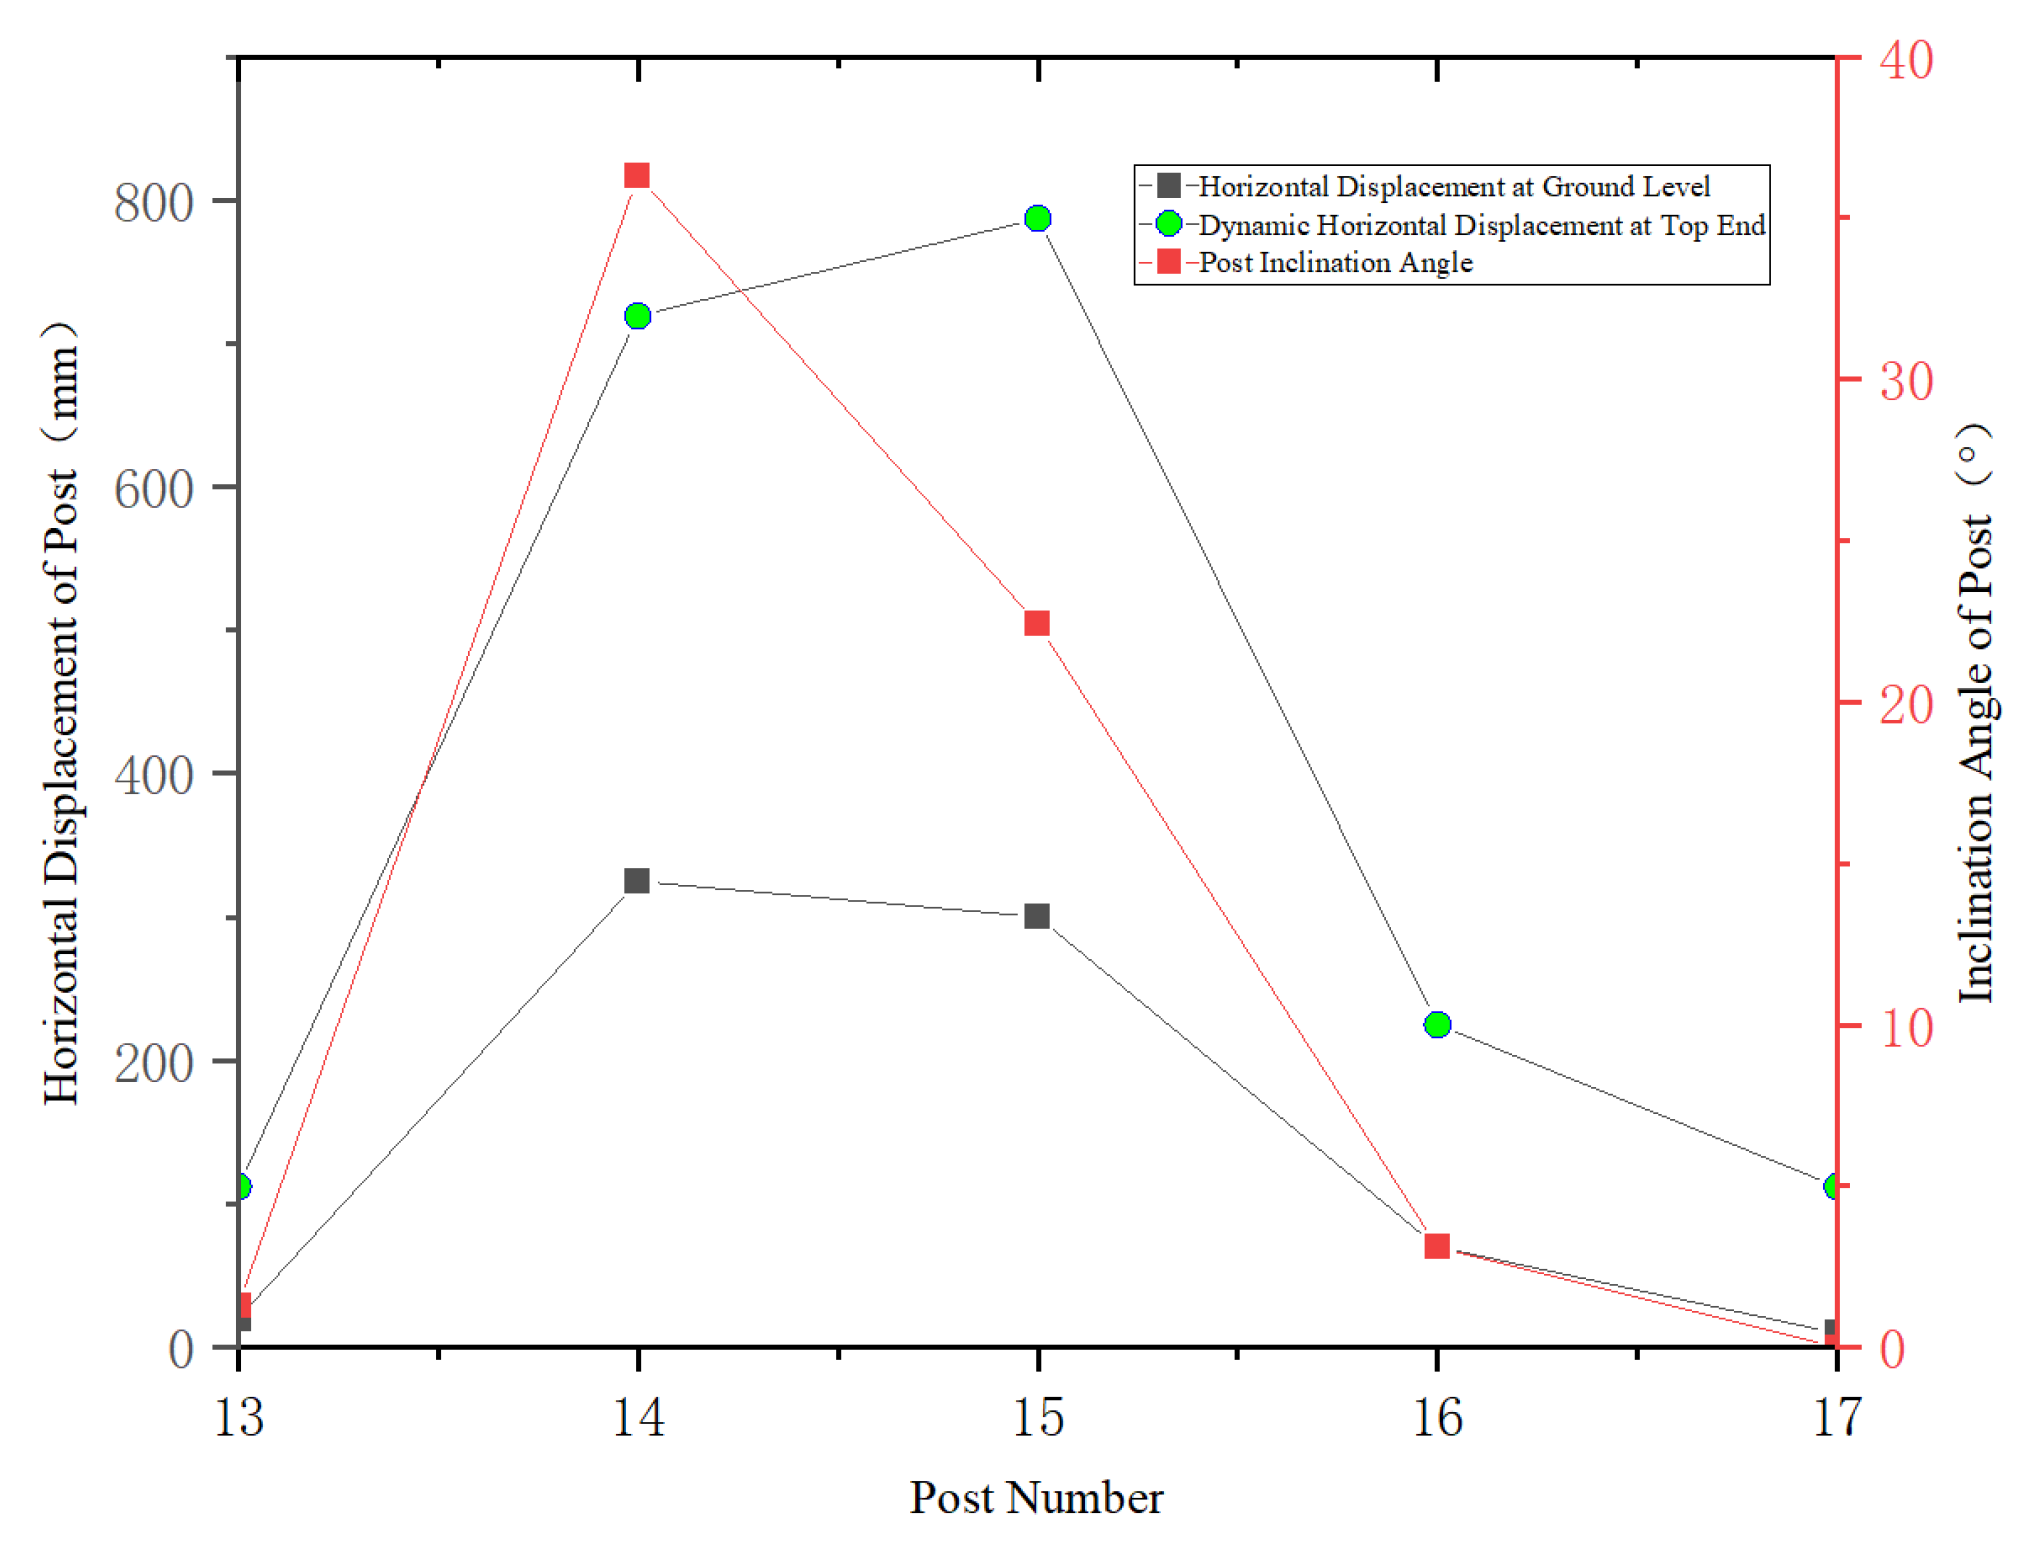
In the small passenger car test, the barrier posts numbered 13th to 17th experienced lateral displacement and soil compression, resulting in a total foundation deformation of 725 mm around the posts, with an average deformation of 145 mm and a maximum deformation of 325 mm (14th). The total dynamic displacement at the top of the posts was 1955 mm, with an average of 391 mm and a maximum of 787 mm (15th)(
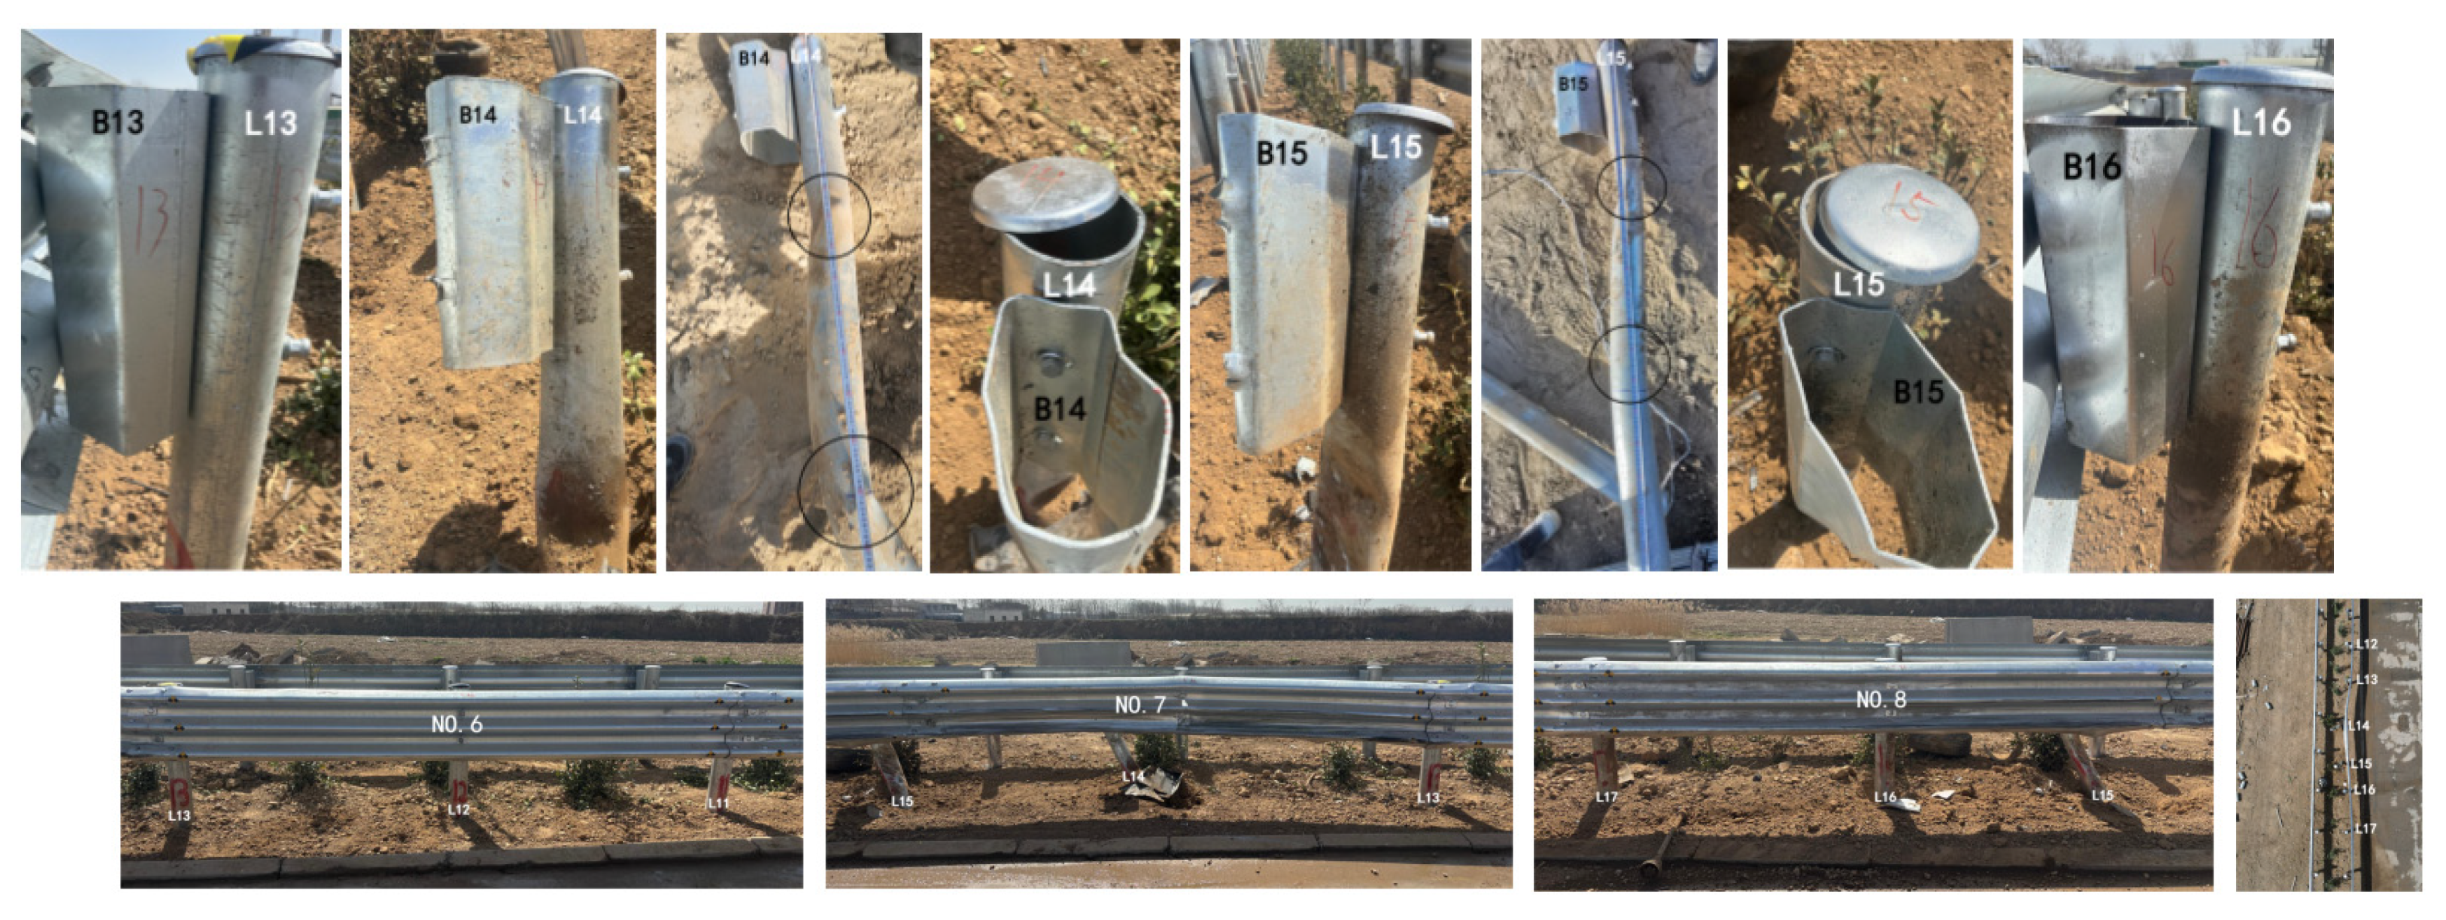
Figure 12). The maximum tilt angle of the posts was 36.3° (14th). The 14th post bent 505 mm below ground with a bending angle of 31.2°, and experienced deformation 290 mm above ground. The 15th post bent 585 mm below ground with a bending angle of 6.7°, and experienced deformation 250 mm above ground. The anti-block bolts of the 14th and 15th posts perforated and detached from the barrier panel. During the test, the barrier panels did not fracture and the overall deformation was minimal (
Figure 13).
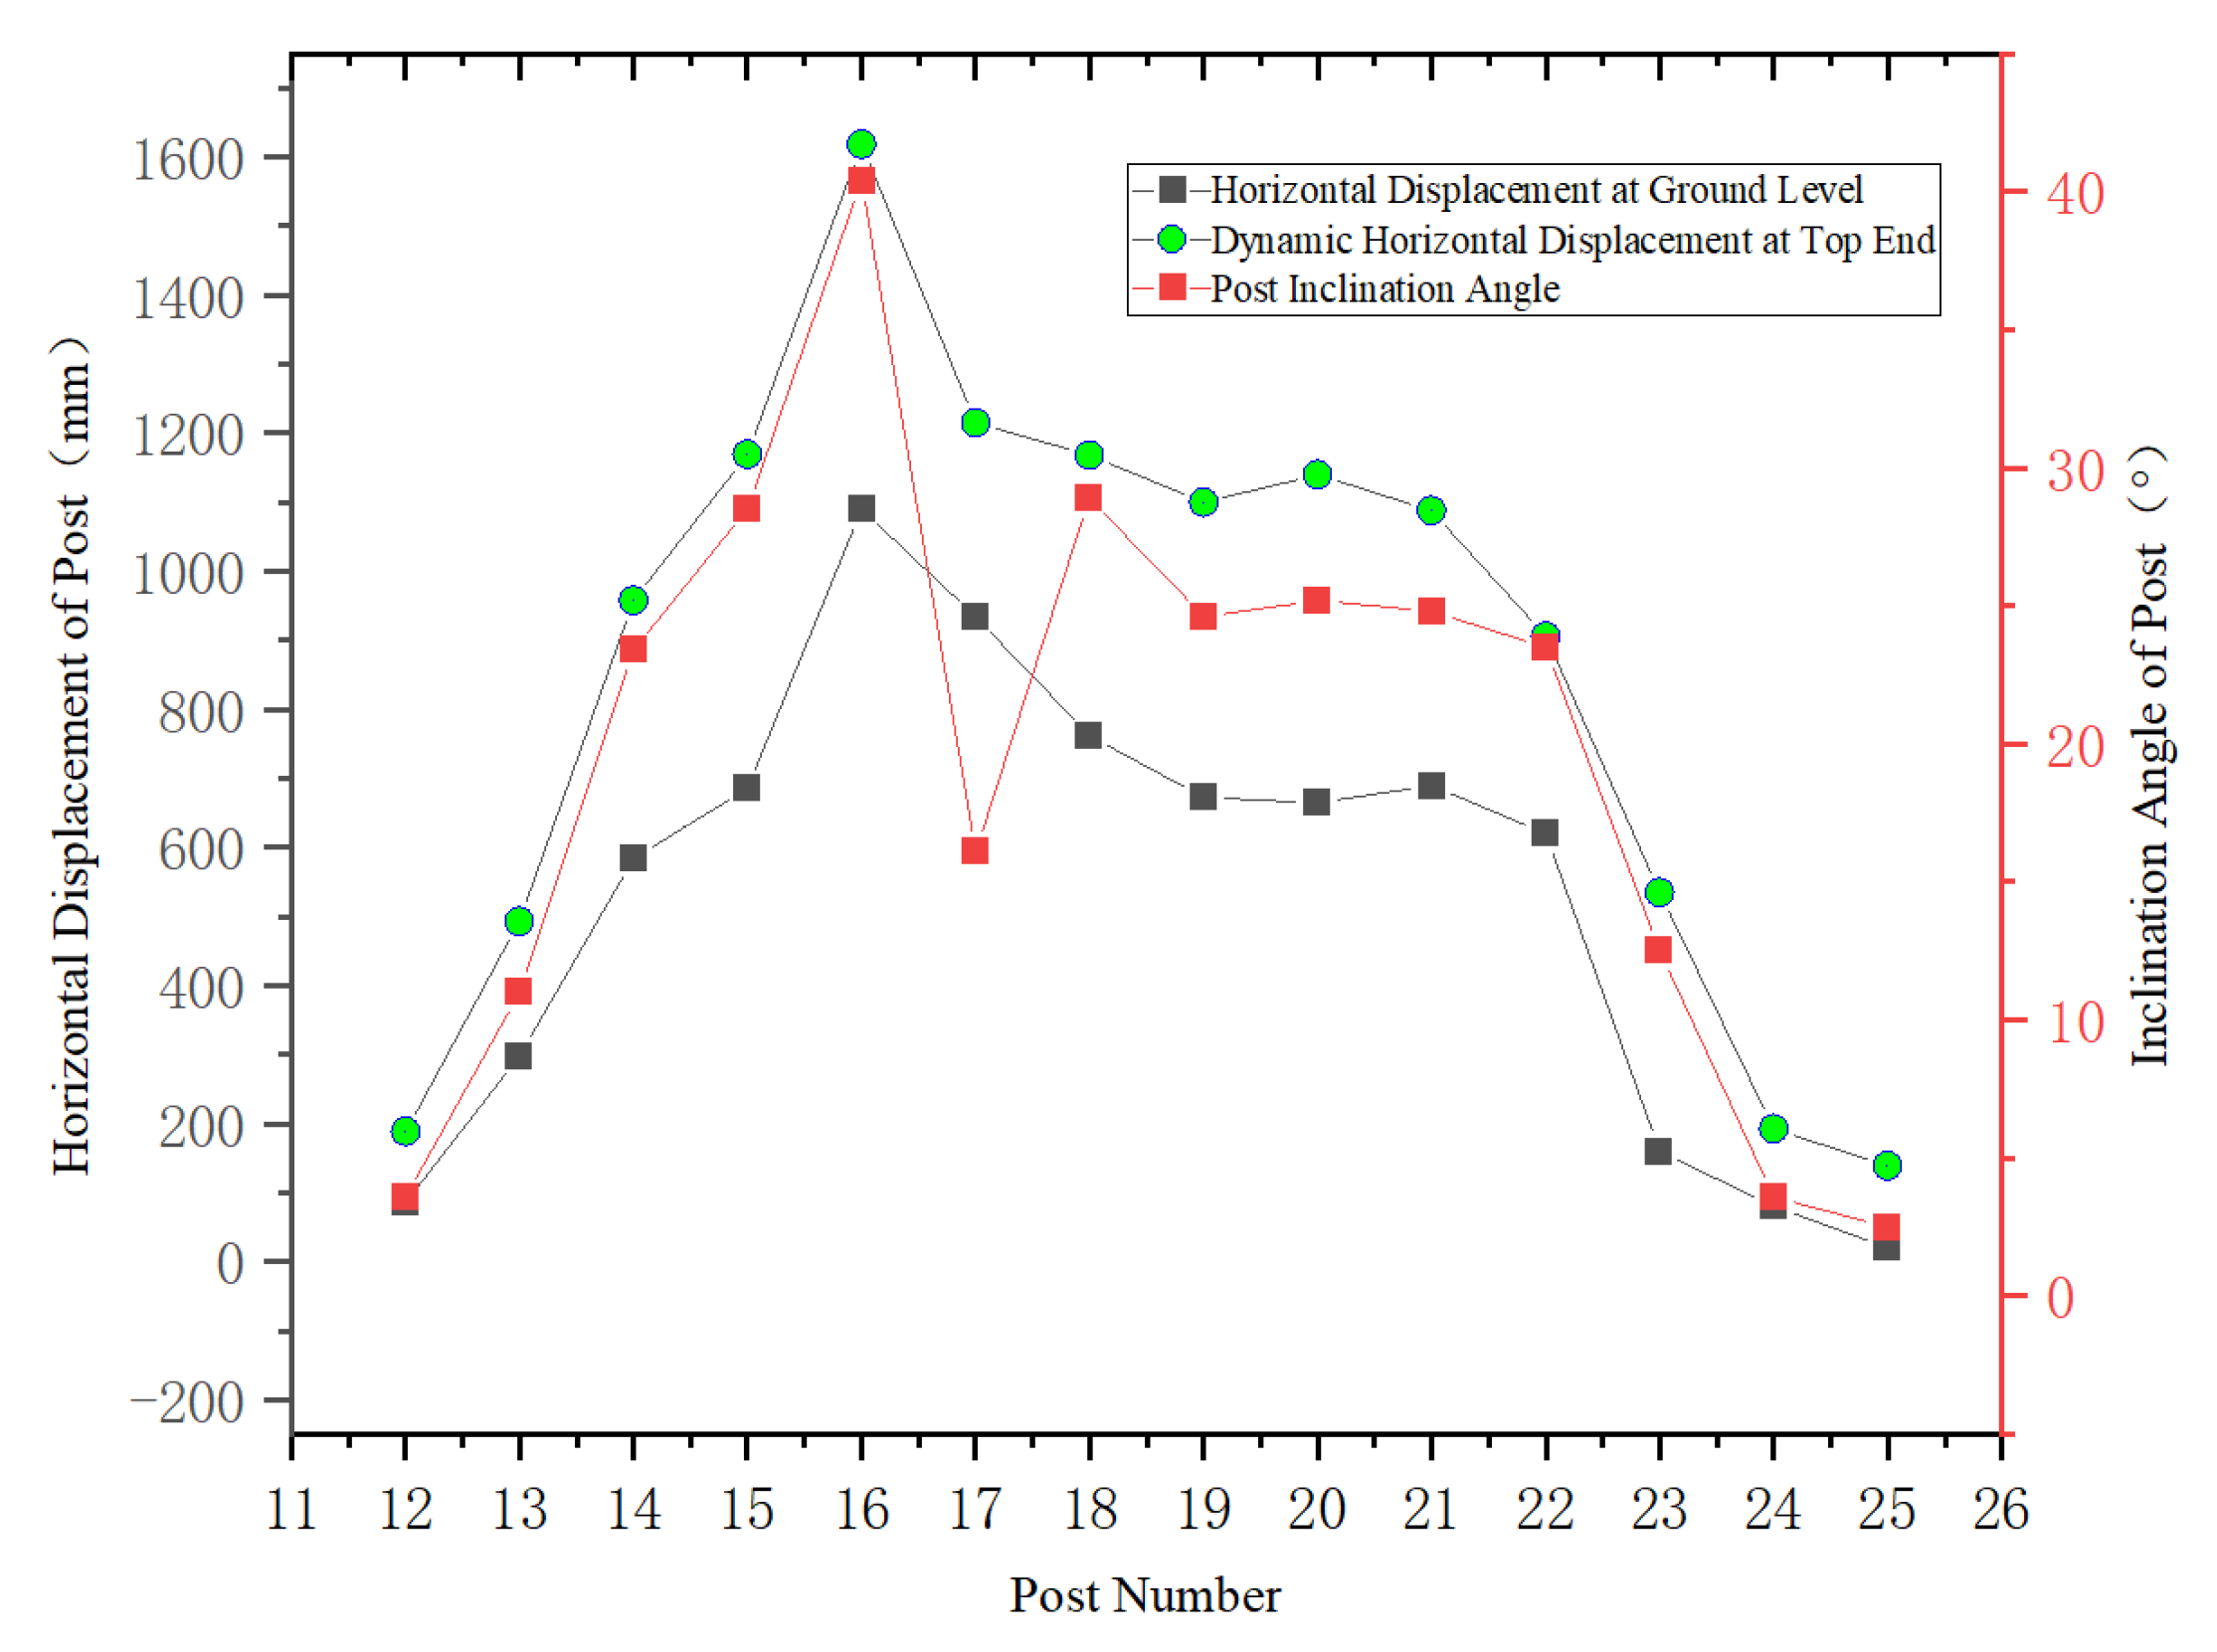
In the medium bus collision test, the impact caused the 12th-25th posts to undergo lateral displacement and compression of the subgrade, resulting in a total deformation of the surrounding foundation of 7343mm, with an average value of 525mm and a maximum value of 1090mm (16
th). The total dynamic displacement of the post tops was 11911mm, with an average value of 851mm and a maximum value of 1618mm (16
th). The maximum inclination angle of the 16
th post reached 40.4°. The 15
th, 16
th, 17
th, and 18
th posts were damaged and deformed due to being run over by the right rear wheel of the vehicle, with the damaged areas within 300mm above the ground. The anti-collision block connection bolts of the 16
th post were perforated, causing the anti-collision block assembly to detach from the barrier plate system, resulting in the displacement of the 16
th post no longer being affected by the subsequent rebound of the barrier plate. This explains why the 16th post had the largest displacement and showed a sudden change in the data graph (
Figure 14). The anti-collision block of the 17
th post did not fall off, but it relied on the opposing barrier post when impacted by the rear wheel of the vehicle, resulting in a reverse bend 23mm above the ground with a bend angle of 36.6°, which also reduced its inclination angle. From the post-test barrier plates, it can be seen that during the test, the splice bolts between the barrier plates did not fall off, and the connections were tight, with no fractures or significant damage to the barrier platesminimal (
Figure 15).
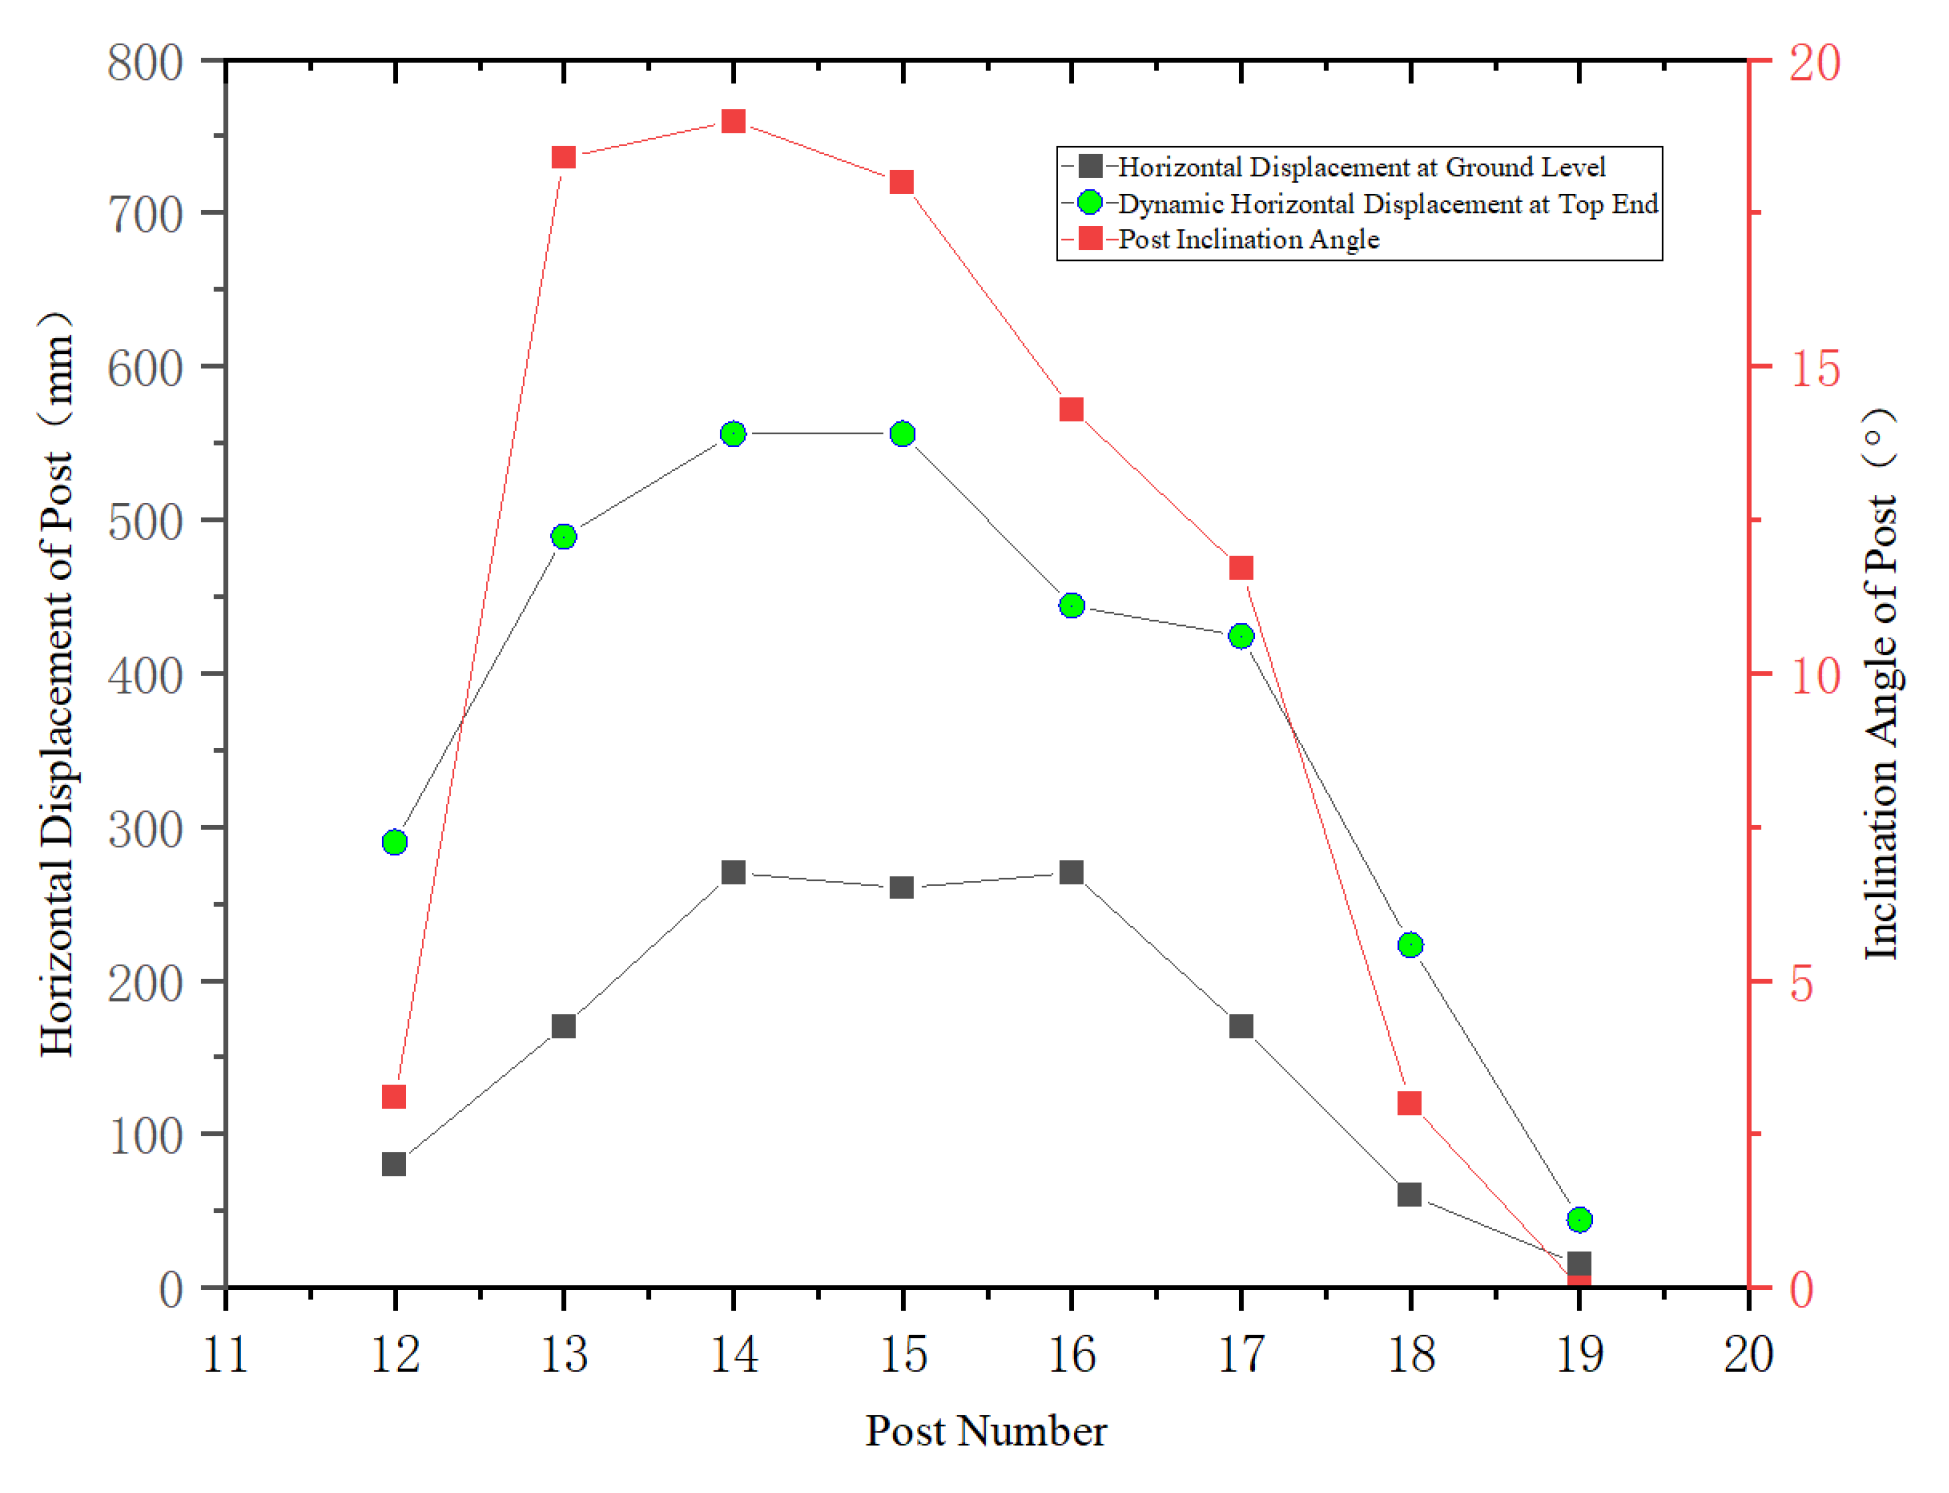
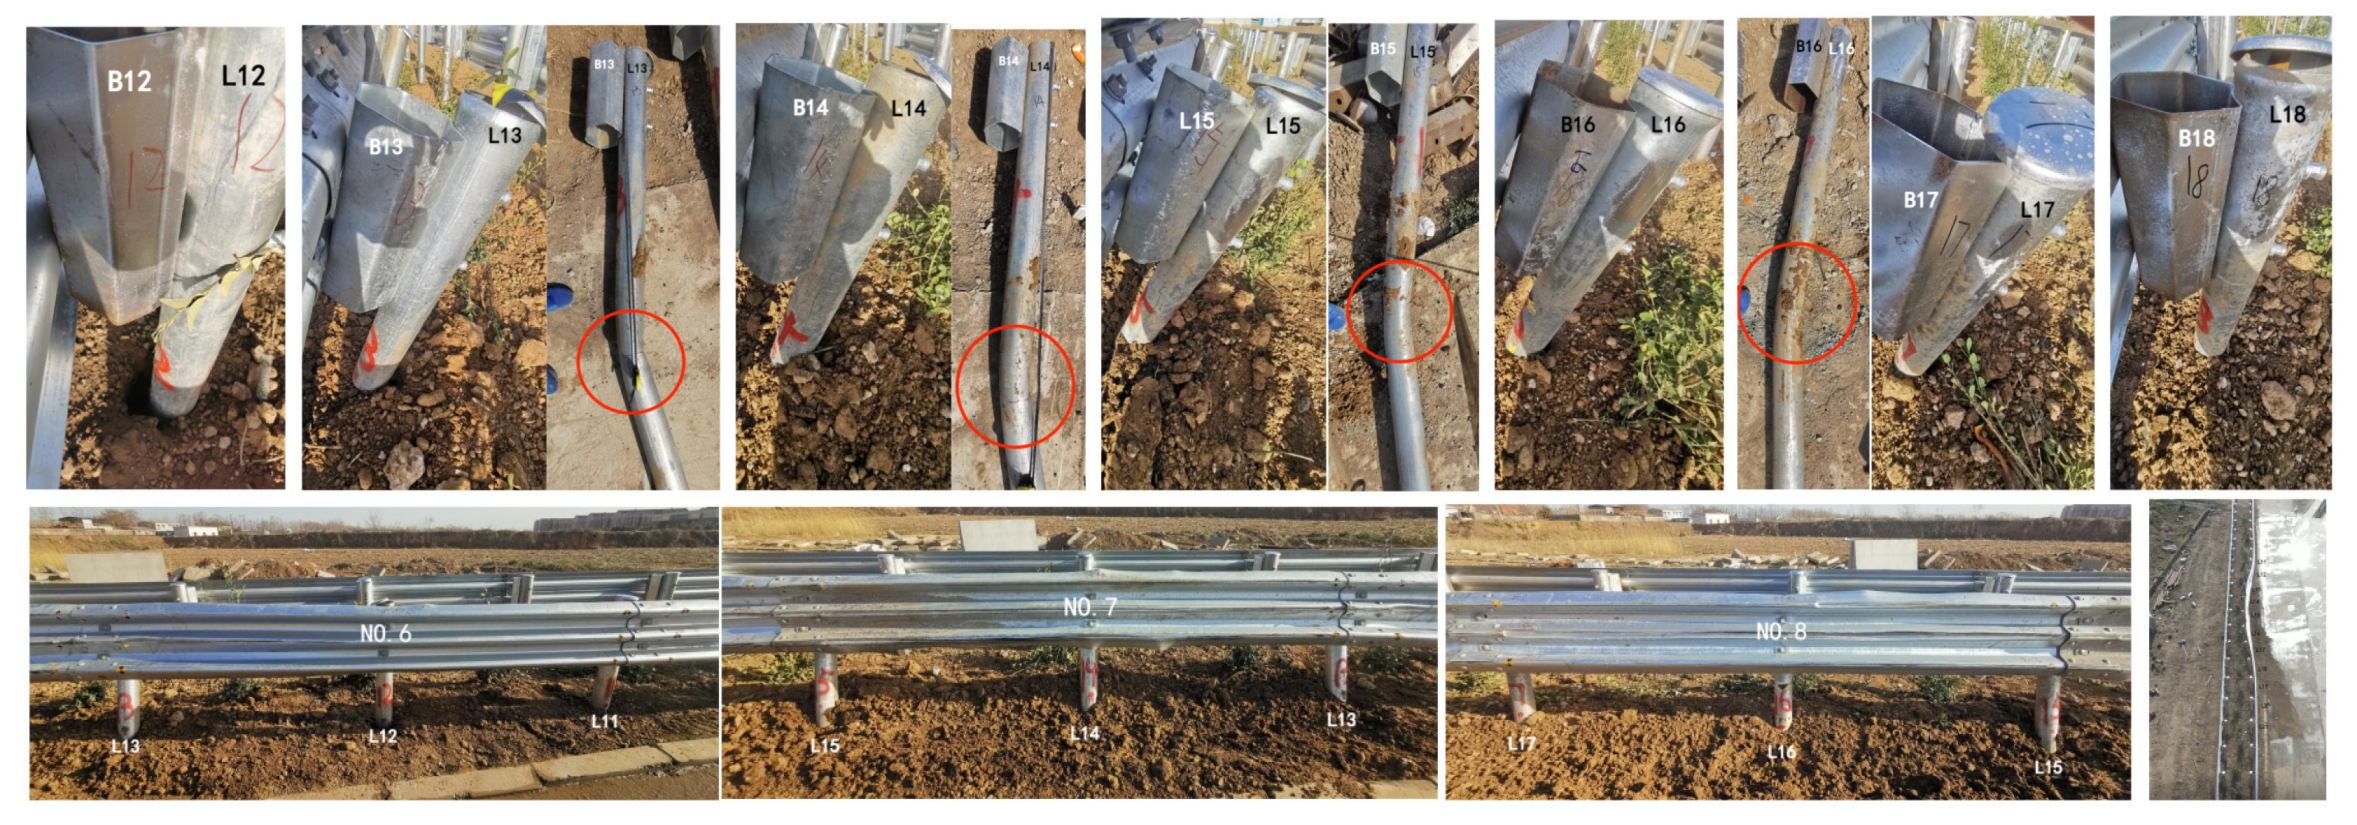
In the test with a medium truck, the collision caused lateral displacement and soil compression around posts 12th to 19th, with a total foundation deformation of 1295 mm, averaging 162 mm, and peaking at 270 mm (14th and 16th). The dynamic displacement at the post tops totaled 3026 mm, averaging 378 mm, peaking at 556 mm (14th and 15th), with a maximum inclination angle of 19° (14th). 13th experienced a bend below at 492 mm depth with a bend angle of 21.4°; 14th at 597 mm depth with a bend angle of 14.5°; post 15th at 512 mm depth with a bend angle of 13°; post 16th at 364 mm depth with a minimal bend angle; and post 17th at 579 mm depth with a bend angle of 11.2° (
Figure 16).Throughout the experiment, there were no instances of separation between the post’s energy-absorbing block and the barrier panel, and no fractures were observed in the barrier panels. Panels 6th, 7th, and 8th bent at posts 12th, 14th, and 16th respectively, with varying degrees of corrugation, yet overall barrier deformation was minimal (
Figure 17).
3.3. Vehicle Deformation
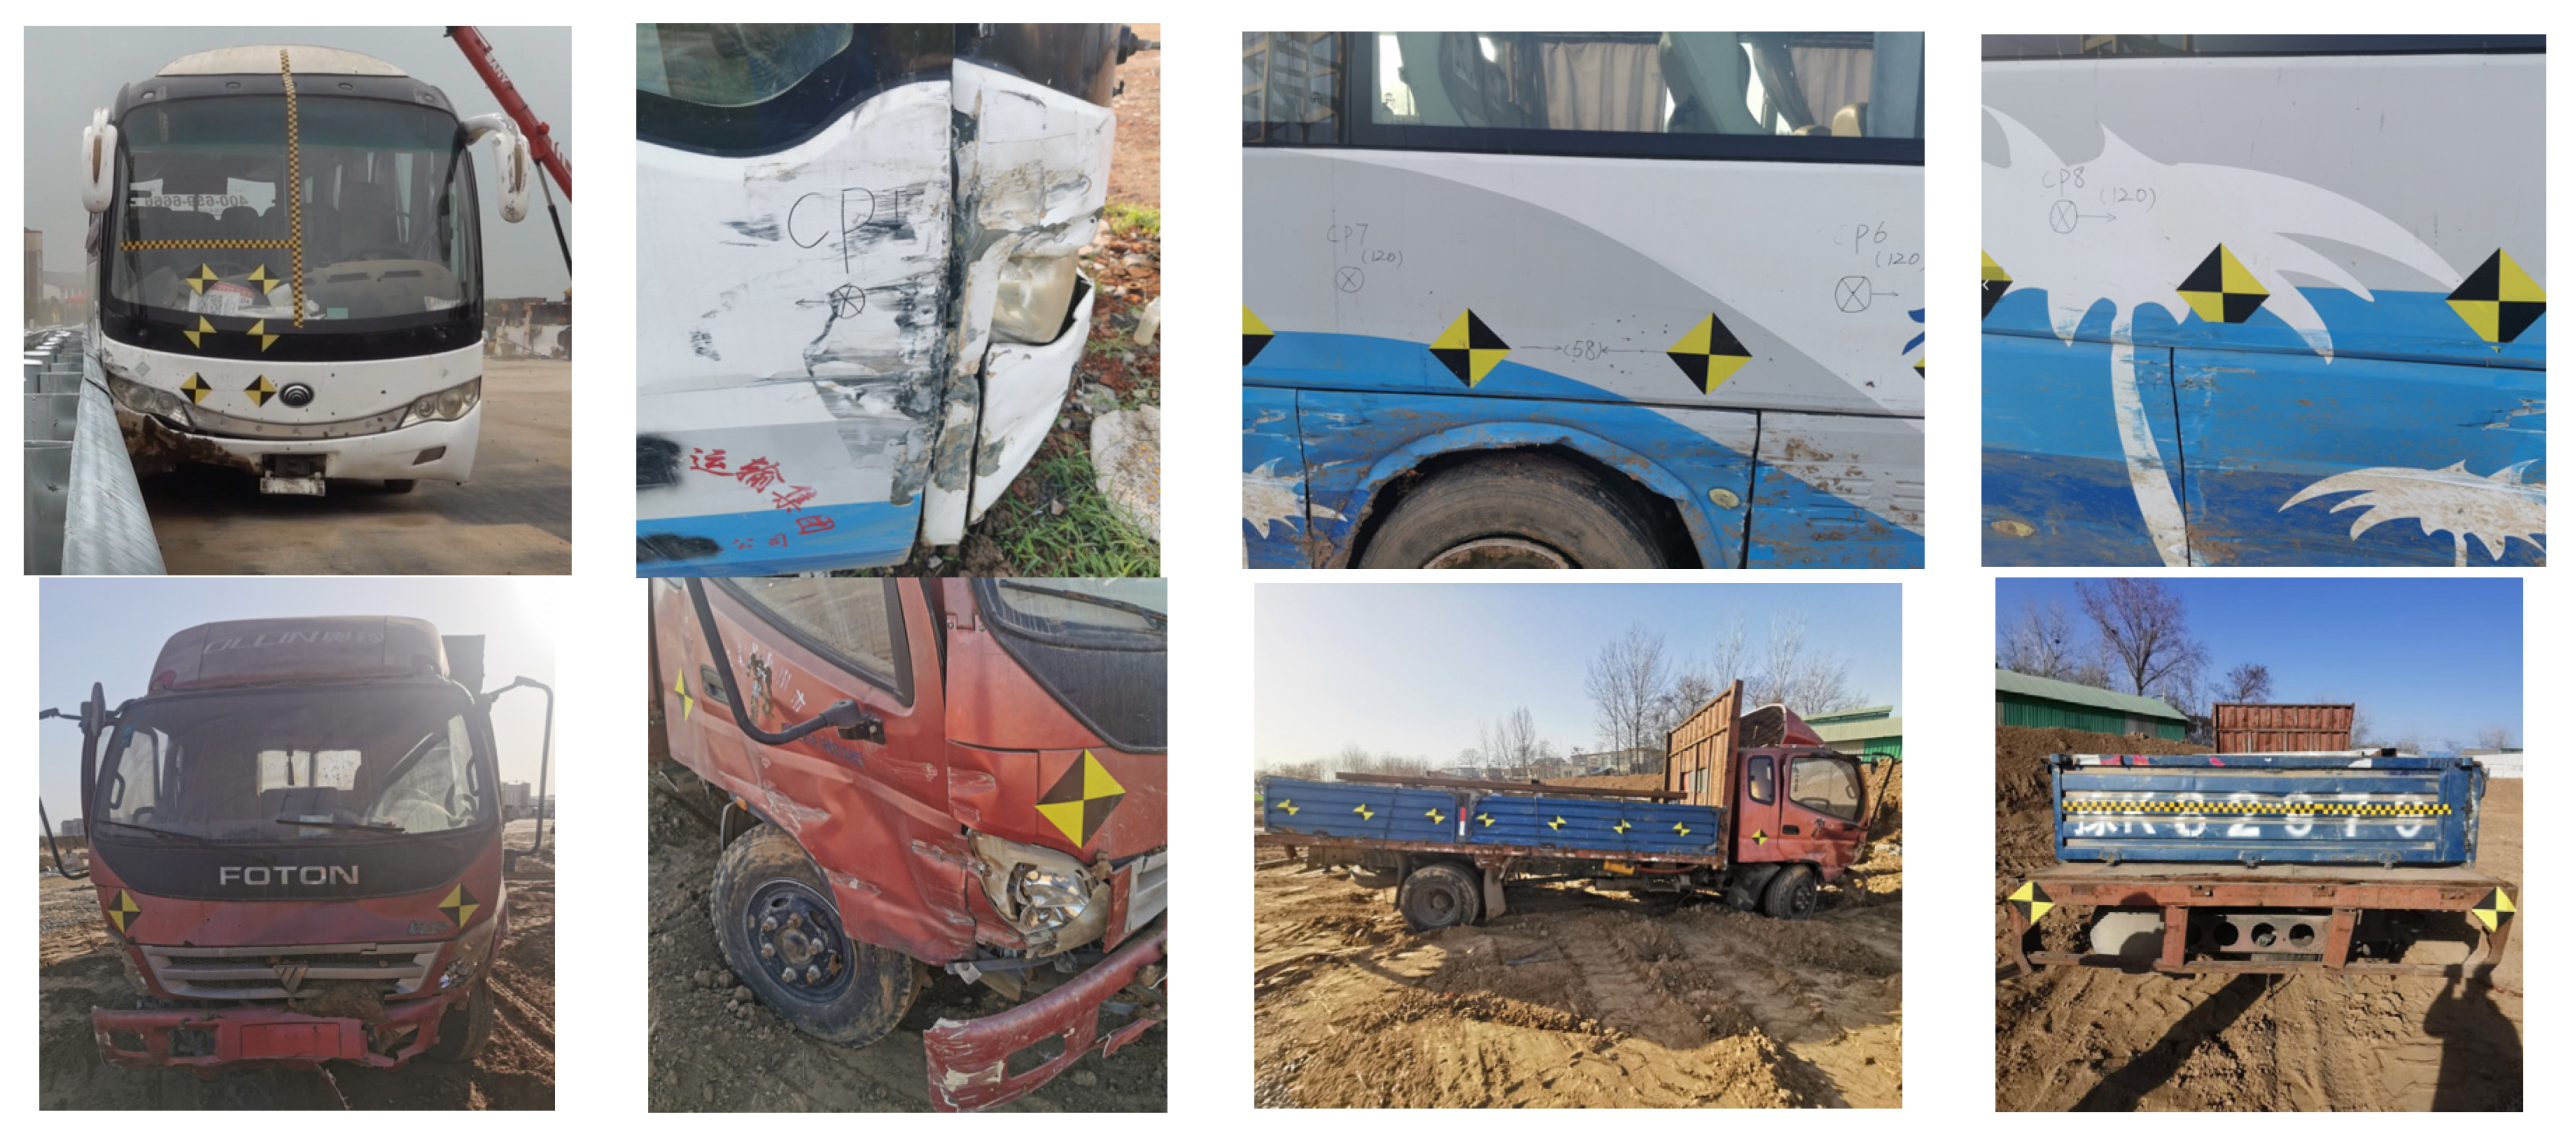
Due to the low soil compaction, in the small passenger car test, the vehicle’s impact on the post compressed the soil, causing horizontal displacement and tilting of the post at ground level. The wheel on the impact side crossed the post axis after striking the barrier, and during the reorientation process, the vehicle struck the 14th and 15th posts, resulting in the detachment of the right front wheel and causing some deformation at that position. In the medium bus test, the vehicle was smoothly guided out of the collision zone after impacting the barrier. Due to the influence of the curb, the vehicle decelerated while closely rubbing against the barrier until it stopped. Post-collision inspection revealed minor scratches on the impact side and a shattered right front window. In the medium truck test, the collision resulted in damage to the right headlight and front bumper, with slight deformation observed on the right door. The deformations in all three vehicles did not affect the occupant compartments.
Figure 18.
Vehicle deformation.
Figure 18.
Vehicle deformation.
3.4. Buffering Performance
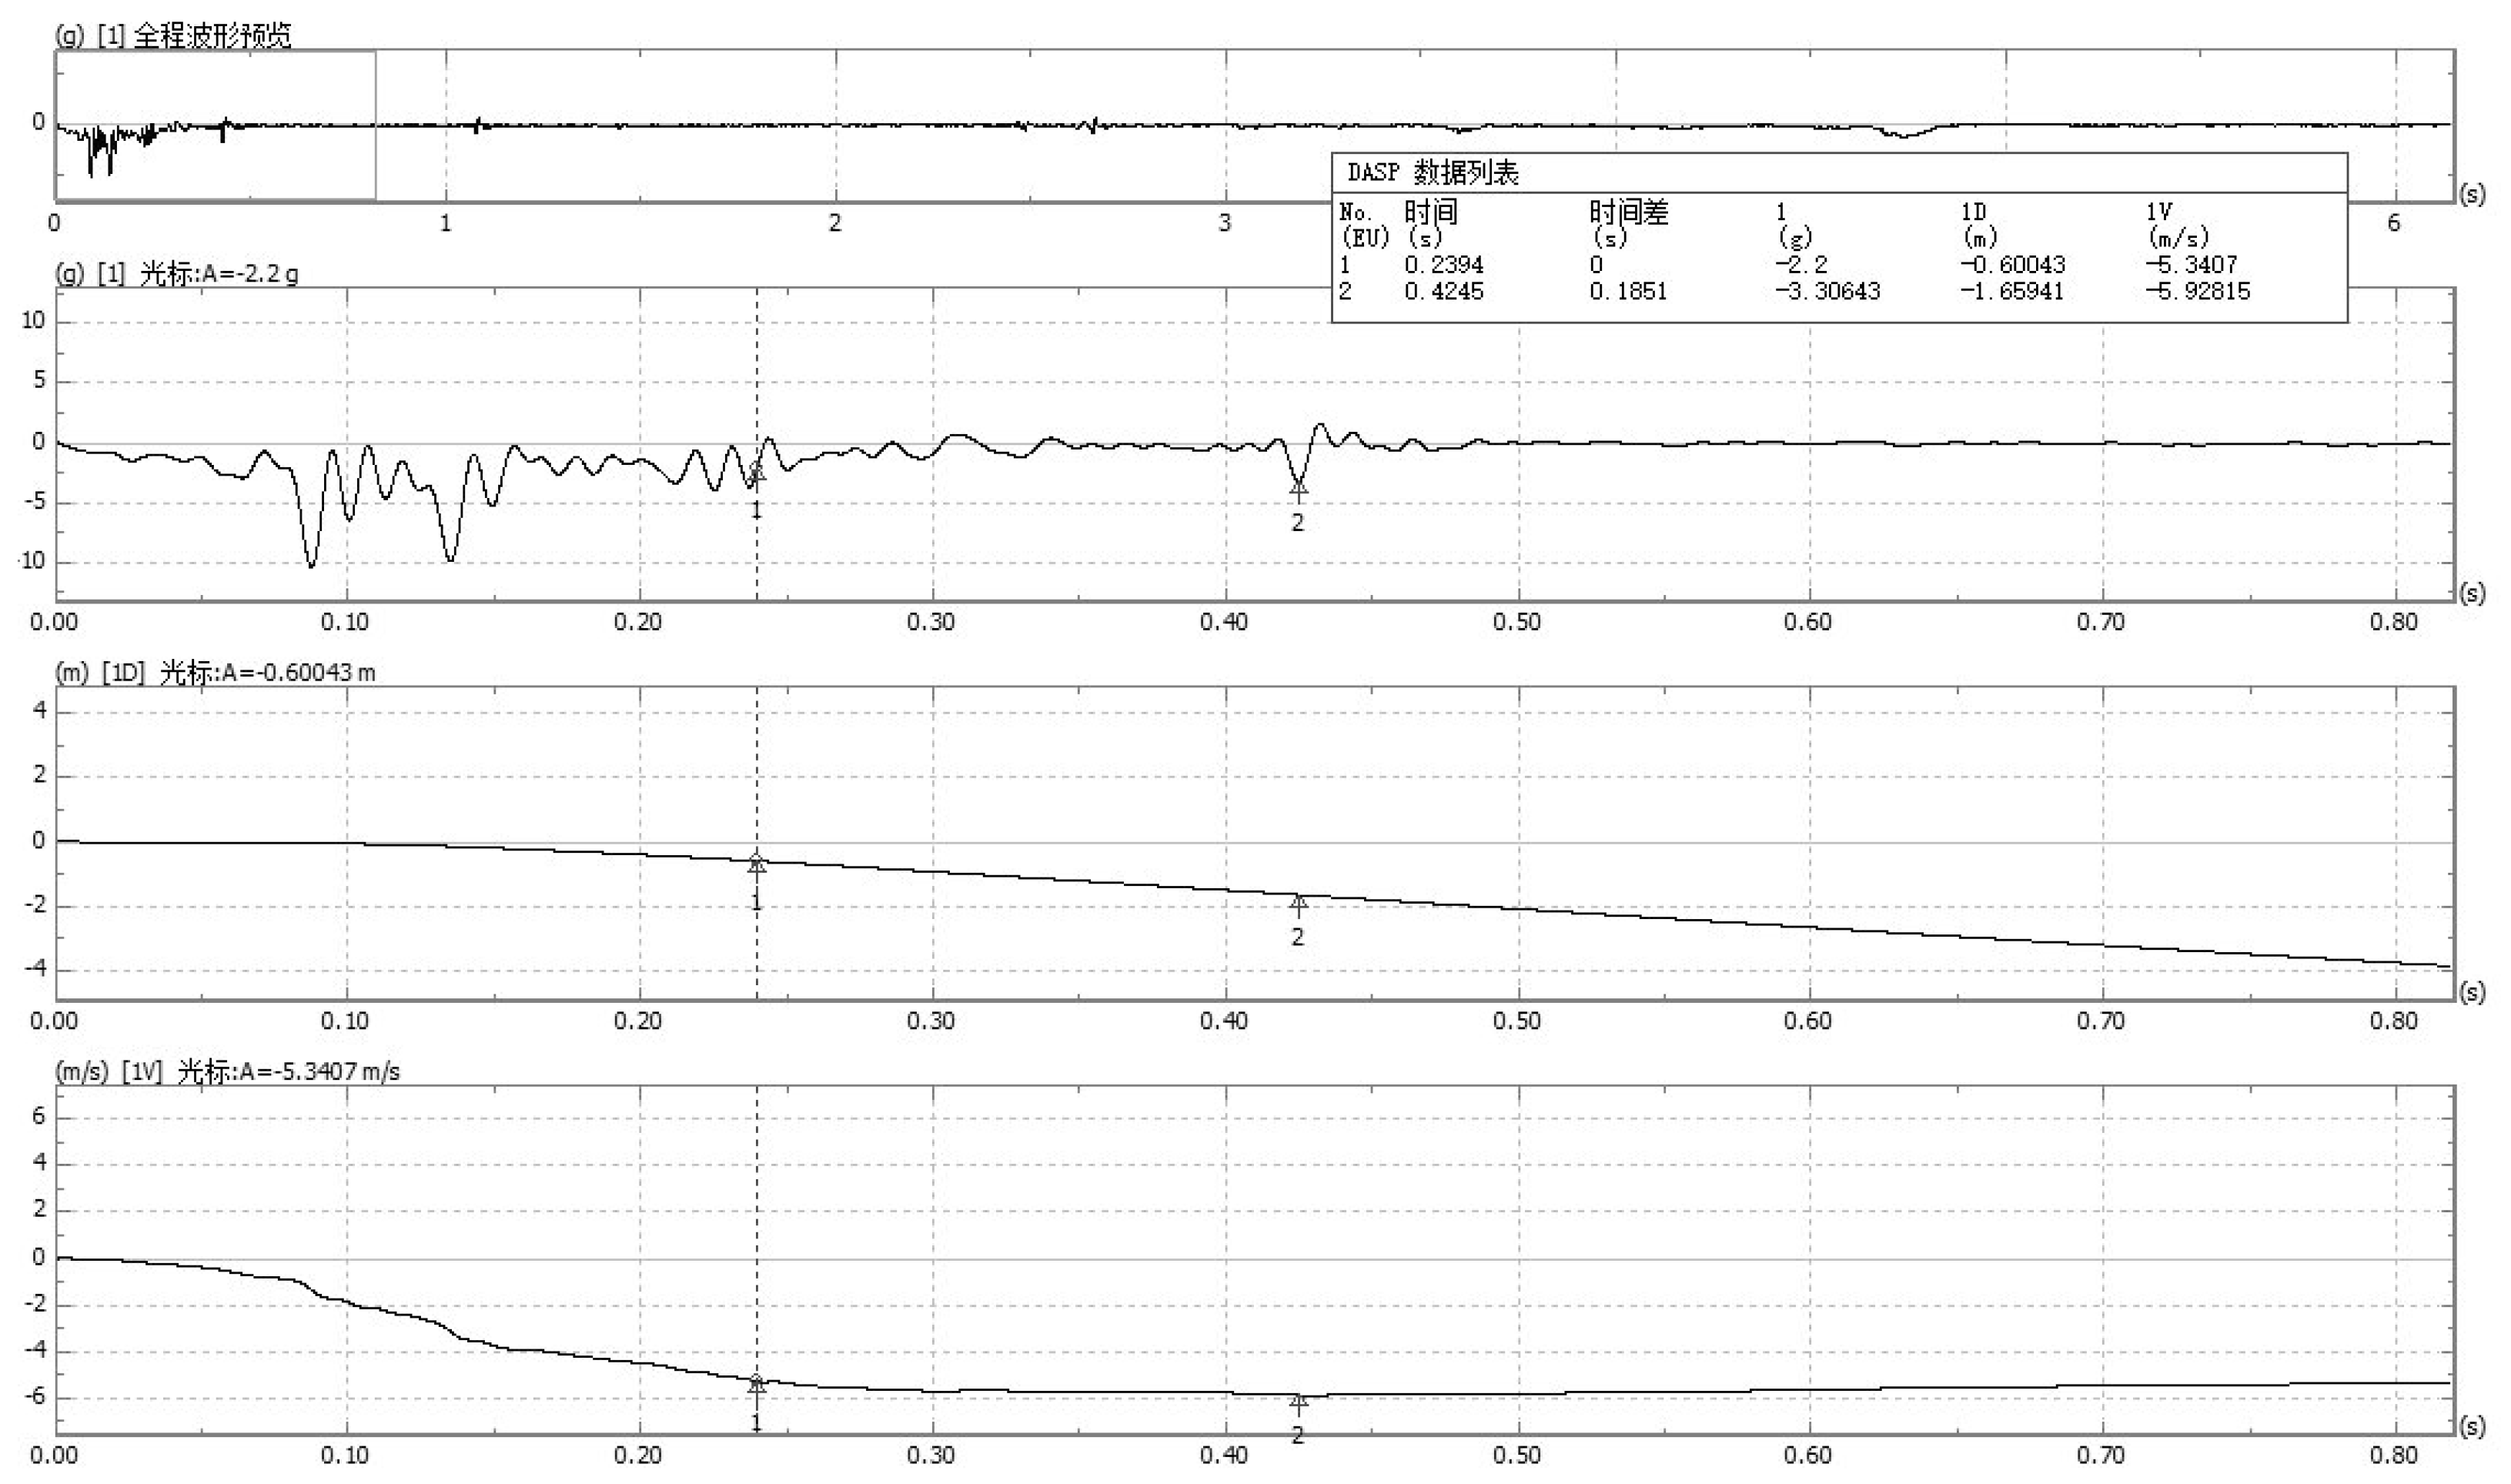
The hypothetical occupant’s head collision time with the vehicle interior was determined to be 0.239 seconds when moving 0.6 meters along the longitudinal axis (
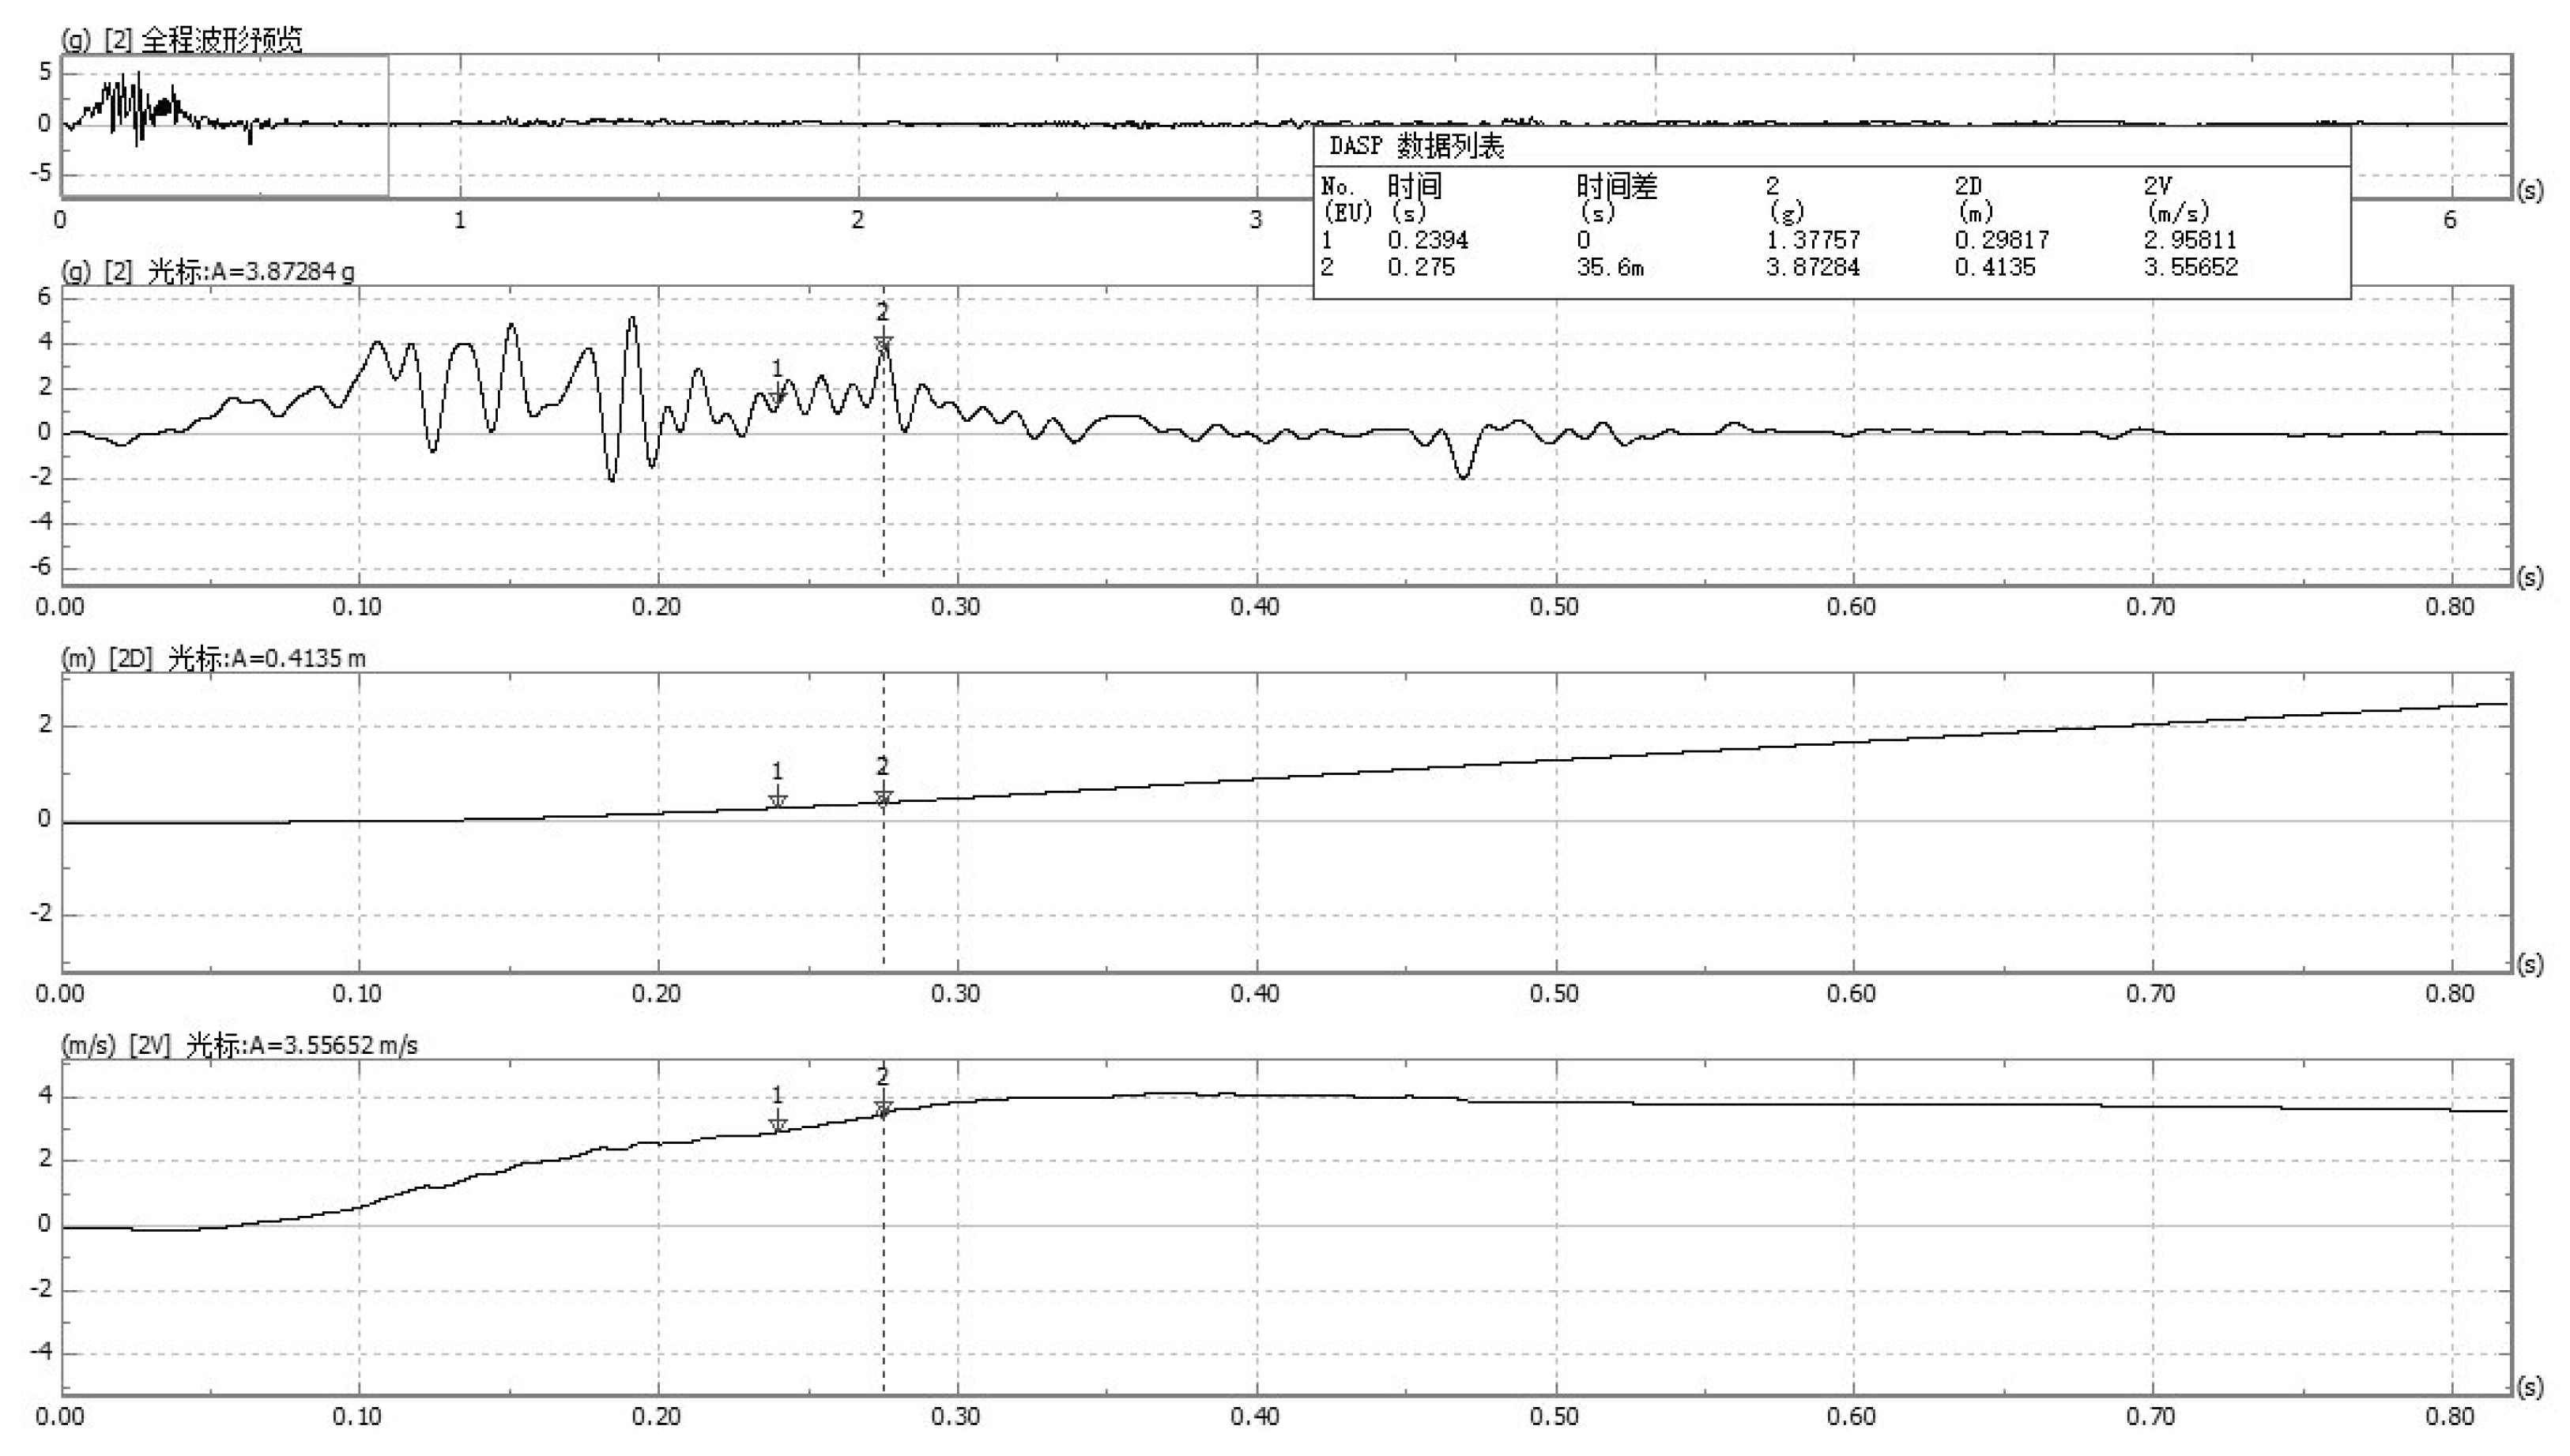
Figure 19) of the occupant compartment and 0.241 seconds when moving 0.3 meters along the lateral axis (
Figure 20). Therefore, the critical collision time was 0.239 seconds. Based on the collected acceleration curve at the vehicle’s center of gravity and the derived occupant impact velocity curve, the buffering performance indicators for this test are shown in
Table 4.
The barrier’s buffering performance was evaluated using a passenger car. The test results showed occupant impact velocities of Vx = 5.3 m· s-1 and Vy = 3.0 m·s-1, both below the standard value of 12 m·s-1. The occupant ride-down accelerations were ɑx = 18.5 m·s-2 and ɑy = 26.3 m·s-2, both below the standard value of 200 m·s-2, demonstrating that the barrier’s buffering performance met the required standards.
3.5. Barrier Anti-Intrusion Resistance
Barrier Anti-intrusion Resistance:The W or VI
n value of the barrier should not exceed the permissible gap between the barrier and the protected object, and the out-of-control vehicle and barrier should not intrude into the opposing lane. The intrusion resistance capability of the barrier typically involves two scenarios. The first scenario is on regular sections of the median without obstacles, where control is based on W
d and VI
n. Specifically, W
d should be less than the median barrier C value plus the width of the right roadside verge (S), and VI
n should be less than the median barrier width (M) plus the width of the right roadside verge (S) minus the median barrier C value.The second scenario occurs when obstacles are present within the median. If the obstacle is lower than the barrier height, the W value is used, which should be less than the distance from the barrier face to the obstacle. If the obstacle is higher than the barrier height, the VI
n value is used, which should be less than the distance from the barrier face to the obstacle. This study primarily focuses on the first scenario. In the full-scale vehicle tests, the central median width was 2500 mm, the designed C value was 500 mm, and the roadside verge width was 750 mm [
40].
In the vehicle test results (
Table 5), the W
d values for small passenger car, medium bus, and medium truck were 0 mm, 76.9 mm, and 0 mm respectively. The VI
n values for bus and truck were 2.294 m and 1.026 m, respectively, all of which did not exceed the specified limits, meeting the intrusion resistance requirements under the test conditions set for this barrier.
In this study, we observed that under the same collision energy conditions, the medium bus, compared to the medium truck, experienced more severe impacts due to the simulated post-rainfall conditions. During the full-scale vehicle crash tests, the central median was saturated with water to mimic rainfall, resulting in significant soil seepage around the posts. This saturation caused the soil within the embedding depth range to lose strength and stability. Consequently, the affected length of the barrier posts increased by 1.9 times, the average ground-level base deformation increased by 3.2 times, and the maximum deformation increased by over 4 times. The tilt angle of the posts increased by 2.1 times. This situation led to W, Wd, and VIn values far exceeding those of the medium truck. Additionally, the energy loss of the vehicle due to the collision increased by 5%. These findings highlight the significant impact of soil stability on barrier performance under rainfall conditions.
4. Conclusions
This study conducted full-scale crash tests on three vehicle types (passenger car, medium bus, and medium truck) under specified collision angles and speeds (A-level) to thoroughly analyze the barrier’s blocking, buffering, guiding, and anti-intrusion functions, as well as the impact on both the barrier and vehicle. The following conclusions were drawn:
Experimental results indicate that under low compaction conditions, the separated central median W-beam guardrail reinforced with post-densification design meets the safety performance requirements of Class A barriers as per standard [
38]. The anti-intrusion capability also satisfies the specified technical standards.
The study found that enhancing the strength of the central median foundation can effectively reduce the affected length of the guardrail during collisions and decrease the degree of post inclination deformation. Although the energy loss of the vehicle during collisions is slightly reduced, the overall stability of the guardrail is significantly improved, thereby enhancing the safety protection capability of the separated semi-rigid guardrail.
This research not only validates the effectiveness of the reinforcement scheme but also provides critical technical support and reference for the design and optimization of separated central median guardrails.These conclusions provide substantial scientific evidence for further enhancing the design and performance of road safety protection facilities.
Author Contributions
Conceptualization, H.W. (Hongliang Wei) and Y.W. (Yongke Wei) ; validation, F.Z. (Feng Zhang), B.C. (Bin Chen); Formal analysis, Y.W. and F.Z.; Investigation, B.C. and H.W.; Methodology, F.Z. and H.W.; Validation, F.Z. and Y.W.; Writing—original draft, F.Z.; Writing—review & editing, H.W., and Y.W.
Funding
This research was funded by the Guangxi Zhuang Autonomous Region Transportation Department under the Guangxi Transportation Standard Project [2022] No. 35.
Institutional Review Board Statement
Not applicable.
Informed Consent Statement
Not applicable.
Data Availability Statement
The data presented in this study are available on request from the corresponding author. The data are not publicly available due to the commercial privacy.
Conflicts of Interest
The authors declare no conflicts of interest.
References
- Lei, Z.B.; Yang, B.; Xiao, L.H. Topological Optimization of Semi-rigid Barriers in Central Median. Journal of Wuhan University of Technology: Transportation Science and Engineering Edition 2015, 39, 4. [Google Scholar]
- Chen, C.Y.; Wei, B.C.; Tai, Y.G. Analysis of Highway Central Median Barrier Improvement Scheme Based on Cooperative Stress. Fujian Transportation Technology 2023, 87–91. [Google Scholar]
- Feng, H.Y.; Li, M.L.; Meng, Y.; Liu, Y.; Hu, Y.W.; Du, J.H. Comparative Analysis of Schemes to Improve the Protective Capacity of Existing Central Median W-beam barriers. Henan Science and Technology 2020, 39, 6. [Google Scholar]
- Lei, Z.B.; Liu, B. Research Trends and Dynamics of Highway Safety Protection Technology. Highway Engineering 2020, 45, 7. [Google Scholar]
- Li, M.Z. Research on the Reconstruction Scheme of W-beam barriers in Highway Central Median. Transportation World 2022.
- Gutowski, M.; Palta, E.; Fang, H. Crash analysis and evaluation of vehicular impacts on W-beam barriers placed on sloped medians using finite element simulations. Advances in Engineering Software 2017, 112, 88–100. [Google Scholar] [CrossRef]
- Mehdi, H.; Kirolos, H. Examining crash injury severity and barrier-hit outcomes from cable barriers and strong-post barriers on Alabama’s interstate highways. Journal of safety research 2021, 78, 155–169. [Google Scholar]
- Chen, Y.F.; Chen, L.B.; Zeng, J.C. Research on the Adaptability Evaluation and Upgrading Technology of In-Service W-beam barriers on Highways. Journal of Highway and Transportation Research and Development 2019, 36, 6. [Google Scholar]
- Ding, H.; Wu, M.X.; Wang, M.; et al. Discussion on the Foundation of barrier Posts in Central Median. Engineering Mechanics 2002.
- Jia, N.; Liu, H.; Liang, Y.P.; et al. Study on the Embedding Method of W-beam barrier Foundation. Highway 2015, 60, 4. [Google Scholar]
- Jia, X.Z.; Li, Y. Study on the Setting Scheme of Split-Type Concrete barrier Foundation in Highway Reconstruction and Expansion Projects. Highway 2018, 63, 6. [Google Scholar]
- Tai, Y.G. Research on the Influence of Height Variation of SA Grade Concrete barrier in Split-Type Central Median on Protective Performance. Highway 2020, 65, 5. [Google Scholar]
- Han, H.F.; Yang, Z.; Zheng, T. Study on the Energy Requirement of Roadside barrier Collision on Highways. Journal of Highway and Transportation Research and Development 2016, 33, 7. [Google Scholar]
- Yang, L.; Tang, Z.D.; Chen, J.Y.; et al. Safety Analysis of F-Type Concrete barrier Based on Collision Simulation. Journal of Highway and Transportation Research and Development 2023, 40, 208–218. [Google Scholar]
- Jia, N.; Wang, C.H.; Li, Y. Research on the Safety Margin of barrier Structures. Highway Engineering 2017, 42, 7. [Google Scholar]
- Liu, H.; Gong, S.; Liu, S.Y.; et al. Study on the Reconstruction of Old W-beam barriers on Highways. Highway Engineering 2020, 45, 173–180. [Google Scholar]
- Chen, H.; Jiang, C.; Ding, X.D.; et al. Research on the Upgrading Technology of W-beam Steel barriers. China and Foreign Highway 2016, 36, 331–334. [Google Scholar]
- Zhou, X.H.; Chen, W.X.; Deng, B.; et al. Study on the Bearing Capacity of W-beam barrier Posts. China and Foreign Highway 2021, 41, 5. [Google Scholar]
- You, L.C.; Zhang, H.G.; Liao, H.L.; et al. Study on the Upgrading and Renovation Methods of W-beam barriers on Highways. Transportation World 2023, 32–34. [Google Scholar]
- Lu, J.; Jia, N. Analysis of the Protective Capability of Sleeve-Heightened barriers after Pavement Overlay. Journal of Highway and Transportation Research and Development 2022, 190–196. [Google Scholar]
- Fu, Z.P.; Wu, Z.Y.; Jing, L. Study on the Height of W-beam barriers in the Central Median of Highways. Journal of Highway and Transportation Research and Development 2010, 143–148. [Google Scholar]
- Wang, W.L.; Jing, D.F.; Song, C.C. Simulation Study on the Critical Height of W-beam barrier Reconstruction. Highway Engineering 2020, 45, 8. [Google Scholar]
- Sun, S.J.; Zhu, C.H.; Mei, K.H. Impact Performance of Basalt Fiber Composite Beam-post barriers. Journal of Vibration and Shock 2019, 38, 6. [Google Scholar]
- Hu, Y.W.; Zhou, D.Y. Structural Analysis and Simulation Study of New barrier Types. Structural Engineer 2014, 30, 8. [Google Scholar]
- JTG D81-2017, Specifications for Highway Traffic Safety Facilities Design [S].
- Xie, Y.H.; Lei, Z.B.; Li, H.X.; et al. Research Status and Development Trends of Highway Anti-Collision barriers. Engineering Construction and Design 2003, 4. [Google Scholar]
- Pan, B.H.; Zhao, Y.F.; Yang, S.W.; et al. Height of W-beam barriers in the Central Median of Highways. Journal of Chang’an University (Natural Science Edition) 2008, 28. [Google Scholar]
- Yan, S.M.; Chen, G.X.; Liu, H. Collision Analysis of Several Improved W-beam barriers. Highway Engineering 2016, 41, 6. [Google Scholar]
- Han, H.F.; Pi, Z.X.; Li, X.W. Development and Crash Performance Test of New Beam-post Steel barriers. China and Foreign Highway 2016, 36, 4. [Google Scholar]
- Zhou, W.; Zhang, T.X.; Cui, H.T.; et al. Finite Element Simulation of Car-Highway barrier Collision. Journal of Beijing University of Technology 2008, 34, 7. [Google Scholar]
- Asadollahi Pajouh, M.; Julin, Ramen D.; Stolle, Cody S.; Reid, John D.; Faller, Ronald K. Rail height effects on safety performance of Midwest barrier System. Traffic Injury Prevention 2018, 19, 219–224. [CrossRef]
- Shu, X.; Zhang, X.Q.; Huang, X.Q.; et al. Finite Element Optimization Analysis of Highway barrier Systems. Journal of Highway and Transportation Research and Development 2006, 23, 5. [Google Scholar]
- Davids, William G.; Botting, Joshua K.; Peterson, Michael. Development and structural testing of a composite-reinforced timber highway barrier. Construction and Building Materials 2006, 20, 733–743. [CrossRef]
- Gao, K. Full-Scale Crash Test Study of New Concrete barrier for Roadside. Highway 2019, 64, 4. [Google Scholar]
- Liu, M.H.; Zhang, M.Z.; Kang, H.J.; et al. Safety Analysis of Fixed-Base Steel barriers in Central Median of Bridges. Journal of Road and Bridge 2019, 39, 6. [Google Scholar]
- Yu, H.X.; Jiang, C.H.; Zhong, H.; et al. Full-Scale Crash Test Study of New Central Median Opening barriers. Highway 2017, 62, 5. [Google Scholar]
- JTG E40-2007, Test Methods of Soils for Highway Engineering [S].
- JTG 3450-2019, Specifications for Highway Subgrade and Pavement Field Testing [S].
- JTG B05-01-2013, Specifications for Safety Performance Evaluation of Highway barriers [S].
- JTG B01-2014, Technical Standard of Highway Engineering [S].
Figure 1.
Barrier installation design diagram.
Figure 1.
Barrier installation design diagram.
Figure 2.
On-site construction diagram: (a) Foundation compaction, (b) Pipeline excavation, (c) Tree pit excavation, (d) Barrier installation, (e)Overall effect diagram.
Figure 2.
On-site construction diagram: (a) Foundation compaction, (b) Pipeline excavation, (c) Tree pit excavation, (d) Barrier installation, (e)Overall effect diagram.
Figure 3.
Full-scale vehicle acceleration system: (a) Gravitational potential energy tower, (b) Drop weight, (c) Acceleration runway, (d) Braking system, (e) Acceleration traction vehicle.
Figure 3.
Full-scale vehicle acceleration system: (a) Gravitational potential energy tower, (b) Drop weight, (c) Acceleration runway, (d) Braking system, (e) Acceleration traction vehicle.
Figure 4.
Test vehicles: (a) Small passenger car, (b) Medium bus, (c) Medium truck.
Figure 4.
Test vehicles: (a) Small passenger car, (b) Medium bus, (c) Medium truck.
Figure 5.
High-speed cameras and their arrangement.
Figure 5.
High-speed cameras and their arrangement.
Figure 6.
Data acquisition system and accelerometers.
Figure 6.
Data acquisition system and accelerometers.
Figure 7.
Redirective exit box.
Figure 7.
Redirective exit box.
Figure 8.
Barrier anti-intrusion capability indicators.
Figure 8.
Barrier anti-intrusion capability indicators.
Figure 9.
Trajectory of the small passenger car.
Figure 9.
Trajectory of the small passenger car.
Figure 10.
Trajectory of the medium bus.
Figure 10.
Trajectory of the medium bus.
Figure 11.
Trajectory of the medium truck.
Figure 11.
Trajectory of the medium truck.
Figure 12.
Post deformation: small passenger car.
Figure 12.
Post deformation: small passenger car.
Figure 13.
Barrier deformation: small passenger car.
Figure 13.
Barrier deformation: small passenger car.
Figure 14.
Post deformation: medium bus.
Figure 14.
Post deformation: medium bus.
Figure 15.
Barrier deformation: medium bus.
Figure 15.
Barrier deformation: medium bus.
Figure 16.
Post deformation: medium truck.
Figure 16.
Post deformation: medium truck.
Figure 17.
Barrier deformation: medium truck.
Figure 17.
Barrier deformation: medium truck.
Figure 19.
Buffering performance indicators curve: X-direction.
Figure 19.
Buffering performance indicators curve: X-direction.
Figure 20.
Buffering performance indicators curve: Y-direction.
Figure 20.
Buffering performance indicators curve: Y-direction.
Table 1.
Barrier construction dimensions.
Table 1.
Barrier construction dimensions.
| Protection Level |
Code |
Beam Plate (mm) |
Beam Plate Height
(mm) |
Post
(mm) |
Post Embedding Depth
(mm) |
Anti-blocking Block
(mm) |
| 三 |
A |
506×85×3 |
697 |
φ140×4.5×2470 |
1490 |
196×178×400×4.5 |
Table 2.
Full-scale crash test conditions for class 3 (A) barriers.
Table 2.
Full-scale crash test conditions for class 3 (A) barriers.
| Vehicle Type |
Collision Speed
(km·h-1) |
Collision Angle
(°) |
Total Vehicle Mass
(kg) |
Collision Energy
(kJ) |
| Small Passenger Car |
100 |
20 |
1500 |
68 |
| Medium Bus |
60 |
20 |
10000 |
162 |
| Medium Truck |
60 |
20 |
10000 |
162 |
Table 3.
The values of A and B.
Table 3.
The values of A and B.
| Vehicle Type |
A
(m) |
B
(m) |
| Small Passenger Car |
2.2+Vw1+0.16VL2
|
10 |
| Medium Bus/Medium Truck |
24.4+Vw+0.16VL
|
20 |
Table 4.
Test results for barrier buffering performance indicators.
Table 4.
Test results for barrier buffering performance indicators.
| Evaluation Indicators |
Direction |
Test Values |
Standard Values |
| ORV (m·s-1) |
X |
5.3 |
≤12 |
| Y |
3.0 |
≤12 |
| ORA (m·s-2) |
X |
18.5 |
≤200 |
| Y |
26.3 |
≤200 |
Table 5.
Test results for barrier anti-intrusion resistance indicators.
Table 5.
Test results for barrier anti-intrusion resistance indicators.
| Indicators |
Small passenger car |
Medium bus |
Medium truck |
| D (cm) |
77.8 |
168.5 |
62.1 |
| W (cm) |
133.3 |
222.4 |
118.6 |
| VI (m) |
/ |
2.125 |
0.740 |
| VIn (m) |
/ |
2.294 |
1.026 |
| Wd (cm) |
0 |
76.9 |
0 |
|
Disclaimer/Publisher’s Note: The statements, opinions and data contained in all publications are solely those of the individual author(s) and contributor(s) and not of MDPI and/or the editor(s). MDPI and/or the editor(s) disclaim responsibility for any injury to people or property resulting from any ideas, methods, instructions or products referred to in the content. |
© 2024 by the authors. Licensee MDPI, Basel, Switzerland. This article is an open access article distributed under the terms and conditions of the Creative Commons Attribution (CC BY) license (http://creativecommons.org/licenses/by/4.0/).

