Submitted:
23 June 2024
Posted:
25 June 2024
You are already at the latest version
Abstract
Keywords:
1. Introduction
2. Systematic Review of Empirical Studies on the Effects of MW on Inequality and Poverty
2.1. Systematic Review up to 2019
2.2. Systematic Review from 2020 to 2024
3. The Spanish Case
4. An Analysis of the Impact of the MW on Income Inequality. In Spain, for the 2019 Increase
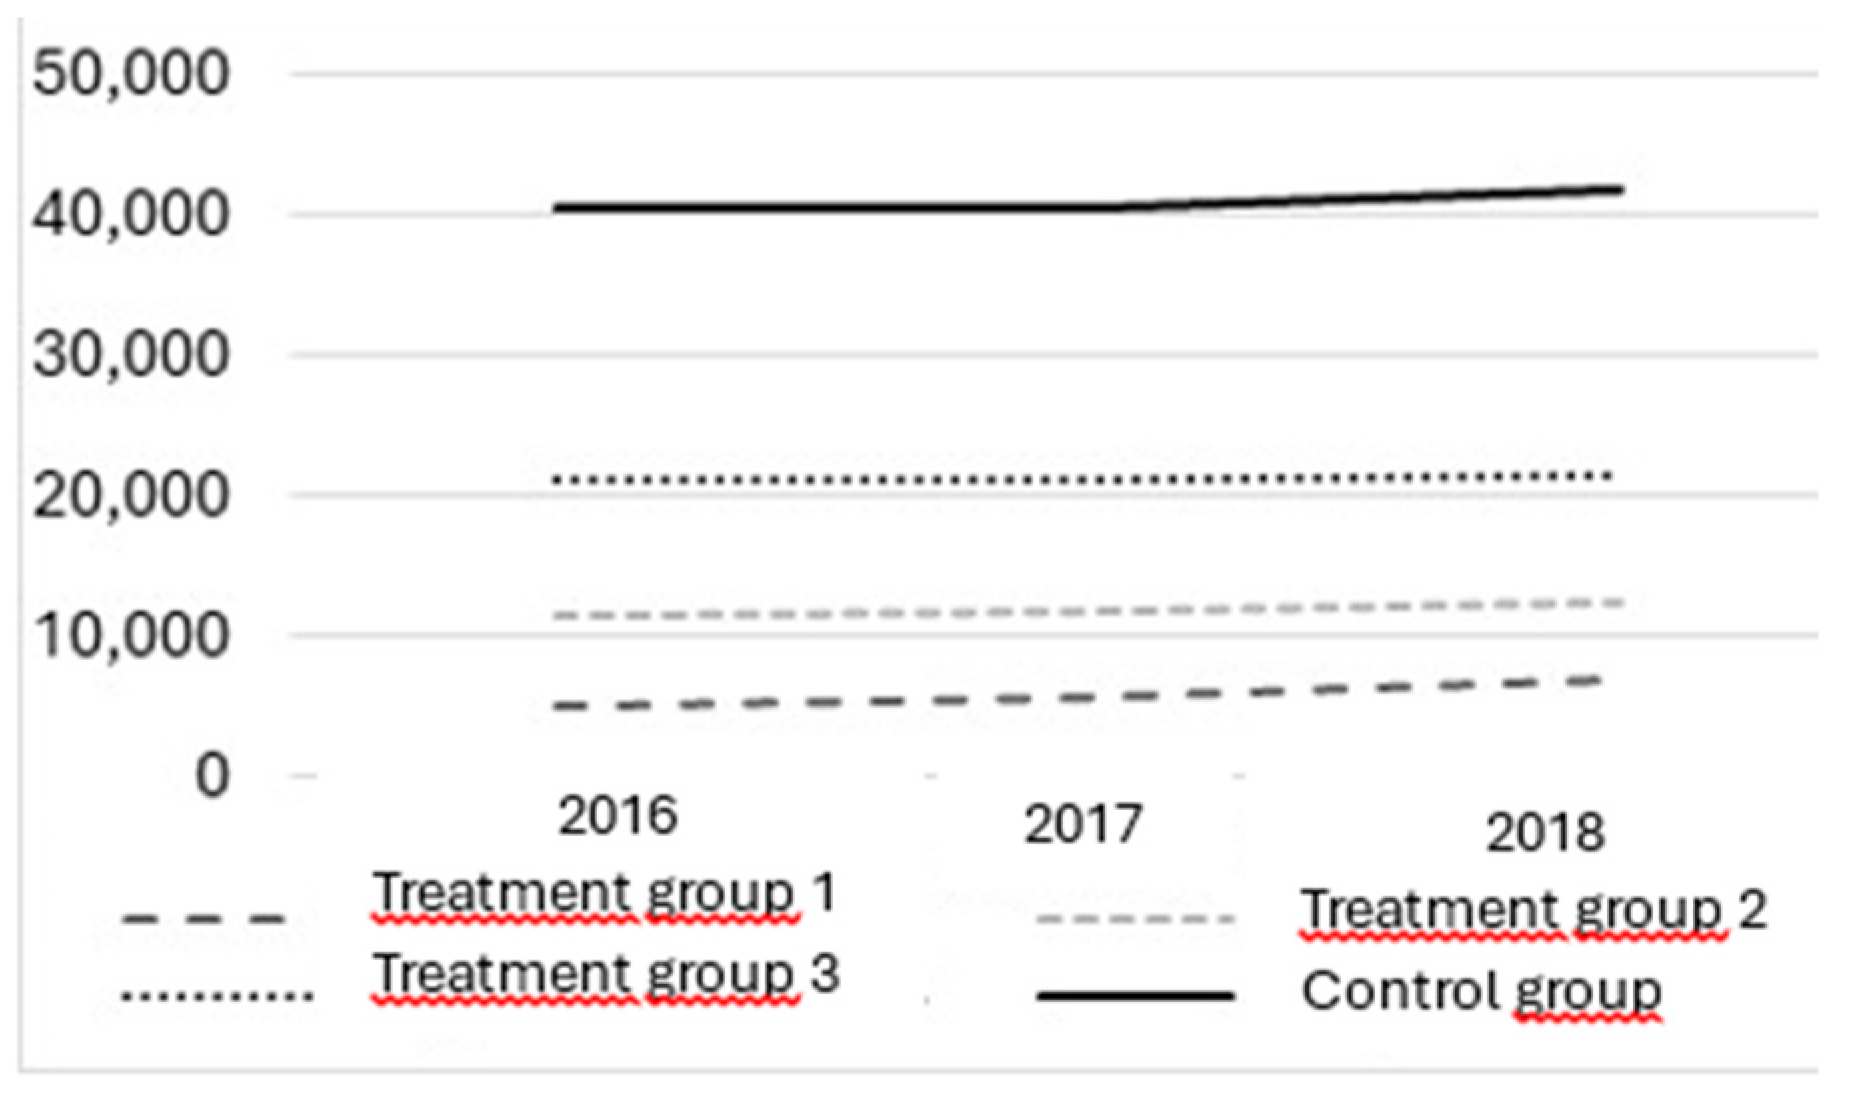
| Number | Percentage | |
| Total sample | 2.344 | 100% |
| Treatment group 1 | 316 | 13.5% |
| Treatment group 2 | 260 | 11.1% |
| Treatment group 3 | 1.297 | 55.3% |
| Control group | 473 | 20.1% |
| Model (1) | Model (2) | |
| Year | 0.021** (0.014) |
0.020** (0.013) |
| Treatment 1 | -1.062*** (0.016) |
-1.024*** (0.017) |
| Treatment 1 x year | 0.187*** (0.022) |
0.188*** (0.022) |
| Gender | -0.023*** (0.011) |
|
| Living as a couple | -0.035*** (0.012) |
|
| Level of education | 0.062*** (0.012) |
|
| Adjusted R2 (a) | 0.913 | 0.917 |
| Durbin Watson | 1.854 | |
| Standard error | 0.20812 | 0.20349 |
| Model (1) | Model (2) | |
| Year | 0.031*** (0.010) |
0.030*** (0.010) |
| Treatment 2 | -0.982*** (0.012) |
-0.954*** (0.012) |
| Treatment 2 x year | 0.036** (0.017) |
0.037** (0.016) |
| Gender | -0.019** (0.008) |
|
| Living as a couple | -0.024*** (0.009) |
|
| Level of education | 0.052*** (0.009) |
|
| Adjusted R2 (a) | 0.926 | 0.928 |
| Standard error | 0.14959 | 0.14732 |
| Durbin Watson | 1.937 | |
| Model (1) | Model (2) | |
| Year | 0.041** (0.015) |
0.039** (0.014) |
| Treatment 3 | -0.786*** (0.012) |
-0.731*** (0.012) |
| Treatment 3 x year | 0.019 (0.017) |
0.018 (0.016) |
| Gender | -0.063** (0.008) |
|
| Living as a couple | -0.034*** (0.009) |
|
| Level of education | 0.182*** (0.008) |
|
| Adjusted R2 (a) | 0.607 | 0.636 |
| Standard error | 0.22425 | 0.21582 |
| Durbin Watson | 1.969 | |
Multiple Regression Model
- -
- In the first case, the variable X2 takes on a value of 1 when the person has a gross annual income equal to or below the 2019 minimum wage (i.e. belongs to treatment group 1), and a value of 0 when the person belongs to the control group (persons with a gross annual income equal to or above 1.5 times the median income in 2019).
- -
- In the second case, the variable X2 takes on a value of 1 when the person has a gross annual income above the 2019 minimum wage but equal to or below two-thirds of the 2019 median income (treatment group 2), and a value of 0 when the person belongs to the control group, i.e. with an income equal to or above 1.5 times the 2019 median income.
- -
- In the third case, the variable X2 takes on a value of 1 when the person has a gross annual income of more than two-thirds and less than 1.5 times the median income in 2019 (treatment group 3), and a value of 0 when the person belongs to the control group.
First case. Effects of the MW increase on the income of individuals with gross annual incomes equal to or below the minimum wage (treatment group 1)
- -
- The income of individuals with a gross annual income equal to or below the MW was 102.4% to 106% lower than the income of the highest gross income group, the control group.
- -
- The gross annual income of all individuals (regardless of whether they belong to treatment group 1 or the control group) increased by around 2% in real terms after the 2019 minimum wage increase.
- -
- The increase in the minimum wage led to an increase of 18.7% to 18.8% in the income of those with an income at or below the minimum wage.
Second case. Effects of the MW increase on the incomes of low-income individuals (treatment group 2)
- -
- The income of individuals belonging to this treatment group was between 98.2% and 95.4% lower than the income of the highest income group.
- -
- The income of individuals (in both treatment and control groups) increased by around 3% between 2018 and 2019.
- -
- The income of the group of people in treatment group 2 increased by between 3.6% and 3.7% between 2018 and 2019. This is a smaller increase than for the group of people with incomes below the minimum wage, but significant for such low-income levels (considering the income thresholds for the groups shown in Table 2).
Third case. Effects of the MW increase on the income of middle-income individuals (treatment group 3)
- -
- The gross annual income of people with medium-high incomes stood at between 73.1% and 78.6% of the income of the control group. Thus, the analysis of coefficients shows, in the different scenarios, the large difference in income between all groups and the high-income group.
- -
- The income of individuals (in both treatment 3 group and control group) increased by around 4% between 2018 and 2019.
- -
- The differences between the genders were more pronounced the higher the income level.
- -
- Individuals living with a partner had higher incomes than those living alone.
- -
- In higher income groups, tertiary education had a greater impact on income than in lower income groups.
5. Discussion of the results
Impact on Inequality
6. Practical implications
7. Conclusions
Practical Recommendations
- Minimum wage coverage needs to be universal so that it does not leave out any vulnerable groups such as domestic services, the agricultural sector, or the hotel and catering industry.
- The level or amount of the minimum wage, i.e. too low is not enough to overcome poverty and too high can affect employment and fulfilment, must be just high enough to allow for a dignified life.
- The level of compliance must be adequate, although it will in any case affect if compliance is very low, when it will not have as much of a positive effect.
- There should be a mechanism for automatic updating of the minimum wage to avoid the progressive loss of its purchasing power, as recommended by the Directive EU 2022.
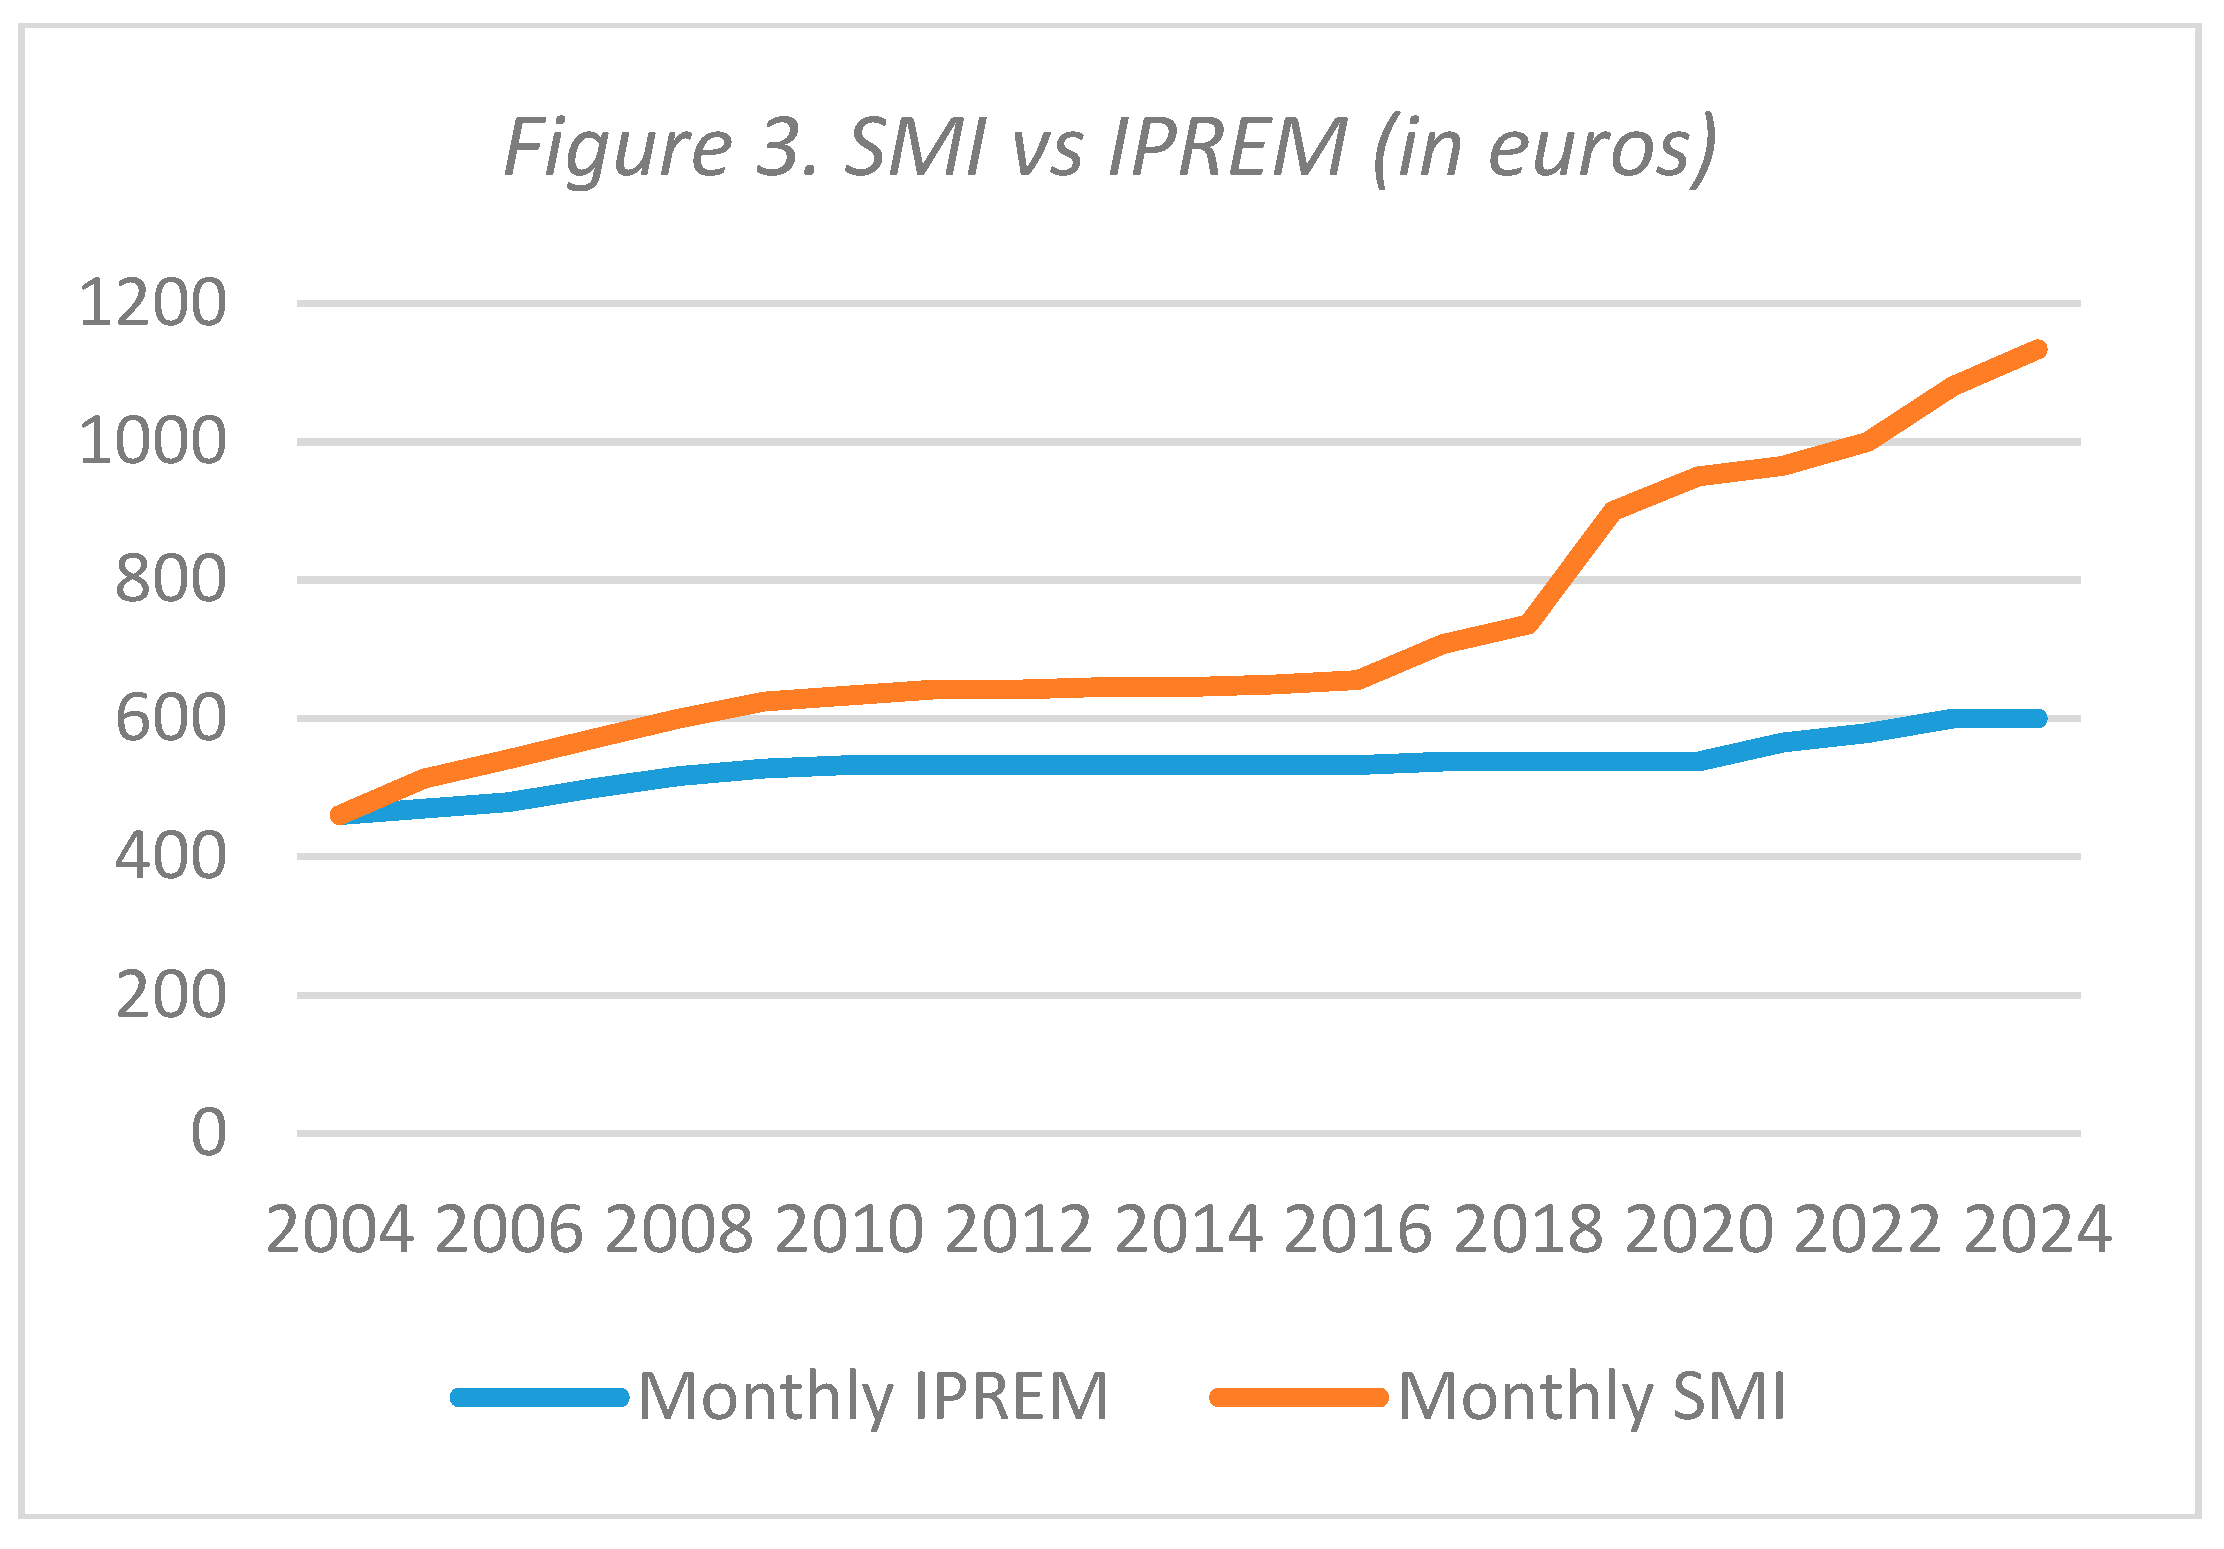
- For the Spanish case, it is proposed to re-link the IPREM to the minimum wage in order to really have a significant effect on transfers aimed at eliminating poverty.
- Finally, a permanent and independent minimum wage Monitoring Commission, along the lines of those that exist in Germany or the UK, should be set up.
Author Contributions
Rights and Permissions:
Competing Interests:
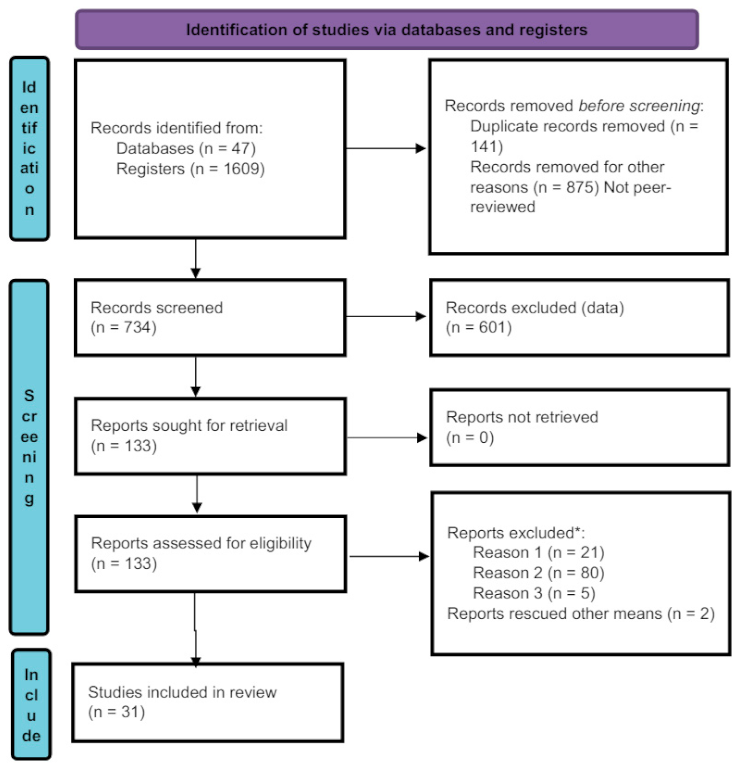
Appendix A. Systematic Review of the Effects of the MW on Income Inequality and Poverty (Following the PRISMA 2020 Methodology). Summary Report
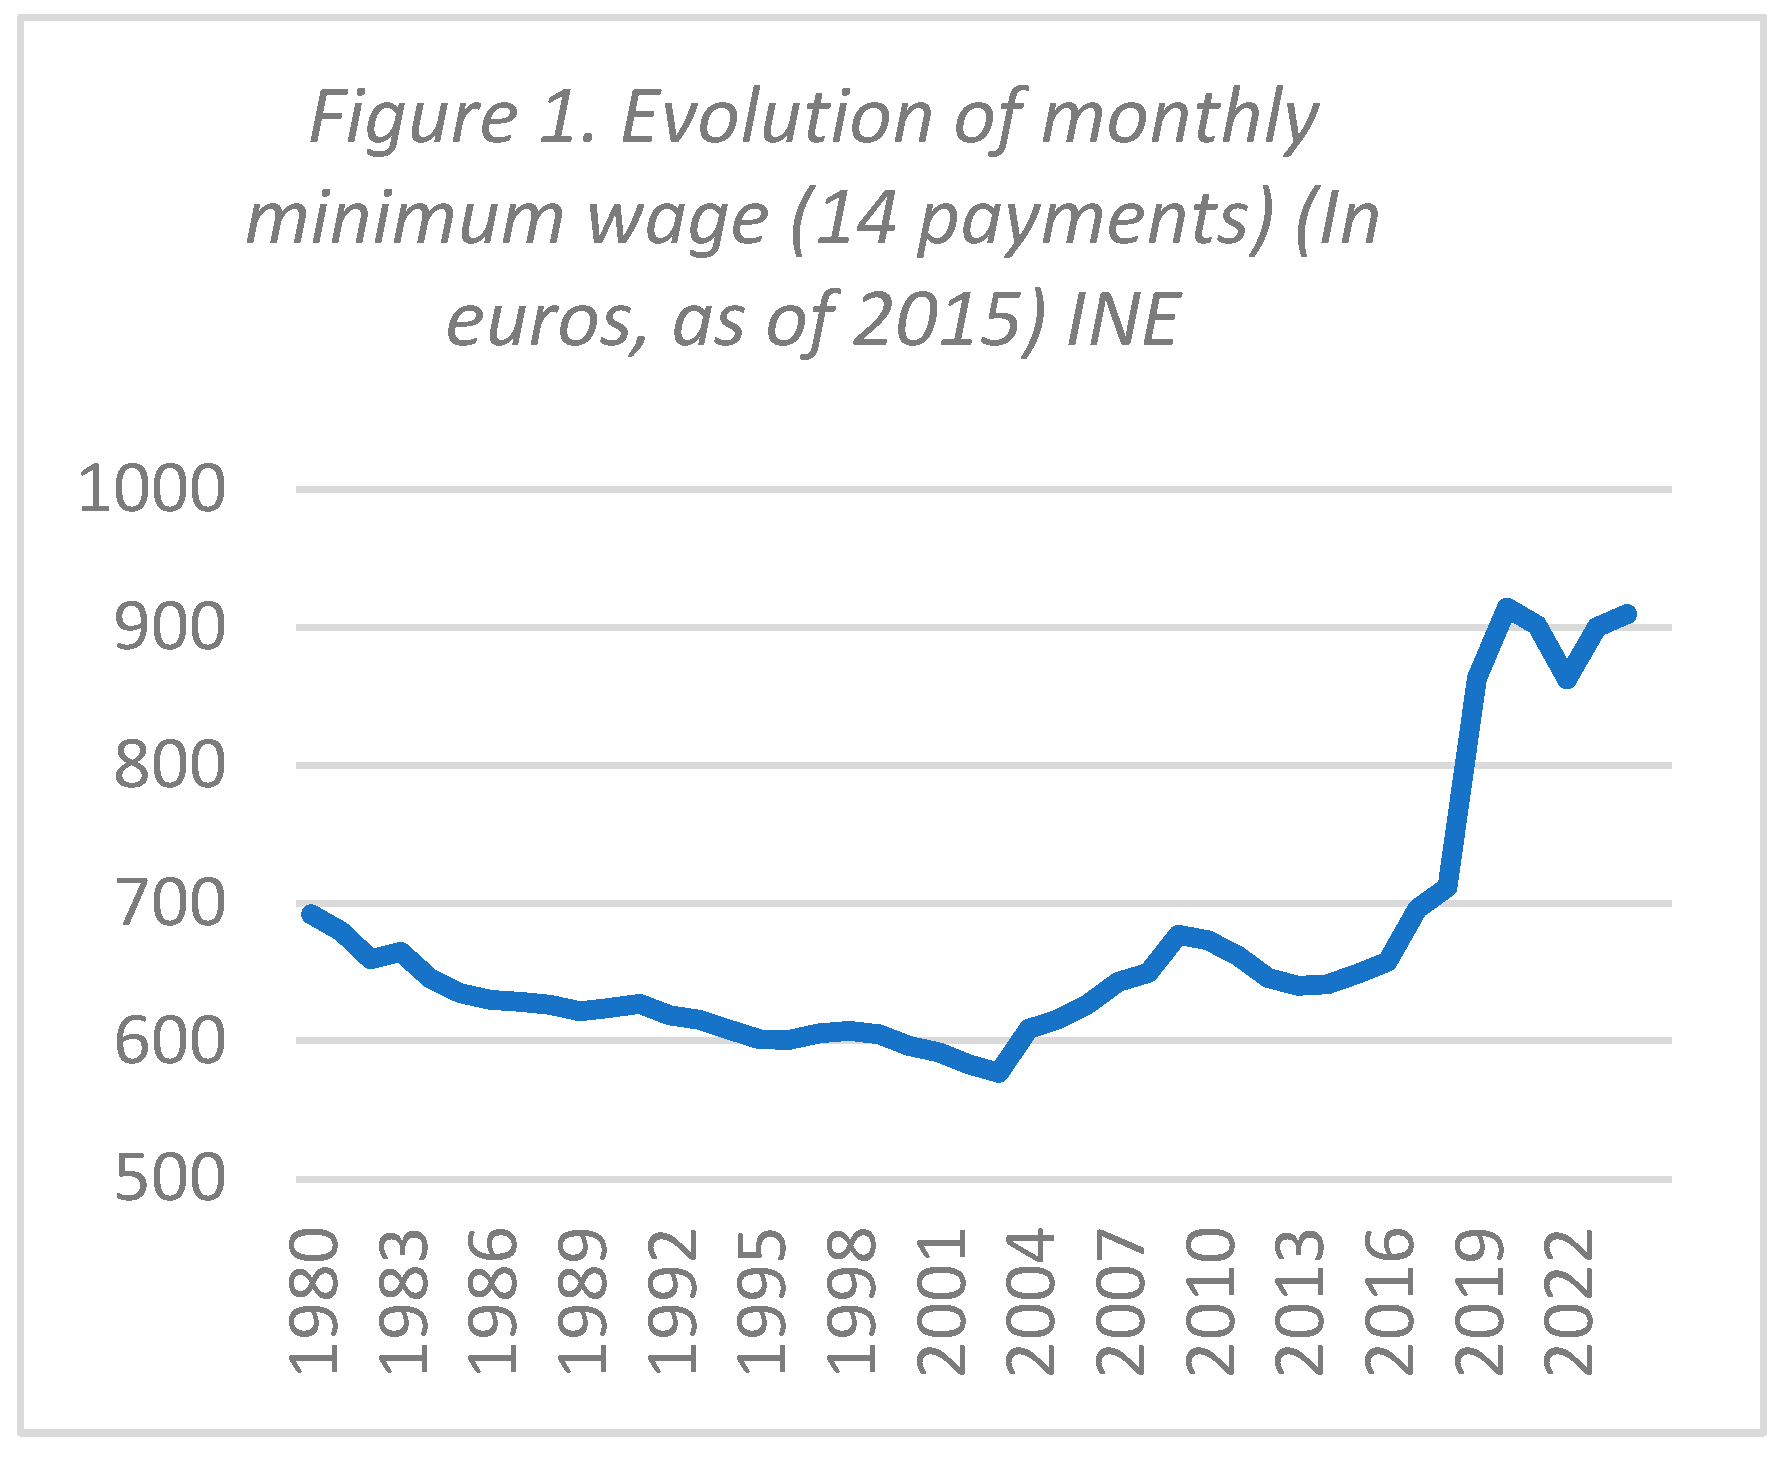
Appendix B. Summary Table of the Systematic Review Results
| Reference | Period | Objective | Treatment group | Control group | Place | Methodology | Data sources used | Results |
| Bossler & Schank, 2023 | 2011-2017 | Wage inequality | High impact regions | Low impact regions | Germany | DD. by quantile - Card 1992 | IEB - Administrative - Individual data | 12% MW-induced wage increase at the 5th percentile; 21% at the 20th percentile: 2% at the 50th percentile. Null effect beyond the median. |
| Burauel et al., 2020 | 2010-2016 | Wages and income | Wage< MW (8.5) | 8.5 ≤ Wage <10 | Germany | DTADD | SOEP - Survey - Individual data | MW induced wage increase 6.5%. Induced monthly income increase of 6.6%. |
| Caliendo, et al., 2023 | 2013-2018 | Wages | High impact regions | Low impact regions | Germany | DD. by quantile - Card 1992 | SOEP - Survey - Individual data | 9% in 2015 and 21% between 2016 and 2018 in the first quintile. |
| Derenoncourt & Montialoux,, 2021 | 1967 | Racial inequality | Average annual earnings of workers covered in 1967 | Average annual earnings of workers covered before 1967 | USA | DD | Industry wage reports BLS - Survey - Wage distributions and individual data | The expansion of the minimum wage in 1967 can explain more than 20% of the reduction in the racial income gap during the civil rights era. |
| Forsythe, 2023 | 2011-18 | Wage and occupational distribution | States that increased their MW in 2009 - 2016 | States that did not increase their MW in 2009 - 2016 | USA | DD | OEWSP- Surveys - Establishment level | Overall wage inequality decreases within establishments after minimum wage increases. |
| Frank, 2021 | 1977-2011 | Indirect effects high income | High impact states | Low impact states | USA | DD | IRS Tax - Administrative - Individual data | There is a causal relationship between declining real MW and rising inequality. |
| Ohlert, 2023 | 2014-2015 | Gender inequality | Companies with at least one employee earning less than MW. | Companies without employees with less than MW | Germany | DD | VSE 2014 and VE 2015 - Surveys - Companies | Significant reduction in the gender pay gap |
| Pérez, 2020 | 1996-2000 | Formal and informal wages | High impact city-industry blocks | Low impact city-industry blocks | Colombia | DD - Card 1992 | ENH - Survey - Individual data | Formal wage growth > informal. Induced wage growth (formal) 3%. |
| Sotomayor, 2021 | 1995-2015 | Inequality and poverty | Treatment region Río de Janeiro | Control region São Paulo | Brazil | DD - Card 1992 | PMEs - Surveys - Household data | Poverty and income inequality fall, on average, by 2.8% and 2.4%. The effects fade over time. |
| Beccaria,et al., 2020 | 2002-15 | Negotiated wages | No | No | Argentina | Descriptive | EPH - Survey - Individual data | Without significant effect on the process of reducing the gap between negotiated wage rates. |
| Cho & Yang, 2021. | 2010-20 | Gender inequality | No | No | Korea | Descriptive | Sample in the Korean stock market | MW reduces the gender pay gap. |
| Laporšek, et al., 2021 | 2005-15 | Wage inequality | No | No | Slovenia | Descriptive | SURS - Administrative - Individual data | MW reduces wage inequality. The effect was greater for women, young people, and workers with a lower level of education or low occupation. |
| Alinaghi et al., 2020 | 2012-13 | Inequality | No | No | N. Zealand | Microsimulation | HES - Survey - Individual data | Small effect. |
| Backhaus & Müller, 2023 | 2012-2016 | Inequality Household | No | No | Germany | Descriptive/simulation | SOEP - Survey - Individual and household data | Substantial impact on the lower end of the wage distribution, but not on poverty. |
| Engbom & Moser, 2022 | 1996-2012 | Infant mortality | No | No | Brazil | Labour market equilibrium model | The MW increase represents 45% of a large fall in income inequality during 1996 to 2012. | |
| Grünberger et al., 2021 | 2017 | Inequality and poverty | No | No | European Union | Microsimulation - EUROMOD | EU-SILC - surveys - Individual data | MW increases can significantly reduce in-work poverty, wage inequality, and the pay gap between men and women. |
| Long, 2022 | 2014-2017 | Inequality and income | No | No | USA (Seatle) | Simulation - Synthetic control | SWESD - Administrative - Individual data | Local minimum wage laws are unlikely to substantially reduce income inequality. |
| Fortin et al., 2021 | 1979 a 2017 | Indirect effects on wage inequality | No | No | USA | Regression | CPS - Survey - Individual data | Indirect effects increase the explanatory power of the decline in MW by up to two-thirds of the increase in inequality at the lower end of the female wage distribution. |
| Sefil-Tansever & Yılmaz, 2024 | 2004-20 | Income inequality | No | No | Turkey | Regression | HLFS - Survey - Individual data | Significant reduction in Income inequality. |
| Bakis & Polat, 2023 | 2002-19 | Wage inequality | No | No | Turkey | Regression (semiparametric decomposition analysis) | HLFS - Survey - Individual data | Significant reduction in wage inequality. |
| Bassier& Ranchhod, 2024 | 2010-14 | Income and poverty. Agricultural | No | No | South Africa | Regression | QSWP - Survey - Individual data | Farmworkers were 7 % less likely to have household income per person below the poverty line. |
| Chao et al., 2022 | 2005-2015 | Wage inequality | No | No | 43 Countries | Regression | WDI and ILOSTAT - Aggregated data | An increase in the urban MW reduces the wage gap between skilled and unskilled workers. |
| Engelhardt & Purcell, 2021 | 1981 a 2015 | Wage inequality | No | No | USA | Regression | CWHS/LEED - Survey/administrative - Individual data | Minimum wage increases are associated with increases in annual earnings for men in the bottom quartile, and especially in the bottom decile. |
| Herrero-Olarte & Sosa, 2020 | 2002-2011 | Income inequality | No | No | South America | Regression (Random effects model) | CEDLAS - per capita income by decile - Aggregated data | MW increases the lowest wages and reduces inequality although it was minimal (due to informality). |
| Herrero-Olarte, 2023 | 2007-17 | Work market | No | No | Ecuador | Regression (Double fixed effects model) | ENEMDU - Survey - Individual data | Significant indirect effect. |
| Herrero-Olarte, 2022 | 2007-14 | Middle class | No | No | Ecuador | Regression (Double fixed effects model) | ENEMDU - Survey - Individual data | MW variations are especially related to the lower-intermediate deciles. |
| Joe & Moon, 2020 | 1990-2017 | Wage inequality | No | No | OECD | Regression | OECD dataset | An increase in the MW reduces wage inequality at the bottom of the wage distribution. |
| Saboia et al., 2021 | 2012-19 | Labor income | No | No | Brazil | Regression | PNAD - Survey - Individual data | MW increases the lowest and middle wage significant except on the income of the first two tenths of the distribution. |
| Tamkoç & Torul, 2020 | 2022-16 | Wage inequality | No | No | Turkey | Regression + Hypothetical (counterfactual experiment) | HBS and SILC - surveys - Individual data | The rapid growth of the minimum wage coincides with a decrease in wage inequality (correlation coefficient 0.54). |
| Bükey, 2022 | 1987-2017 | Income inequality | No | No | Turkey | Autoregressive Distributed Lag (ARDL) | MLSS - Aggregated and individual data | A 1% increase in MW reduces the Gini coefficient by 0.061%. |
| Sari & Rudi, 2021 | 2005-2018 | Income inequality | No | No | Indonesia | Long-run structural vector autoregression (SVAR) | ICSO | MW reduces income inequality and poverty. |
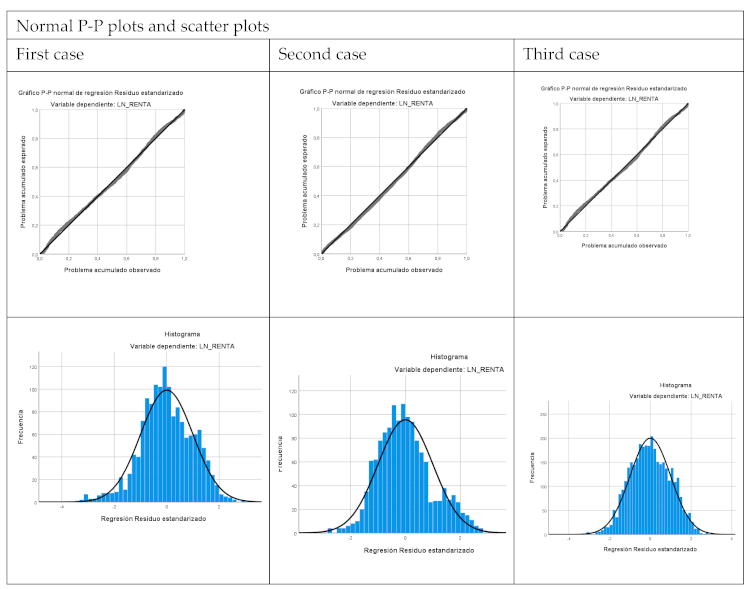
Appendix C. Results from Applying the Difference-in-Differences Methodology
| Test 1. Treatment group: people with incomes equal to or below the MW; control group: the rest of the target population. | ||||
| Non-Stand Coef. | Stand. Coef. | t | p | |
| Constant | 10.03 | 938.959 | 0.000 | |
| β1 | 0.052 | 0.050 | 4.501 | 0.000 |
| β 2 | -1.23 | -0.641 | -43.578 | 0.000 |
| β 3 | 0.302 | 0.110 | 7.382 | 0.000 |
| Adjusted R-Squared | 0.472 | |||
| Durbin Watson | 0.938 | |||
| Test 2. Treatment group: people with incomes at or below the MW; control group: people in the target population with incomes above two-thirds of the median income in 2019. | ||||
| Non-Stand Coef. | Stand. Coef. | t | p | |
| Constant | 10.138 | 936.991 | 0.000 | |
| β1 | 0.020 | 0.019 | 1.709 | 0.000 |
| β 2 | -1.151 | -0.784 | -52.805 | 0.000 |
| β 3 | 0.441 | 0.222 | 14.481 | 0.000 |
| Adjusted R-Squared | 0.553 | |||
| Durbin Watson | 1.218 | |||
| Dependent variable. Log of income. The same tests have been applied to treatment variables 2 and 3 and the results have been similar. | ||||
References
- Aceytuno, M., Sánchez-López, C., & de Paz-Báñez, M. A. (2020). Rising inequality and entrepreneurship during economic downturn: An analysis of opportunity and necessity entrepreneurship in spain. Sustainability, 12(11). [CrossRef]
- Alinaghi, N., Creedy, J., & Gemmell, N. (2020). The redistributive effects of a minimum wage increase in new zealand: A microsimulation analysis. Australian Economic Review, 53(4), 517-538.
- Allegretto, S., Dube, A., Reich, M., & Zipperer, B. (2017). Credible research designs for minimum wage studies. ILR Review, 70(3), 559-592. [CrossRef]
- Arranz Muñoz, J. M., & García-Serrano, C. (2023). Los efectos de una subida del salario mínimo sobre los ingresos familiares, la desigualdad y la pobreza. Papeles De Trabajo El Instituto De Estudios Fiscales. Serie Economía., (10), 1-34.
- Autor, David H., Lawrence F. Katz, and Melissa S. Kearney. 2008. Trends in US wage inequality: Revising the revisionists. The review of economics and statistics 90, no. 2:300-323.
- Autor, D. H., Manning, A., & Smith, C. L. (2016a). The contribution of the minimum wage to US wage inequality over three decades: A reassessment. American Economic Journal: Applied Economics, 8(1), 58-99.
- Autor, D. H., Manning, A., & Smith, C. L. (2016b). The contribution of the minimum wage to US wage inequality over three decades: A reassessment. American Economic Journal: Applied Economics, 8(1), 58-99.
- Backhaus, T., & Müller, K. (2023). Can a federal minimum wage alleviate poverty and income inequality? ex-post and simulation evidence from germany. Journal of European Social Policy, 33(2), 216-232.
- Bakis, O., & Polat, S. (2023). Wage inequality dynamics in turkey. Empirica, 50(3), 657-694.
- Bartels, Larry. 2016. Unequal Democracy: The Political Economy of the New Gilded Age, 2nd edition. New York: Russell Sage Foundation, and Princeton, NJ: Princeton University Press (1st edition in 2009).
- Bassier, I., & Ranchhod, V. (2024). Can minimum wages effectively reduce poverty under low compliance? A case study from the agricultural sector in south africa. Review of Political Economy, 36(2), 398-419. [CrossRef]
- Beccaria, L., Fernández, A. L., & Trajtemberg, D. (2020). Reducción de la desigualdad de las remuneraciones e instituciones en argentina (2002-2015). Cuadernos De Economía, 39(81), 731-763.
- Belman, D., & Wolfson, P. J. (2014a). What does the minimum wage do? WE Upjohn Institute.
- Belman, D., & Wolfson, P. J. (2014b). What does the minimum wage do? WE Upjohn Institute.
- Bosch, M., & Manacorda, M. (2010). Minimum wages and earnings inequality in urban mexico. American Economic Journal: Applied Economics, 2(4), 128-149.
- Bossler, M., & Schank, T. (2023). Wage inequality in germany after the minimum wage introduction. Journal of Labor Economics, 41(3), 813-857.
- Brown, C. (1999). Minimum wages, employment, and the distribution of income. In O. Ashenfelter, & D. Card (Eds.), Handbook of labor economics (pp. 2101-2163) Elsevier. Retrieved from https://EconPapers.repec.org/RePEc:eee:labchp:3-32.
- Brown, C., Gilroy, C., & Kohen, A. (1982). The effect of the minimum wage on employment and unemployment. Journal of Economic Literature, 20, 487-528. [CrossRef]
- Bükey, A. M. (2022). Türkiye’de ücret politikaları ve gelir dağılımı eşitsizliği i̇lişkisi. Alanya Akademik Bakış, 6(3), 3109-3128.
- Burauel, P., Caliendo, M., Grabka, M. M., Obst, C., Preuss, M., Schröder, C., & Shupe, C. (2020). The impact of the german minimum wage on individual wages and monthly earnings. Jahrbücher Für Nationalökonomie Und Statistik, 240(2-3), 201-231.
- Bartels, Larry M. 2016. Unequal democracy: The political economy of the new gilded age.
- Butcher, T., Dickens, R., & Manning, A. (2012). Minimum wages and wage inequality: Some theory and an application to the UK.
- CAASMI (Comisión asesora para el análisis del SMI) (2021). De la Rica, S., Gorjón, L., de Lafuente, D. M., & Romero, G. (2021). El impacto de la subida del salario mínimo interprofesional en la desigualdad y el empleo. ISEAK.Http://T.Ly/6HRYg.
- CAASMI (Comisión asesora para el análisis del SMI) (2022). Cebrián López, I. (Relatora) (2022). II Informe de la comisión asesora para el análisis del SMI. ISEAK.https://www.tercerainformacion.es/wp-content/uploads/2022/12/SMIV5.pdf.
- Caliendo, M., Fedorets, A., Preuss, M., Schröder, C., & Wittbrodt, L. (2023). The short- and medium-term distributional effects of the german minimum wage reform. Empirical Economics, 64(3), 1149-1175. [CrossRef]
- Card, David, and John E. DiNardo. 2002. Skill-biased technological change and rising wage inequality: Some problems and puzzles. Journal of Labor Economics 20, no. 4:733-783.
- Card, D., & Krueger, A. B. (1992). Does school quality matter? returns to education and the characteristics of public schools in the united states. Journal of Political Economy, 100(1), 1-40.
- Card, D., & Krueger, A. B. (1995a). Myth and measurement: The new economics of the minimum wage* industrial and labor relations review, vol. 48, no. 4, july 1995. Industrial and Labor Relations Review, 48(4).
- Card, D., & Krueger, A. B. (1995b). Myth and measurement: The new economics of the minimum wage* industrial and labor relations review, vol. 48, no. 4, july 1995. Industrial and Labor Relations Review, 48(4).
- Card, D., & Krueger, A. B. (2016). Myth and measurement: The new economics of the minimum wage Princeton University Press.
- Chao, C., Ee, M. S., Nguyen, X., & Yu, E. S. (2022). Minimum wage, firm dynamics, and wage inequality: Theory and evidence. International Journal of Economic Theory, 18(3), 247-271.
- Cho, J., & Yang, D. (2021). Impact of minimum wage legislation on gender differentials in sticky wages: Evidence from korea. Applied Economics Letters, 30(7), 855-858.
- De Paz-Báñez, M. A., Asensio-Coto, M., Sánchez-López, C., & Aceytuno, M. (2020). Is there empirical evidence on how the implementation of a universal basic income (UBI) affects labour supply? A systematic review. Sustainability, 12(22). [CrossRef]
- Derenoncourt, E., & Montialoux, C. (2021). Minimum wages and racial inequality. The Quarterly Journal of Economics, 136(1), 169-228.
- Dickens, R., & Manning, A. (2004). Has the national minimum wage reduced UK wage inequality? Journal of the Royal Statistical Society Series A: Statistics in Society, 167(4), 613-626.
- Dickens, R., Manning, A., & Butcher, T. (2012). No title. Minimum Wages and Wage Inequality: Some Theory and an Application to the UK, .
- DiNardo, J., Fortin, N. M., & Lemieux, T. (1996). Labor market institutions and the distribution of wages, 1973-1992: A semiparametric approach. Econometrica, 64(5), 1001-1044. [CrossRef]
- Dube, A. (2019a). Impacts of minimum wages: Review of the international evidence. Independent Report.UK Government Publication, , 268-304.
- Dube, A. (2019b). Minimum wages and the distribution of family incomes. American Economic Journal: Applied Economics, 11(4), 268-304.
- Dube, A. (2019c). Minimum wages and the distribution of family incomes. American Economic Journal: Applied Economics, 11(4), 268-304.
- Dustmann, C., Lindner, A., Schönberg, U., Umkehrer, M., & Vom Berge, P. (2022). Reallocation effects of the minimum wage. The Quarterly Journal of Economics, 137(1), 267-328.
- Dütsch, M., Ohlert, C., & Baumann, A. (2024). The minimum wage in germany: Institutional setting and a systematic review of key findings. Jahrbücher Für Nationalökonomie Und Statistik, (0).
- Engbom, N., & Moser, C. (2022). Earnings inequality and the minimum wage: Evidence from brazil. American Economic Review, 112(12), 3803-47. [CrossRef]
- Engelhardt, G. V., & Purcell, P. J. (2021). The minimum wage and annual earnings inequality. Economics Letters, 207, 110001.
- Eurofound (2022). Minimum wages in 2022: Annual review, Minimum wages in the EU series, Publications Office of the European Union, Luxembourg. Authors: Christine Aumayr-Pintar, Jakub Kostolný and Carlos Vacas Soriano.
- Eurofound (2024), Minimum wages: Non-compliance and enforcement across EU Member States – Comparative report, Publications Office of the European Union, Luxembourg.
- Autor, David H., Alan Manning, and Christopher L. Smith. 2016. “The Contribution of the Minimum Wage to US Wage Inequality over Three Decades: A Reassessment.” American Economic Journal: Applied Economics 8 (1): 58–99.
- Forsythe, E. (2023). The effect of minimum wage policies on the wage and occupational structure of establishments. Journal of Labor Economics, 41(S1), S291-S324.
- Fortin, N. M., Lemieux, T., & Lloyd, N. (2021). Labor market institutions and the distribution of wages: The role of spillover effects. Journal of Labor Economics, 39(S2), S369-S412.
- Frank, M. (2021). Minimum wage laws and top income shares: Evidence from A large panel of states. Journal of Business Strategies, 38(1), 25-37.
- Freeman, R. B. (1996a). The minimum wage as a redistributive tool. The Economic Journal, 106(436), 639-649. [CrossRef]
- Freeman, R. B. (1996b). The minimum wage as a redistributive tool. The Economic Journal, 106(436), 639-649. [CrossRef]
- Gramlich, E. (1976). Impact of minimum wages on other wages, employment, and family incomes. Brookings Papers on Economic Activity, 7(2), 409-462. Retrieved from https://EconPapers.repec.org/RePEc:bin:bpeajo:v:7:y:1976:i:1976-2:p:409-462.
- Grünberger, K., Narazani, E., Filauro, S., & Kiss, Á. (2021). Social and fiscal impacts of statutory minimum wages in EU countries: A microsimulation analysis with EUROMOD. IZA Journal of Labor Policy, 12(1).
- Herrero-Olarte, S. (2022). Salario mínimo, pobreza y clase media. el caso ecuatoriano. Regional and Sectoral Economic Studies, 22(1), 95-106.
- Herrero-Olarte, S. (2023). The minimum wage in ecuador. Work Organisation, Labour & Globalisation, 17(2), 105-127.
- Herrero-Olarte, S., & Sosa, F. V. (2020). ¿ Influyen los salarios mínimos en los ingresos de los más pobres de sudamérica? Regional and Sectoral Economic Studies, 20(2), 139-150.
- ILO. (2014). Report of the committee of experts on the application of conventions and recommendations ILC, 103rd session, 2014, Report III (Part 1B). Geneva: International Labour Office.
- Joe, D. H., & Moon, S. (2020). Minimum wages and wage inequality in the OECD countries. East Asian Economic Review, 24(3), 253-273.
- Laporšek, S., Vodopivec, M., & Vodopivec, M. (2021). Lowering wage inequality with the minimum wage increase in slovenia. International Journal of Sustainable Economy, 13(3), 306-321.
- Lee, D. S. (1999a). Wage inequality in the united states during the 1980s: Rising dispersion or falling minimum wage? The Quarterly Journal of Economics, 114(3), 977-1023.
- Lee, D. S. (1999b). Wage inequality in the united states during the 1980s: Rising dispersion or falling minimum wage? The Quarterly Journal of Economics, 114(3), 977-1023.
- Llopis, J. B., CANO, E. C., & Bloise, E. A. (2011). La incidencia del salario mínimo interprofesional en sectores de bajos salarios. Cuadernos De Relaciones Laborales, 29(2), 363-389.
- Long, M. C. (2022). Seattle's local minimum wage and earnings inequality. Economic Inquiry, 60(2), 528-542.
- Neumark, D., Salas, J. M. I., & Wascher, W. (2014). Revisiting the minimum Wage—Employment debate: Throwing out the baby with the bathwater? ILR Review, 67(3), 608-648. Retrieved from https://EconPapers.repec.org/RePEc:sae:ilrrev:v:67:y:2014:i:3_suppl:p:608-648.
- Ohlert, C. (2023). Auswirkungen des gesetzlichen mindestlohns auf geschlechterungleichheiten bei arbeitszeiten und verdiensten. Soziale Welt, 74(4). [CrossRef]
- Neumark, D., & Shirley, P. (2022). Myth or measurement: What does the new minimum wage research say about minimum wages and job loss in the united states? Industrial Relations: A Journal of Economy and Society, 61(4), 384-417. [CrossRef]
- Neumark, D., & Wascher, W. L. (2008). In Neumark D., Wascher W. L. (Eds.), Minimum wages The MIT Press. https://doi.org/10.7551/mitpress/9780262141024.003.0001 Retrieved from. [CrossRef]
- . [CrossRef]
- Pérez, J. P. (2020). The minimum wage in formal and informal sectors: Evidence from an inflation shock. World Development, 133, 104999.
- Saboia, J., Hallak, J., Simões, A., & Dick, P. C. (2021). Mercado de trabalho, salário-mínimo e distribuição de renda no brasil no passado recente. Revista De Economia Contemporânea, 25(2), e212521.
- Sánchez-López, C., & Paz Báñez, M.,Adelaida de. (2016). Desigualdad y pobreza en la gran recesión. diferencias entre los países de la UE.
- Sari, D. W., & Rudi Purwono, D. (2021). Analysis of the relationship between income inequality and social variables: Evidence from indonesia. Economics and Sociology, 14(1), 103-119.
- Sefil-Tansever, S., & Yılmaz, E. (2024). Minimum wage and spillover effects in a minimum wage society. Labour.
- Shiller, Robert J. (2019) Narrative Economics. Princeton University Press.
- Sotomayor, O. J. (2021). Can the minimum wage reduce poverty and inequality in the developing world? evidence from brazil. World Development, 138, 105182.
- Stigler, G. J. (1946). The economics of minimum wage legislation. The American Economic Review, 36(3), 358-365. Retrieved from http://www.jstor.org/stable/1801842.
- Tamkoç, M. N., & Torul, O. (2020). Cross-sectional facts for macroeconomists: Wage, income and consumption inequality in turkey. The Journal of Economic Inequality, 18(2), 239-259.
- Vicens Otero, J. (2008). Problemas econométricos de los modelos de diferencias en diferencias.26-1, 363-384.
- Yun, J., & Heo, I. (2024). Legitimation and perversity: A comparison of the politics of minimum wage reforms in japan and south korea. Asian Studies Review, 48(1), 159-178.
[1] The first minimum wage legislation was enacted in the Australian state of Victoria in 1890, following major workers' demands and demonstrations, and at the national level, in New Zealand in 1894. The International Labour Office (ILO) has paid particular attention to this issue since its inception. Indeed, the preamble to its 1919 Constitution stressed the importance of the urgent improvement of working conditions and emphasised the need to ensure ‘an adequate living wage’. |
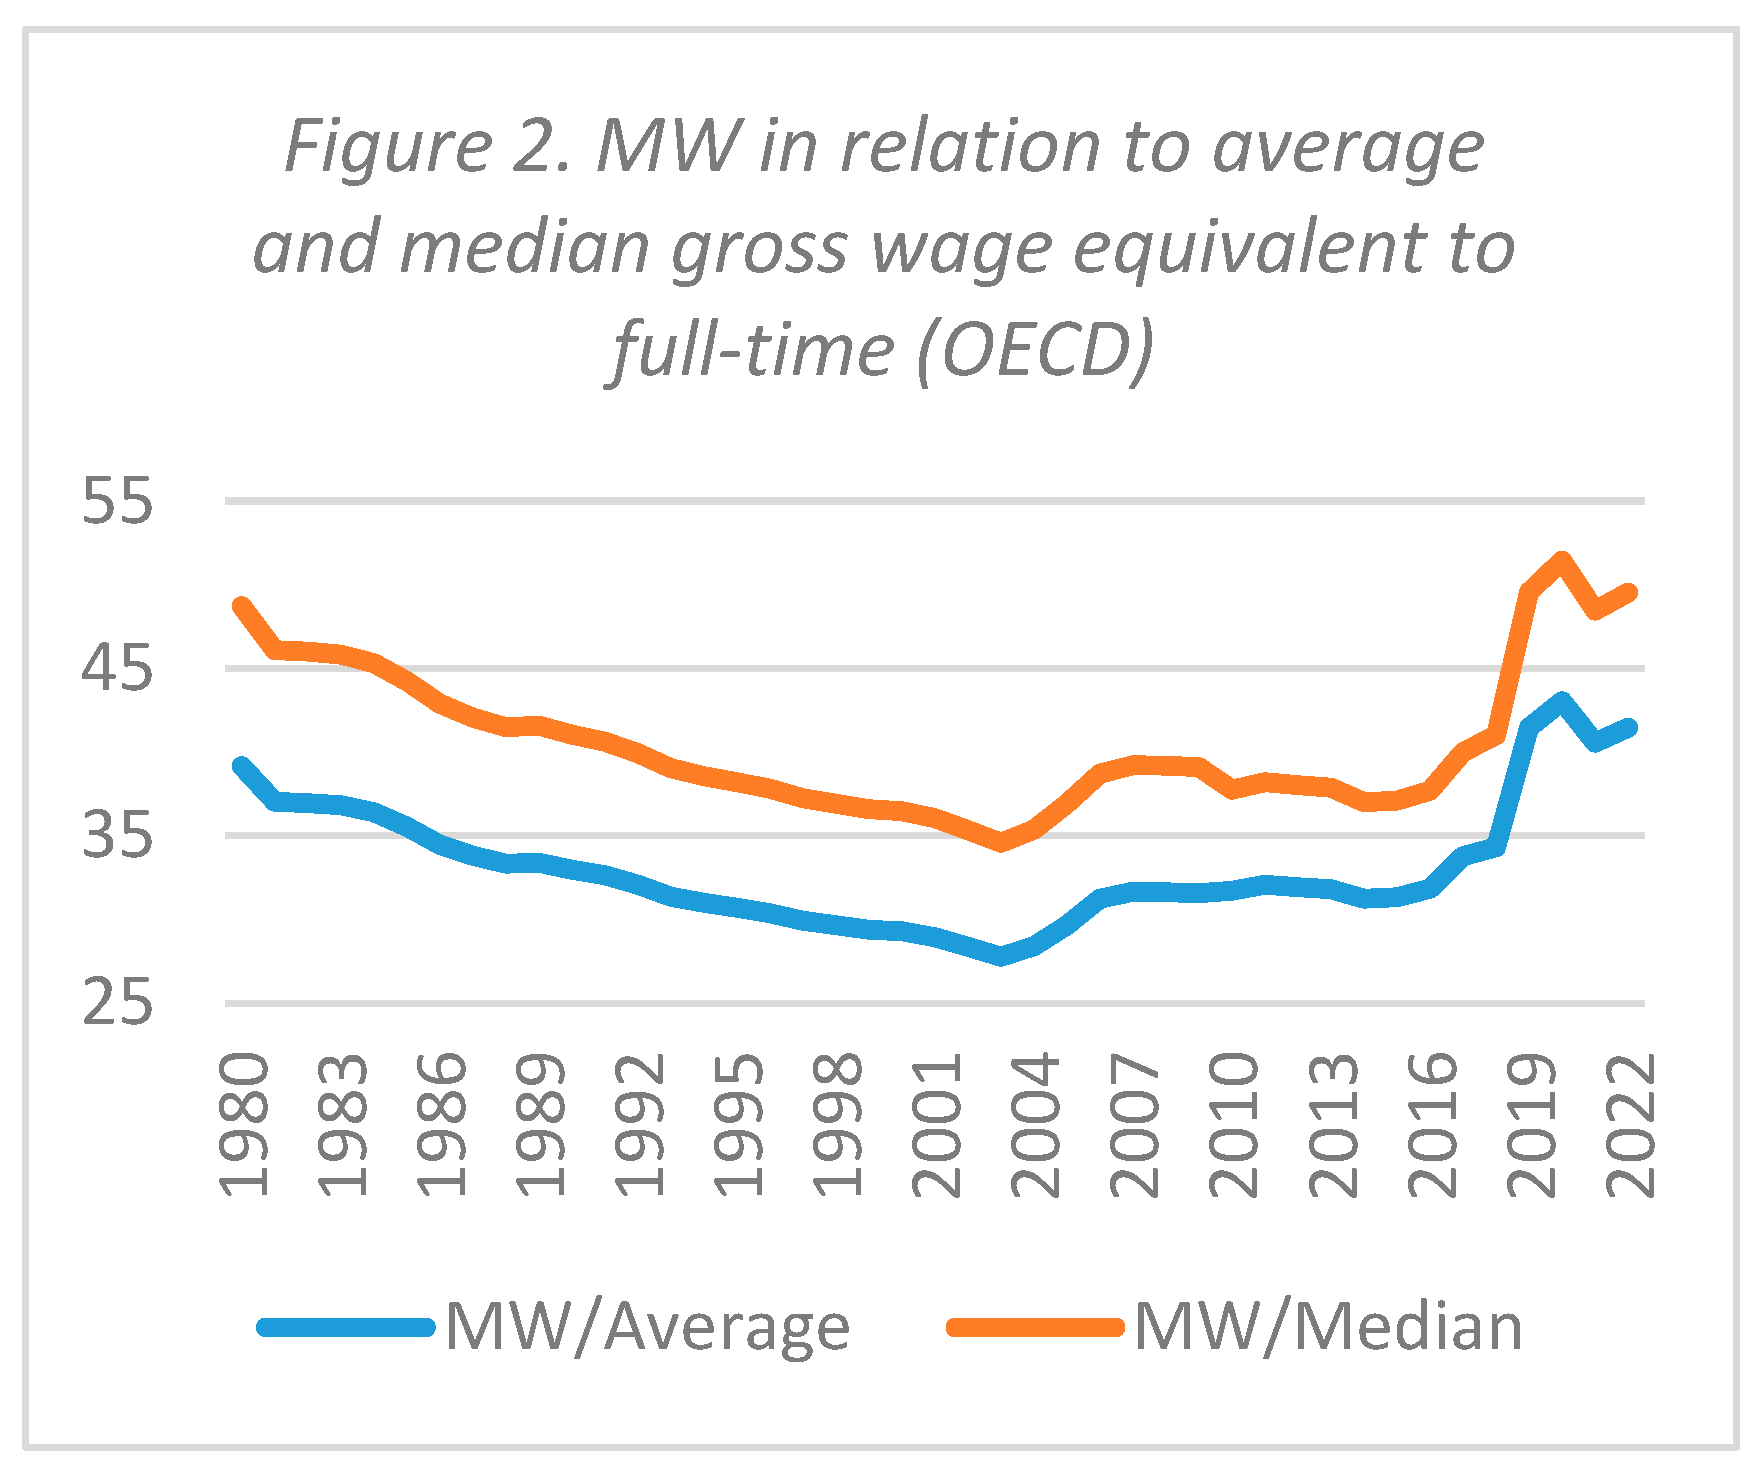
[2] Lowered from the previous version which set it at 68%. Directive 2022/2041 (Art. 5.4) lowers it again to 60% of the median gross wage or 50% of the average gross wage and transforms it into a mere recommendation. |
[3] In any case, the articles found for the pre-2020 stage were reviewed using the same procedure as for the 2020-2024 period, although only at abstract level in case there were any interesting results not referenced in the aforementioned reviews. A total of 153 empirical articles were found, of which 14 were rejected for not providing specific evidence and 57 for not being related to the topic under analysis, leaving a total of 34. The results of all these studies have been included in the previous reviews and are included in the present one. |
[4] Yet, four technical works have been found by other means, as discussed below. |
[5] As in (Grünberger, Narazani, Filauro, & Kiss, 2021) by applying simulation. |
[6] (Alinaghi, Creedy, & Gemmell, 2020), using microsimulation methodology, found that an increase in the minimum wage may have a more substantial effect on some measures against poverty for single-parent employed families in New Zealand. |
[7] In Turkey, the minimum wage experienced two significant increases of around 25% in 2004 and in 2016. |
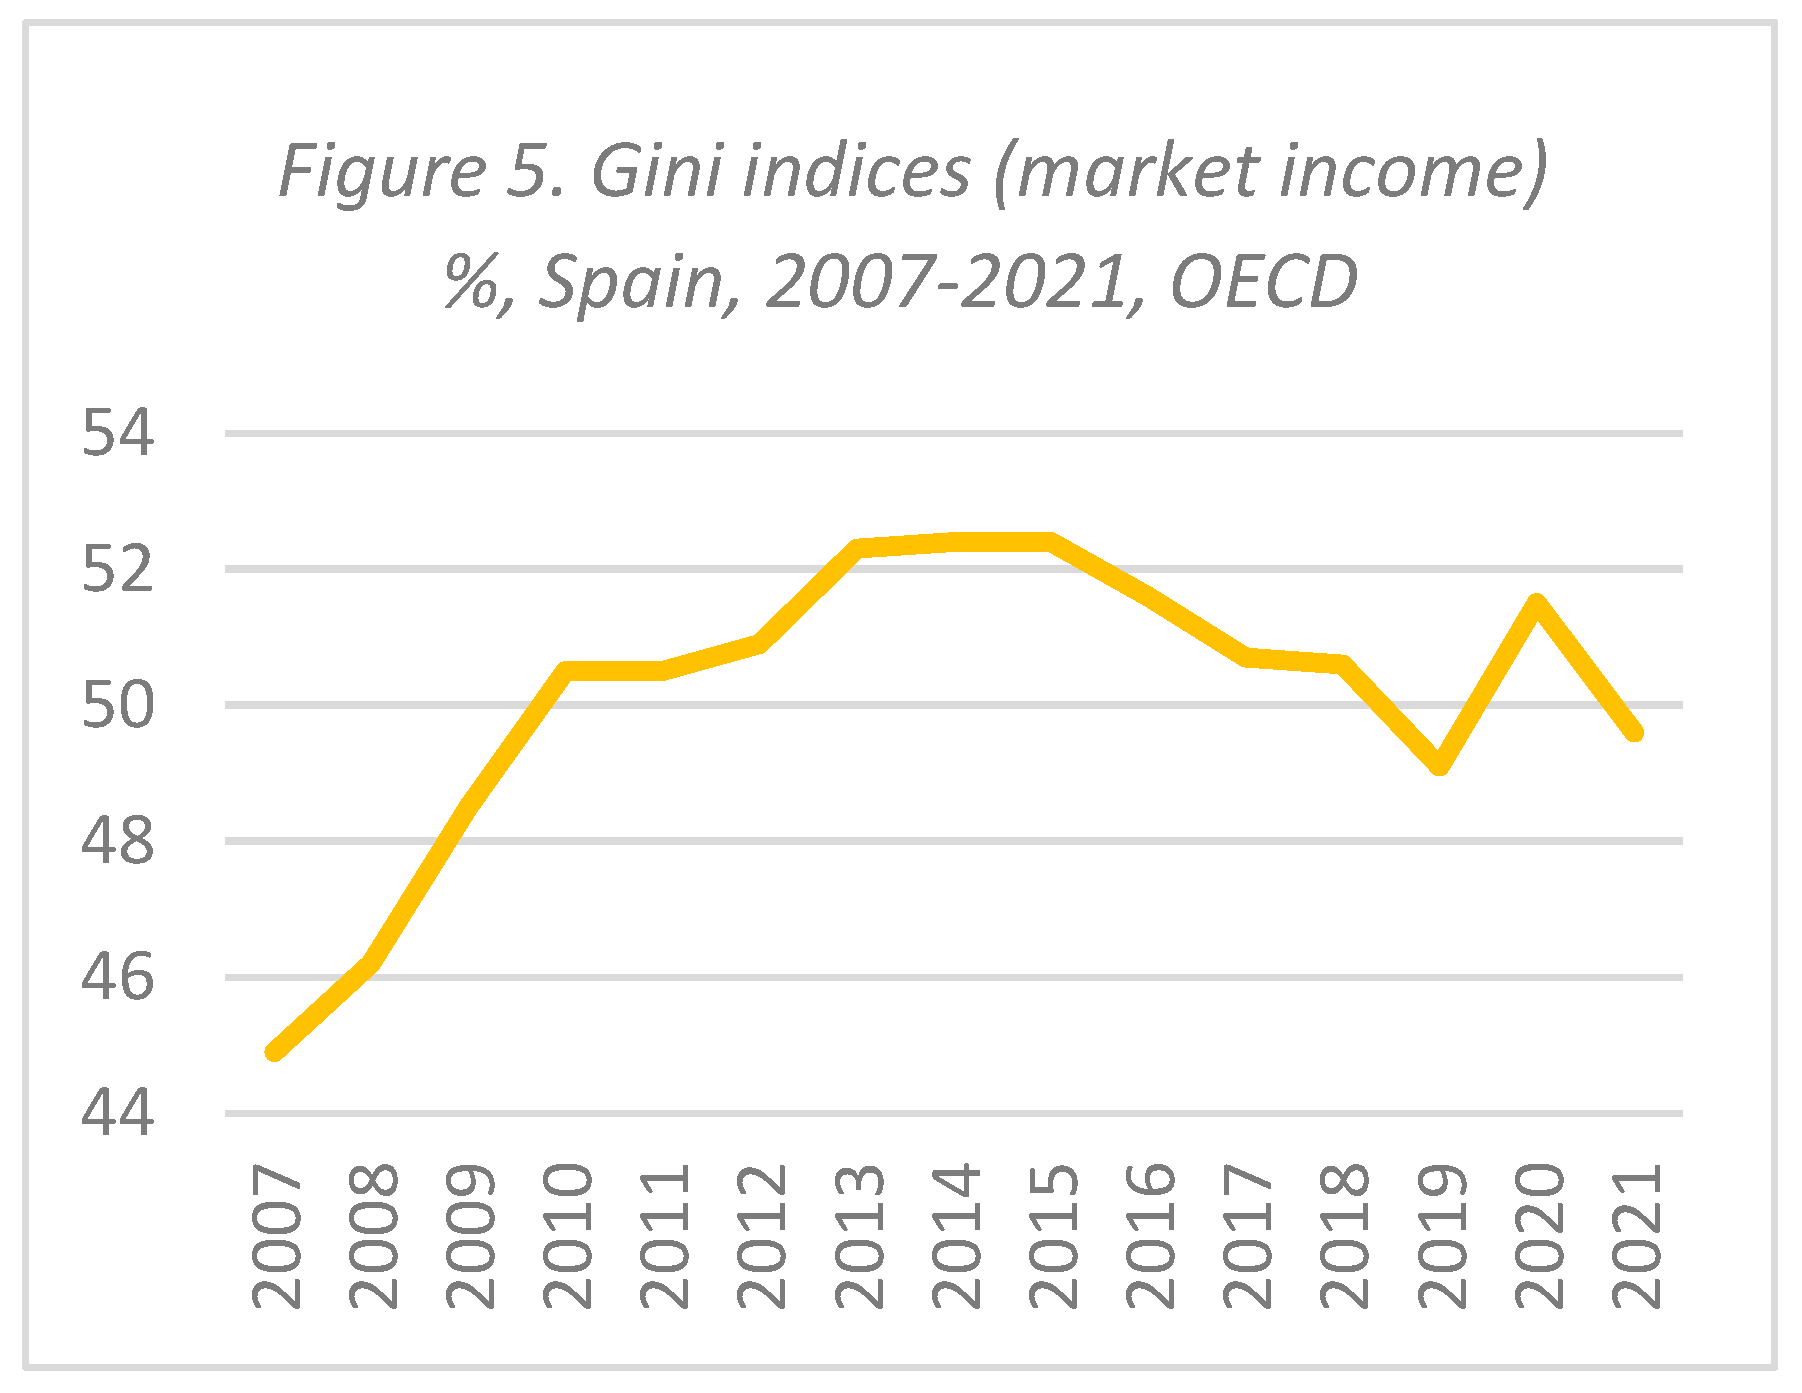
[8] The ‘market’ Gini index, i.e. before taking account of taxes and social transfers, has been used to better illustrate the relationship with the increase in MW, without affecting other measures of inequality reduction. |
[9] The problem with the so-called ‘grey literature’ (institutional) is that they are commissioned technical works that do not usually address conceptual, theoretical, and methodological issues. Moreover, they do not usually undergo external evaluations that are able to verify the methodological robustness of the analysis, so that their results can hardly count as scientific evidence. In any case, the results are analysed in order to verify the results. The following is a list of the results found: Instituto de Estudios Fiscales (Arranz Muñoz & García-Serrano, 2023); (Eurofound ,2022); CAASMI (2021 and 2022). |
[10] The classification of the target population by income level is based on the definitions used by the OECD for the calculation of wage levels and the establishment of high and low wage incidence rates in the Employment Outlook report. Available at: https://data.oecd.org/earnwage/wage-levels.htm. |
[11] According to the Spanish CIS, the Centre for Sociological Research, 71% of Spaniards were in favour or very much in favour of the measure. |
[12] This is what has been recently done with pensions is Spain, which are almost automatically updated. |
[13] Here are the links to the most relevant documents for applying this methodology: Elaboration of the Protocol: https://www.bmj.com/content/349/bmj.G7647; full checklist: https://prisma.shinyapps.io/checklist/; flow diagram: https://www.prisma-statement.org/prisma-2020-flow-diagram; and explanatory guidance for conducting the systematic review: https://www.bmj.com/content/372/ bmj.n160?ijkey=f8955c1394a4fda7939b8b197f23c8b4e3ef260e&keytype2=tf_ipsecsha. |
| Reference | Period | Objective | Treatment group | Control group | Place | Methodology | Data sources | Results |
| Bossler & Schank, 2023 | 2011-2017 | Wage inequality | High impact regions | Low impact regions | Germany | DD. by quantile - Card 1992 | IEB - Administrative - Individual data | 12% MW-induced wage increase at the 5th percentile; 21% at the 20th percentile: 2% at the 50th percentile. Null effect beyond the median. |
| Burauel et al., 2020 | 2010-2016 | Wages and income | Wage< MW (8.5) | 8.5 ≤ Wage <10 | Germany | DTADD | SOEP - Survey - Individual data | MW induced wage increase 6.5%. Induced monthly income increase of 6.6%. |
| Caliendo, et al., 2023 | 2013-2018 | Wages | High impact regions | Low impact regions | Germany | DD. by quantile - Card 1992 | SOEP - Survey - Individual data | 9% in 2015 and 21% between 2016 and 2018 in the first quintile. |
| Derenoncourt & Montialou, 2021 | 1967 | Racial inequality | Average annual earnings of workers covered in 1967 | Average annual earnings of workers covered before 1967 | USA | DD | Industry wage reports BLS - Survey - Wage distributions and individual data | The expansion of the minimum wage in 1967 can explain more than 20% of the reduction in the racial income gap during the civil rights era. |
| Forsythe, 2023 | 2011-18 | Wage and occupational distribution | States that increased their MW in 2009 - 2016 | States that did not increase their MW in 2009 - 2016 | USA | DD | OEWSP- Surveys - Establishment level | Overall wage inequality decreases within establishments after minimum wage increases. |
| Frank, 2021 | 1977-2011 | Indirect effects high income | High impact states | Low impact states | USA | DD | IRS Tax - Administrative - Individual data | There is a causal relationship between declining real MW and rising inequality. |
| Ohlert, 2023 | 2014-2015 | Gender inequality | Companies with at least one employee earning less than MW. | Companies without employees with less than MW | Germany | DD | VSE 2014 and VE 2015 - Surveys - Companies | Significant reduction in the gender pay gap |
| Pérez, 2020 | 1996-2000 | Formal and informal wages | High impact city-industry blocks | Low impact city-industry blocks | Colombia | DD - Card 1992 | ENH - Survey - Individual data | Formal wage growth > informal. Induced wage growth (formal) 3%. |
| Sotomayor, 2021 | 1995-2015 | Inequality and poverty | Treatment region Río de Janeiro | Control region São Paulo | Brazil | DD - Card 1992 | PMEs - Surveys - Household data | Poverty and income inequality fall, on average, by 2.8% and 2.4%. The effects fade over time. |
| Minimum wage | 12,600 |
| Median income | 24,667.20 |
| 2/3 median | 16,444.80 |
| 1.5 median | 37,000.80 |
Disclaimer/Publisher’s Note: The statements, opinions and data contained in all publications are solely those of the individual author(s) and contributor(s) and not of MDPI and/or the editor(s). MDPI and/or the editor(s) disclaim responsibility for any injury to people or property resulting from any ideas, methods, instructions or products referred to in the content. |
© 2024 by the authors. Licensee MDPI, Basel, Switzerland. This article is an open access article distributed under the terms and conditions of the Creative Commons Attribution (CC BY) license (http://creativecommons.org/licenses/by/4.0/).


