Preprint
Article

Identifying the Mobility Patterns of the Historic Centre of Syrian Cities Using Cluster and Spatial Analysis

Altmetrics

Downloads

103

Views

51

Comments

0

This version is not peer-reviewed

Submitted:

24 June 2024

Posted:

25 June 2024

You are already at the latest version

Alerts
Abstract
One of the most significant challenges that is facing urban-planning ,is the develop-ment of a transportation network, particularly in historical Syrian cities, which are characterized by their compact urban form. Historical Syrian cities, including historical city of Aleppo, present difficulties due to the essential balance required between saving cultural heritage and meeting the needs of a present-day population. This study basically addresses the city's key elements and planning issues, including traffic density, pedestrian safety, and the massive spreading of motor-ized vehicles. The objective of this study is to analyze the street structure, understanding its components and problems in order to develop a methodology that can be used to enhance urban mobility and to improve the structure of the historical city. for this purpose, two main methods were employed, method of analyzing geographical data based on Geographic Information Systems (GIS) and K-Means cluster analysis method. These two methods were employed to gain detailed and clear vision into mobility patterns of historical Aleppo. Which involved careful processing of data, such as street names, locations, components, quantities, and widths, based on the author’s observations and notes and a variety of local and international sources. This analysis process will not only reveal the current hierarchy of streets but also demonstrates the dynamical and complicated formation of transportation structures of the historical city. The findings of the study describe the challenges faced by historic city centers and highlight the interrelationship between the following: urban structure, objects of cultural heritage, tourism plans, and mobility patterns. The application of spatial analysis method serves as a technique that reveals the formulation of possible scenarios that helps to develop the transportation structure in the historical city of Aleppo. These generated scenarios will be used as typical solutions that can be generalized to all similar historic Syrian cities.
Keywords: 
Subject: Engineering  -   Transportation Science and Technology

1. Introduction

Historically significant cities face contradictions between preserving urban identity and adapting to the demands of sustainability in modern societies. The complexity of social, economic, and administrative issues makes the required and delicate balance very important, especially in territories of Syrian cities where historic preservation and urban development are being planned [1,3,22,47].
When improving the masterplans of cities, developing historical cities transportation structure is needed, however the usual challenge here is the incompatibility of existing street cross-sections with the types of mobility found in historic centers. These contradictions lead to many issues such as traffic congestion, inefficiency, and weakening of the urban fabric. In a related context, there are ongoing international initiatives to enhance transportation infrastructure in urban territories, with a particular focus on historic centers [4,7]. Any development in urban transportation has the potential to improve the life quality of residents by enhancing safety, comfort, and also to develop the economy by supporting tourism [1,8].
Recent international trends in urban planning consider pedestrian mobility a priority, and this can be understood in enabling pedestrians to reclaim public street spaces. This is done using multiple techniques, the most important of which is determining the density of transportation traffic in historical areas, in addition to ensuring safe and comfortable access to cultural heritage sites [9,12].
Previous studies in the field of urban mobility focused on the importance of pedestrian movement and set standards and guidelines for it, and also shed light on controlling the flow of vehicular traffic and public transportation systems. A variety of scientific methods have been used in these studies, including survey, comparative, inductive and data analysis, to gain insight into the factors that influence mobility behaviors. [1,4,13,17]. Geographic Information Systems (GIS) are considered as a valuable tool for spatial analysis, with which mobility patterns within urban areas can be visualized, processed and analyzed [18].
In the context of historic city centers, many researchers have identified a number of unique challenges caused by narrow street configurations, mixed land uses, and environmental and heritage preservation concerns. In addition, studies have examined the impact of urban form, cultural heritage, and tourism on mobility patterns, focusing on the complex interrelationships between infrastructure and human behavior [1,19].
Increasingly, researchers have used spatial analysis techniques, such as spatial clustering and transportation network analysis, to trace spatial patterns and relationships within historic city centers. It is worth noting that these methods allow identifying attractions and points of interest, assessing accessibility, and visualizing urban planning development scenarios [20,21,22,23,24].
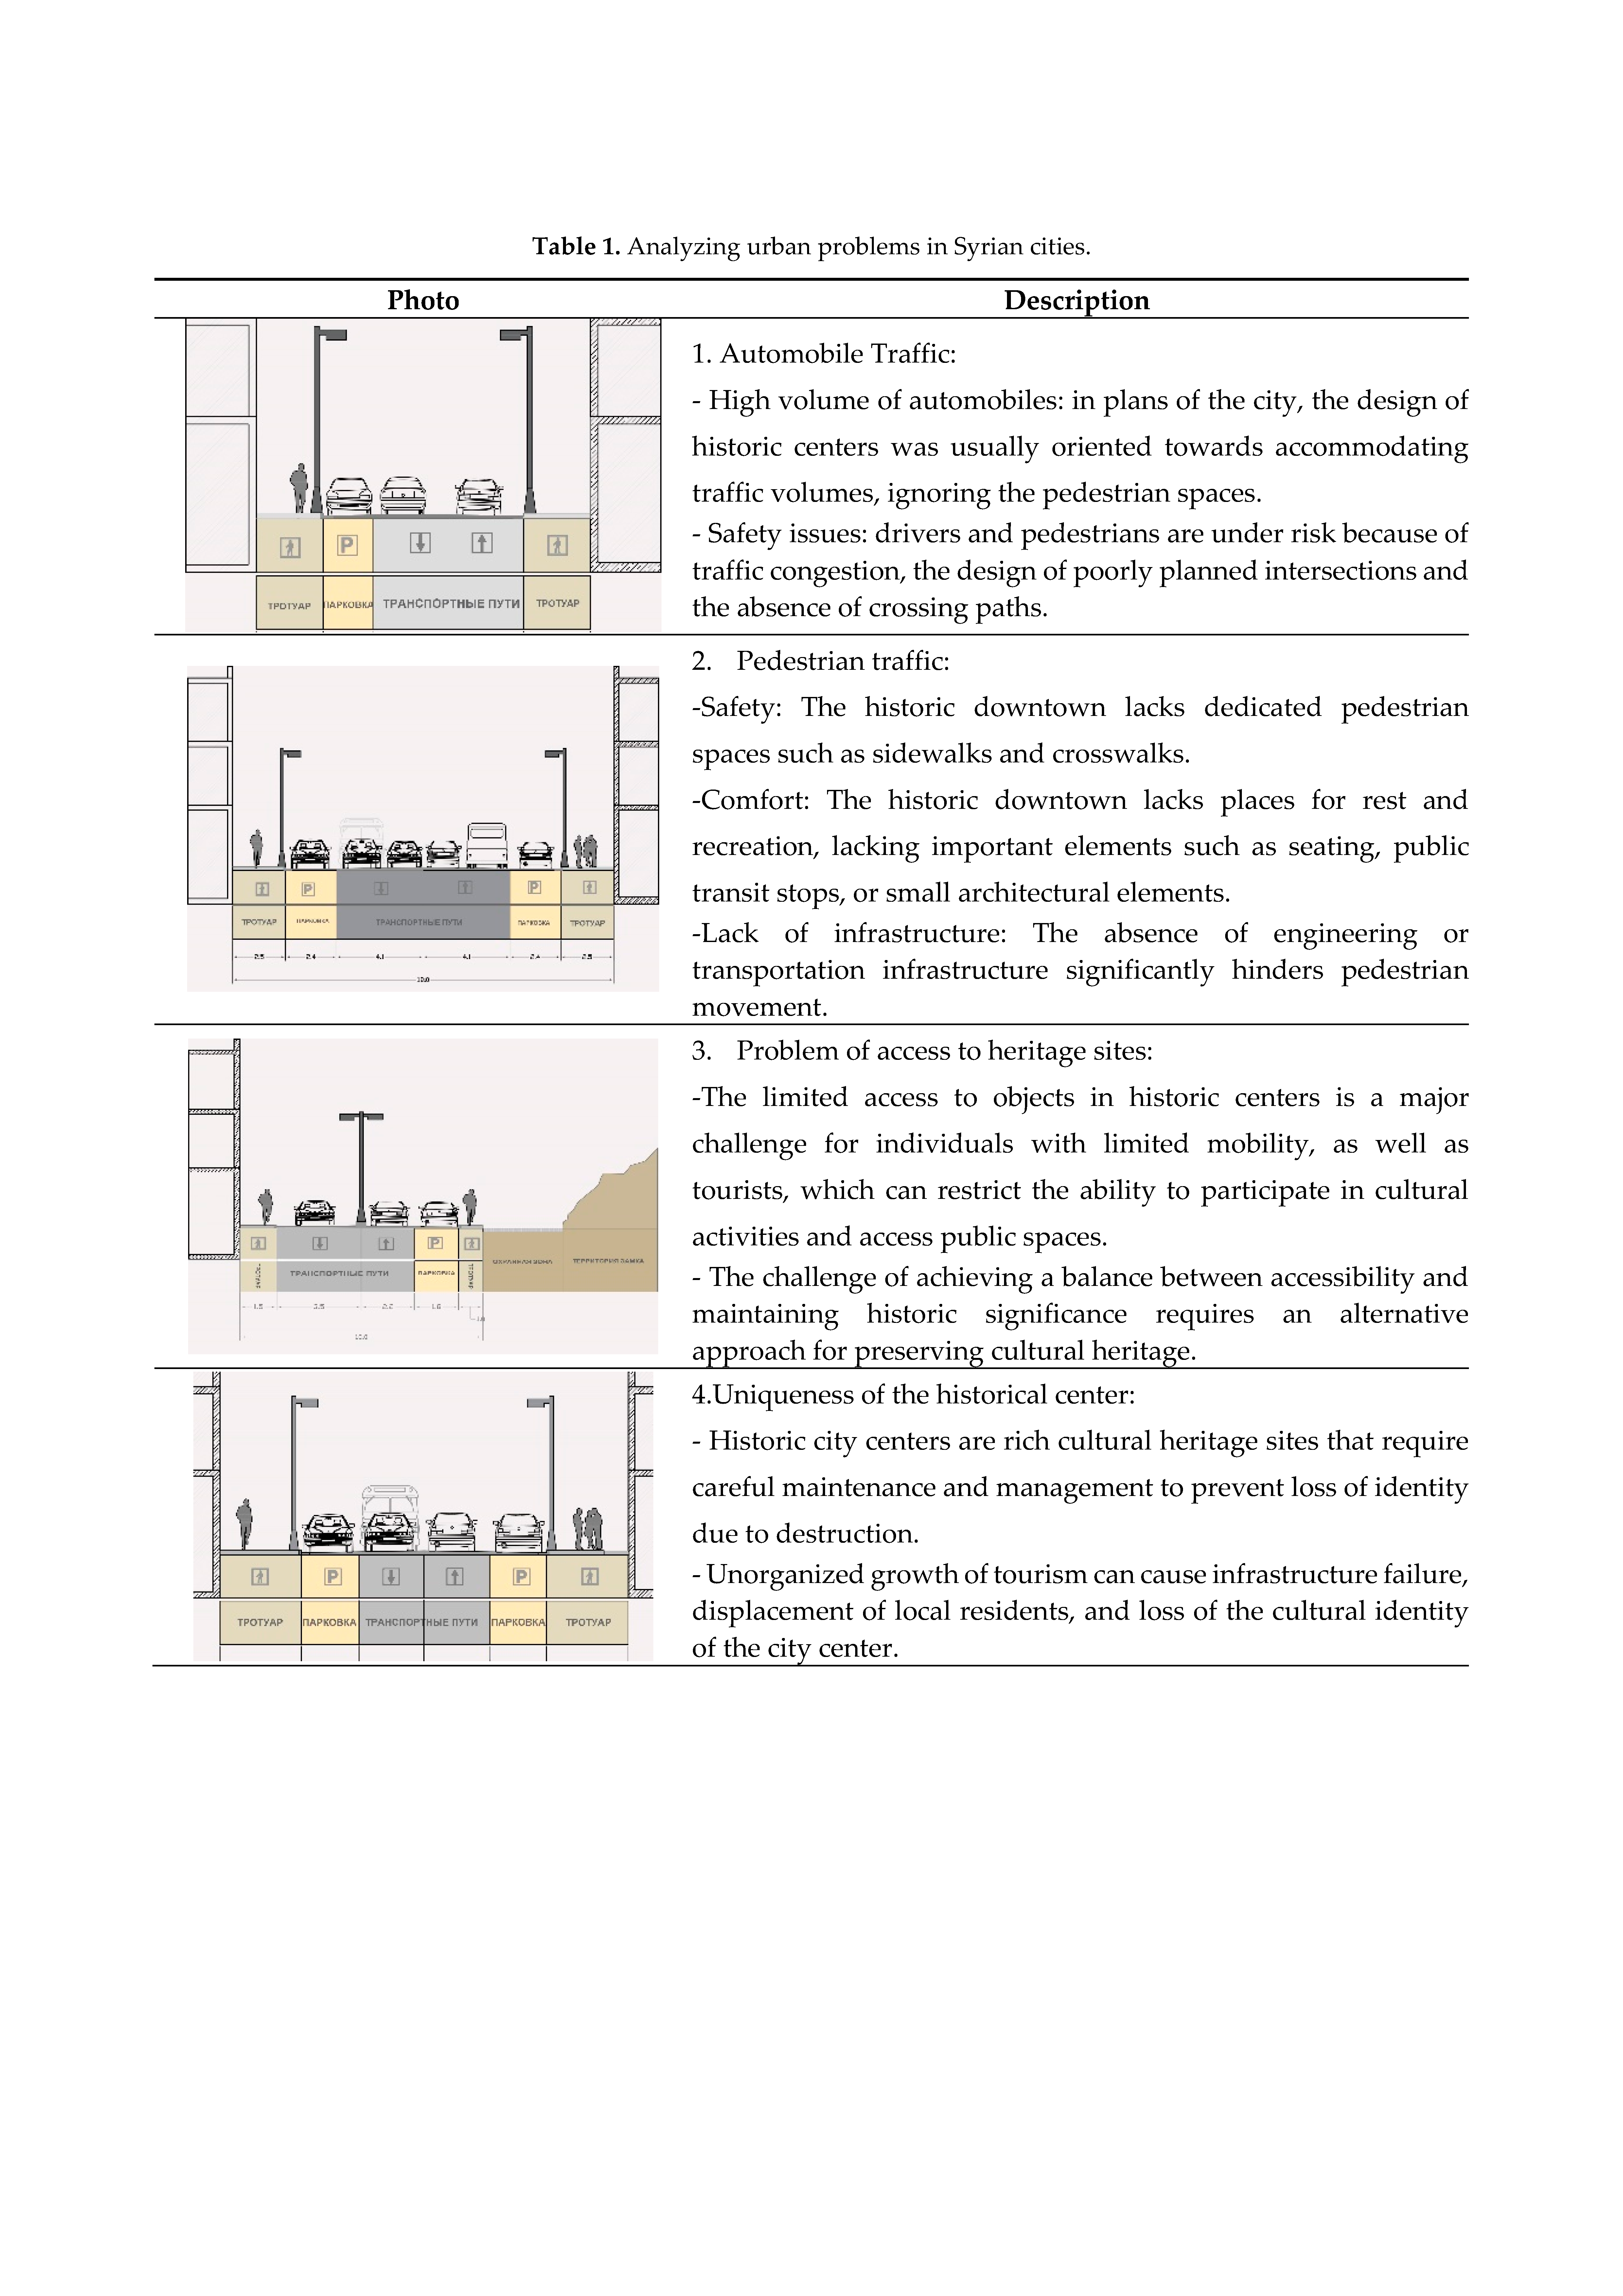
The city's compact historic structure and the evolution of the distribution of buildings in close proximity to each other for environmental and social reasons has created a unique street structure with a broken, winding, closed-ended form, which is an important feature of the urban identity of this area, its culture and the social values that underpin it [25]. Additionally, in the Table 1. the main challenges the faces the historical Syrian cities are described:
This study also aims to improve pedestrian accessibility in historic city centers, also highlighting the need for a methodical approach that includes several phases, as described below and shown in Figure 1:
In addition to defining the basic requirements and principles that should guide the pedestrian space system in the historic city center, which include (connectivity, throughput capacity, functional richness, comfort and security). The main task of this research is to analyze the street structure, understanding its problems to develop a methodology that can be used to develop urban mobility in historical Syrian city centers without losing urban identity. The research employs cluster and spatial analysis to identify movement patterns and propose interventions that respect the delicate balance between preserving cultural heritage, and facilitating modern-day urban life.

2. Materials and Methods

2.1. Study Area

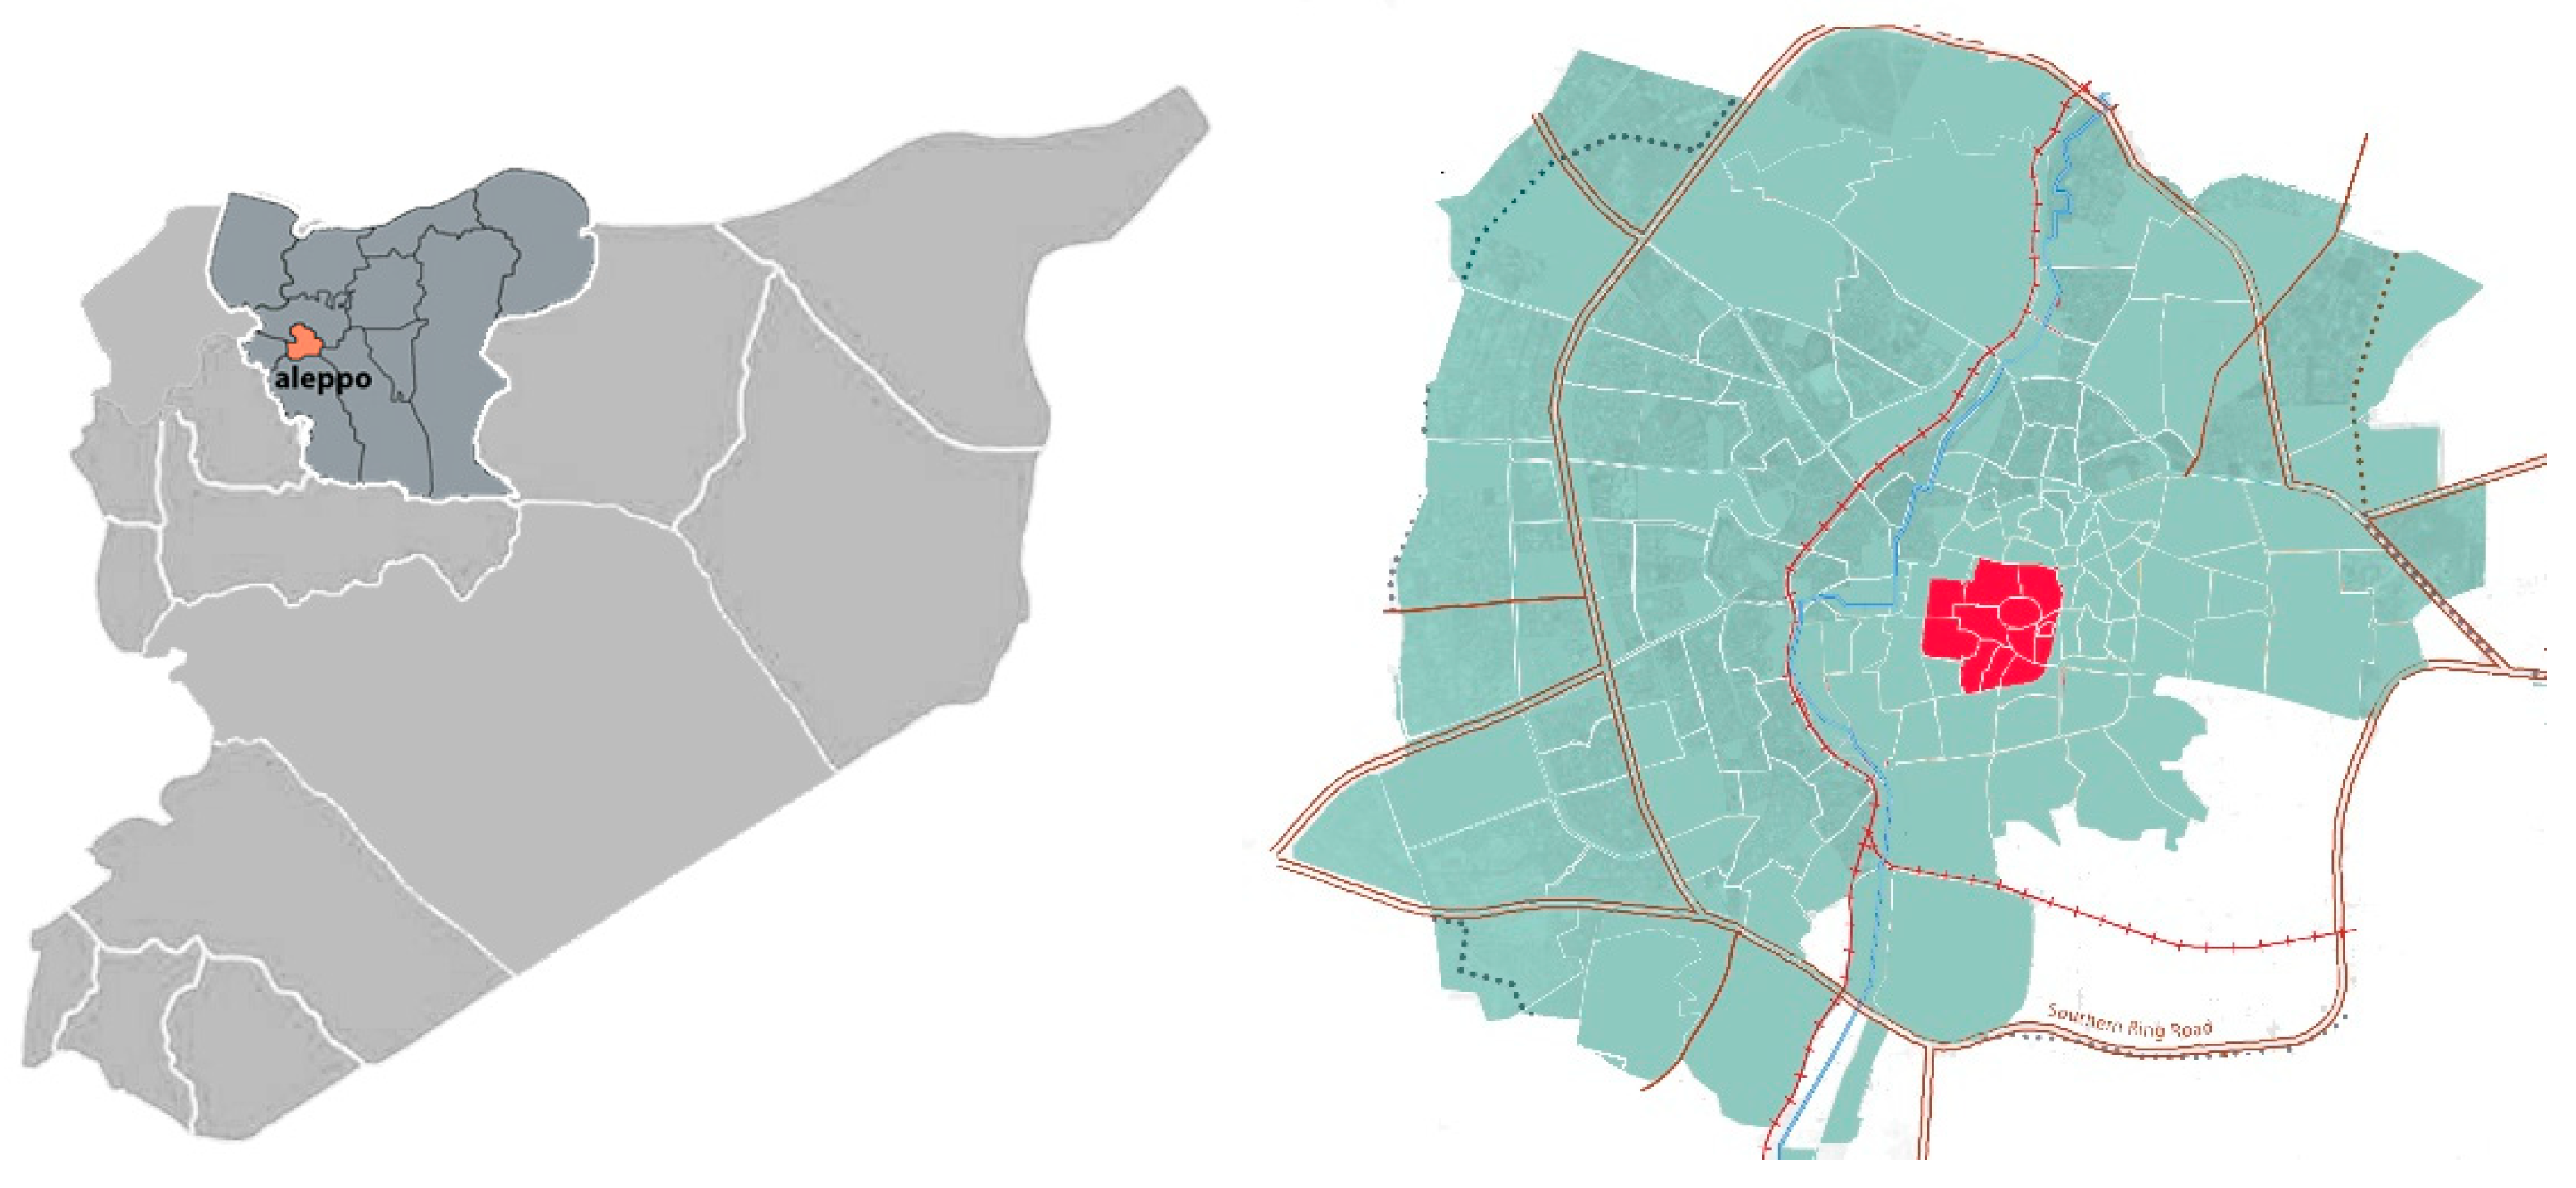
The city of Aleppo is located in northern Syria, it lies within about (50 km) south of the Syrian-Turkish border. between the Taurus mountains in the north and Homs desert in the south as shown the Figure 2. The city is located between the plains of the Euphrates valley in the east and the plains of Ghor al-Haddam in the west [26,27,28,29]. It occupies an area of 190 km2. The main characteristics of the city are listed in Table 2
Aleppo is one of the oldest inhabited cities in the world. It has been the center of many cultural influences, including those of the Assyrians, Persians, Greeks, Romans, Arabs, Mongols, Ottomans, and French. These different variations of influences have left their effects on the city, forming a unique urban fabric and a rich cultural heritage. Examples of complex Syrian heritage include Aleppo citadel, the Great Mosque, and various religious and educational schools, residences, khans, markets, and public baths [26,27,28,29].
These various cultures also had a significant impact on the transformation of planning structure of the city, which can be clarified as following:
Stages of Aleppo's growth:
Historically, the city of Aleppo grew in concentric rings, as the urban fabric developed around the citadel area in several stages.
The first stage: The basic core of the city, known as the Old City, which has a dense urban and residential fabric and includes residential neighborhoods and a group of traditional covered markets, which together constitute the most important and oldest commercial center of the city. [30,31,32,33]
The second phase: From the eighteenth century until independence in 1946, the city expanded beyond the old walls, and a planning system with a new structure emerged in addition to the new commercial center of the city.
The third phase: After the end of World War I, the city experienced a period of significant economic and population growth, necessitating the formation of the third and main ring from 1900 to 1994.
The fourth phase: began in the early 1980s, when the city began to expand north, west, and south in the form of post-modern residential districts projects.
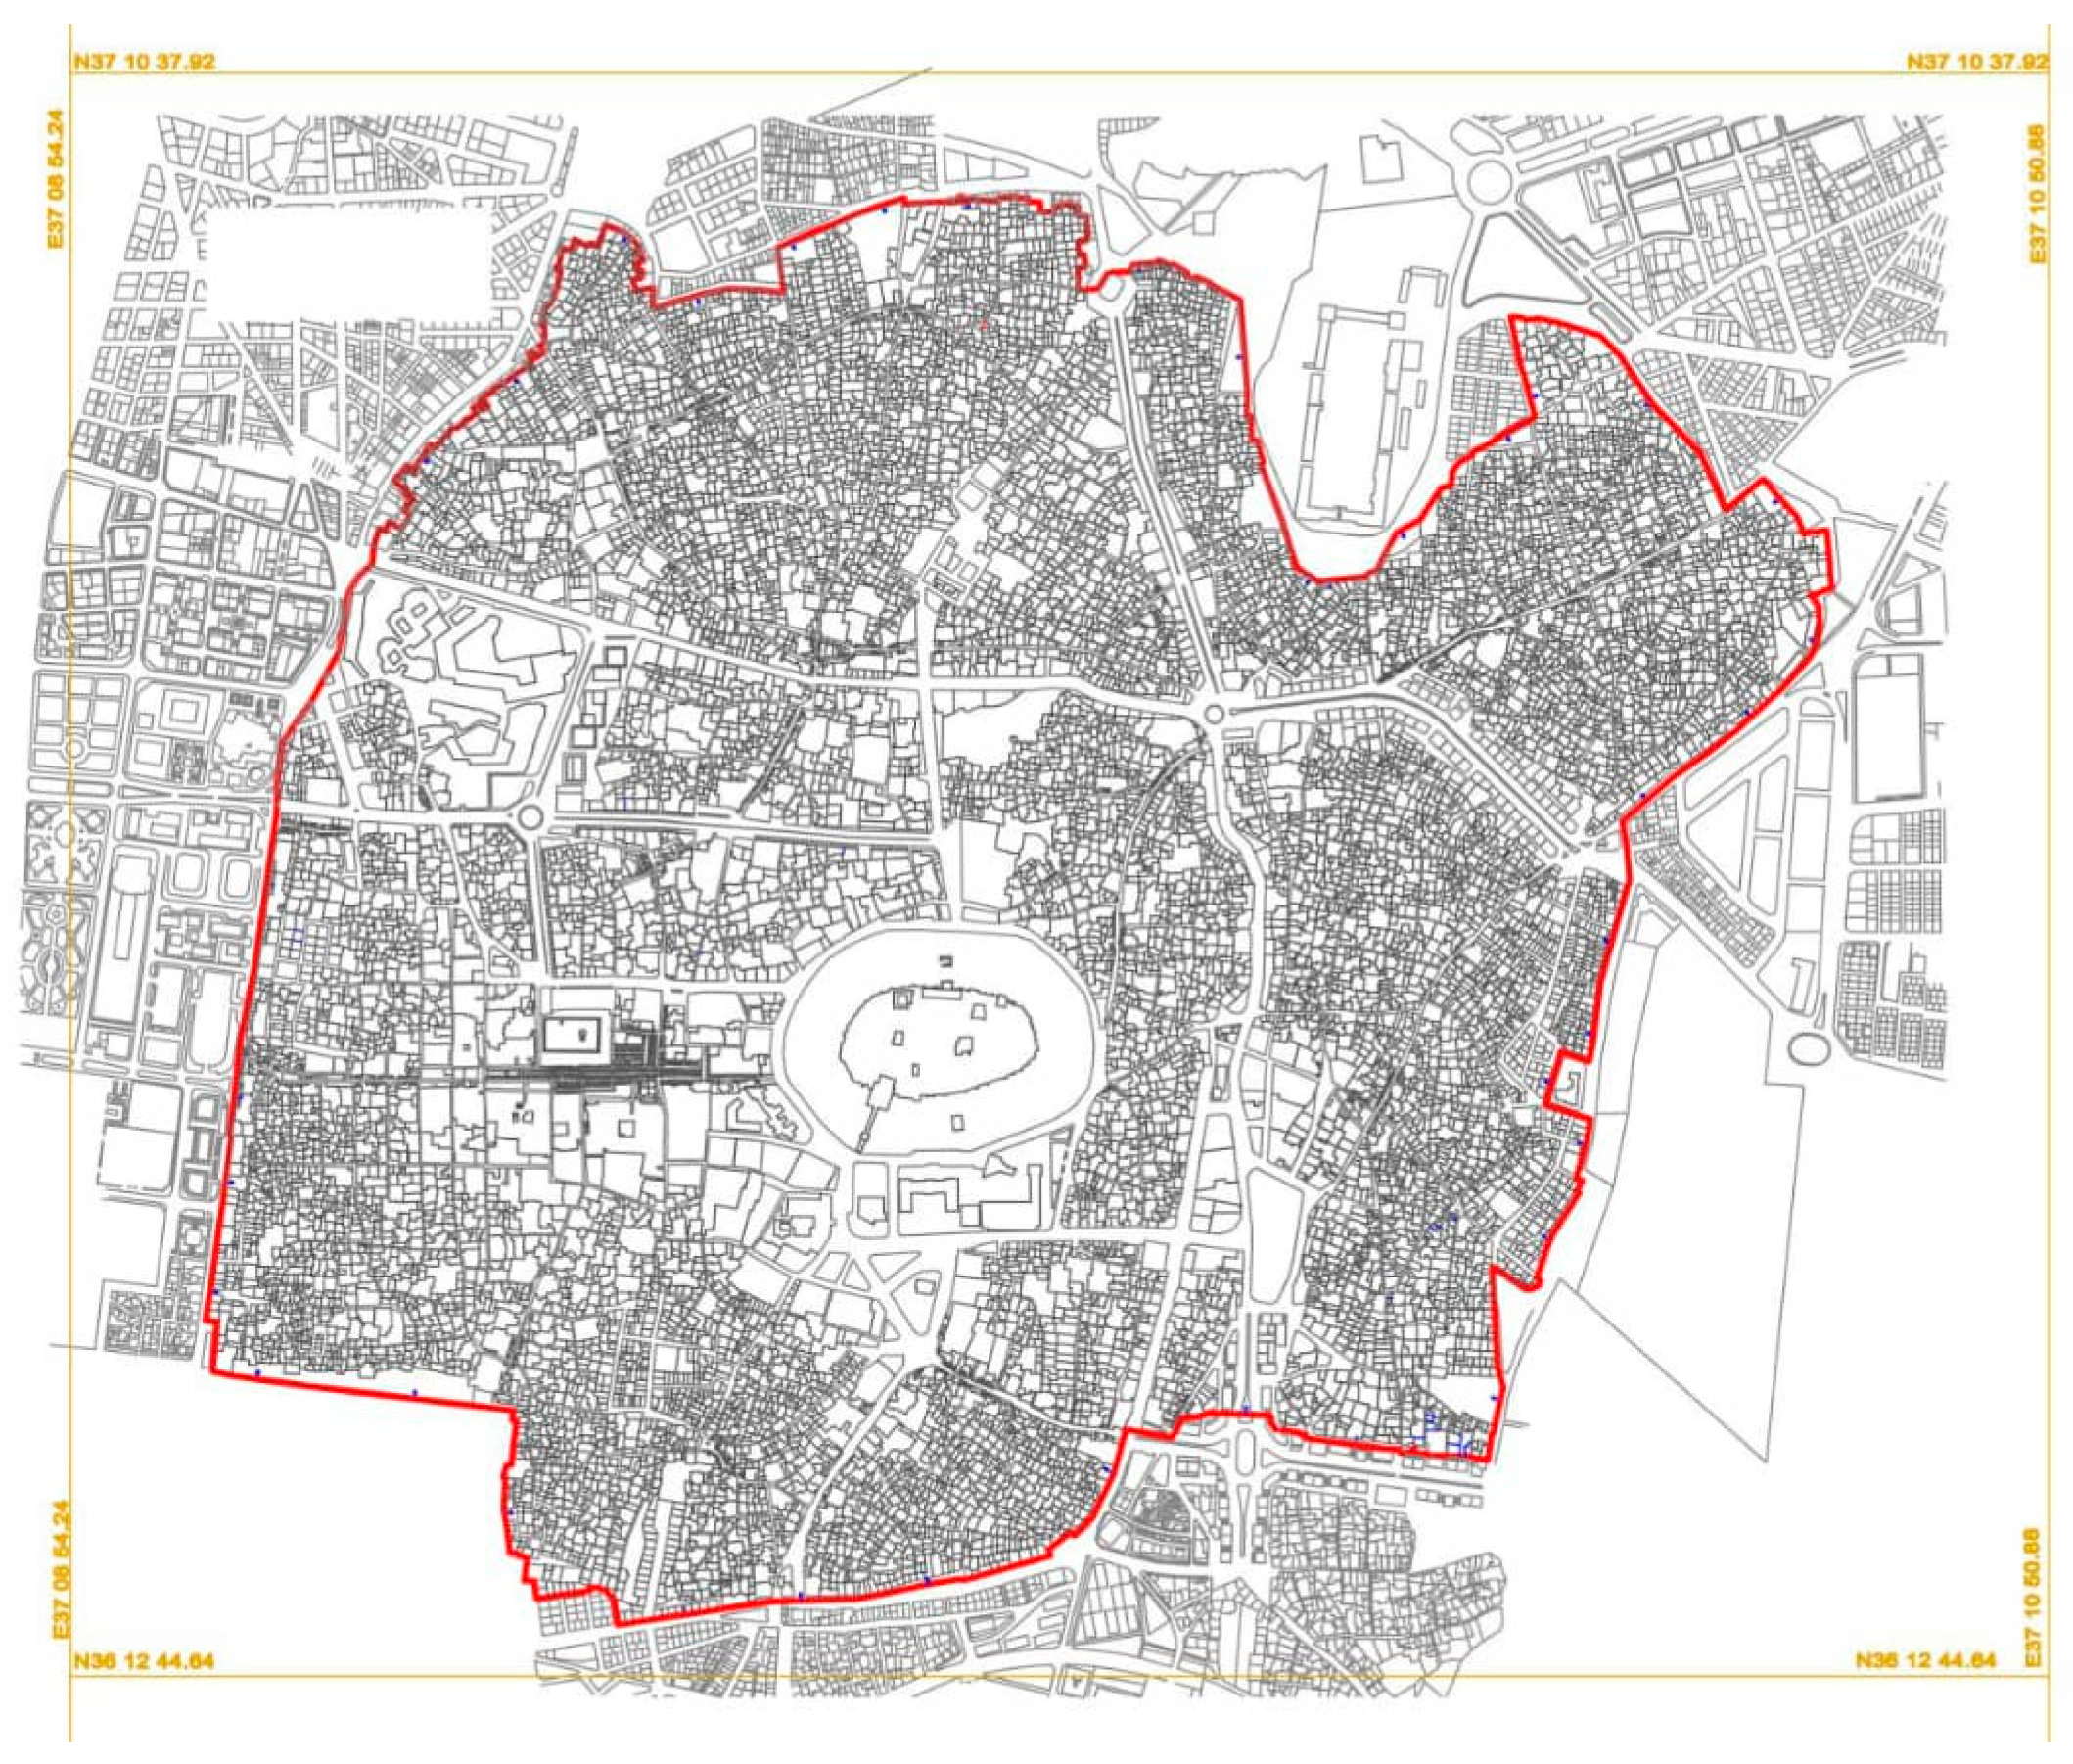
However, the first one of these projects was in 1988, followed by several plans, which was developed in cooperation with international planners (Yang, Dang, and Corton)[33], also the center of Aleppo was the main subject of these planning projects, which included preservation, modernization, demolition, reconstruction, and restoration of the city as shown in Figure 3 that presents Aleppo's historical center plan
The structure of the urban plan for the historical city of Aleppo includes a group of sections and components that define the structure and landmarks of the historic city [34,35]. This rich structure can be understood and classified based on five functions:
1. Fortresses and defense towers: The old city of Aleppo is known for a group of historical elements that include (high walls, historical gates, defensive towers, in addition to the Aleppo Citadel, which is included on the World Heritage List).
2. Covered and traditional markets: Aleppo’s historical markets are important commercial centers and tourist attractions for the urban fabric of the city because of their unique urban design, including the grand Bazaar, which is considered the main market.
3. Religious and ethnic heritage objects: Aleppo enjoys its heritage and cultural diversity; the juxtaposition of various religious buildings represents an important feature of the unique urban identity of historical Syrian cities.
4. Residential neighborhoods: The city’s residential neighborhoods with their distinctive architectural facades that give the city its special character, in addition to its narrow streets and alleys that form the historical fabric of the city.
5. Public squares and meeting places: Public squares and open areas are the main places for recreation, social and cultural activities, the most important of which are Saadallah Al-Jabri Square and Shuhada’ Square, which in turn are where various cultural activities, celebrations and recreational activities take place.
All of the previous components and features form the material and non-material heritage of the Aleppo city.

2.2. Methodological Approach

The study employs a comprehensive and multifaceted analysis to gain better vision and to analyze mobility in the historical centers of Syrian cities.
This analysis relies on a wide range of data sources, including Geographic Information System (GIS) data that provide detailed information about the spatial and physical characteristics of the transportation network, such as road classification and street dimensions. It also draws on local records of mobility, such as Syrian Central Bureau of Statistics and author’s notes and records [36,37,38,39].
The diverse sources enable the study to better understand mobility patterns in Syrian cities, including identifying areas that suffer from traffic congestion, and identifying fac-tors that affect pedestrian and vehicular movement. Furthermore, this study will contribute in the development of effective possible strategies to improve mobility and promote sustainable urban development in historic cities.
This developed method synthesizes cluster and spatial analysis to gain a deeper understanding of mobility patterns within the historic centers of Syrian cities. By understanding and applying this method street segment scenarios can be developed that aim to improve traffic flow, reduce congestion, and make historic areas safer and more comfortable for residents.
Additionally, cluster analysis is based on dividing streets into clusters based on several criteria, such as the detailed width and dimensions of each street. This allows more accurate demonstrations of the street design and dimensional-based solutions [40,41,42].
Also, spatial analysis is based on the analysis of spatial data and the distribution of activities within historic centers. This analysis can reveal areas, these areas that are more congested as a result of the concentration of attractions and services, which can help identify where it is important to focus while improving traffic flow and minimize heavy pressure on the streets.
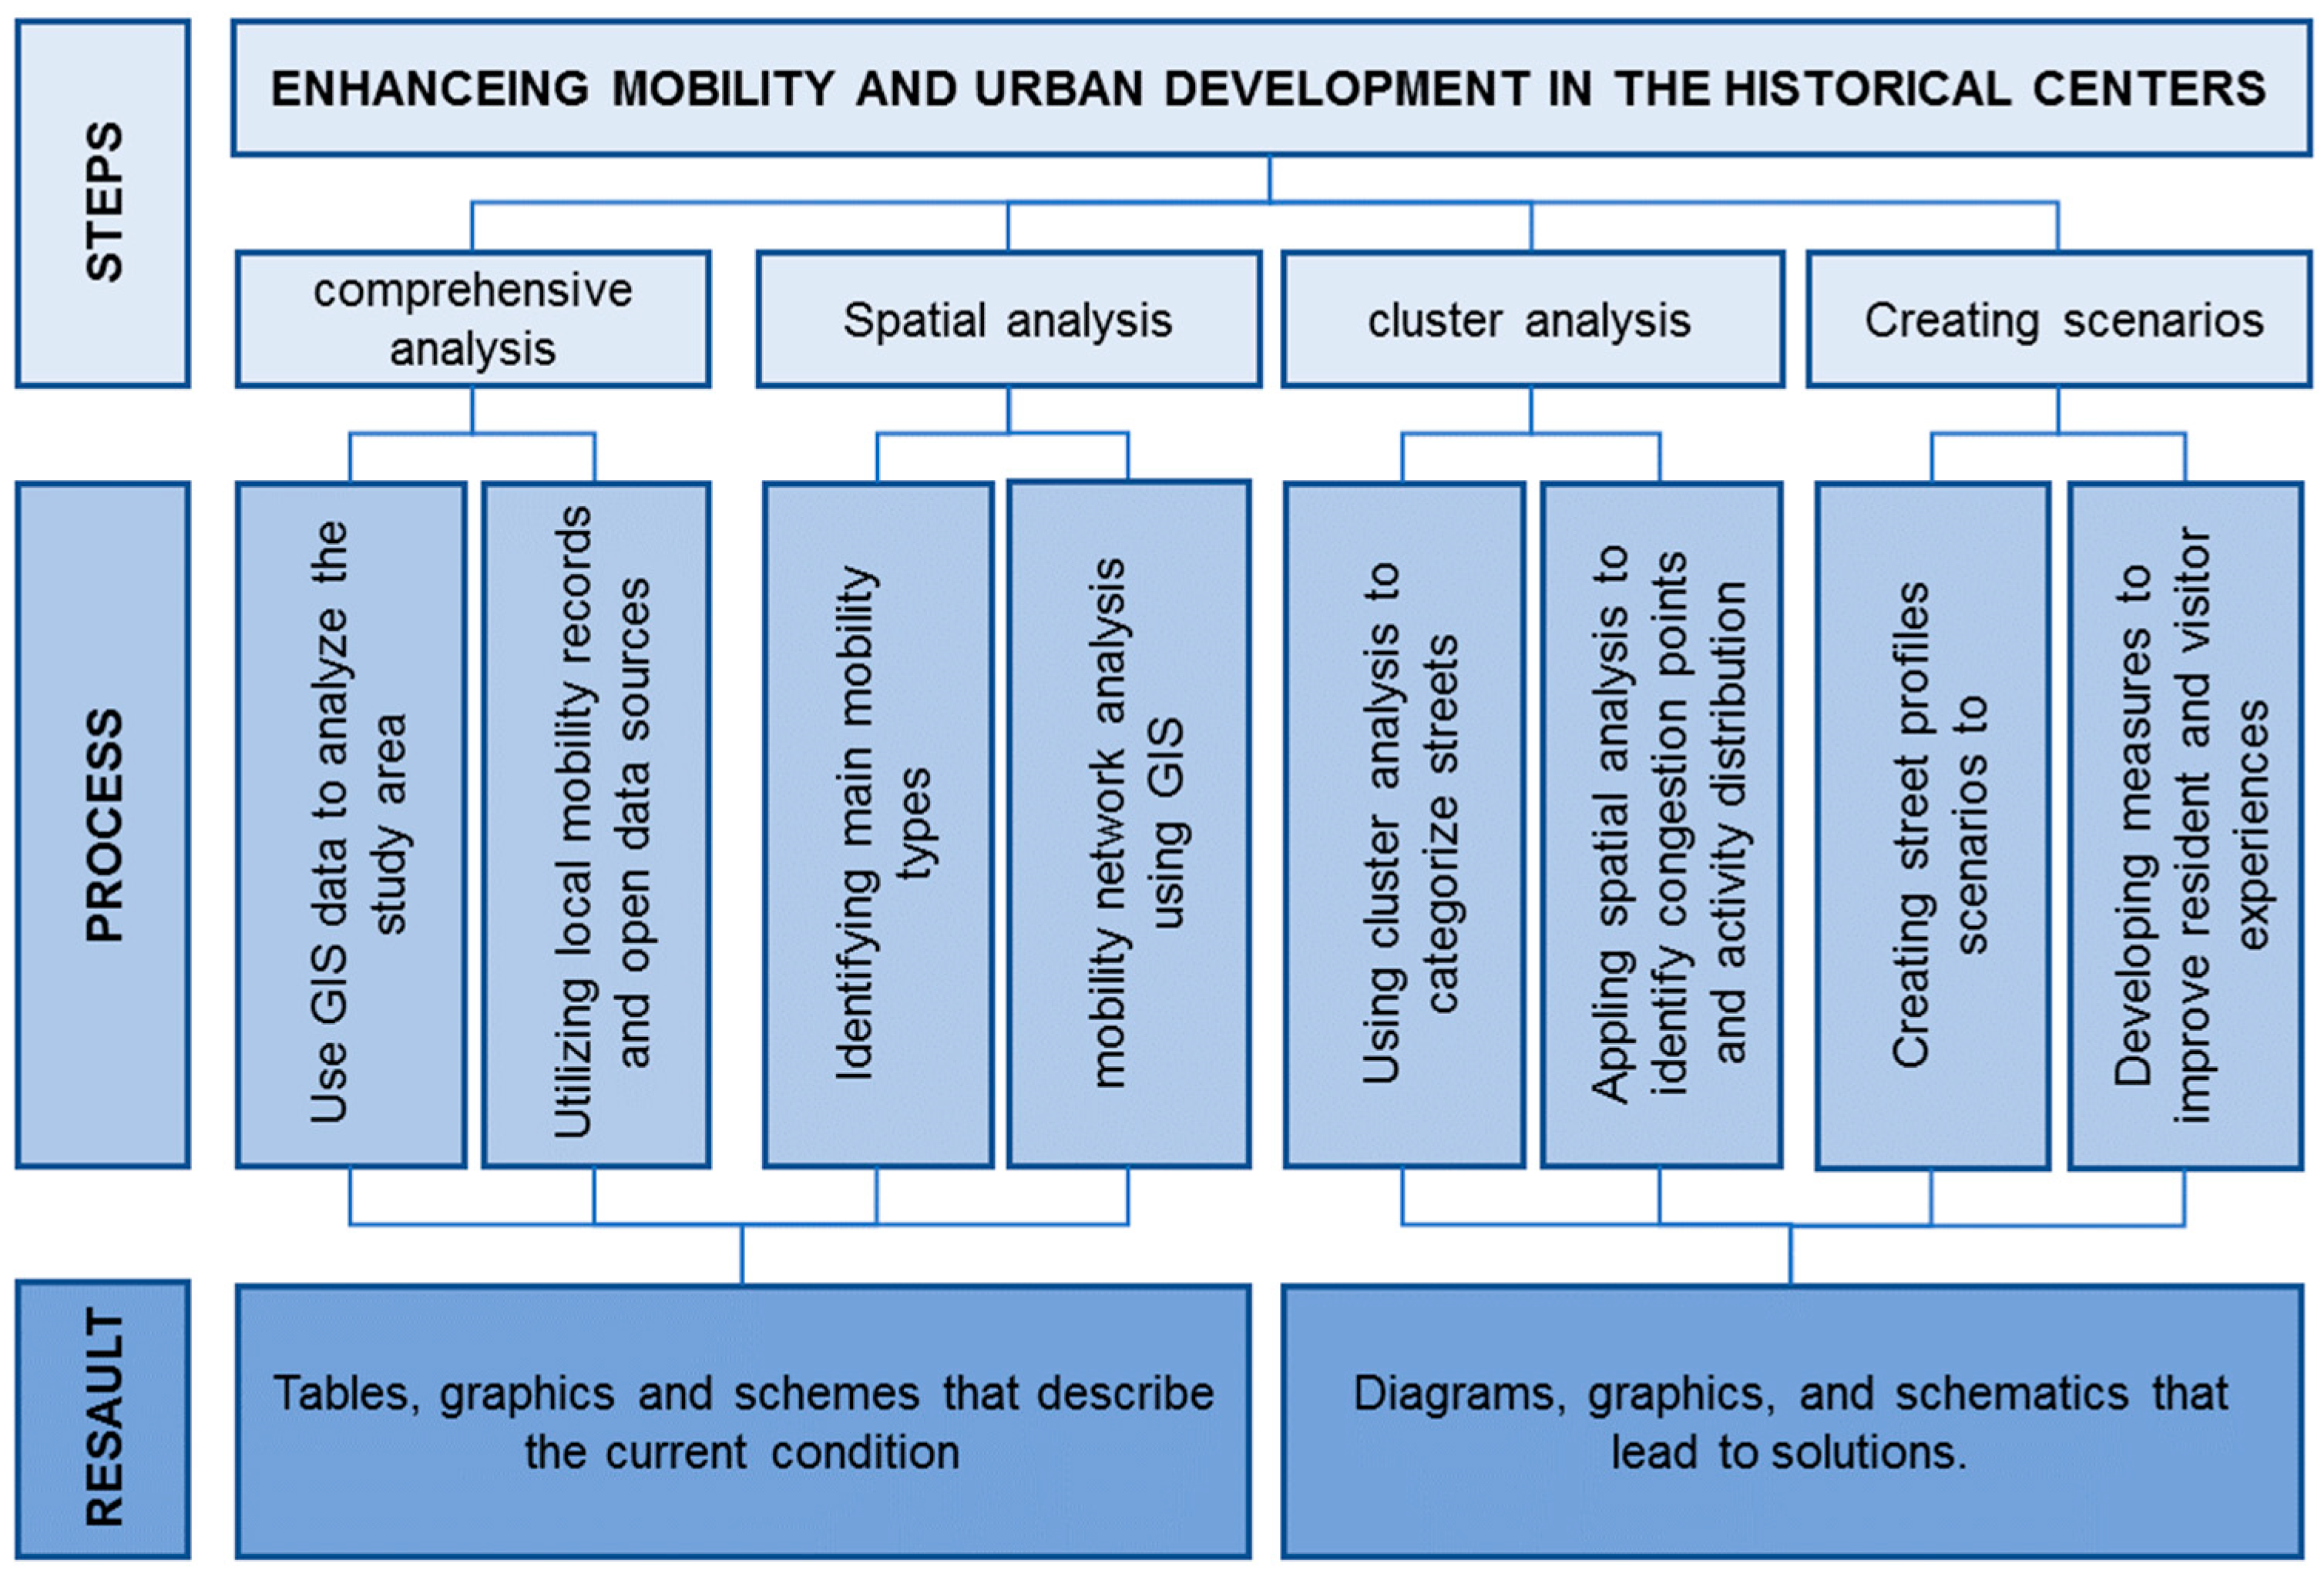
Using this method as shown in the Figure 4, the current research can form policies and measures aimed at enhancing mobility and improving the experience of residents and visitors in historic Syrian cities, thereby contributing to the preservation of the identity and cultural heritage of such valuable territories.

2.2.1. Spatial Analysis

This step focuses on a comprehensive examination of the urban movement patterns within Syrian cities, in our case with a particular focus on Aleppo. The analysis employs a Geographic Information System (GIS) to analyze the street network, which allows for a detailed classification of the street network, thus providing insight into the urban structure of the historical city center.
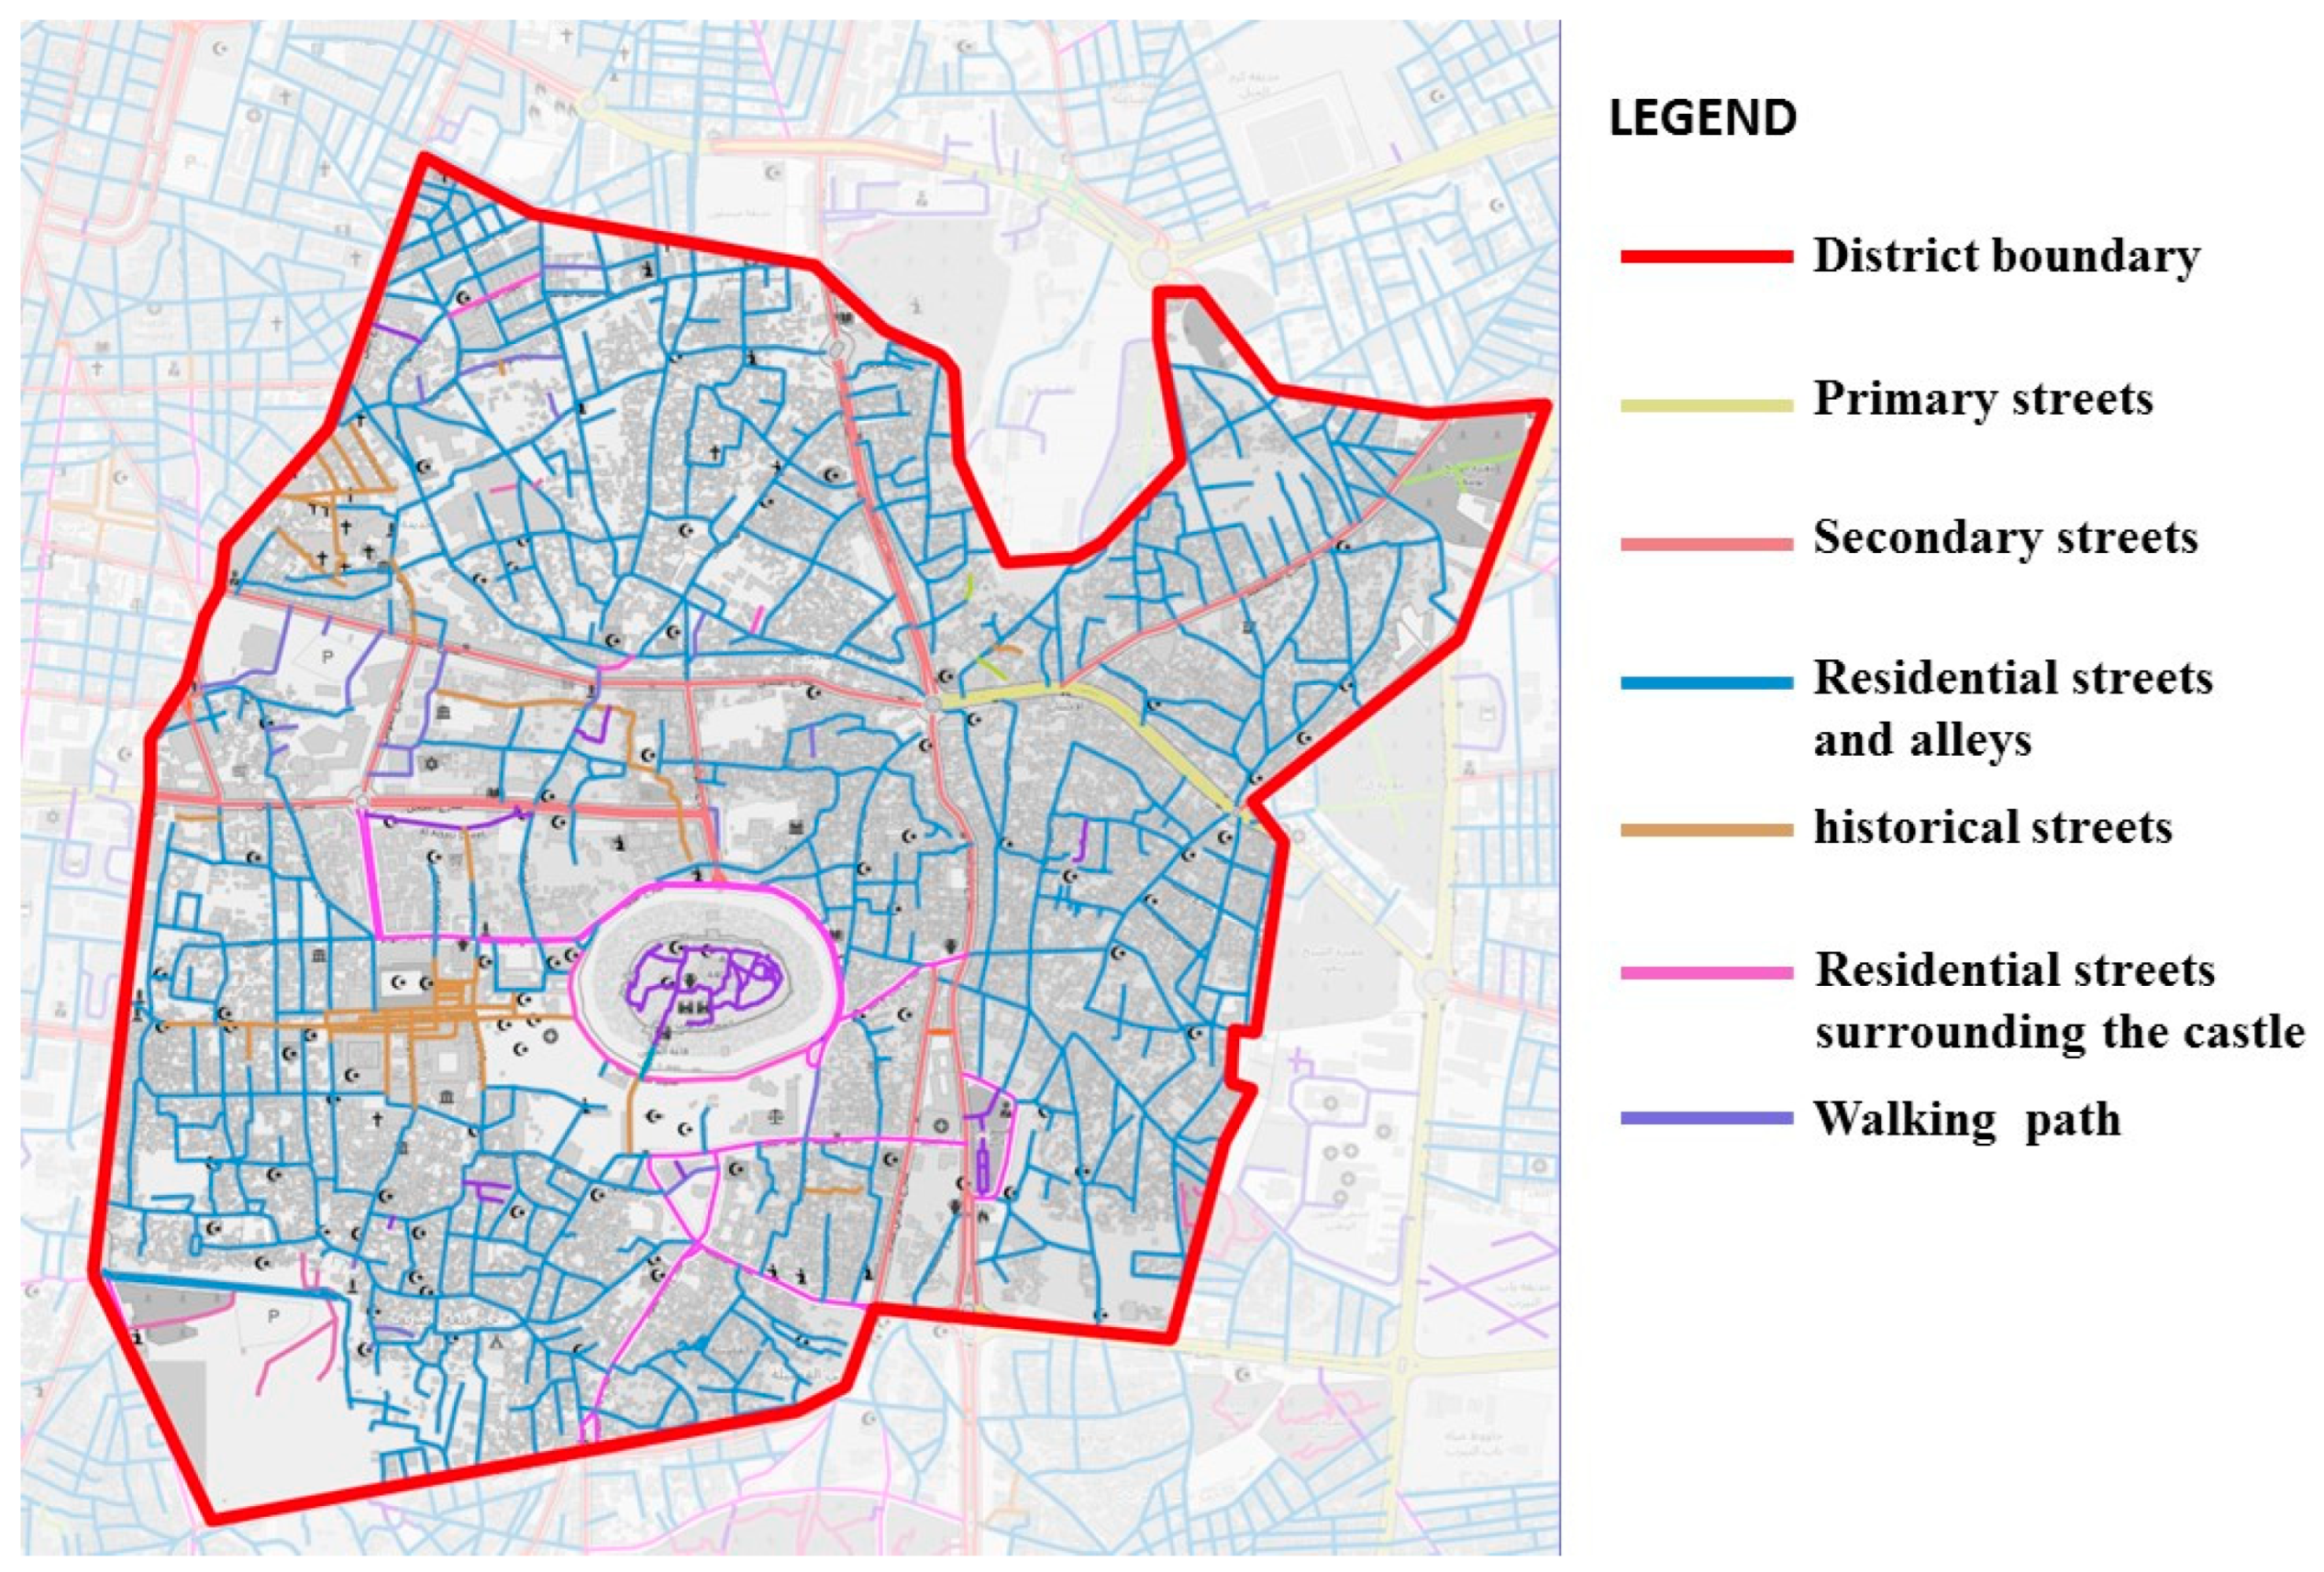
As shown in Figure 1, the streets of Aleppo's historical center can be classified into the following:
Primary streets: These are the principal streets that connect Aleppo to its historic core and have been designed to accommodate vehicular traffic.
Secondary streets: are defined as those that connect the primary arteries to the inner core of the city, these streets are narrower in width.
The area surrounding the castle (living streets): The streets surrounding the castle are characterized as residential, with a width of approximately 10 meters.
Pedestrian routes (historical street): These routes are found in areas of main markets and near religious objects of heritage.
Alleys: are narrow passages that wind through the city, often leading to dead ends. They are typically found in areas with a high concentration of residential buildings. These narrow passages, increases the feeling of privacy, while giving the pedestrian a higher understanding of place soul.
By determining these distinct street types, a better understanding of historical city’s transport structure is attained, providing better vision into the city's historical evolution and spatial organization, Figure 5 shows classification of previously mentioned streets.
In order to understand the analysis and its objectives and in order to reach results that are compatible with the current challenges, it is necessary to identify the different types of mobility used in the historical city of Aleppo, and to describe their operational characteristics.
For example, we have found that private cars are used primarily for individual mobility, where they dominate, and it also interacts with public mobility, as can be noted that the private cars and public transportation shares the same paths on the streets, which can lead to mobility problems, and despite the convenience and environmental protection provided by shared public mobility such as buses, as a service, they are considered weak and few in number in the city historical city of Aleppo, which also notable in other historical Syrian cities.
When considering the population number, it is important to note the importance of taxis as public mobility in the city, and on a more detailed level, individual movements and pedestrian paths are also considered essential components of the transportation network, especially in the historical center, that’s why the research is presented, for the purpose of developing and enhancing the pedestrian mobility network.
In order to get a better and deeper understanding, it is necessary to explore and describe the mutual relation between the various types of mobility and related aspects. This includes examining the operational capabilities, speeds, and spread of various means of transportation.
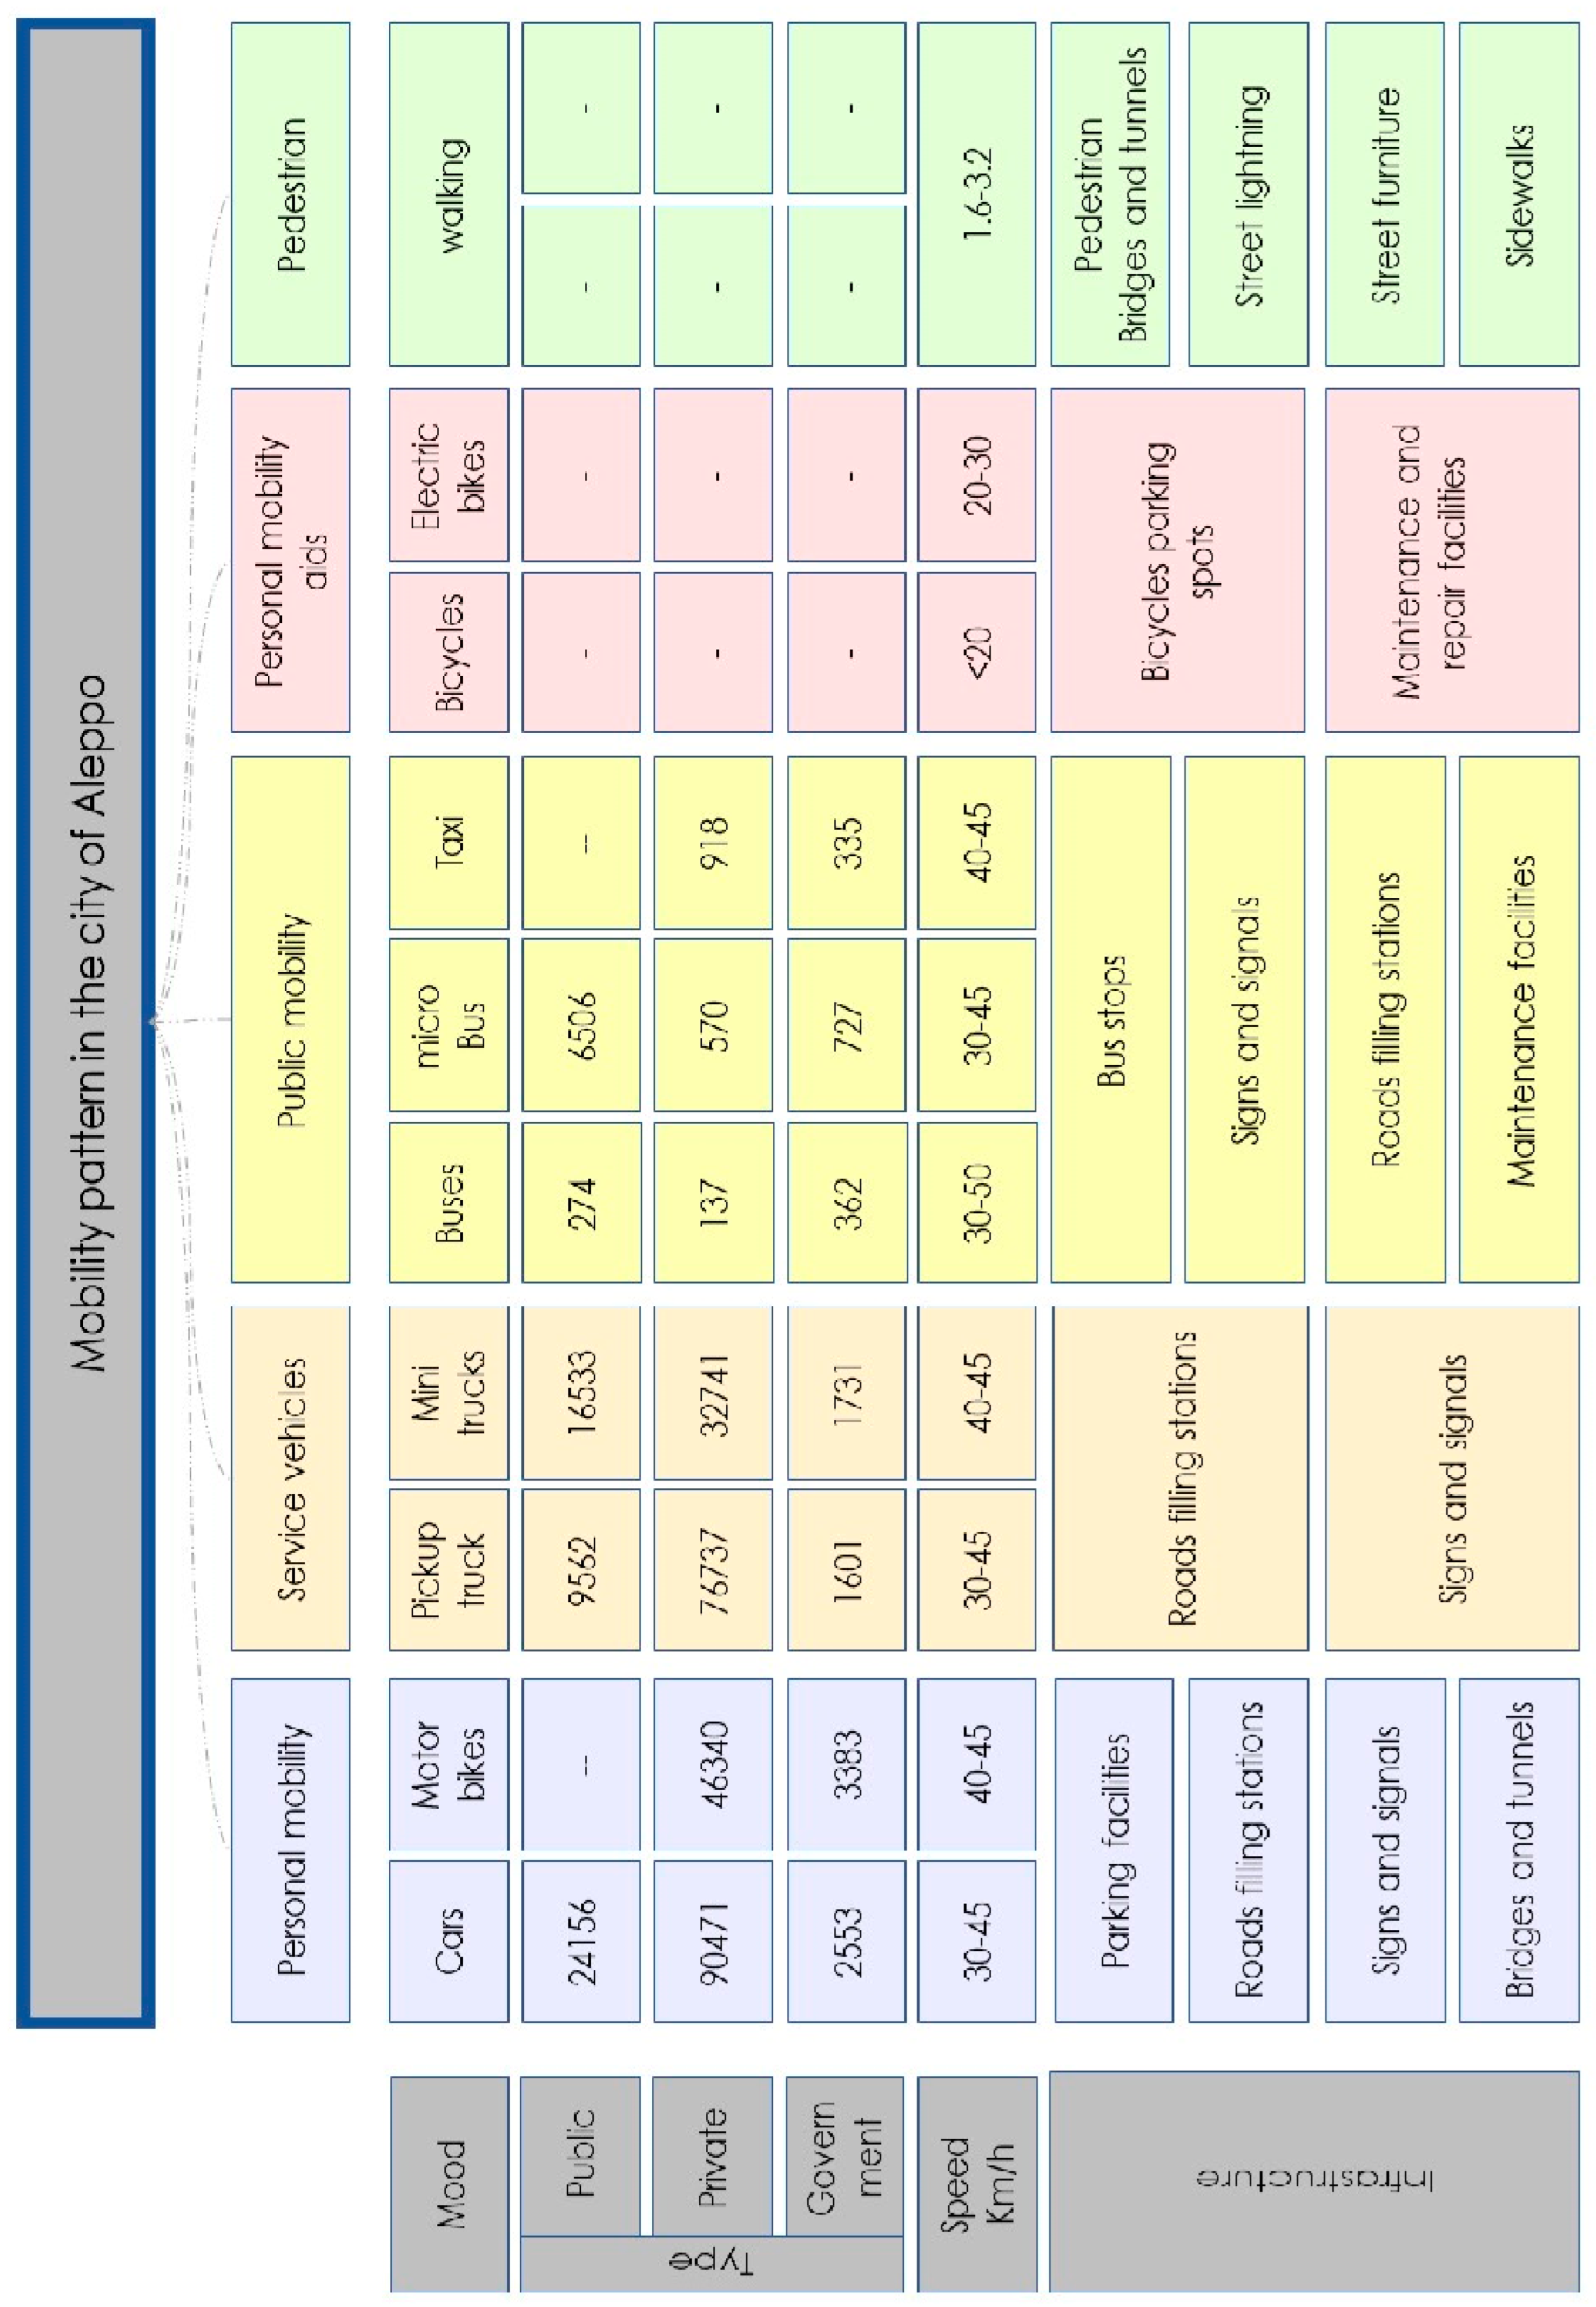
By examining the transportation network in the historical center, using open data sources provided by the Syrian central bureau of statistics, it was found that there are five main types of mobility (personal mobility, public mobility, service vehicles, personal mobility aids, and pedestrians).
Figure 6 below shows that each of the five types of transportation mentioned above has been classified into three types of registration within the country (public, private and governmental), in addition to specifying the number of registered means of transportation and the speeds allowed for each type.
Which enabled us to identify changes in the number of registered vehicles and permitted speeds within the country, and in the light of this, we can work on recommendations to enhance safety through different proposals that help determine the speeds and number of cars allowed for each territory in the city according to the types of events it contains.

2.2.2. Cluster and Spatial Analysis

Cluster analysis is one of the most powerful statistical techniques performed for the purpose of grouping a set of objects into a class of similar objects. In this case, objects in the same cluster would share a lot more similarities with each other than objects from any other cluster.
More specifically; the algorithm creates clusters, that can be formed based on a data set according to the similarities between data points, without the use of any background information on group membership [43].
The purpose of cluster analysis is mainly to group data in a way that reveals basic patterns or structures for convenient exploration and recognition of patterns from the data. Therefore, the process of clustering, helps to provide insight into the basic structure of the dataset, something that would be useful in a whole host of activities, from data segmentation to classification [44].
In this research, cluster analysis involves the K-means method, one of the clustering methods. It partitions the data set into K-dimension groups based on similarities in items.
This is an algorithm, which in the first place first starts with the random initialization of basic centroids for K clusters; after taking this step, each data point will then follow the nearest centroid.
The iterative re-calculation of centroids, which is based on the average data points assigned to the groups, proceeds to the next step; at each turn, the data points are reset to their nearest centroid.
This process goes on iteratively till the centroids trying to change in a basic way and reach a stable final solution [45].
In general, and in simple words. K-means clustering is the process of minimizing the sum of squared even distances between given data points and their cluster centroids with the goal to get a well-separated and designed, clusters.
The general process of cluster analysis with k-means can be described as the following:
1. Data Selection and Normalization:
While working with the dataset, it is important to keep in mind that usually, the variables of a matrix are measured in different units and often have very different scales. Therefore, it is very necessary to give each variable an equal chance to influence the clustering result. The purpose behind this process is that the scale of these variables should be changed, to make each of their contribution equal.
Min-Max Scaling: It is a normalization technique that transforms all variables into a common scale, which will lead to maintain all the differences in the ranges of these values. This will be quite useful in some particular cases when there is a need to keep the relative relationships existing between the original main values.
The process involves rescaling the range of the values, so that all the ranges would lie in the interval [0, 1], and the formula for Min-Max scaling is as follows in formula (1):
X n o r m = x x m i n x m a x x m i n ,
Where:
X is the initial value;
X min - minimum value of the parameter;
X max - maximum value of the parameter.
2. The determination of the number of clusters:
The optimal number of clusters is determined by the following standards: Selecting the optimal number of clusters is a primary stage in cluster analysis, because it mainly affects the results that can be reached from the data, so the elbow method is a commonly used to ensure the optimal number of clusters in the k-means cluster method
The Elbow Method
The Elbow Method requires performing the k-means clustering algorithm on the dataset for a range of cluster numbers (usually from 1 to 10) and calculating the weighted sum of squares within the cluster (WCSS) for each, also the sum of squares within a cluster is a measure of the total variation within the clusters, and as the number of groups increases, the WCSS tends to decrease. This is can be explained by knowing that each cluster will have fewer component models, and the models will be closer to their own centers [46].
The following formula (2) can give use the number of clusters
W C S S k = i = 1 n j = 1 k   d ( x i   , c j )   2 ,
Where:
- WCSS(k): intra-cluster sum of squares for a given number of clusters k.
- n: the total number of data points.
- k: the number of clusters.
- xi: represents the i-th data point.
- cj: is the centroid of the j-th cluster.
- d(xi,cj) :distance between data point xi and centroid cj.
The plot of the WCSS against the number of clusters allows to get the visual inspection of a curve representing the “elbow” in the data. This curve can then be used to select the number of clusters that best represents the data set. This method is straightforward and readily applicable, demonstrating it a prevalent approach for determining the optimal number of clusters in k-means clustering.
3. Application of the K-Means algorithm:
The algorithm employs a straightforward and expedient iterative methodology to partition the dataset.
The following is a step-by-step process:
The initialization of centroids is as follows: The algorithm initiates the process by selecting a set of 'k' points from the dataset as the centroids of the clusters. The selection of these centroids may be random or based on a specific strategy designed to enhance the quality of the clusters.
The next step is the assignment of data points. Subsequently, each data point in the dataset is assigned to the nearest centroid. The Euclidean distance between the data point and the centroid is typically employed to determine the "nearest" point.
The centroids are updated as follows: when all data points have been assigned to clusters, the centroids are recalculated. This is accomplished by calculating the mean of all data points within each cluster [44,45,46].
Iteration: Steps 2 and 3 are repeated iteratively until the centroids will no longer shows significant variation, indicating that the clusters are as consistent as possible.
The K-Means algorithm is designed to minimize the total sum of squared distances between the data points and their respective cluster centroids. The formula (3) is for calculating this, known as the objective function of K-Means, is as follows:
c j = 1 | s j | x i ϵ s i   x i c j ,  
Where :
xi: represents the i-th data point.
Sj :represents the set of data points assigned to the cluster
j and cj : is the centroid of cluster j.

3. Results

3.1. Application of the k-Means Analysis Method

As stated in the study, cluster analysis was employed as the methodological foundation of the study. The historical center of Aleppo city was chosen as a case study to illustrate this methodology, comprising several stages.
The preliminary stage of cluster analysis entails the collection of requisite data as shown in the Table 3.
In the Elbow method we define that the number of clusters (K) is valued from 1 to 10, and for each value of (K) the intra-cluster sum of squares (WCSS) is calculated, while the WCSS is defined as the sum of the squared distances between each data point and the centroid of the cluster. Upon illustrating the WCSS with a given K value, the resulting curve appears to give an elbow shape, and the number of clusters increases, the WCSS value will begin to decrease.
The WCSS formula was applied with the assumption of ten clusters (K = 1, 2, ..., 10), resulting in the following values and outcomes.
It is important to recognize that examining the WCSS value at K = 1 is considered as a required step for identifying the optimal number of clusters in a given dataset. However, in order to know and define the ideal number of clusters, it is important to do further examining of the WCSS values at deferent values of K, also upon a more detailed analysis of the graphic that describe the connection between K and WCSS, a shown pattern becomes clear.
At first, as (K) value increases, the WCSS value tends to decrease gradually, in order to reflect the enhancement in clustering quality as the algorithm assigns data points to an expanding number of clusters, that way reducing the within-cluster variability.
However, at specific point, the rate of WCSS starts to drop, as visually showed by the "elbow" in the graphic, as this marks the transition from a significant enhancement in clustering quality to a slight increase, and by following this inflection point, the decline in WCSS becomes less pronounced, and the curve begins to flatten out. Eventually, it stabilizes and became almost parallel to the X-axis, as illustrated in Figure 7.
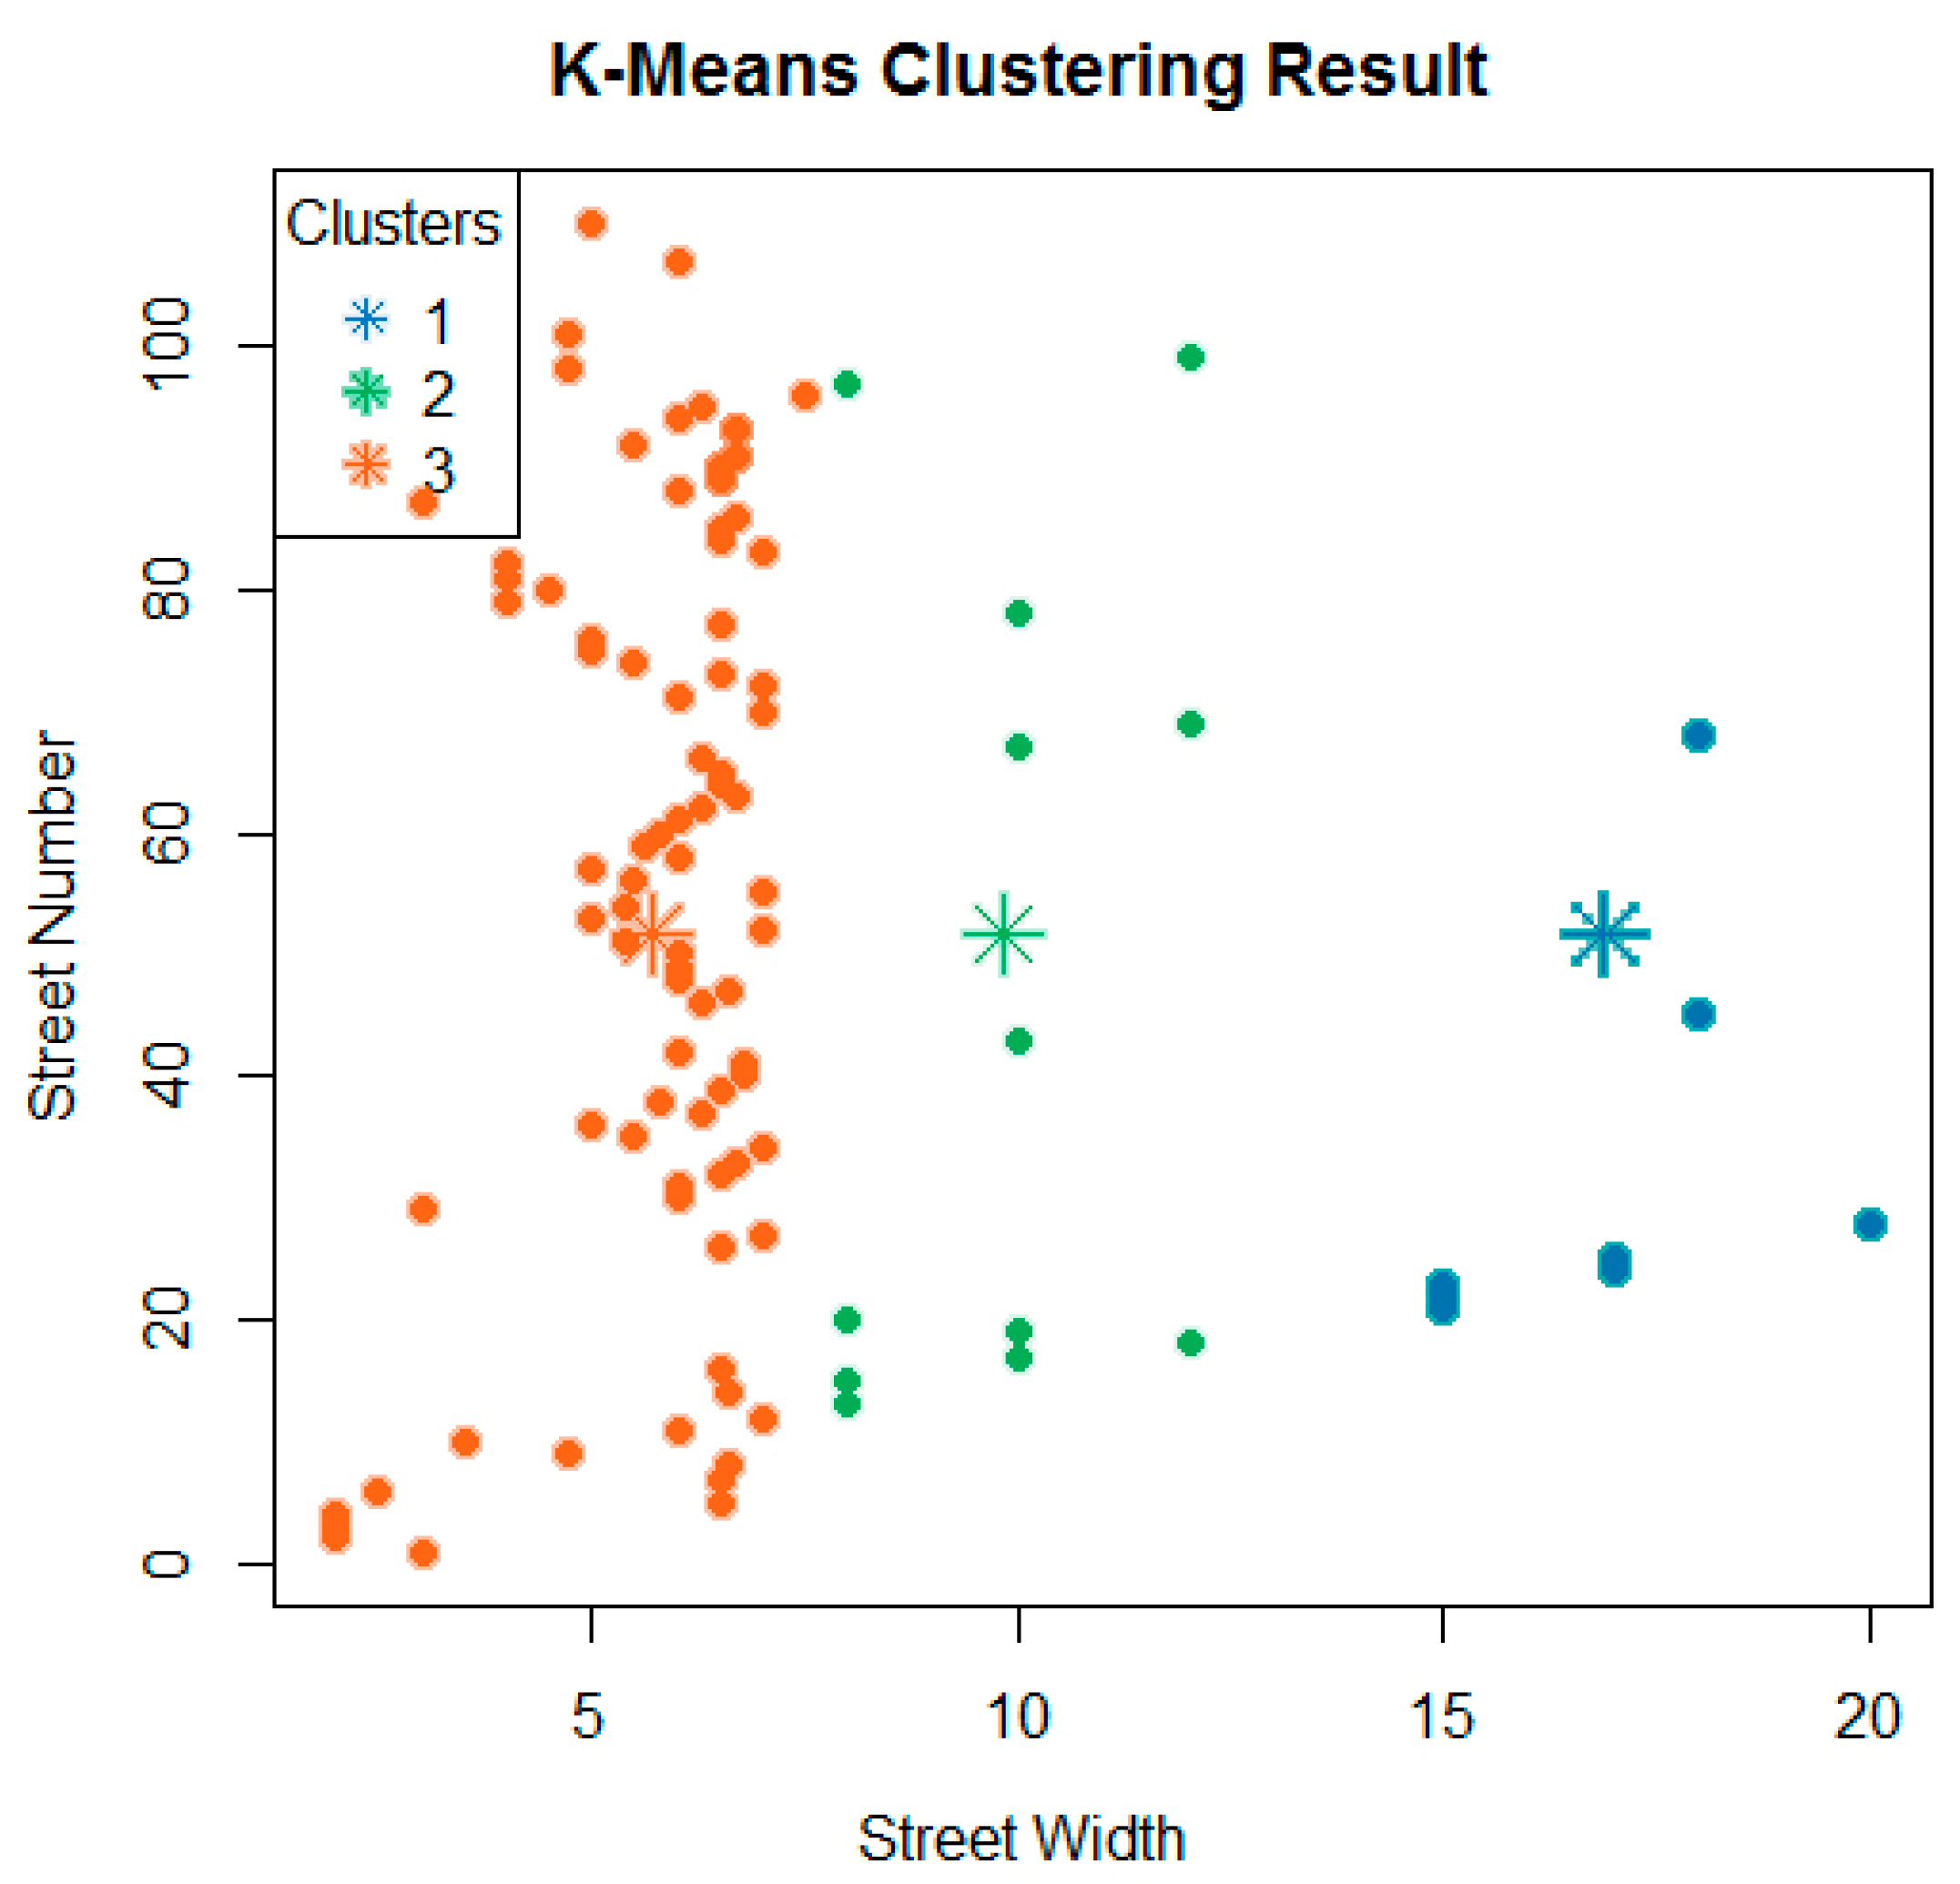
Upon examination of the graphical curve depicted in Figure 7, it was determined that the optimal value for the number of clusters is K = 3. Consequently, utilizing the mentioned equation and calculating the centroids of the clusters, it can be concluded that there are three clusters.
The k-means cluster formula can be applied to the given data points in order to group them into three clusters.
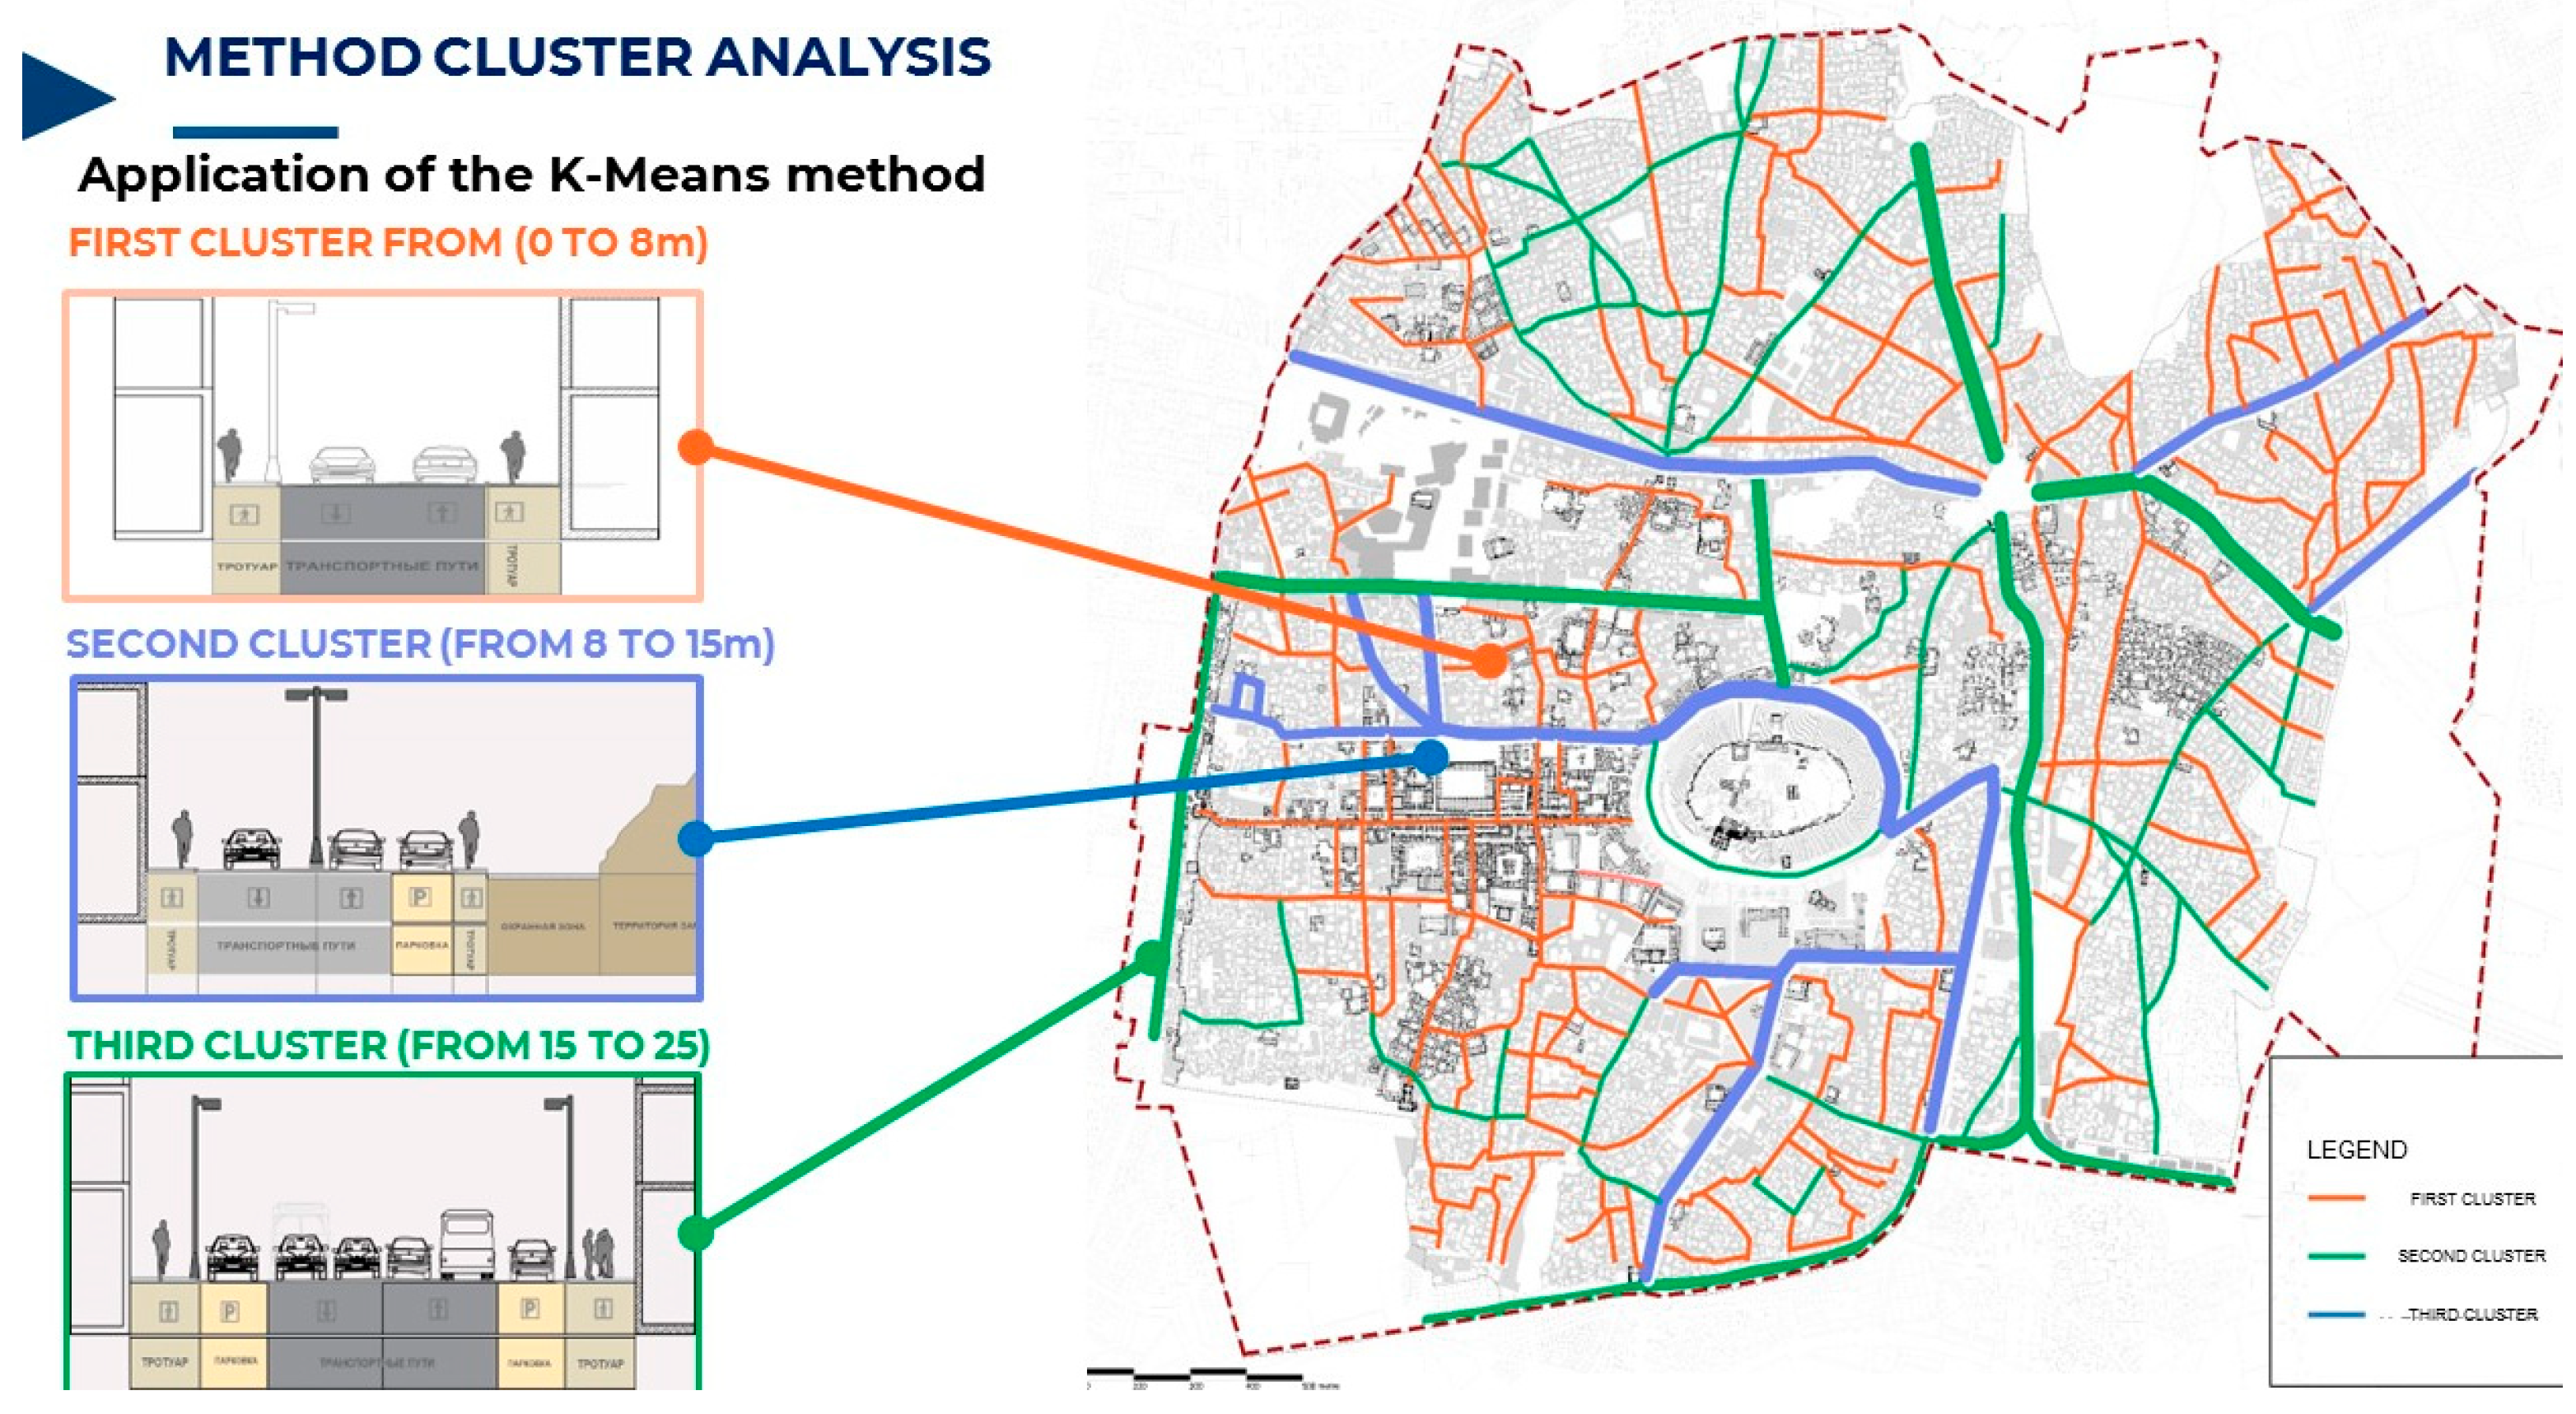
Furthermore, the utilization of MATLAB through coding made it possible to create a graphic that represented the used data into clusters based on the width of the streets, as illustrated in Figure 8. The first cluster include street widths with the range from (0 to 8)m, the second from (8 to 15)m, and the third from (15 to 25)m.
Once the cluster analysis has been completed and the results of the street classification into three clusters have been obtained, it becomes possible to represent the results in the form of a scheme, witch is an organized representation that provides a clear visualization of the street classifications and their characteristics, and it also It can be created using a geographic information system (GIS).
The schema in the Figure 9. serves as a structured representation that provides a clear and visualization of the street classifications and their respective attributes.

3.2. Creating Scenarios

Based on the comprehensive and multi-faceted analysis presented previously, a methodology was developed that includes network and transportation elements, along with a cluster analysis that classified the streets of the old City based on their width, also with the help this approach, we were able to achieve the aim of the study, which included proposing and identifying optimal scenarios for designing Street profile sections that take into account the uniqueness and identity of the historical center of Aleppo.
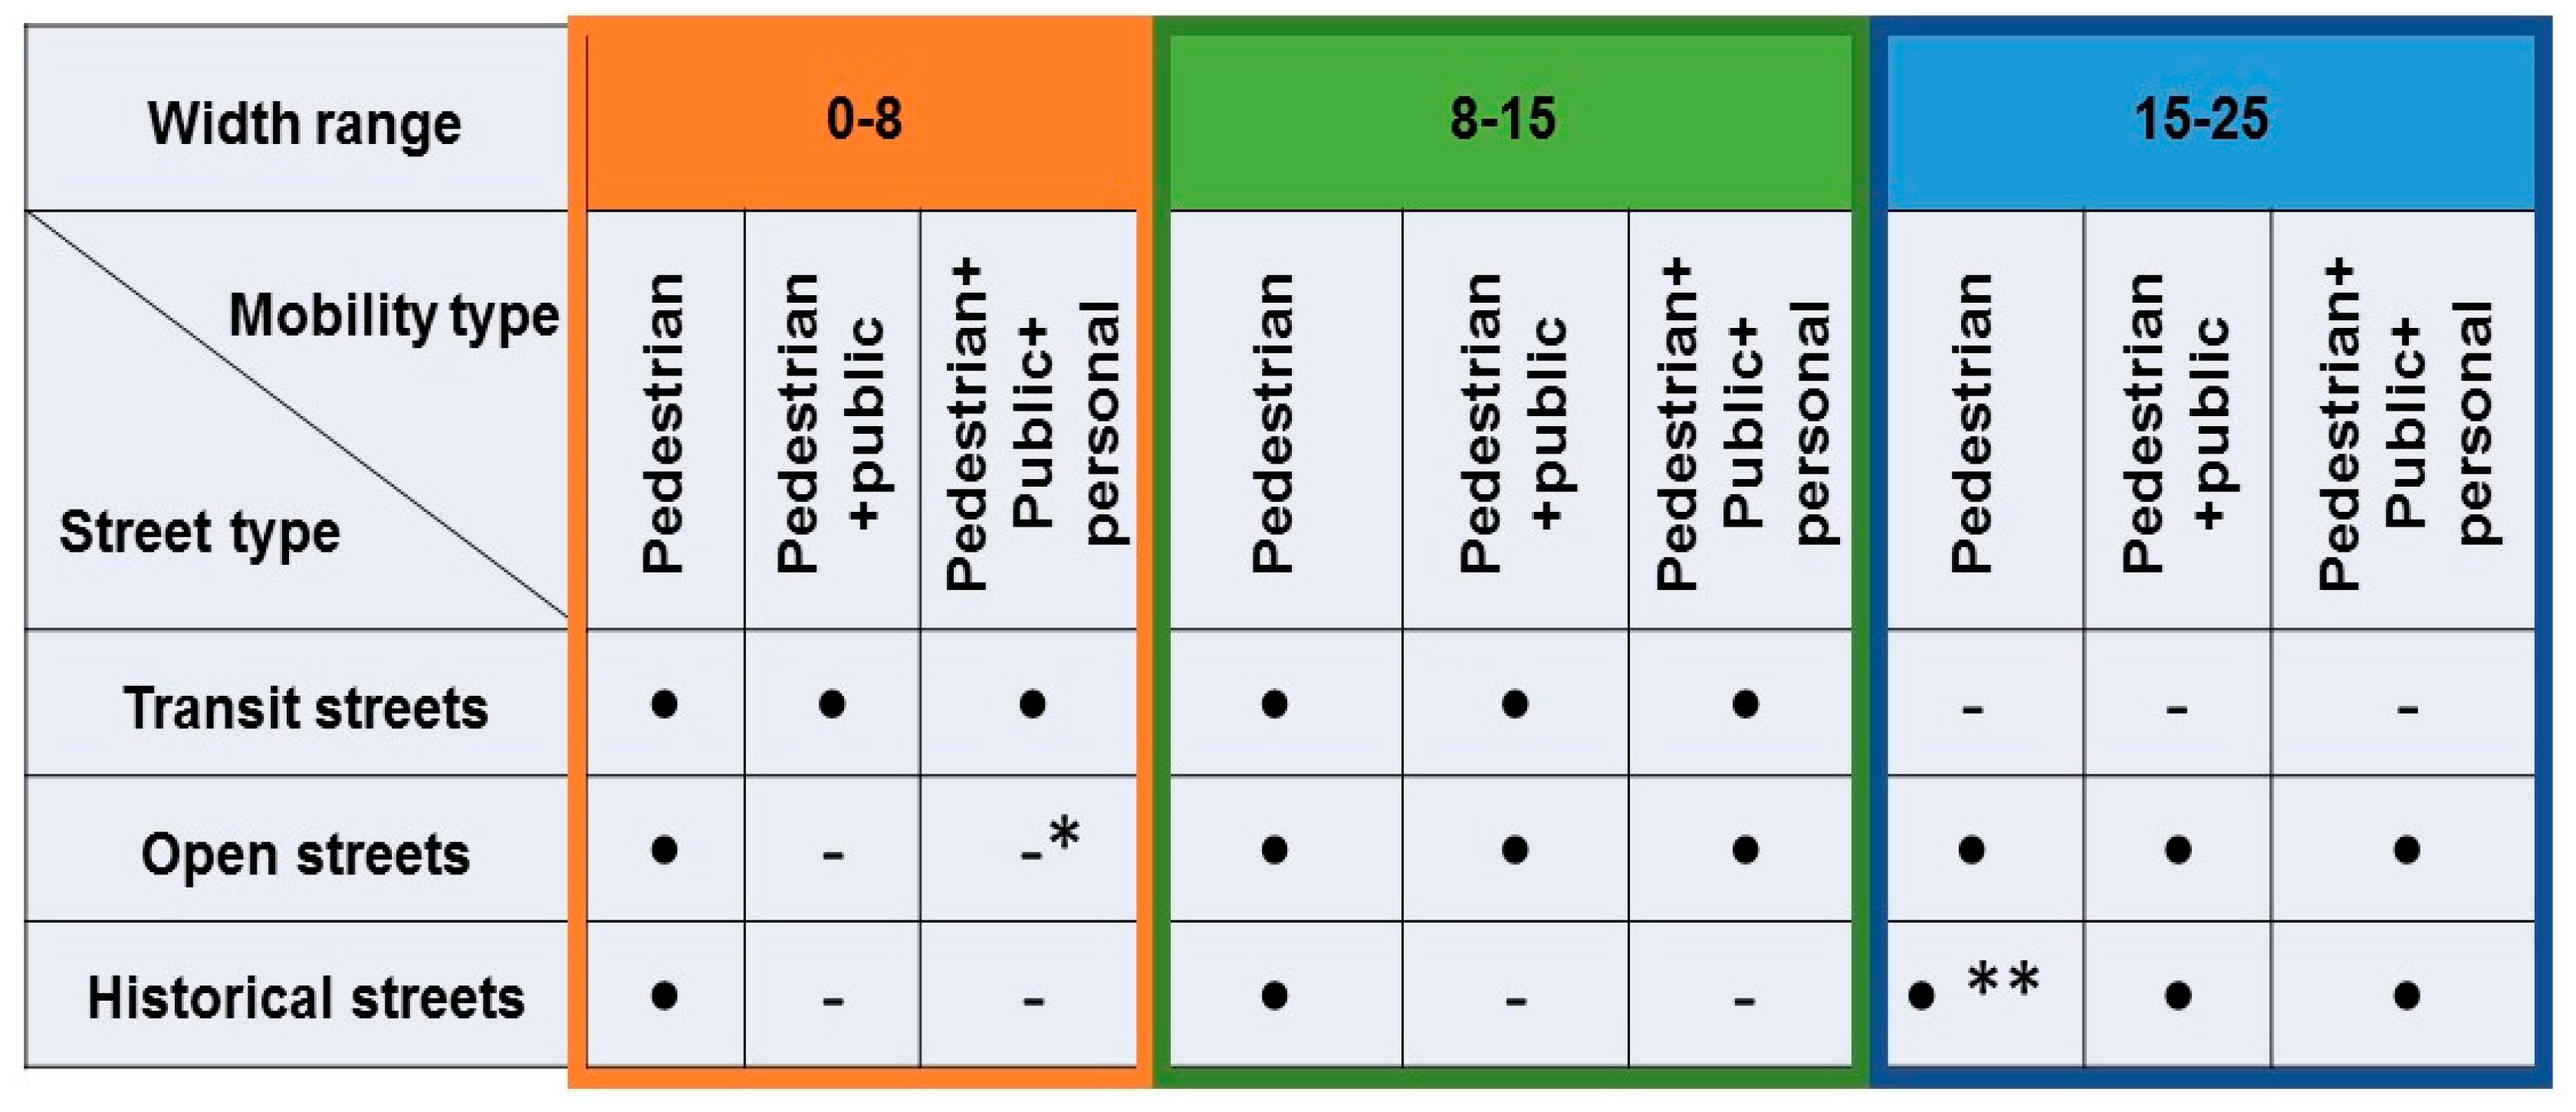
The designed matrix is considered a classification system for streets within the historical centers of Syrian cities, which helps in decision-making processes to improve mobility and infrastructure while preserving cultural heritage.
Streets are classified according to three main principles: width, type of movement, and street type as follows:
Width Range:
The dimensions of a street are main factor to evaluate its capacity to accommodate various types of mobility.
-Streets with a width of less than eight meters are often found in historic centers and are basically used by pedestrians.
-Streets with a width range from 8 to 15 meters, these streets are designed to accommodate pedestrians, bicycles, and possibly small vehicles for residential access.
-A street with a width of 15 to 25 meters is suitable for a wide range of mobility types, including cars, bicycles, and pedestrians, these are streets that are wide enough to accommodate a full range of transportation modes, including automobiles.
Mobility Types:
The matrix identifies three primary mobility types:
-
The pedestrian mobility type is intended exclusively for foot traffic.
-
The Pedestrian + Public category encompasses a combination of pedestrians and public transportation (e.g., buses, trams). A combination of pedestrians and public transportation, such as buses and trams.
-
The Pedestrian + Public + Personal category encompasses all modes of transportation, including pedestrians, public transit, and private vehicles.
Street Types
The matrix considers three types of streets: transit streets, open streets, and historical streets.
Transit streets are designed mainly for transportation and to provide access to residential areas.
Open streets are versatile streets that accommodate various uses and are full of residential activities and attractions.
Historical streets are streets with cultural or historical significance that often have restrictions to preserve their character.
The following symbols are used in the Matrix as shown in the Figure 10.:
-The use of dots (•) indicates the presence of a street type within a specific width range.
-Dashes (-) are used to indicate the absence or infeasibility of a street type within a certain width range.
-Symbol (*) are used to indicate the only use of public transport without the use of personal vehicles.
-Symbol (**) are used to indicate the only use of Touristic public transportation.
This matrix can be utilized to identify prospective areas for development or conservation, comprehend existing mobility patterns, and devise strategies for anticipating future infrastructure requirements.
The data provides a representative sample of how different street widths accommodate various mobility types, which is a fundamental aspect of creating sustainable and livable urban environments.
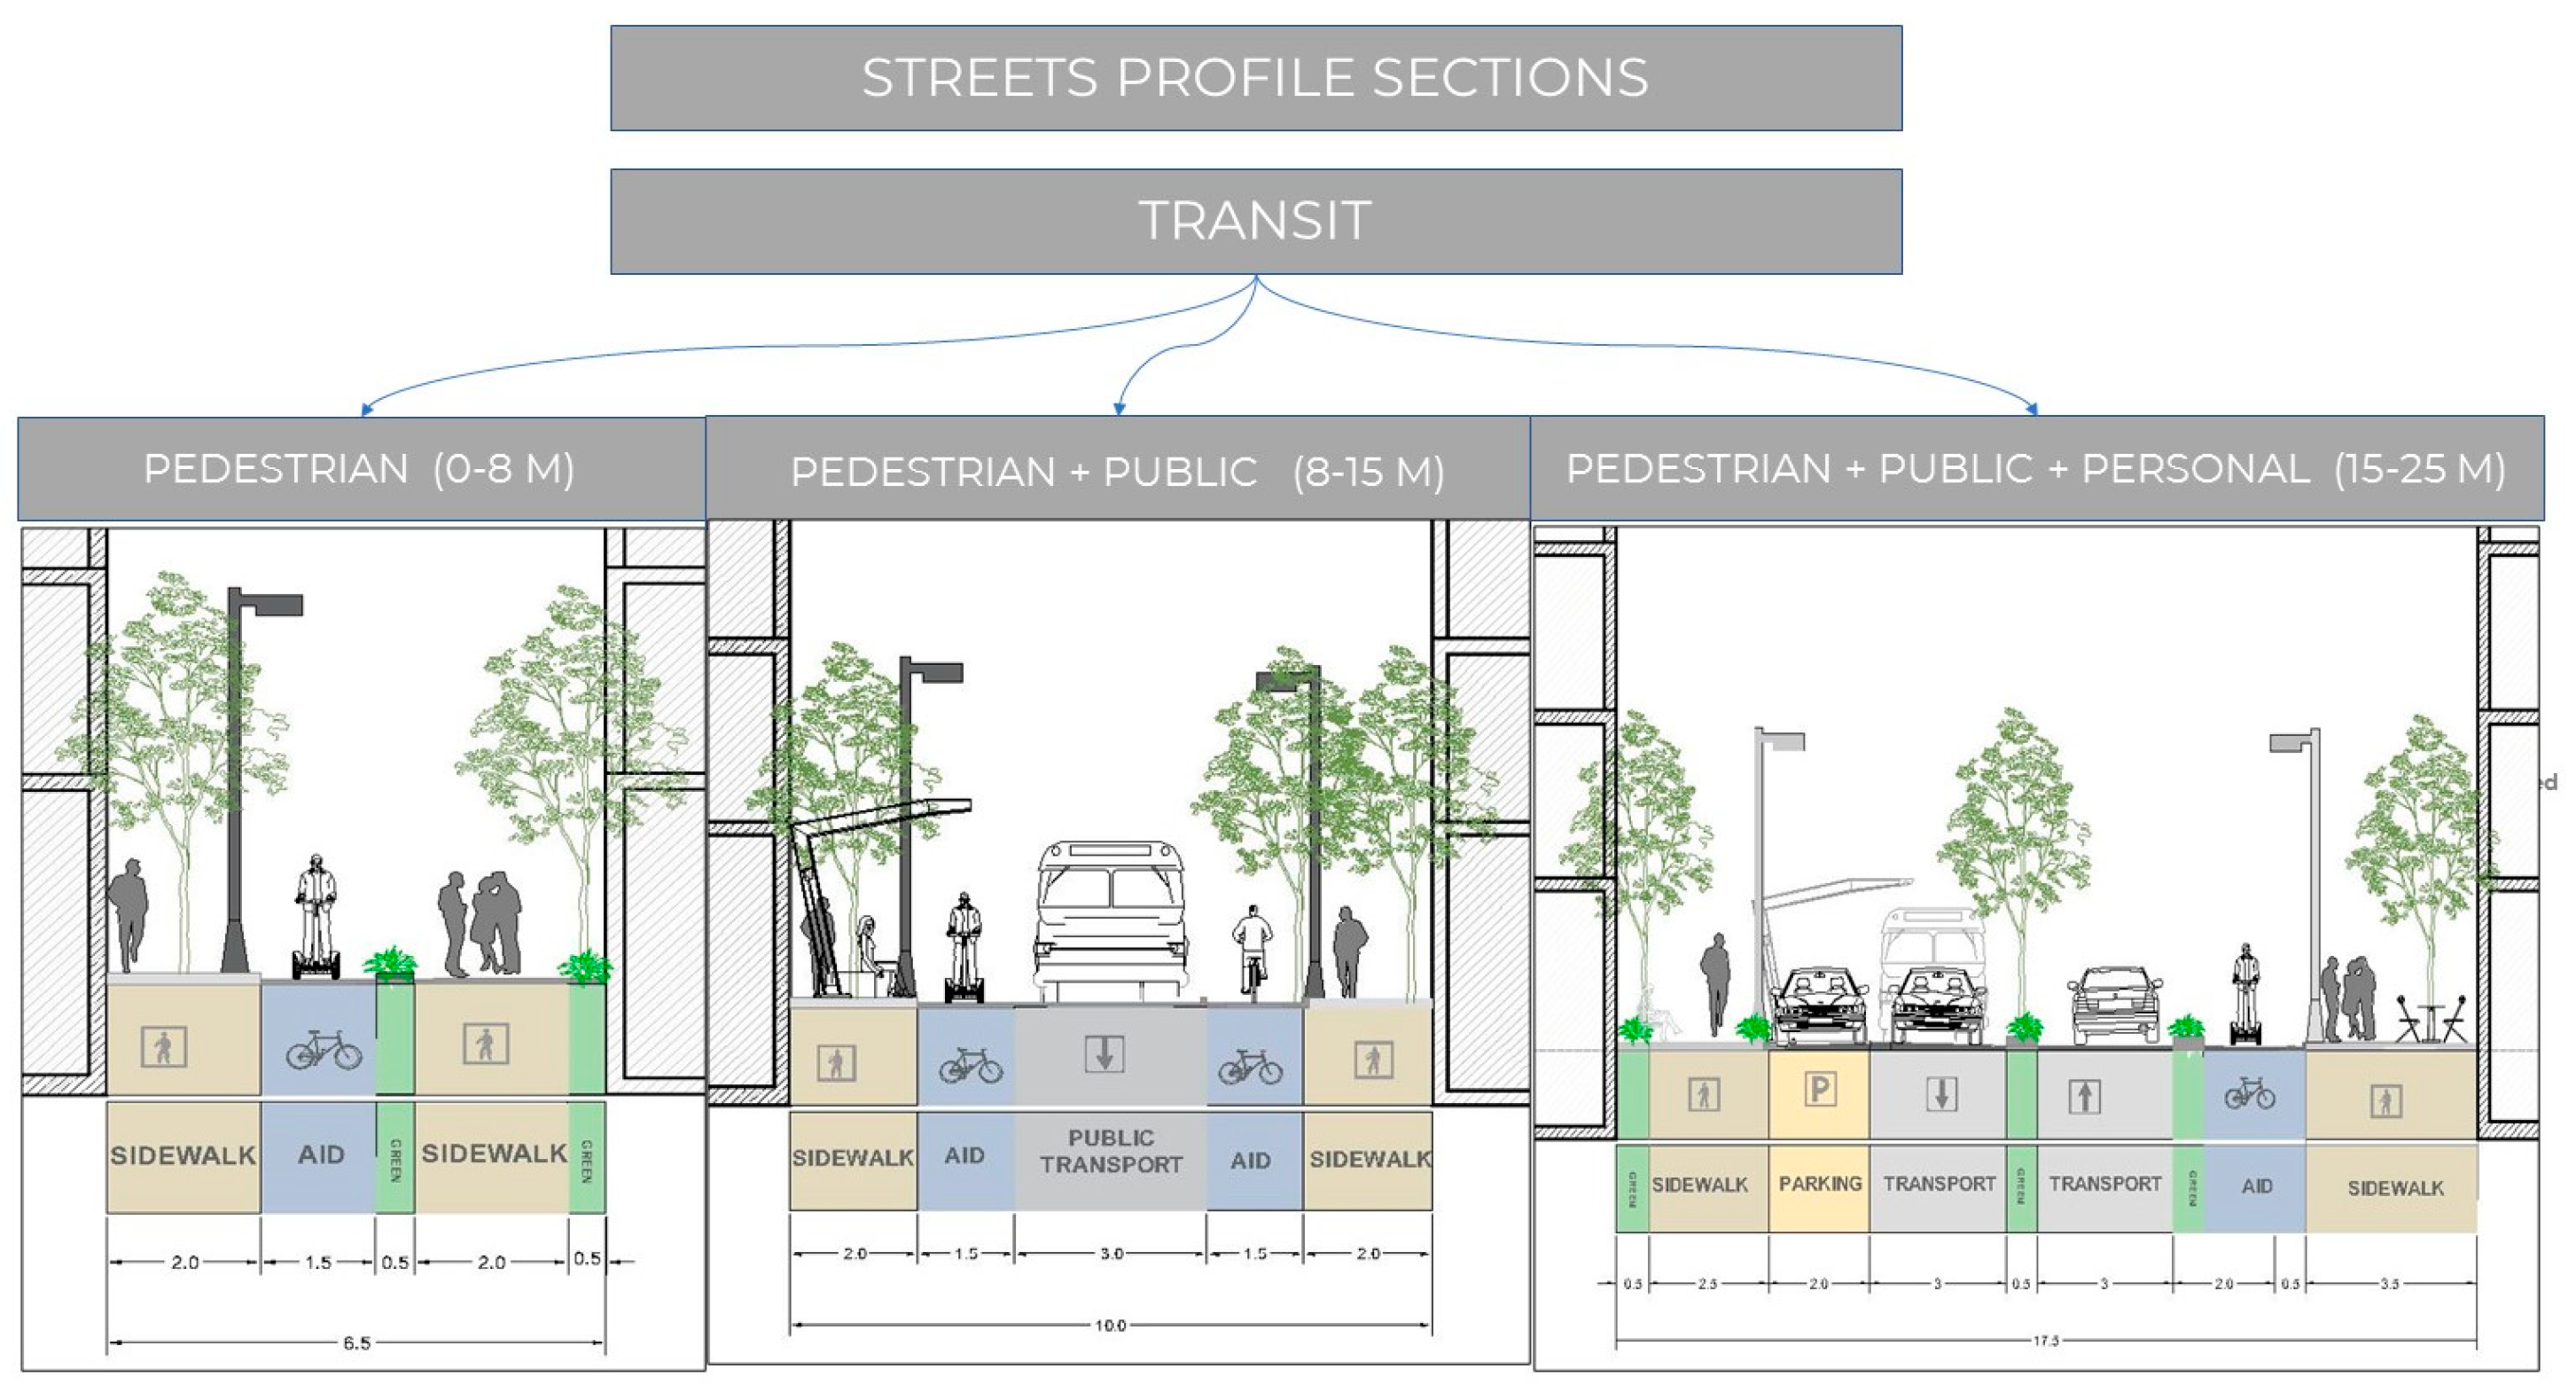
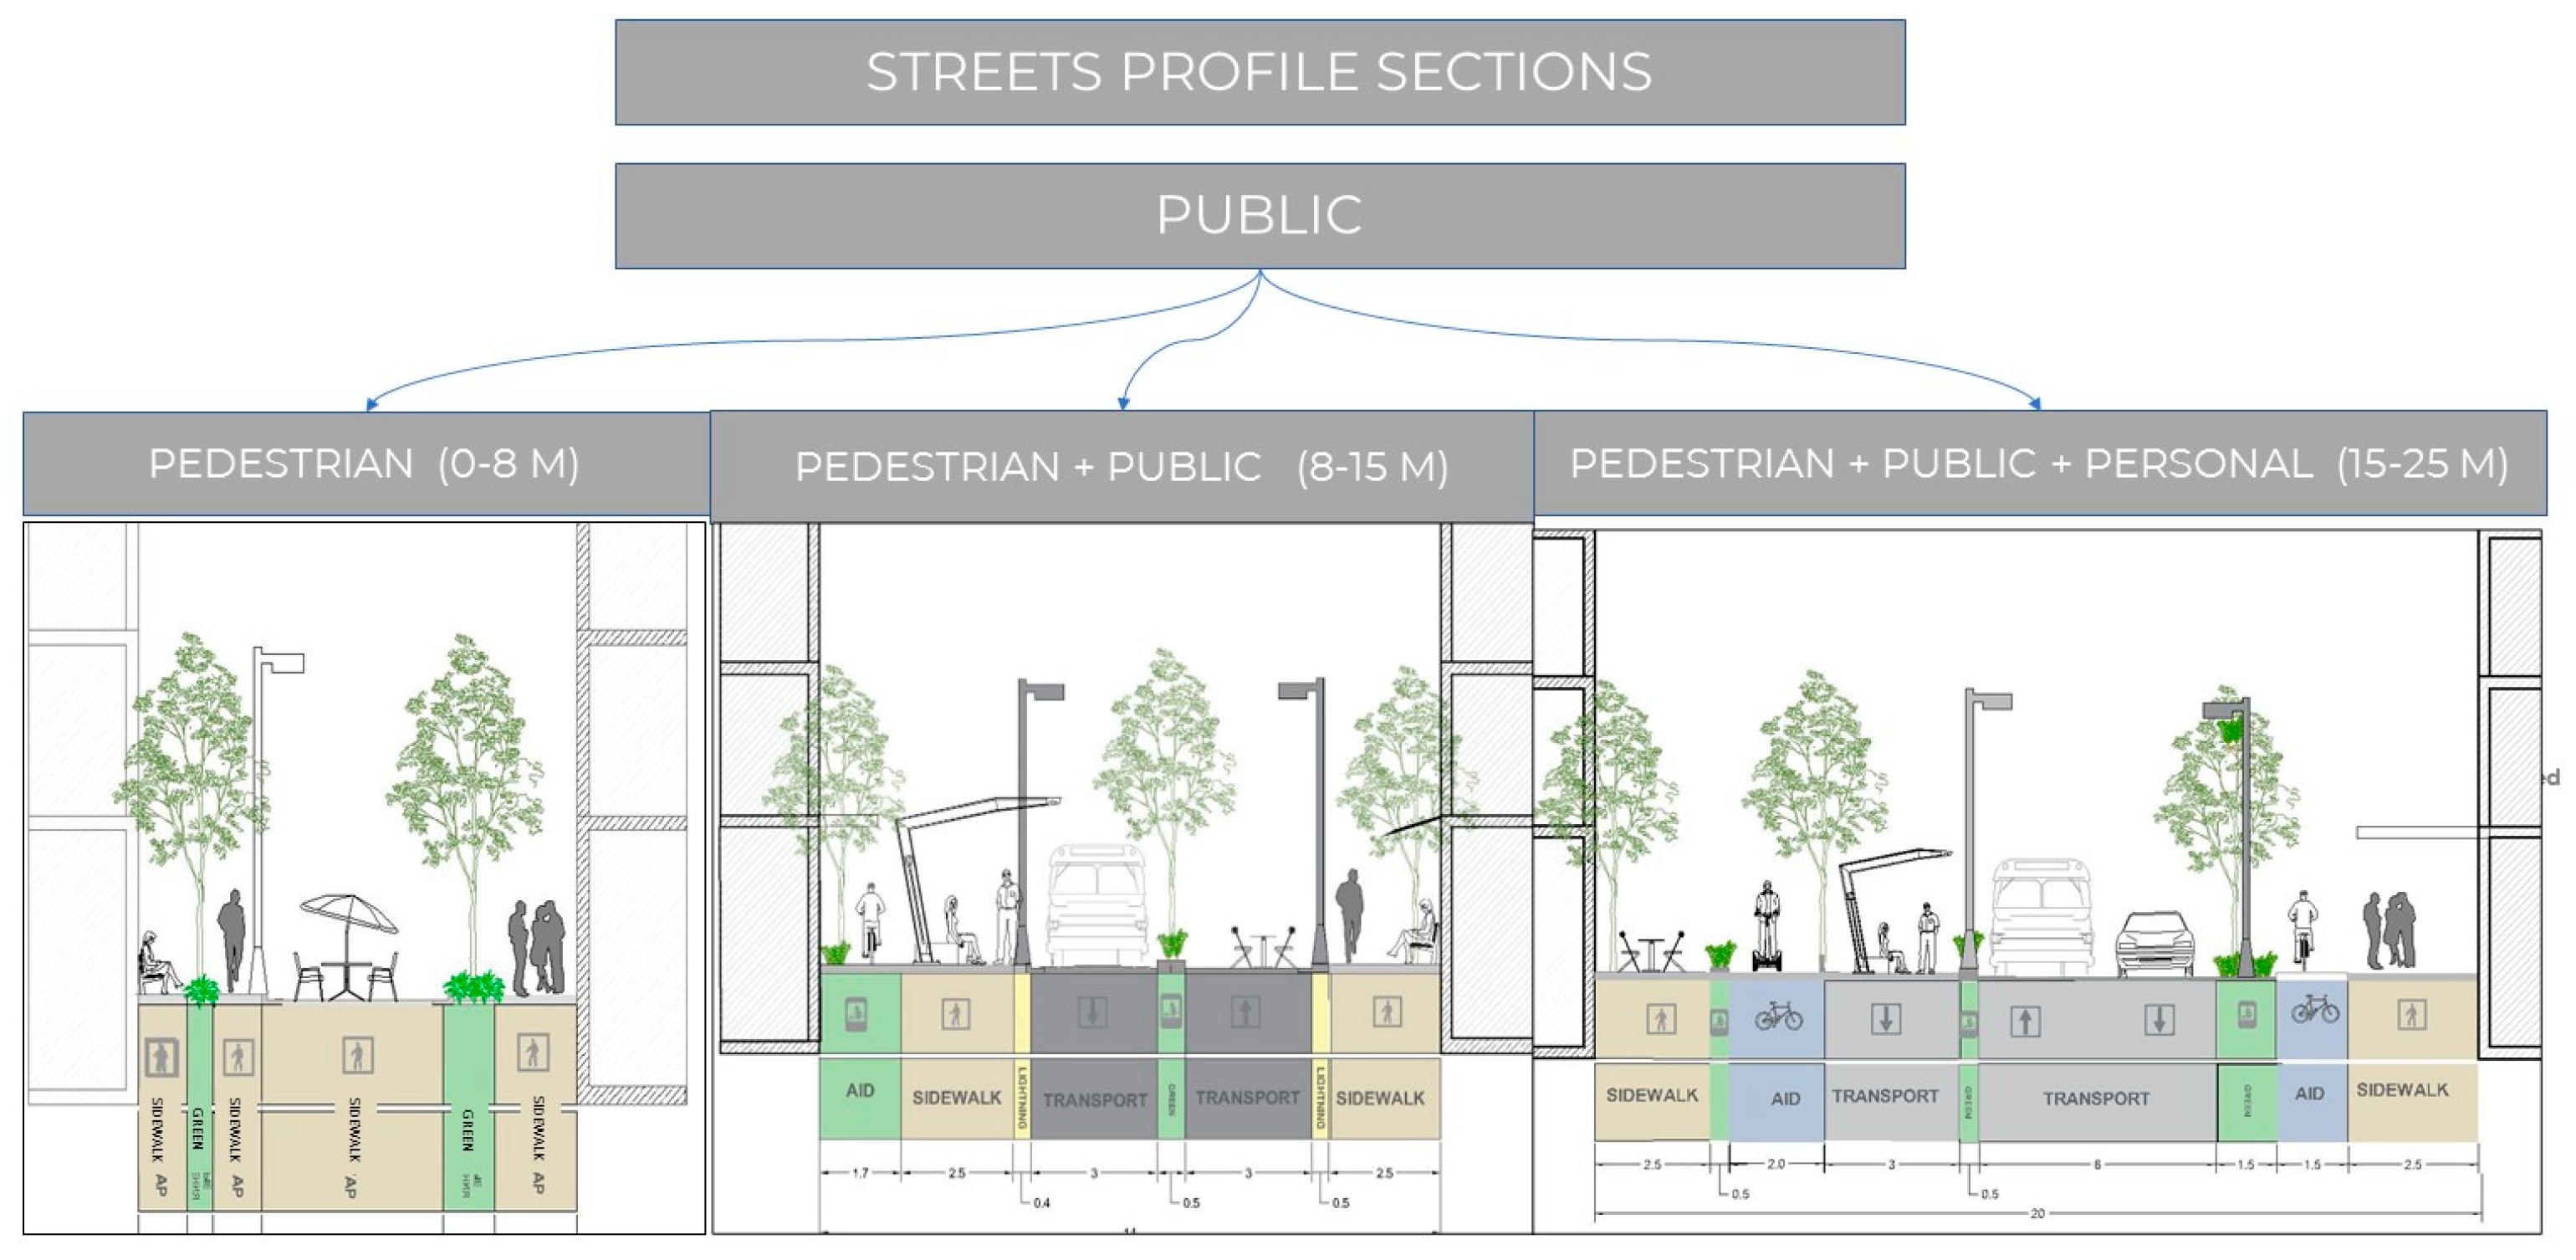
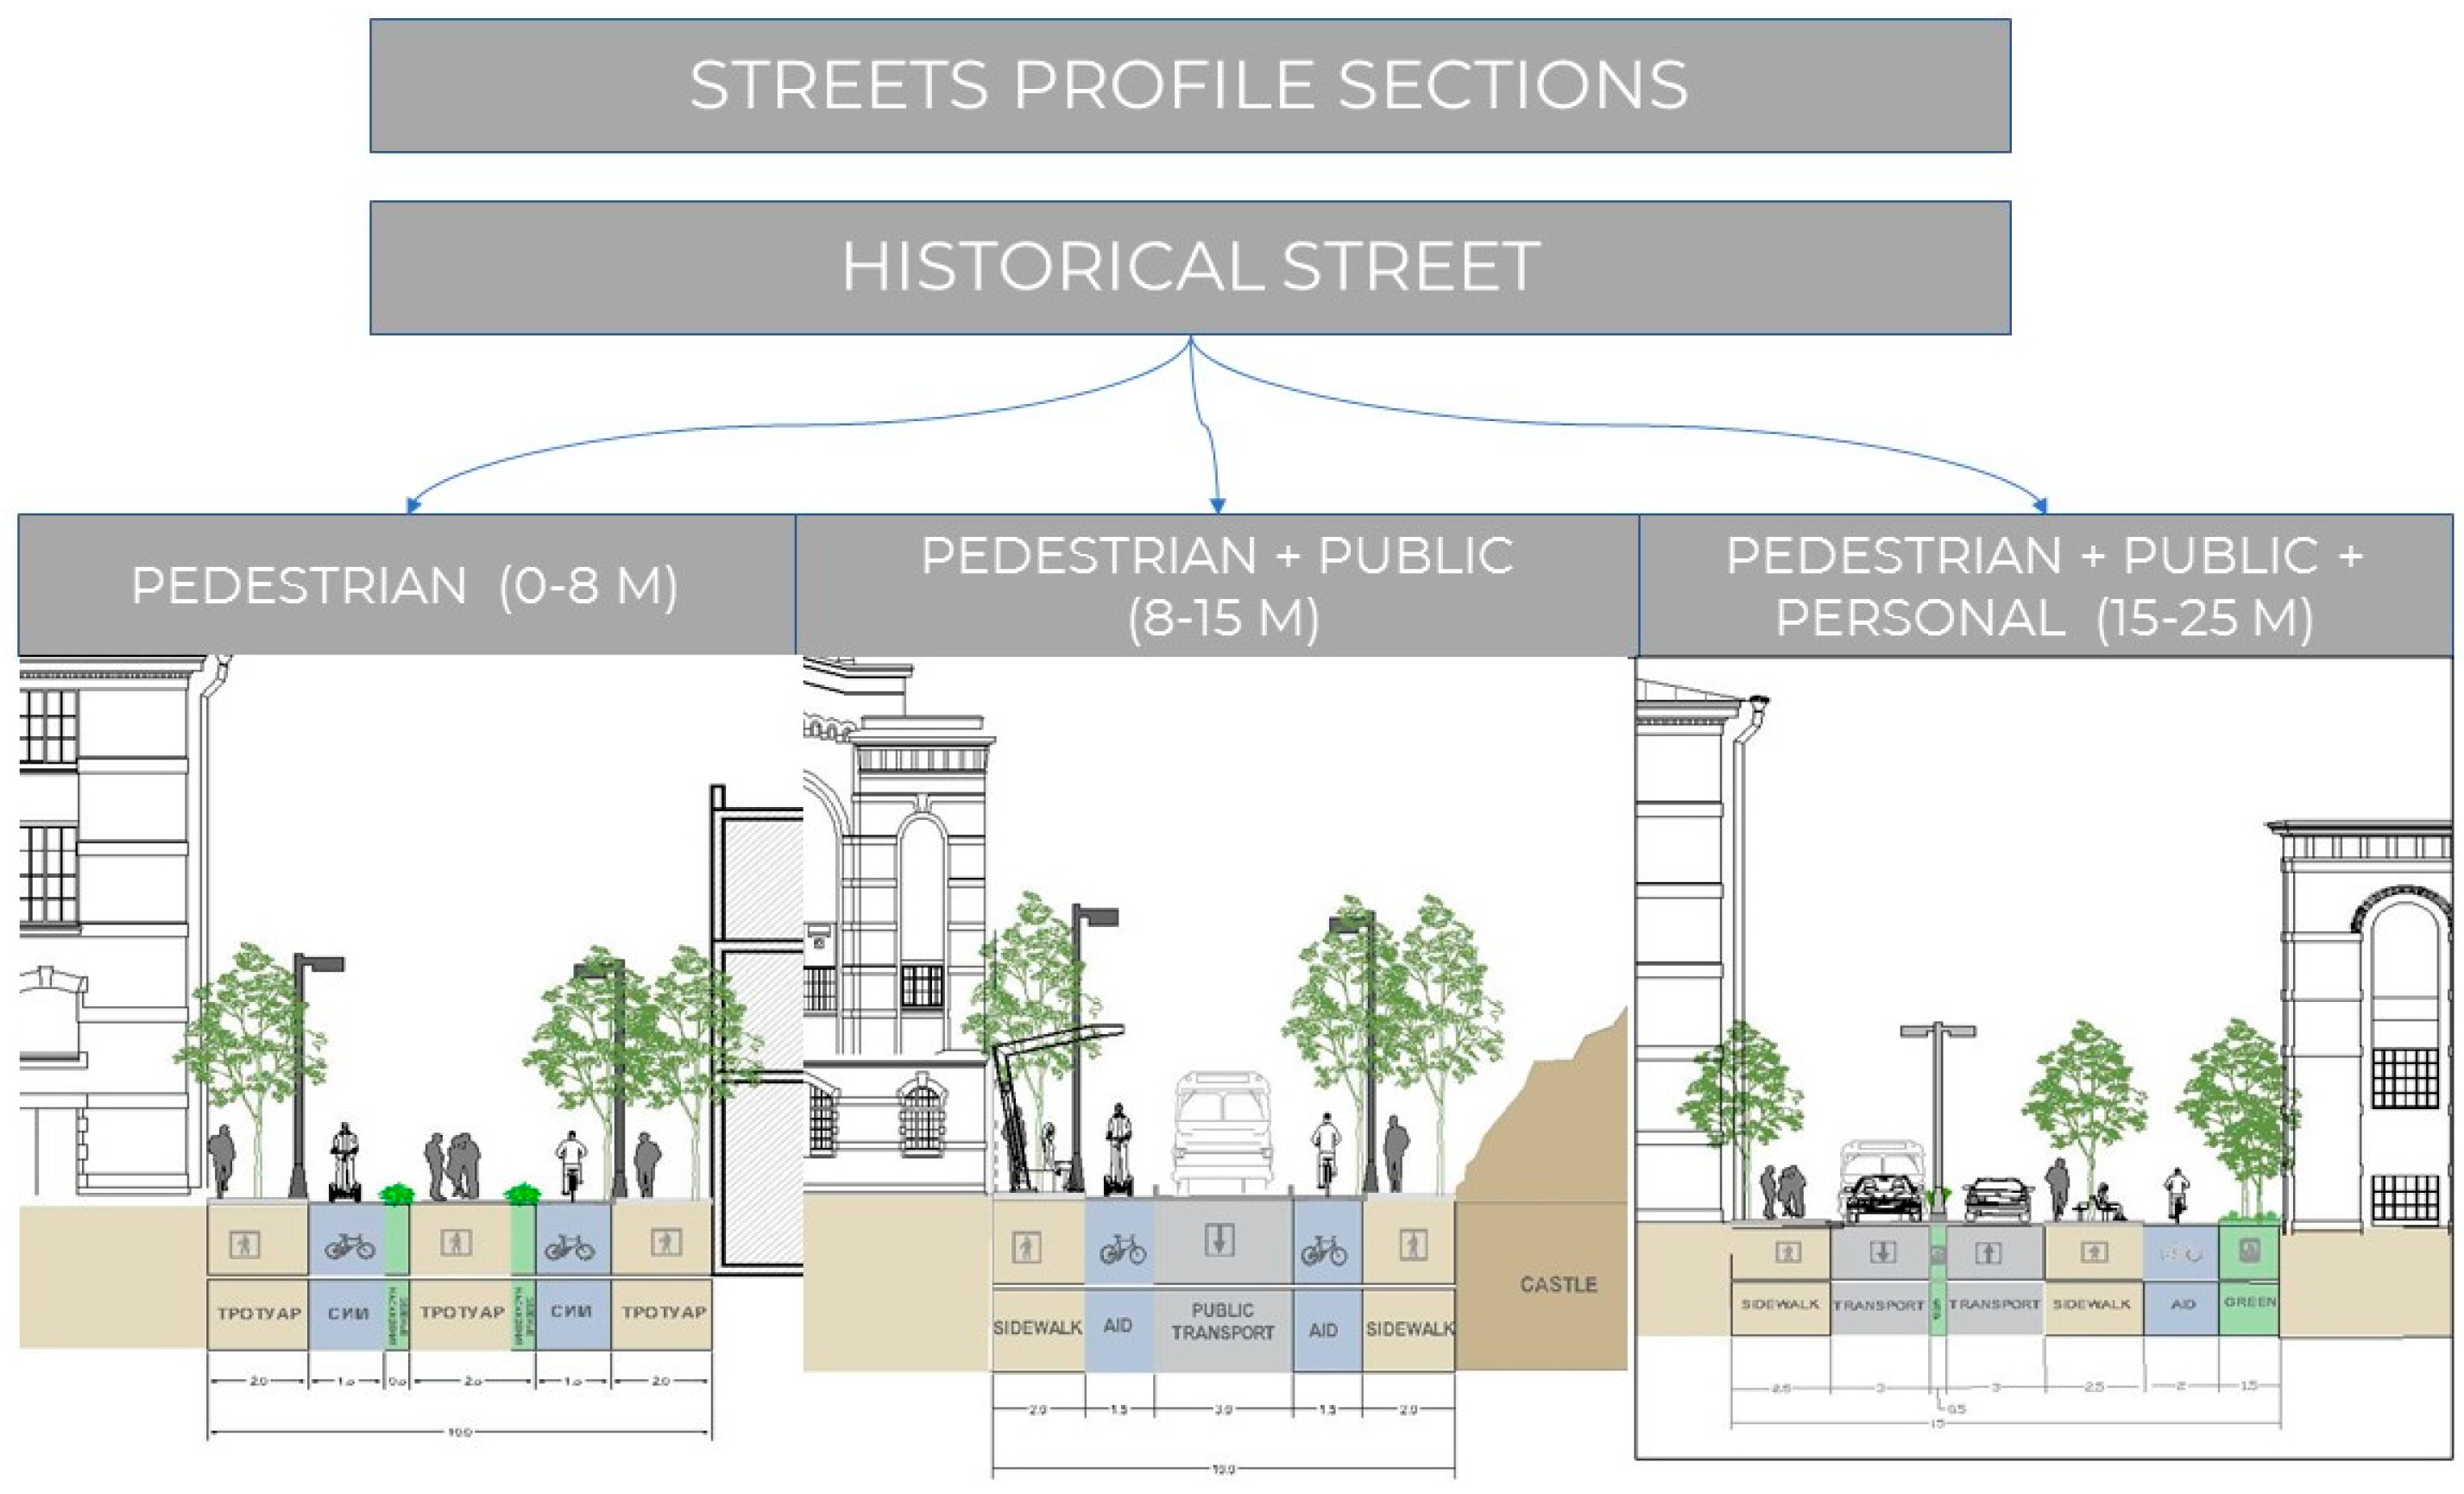
Based on the preceding analysis, a series of scenarios was proposed that suggest streets profile sections that can be utilized and applied in the historical city of Aleppo and the remainder of Syrian cities. These scenarios were divided into three categories, as illustrated in the
The first category (Figure 11) depicts three sections of transit streets connected with the street’s width and mobility types.
The second category (Figure 12) depicts three sections of public streets connected with the street’s width and mobility types.
The third category (Figure 13) depicts three sections of public streets connected with the street’s width and mobility types

4. Discussion

The research is focused on the complex problems of urban planning in one of the historical Syrian cities called Aleppo, setting the optimal balance between the imperative of preserving cultural heritage and meeting the needs of residents, It also uses advanced methodological techniques, like K-Means cluster analysis and geographic information systems, and in this way these methods enable an in-depth look at the mobility patterns in Aleppo through a detailed analysis of street structures and hierarchies.
K-Means method was used to understand o the complex dynamics of historical transportation structures, in which could be explained by reducing the sum of squared distances between data points and their centroids. Then, this analysis helped to classify the streets of the historical city of Aleppo into different clusters representing one unique combination of characteristics of both mobility and uses.
A major impact of this approach can therefore be to classify Aleppo's streets into three major categories: primary, secondary, and mainly pedestrian. All these various kinds of streets play their role in linking to urban mobility, which will enhance or improve the current understanding of mobility patterns and also help in identifying specific infrastructure improvement needs for each street type. Fulfillment of these requirements will ensure enhanced traffic efficiency while remaining sensitive towards pedestrian security and preserving the historic integrity of the city.
The necessity for the preservation of historical city centers is further identified by the research, that uncontrolled tourism growth might cause enormous damages, loss of authenticity, and cultural erosion. Therefore, urban planning has to incorporate measures of protection and conservation of cultural heritage, due to the value already present at such sites. In this direction, the spatial analysis techniques applied in this research are of great value in formulating transportation development scenarios attuned to these characteristics of historic cities. Such techniques give a model of application that can be replicated in other urban areas characterized by the same structural features.

5. Conclusions

The study employed K-Means cluster analysis and geographic information systems (GIS) methodologies to analyze the street structure of Aleppo, which gave us a valuable insights into mobility patterns in historic Syrian cities.
In addition, by categorizing streets based on widths and types, this research gave a proposed design scenarios for the street profile of Aleppo historical city center in order it enhance urban mobility.
(GIS) enabled a structured representation of street classifications and attributes, which is important for urban planning and mobility design, also the results highlight the complex linkage between urban structure, cultural heritage, tourism, and various mobility patterns in historic city centers.
By the confirming of necessity for sustainable urban development strategies, the proposed scenarios and methods can work as an example for other historical urban centers with similar structure and challenges, giving a framework for determining mobility problems while protecting cultural heritage.
In summary, the results that was presented provide a comprehensive framework, in order to understand and improve mobility in historic city centers, balancing the dual of heritage preservation and modern urban functionality

Author Contributions

Conceptualization, N.D.; methodology, N.D. , L.I. and I.T.; software, L.I..; validation ,N.D.,I.T.; formal analysis, L.I.; investigation, N.D. and I.T.; resources, L.I.; data curation, V.D and L.I. All authors have read and agreed to the published version of the manuscript.

Funding

This work was financially supported by the Ministry of Science and Higher Education (grant # 075-15-2021-686). All tests were carried out using research equipment of The Head Regional Shared Research Facilities of the Moscow State University of Civil Engineering.

Institutional Review Board Statement

Institutional Review Board Statement: This study was approved by the Urban planning section, Scientific Committee of Moscow State University of Civil Engineering (protocol №1 approved on 7 October 2021).

Informed Consent Statement

Not applicable.

Data Availability Statement

The data used to support the findings of this study are available from the corresponding author upon request.

Conflicts of Interest

The authors declare no conflict of interest.

References

  1. Shehata, A.M. Sustainable-Oriented Development for Urban Interface of Historic Centers. Sustainability 2023, 15, 2792. [CrossRef]
  2. Shehata, A.M.A.E.-R.; Mostafa, M.M.I. Open Museums as a Tool for Culture Sustainability. Procedia Environ. Sci. 2017, 37, 363–373. [CrossRef]
  3. Guzman Molina, P.C.; Pereira Roders, A.R.; Colenbrander, B.J.F.Proceedings of the 34th Annual Conference of the International Association for Impact Assessment (IAIA14) 8-11 April 2014, Vina del Mar, Chile. 2014. p. 1-6. [CrossRef]
  4. Liu Yang, Koen H. van Dam, Arnab Majumdar, Bani Anvari, Washington Y. Ochieng, Lufeng Zhang. Integrated design of transport infrastructure and public spaces considering human behavior: A review of state-of-the-art methods and tools. Front. Archit. Res., 2019, 8(4): 429‒453 . [CrossRef]
  5. Ahmed, N. O. (2017). TOWARDS AN APPROACH TO HUMANIZE THE STREET ENVIRONMENT: RECONCILING PEDESTRIAN-VEHICLE RELATIONSHIP. International Journal of Architecture and Urban Studies.,2017, 2(2), 29-41.
  6. Yannis, G., & Chaziris, A.Transport system and infrastructure. Transportation Research Procedia, (2022). 60, 6–11. [CrossRef]
  7. Gross,M.,Dudzińska,M.,Dawidowicz,A. & Wolny-Kucińska,A.(2024).Transportation Management in Urban Functional Areas. Real Estate Management and Valuation,0(0) -. [CrossRef]
  8. Boeri, A., Longo, D., Massari, M., Sabatini, F., Turillazzi, B. (2024). The Role of Historical City Centers in the Climate-Neutral Transition of Cities: The Digital Twin as a Tool for Dynamic and Participatory Planning. In: Battisti, A., Baiani, S. (eds) ETHICS: Endorse Technologies for Heritage Innovation. Designing Environments. Springer, Cham. [CrossRef]
  9. Soufiane, F., Said, M., & Atef, A. (2015). Sustainable urban design of historical city centers. Energy Procedia, 74, 301–307. [CrossRef]
  10. Anciaes, P., & Jones, P. (2022). Pedestrian priority in street design - how can it improve sustainable mobility? Transportation Research Procedia, 60, 220–227. [CrossRef]
  11. Shahmoradi, S., Abtahi, S. M., & Guimarães, P. (2023). Pedestrian street and its effect on economic sustainability of a historical Middle Eastern City: The case of Chaharbagh Abbasi in Isfahan, Iran. Geography and Sustainability, 4(3), 188–199. [CrossRef]
  12. Ortega, E., Martín, B., De Isidro, Á., & Cuevas-Wizner, R. (2020). Street walking quality of the ‘Centro’ district, Madrid. Journal of Maps, 16(1), 184–194. [CrossRef]
  13. Anciaes, P., & Jones, P. (2022). Pedestrian priority in street design - how can it improve sustainable mobility? Transportation Research Procedia, 60, 220–227. [CrossRef]
  14. Jabbari, M., Fonseca, F., Smith, G., Conticelli, E., Tondelli, S., Ribeiro, P., … Ramos, R. (2023). The Pedestrian Network Concept: A systematic literature review. Journal of Urban Mobility, 3, 100051. [CrossRef]
  15. Azad, M., Abdelqader, D., Taboada, L. M., & Cherry, C. R. (2021). Walk-to-transit demand estimation methods applied at the parcel level to improve pedestrian infrastructure investment. Journal of Transport Geography, 92, Article 103019. [CrossRef]
  16. Delso, J., Martín, B., & Ortega, E. (2018). A new procedure using network analysis and kernel density estimations to evaluate the effect of urban configurations on pedestrian mobility. The case study of Vitoria –Gasteiz. Journal of Transport Geography, 67, 61– 72. [CrossRef]
  17. Oswald Beiler, M., McGoff, R., & McLaughlin, S. (2017). Trail network accessibility: Analyzing collector pathways to support pedestrian and cycling mobility. Journal of Urban Planning and Development, 143(1), Article 04016024. [CrossRef]
  18. J. Ammapa, P. Visuttiporn, J. Klaylee, S. Chayphong and P. Iamtrakul, "Using GIS-Based Spatial Analysis: Comparing Pattern of Urbanization and Transportation Networks," 2022 10th International Conference on Traffic and Logistic Engineering (ICTLE), Macau, China, 2022, pp. 17-21. [CrossRef]
  19. Ji Li, Tianchen Dai, Shengchen Yin, Yiqing Zhao, Deniz Ikiz Kaya, Linchuan Yang. Promoting conservation or change? The UNESCO label of world heritage (re)shaping urban morphology in the Old Town of Lijiang, China. Front. Archit. Res., 2022, 11(6): 1121‒1133 . [CrossRef]
  20. Szromek, A.R.; Walas, B.; Kruczek, Z. Identification of Challenges for the Reconstruction of Heritage Tourism—Multiple Case Studies of European Heritage Cities. Heritage 2023, 6, 6800-6821. [CrossRef]
  21. Kordi, A.O., Galal Ahmed, K. Towards a socially vibrant city: exploring urban typologies and morphologies of the emerging “CityWalks” in Dubai. City Territ Archit 10, 34 (2023). [CrossRef]
  22. Wei, Y.; Yuan, H.; Li, H. Exploring the Contribution of Advanced Systems in Smart City Development for the Regeneration of Urban Industrial Heritage. Buildings 2024, 14, 583. [CrossRef]
  23. Horbliuk, S.; Dehtiarova, I. Approaches to urban revitalization policy in light of the latest concepts of sustainable urban development. Balt. J. Econ. Stud. 2021, 7, 46–55.
  24. Alnaim, M.M.; Noaime, E. Spatial Dynamics and Social Order in Traditional Towns of Saudi Arabia’s Nadji Region: The Role of Neighborhood Clustering in Urban Morphology and Decision-Making Processes. Sustainability 2024, 16, 2830. [CrossRef]
  25. Salmo Ali, Scherbina Elena V., and Alibrahim Lina Yaser. "ARCHITECTURAL AND URBAN IDENTITY OF HOMS CITY" Вестник МГСУ, vol. 16, no. 10, 2021, pp. 1285-1296.
  26. Fangi G / Documentation of some Cultural Heritage Emergencies in Syria In August 2010 by Spherical Photrammetry./ Università Politecnica delle Marche, Italy 2015. – № 8. – p. 401-408. –. [CrossRef]
  27. Kousa C, Pottgiesser U, Lubelli B. Post-Syrian War Residential Heritage Transformations in the Old City of Aleppo: Socio-Cultural Sustainability Aspects. Sustainability. 2021; 13(21):12213. [CrossRef]
  28. Kotsoni.A. Dimelli.D/ Urban Regeneration of the Historic Center of Aleppo in Syria// Conference: The 7th International Conference on Architecture and Built Environment At: Tokyo, Japan .2020 . – № 15. – p. 227-212. – URL:https://www.researchgate.net/publication/342692984_Urban_Regeneration_of_the_Historic_Center_of_Aleppo_in_Syria.
  29. Salkini H., Swaid B., Greco L., Lucente R., Developing a Multi-scale Approach for Rehabilitating the Traditional Residential Buildings within the Old City of Aleppo (Syria),World Heritage and Degradation, Naples, Italy, 2016. - № 11. – p. 443-432. – https://www.researchgate.net/publication/305619298.
  30. Fangi, G. (2015). Documentation of some Cultural Heritage Emergencies in Syria In August 2010 by Spherical Photrammetry. ISPRS Annals of the Photogrammetry, Remote Sensing and Spatial Information Sciences, 401-408. [CrossRef]
  31. Kousa, C.; Pottgiesser, U.; Lubelli, B. Post-Syrian War Residential Heritage Transformations in the Old City of Aleppo: Socio-Cultural Sustainability Aspects. Sustainability 2021, 13, 12213. [CrossRef]
  32. Dimelli, D.; Kotsoni, A. The Reconstruction of Post-War Cities—Proposing Integrated Conservation Plans for Aleppo’s Reconstruction. Sustainability 2023, 15, 5472. [CrossRef]
  33. Swaid, Bashar. (2016). Developing a Multi-scale Approach for Rehabilitating the Traditional Residential Buildings within the Old City of Aleppo (Syria).
  34. Zeido, Z. Attempting to document and rehabilitate Aleppo between 1994 and 2011: the ramifications of pre-conflict built heritage mismanagement and the effects of the scarcity of documentation on options available for post-conflict conservation. Built Heritage 7, 3 (2023). [CrossRef]
  35. Ibrahim, Sonia. (2022). Mapping Spatial Social Aspects of Urban Recovery in contested cities: A Case of The Historic Commercial Center of The Ancient City of Aleppo. 10.4995/HERITAGE2022.2022.15764.
  36. Liu, X., Payakkamas, P., Dijk, M., & de Kraker, J. (2023). GIS Models for Sustainable Urban Mobility Planning: Current Use, Future Needs, and Potentials. Future Transportation, 3(1), 384-402. [CrossRef]
  37. Shafabakhsh, Gholamali & Famili, Afshin & Bahadori, Mohammad Sadegh. (2017). GIS-based spatial analysis of urban traffic accidents: Case study in Mashhad, Iran. Journal of Traffic and Transportation Engineering. [CrossRef]
  38. Hasan, Md Mehedi, and Jun-Seok Oh. "GIS-based multivariate spatial clustering for traffic pattern recognition using continuous counting data." Transportation Research Record 2674.10 (2020): 583-598.
  39. Paul, P. R. (2005). Geographic Information Systems for Transportation: Principles and Applications. Investigación Operacional, 26(2), 201. https://link.gale.com/apps/doc/A360358849/IFME?u=anon~5cc3838a&sid=googleScholar&xid=6fefc7eb.
  40. Vera, C., Lucchini, F., Bro, N., Mendoza, M., Löbel, H., Gutiérrez, F., Dimter, J., Cuchacovic, G., Reyes, A., Valdivieso, H., Alvarado, N., & Toro, S. (2022). Learning to cluster urban areas: two competitive approaches and an empirical validation. EPJ Data Science, 11, Article number: 62.
  41. Sarstedt, M., Mooi, E. (2019). Cluster Analysis. In: A Concise Guide to Market Research. Springer Texts in Business and Economics. Springer, Berlin, Heidelberg. [CrossRef]
  42. King, R. (2013). Chapter 1: Introduction to Cluster Analysis. In Cluster Analysis and Data Mining: An Introduction (pp. 1-17). Berlin, Boston: Mercury Learning and Information. [CrossRef]
  43. Xie, J., Jiang, X., & Zhao, H. (2016). Research on clustering algorithm and its improved method. Journal of Data Analysis and Information Processing, 4(3), 120-130.
  44. Gan, G., Ma, C., & Wu, J. (2020). Data clustering: theory, algorithms, and applications. SIAM.
  45. Gul, M., Rehman, M. Big data: an optimized approach for cluster initialization. J Big Data 10, 120 (2023). [CrossRef]
  46. M A Syakur et al. 2018 IOP Conf. Ser.: Mater. Sci. Eng. 336 012017. [CrossRef]
  47. Shcherbina, E., & Salmo, A. (2023). Exploring impact of historical and cultural heritage on the sustainability of urban and rural settlements. E3S Web of Conferences, 457, 03001. [CrossRef]
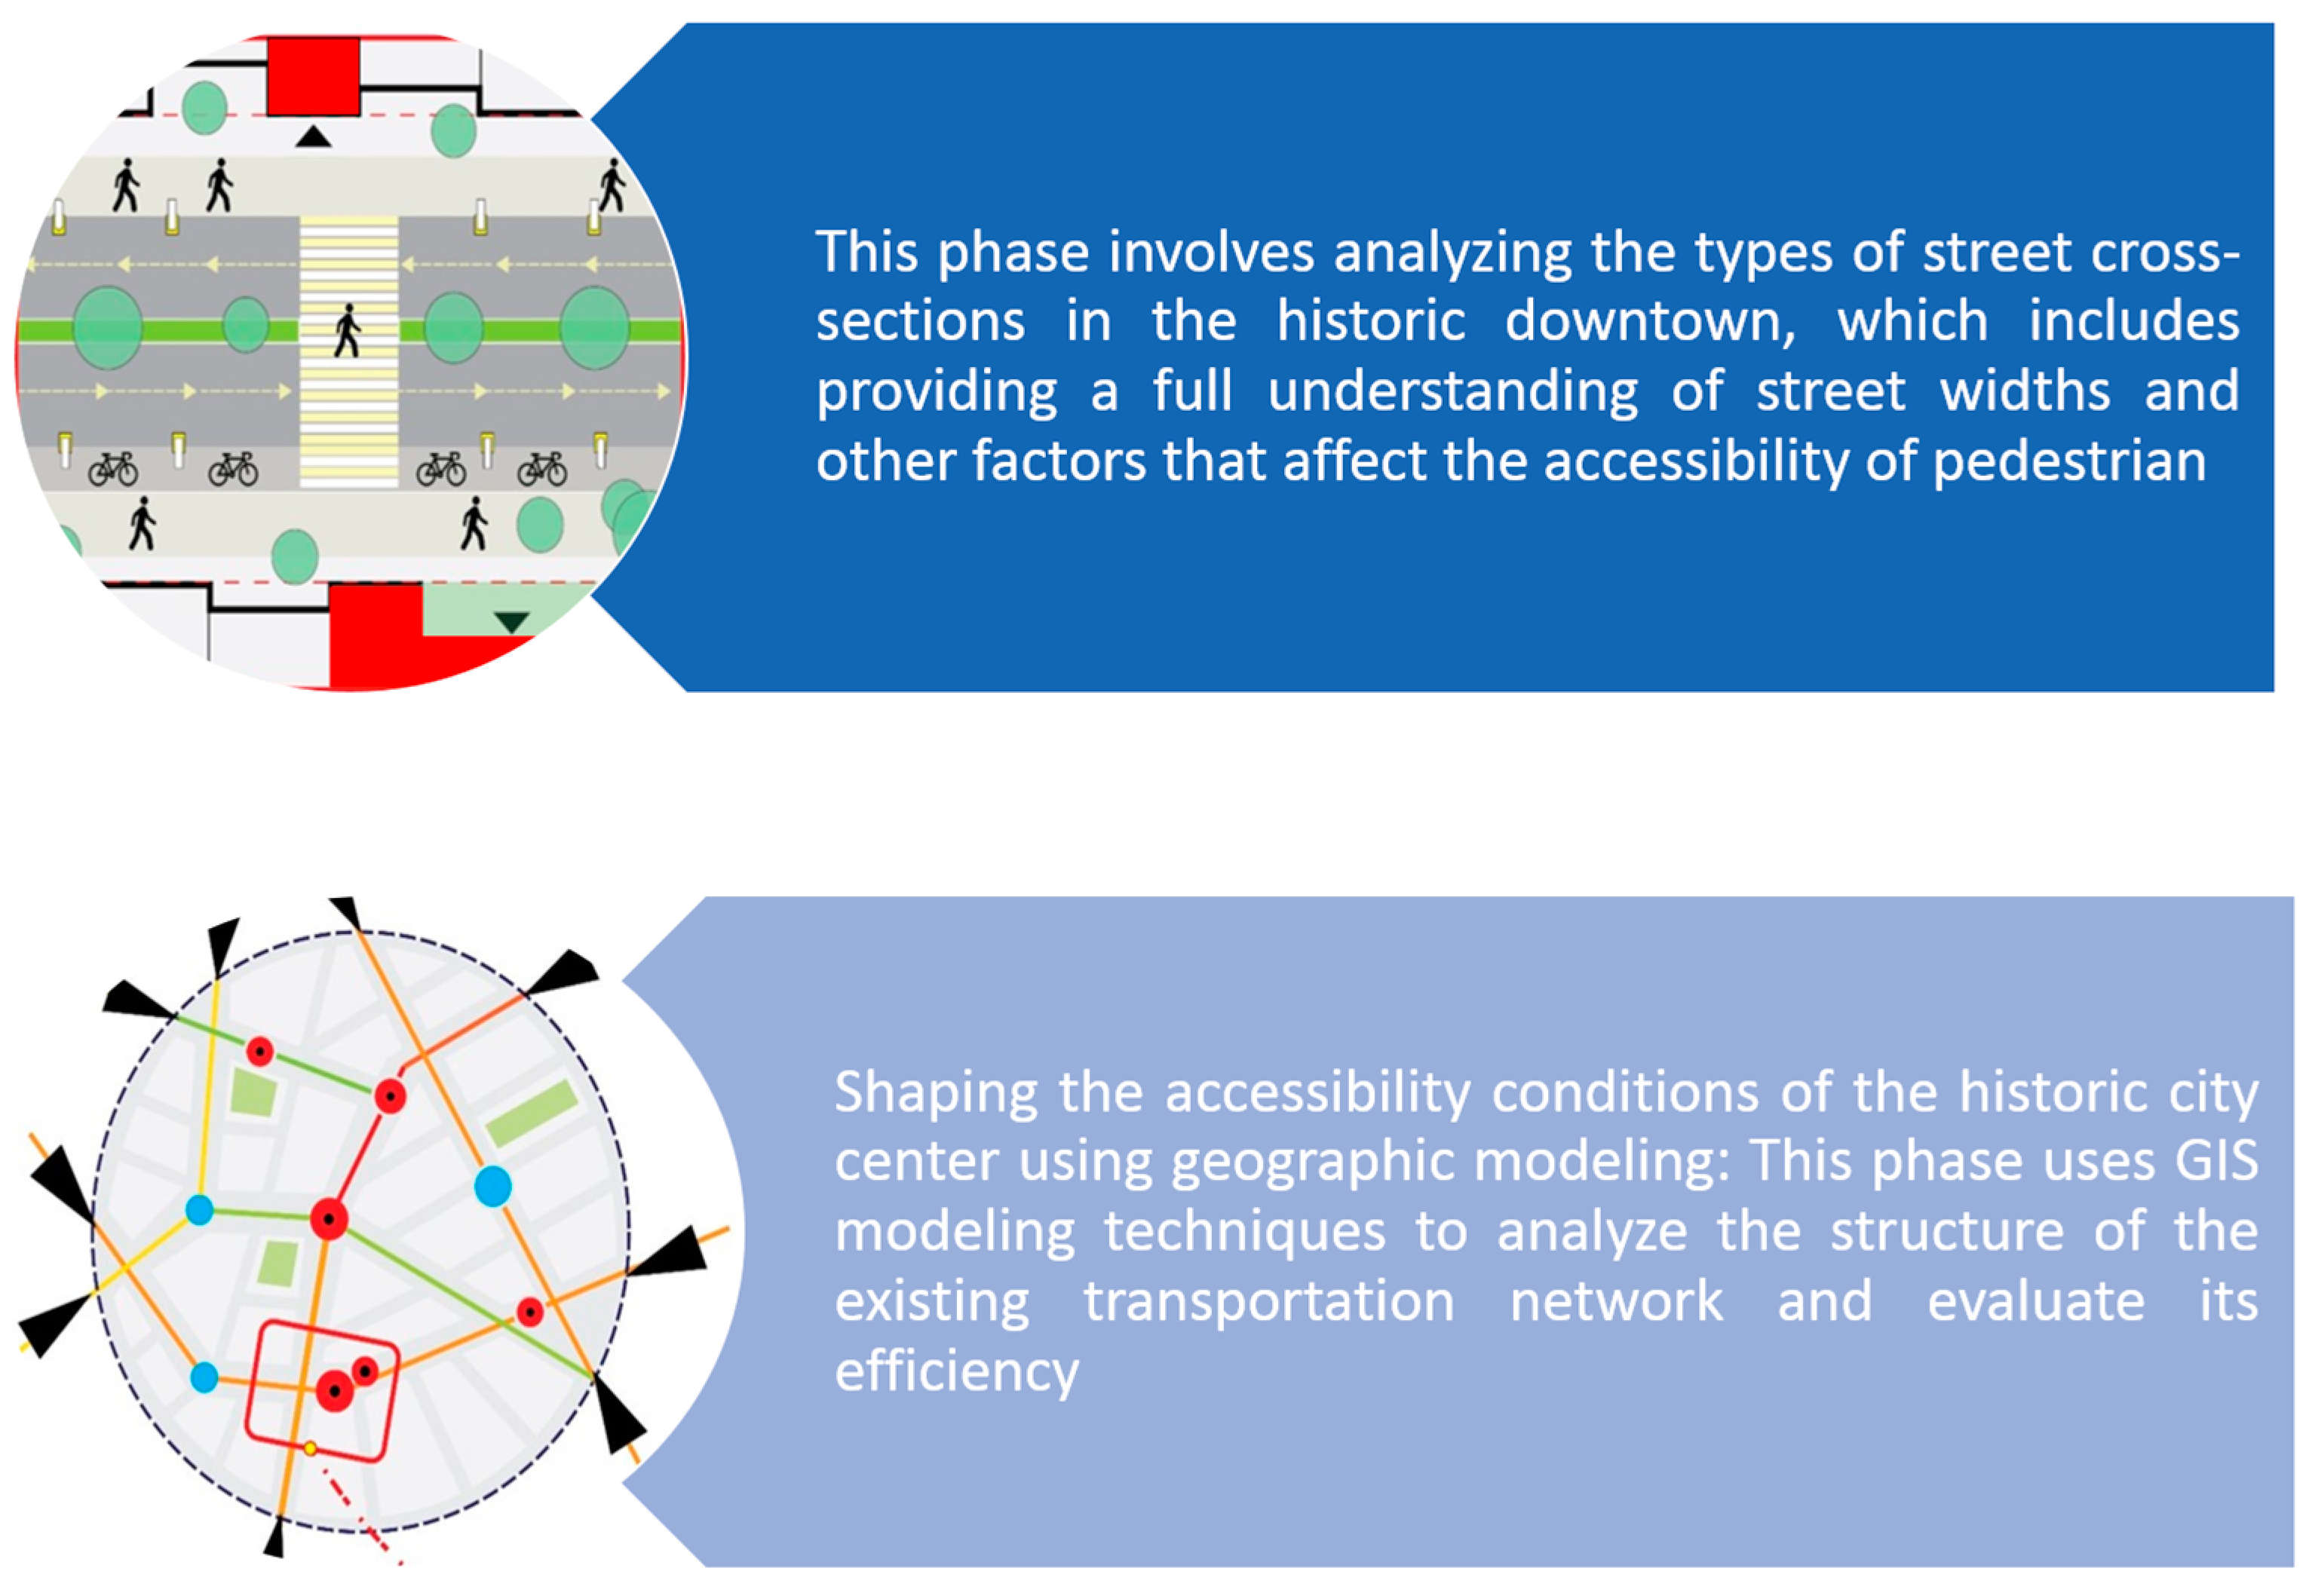
Figure 1. Conditions of accessibility of the historical city center.
Preprints 110213 g001
Figure 2. The Location of Aleppo governorate in Syria and the borders of the historical city of Aleppo.
Preprints 110213 g002
Figure 3. Aleppo's Historic Center Scheme.
Preprints 110213 g003
Figure 4. Structure of scientific method.
Preprints 110213 g004
Figure 5. Classification of historical Aleppo city streets.
Preprints 110213 g005
Figure 6. Identifying and determining urban mobility patterns of historical city center of Aleppo.
Preprints 110213 g006
Figure 7. The Elbow method application.
Preprints 110213 g007
Figure 8. K-Means clustering results.
Preprints 110213 g008
Figure 9. K-Means clustering results application on the historic city center of Aleppo.
Preprints 110213 g009
Figure 10. Street width and mobility compatibility matrix.
Preprints 110213 g010
Figure 11. Suggested streets profile section of transit streets.
Preprints 110213 g011
Figure 12. Suggested streets profile section of public streets.
Preprints 110213 g012
Figure 13. Suggested streets profile section of historical streets.
Preprints 110213 g013
Table 1. Analyzing urban problems in Syrian cities.
Preprints 110213 i001
Table 2. Characteristics of the Aleppo city.
Area km2 Population, person Population density, person/км Length of road network км
190 2,098,000 11,000 13993
Table 3. A dataset that includes a variety of street widths and configurations.
N Street width N Street width
1 Al-Nahasin market 3 57 St.Alarian 6
2 Ahmadiyya market 2 58 Al-Muhtaseb 6
3 Al Zarb Market 3.5 59 Al-Muhtaseb 2 6.5
4 Soap Market 3 60 Al-Hashmeen 6.7
5 Attarin Market 2 61 St.Alarian 2 6
6 Bab Antakya Market 3.5 62 Al-Msht 5.5
7 Al Sakateyya Market 3 63 Al-Msht 2 5
8 Al juh Market 2 64 Al-Tarbeya 6.3
9 Alfarin Market 2.5 65 Abdul Rahim 5.8
10 Al-Bahramiya Market 2 66 Foundation.st 6.5
11 Castle Street 10 67 Al-Aws 6.8
12 Khan Al-Wazir 12 68 Al-Aws2 6.8
13 Khan al-Hari 8 69 Al-Jabriya 7
14 Bab Nazlat Akaba 6 70 Al-Hazaza 7
15 Seven Lakes 10 71 Al-qaser 6
16 St.Al-Khandaq 10 72 Al - Wakiliyya 6.5
17 St.Antar 12 73 L-Reach 5.5
18 St.Al Mashatiya 8 74 Al-Qashla 6.6
19 St.Qadi Askara 7 75 Avenue 1 6
20 St.Bab Al Hadid 15 76 Avenue 2 6
21 St.Bab Antakya 18 77 Avenue 3 6
22 St.Mutanabi 17 78 Avenue 4 5.4
23 St.Prison 17 79 Avenue 5 5.5
24 St.kawakibi 15 80 Avenue 6 5
25 St.Saad Bin Al Aas 15 81 Avenue 7 5.4
26 St.Al-Abbasiyyin 17 82 Avenue 8 5
27 St.Mohamed Fares 20 83 Avenue 9 5.5
28 St.Mohamed Beck 25 84 Avenue 10 5
29 Avenue 11 4.7 85 Avenue 16 6.7
30 Avenue 12 5.6 86 Avenue 17 6
31 Avenue 13 5.8 87 Avenue 18 6
32 Avenue 14 6 88 Avenue 19 6.5
33 Al-Basha 6.3 89 Avenue 20 6.5
34 Safwan 6.7 90 Avenue 21 6.7
35 Al-Hajaj 7 91 Al-Faruk 5.5
36 Al-Raee 6.5 92 Al-Qasila 10
37 Al-Nesbe 6.5 93 Al-Qasila 2 6.7
38 Al-Masri 6.5 94 Avenue 22 6
39 Al-Shakrea 6.5 95 Avenue 23 7
40 Bab Al-Ahmar 2 7 96 Avenue 24 7.5
41 Al-qatani 6.5 97 Avenue 25 8
42 Al-Sfsafe 6 98 Avenue 26 6.5
43 Al-Kaltawi 6.5 99 Avenue 27 7.5
44 Al-Bayada 6.5 100 Avenue 28 7
45 Al-Kourani 5.5 101 Avenue 29 7
46 Al-Mawazine Market 5 102 Avenue 30 6.8
47 Al-Souika 5 103 Avenue 31 6.5
48 Al-Zahrawi 6 104 Avenue 32 6
49 Al-Adasi 6.3 105 Avenue 33 6
50 Souq 1 4 106 Bab Qinnesrin 7
51 Souq 2 4.5 107 Al-Souika 2 6
52 Souq 3 4 108 Avenue 34 5
53 Souq Bab Antakya 4 109 Avenue 35 5.5
54 Avenue 15 6.6 110 Avenue 36 5
55 Al-Bustan 6.5 111 Avenue 37 5
56 Al-Aasam 6.5 112 Avenue 38 5.5
Table 4. Shows the WCSS values that have been reached.
Number of Clusters (K) WCSS
1 1194
2 310.3
3 216.8
4 79.24
5 53.98
6 49.2
7 38.17
8 27.78
9 36.4
10 33
Disclaimer/Publisher’s Note: The statements, opinions and data contained in all publications are solely those of the individual author(s) and contributor(s) and not of MDPI and/or the editor(s). MDPI and/or the editor(s) disclaim responsibility for any injury to people or property resulting from any ideas, methods, instructions or products referred to in the content.
Copyright: This open access article is published under a Creative Commons CC BY 4.0 license, which permit the free download, distribution, and reuse, provided that the author and preprint are cited in any reuse.
Prerpints.org logo

Preprints.org is a free preprint server supported by MDPI in Basel, Switzerland.

Subscribe

© 2024 MDPI (Basel, Switzerland) unless otherwise stated