Submitted:
24 June 2024
Posted:
25 June 2024
You are already at the latest version
Abstract

Keywords:
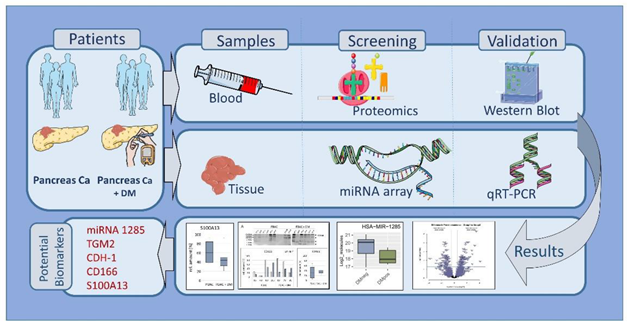
Graphical Abstract:
1. Introduction
2. Materials and Methods
2.1. Patient Recruitment and Sample Collection
2.2. Proteomics Screening Analysis
2.3. Differentiated miRNA Expression Analysis in Blood Plasma Samples
2.3.1. miRNA Extraction from Plasma
2.3.2. miRNA Quantification
2.3.3. miRNA Profiling Using a Takara Platform
2.4. miRNA Validation, cDNA Synthesis from Plasma Samples and Quantitative Real-Time PCR
2.5. Protein Targets of miRNA-1285 in the Literature
2.6. Tissue Lysis and Protein Expression Analysis with Western Blot for Protein Target Validation
2.7. Statistics and Calculations
3. Results
3.1. Patient Recruitment and Sample Collection
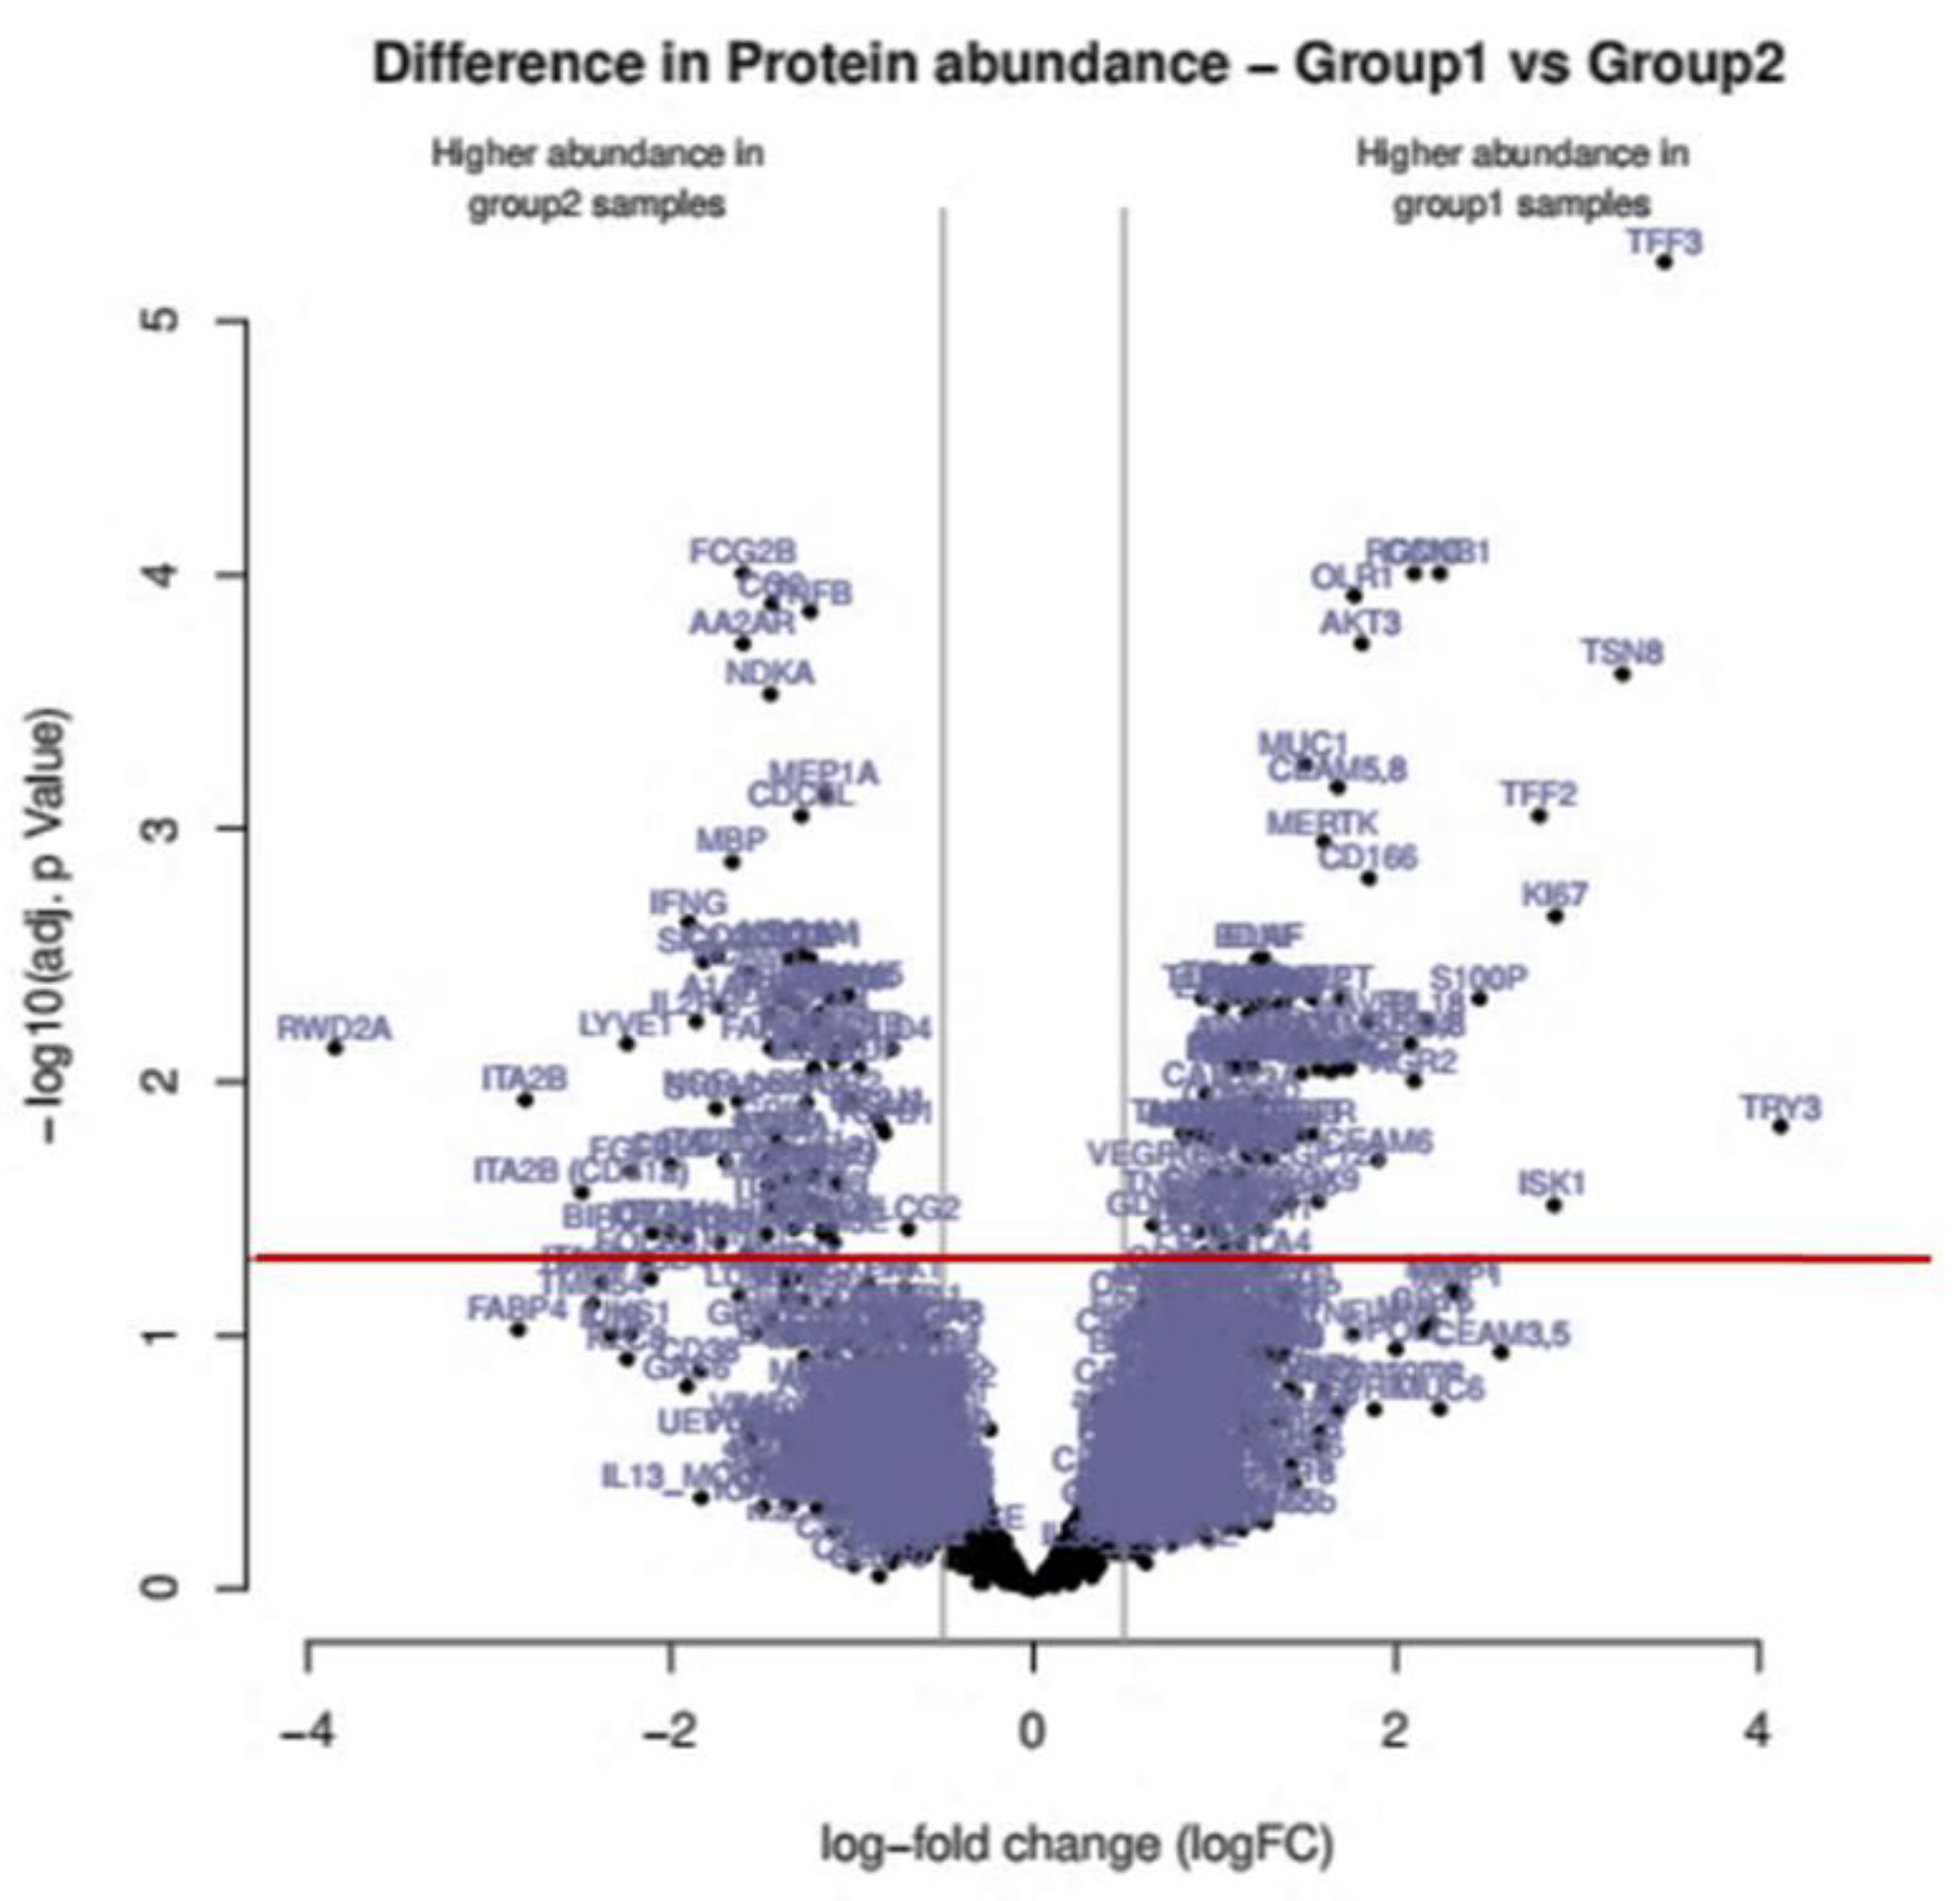
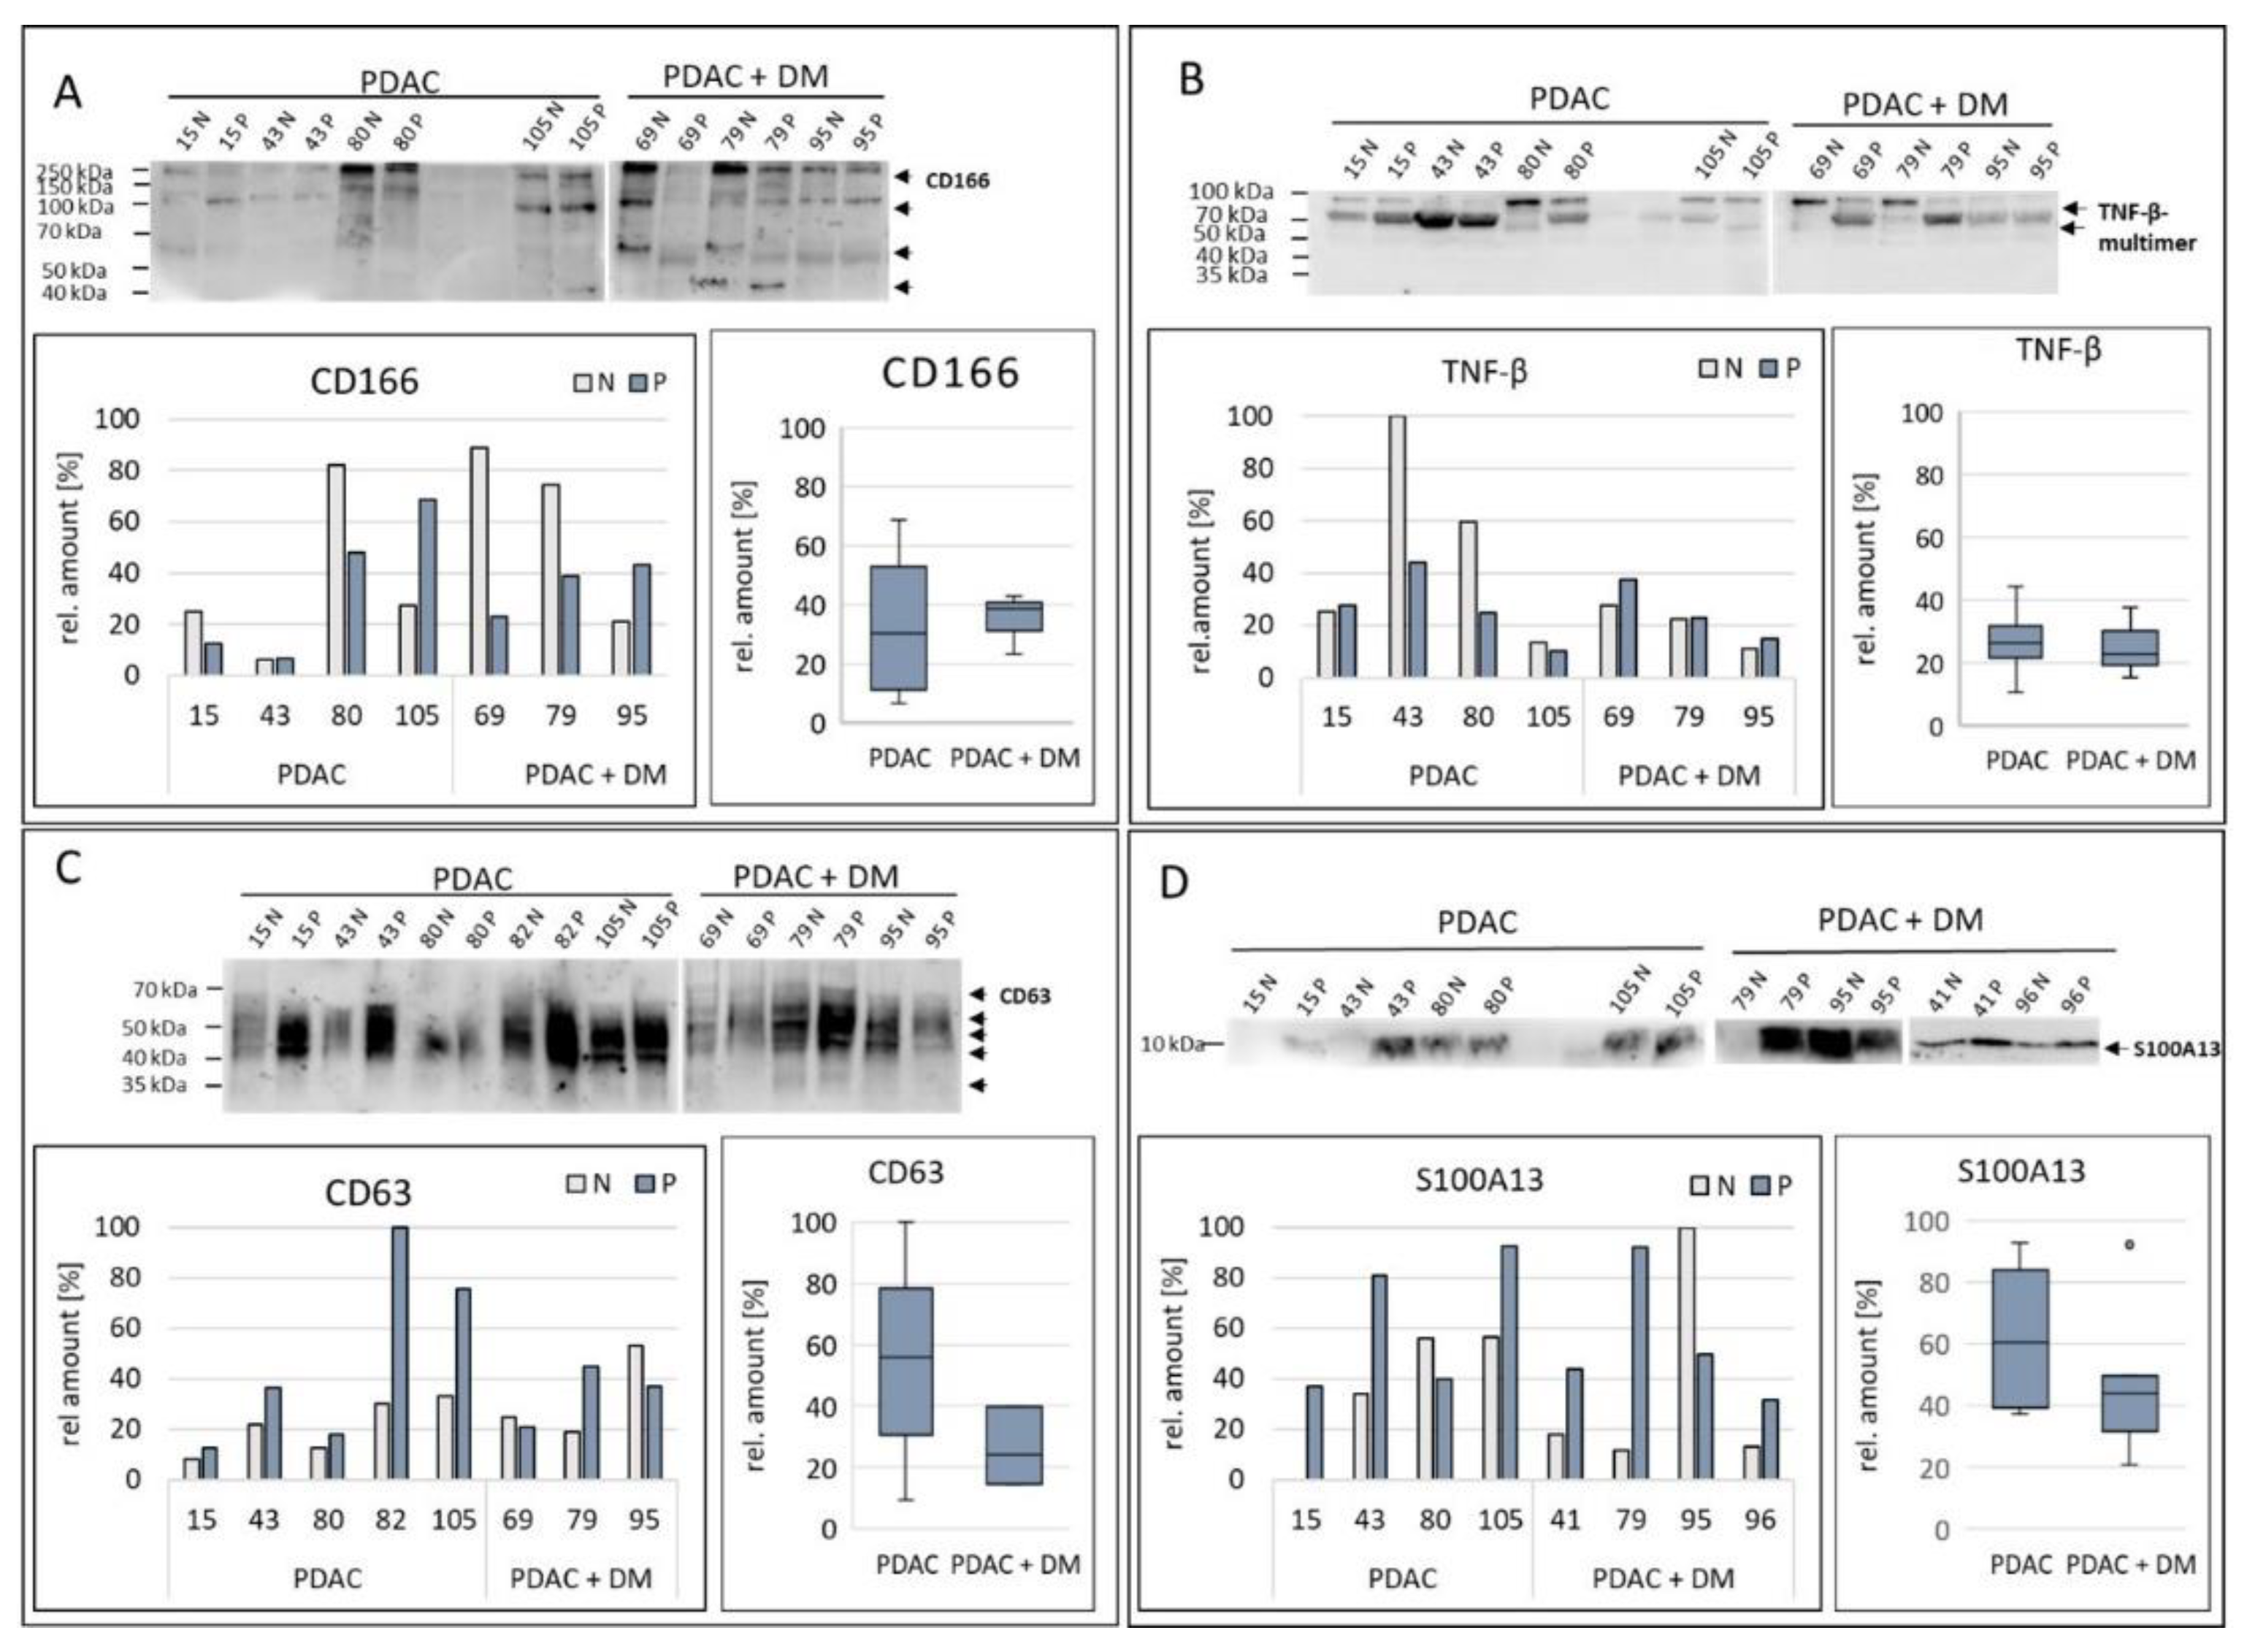
3.2. Proteomics Screening Analysis and Selection of Protein Targets for Validation
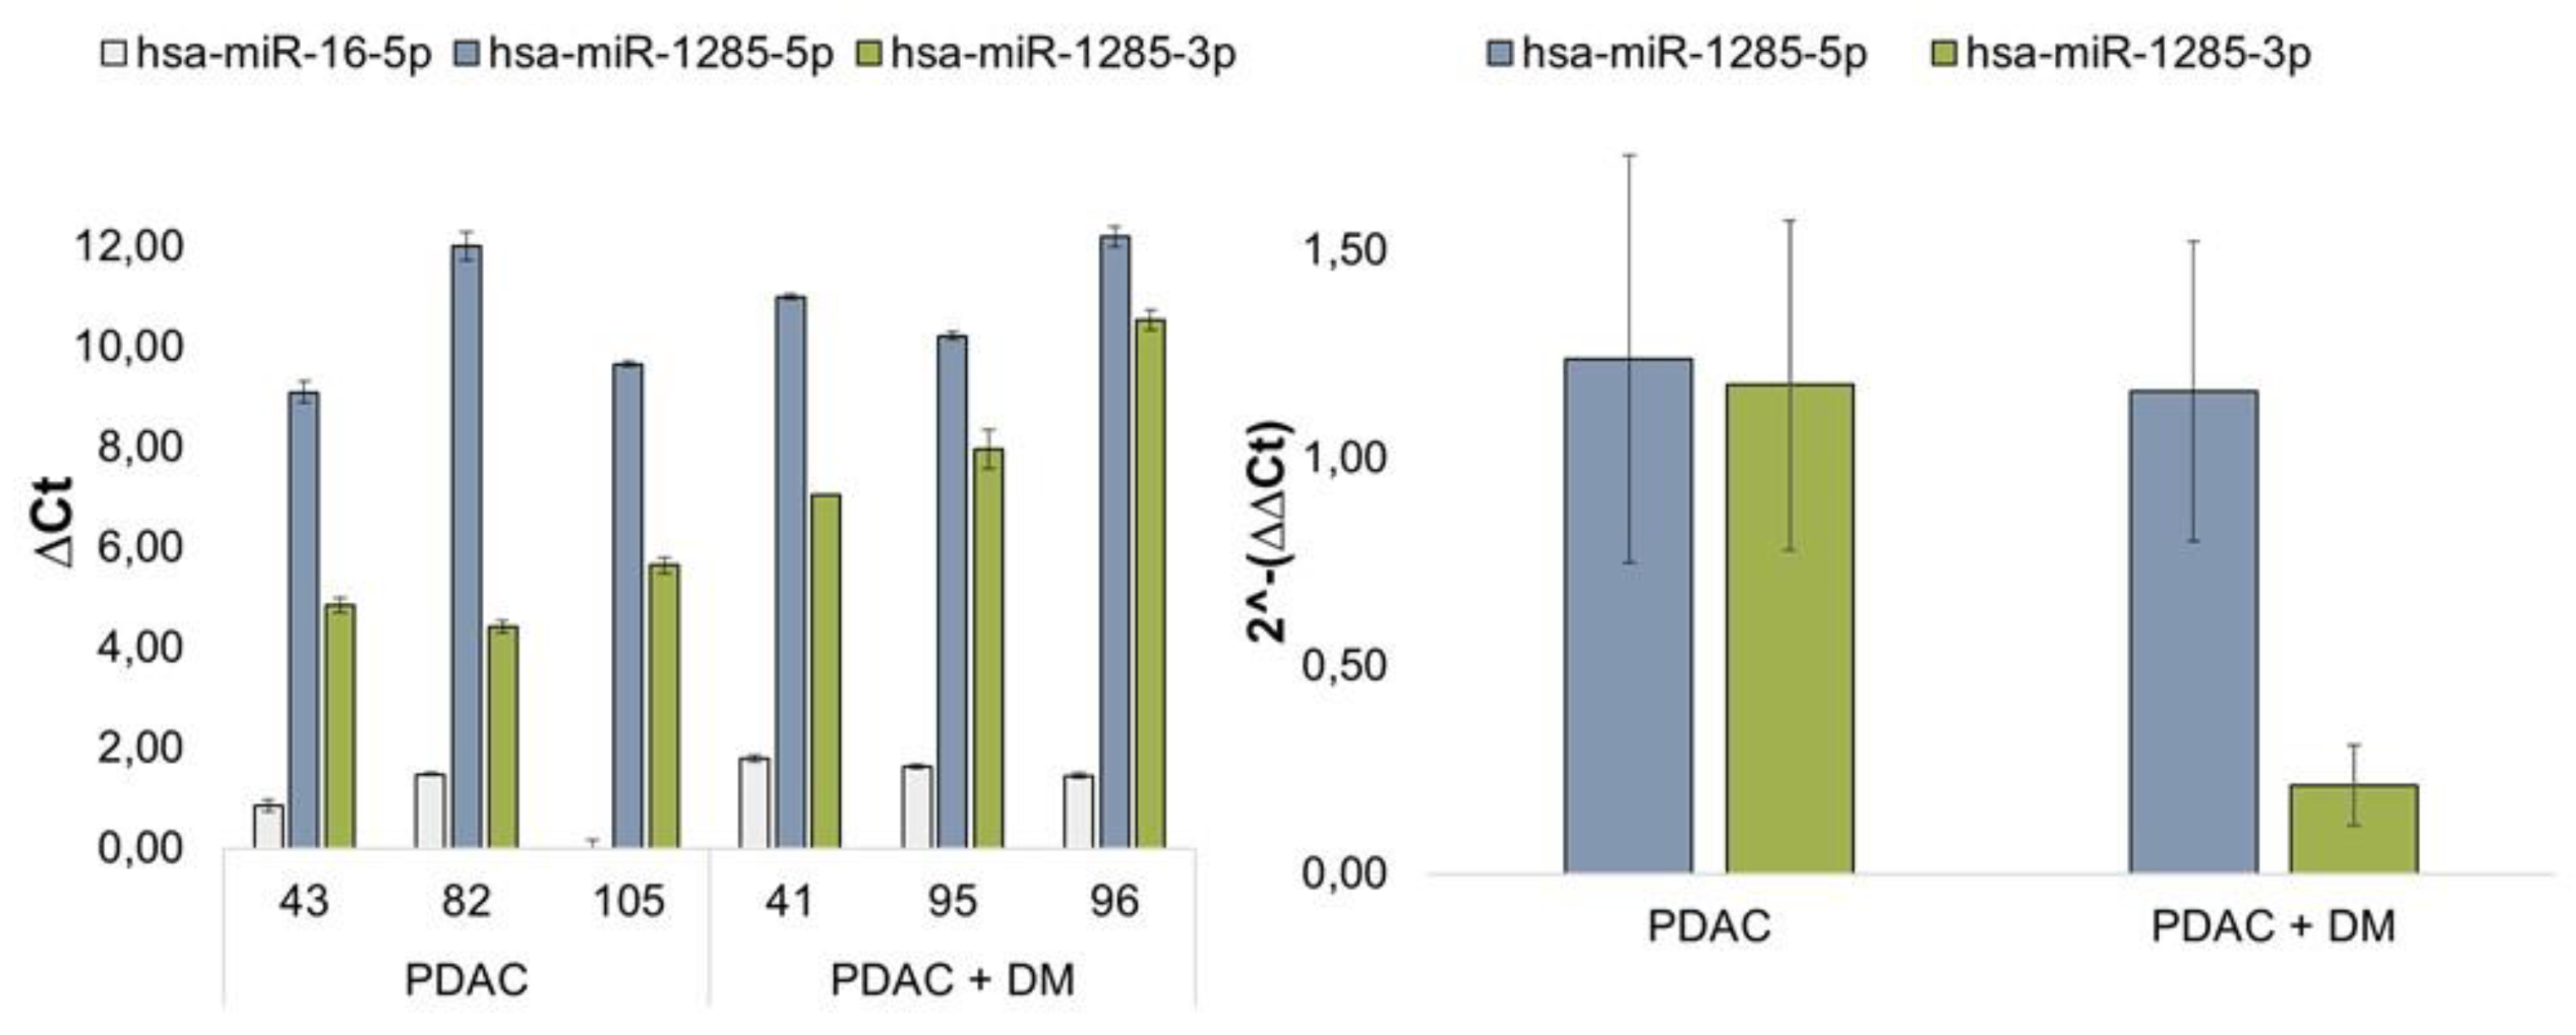
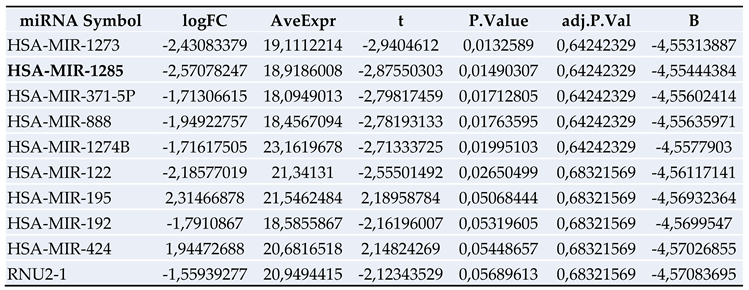
3.4. Results of miRNA Validation via qRT-PCR in Blood Plasma Samples of the Patient Collective
3.5. Results of Protein Validation/Target Protein Analysis in Tissue Samples Via Western Blot
4. Discussion
5. Conclusions
Supplementary Materials
Author Contributions
Funding
Institutional Review Board Statement
Informed Consent Statement
Data Availability Statement
Conflicts of Interest
References
- Quante AS, Ming C, Rottmann M, Engel J, Boeck S, Heinemann V, Westphalen CB, Strauch K: Projections of cancer incidence and cancer-related deaths in Germany by 2020 and 2030. Cancer medicine 2016, 5(9):2649-2656. [CrossRef]
- Iriana S, Ahmed S, Gong J, Annamalai AA, Tuli R, Hendifar AE: Targeting mTOR in Pancreatic Ductal Adenocarcinoma. Frontiers in oncology 2016, 6:99. [CrossRef]
- Jancik S, Drabek J, Radzioch D, Hajduch M: Clinical relevance of KRAS in human cancers. Journal of biomedicine & biotechnology 2010, 2010:150960. [CrossRef]
- Suda K, Tomizawa K, Mitsudomi T: Biological and clinical significance of KRAS mutations in lung cancer: an oncogenic driver that contrasts with EGFR mutation. Cancer metastasis reviews 2010, 29(1):49-60. [CrossRef]
- Hidalgo M: Pancreatic cancer. The New England journal of medicine 2010, 362(17):1605-1617.
- Populo H, Lopes JM, Soares P: The mTOR signalling pathway in human cancer. International journal of molecular sciences 2012, 13(2):1886-1918. [CrossRef]
- Mader S, Pantel K: Liquid Biopsy: Current Status and Future Perspectives. Oncology research and treatment 2017, 40(7-8):404-408. [CrossRef]
- Mellby LD, Nyberg AP, Johansen JS, Wingren C, Nordestgaard BG, Bojesen SE, Mitchell BL, Sheppard BC, Sears RC, Borrebaeck CAK: Serum Biomarker Signature-Based Liquid Biopsy for Diagnosis of Early-Stage Pancreatic Cancer. Journal of clinical oncology : official journal of the American Society of Clinical Oncology 2018, 36(28):2887-2894. [CrossRef]
- Andersen DK, Korc M, Petersen GM, Eibl G, Li D, Rickels MR, Chari ST, Abbruzzese JL: Diabetes, Pancreatogenic Diabetes, and Pancreatic Cancer. Diabetes 2017, 66(5):1103-1110. [CrossRef]
- Li D: Diabetes and pancreatic cancer. Molecular carcinogenesis 2012, 51(1):64-74. [CrossRef]
- Menini S, Iacobini C, Vitale M, Pesce C, Pugliese G: Diabetes and Pancreatic Cancer-A Dangerous Liaison Relying on Carbonyl Stress. Cancers 2021, 13(2). [CrossRef]
- Honselmann KC, Elser Y, Boeckmann T, Bolm L, Winkel MT, Deichmann S, Braun R, Wellner UF, Keck T, Lapshyn H: Recent onset diabetes is associated with better survival in pancreatic ductal adenocarcinoma-An analysis of preoperative symptoms within the DGAV StuDoQ|Pancreas Registry. Surgery 2023, 174(3):674-683. [CrossRef]
- Jian Z, Cheng T, Zhang Z, Raulefs S, Shi K, Steiger K, Maeritz N, Kleigrewe K, Hofmann T, Benitz S et al.: Glycemic Variability Promotes Both Local Invasion and Metastatic Colonization by Pancreatic Ductal Adenocarcinoma. Cellular and molecular gastroenterology and hepatology 2018, 6(4):429-449. [CrossRef]
- Pereira SP, Oldfield L, Ney A, Hart PA, Keane MG, Pandol SJ, Li D, Greenhalf W, Jeon CY, Koay EJ et al.: Early detection of pancreatic cancer. The lancet Gastroenterology & hepatology 2020, 5(7):698-710. [CrossRef]
- Tian F, Appert HE, Myles J, Howard JM: Prognostic value of serum CA 19-9 levels in pancreatic adenocarcinoma. Annals of surgery 1992, 215(4):350-355.
- Zhou S, Zhang Z, Zheng P, Zhao W, Han N: MicroRNA-1285-5p influences the proliferation and metastasis of non-small-cell lung carcinoma cells via downregulating CDH1 and Smad4. Tumour biology : the journal of the International Society for Oncodevelopmental Biology and Medicine 2017, 39(6):1010428317705513. [CrossRef]
- Liu J, Yan J, Zhou C, Ma Q, Jin Q, Yang Z: miR-1285-3p acts as a potential tumor suppressor miRNA via downregulating JUN expression in hepatocellular carcinoma. Tumour biology : the journal of the International Society for Oncodevelopmental Biology and Medicine 2015, 36(1):219-225. [CrossRef]
- Tian S, Huang S, Wu S, Guo W, Li J, He X: MicroRNA-1285 inhibits the expression of p53 by directly targeting its 3’ untranslated region. Biochemical and biophysical research communications 2010, 396(2):435-439. [CrossRef]
- Hidaka H, Seki N, Yoshino H, Yamasaki T, Yamada Y, Nohata N, Fuse M, Nakagawa M, Enokida H: Tumor suppressive microRNA-1285 regulates novel molecular targets: aberrant expression and functional significance in renal cell carcinoma. Oncotarget 2012, 3(1):44-57. [CrossRef]
- Huang H, Xiong G, Shen P, Cao Z, Zheng L, Zhang T, Zhao Y: MicroRNA-1285 inhibits malignant biological behaviors of human pancreatic cancer cells by negative regulation of YAP1. Neoplasma 2017, 64(3):358-366. [CrossRef]
- Hu XH, Dai J, Shang HL, Zhao ZX, Hao YD: miR-1285-3p is a potential prognostic marker in human osteosarcoma and functions as a tumor suppressor by targeting YAP1. Cancer biomarkers : section A of Disease markers 2019, 25(1):1-10. [CrossRef]
- Asnaghi L, Bruno P, Priulla M, Nicolin A: mTOR: a protein kinase switching between life and death. Pharmacological research 2004, 50(6):545-549. [CrossRef]
- Basso D, Fabris C, Del Favero G, Piccoli A, Angonese C, Pasquali C, Castoro C, Plebani M, Leandro G, Burlina A et al.: How does liver dysfunction influence serum CA 19-9 in pancreatic cancer? The Italian journal of gastroenterology 1990, 22(1):1-6.
- Narimatsu H, Iwasaki H, Nakayama F, Ikehara Y, Kudo T, Nishihara S, Sugano K, Okura H, Fujita S, Hirohashi S: Lewis and secretor gene dosages affect CA19-9 and DU-PAN-2 serum levels in normal individuals and colorectal cancer patients. Cancer research 1998, 58(3):512-518.
- Scara S, Bottoni P, Scatena R: CA 19-9: Biochemical and Clinical Aspects. Advances in experimental medicine and biology 2015, 867:247-260. [CrossRef]
- Rachdaoui N: Insulin: The Friend and the Foe in the Development of Type 2 Diabetes Mellitus. International journal of molecular sciences 2020, 21(5). [CrossRef]
- Wang CC, Goalstone ML, Draznin B: Molecular mechanisms of insulin resistance that impact cardiovascular biology. Diabetes 2004, 53(11):2735-2740. [CrossRef]
- D’Oria R, Laviola L, Giorgino F, Unfer V, Bettocchi S, Scioscia M: PKB/Akt and MAPK/ERK phosphorylation is highly induced by inositols: Novel potential insights in endothelial dysfunction in preeclampsia. Pregnancy hypertension 2017, 10:107-112. [CrossRef]
- Hart PA, Bellin MD, Andersen DK, Bradley D, Cruz-Monserrate Z, Forsmark CE, Goodarzi MO, Habtezion A, Korc M, Kudva YC et al.: Type 3c (pancreatogenic) diabetes mellitus secondary to chronic pancreatitis and pancreatic cancer. The lancet Gastroenterology & hepatology 2016, 1(3):226-237. [CrossRef]
- van Kempen LC, Nelissen JM, Degen WG, Torensma R, Weidle UH, Bloemers HP, Figdor CG, Swart GW: Molecular basis for the homophilic activated leukocyte cell adhesion molecule (ALCAM)-ALCAM interaction. The Journal of biological chemistry 2001, 276(28):25783-25790. [CrossRef]
- Sulaj A, Kopf S, Grone E, Grone HJ, Hoffmann S, Schleicher E, Haring HU, Schwenger V, Herzig S, Fleming T et al.: ALCAM a novel biomarker in patients with type 2 diabetes mellitus complicated with diabetic nephropathy. Journal of diabetes and its complications 2017, 31(6):1058-1065. [CrossRef]
- Hebron KE, Li EY, Arnold Egloff SA, von Lersner AK, Taylor C, Houkes J, Flaherty DK, Eskaros A, Stricker TP, Zijlstra A: Alternative splicing of ALCAM enables tunable regulation of cell-cell adhesion through differential proteolysis. Scientific reports 2018, 8(1):3208. [CrossRef]
- Amantini C, Morelli MB, Nabissi M, Piva F, Marinelli O, Maggi F, Bianchi F, Bittoni A, Berardi R, Giampieri R et al.: Expression Profiling of Circulating Tumor Cells in Pancreatic Ductal Adenocarcinoma Patients: Biomarkers Predicting Overall Survival. Frontiers in oncology 2019, 9:874. [CrossRef]
- Kahlert C, Weber H, Mogler C, Bergmann F, Schirmacher P, Kenngott HG, Matterne U, Mollberg N, Rahbari NN, Hinz U et al.: Increased expression of ALCAM/CD166 in pancreatic cancer is an independent prognostic marker for poor survival and early tumour relapse. British journal of cancer 2009, 101(3):457-464. [CrossRef]
- Hong X, Michalski CW, Kong B, Zhang W, Raggi MC, Sauliunaite D, De Oliveira T, Friess H, Kleeff J: ALCAM is associated with chemoresistance and tumor cell adhesion in pancreatic cancer. Journal of surgical oncology 2010, 101(7):564-569. [CrossRef]
- Miao S, Qiu T, Zhao Y, Wang H, Sun X, Wang Y, Xuan Y, Qin Y, Jiao W: Overexpression of S100A13 protein is associated with tumor angiogenesis and poor survival in patients with early-stage non-small cell lung cancer. Thoracic cancer 2018, 9(9):1136-1144. [CrossRef]
- Massi D, Landriscina M, Piscazzi A, Cosci E, Kirov A, Paglierani M, Di Serio C, Mourmouras V, Fumagalli S, Biagioli M et al.: S100A13 is a new angiogenic marker in human melanoma. Modern pathology : an official journal of the United States and Canadian Academy of Pathology, Inc 2010, 23(6):804-813. [CrossRef]
- Landriscina M, Schinzari G, Di Leonardo G, Quirino M, Cassano A, D’Argento E, Lauriola L, Scerrati M, Prudovsky I, Barone C: S100A13, a new marker of angiogenesis in human astrocytic gliomas. Journal of neuro-oncology 2006, 80(3):251-259. [CrossRef]
- Fagerberg L, Hallstrom BM, Oksvold P, Kampf C, Djureinovic D, Odeberg J, Habuka M, Tahmasebpoor S, Danielsson A, Edlund K et al.: Analysis of the human tissue-specific expression by genome-wide integration of transcriptomics and antibody-based proteomics. Molecular & cellular proteomics : MCP 2014, 13(2):397-406. [CrossRef]
- Li HB, Wang JL, Jin XD, Zhao L, Ye HL, Kuang YB, Ma Y, Jiang XY, Yu ZY: Comprehensive analysis of the transcriptional expressions and prognostic value of S100A family in pancreatic ductal adenocarcinoma. BMC cancer 2021, 21(1):1039. [CrossRef]
- Li T, Xu Y, Shi Y, Chen J, Lin S, Zhu J, Xu X, Lu L, Zou H: Genome-wide analysis of DNA methylation identifies S100A13 as an epigenetic biomarker in individuals with chronic (>/= 30 years) type 2 diabetes without diabetic retinopathy. Clinical epigenetics 2020, 12(1):77. [CrossRef]
- Justo BL, Jasiulionis MG: Characteristics of TIMP1, CD63, and beta1-Integrin and the Functional Impact of Their Interaction in Cancer. International journal of molecular sciences 2021, 22(17). [CrossRef]
- Khushman M, Bhardwaj A, Patel GK, Laurini JA, Roveda K, Tan MC, Patton MC, Singh S, Taylor W, Singh AP: Exosomal Markers (CD63 and CD9) Expression Pattern Using Immunohistochemistry in Resected Malignant and Nonmalignant Pancreatic Specimens. Pancreas 2017, 46(6):782-788. [CrossRef]
- Uhlen M, Zhang C, Lee S, Sjostedt E, Fagerberg L, Bidkhori G, Benfeitas R, Arif M, Liu Z, Edfors F et al.: A pathology atlas of the human cancer transcriptome. Science 2017, 357(6352). [CrossRef]
- Sandstrom A, Andersson R, Segersvard R, Lohr M, Borrebaeck CA, Wingren C: Serum proteome profiling of pancreatitis using recombinant antibody microarrays reveals disease-associated biomarker signatures. Proteomics Clinical applications 2012, 6(9-10):486-496. [CrossRef]
- Bayraktar R, Van Roosbroeck K, Calin GA: Cell-to-cell communication: microRNAs as hormones. Molecular oncology 2017, 11(12):1673-1686. [CrossRef]
- Costa-Silva B, Aiello NM, Ocean AJ, Singh S, Zhang H, Thakur BK, Becker A, Hoshino A, Mark MT, Molina H et al.: Pancreatic cancer exosomes initiate pre-metastatic niche formation in the liver. Nature cell biology 2015, 17(6):816-826. [CrossRef]
- Montani F, Bianchi F: Circulating Cancer Biomarkers: The Macro-revolution of the Micro-RNA. EBioMedicine 2016, 5:4-6. [CrossRef]
- Minciacchi VR, Freeman MR, Di Vizio D: Extracellular vesicles in cancer: exosomes, microvesicles and the emerging role of large oncosomes. Seminars in cell & developmental biology 2015, 40:41-51. [CrossRef]
- Hu X, Wang J, He W, Zhao P, Ye C: MicroRNA-433 targets AKT3 and inhibits cell proliferation and viability in breast cancer. Oncology letters 2018, 15(3):3998-4004. [CrossRef]
- Ding XM: MicroRNAs: regulators of cancer metastasis and epithelial-mesenchymal transition (EMT). Chinese journal of cancer 2014, 33(3):140-147. [CrossRef]
- Tian F, Shen Y, Chen Z, Li R, Ge Q: No Significant Difference between Plasma miRNAs and Plasma-Derived Exosomal miRNAs from Healthy People. BioMed research international 2017, 2017:1304816. [CrossRef]
- Meerson A, Ploug T: Assessment of six commercial plasma small RNA isolation kits using qRT-PCR and electrophoretic separation: higher recovery of microRNA following ultracentrifugation. Biology methods & protocols 2016, 1(1):bpw003. [CrossRef]
- Zhao B, Wei X, Li W, Udan RS, Yang Q, Kim J, Xie J, Ikenoue T, Yu J, Li L et al.: Inactivation of YAP oncoprotein by the Hippo pathway is involved in cell contact inhibition and tissue growth control. Genes & development 2007, 21(21):2747-2761. [CrossRef]
- Zhao B, Ye X, Yu J, Li L, Li W, Li S, Yu J, Lin JD, Wang CY, Chinnaiyan AM et al.: TEAD mediates YAP-dependent gene induction and growth control. Genes & development 2008, 22(14):1962-1971. [CrossRef]
- Dong J, Feldmann G, Huang J, Wu S, Zhang N, Comerford SA, Gayyed MF, Anders RA, Maitra A, Pan D: Elucidation of a universal size-control mechanism in Drosophila and mammals. Cell 2007, 130(6):1120-1133. [CrossRef]
- Salcedo Allende MT, Zeron-Medina J, Hernandez J, Macarulla T, Balsells J, Merino X, Allende H, Tabernero J, Ramon YCS: Overexpression of Yes Associated Protein 1, an Independent Prognostic Marker in Patients With Pancreatic Ductal Adenocarcinoma, Correlated With Liver Metastasis and Poor Prognosis. Pancreas 2017, 46(7):913-920. [CrossRef]
- Zhang Q, Zhang Y, Parsels JD, Lohse I, Lawrence TS, Pasca di Magliano M, Sun Y, Morgan MA: Fbxw7 Deletion Accelerates Kras(G12D)-Driven Pancreatic Tumorigenesis via Yap Accumulation. Neoplasia 2016, 18(11):666-673. [CrossRef]
- Murakami S, Nemazanyy I, White SM, Chen H, Nguyen CDK, Graham GT, Saur D, Pende M, Yi C: A Yap-Myc-Sox2-p53 Regulatory Network Dictates Metabolic Homeostasis and Differentiation in Kras-Driven Pancreatic Ductal Adenocarcinomas. Developmental cell 2019, 51(1):113-128 e119. [CrossRef]
- Murakami S, Shahbazian D, Surana R, Zhang W, Chen H, Graham GT, White SM, Weiner LM, Yi C: Yes-associated protein mediates immune reprogramming in pancreatic ductal adenocarcinoma. Oncogene 2017, 36(9):1232-1244. [CrossRef]
- Ortillon J, Le Bail JC, Villard E, Leger B, Poirier B, Girardot C, Beeske S, Ledein L, Blanchard V, Brieu P et al.: High Glucose Activates YAP Signaling to Promote Vascular Inflammation. Frontiers in physiology 2021, 12:665994. [CrossRef]
- Rauscher FJ, 3rd, Cohen DR, Curran T, Bos TJ, Vogt PK, Bohmann D, Tjian R, Franza BR, Jr.: Fos-associated protein p39 is the product of the jun proto-oncogene. Science 1988, 240(4855):1010-1016. [CrossRef]
- Lamph WW, Wamsley P, Sassone-Corsi P, Verma IM: Induction of proto-oncogene JUN/AP-1 by serum and TPA. Nature 1988, 334(6183):629-631. [CrossRef]
- Serna R, Ramrakhiani A, Hernandez JC, Chen CL, Nakagawa C, Machida T, Ray RB, Zhan X, Tahara SM, Machida K: c-JUN inhibits mTORC2 and glucose uptake to promote self-renewal and obesity. iScience 2022, 25(6):104325. [CrossRef]
- Levine AJ, Oren M: The first 30 years of p53: growing ever more complex. Nature reviews Cancer 2009, 9(10):749-758. [CrossRef]
- Wang S, Zheng Y, Yang F, Zhu L, Zhu XQ, Wang ZF, Wu XL, Zhou CH, Yan JY, Hu BY et al.: The molecular biology of pancreatic adenocarcinoma: translational challenges and clinical perspectives. Signal transduction and targeted therapy 2021, 6(1):249. [CrossRef]
- Maddalena M, Mallel G, Nataraj NB, Shreberk-Shaked M, Hassin O, Mukherjee S, Arandkar S, Rotkopf R, Kapsack A, Lambiase G et al.: TP53 missense mutations in PDAC are associated with enhanced fibrosis and an immunosuppressive microenvironment. Proceedings of the National Academy of Sciences of the United States of America 2021, 118(23). [CrossRef]
- Kung CP, Murphy ME: The role of the p53 tumor suppressor in metabolism and diabetes. The Journal of endocrinology 2016, 231(2):R61-R75. [CrossRef]
- Pertz O, Bozic D, Koch AW, Fauser C, Brancaccio A, Engel J: A new crystal structure, Ca2+ dependence and mutational analysis reveal molecular details of E-cadherin homoassociation. The EMBO journal 1999, 18(7):1738-1747. [CrossRef]
- Frixen UH, Behrens J, Sachs M, Eberle G, Voss B, Warda A, Lochner D, Birchmeier W: E-cadherin-mediated cell-cell adhesion prevents invasiveness of human carcinoma cells. The Journal of cell biology 1991, 113(1):173-185. [CrossRef]
- Siret C, Dobric A, Martirosyan A, Terciolo C, Germain S, Bonier R, Dirami T, Dusetti N, Tomasini R, Rubis M et al.: Cadherin-1 and cadherin-3 cooperation determines the aggressiveness of pancreatic ductal adenocarcinoma. British journal of cancer 2018, 118(4):546-557. [CrossRef]
- Maftouh M, Avan A, Sciarrillo R, Granchi C, Leon LG, Rani R, Funel N, Smid K, Honeywell R, Boggi U et al.: Synergistic interaction of novel lactate dehydrogenase inhibitors with gemcitabine against pancreatic cancer cells in hypoxia. British journal of cancer 2014, 110(1):172-182. [CrossRef]
- Facchiano F, Facchiano A, Facchiano AM: The role of transglutaminase-2 and its substrates in human diseases. Frontiers in bioscience : a journal and virtual library 2006, 11:1758-1773.
- Cheung W, Darfler MM, Alvarez H, Hood BL, Conrads TP, Habbe N, Krizman DB, Mollenhauer J, Feldmann G, Maitra A: Application of a global proteomic approach to archival precursor lesions: deleted in malignant brain tumors 1 and tissue transglutaminase 2 are upregulated in pancreatic cancer precursors. Pancreatology : official journal of the International Association of Pancreatology 2008, 8(6):608-616. [CrossRef]
- Iacobuzio-Donahue CA, Ashfaq R, Maitra A, Adsay NV, Shen-Ong GL, Berg K, Hollingsworth MA, Cameron JL, Yeo CJ, Kern SE et al.: Highly expressed genes in pancreatic ductal adenocarcinomas: a comprehensive characterization and comparison of the transcription profiles obtained from three major technologies. Cancer research 2003, 63(24):8614-8622.
- Verma A, Wang H, Manavathi B, Fok JY, Mann AP, Kumar R, Mehta K: Increased expression of tissue transglutaminase in pancreatic ductal adenocarcinoma and its implications in drug resistance and metastasis. Cancer research 2006, 66(21):10525-10533. [CrossRef]

| Sample | Age | Gender | BMI | Histology | DM | HbA1C | CA 19-9 |
|---|---|---|---|---|---|---|---|
| 43 | 78 | m | 32,7 | PDAC (no resection) | y, insulin dependent | 11,3 | 10974 |
| 68 | 77 | m | 29,7 | PDAC (no resection) | y (notknownpre-OP) | 6,9 | 719 |
| 35 | 69 | f | 25,2 | PDAC (no resection) | y, insulin dependent | 9,8 | 1248 |
| 87 | 80 | f | 26,6 | PDAC (no resection) | y, insulin dependent | 8,1 | 1803 |
| 66 | 79 | m | 24,3 | PDAC (no resection) | n | 5,6 | 726,8 |
| 40 | 59 | m | 27,7 | PDAC (no resection) | y, insulin independent | 7,3 | 1294 |
| 42 | 73 | m | 22,4 | PDAC (no resection) | n | 5,7 | 599,6 |
| 36 | 61 | f | 25,1 | PDAC (no resection) | n | 5,8 | 601,8 |
| 8 | 76 | m | 22,6 | PDAC (resected) | n | 4,7 | 256,6 |
| 78 | 81 | m | 36,4 | PDAC (resected) | n | 5,1 | 84,3 |
| 82 | 82 | m | 22 | PDAC (resected) | n | 5,1 | 118,9 |
| 71 | 73 | m | 28,7 | PDAC (resected) | y, insulin dependent | 6,2 | 189,4 |
| 79 | 70 | m | 32,3 | PDAC (resected) | y, insulin dependent | 9,7 | 3340 |
| 69 | 64 | m | 31,2 | PDAC (resected) | y, insulin dependent | 7,6 | 1147 |
| 44 | 62 | m | 27,8 | PDAC (resected) | n | 5,4 | 17,3 |
| 80 | 82 | f | 27,3 | PDAC (resected) | n | 5,9 | 247,3 |
| 95 | 69 | m | 20 | PDAC (resected) | y, insulin dependent | 6,2 | 0,6 |
| 105 | 73 | f | 19,3 | PDAC (resected) | n | 6,1 | 368,3 |
| 99 | 80 | f | 20,3 | PDAC (resected) | n | 6 | 1289 |
| 51 | 63 | f | 20,2 | PDAC (resected) | n | 4,9 | 335,5 |
| 62 | 75 | f | 23,4 | PDAC (resected) | n | 5,2 | 24,9 |
| 80 | 82 | f | 29,4 | PDAC (resected) | n | 4,1 | 3917 |
| 15 | 78 | f | 25,6 | PDAC (resected) | n | 6,2 | 208,6 |
| 41 | 75 | f | 27,6 | PDAC (resected) | y, insulin independent | 7,6 | 127,4 |
| 86 | 58 | f | 27,9 | PDAC (resected) | n | 6 | 218,4 |
| 96 | 55 | f | 36,1 | PDAC (resected) | y, insulin independent | 5,3 | 1 |
| 43 | 78 | f | 23 | PDAC (resected) | n | 5,9 | 211,3 |
| 29 | 61 | m | 24,5 | chronic pancreatitis | n | 5,6 | 9,5 |
| 1 | 57 | m | 32 | chronic pancreatitis | y, insulin dependent | 7,6 | 11 |
| 100 | 35 | m | 29,6 | chronic pancreatitis | y, insulin dependent | 9,9 | 9,8 |
| 89 | 61 | m | 26,8 | chronic pancreatitis | y, insulin independent | 7,6 | 5,2 |
| 88 | 44 | f | 22,1 | chronic pancreatitis | y, insulin independent | 6,6 | 45,5 |
| 56 | 45 | f | 13,9 | chronic pancreatitis | n | 4,7 | 17 |
| 76 | 69 | f | 27,5 | chronic pancreatitis | y, insulin independent | 5,7 | - |
| 52 | 33 | f | 22 | chronic pancreatitis | n | 5,6 | <0,6 |
| 67 | 78 | f | 27,1 | chronic pancreatitis | n | 6,4 | 9,3 |
| 9 | 71 | f | 25,3 | chronic pancreatitis | y, insulin dependent | 7,620,6 | |
| 85 | 65 | m | 27,7 | distal CCC | y, insulin independent | 6,9 | 32,1 |
| 58 | 74 | m | 32,7 | distal CCC | n | 5,1 | 64,3 |
| 24 | 81 | m | 23,9 | distal CCC | n | 5,4 | 85,7 |
| 73 | 78 | m | 27,7 | distal CCC | n | 5,3 | 8 |
| 53 | 68 | m | 23,2 | distal CCC | n | 5,9 | 76 |
| 93 | 77 | m | 24 | distal CCC | n | 5,6 | 159 |
| 75 | 74 | f | 27,7 | NET Pancreas | n | 5,4 | 5,8 |
| Pathway ID | Pathway Description | Protein Count | |
|---|---|---|---|
| 1 | hsa05200 | Pathways in cancer | 29 |
| 2 | hsa04060 | Cytokine-cytokine receptor interaction | 22 |
| 3 | hsa04151 | PI3K-Akt signaling pathway | 16 |
| 4 | hsa05418 | Fluid shear stress and atherosclerosis | 14 |
| 5 | hsa04514 | Cell adhesion molecules (CAMs) | 14 |
| 6 | hsa05205 | Proteoglycans in cancer | 13 |
| 7 | hsa04010 | MAPK signaling pathway | 13 |
| 8 | hsa05225 | Hepatocellular carcinoma | 12 |
| 9 | hsa04015 | Rap1 signaling pathway | 12 |
| 10 | hsa04380 | Osteoclast differentiation | 11 |
| 11 | hsa04630 | Jak-STAT signaling pathway | 11 |
| 12 | hsa05152 | Tuberculosis | 11 |
| 13 | hsa04014 | Ras signaling pathway | 11 |
| 14 | hsa04640 | Hematopoietic cell lineage | 10 |
| 15 | hsa05161 | Hepatitis B | 10 |
| 16 | hsa05226 | Gastric cancer | 10 |
| 17 | hsa05223 | Non-small cell lung cancer | 9 |
| 18 | hsa05218 | Melanoma | 9 |
| 19 | hsa04933 | AGE-RAGE signaling pathway in diabetic complications9 | |
| 20 | hsa05162 | Measles | 9 |
| 21 | hsa05166 | HTLV-I infection | 9 |
| 22 | hsa05165 | Human papillomavirus infection | 9 |
| 23 | hsa05214 | Glioma | 8 |
| 24 | hsa05212 | Pancreatic cancer | 8 |
| 25 | hsa05222 | Small cell lung cancer | 8 |
| Protein | Regulation PDAC + DM | Potential Validation Method |
|---|---|---|
| BDNF | ↑ | WB |
| CD166 | ↑ | WB |
| CD63 | ↑ | WB |
| CXCL13 | ↑ | WB |
| CXCL16 | ↑ | WB |
| S100A13 | ↓ | WB |
| TNF-β | ↓ | WB |

| miR-Variant | Effect | Tumor Entity | Protein Target | Reference |
|---|---|---|---|---|
| miR1285-3p | Tumor suppressor | HCC | Jun ↓ | (Liu et al. 2015) |
| Tumor promoter | Neuroblastoma Hepatoblastoma Mamma carcinoma |
p53 ↓ | (Tian et al. 2010) | |
| Tumor suppressor | RCC | TGM2 ↓ | (Hidaka et al. 2012) | |
| Tumor suppressor | PDAC OS |
YAP ↓ | (Huang et al. 2017) (Hu et al. 2019) |
|
| miR-1285-5p | Tumor promoter | NSCLC | CDH-1 ↓ Smad4 ↓ |
(Zhou et al. 2017) |
Disclaimer/Publisher’s Note: The statements, opinions and data contained in all publications are solely those of the individual author(s) and contributor(s) and not of MDPI and/or the editor(s). MDPI and/or the editor(s) disclaim responsibility for any injury to people or property resulting from any ideas, methods, instructions or products referred to in the content. |
© 2024 by the authors. Licensee MDPI, Basel, Switzerland. This article is an open access article distributed under the terms and conditions of the Creative Commons Attribution (CC BY) license (http://creativecommons.org/licenses/by/4.0/).


