Submitted:
24 June 2024
Posted:
25 June 2024
You are already at the latest version
Abstract
Keywords:
Introduction
Methods
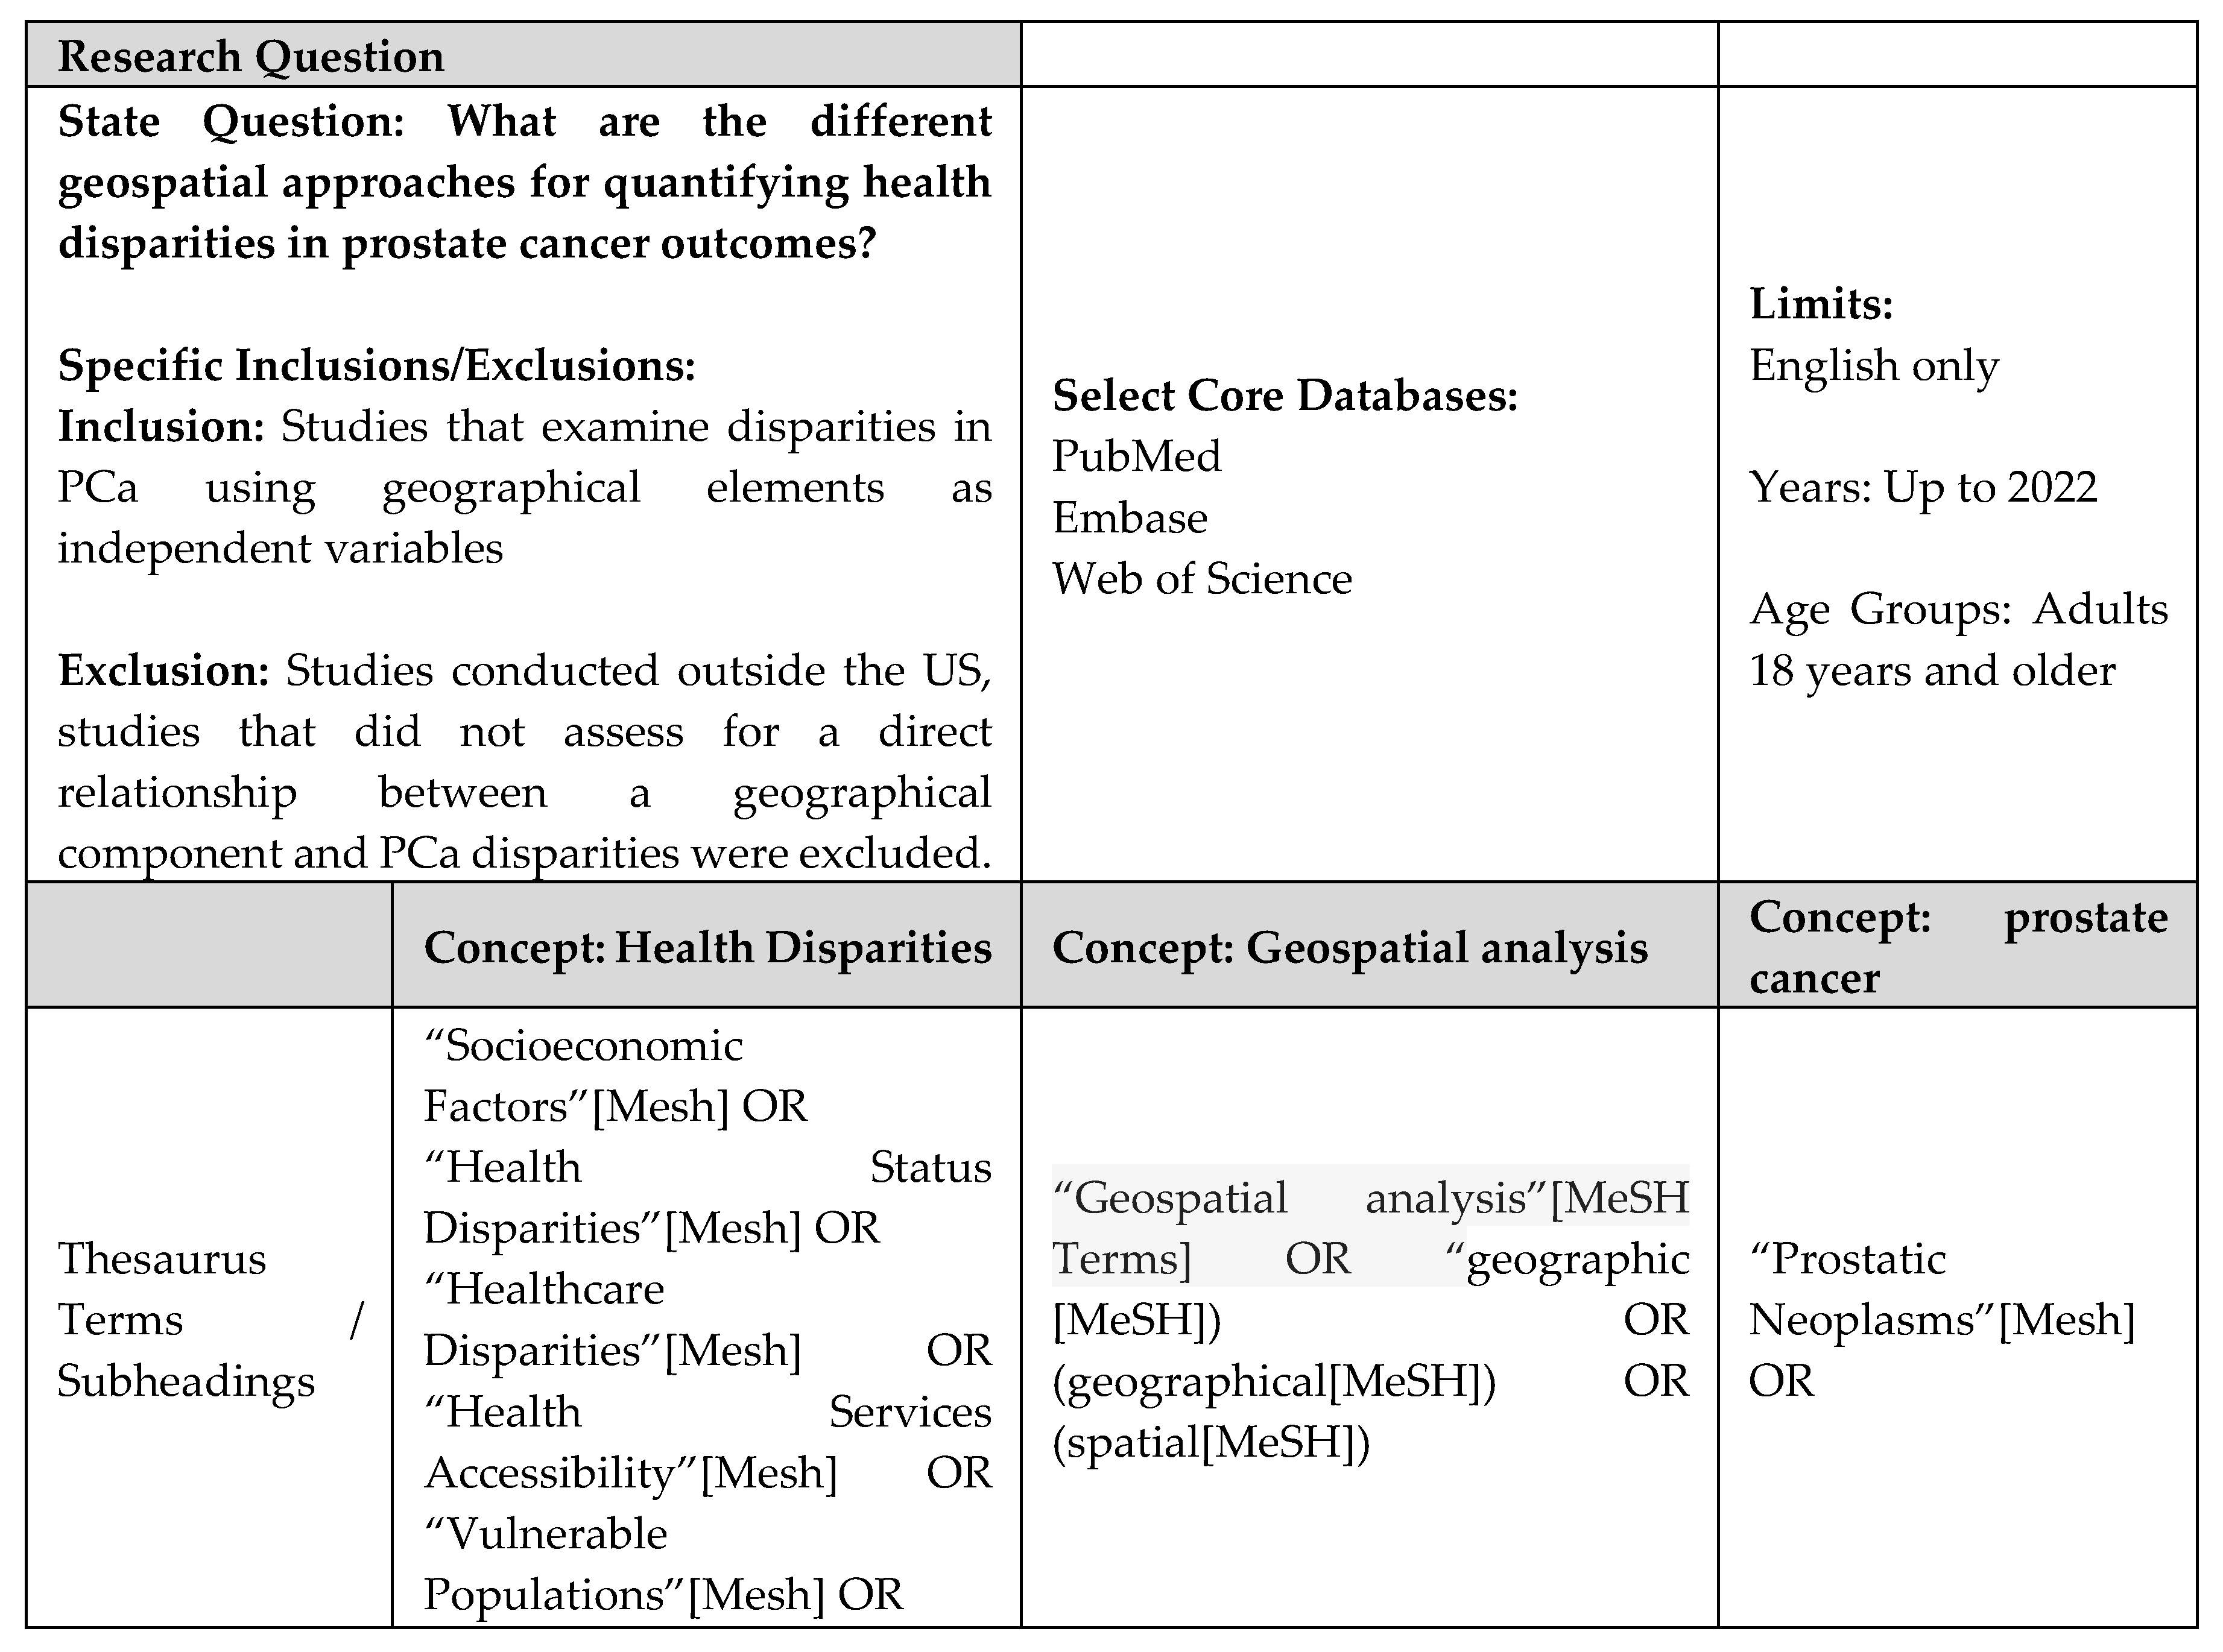
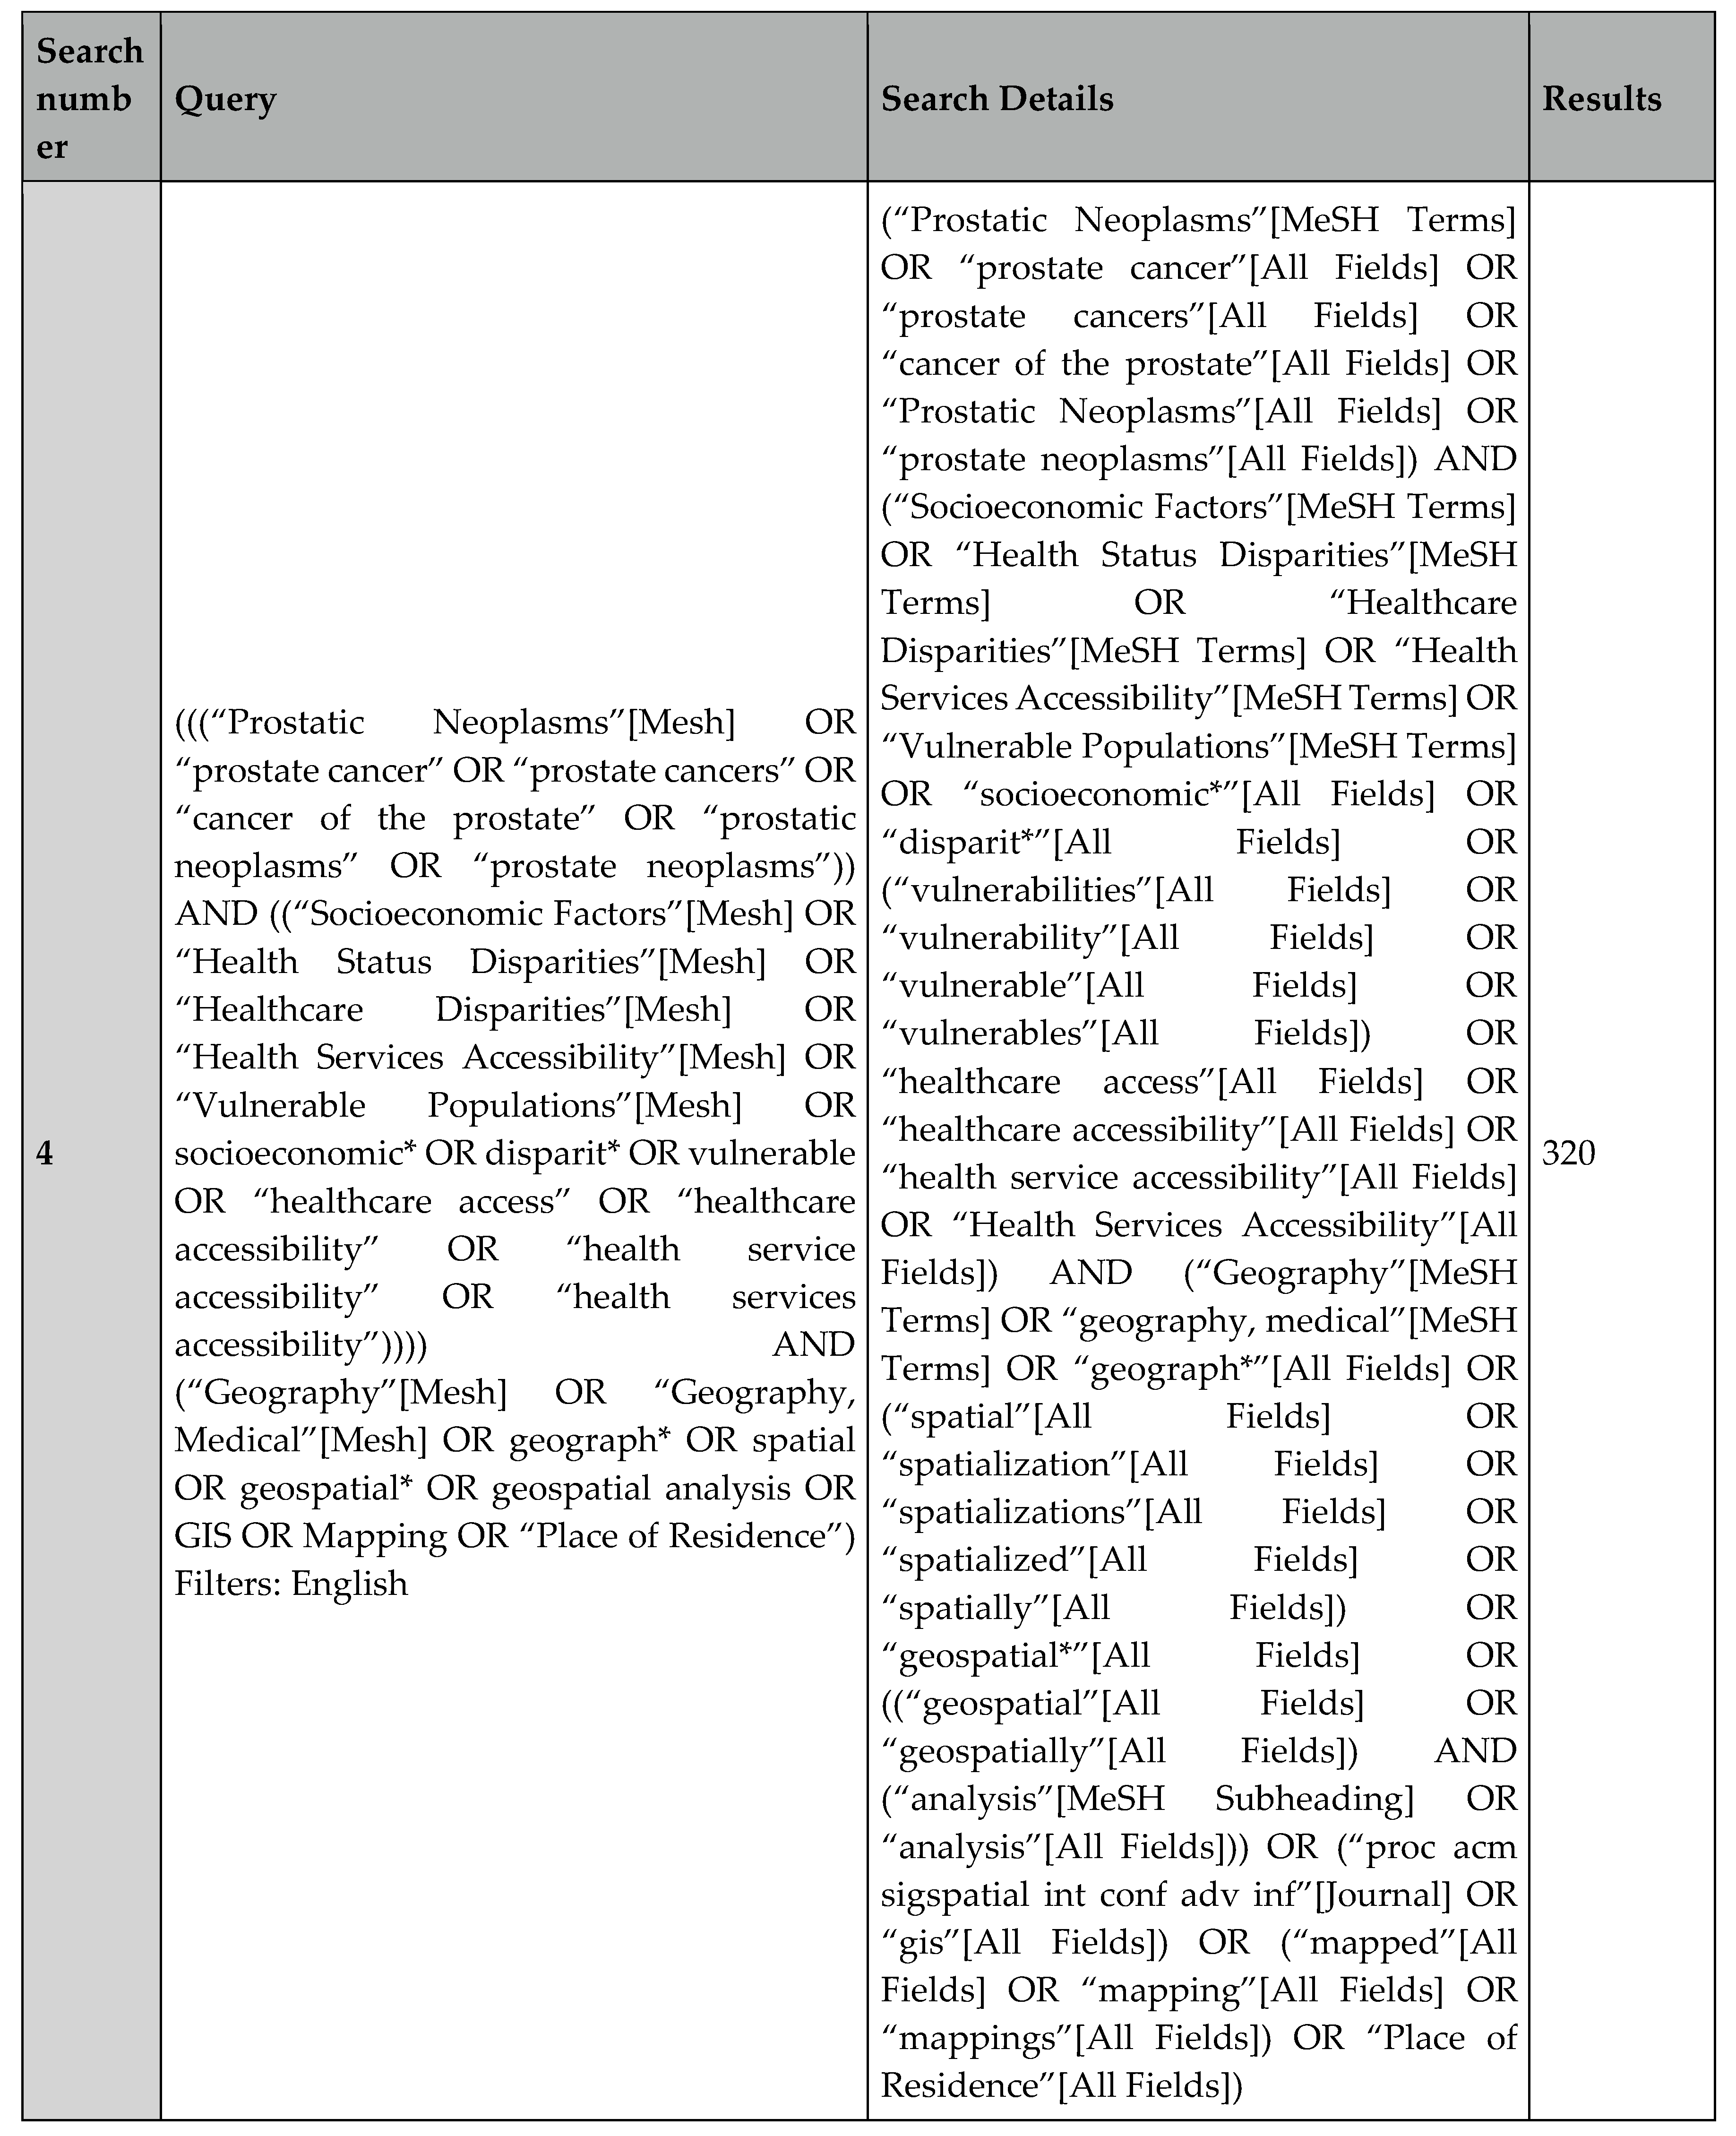
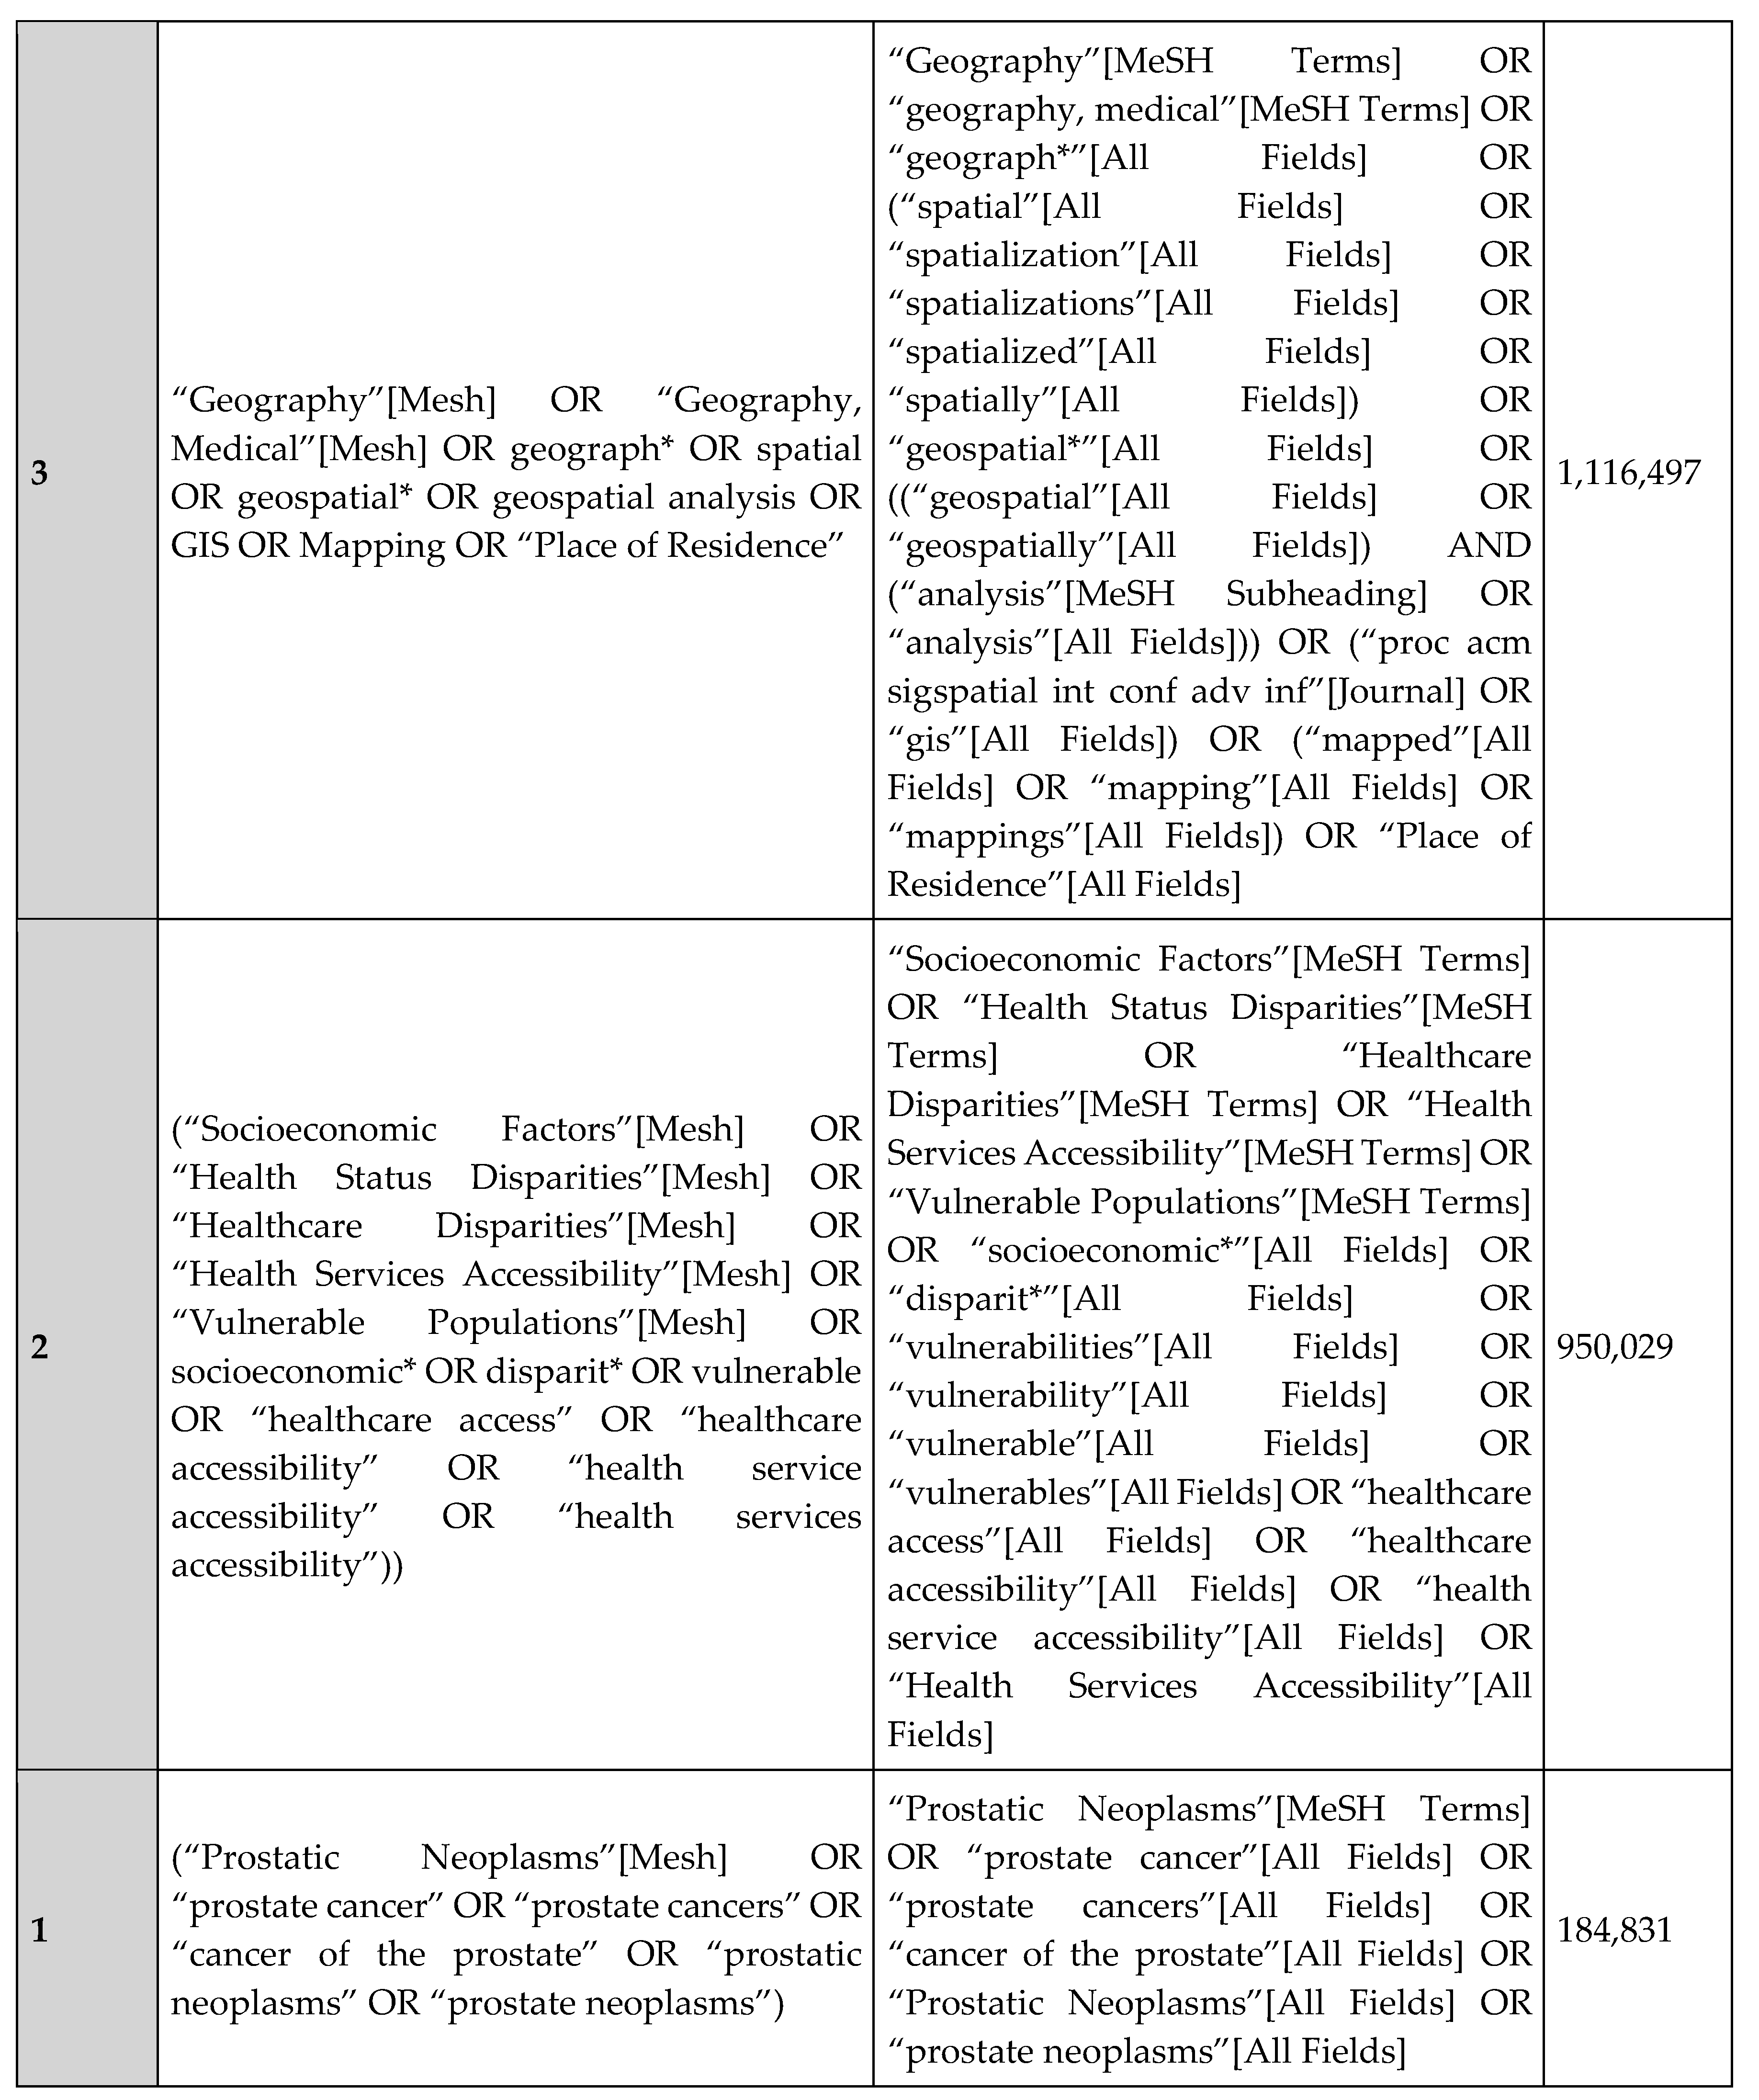
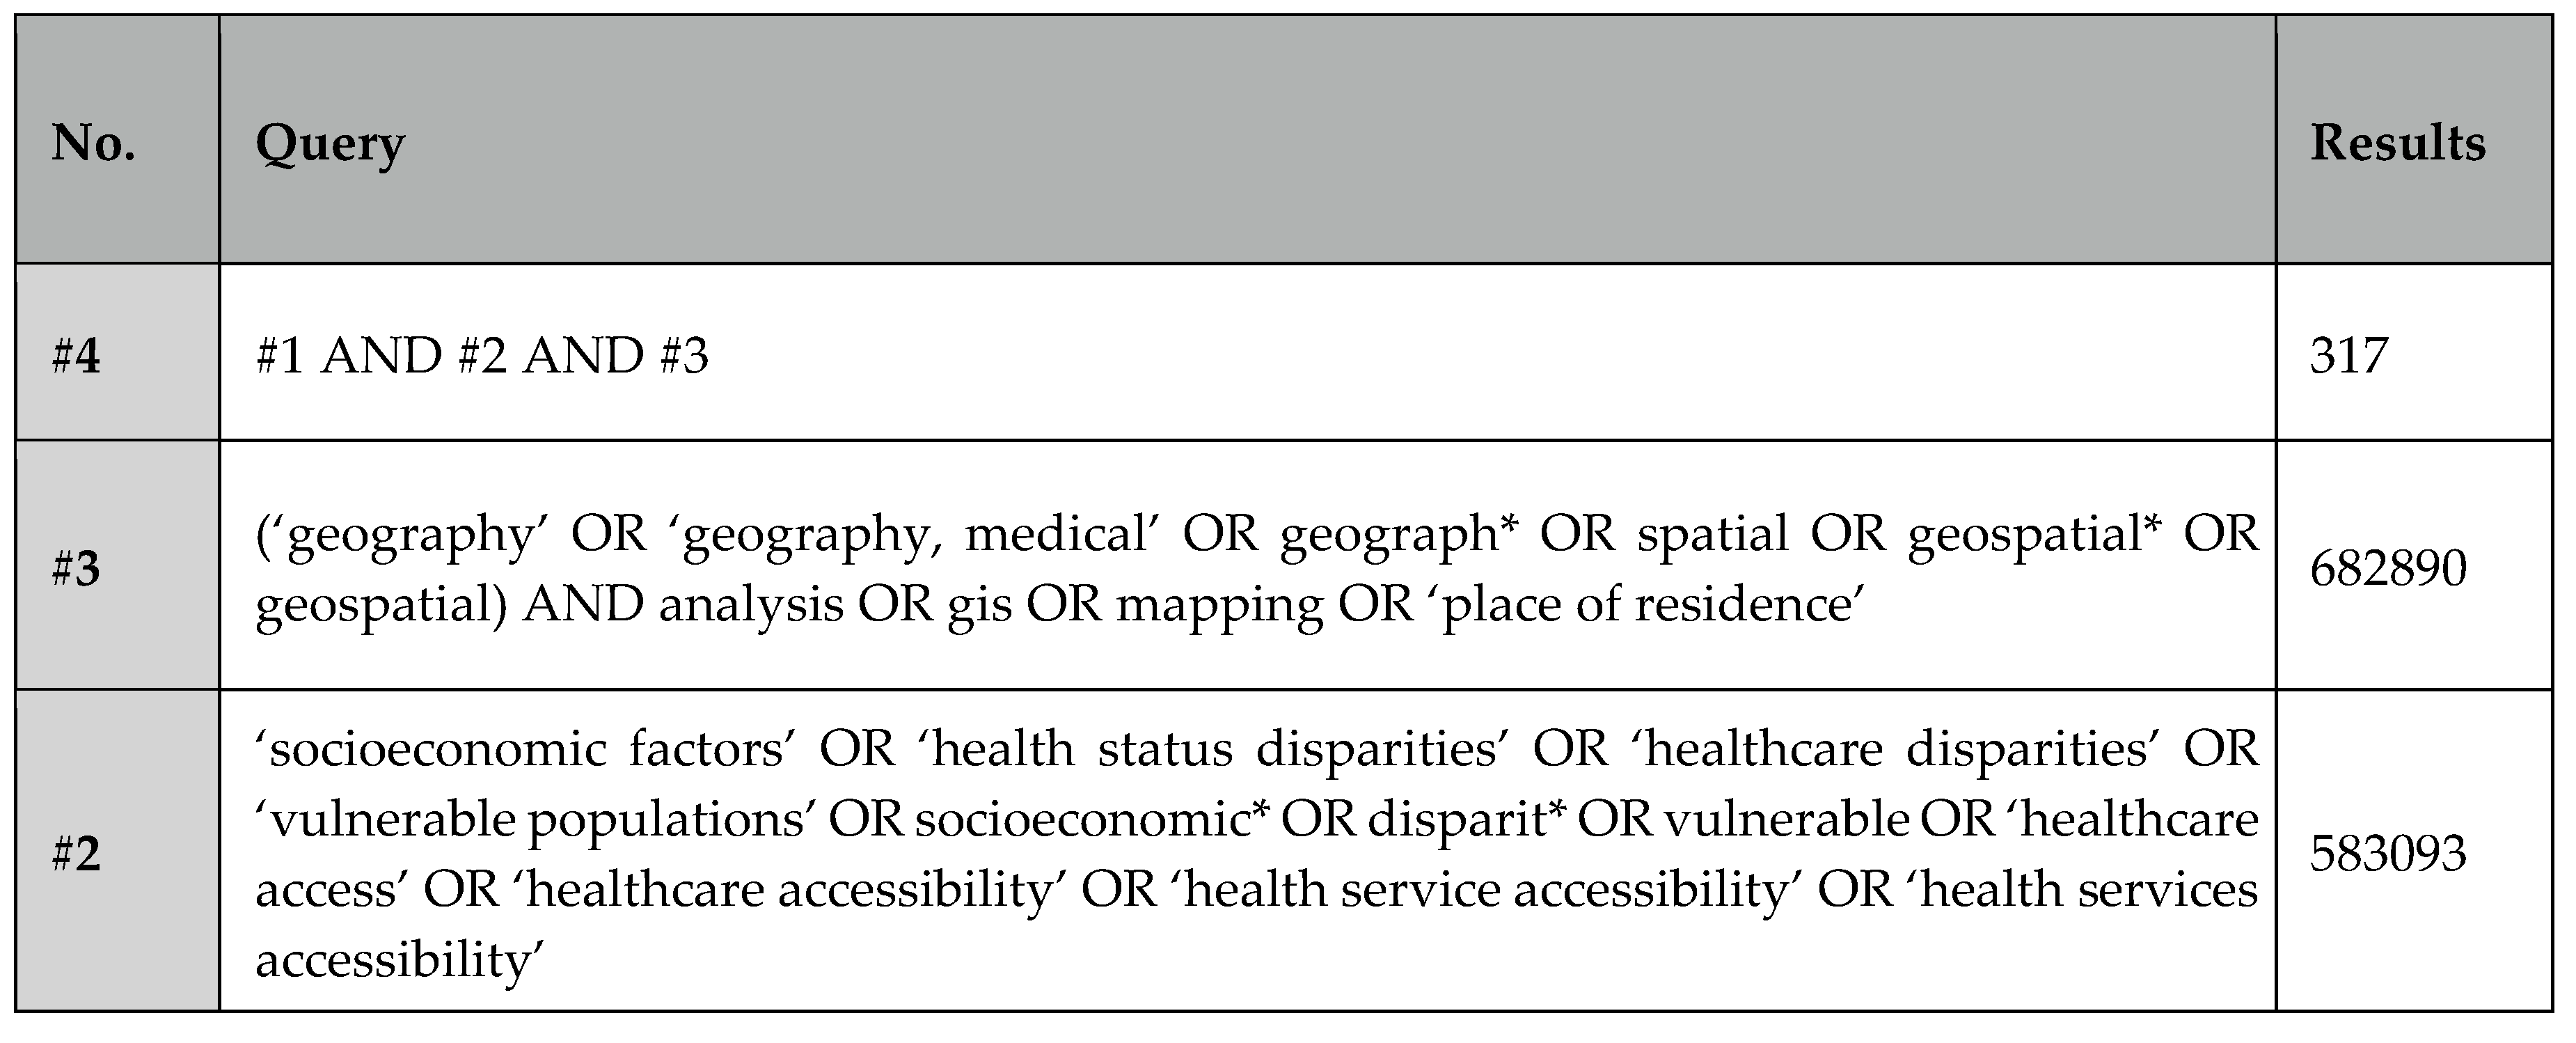
Search Method
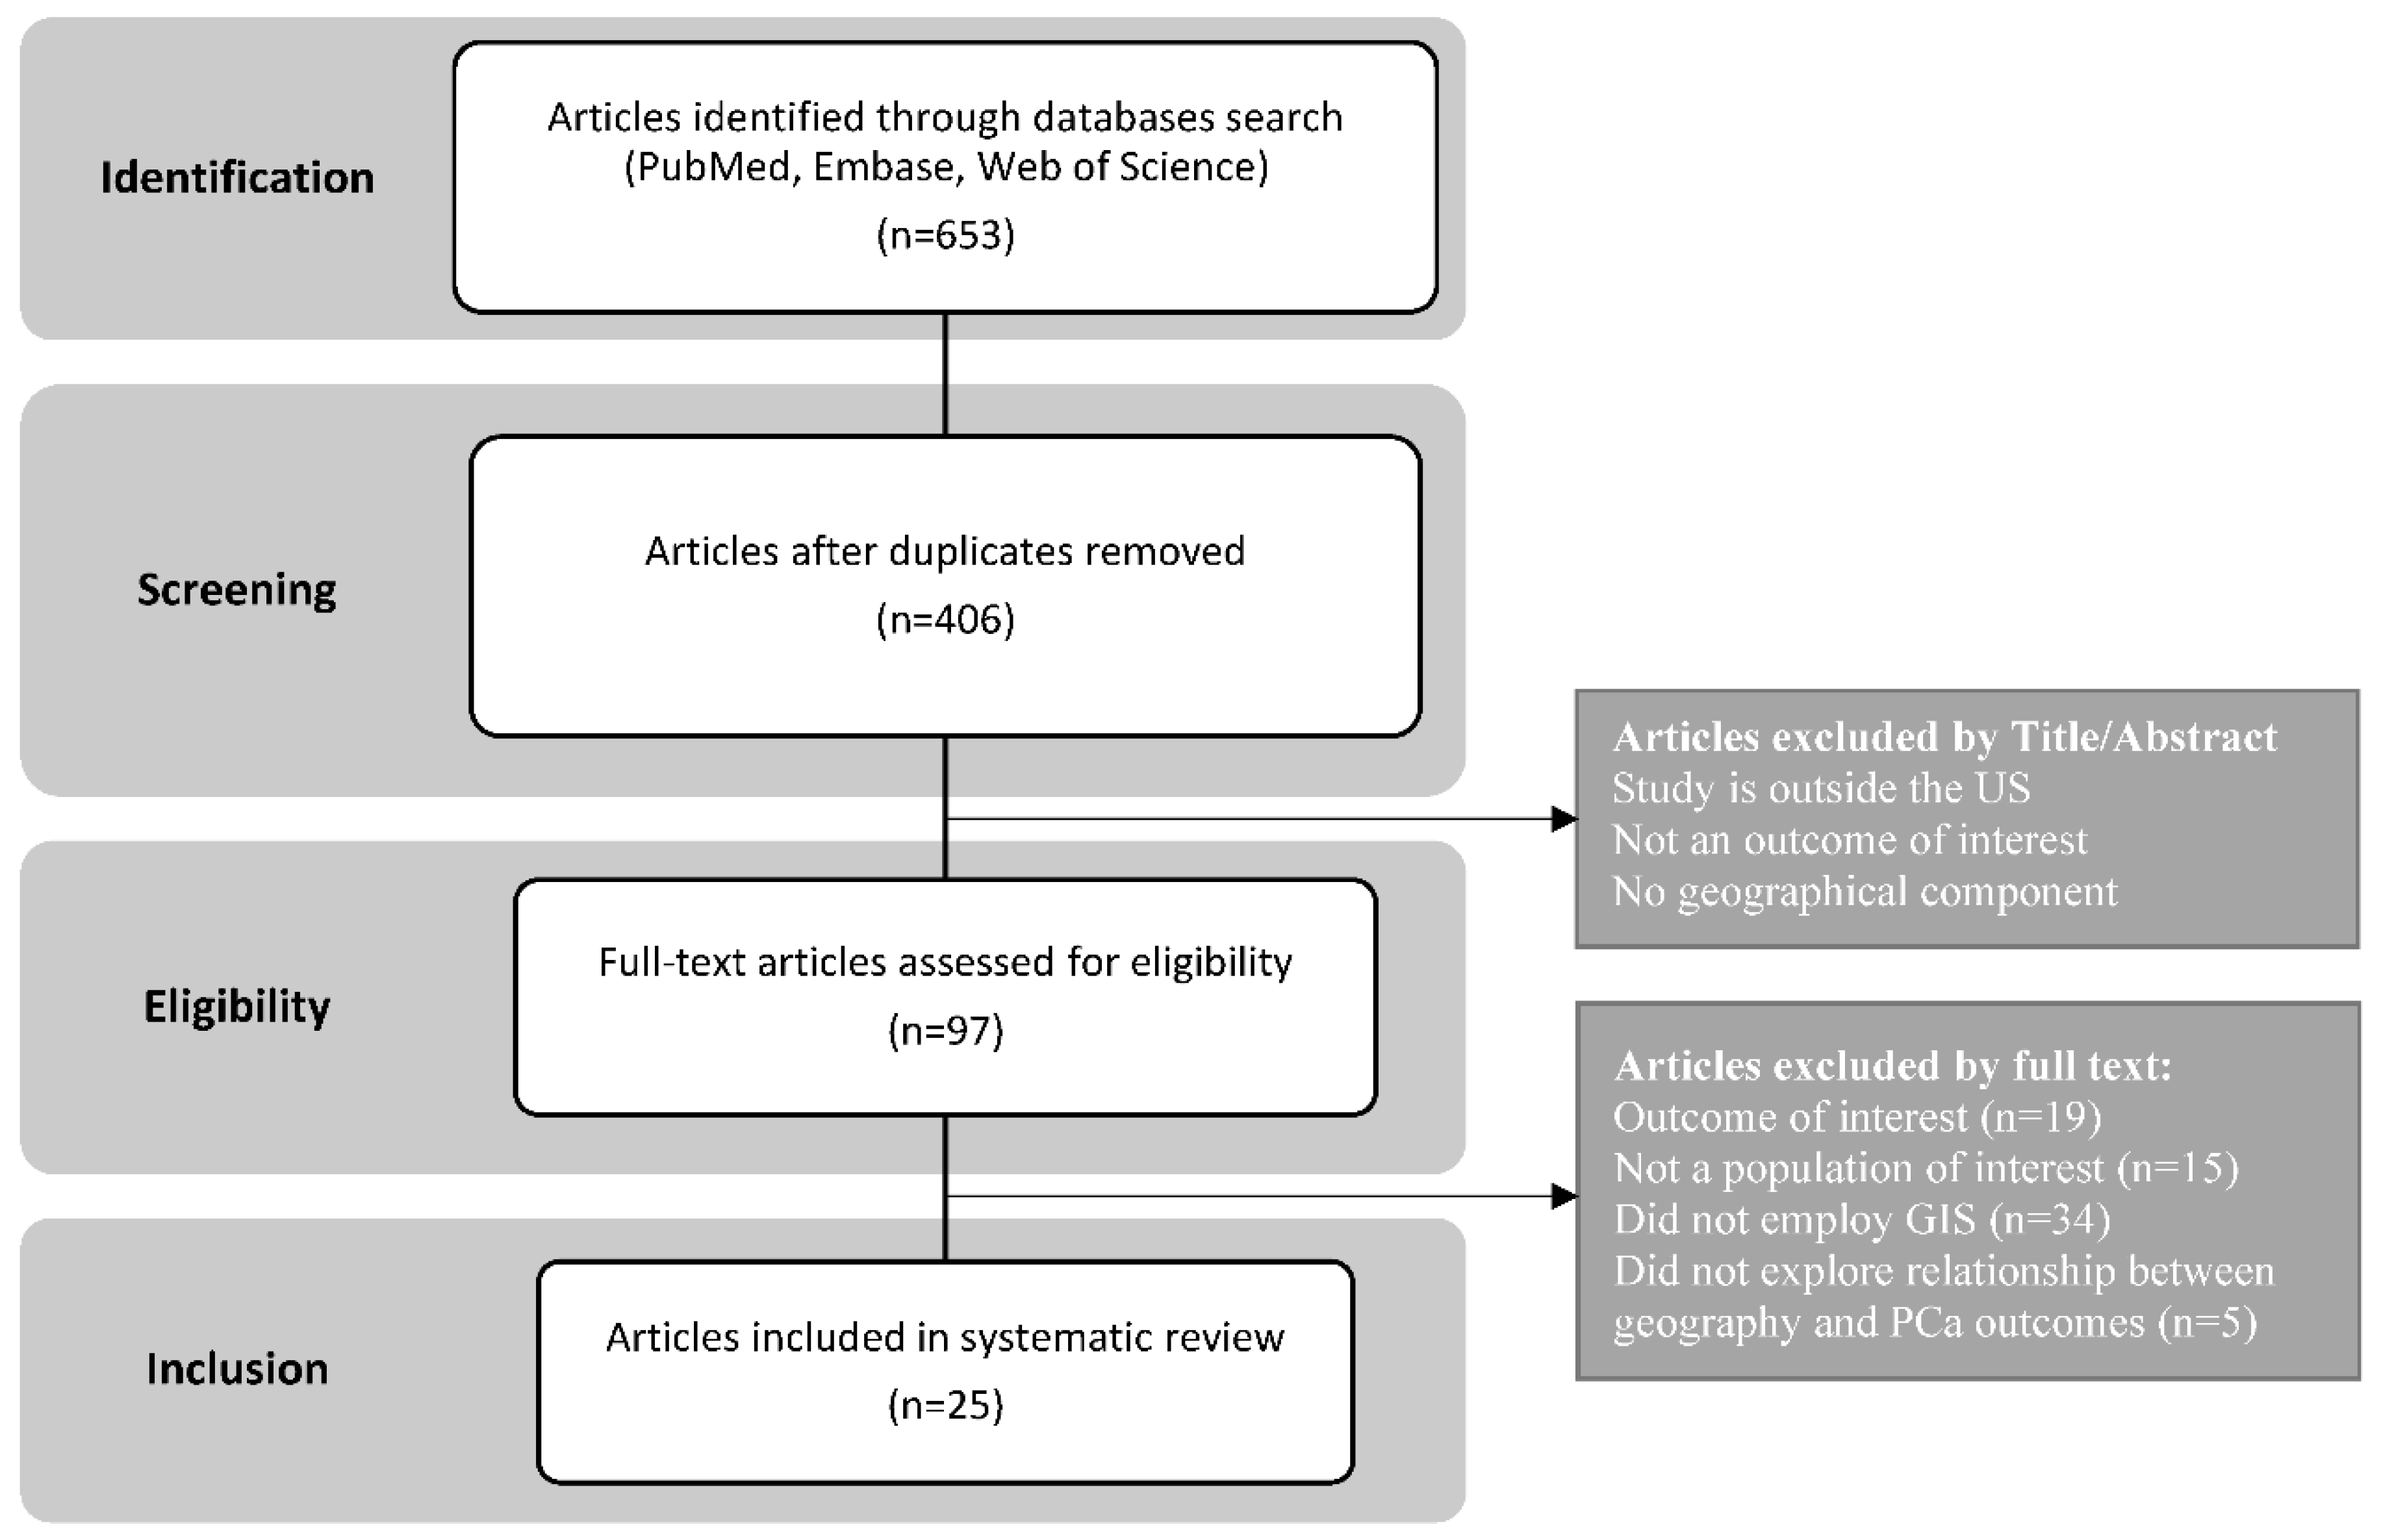
Article Selection
Study Management
Results
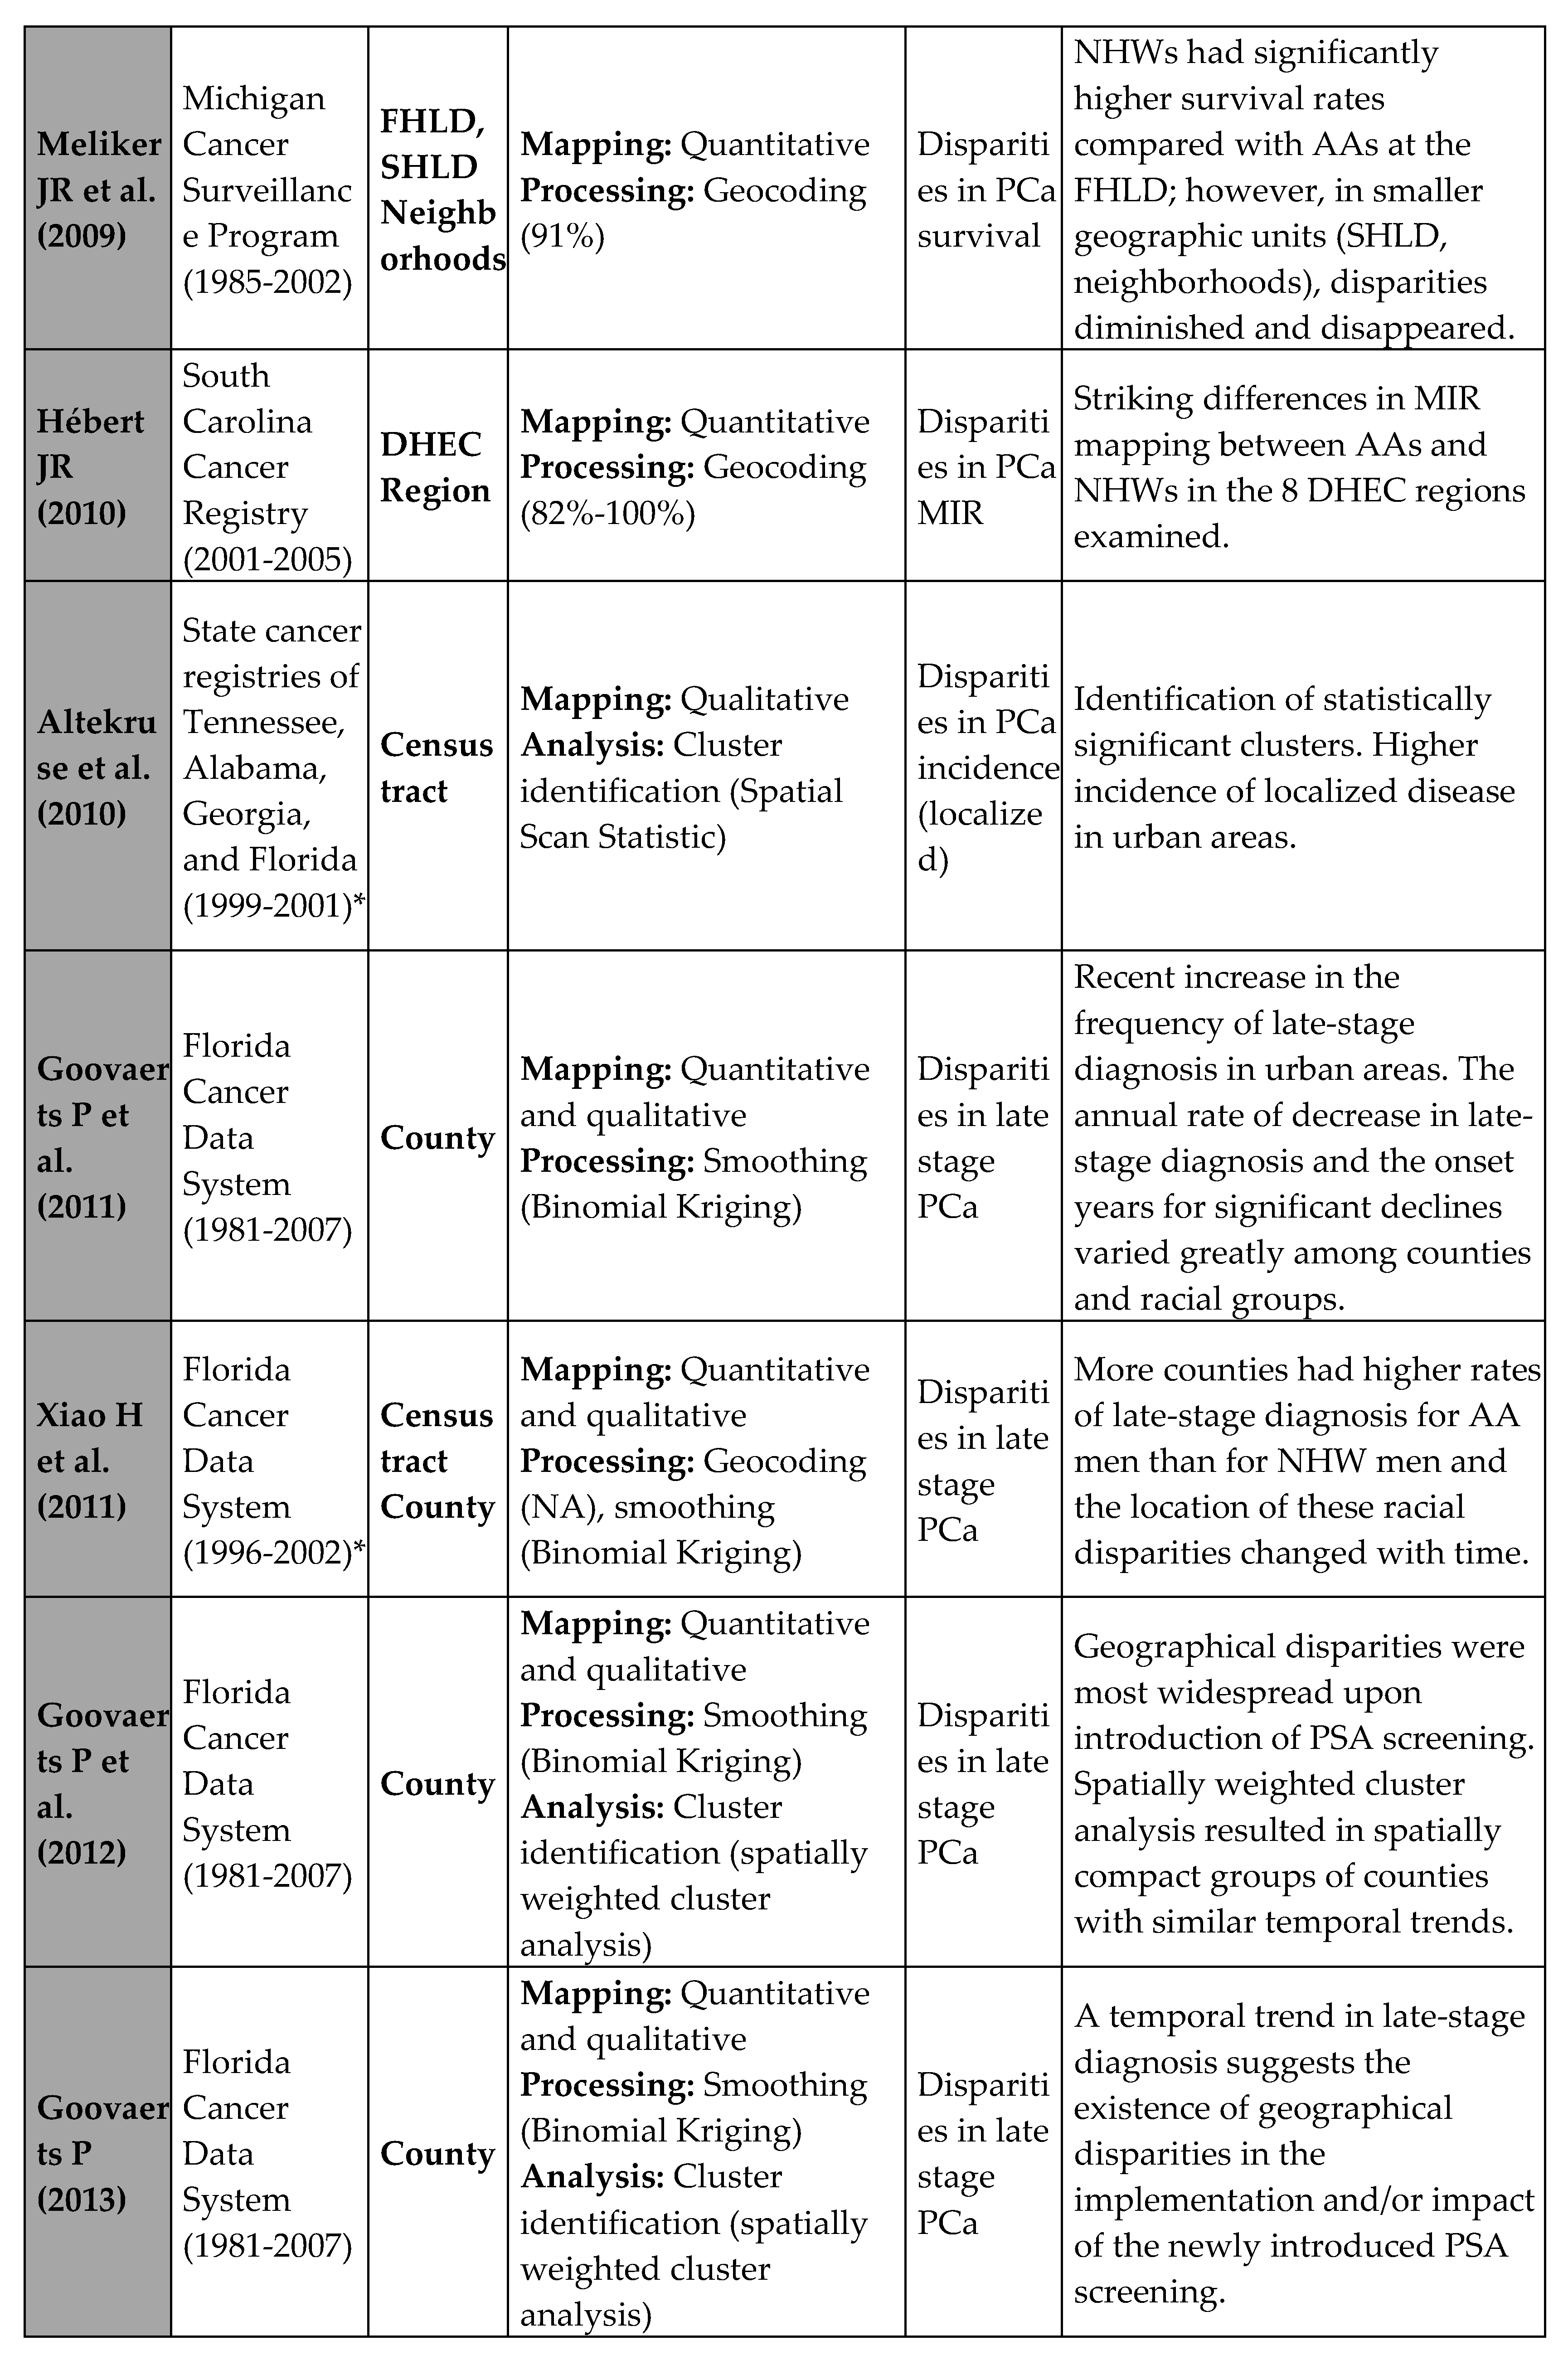
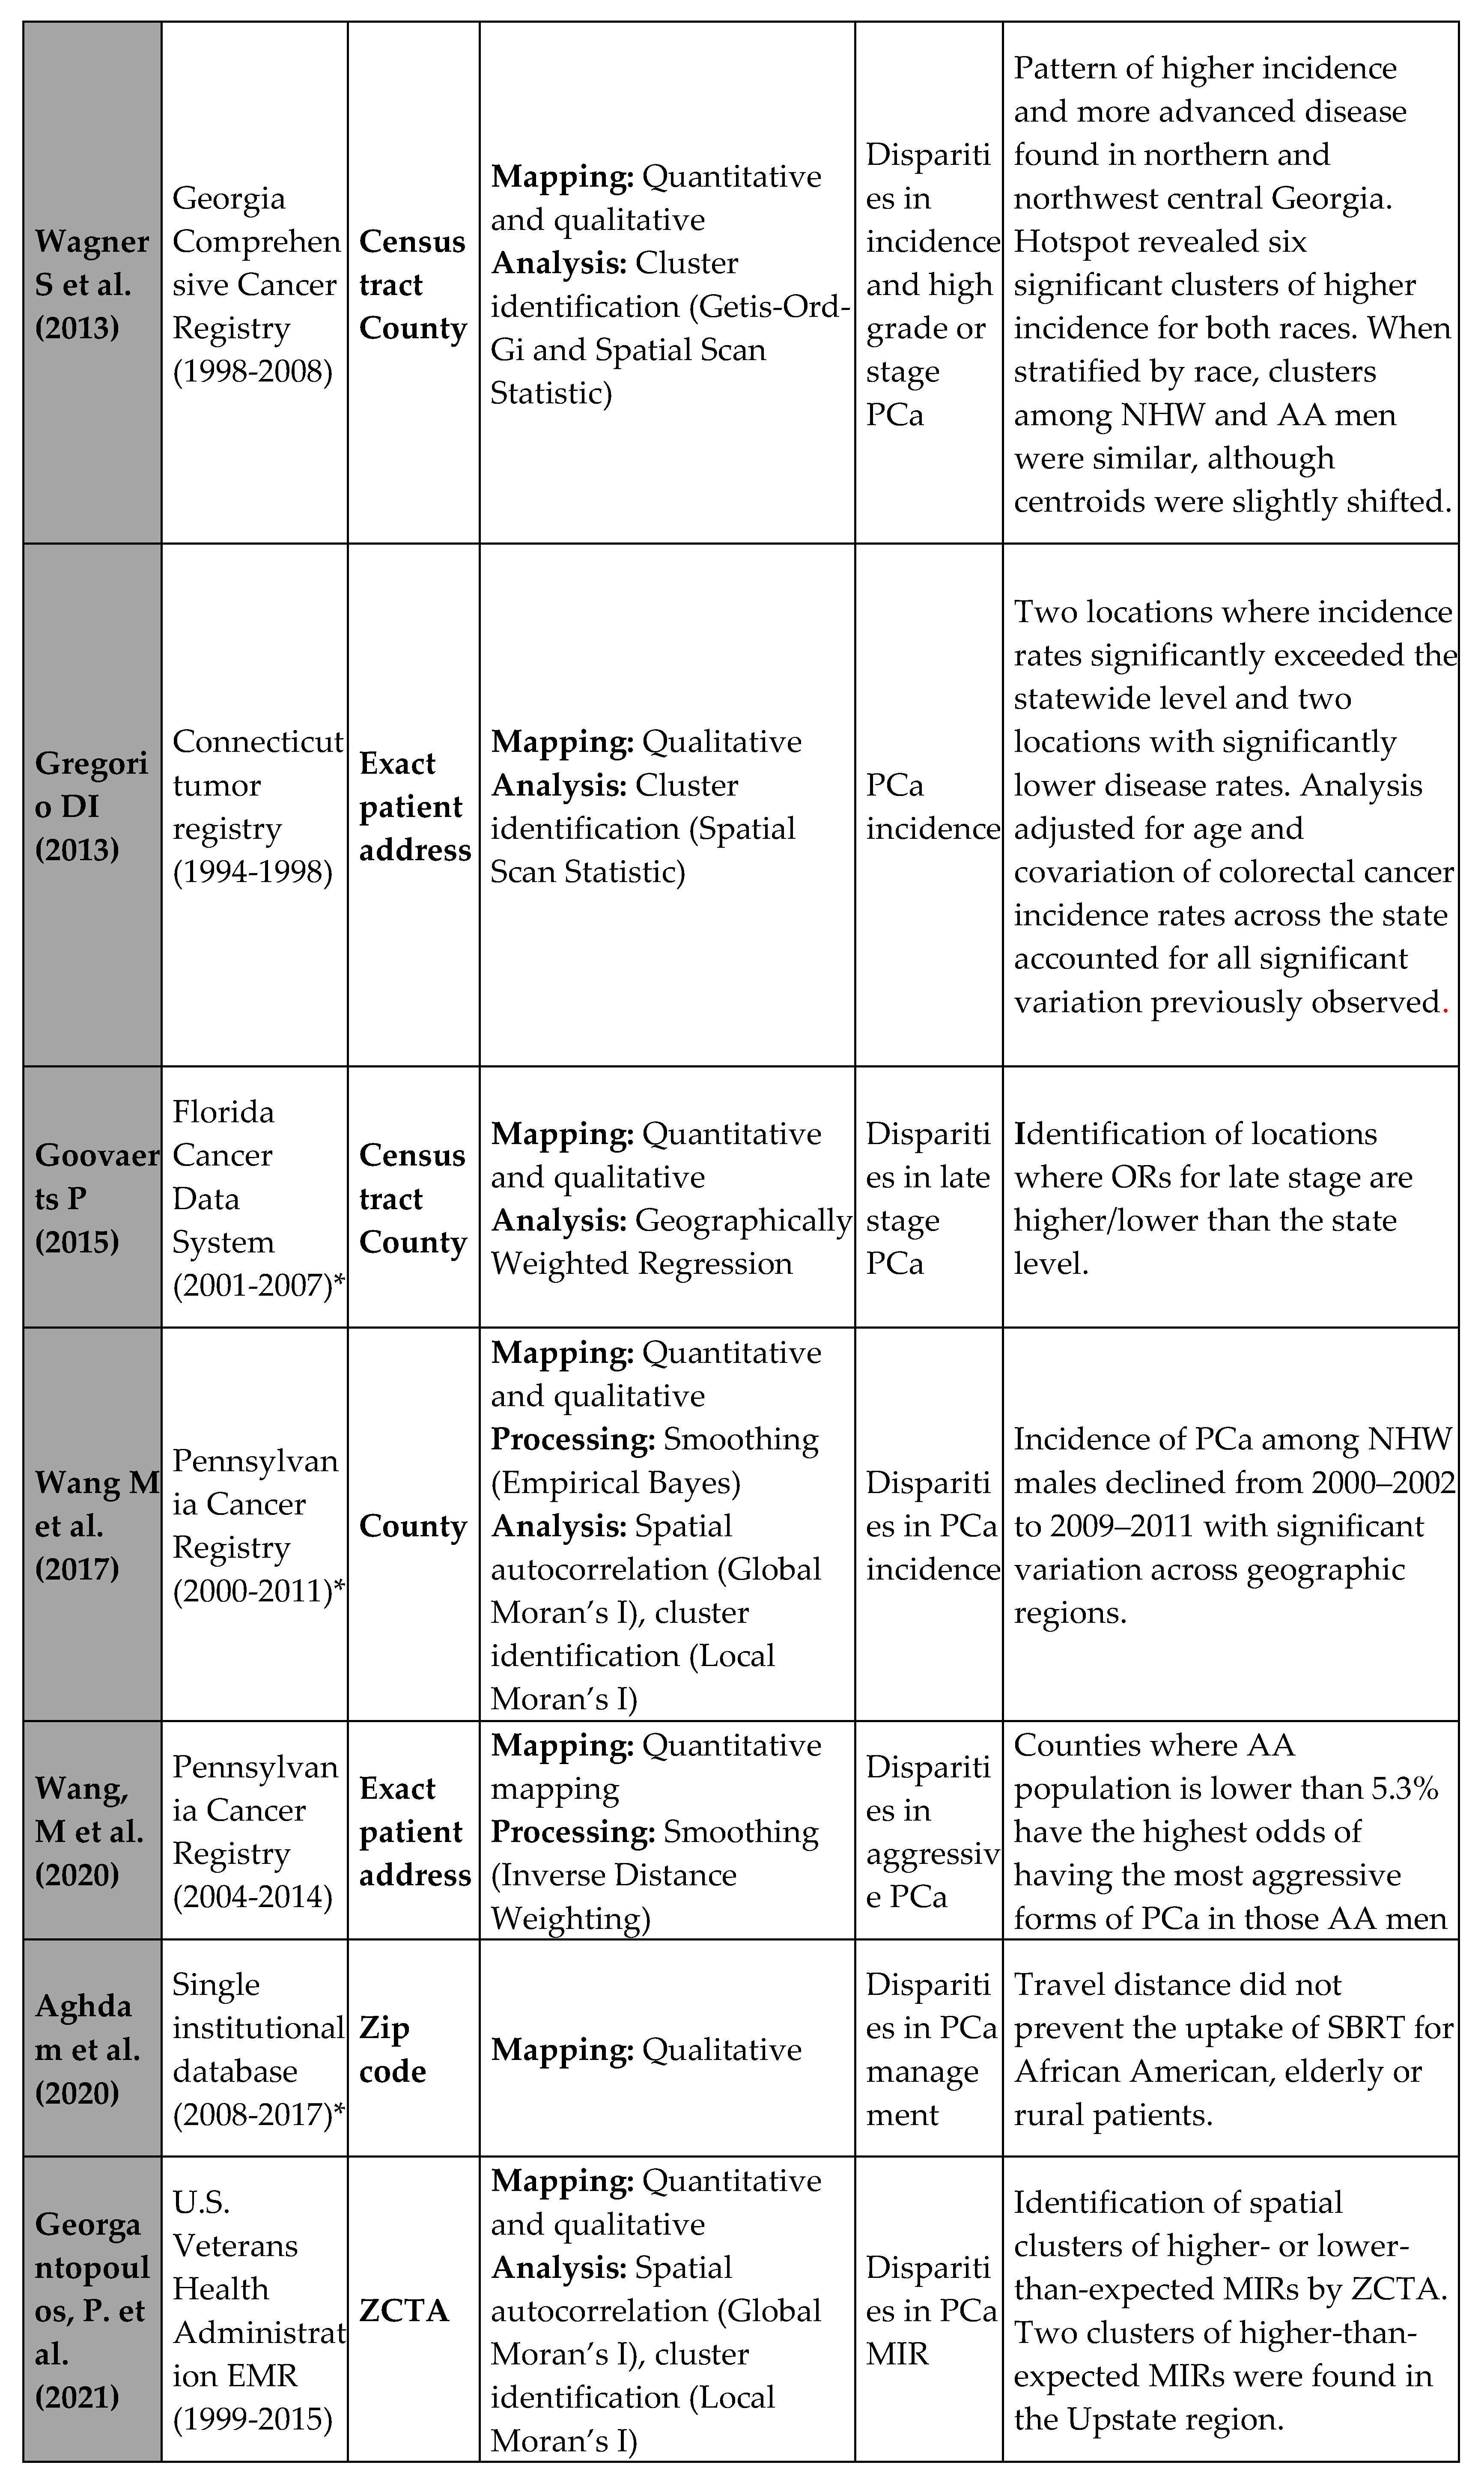
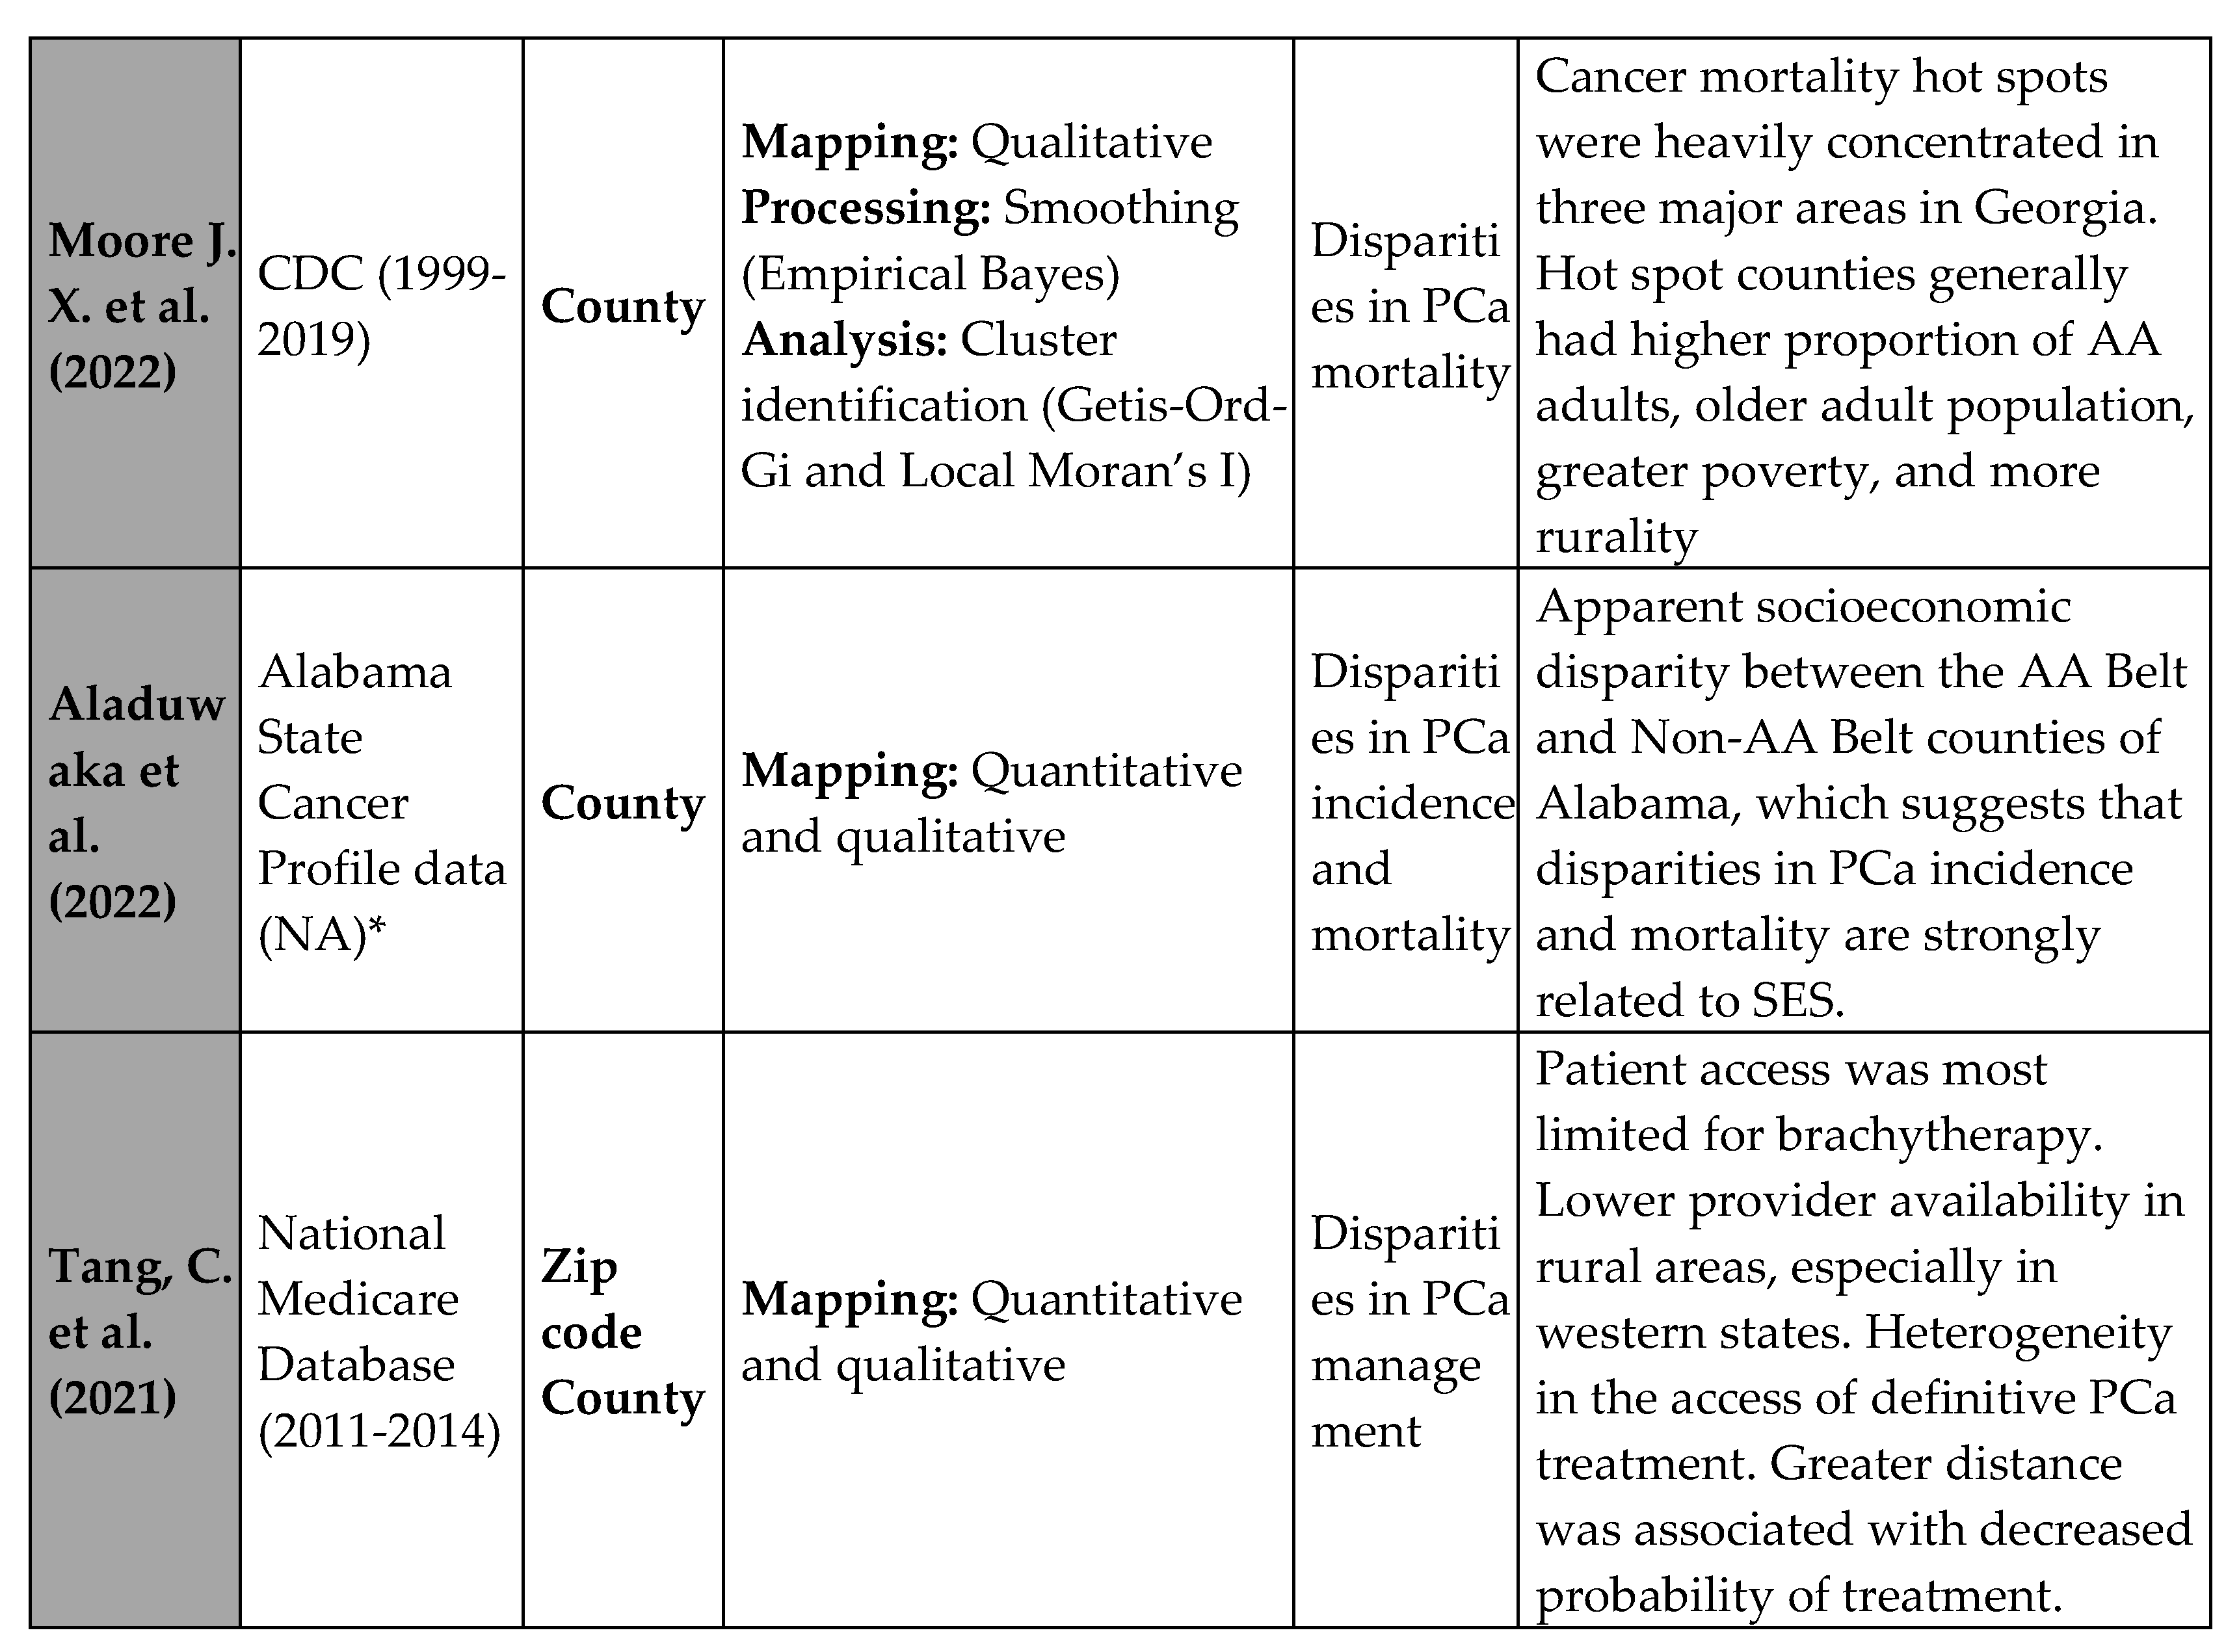
Summary of PCa Disparities Findings in GIS Studies
GIS studies that examined disparities in PCa incidence
GIS studies that Examined Disparities in PCa grade and Stage at Diagnosis
GIS studies that Examined Disparities in PCa Mortality and Survival
GIS studies that Examined Disparities in PCa Management
Application of GIS in PCa Disparities Research
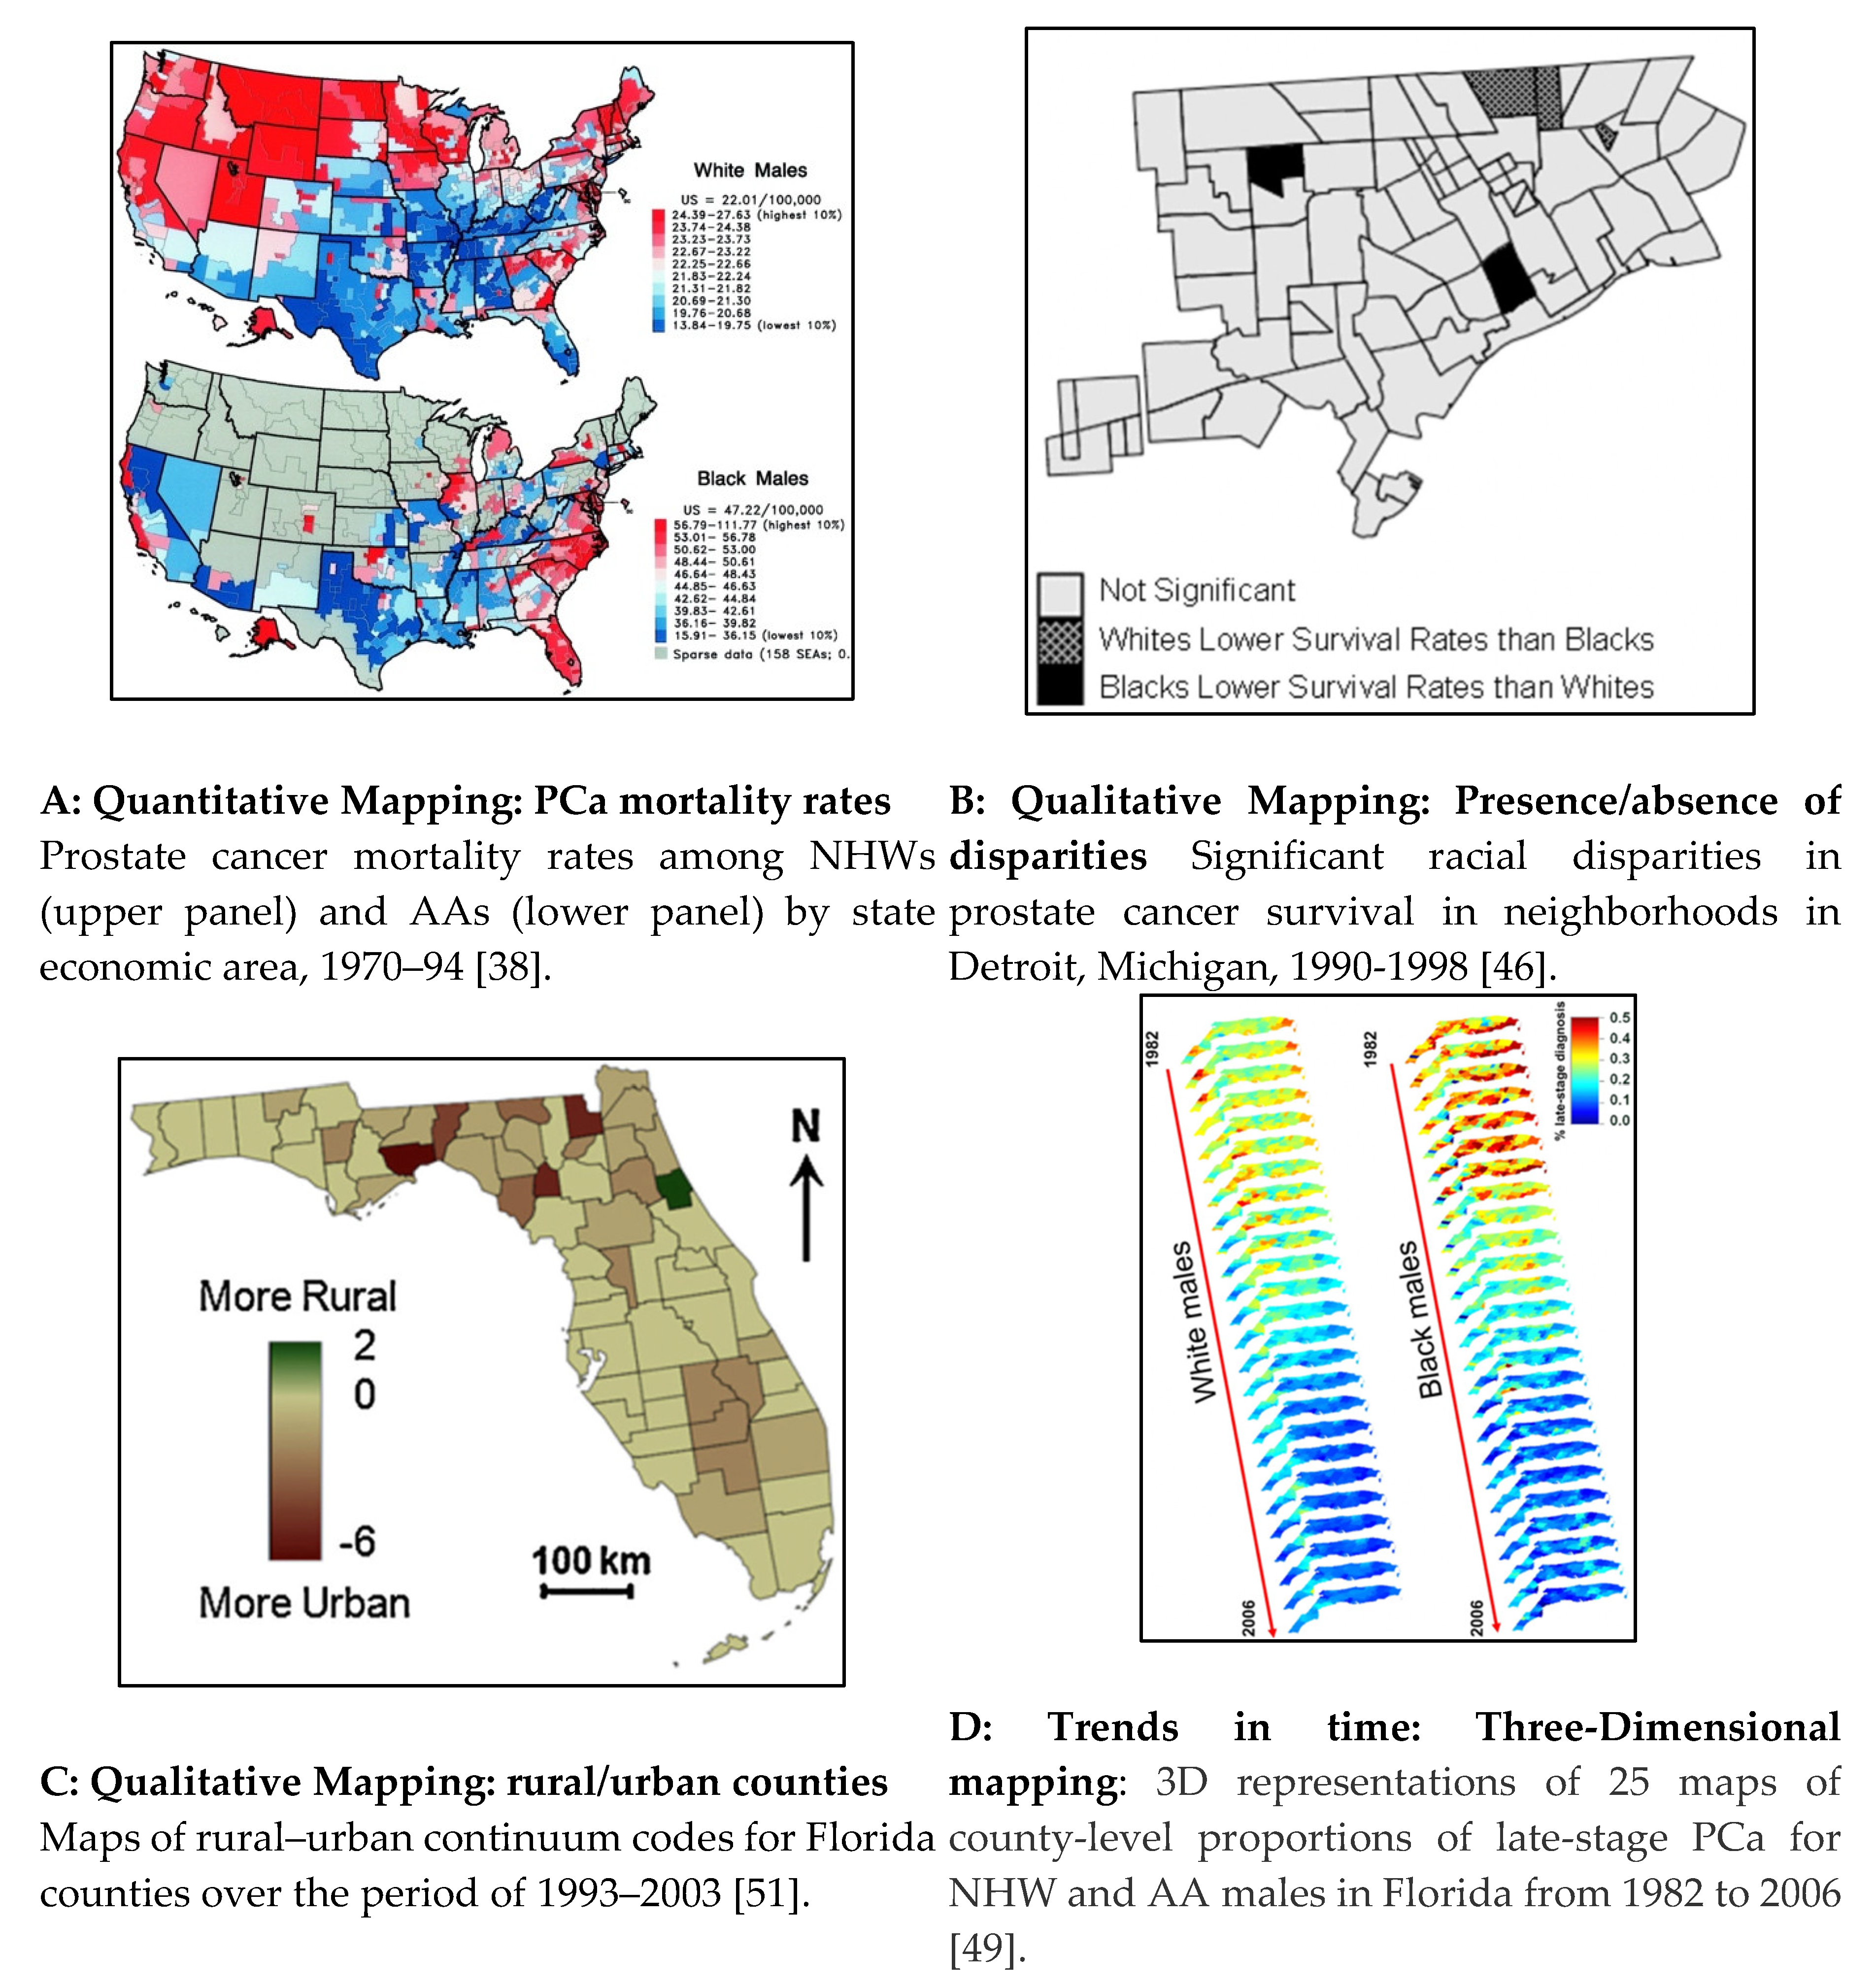
Application of GIS in PCa Disparities Research: “Mapping”
Mapping a Snapshot in Time: Qualitative and Quantitative Data
Mapping Trends Overtime
Application of GIS in PCa Disparities Research: “Processing”
GIS Processing: Geocoding
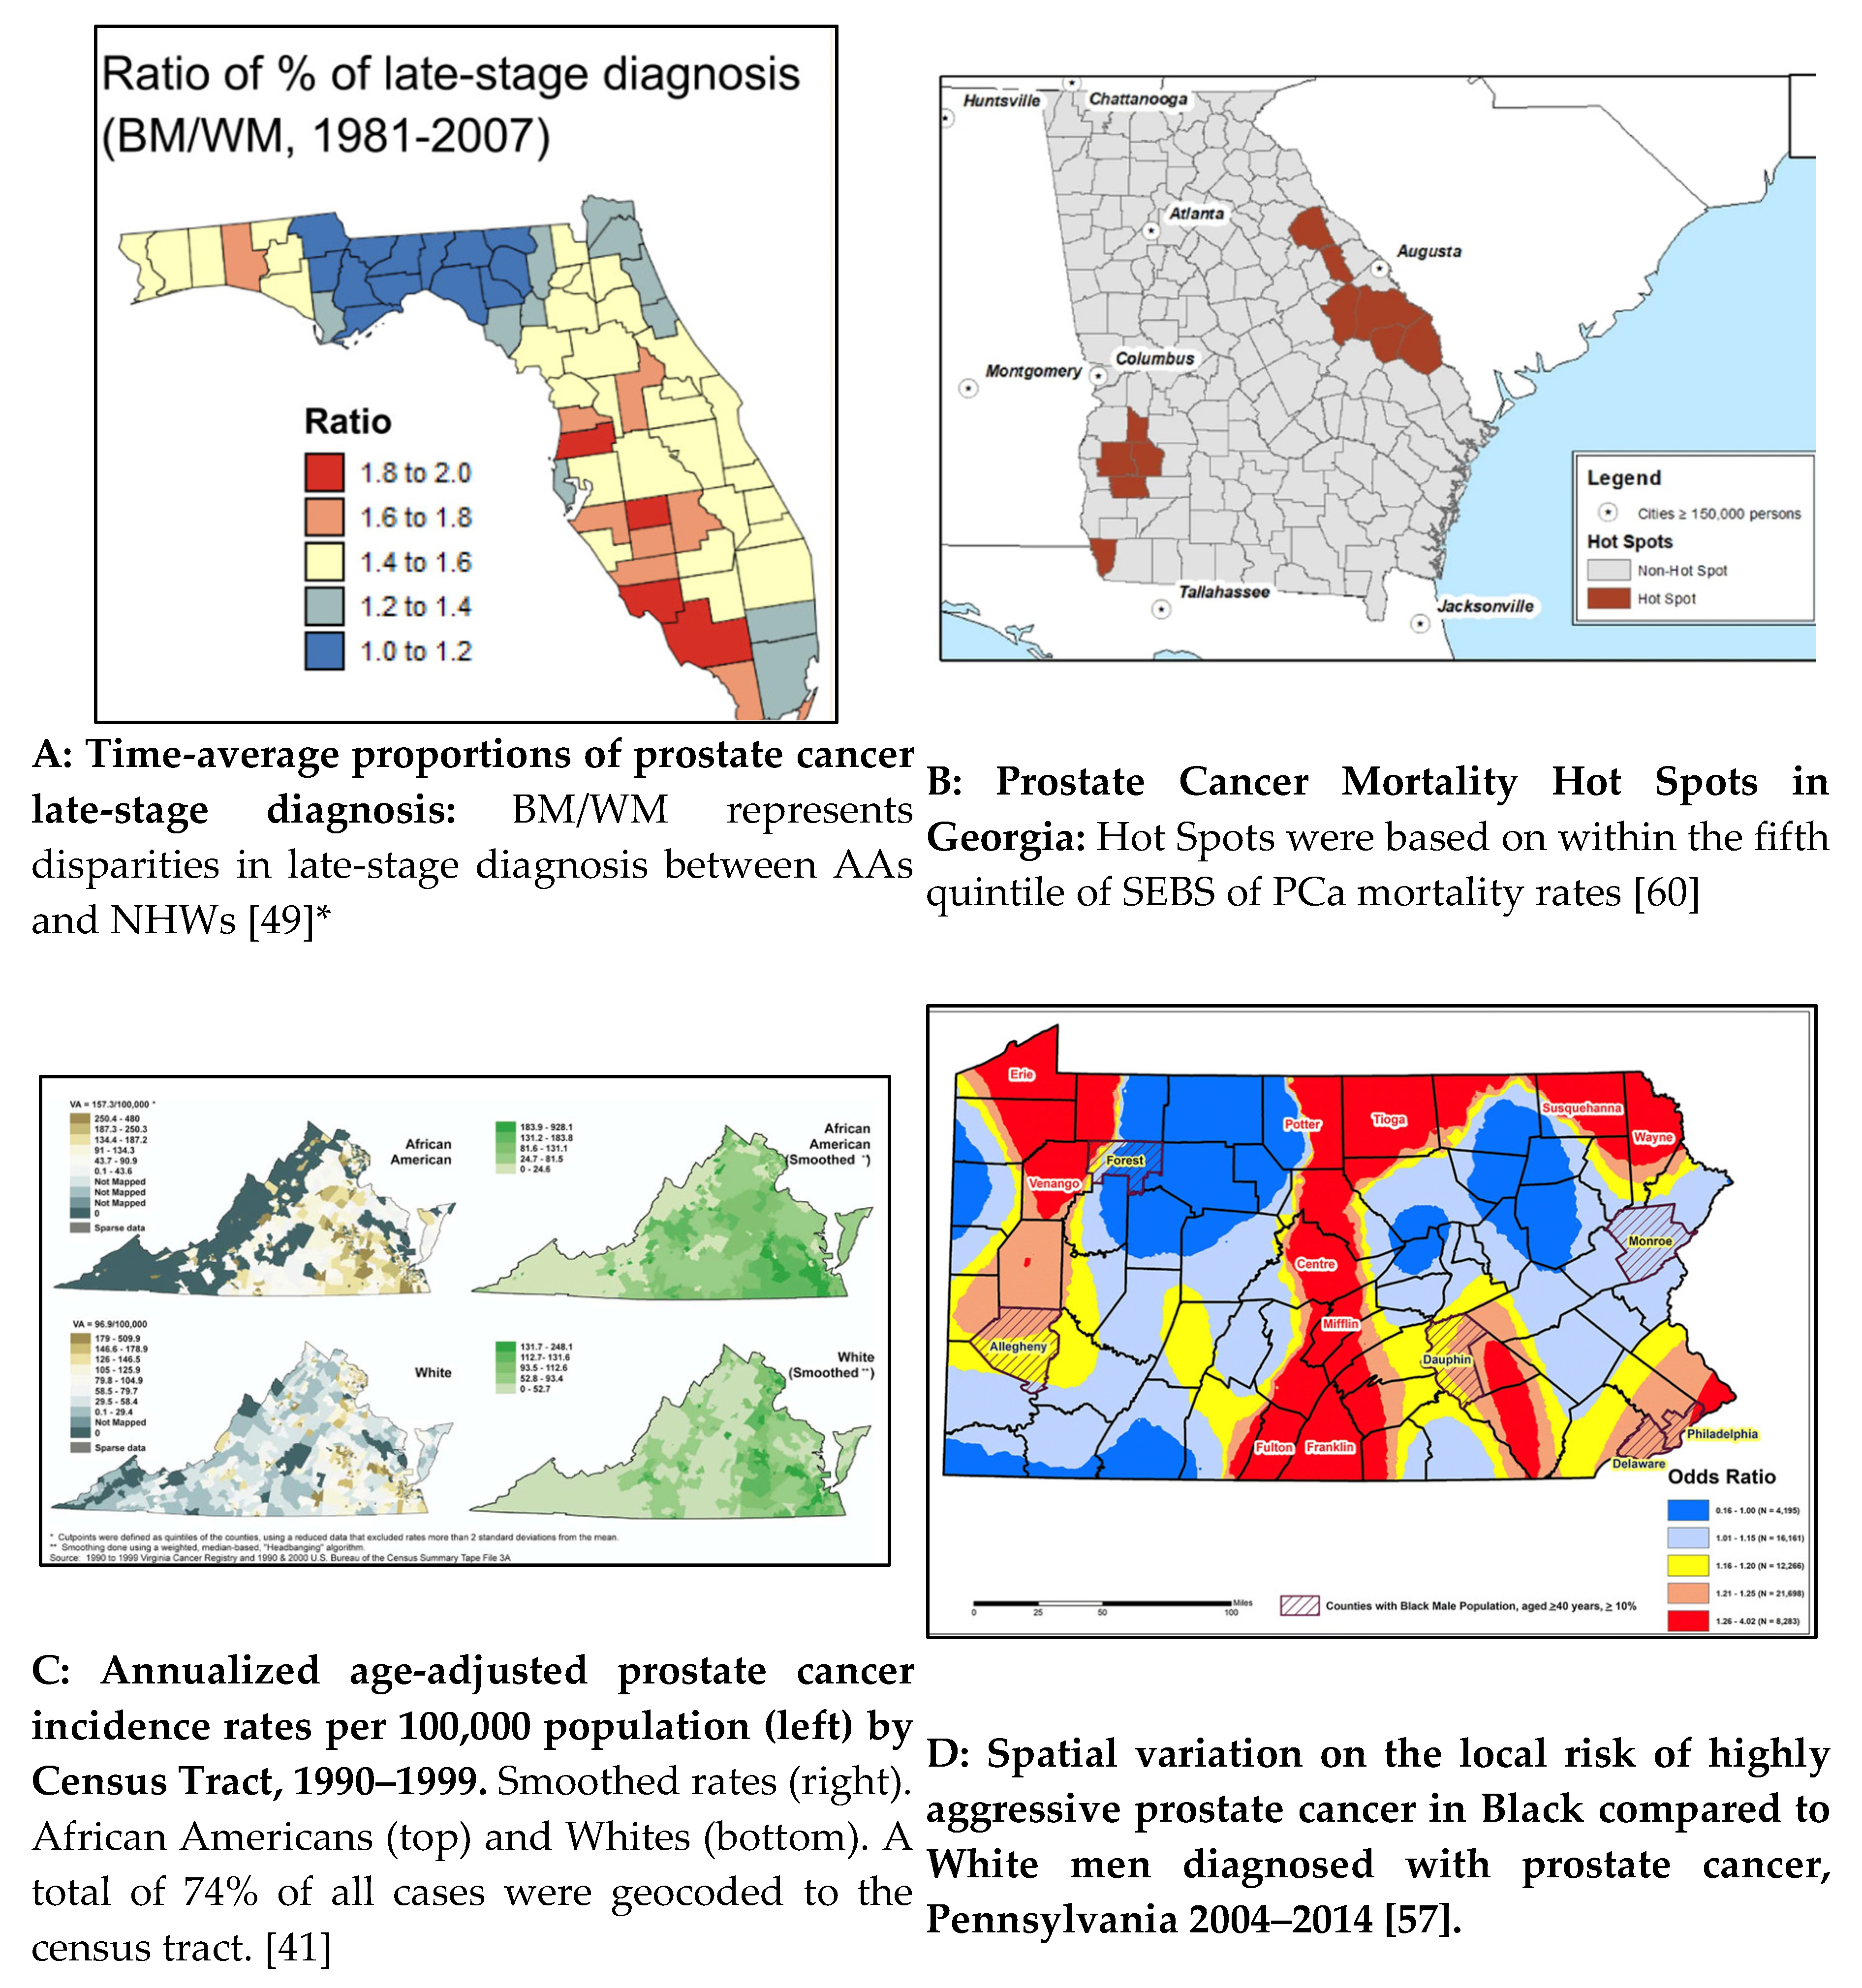
GIS Processing: Smoothing
Application of GIS in PCa Disparities Research: “Spatial Analysis”
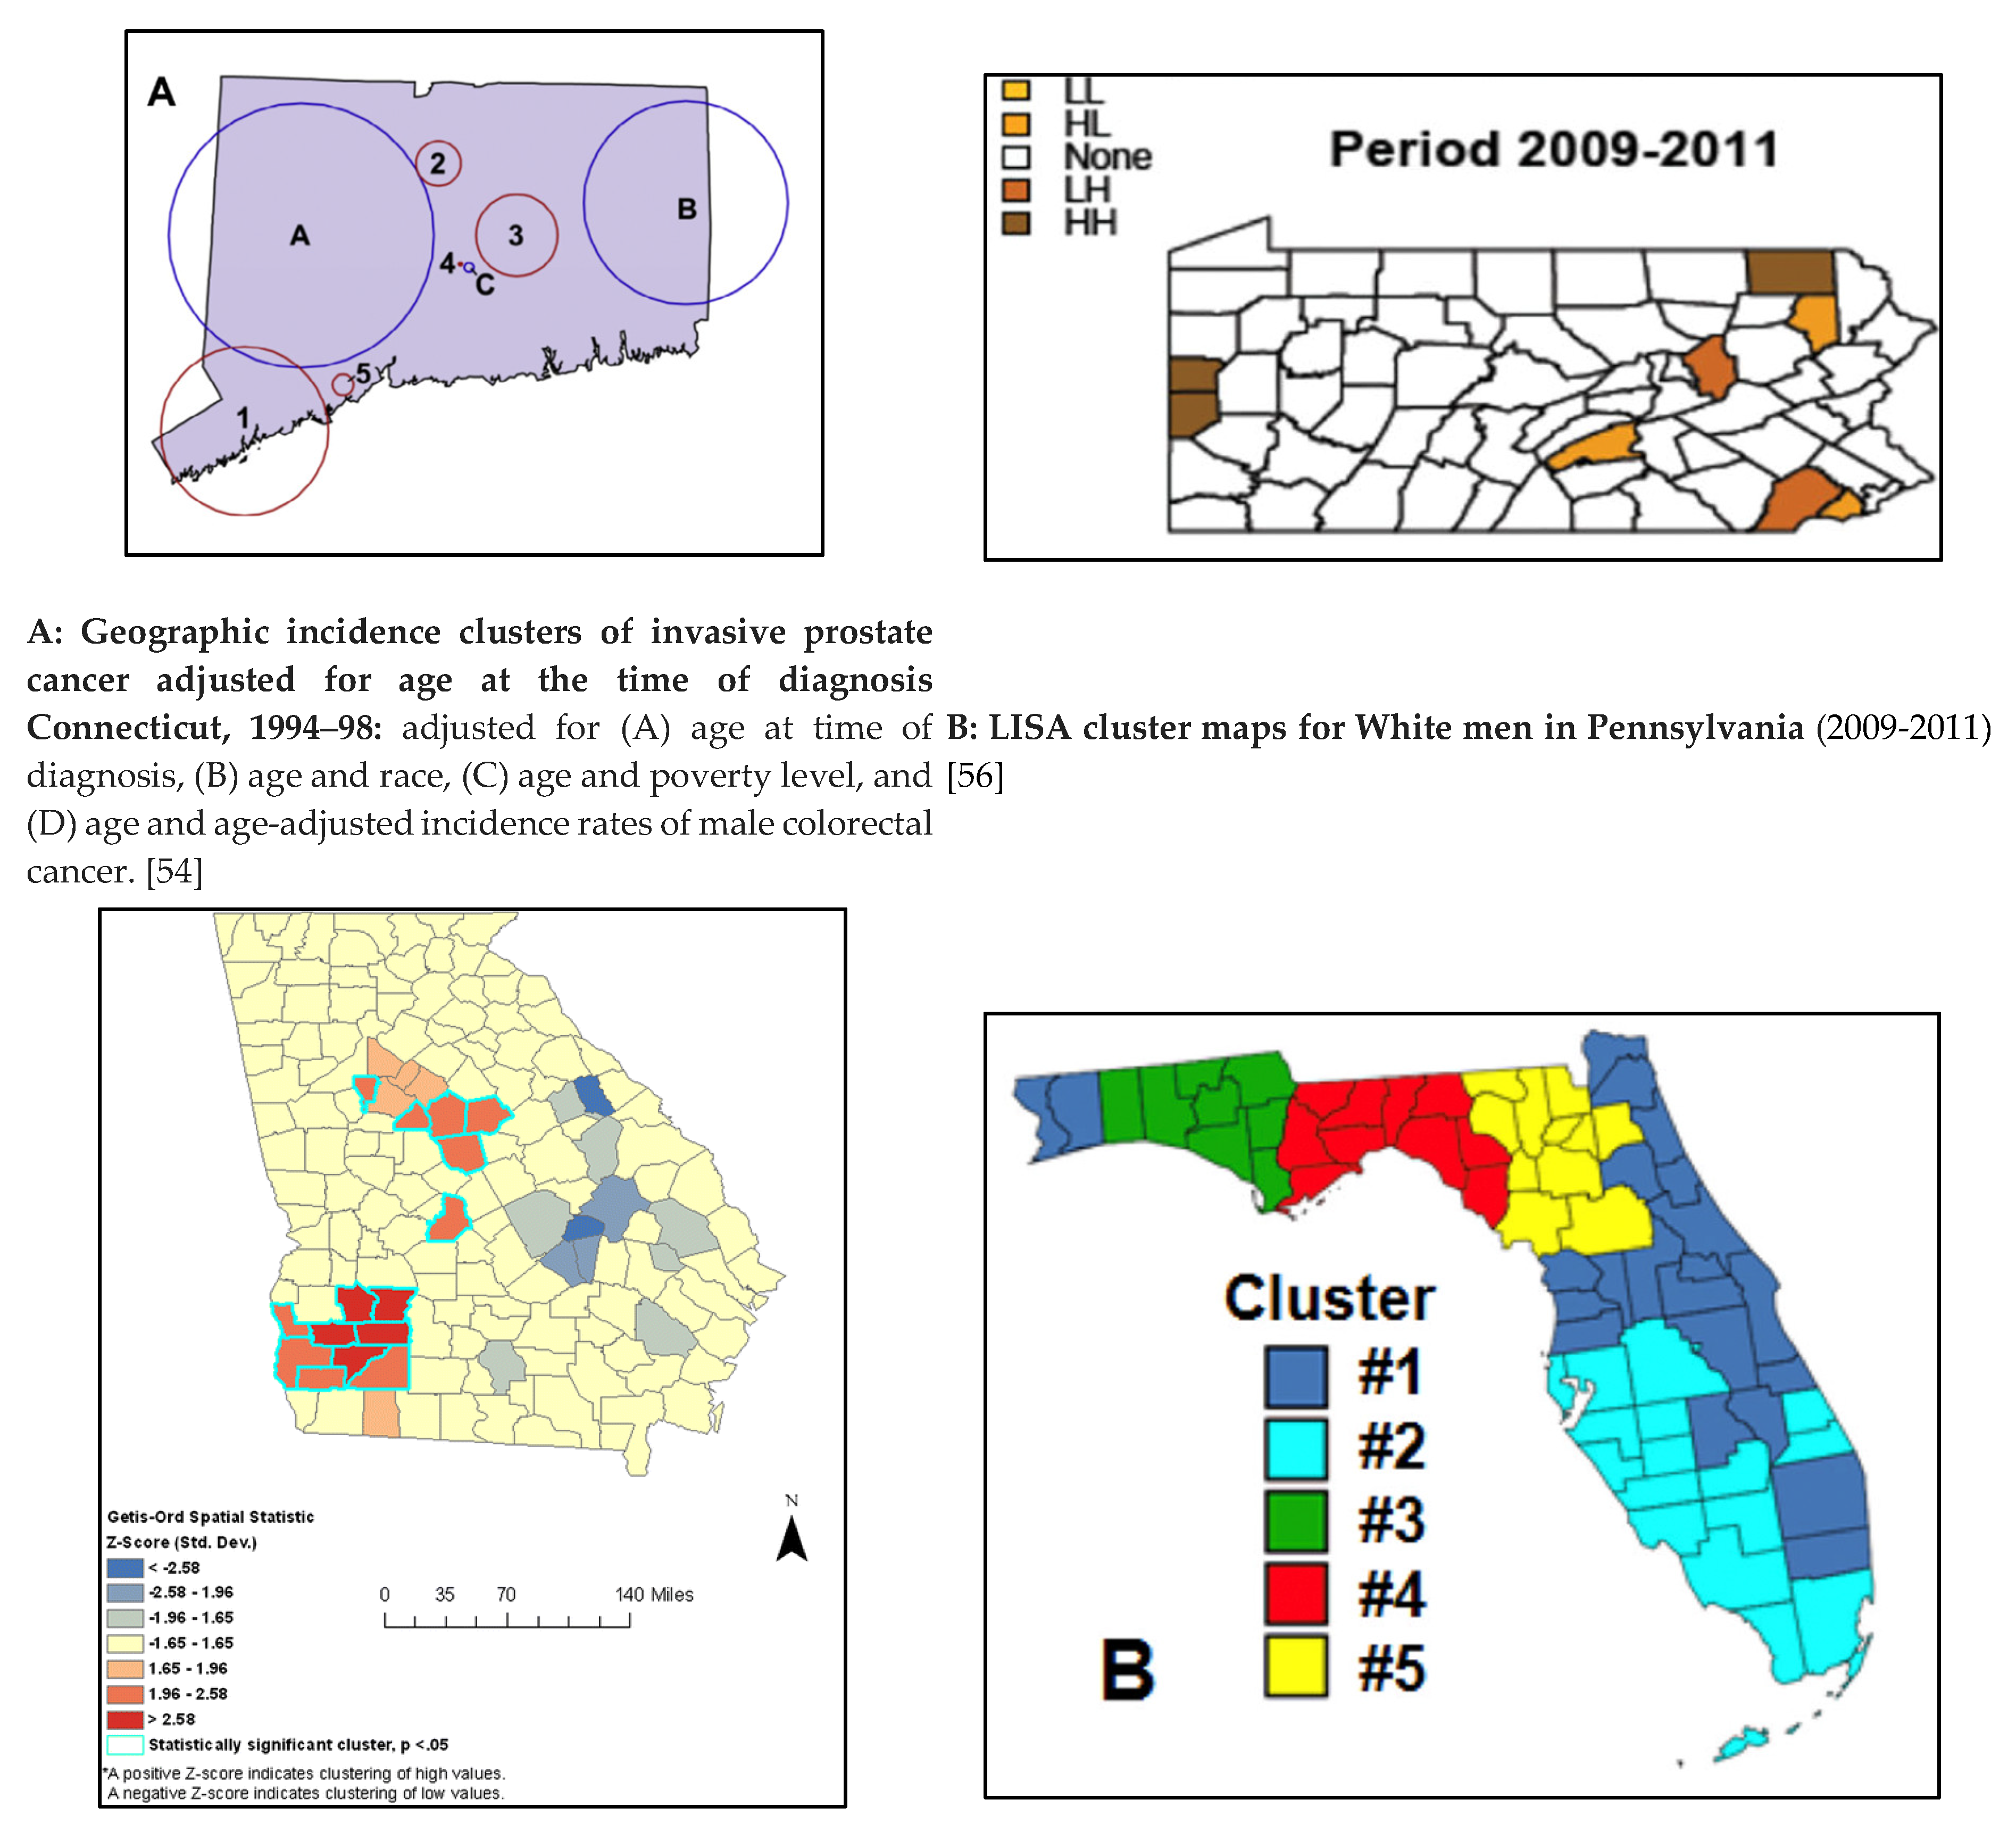
GIS Analysis: Identification of Spatial autocorrelation
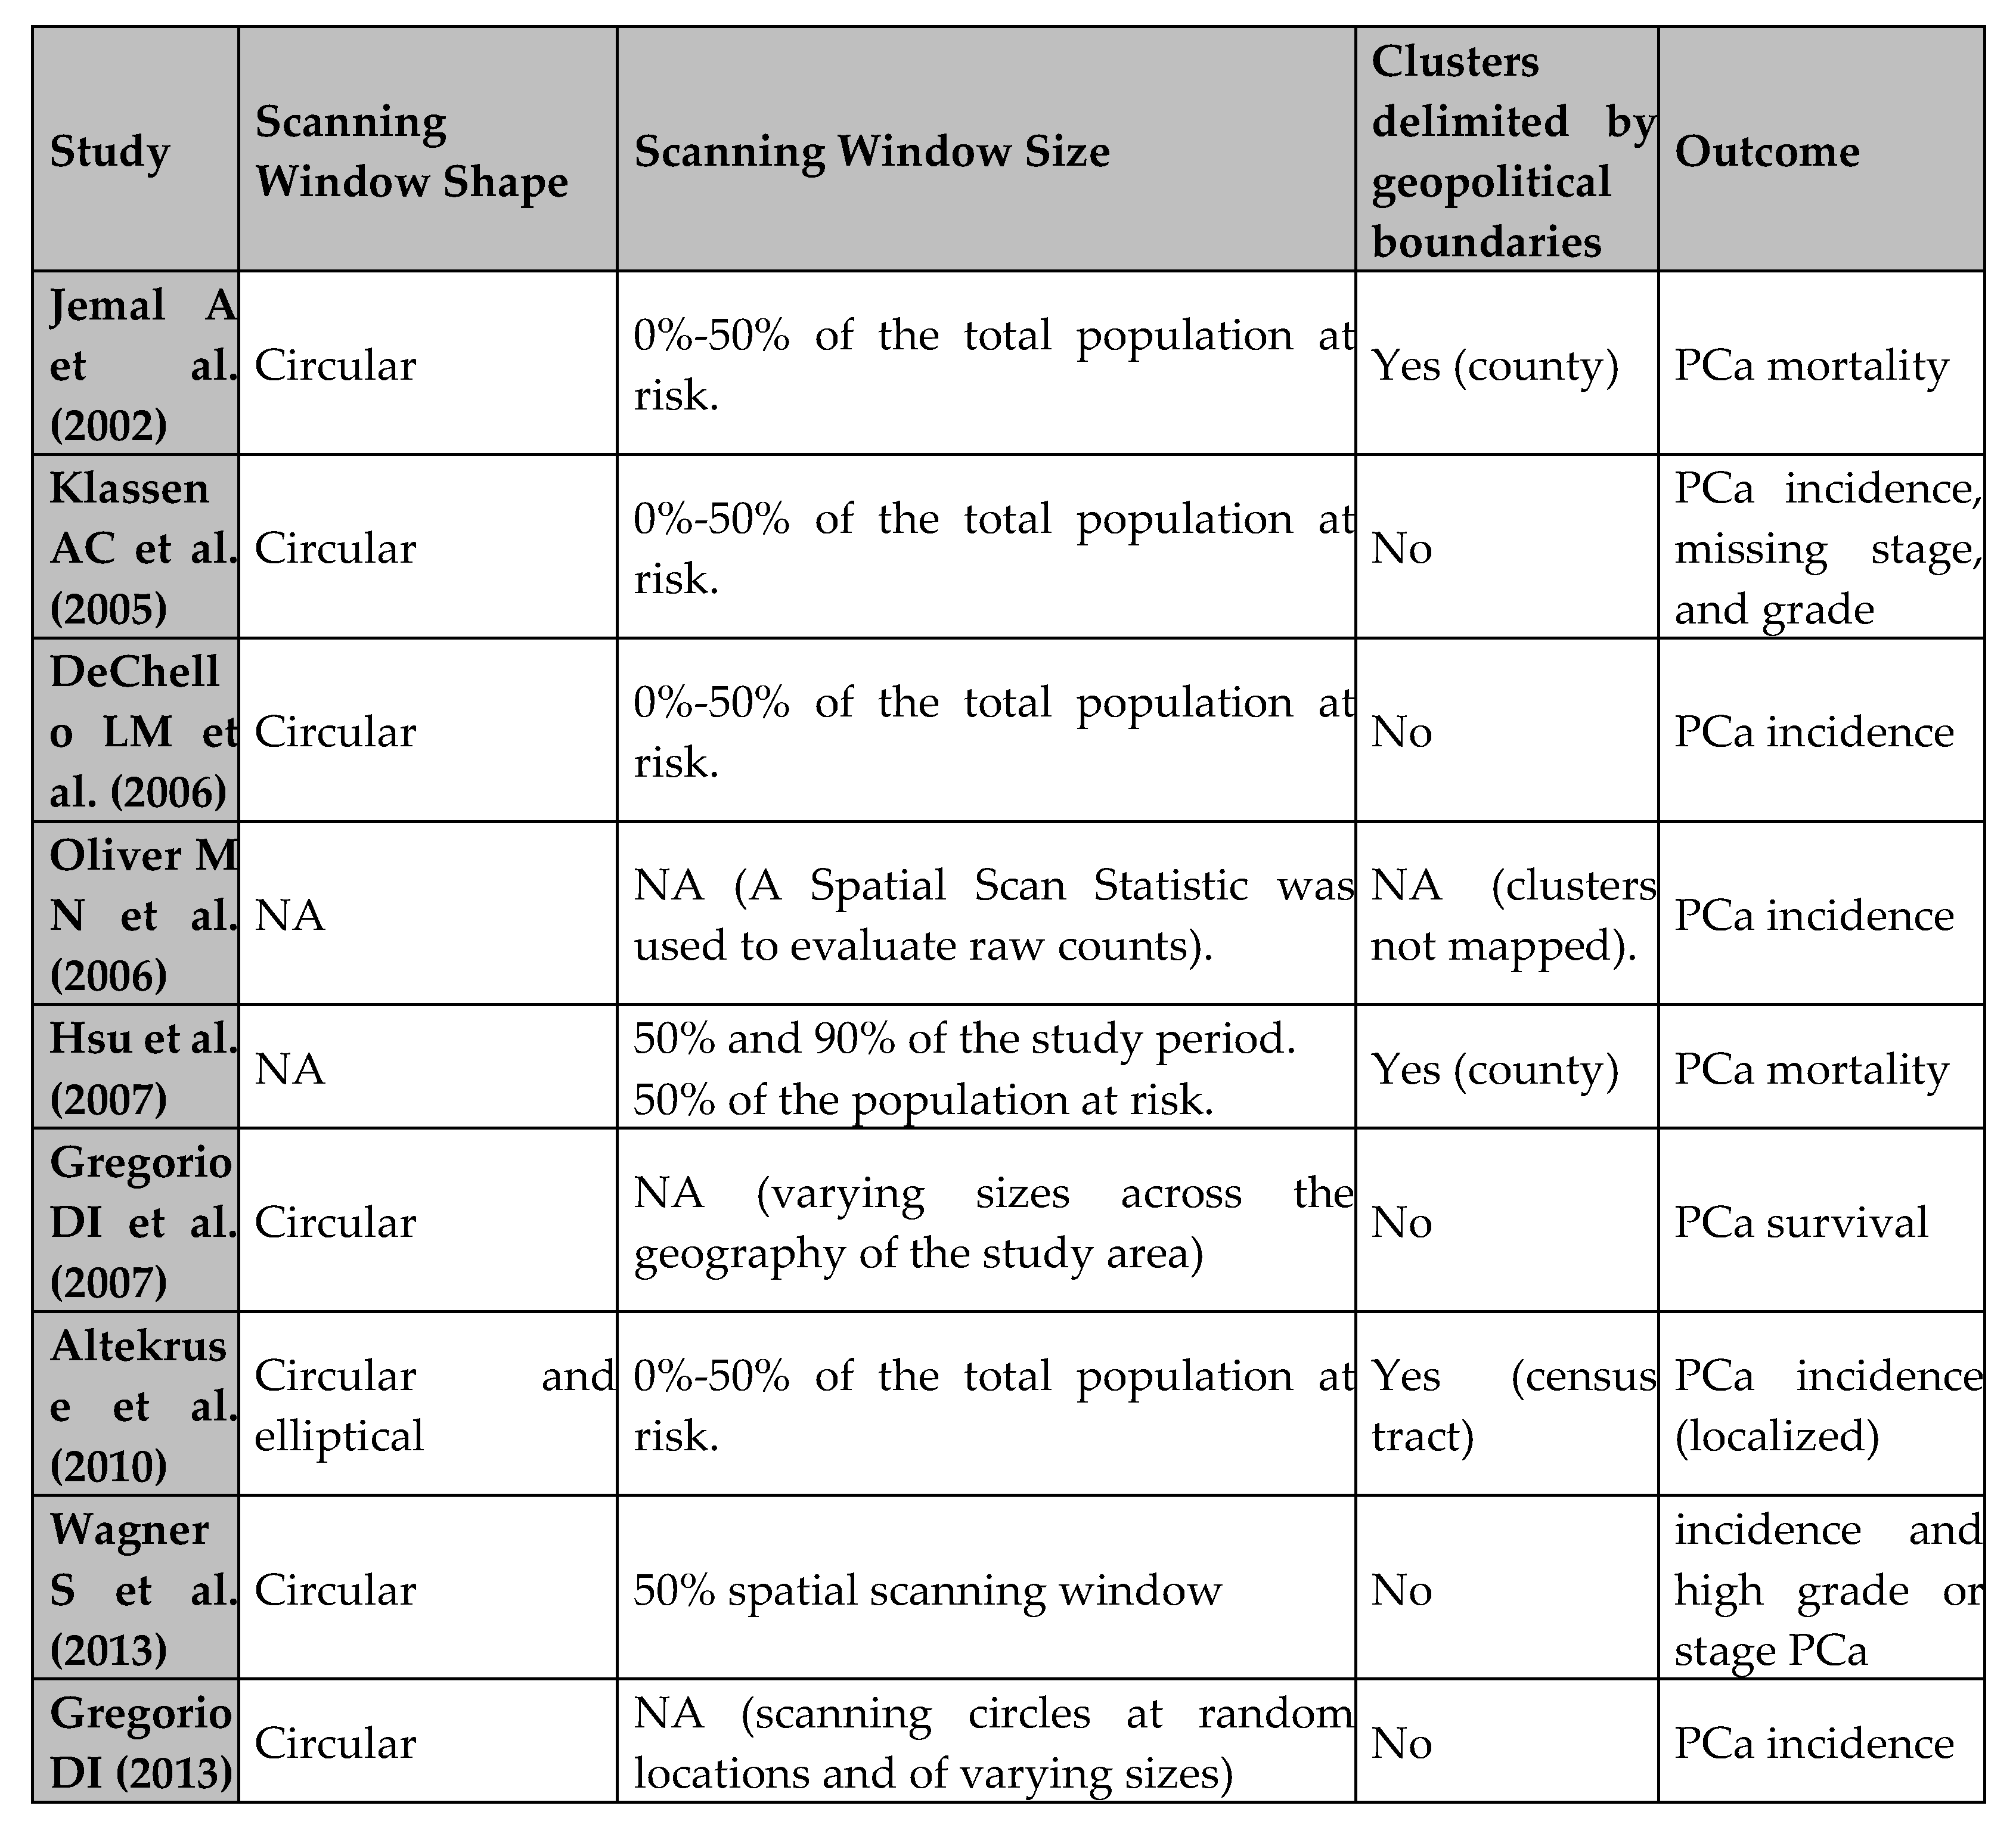
GIS Analysis: Cluster Identification
GIS Analysis: Geographically Weighted Regression (GWR)
Discussion
Main Themes and Findings
Specific GIS Applications in PCa Management
Multilevel Analyses in GIS Research
Limitations and Recommendations
Future Recommendations for GIS Application in PCa Research
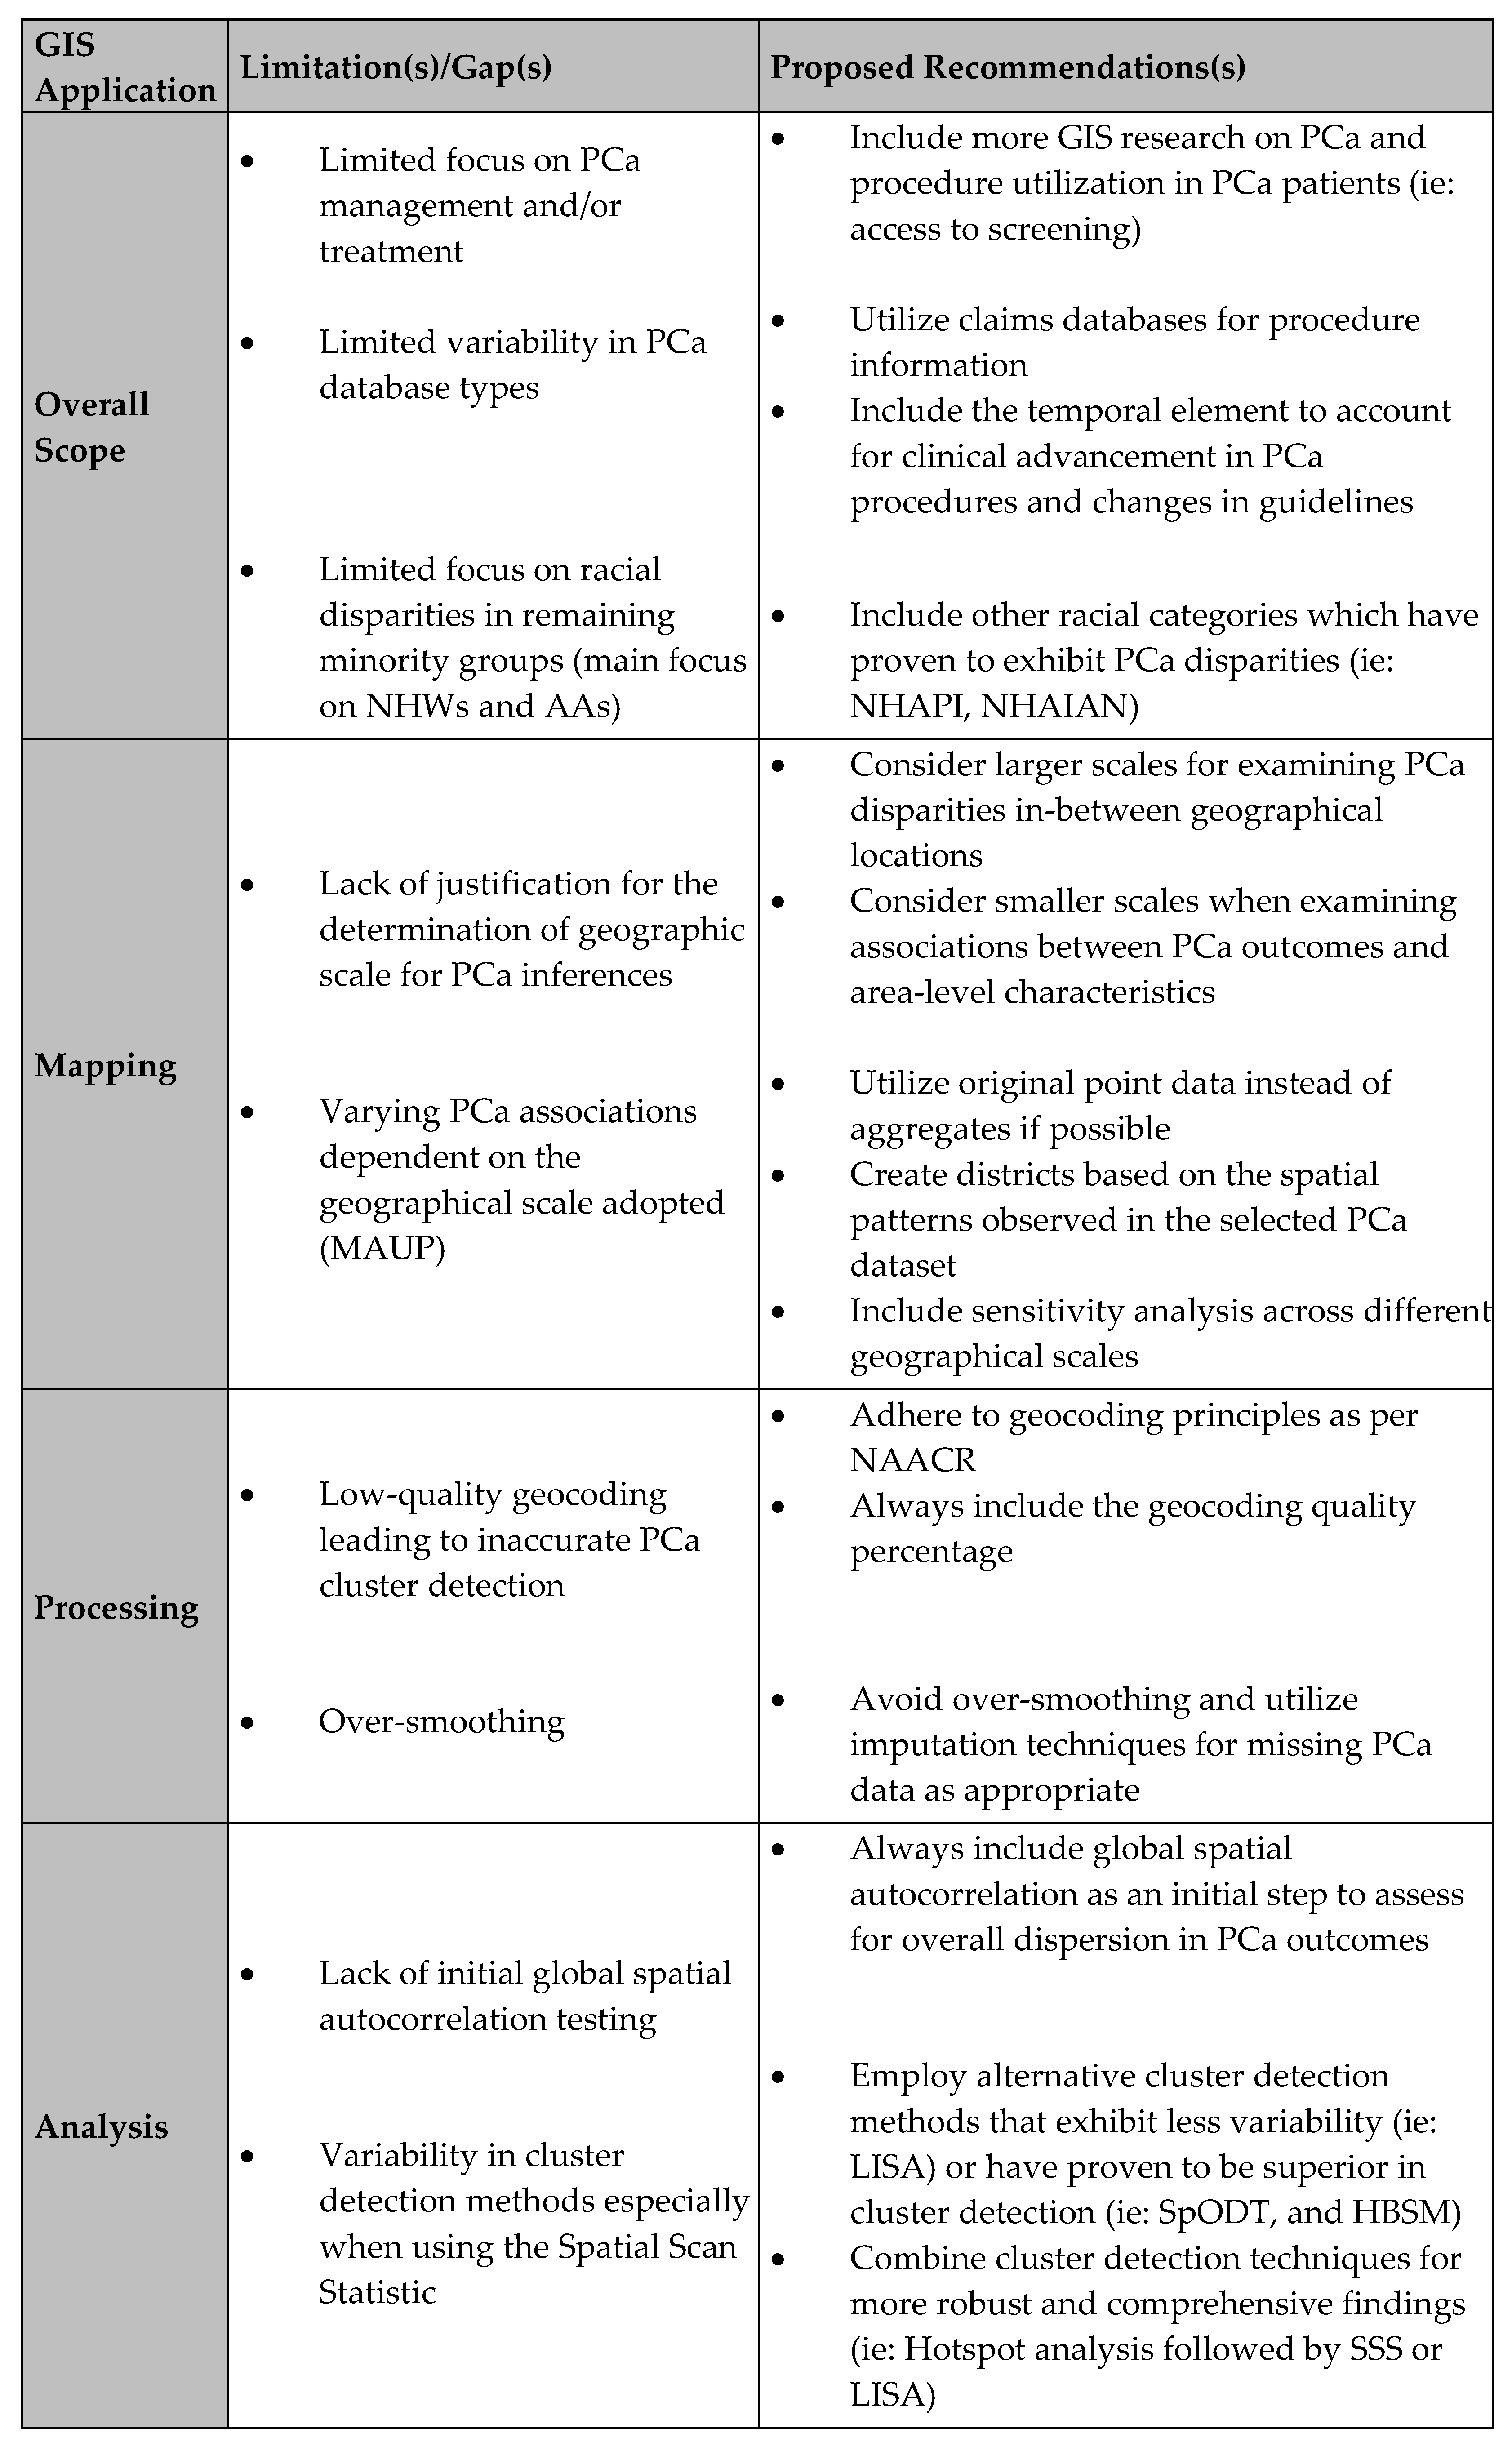
- Expanding the scope to include treatment and management outcomes is crucial. Utilizing comprehensive databases like SEER-Medicare and SPARCS for procedure-level information will provide valuable insights into healthcare access and utilization, leading to a more holistic understanding of PCa disparities.
- Incorporating both spatial and temporal dimensions in GIS research will allow for a more comprehensive assessment of the cancer burden. This can be achieved through preliminary stratification, joinpoint analysis, or detailed discussions that account for ongoing medical advancements and changes in screening recommendations.
- Ensuring racial inclusivity in study populations is also vital. Future research should extend beyond African Americans (AAs) and Non-Hispanic Whites (NHWs) to include other minority groups such as Non-Hispanic Asian/Pacific Islanders (NHAPI). This will provide a broader understanding of racial disparities in PCa outcomes.
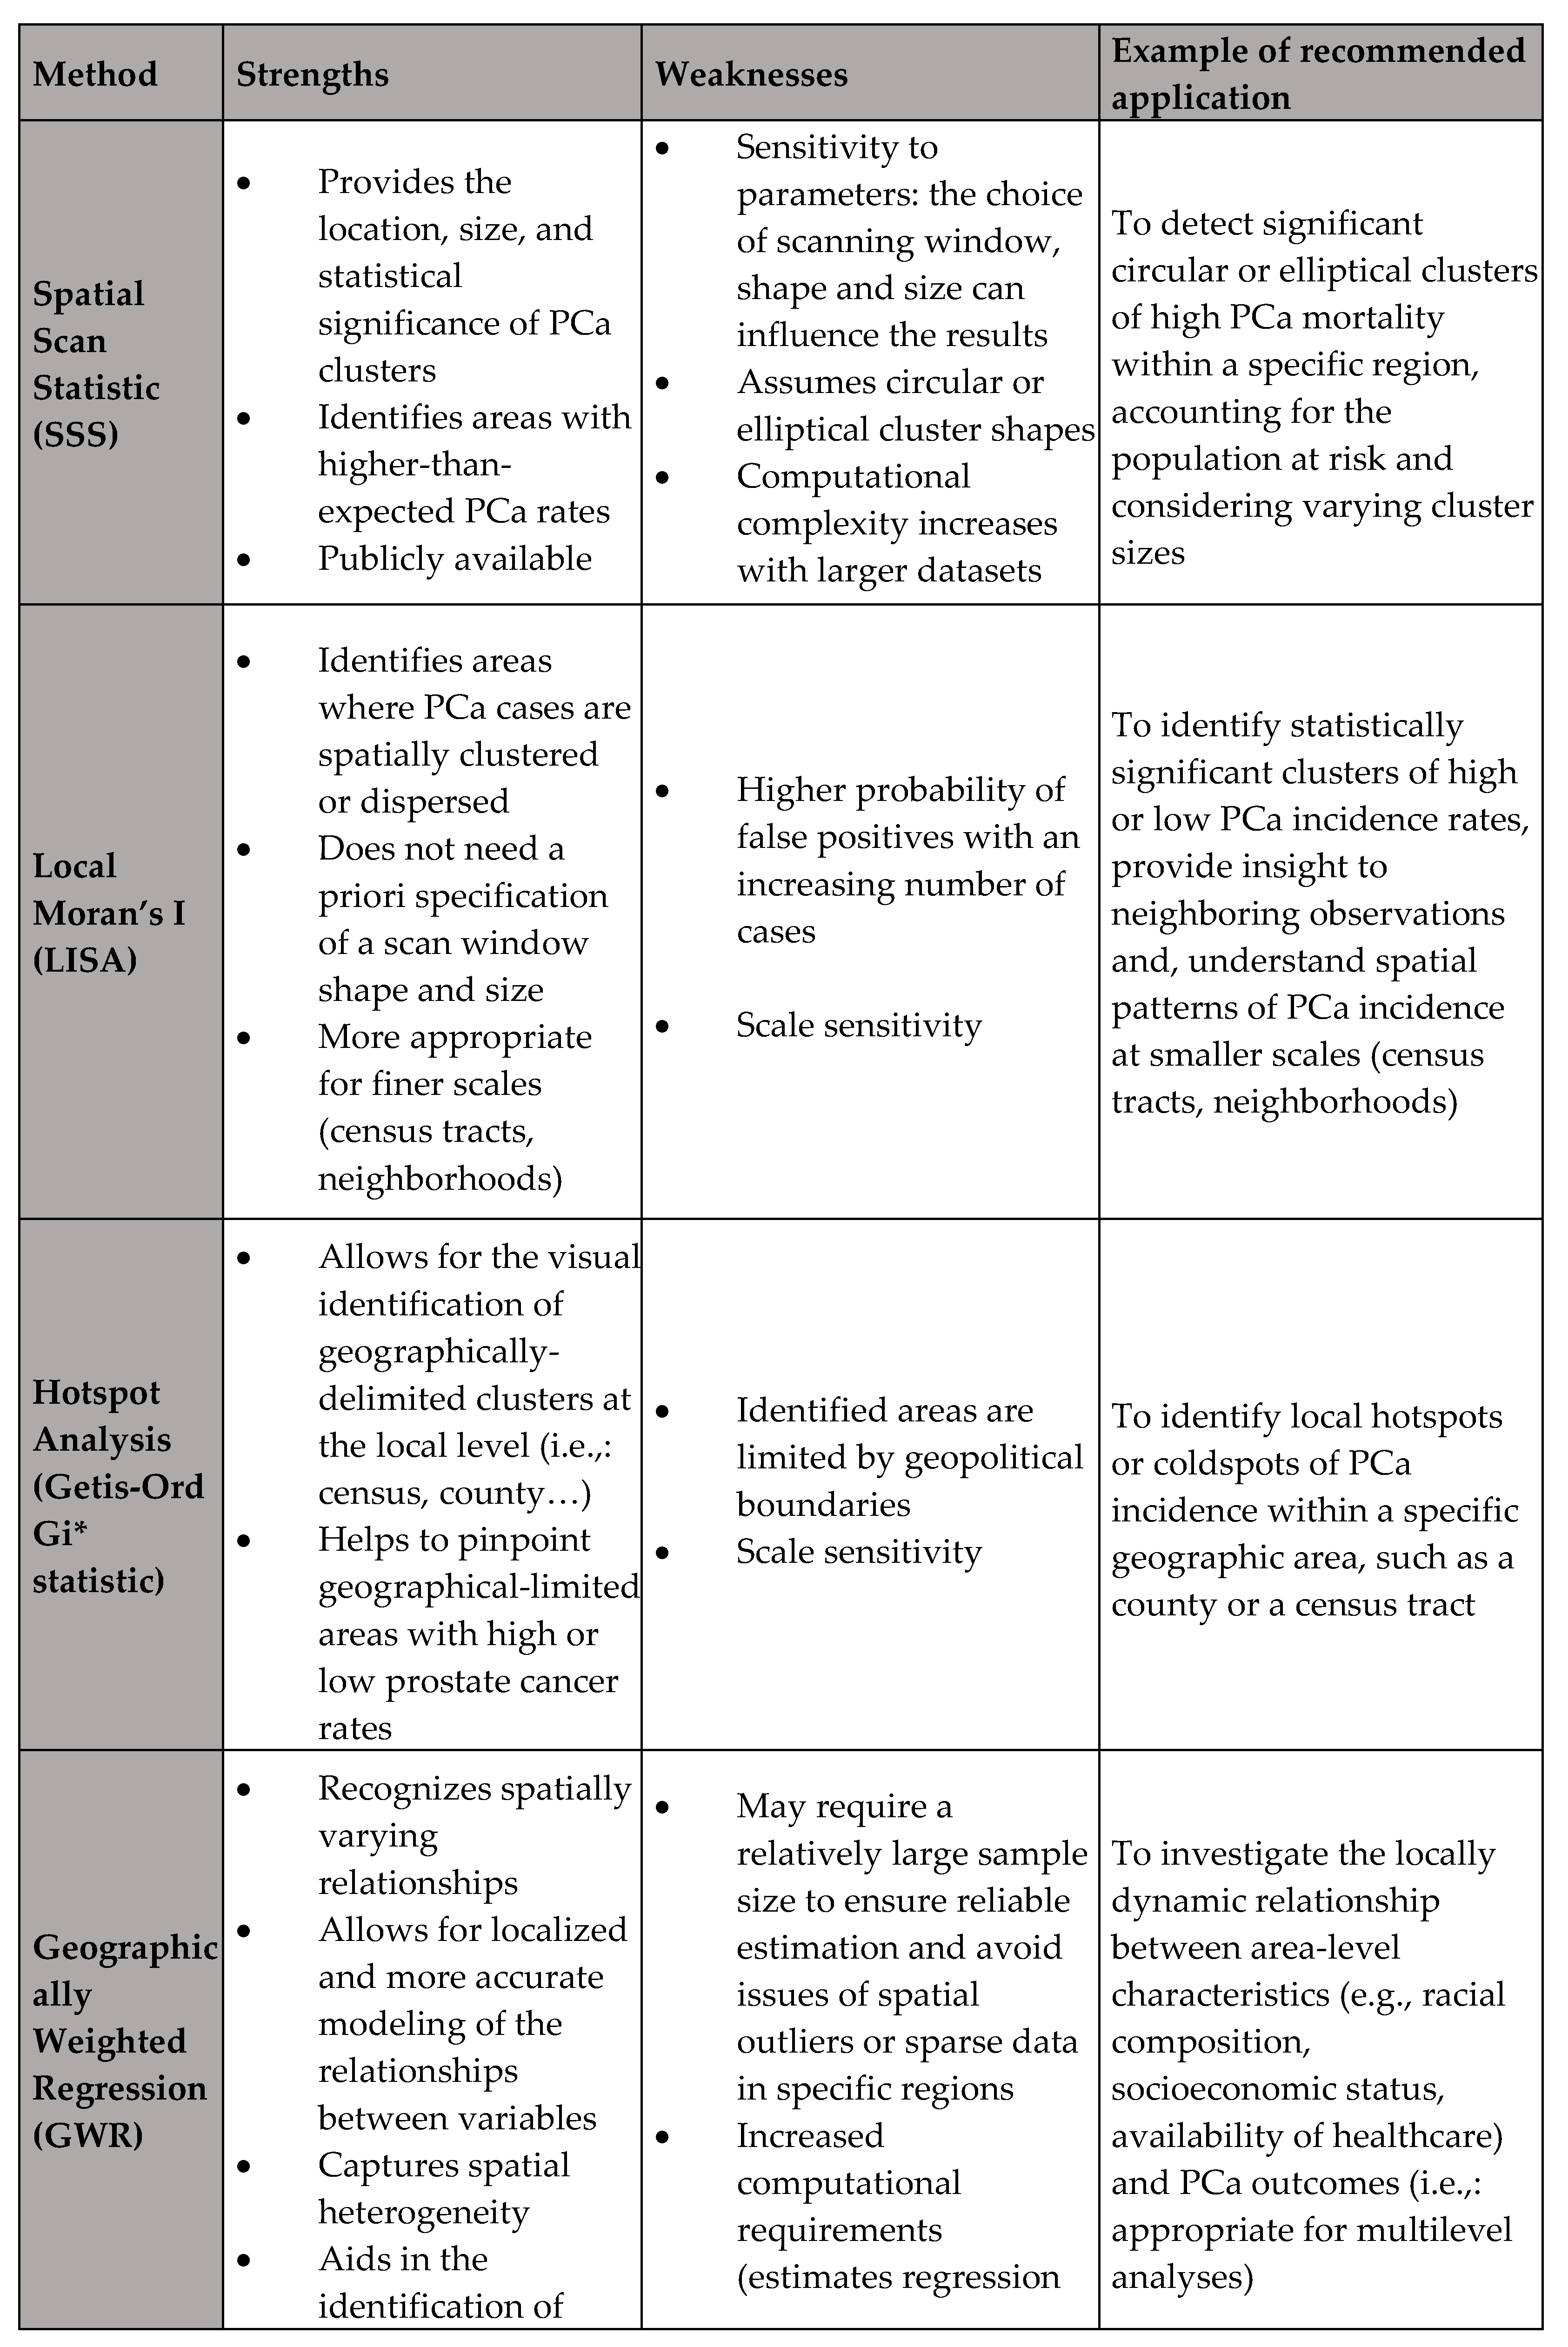
- Combining multiple geospatial approaches for robust cluster detection and sensitivity analysis will enhance the reliability and validity of research findings. Employing techniques like Spatial Scan Statistic (SSS), Local Indicator of Spatial Autocorrelation (LISA), spatial oblique decision trees (SpODT), and hierarchical Bayesian spatial modeling (HBSM) will offer a comprehensive view of spatial patterns and their underlying causes.
- Addressing geocoding quality and the Modifiable Areal Unit Problem (MAUP) is essential. Researchers should adhere to standardized geocoding principles and report geocoding success rates. Conducting sensitivity analyses across different geographical scales and using original point data when possible will mitigate issues related to MAUP and enhance the robustness of findings.
Study Strengths and Limitations
Conclusions
Funding
Data Availability Statement
Conflicts of Interest
Appendix A. Research Strategy



References
- Zavala VA, Bracci PM, Carethers JM, Carvajal-Carmona L, Coggins NB, Cruz-Correa MR, et al. Cancer health disparities in racial/ethnic minorities in the United States. Br J Cancer. 2021;124(2):315-32. [CrossRef] [PubMed] [PubMed Central]
- Rawla P. Epidemiology of Prostate Cancer. World J Oncol. 2019;10(2):63-89. [CrossRef] [PubMed] [PubMed Central]
- Coughlin SS. A review of social determinants of prostate cancer risk, stage, and survival. Prostate Int. 2020;8(2):49-54. [CrossRef] [PubMed] [PubMed Central]
- Siegel RL, Miller KD, Jemal A. Cancer statistics, 2020. CA Cancer J Clin. 2020;70(1):7-30. [CrossRef] [PubMed]
- DeSantis CE, Miller KD, Goding Sauer A, Jemal A, Siegel RL. Cancer statistics for African Americans, 2019. CA Cancer J Clin. 2019;69(3):211-33. [CrossRef] [PubMed]
- Chornokur G, Dalton K, Borysova ME, Kumar NB. Disparities at presentation, diagnosis, treatment, and survival in African American men, affected by prostate cancer. Prostate. 2011;71(9):985-97. [CrossRef] [PubMed] [PubMed Central]
- Dess RT, Hartman HE, Mahal BA, Soni PD, Jackson WC, Cooperberg MR, et al. Association of Black Race With Prostate Cancer-Specific and Other-Cause Mortality. JAMA Oncol. 2019;5(7):975-83. [CrossRef] [PubMed] [PubMed Central]
- Tyson MD, 2nd, Castle EP. Racial disparities in survival for patients with clinically localized prostate cancer adjusted for treatment effects. Mayo Clin Proc. 2014;89(3):300-7. [CrossRef] [PubMed]
- Pinheiro PS, Sherman RL, Trapido EJ, Fleming LE, Huang Y, Gomez-Marin O, et al. Cancer incidence in first generation U.S. Hispanics: Cubans, Mexicans, Puerto Ricans, and new Latinos. Cancer Epidemiol Biomarkers Prev. 2009;18(8):2162-9. [CrossRef] [PubMed]
- Ho GY, Figueroa-Valles NR, De La Torre-Feliciano T, Tucker KL, Tortolero-Luna G, Rivera WT, et al. Cancer disparities between mainland and island Puerto Ricans. Rev Panam Salud Publica. 2009;25(5):394-400. [CrossRef] [PubMed]
- Dasgupta P, Baade PD, Aitken JF, Ralph N, Chambers SK, Dunn J. Geographical Variations in Prostate Cancer Outcomes: A Systematic Review of International Evidence. Front Oncol. 2019;9:238. [CrossRef] [PubMed] [PubMed Central]
- Baade PD, Yu XQ, Smith DP, Dunn J, Chambers SK. Geographic disparities in prostate cancer outcomes--review of international patterns. Asian Pac J Cancer Prev. 2015;16(3):1259-75. [CrossRef] [PubMed]
- Obertova Z, Brown C, Holmes M, Lawrenson R. Prostate cancer incidence and mortality in rural men--a systematic review of the literature. Rural Remote Health. 2012;12(2):2039. [PubMed]
- Afshar N, English DR, Milne RL. Rural-urban residence and cancer survival in high-income countries: A systematic review. Cancer. 2019;125(13):2172-84. [CrossRef] [PubMed]
- Gilbert SM, Pow-Sang JM, Xiao H. Geographical Factors Associated With Health Disparities in Prostate Cancer. Cancer Control. 2016;23(4):401-8. [CrossRef] [PubMed]
- Research NCIGPfC. Health Disparities Information. https://giscancergov/research/health_disparitieshrml.
- Cobb CD. Geospatial Analysis: A New Window Into Educational Equity, Access, and Opportunity. Review of Research in Education. 04/21/2020;Volume 44, Issue 1. [CrossRef]
- Adebola TM, Fennell HWW, Druitt MD, Bonin CA, Jenifer VA, van Wijnen AJ, et al. Population-Level Patterns of Prostate Cancer Occurrence: Disparities in Virginia. Curr Mol Biol Rep. 2022;8(1):1-8. [CrossRef] [PubMed] [PubMed Central]
- Freeman VL, Ricardo AC, Campbell RT, Barrett RE, Warnecke RB. Association of census tract-level socioeconomic status with disparities in prostate cancer-specific survival. Cancer Epidemiol Biomarkers Prev. 2011;20(10):2150-9. [CrossRef] [PubMed] [PubMed Central]
- Washington C, Deville C, Jr. Health disparities and inequities in the utilization of diagnostic imaging for prostate cancer. Abdom Radiol (NY). 2020;45(12):4090-6. [CrossRef] [PubMed]
- Ajayi A, Hwang WT, Vapiwala N, Rosen M, Chapman CH, Both S, et al. Disparities in staging prostate magnetic resonance imaging utilization for nonmetastatic prostate cancer patients undergoing definitive radiation therapy. Adv Radiat Oncol. 2016;1(4):325-32. [CrossRef] [PubMed] [PubMed Central]
- El Khoury CJ, Ros PR. A Systematic Review for Health Disparities and Inequities in Multiparametric Magnetic Resonance Imaging for Prostate Cancer Diagnosis. Acad Radiol. 2021;28(7):953-62. [CrossRef] [PubMed]
- Orom H, Biddle C, Underwood W, 3rd, Homish GG, Olsson CA. Racial or Ethnic and Socioeconomic Disparities in Prostate Cancer Survivors’ Prostate-specific Quality of Life. Urology. 2018;112:132-7. [CrossRef] [PubMed] [PubMed Central]
- Beale L, Abellan JJ, Hodgson S, Jarup L. Methodologic issues and approaches to spatial epidemiology. Environ Health Perspect. 2008;116(8):1105-10. [CrossRef] [PubMed] [PubMed Central]
- Seidman CS. An introduction to prostate cancer and geographic information systems. Am J Prev Med. 2006;30(2 Suppl):S1-2. [CrossRef] [PubMed]
- DM M. Geographic information science: defining the field. In: Duckham M, Goodchild MF, Worboys MF, eds Foundations of Geographic Information Science New York: Taylor & Francis; 2003:3-18. 2003.
- University Consortium for Geographic Information Science (UCGIS). UCGIS bylaws. 2016 version. Washington, DC: UCGIS; 2016 Available at: http://wwwucgisorg/assets/docs/ucgis_bylaws_march2016pdf.
- Sahar L, Foster SL, Sherman RL, Henry KA, Goldberg DW, Stinchcomb DG, et al. GIScience and cancer: State of the art and trends for cancer surveillance and epidemiology. Cancer. 2019;125(15):2544-60. [CrossRef] [PubMed] [PubMed Central]
- Elliott P, Wartenberg D. Spatial epidemiology: current approaches and future challenges. Environ Health Perspect. 2004;112(9):998-1006. [CrossRef] [PubMed] [PubMed Central]
- Lyseen AK, Nohr C, Sorensen EM, Gudes O, Geraghty EM, Shaw NT, et al. A Review and Framework for Categorizing Current Research and Development in Health Related Geographical Information Systems (GIS) Studies. Yearb Med Inform. 2014;9(1):110-24. [CrossRef] [PubMed] [PubMed Central]
- DeRouen MC, Schupp CW, Koo J, Yang J, Hertz A, Shariff-Marco S, et al. Impact of individual and neighborhood factors on disparities in prostate cancer survival. Cancer Epidemiol. 2018;53:1-11. [CrossRef] [PubMed] [PubMed Central]
- DeRouen MC, Schupp CW, Yang J, Koo J, Hertz A, Shariff-Marco S, et al. Impact of individual and neighborhood factors on socioeconomic disparities in localized and advanced prostate cancer risk. Cancer Causes Control. 2018;29(10):951-66. [CrossRef] [PubMed] [PubMed Central]
- Higgins JP, Altman DG, Gotzsche PC, Juni P, Moher D, Oxman AD, et al. The Cochrane Collaboration’s tool for assessing risk of bias in randomised trials. BMJ. 2011;343:d5928. www.icmje.org/coi_disclosure.pdf (available on request from the corresponding author) and declare support from the Cochrane Collaboration for the development and evaluation of the tool described; they have no financial relationships with any organisations that might have an interest in the submitted work in the previous three years and no other relationships or activities that could appear to have influenced the submitted work. [CrossRef] [PubMed] [PubMed Central]
- Liberati A, Altman DG, Tetzlaff J, Mulrow C, Gotzsche PC, Ioannidis JP, et al. The PRISMA statement for reporting systematic reviews and meta-analyses of studies that evaluate healthcare interventions: explanation and elaboration. BMJ. 2009;339:b2700. [CrossRef] [PubMed] [PubMed Central]
- PubMED. https://pubmedncbinlmnihgov.
- EMBASE. https://wwwembasecom/landing?status=grey.
- Web of Science - Clarivate. https://wwwwebofsciencecom/wos/woscc/basic-search.
- Jemal A, Kulldorff M, Devesa SS, Hayes RB, Fraumeni JF, Jr. A geographic analysis of prostate cancer mortality in the United States, 1970-89. Int J Cancer. 2002;101(2):168-74. [CrossRef] [PubMed]
- Klassen AC, Kulldorff M, Curriero F. Geographical clustering of prostate cancer grade and stage at diagnosis, before and after adjustment for risk factors. Int J Health Geogr. 2005;4(1):1. [CrossRef] [PubMed] [PubMed Central]
- DeChello LM, Gregorio DI, Samociuk H. Race-specific geography of prostate cancer incidence. Int J Health Geogr. 2006;5:59. [CrossRef] [PubMed] [PubMed Central]
- Oliver MN, Smith E, Siadaty M, Hauck FR, Pickle LW. Spatial analysis of prostate cancer incidence and race in Virginia, 1990-1999. Am J Prev Med. 2006;30(2 Suppl):S67-76. [CrossRef] [PubMed]
- Gregorio DI, Huang L, DeChello LM, Samociuk H, Kulldorff M. Place of residence effect on likelihood of surviving prostate cancer. Ann Epidemiol. 2007;17(7):520-4. [CrossRef] [PubMed]
- Xiao H, Gwede CK, Kiros G, Milla K. Analysis of prostate cancer incidence using geographic information system and multilevel modeling. J Natl Med Assoc. 2007;99(3):218-25. [PubMed] [PubMed Central]
- Hsu CE, Mas FS, Miller JA, Nkhoma ET. A spatial-temporal approach to surveillance of prostate cancer disparities in population subgroups. J Natl Med Assoc. 2007;99(1):72-80, 5-7. [PubMed] [PubMed Central]
- Hinrichsen VL, Klassen AC, Song C, Kulldorff M. Evaluation of the performance of tests for spatial randomness on prostate cancer data. Int J Health Geogr. 2009;8:41. [CrossRef] [PubMed] [PubMed Central]
- Meliker JR, Goovaerts P, Jacquez GM, Avruskin GA, Copeland G. Breast and prostate cancer survival in Michigan: can geographic analyses assist in understanding racial disparities? Cancer. 2009;115(10):2212-21. [CrossRef] [PubMed] [PubMed Central]
- Hebert JR, Daguise VG, Hurley DM, Wilkerson RC, Mosley CM, Adams SA, et al. Mapping cancer mortality-to-incidence ratios to illustrate racial and sex disparities in a high-risk population. Cancer. 2009;115(11):2539-52. [CrossRef] [PubMed] [PubMed Central]
- Altekruse SF, Huang L, Cucinelli JE, McNeel TS, Wells KM, Oliver MN. Spatial patterns of localized-stage prostate cancer incidence among white and black men in the southeastern United States, 1999-2001. Cancer Epidemiol Biomarkers Prev. 2010;19(6):1460-7. [CrossRef] [PubMed] [PubMed Central]
- Goovaerts P, Xiao H. Geographical, temporal and racial disparities in late-stage prostate cancer incidence across Florida: a multiscale joinpoint regression analysis. Int J Health Geogr. 2011;10:63. [CrossRef] [PubMed] [PubMed Central]
- Xiao H, Tan F, Goovaerts P. Racial and geographic disparities in late-stage prostate cancer diagnosis in Florida. J Health Care Poor Underserved. 2011;22(4 Suppl):187-99. [CrossRef] [PubMed] [PubMed Central]
- Goovaerts P, Xiao H. The impact of place and time on the proportion of late-stage diagnosis: the case of prostate cancer in Florida, 1981-2007. Spat Spatiotemporal Epidemiol. 2012;3(3):243-53. [CrossRef] [PubMed] [PubMed Central]
- Goovaerts P. Analysis of geographical disparities in temporal trends of health outcomes using space-time joinpoint regression. Int J Appl Earth Obs Geoinf. 2013;22:75-85. [CrossRef] [PubMed] [PubMed Central]
- Wagner SE, Bauer SE, Bayakly AR, Vena JE. Prostate cancer incidence and tumor severity in Georgia: descriptive epidemiology, racial disparity, and geographic trends. Cancer Causes Control. 2013;24(1):153-66. [CrossRef] [PubMed]
- Gregorio DI, Samociuk H. Prostate cancer incidence in light of the spatial distribution of another screening-detectable cancer. Spat Spatiotemporal Epidemiol. 2013;6:1-6. [CrossRef] [PubMed]
- Goovaerts P, Xiao H, Adunlin G, Ali A, Tan F, Gwede CK, et al. Geographically-Weighted Regression Analysis of Percentage of Late-Stage Prostate Cancer Diagnosis in Florida. Appl Geogr. 2015;62:191-200. [CrossRef] [PubMed] [PubMed Central]
- Wang M, Matthews SA, Iskandarani K, Li Y, Li Z, Chinchilli VM, et al. Spatial-temporal analysis of prostate cancer incidence from the Pennsylvania Cancer Registry, 2000-2011. Geospat Health. 2017;12(2):611. [CrossRef] [PubMed] [PubMed Central]
- Wang M, Chi G, Bodovski Y, Holder SL, Lengerich EJ, Wasserman E, et al. Temporal and spatial trends and determinants of aggressive prostate cancer among Black and White men with prostate cancer. Cancer Causes Control. 2020;31(1):63-71. [CrossRef] [PubMed]
- Aghdam N, Carrasquilla M, Wang E, Pepin AN, Danner M, Ayoob M, et al. Ten-Year Single Institutional Analysis of Geographic and Demographic Characteristics of Patients Treated With Stereotactic Body Radiation Therapy for Localized Prostate Cancer. Front Oncol. 2020;10:616286. [CrossRef] [PubMed] [PubMed Central]
- Georgantopoulos P, Eberth JM, Cai B, Rao G, Bennett CL, Emrich CT, et al. A spatial assessment of prostate cancer mortality-to-incidence ratios among South Carolina veterans: 1999-2015. Ann Epidemiol. 2021;59:24-32. [CrossRef] [PubMed]
- Moore JX, Tingen MS, Coughlin SS, O’Meara C, Odhiambo L, Vernon M, et al. Understanding geographic and racial/ethnic disparities in mortality from four major cancers in the state of Georgia: a spatial epidemiologic analysis, 1999-2019. Sci Rep. 2022;12(1):14143. [CrossRef] [PubMed] [PubMed Central]
- Aladuwaka S, Alagan R, Singh R, Mishra M. Health Burdens and SES in Alabama: Using Geographic Information System to Examine Prostate Cancer Health Disparity. Cancers (Basel). 2022;14(19). [CrossRef] [PubMed] [PubMed Central]
- Tang C, Lei X, Smith GL, Pan HY, Hoffman KE, Kumar R, et al. Influence of Geography on Prostate Cancer Treatment. Int J Radiat Oncol Biol Phys. 2021;109(5):1286-95. [CrossRef] [PubMed] [PubMed Central]
- Moyer VA, Force USPST. Screening for prostate cancer: U.S. Preventive Services Task Force recommendation statement. Ann Intern Med. 2012;157(2):120-34. [CrossRef] [PubMed]
- Maguire D. ArcGIS: General Purpose GIS Software System. . In: Shekhar, S, Xiong, H (eds) Encyclopedia of GIS Springer, Boston, MA. 2008. [CrossRef]
- Esri AP. ArcGIS Online. https://wwwesricom/en-us/landing-page/product/2019/arcgis-online/overview/.
- Griffith DA. Estimators of Spatial Autocorrelation. Encyclopedia of Social Measurement. 2005;Volume 3, p. 581.
- Tobler W. A computer movie simulating urban growth in the Detroit Region. Economic Geography. 1970;46:234–240.
- Kulldorff M, Nagarwalla N. Spatial disease clusters: detection and inference. Stat Med. 1995;14(8):799-810. [CrossRef] [PubMed]
- Arthur Getis JKO. The Analysis of Spatial Association by Use of Distance Statistics. Geographical Analysis. 1992. [CrossRef]
- Disparities UPC. https://wwwccsnwiorg/prostatecancerdisparitieshtml.
- Cackowski FC, Mahal B, Heath EI, Carthon B. Evolution of Disparities in Prostate Cancer Treatment: Is This a New Normal? Am Soc Clin Oncol Educ Book. 2021;41:1-12. [CrossRef] [PubMed]
- SEER-Medicare Linked Data Resource. https://healthcaredeliverycancergov/seermedicare/.
- Statewide Planning and Research Cooperative System (SPARCS). https://wwwhealthnygov/statistics/sparcs/.
- Arega MA, Yang DD, Royce TJ, Mahal BA, Dee EC, Butler SS, et al. Association Between Travel Distance and Use of Postoperative Radiation Therapy Among Men With Organ-Confined Prostate Cancer: Does Geography Influence Treatment Decisions? Pract Radiat Oncol. 2021;11(4):e426-e33. [CrossRef] [PubMed]
- Muralidhar V, Rose BS, Chen YW, Nezolosky MD, Nguyen PL. Association Between Travel Distance and Choice of Treatment for Prostate Cancer: Does Geography Reduce Patient Choice? Int J Radiat Oncol Biol Phys. 2016;96(2):313-7. [CrossRef] [PubMed]
- Holmes JA, Carpenter WR, Wu Y, Hendrix LH, Peacock S, Massing M, et al. Impact of distance to a urologist on early diagnosis of prostate cancer among black and white patients. J Urol. 2012;187(3):883-8. [CrossRef] [PubMed]
- Dobbs RW, Malhotra NR, Caldwell BM, Rojas R, Moreira DM, Abern MR. Determinants of Clinic Absenteeism: A Novel Method of Examining Distance from Clinic and Transportation. J Community Health. 2018;43(1):19-26. [CrossRef] [PubMed]
- Teshale AB, Amare T. Exploring spatial variations and the individual and contextual factors of uptake of measles-containing second dose vaccine among children aged 24 to 35 months in Ethiopia. PLoS One. 2023;18(1):e0280083. [CrossRef] [PubMed] [PubMed Central]
- Saha A, Hayen A, Ali M, Rosewell A, MacIntyre CR, Clemens JD, et al. Socioeconomic drivers of vaccine uptake: An analysis of the data of a geographically defined cluster randomized cholera vaccine trial in Bangladesh. Vaccine. 2018;36(31):4742-9. [CrossRef] [PubMed] [PubMed Central]
- Zahnd WE, McLafferty SL, Sherman RL, Klonoff-Cohen H, Farner S, Rosenblatt KA. Spatial Accessibility to Mammography Services in the Lower Mississippi Delta Region States. J Rural Health. 2019;35(4):550-9. [CrossRef] [PubMed]
- Pudrovska T, Anishkin A. Clarifying the positive association between education and prostate cancer: a Monte Carlo simulation approach. J Appl Gerontol. 2015;34(3):293-316. [CrossRef] [PubMed] [PubMed Central]
- Bostwick DG, Burke HB, Djakiew D, Euling S, Ho SM, Landolph J, et al. Human prostate cancer risk factors. Cancer. 2004;101(10 Suppl):2371-490. [CrossRef] [PubMed]
- El Khoury CJ, Sean A. P. Clouston. Racial/Ethnic Disparities in Prostate Cancer 5-Year Survival: The Role of Health-Care Access and Disease Severity. Cancers. 2023.
- Iris Hui WKTC. 3.13 - Spatial Dimensions of American Politics,. Editor(s): Bo Huang, Comprehensive Geographic Information Systems, Elsevier, Pages 181-188, ISBN 9780128047934,. 2018. [CrossRef]
- Openshaw STMAUPPI---.
- M.D. Su M-CL, T.H. Wen. Spatial Mapping and Environmental Risk Identification. Encyclopedia of Environmental Health, 2011, Pages 228-235. 2011;National Taiwan University, Taipei, Taiwan, Available online 3 March 2011.
- Grande D, Asch DA, Wan F, Bradbury AR, Jagsi R, Mitra N. Are Patients With Cancer Less Willing to Share Their Health Information? Privacy, Sensitivity, and Social Purpose. J Oncol Pract. 2015;11(5):378-83. [CrossRef] [PubMed] [PubMed Central]
- Luo L, McLafferty S, Wang F. Analyzing spatial aggregation error in statistical models of late-stage cancer risk: a Monte Carlo simulation approach. Int J Health Geogr. 2010;9:51. [CrossRef] [PubMed] [PubMed Central]
- Goldberg DW, Ballard M, Boyd JH, Mullan N, Garfield C, Rosman D, et al. An evaluation framework for comparing geocoding systems. Int J Health Geogr. 2013;12:50. [CrossRef] [PubMed] [PubMed Central]
- Oliver MN, Matthews KA, Siadaty M, Hauck FR, Pickle LW. Geographic bias related to geocoding in epidemiologic studies. Int J Health Geogr. 2005;4:29. [CrossRef] [PubMed] [PubMed Central]
- Walter SR, Rose N. Random property allocation: A novel geographic imputation procedure based on a complete geocoded address file. Spat Spatiotemporal Epidemiol. 2013;6:7-16. [CrossRef] [PubMed]
- Howlader N, Noone AM, Yu M, Cronin KA. Use of imputed population-based cancer registry data as a method of accounting for missing information: application to estrogen receptor status for breast cancer. Am J Epidemiol. 2012;176(4):347-56. [CrossRef] [PubMed] [PubMed Central]
- Henry KA, Boscoe FP. Estimating the accuracy of geographical imputation. Int J Health Geogr. 2008;7:3. [CrossRef] [PubMed] [PubMed Central]
- Sanderson M, Coker AL, Perez A, Du XL, Peltz G, Fadden MK. A multilevel analysis of socioeconomic status and prostate cancer risk. Ann Epidemiol. 2006;16(12):901-7. [CrossRef] [PubMed] [PubMed Central]
- Geary RCTCRaSMTIS, 5, 115-145. [CrossRef]
- Anselin L, Li X. Operational Local Join Count Statistics for Cluster Detection. J Geogr Syst. 2019;21(2):189-210. [CrossRef] [PubMed] [PubMed Central]
- Thatcher EJ, Camacho F, Anderson RT, Li L, Cohn WF, DeGuzman PB, et al. Spatial analysis of colorectal cancer outcomes and socioeconomic factors in Virginia. BMC Public Health. 2021;21(1):1908. [CrossRef] [PubMed] [PubMed Central]
- Moraga P, Montes F. Detection of spatial disease clusters with LISA functions. Stat Med. 2011;30(10):1057-71. [CrossRef] [PubMed]
- Esri AP. https://pro.arcgis.com/en/pro-app/latest/tool-reference/spatial-statistics/h-how-hot-spot-analysis-getis-ord-gi-spatial-stati.htm.
- Goungounga JA, Gaudart J, Colonna M, Giorgi R. Impact of socioeconomic inequalities on geographic disparities in cancer incidence: comparison of methods for spatial disease mapping. BMC Med Res Methodol. 2016;16(1):136. [CrossRef] [PubMed] [PubMed Central]
- Johnson GD. Small area mapping of prostate cancer incidence in New York State (USA) using fully Bayesian hierarchical modelling. Int J Health Geogr. 2004;3(1):29. [CrossRef] [PubMed] [PubMed Central]
- Guttmann A, Li X, Gaudart J, Gerard Y, Demongeot J, Boire JY, et al. Spatial heterogeneity of type I error for local cluster detection tests. Int J Health Geogr. 2014;13:15. [CrossRef] [PubMed] [PubMed Central]
- Walter SD. Visual and statistical assessment of spatial clustering in mapped data. Stat Med. 1993;12(14):1275-91. [PubMed]
- 2013. LABdmhmiseSENYCp.
- Alexander Fotheringham CFB, Martin Charlton Geographically Weighted Regression: The Analysis of Spatially Varying Relationships. 2002;https://www.researchgate.net/publication/27246972_Geographically_Weighted_Regression_The_Analysis_of_Spatially_Varying_Relationships.
- Kim SG, Cho SH, Lambert DM, Roberts RK. Measuring the value of air quality: application of the spatial hedonic model. Air Qual Atmos Health. 2010;3(1):41-51. [CrossRef] [PubMed] [PubMed Central]
- Iyengar S, Hall IJ, Sabatino SA. Racial/Ethnic Disparities in Prostate Cancer Incidence, Distant Stage Diagnosis, and Mortality by U.S. Census Region and Age Group, 2012-2015. Cancer Epidemiol Biomarkers Prev. 2020;29(7):1357-64. [CrossRef] [PubMed] [PubMed Central]
- Kish JK, Yu M, Percy-Laurry A, Altekruse SF. Racial and ethnic disparities in cancer survival by neighborhood socioeconomic status in Surveillance, Epidemiology, and End Results (SEER) Registries. J Natl Cancer Inst Monogr. 2014;2014(49):236-43. [CrossRef] [PubMed] [PubMed Central]
- Gourd E. New advances in prostate cancer screening and monitoring. Lancet Oncol. 2020;21(7):887. [CrossRef] [PubMed]
- Census.gov. https://www.census.gov/content/dam/Census/library/publications/2020/acs/acs_geography_handbook_2020_ch02.pdf.
- Gaudart J, Poudiougou B, Ranque S, Doumbo O. Oblique decision trees for spatial pattern detection: optimal algorithm and application to malaria risk. BMC Med Res Methodol. 2005 Jul 18;5:22. [CrossRef] [PubMed] [PubMed Central]
- Graham-Steed T, Uchio E, Wells CK, Aslan M, Ko J, Concato J. ‘Race’ and prostate cancer mortality in equal-access healthcare systems. Am J Med. 2013 Dec;126(12):1084-8. [CrossRef] [PubMed] [PubMed Central]
- Iyengar S, Hall IJ, Sabatino SA. Racial/Ethnic Disparities in Prostate Cancer Incidence, Distant Stage Diagnosis, and Mortality by U.S. Census Region and Age Group, 2012-2015. Cancer Epidemiol Biomarkers Prev. 2020 Jul;29(7):1357-1364. [CrossRef] [PubMed] [PubMed Central]




Disclaimer/Publisher’s Note: The statements, opinions and data contained in all publications are solely those of the individual author(s) and contributor(s) and not of MDPI and/or the editor(s). MDPI and/or the editor(s) disclaim responsibility for any injury to people or property resulting from any ideas, methods, instructions or products referred to in the content. |
© 2024 by the authors. Licensee MDPI, Basel, Switzerland. This article is an open access article distributed under the terms and conditions of the Creative Commons Attribution (CC BY) license (http://creativecommons.org/licenses/by/4.0/).


