Preprint
Article

A Bioinformatic Assay of Quercetin in Gastric Cancer

Altmetrics

Downloads

125

Views

54

Comments

0

A peer-reviewed article of this preprint also exists.

Submitted:

24 June 2024

Posted:

26 June 2024

You are already at the latest version

Alerts
Abstract
Gastric cancer (GC) remains a significant global health challenge, with high mortality rates, especially in developing countries. Current treatments are invasive and have considerable risks, necessitating the exploration of safer alternatives. Quercetin (QRC), a flavonoid present in various plants and foods, has demonstrated multiple health benefits, including anticancer properties. This study investigates the therapeutic potential of QRC in the treatment of GC. We utilized advanced molecular techniques to assess the impact of QRC on GC cells, examining its effects on cellular pathways and gene expression. Our findings indicate that QRC significantly inhibits GC cell proliferation and induces apoptosis, suggesting its potential as a safer therapeutic option for GC treatment. Further research is required to validate these results and explore the clinical applications of QRC in cancer therapy
Keywords: 
Subject: Medicine and Pharmacology  -   Complementary and Alternative Medicine

1. Introduction

Gastric cancer (GC) is one of the most common types of cancer worldwide (1), with the worst prognosis in developing nations especially those with struggling food safety since they will have a higher incidence of some factors associated with the apparition of GC such as infection by Helicobacter pylori (2).
Following the Global Cancer Observatory (GLOBOCAN) in 2022, GC has a mortality rate of up to 30% depending on the country (3). Furthermore, once diagnosed, the treatment will be varied, going from more “traditional” radiotherapy or chemotherapy to surgery. However, those treatments are highly invasive and, since GC includes key organs needed for nutrient obtaining, the treatment can also be dangerous for the patient (4). Therefore, there is an actual need for a safer, cheaper, and less aggressive treatment and one alternative like this could be those originating directly from botanical products, such as the whole or plants or, biocompounds originating from them.
Quercetin (QRC) is a flavonoid compound found in many products, including onions, cherries, broccoli, fruits, and some plants like Hibiscus sabdariffa (5). It has been linked to multiple beneficial effects such as a hypotensive, antioxidant, hypoglycemic, or anticarcinogenic agent (6–12). In fact, in a previous study, the potential therapeutic targets of QRC in human cells were tested, and one result was the implication of QRC in GC (13). However, this result was only an implication and lacked further support.
Therefore, the objective of this study was to obtain a more concise picture of the effects of QRC in GC through a network pharmacological analysis using a plethora of computer databases. The strategy identified potential therapeutic targets of QRC in GC, which were then subjected to gene ontology tests, protein-to-protein analysis, survival tests, immune system infiltration analysis, and molecular docking analysis. Finally, the results were compared with current information to corroborate them with GC or cancer in general.

2. Materials and Methods

2.1. Bioinformatic Analysis

Figure 1 shows a diagram containing the general workflow of the entire study.

2.1.1. Gathering of Target Genes

Quercetin (QRC) and Gastric Cancer (GC) were chosen as the key concepts of the study. They were subjected to bioinformatic analysis individually and in conjunction, as described below.

2.1.1.1. QRC Target Genes

The site Swiss Target Prediction (14) was used to gather the key targets of quercetin in human cells. This required the SMILE sequence of QRC, obtained from the PubChem site.

2.1.1.2. GC Target Genes

The genes related to GC were gathered from the MalaCards website (15), by searching for the term “Gastric Cancer” and choosing the corresponding option with MCID: GST053 and MIFTS: 87.

2.1.2. Common Genes Analysis

The comparison between QRC target genes and the genes related to GC was made using Venny 2.1 site.

2.1.3. Gene Ontology and Functional Annotation Assay

Using Genes common to GC and QRC, The ShinyGo 0.77 (16) and the DAVID-Bioinformatic Resources (17) website were used for Gene Ontology and Functional Annotation Assay. For ShinnyGo 0.77, the parameters were set to: Homo Sapiens species, with a False Discovery Rate (FDR) threshold of 0.05 percent, and to calculate the fold enrichment (FE) of each target, with a false discovery rate (FDR)(18) threshold of 0.05. Results with an FE equal to or greater than 5 were used to ascertain the biological pathways implicated with those genes, by using the Kyoto Encyclopedia of Genes and Genomes (KEGG) database. For the Functional Annotation Assay, the DAVID-Bioinformatic Resources was used, for this we added the common genes between GC and QRC to the site, obtaining Functional Annotations results.

2.1.4. Protein-to-Protein Analysis

To obtain Hub Genes from the combination of GC and QRC, a Protein-to-Protein (PPI) Network was used. The StringDb site (19–27) was employed, and genes with at least 10 interactions were chosen as hub genes.

2.1.5. Survival Curves and Immune System Infiltration

The GEPIA2 database (28) was used to obtain survival curves of hub genes in GC, with a significance level of p ≤ 0.05. The TISIDB (29) database was used for immune system infiltration, with p ≤ 0.05 as significant, and the Spearman test for correlation.

2.1.6. Molecular Docking Analysis

Using the Swiss Dock website (from the Swiss Institute of Bioinformatics)(30) we analyzed the genes that were associated with cancer invasion and metastasis, by filtering the HUB genes with the software Cytoscape (31). This required pdb files of hub gene proteins, obtained from the Research Collaboratory for Structural Bioinformatics (32) and AlphaFold Protein Structure Database(33). As for the QRC structure, mol2 file was obtained from PubChem (34) and converted to the required format using the Department of Internal Medicine Translational Informatic Division’s converting tool (https://datascience.unm.edu/tomcat/biocomp/convert). Results were visualized using UCSF Chimera software (35). The results shown are only those with a ΔG ≤ -6.

3. Results

3.1. Target Genes

3.1.1. Common Genes between GC and QRC.

Figure 2 shows Venny diagrams from Venny 2.1 (https://bioinfogp.cnb.csic.es/tools/venny/ ) comparing QRC and GC-related genes according to Swiss Target Prediction (http://www.swisstargetprediction.ch/) and Malacards (https://www.malacards.org/), respectively. There are 31 genes in common.

3.2. Gene Ontology Test (GO)

3.2.1.

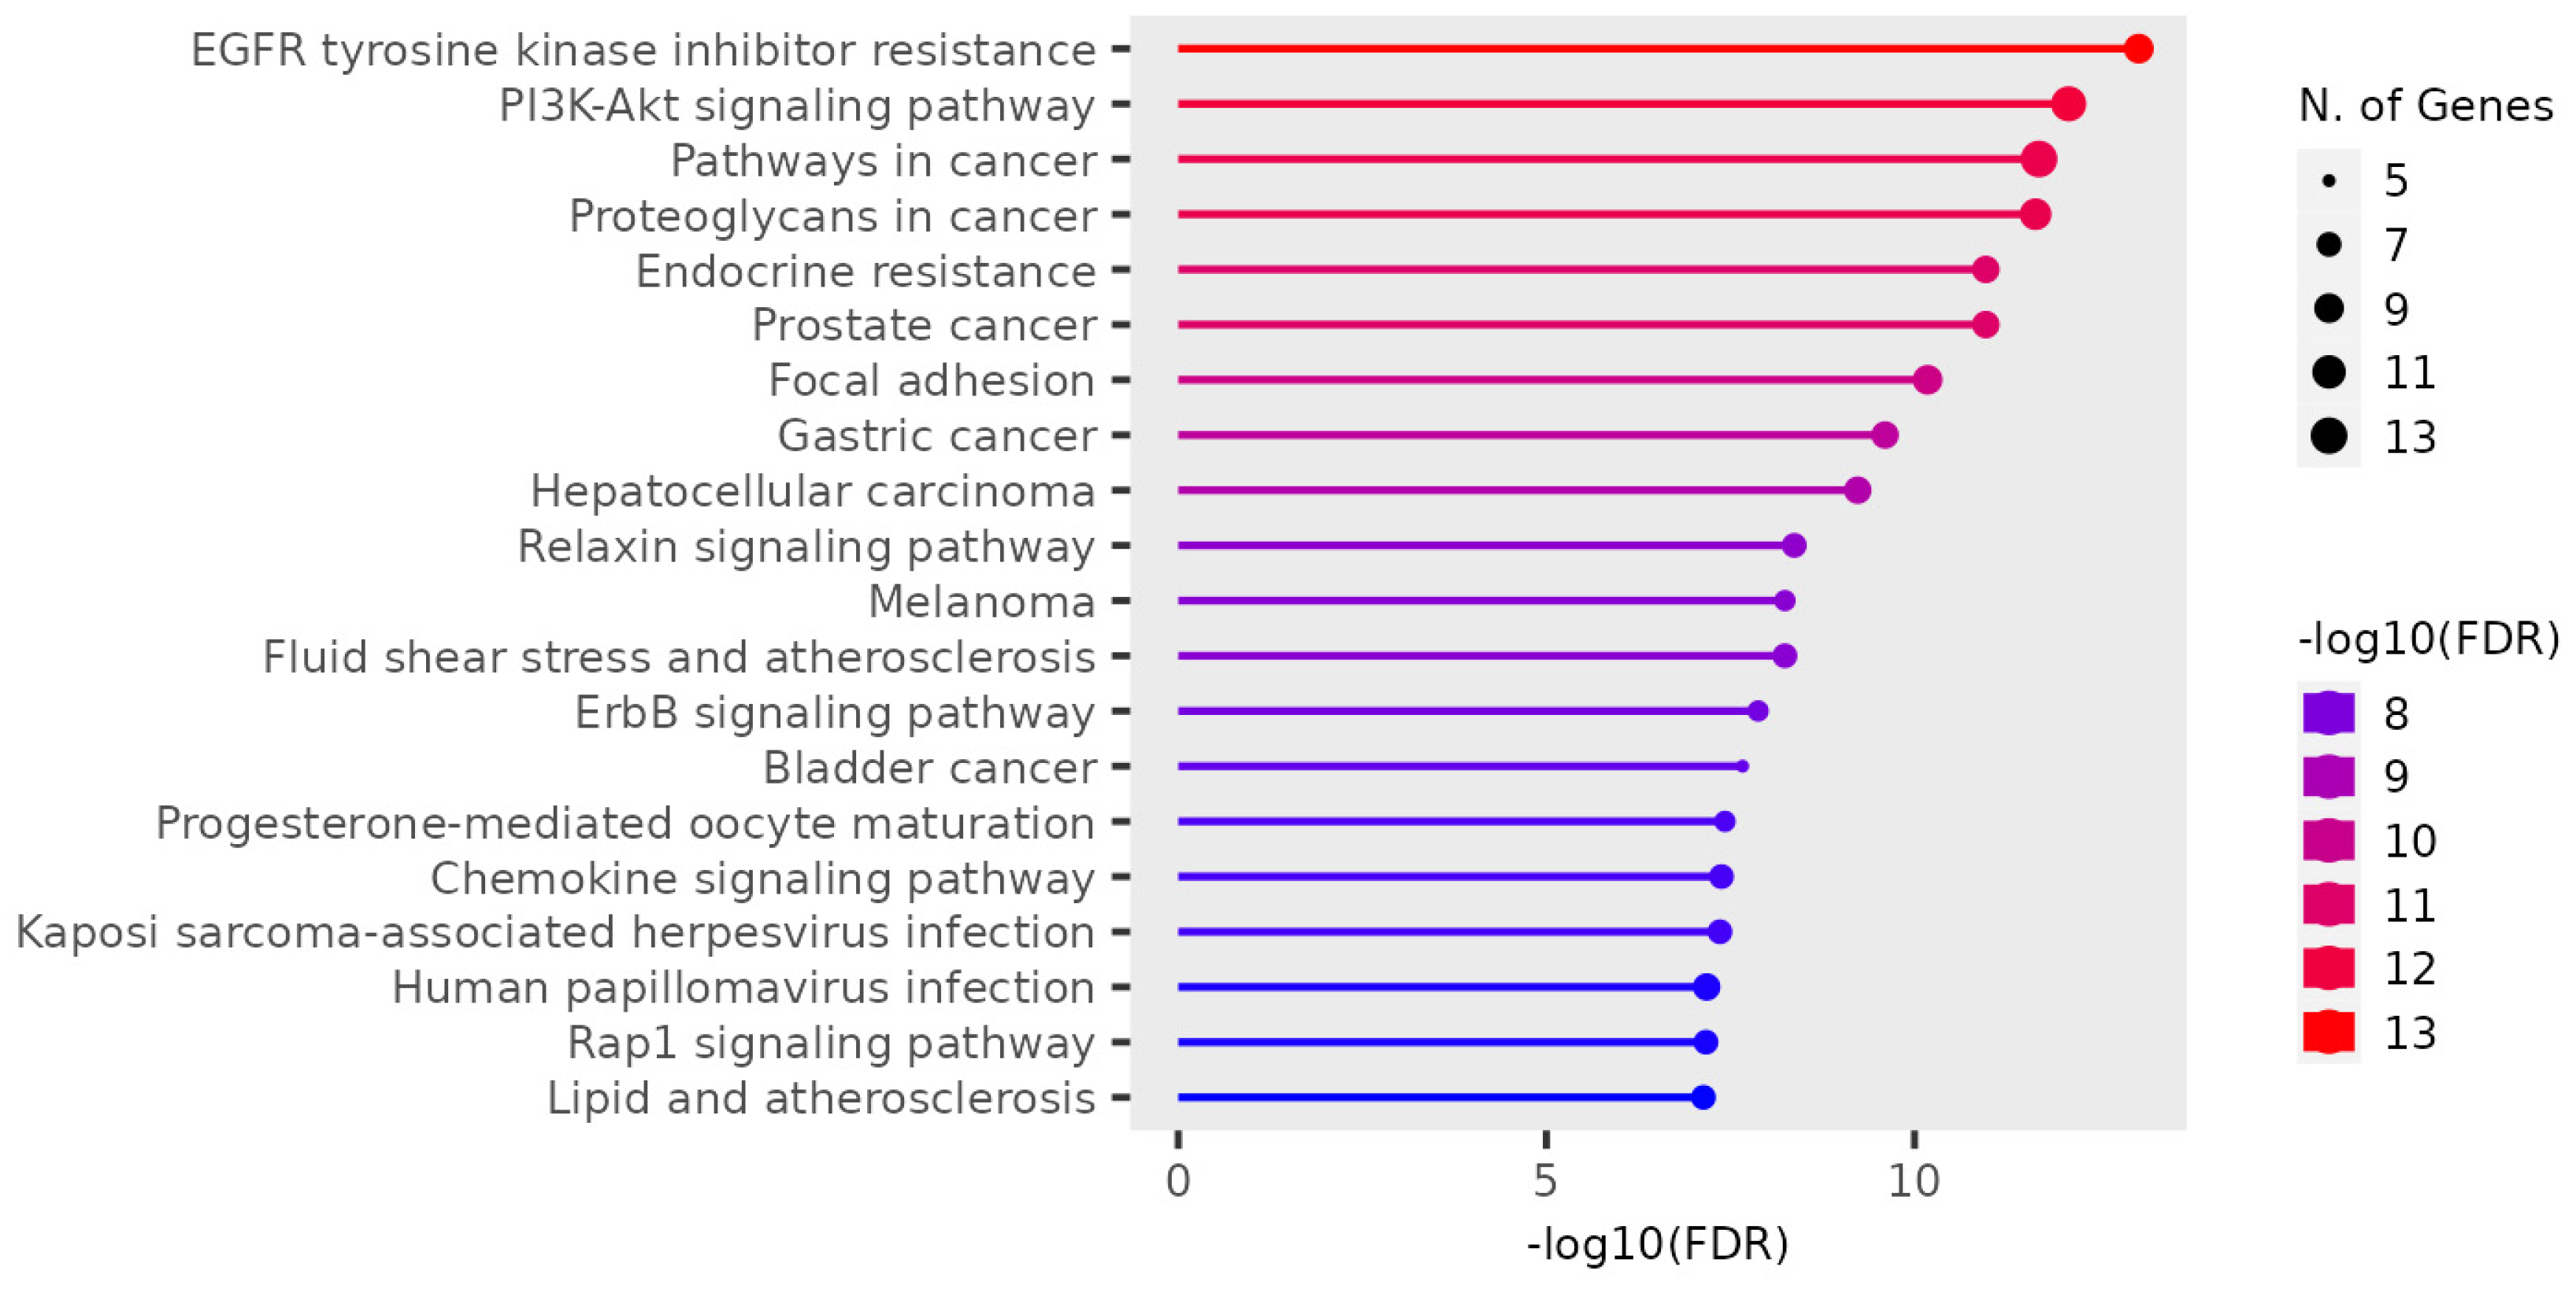
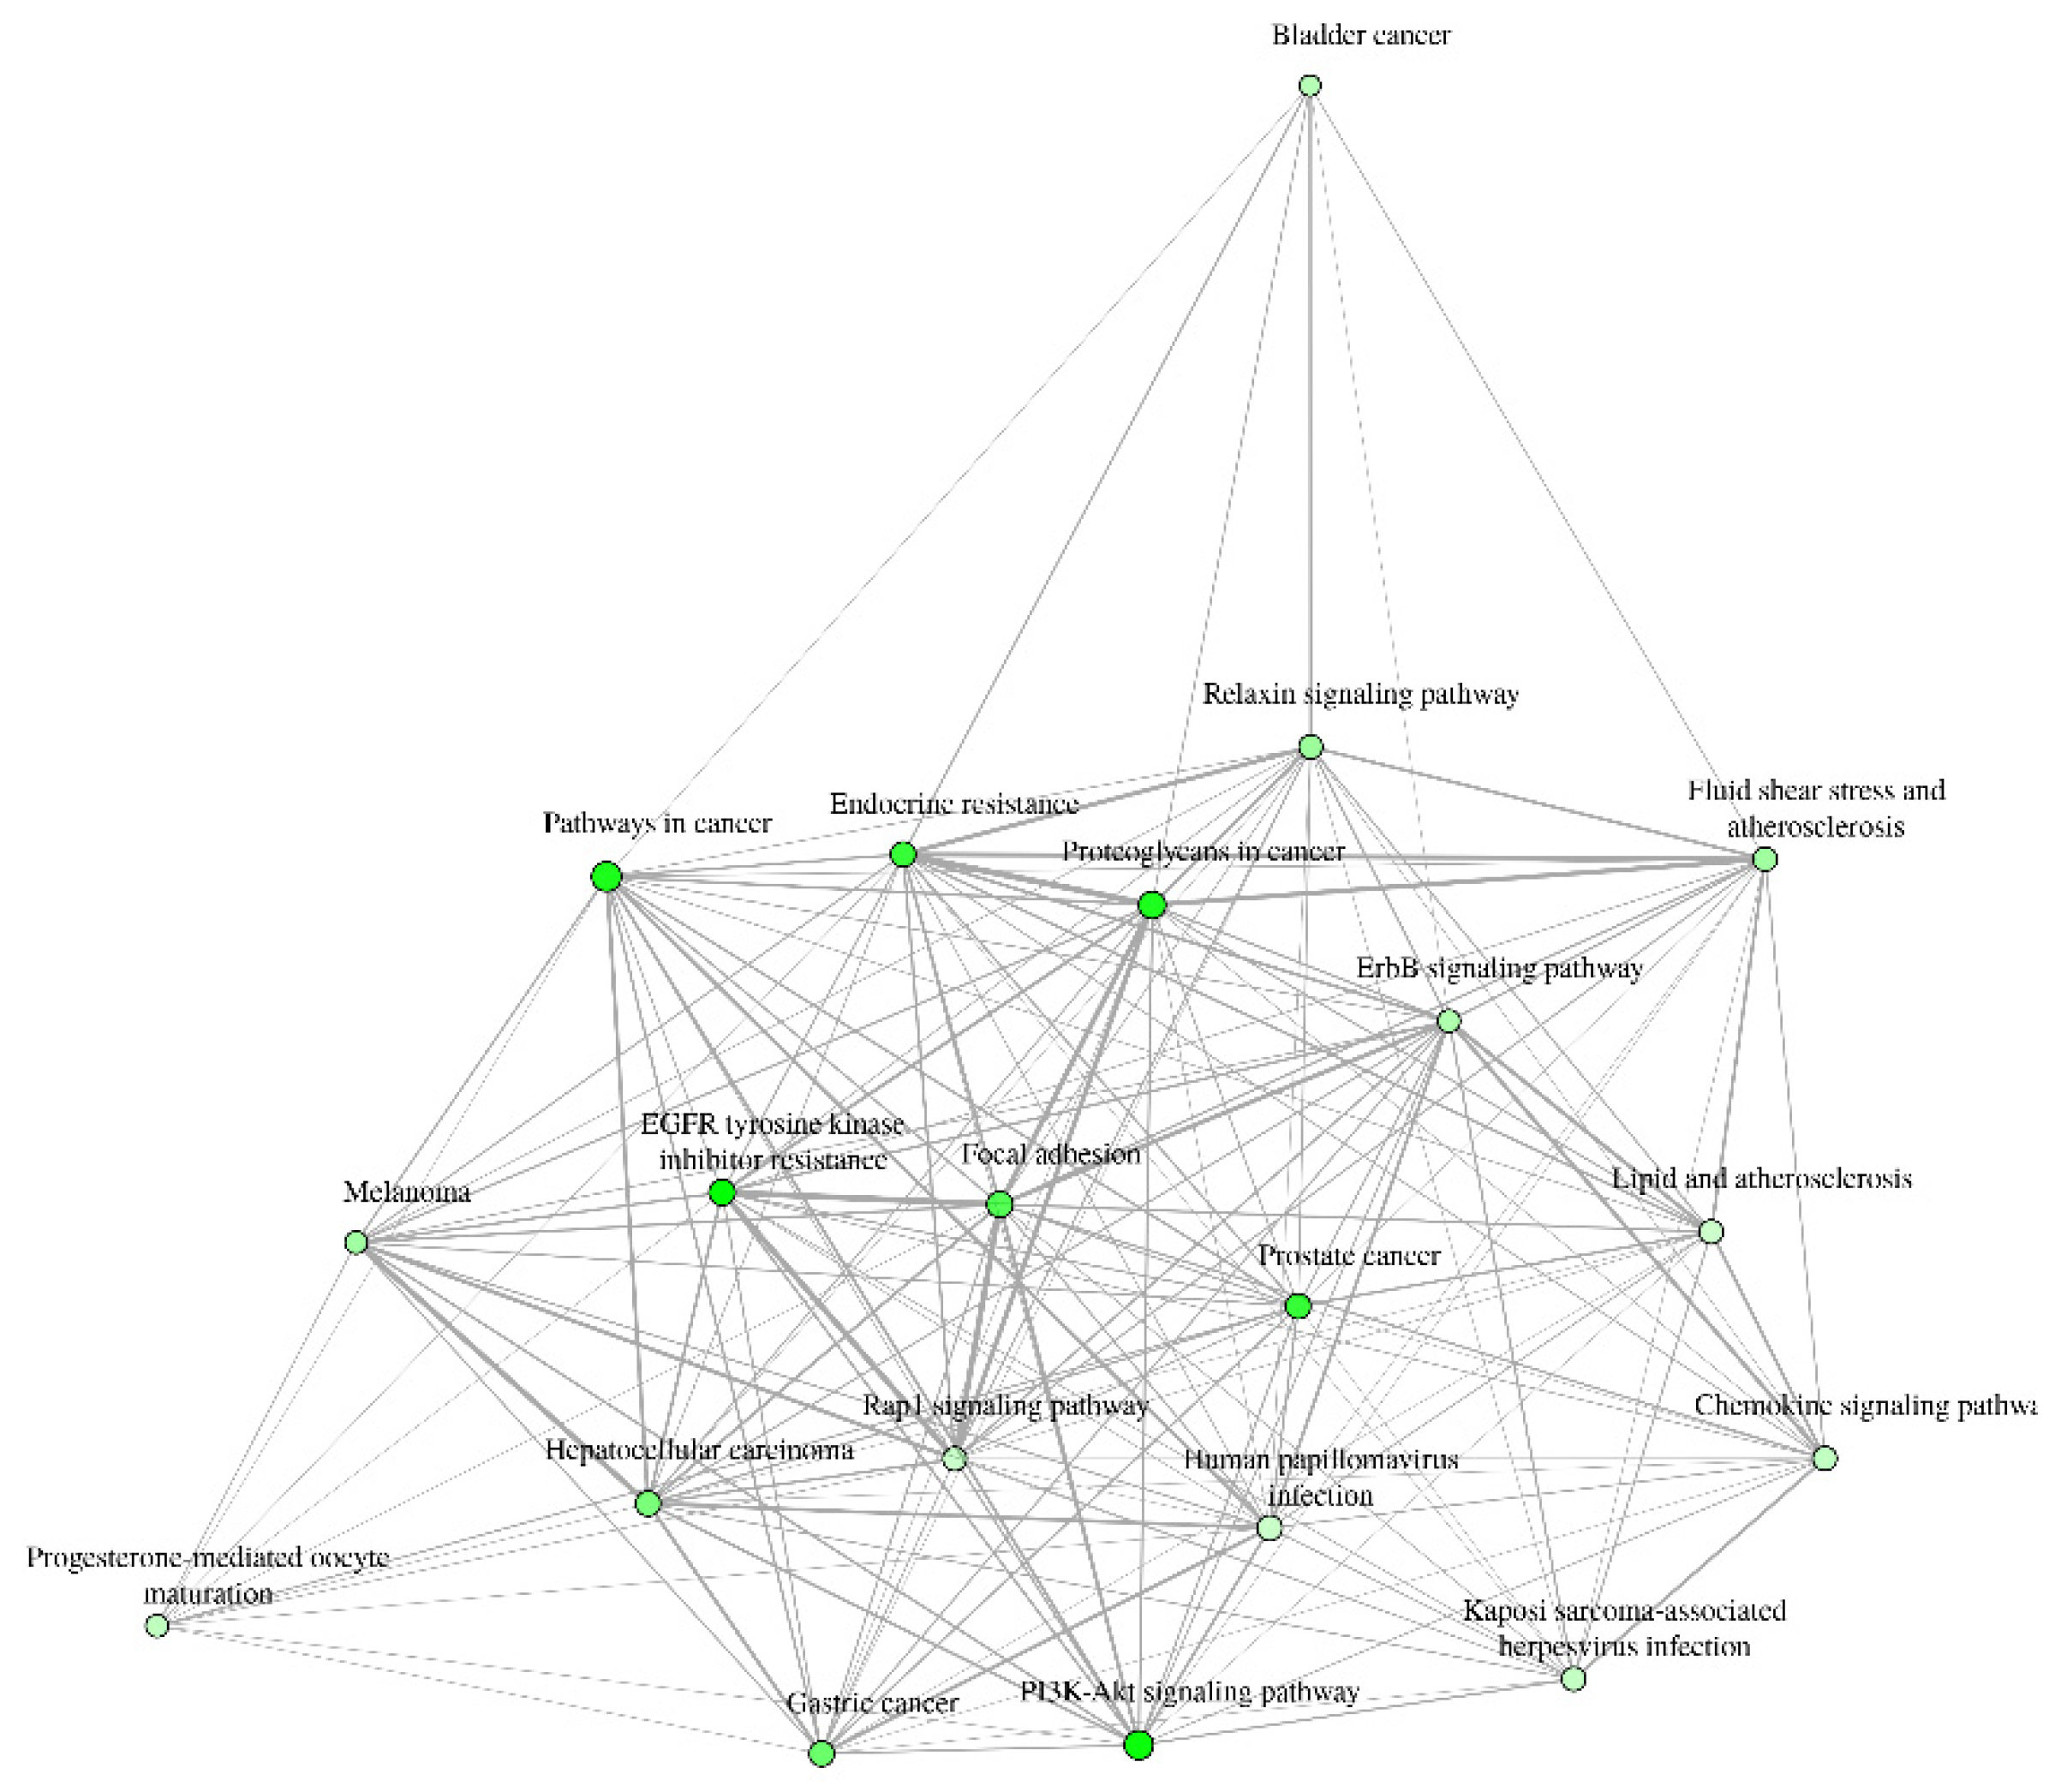
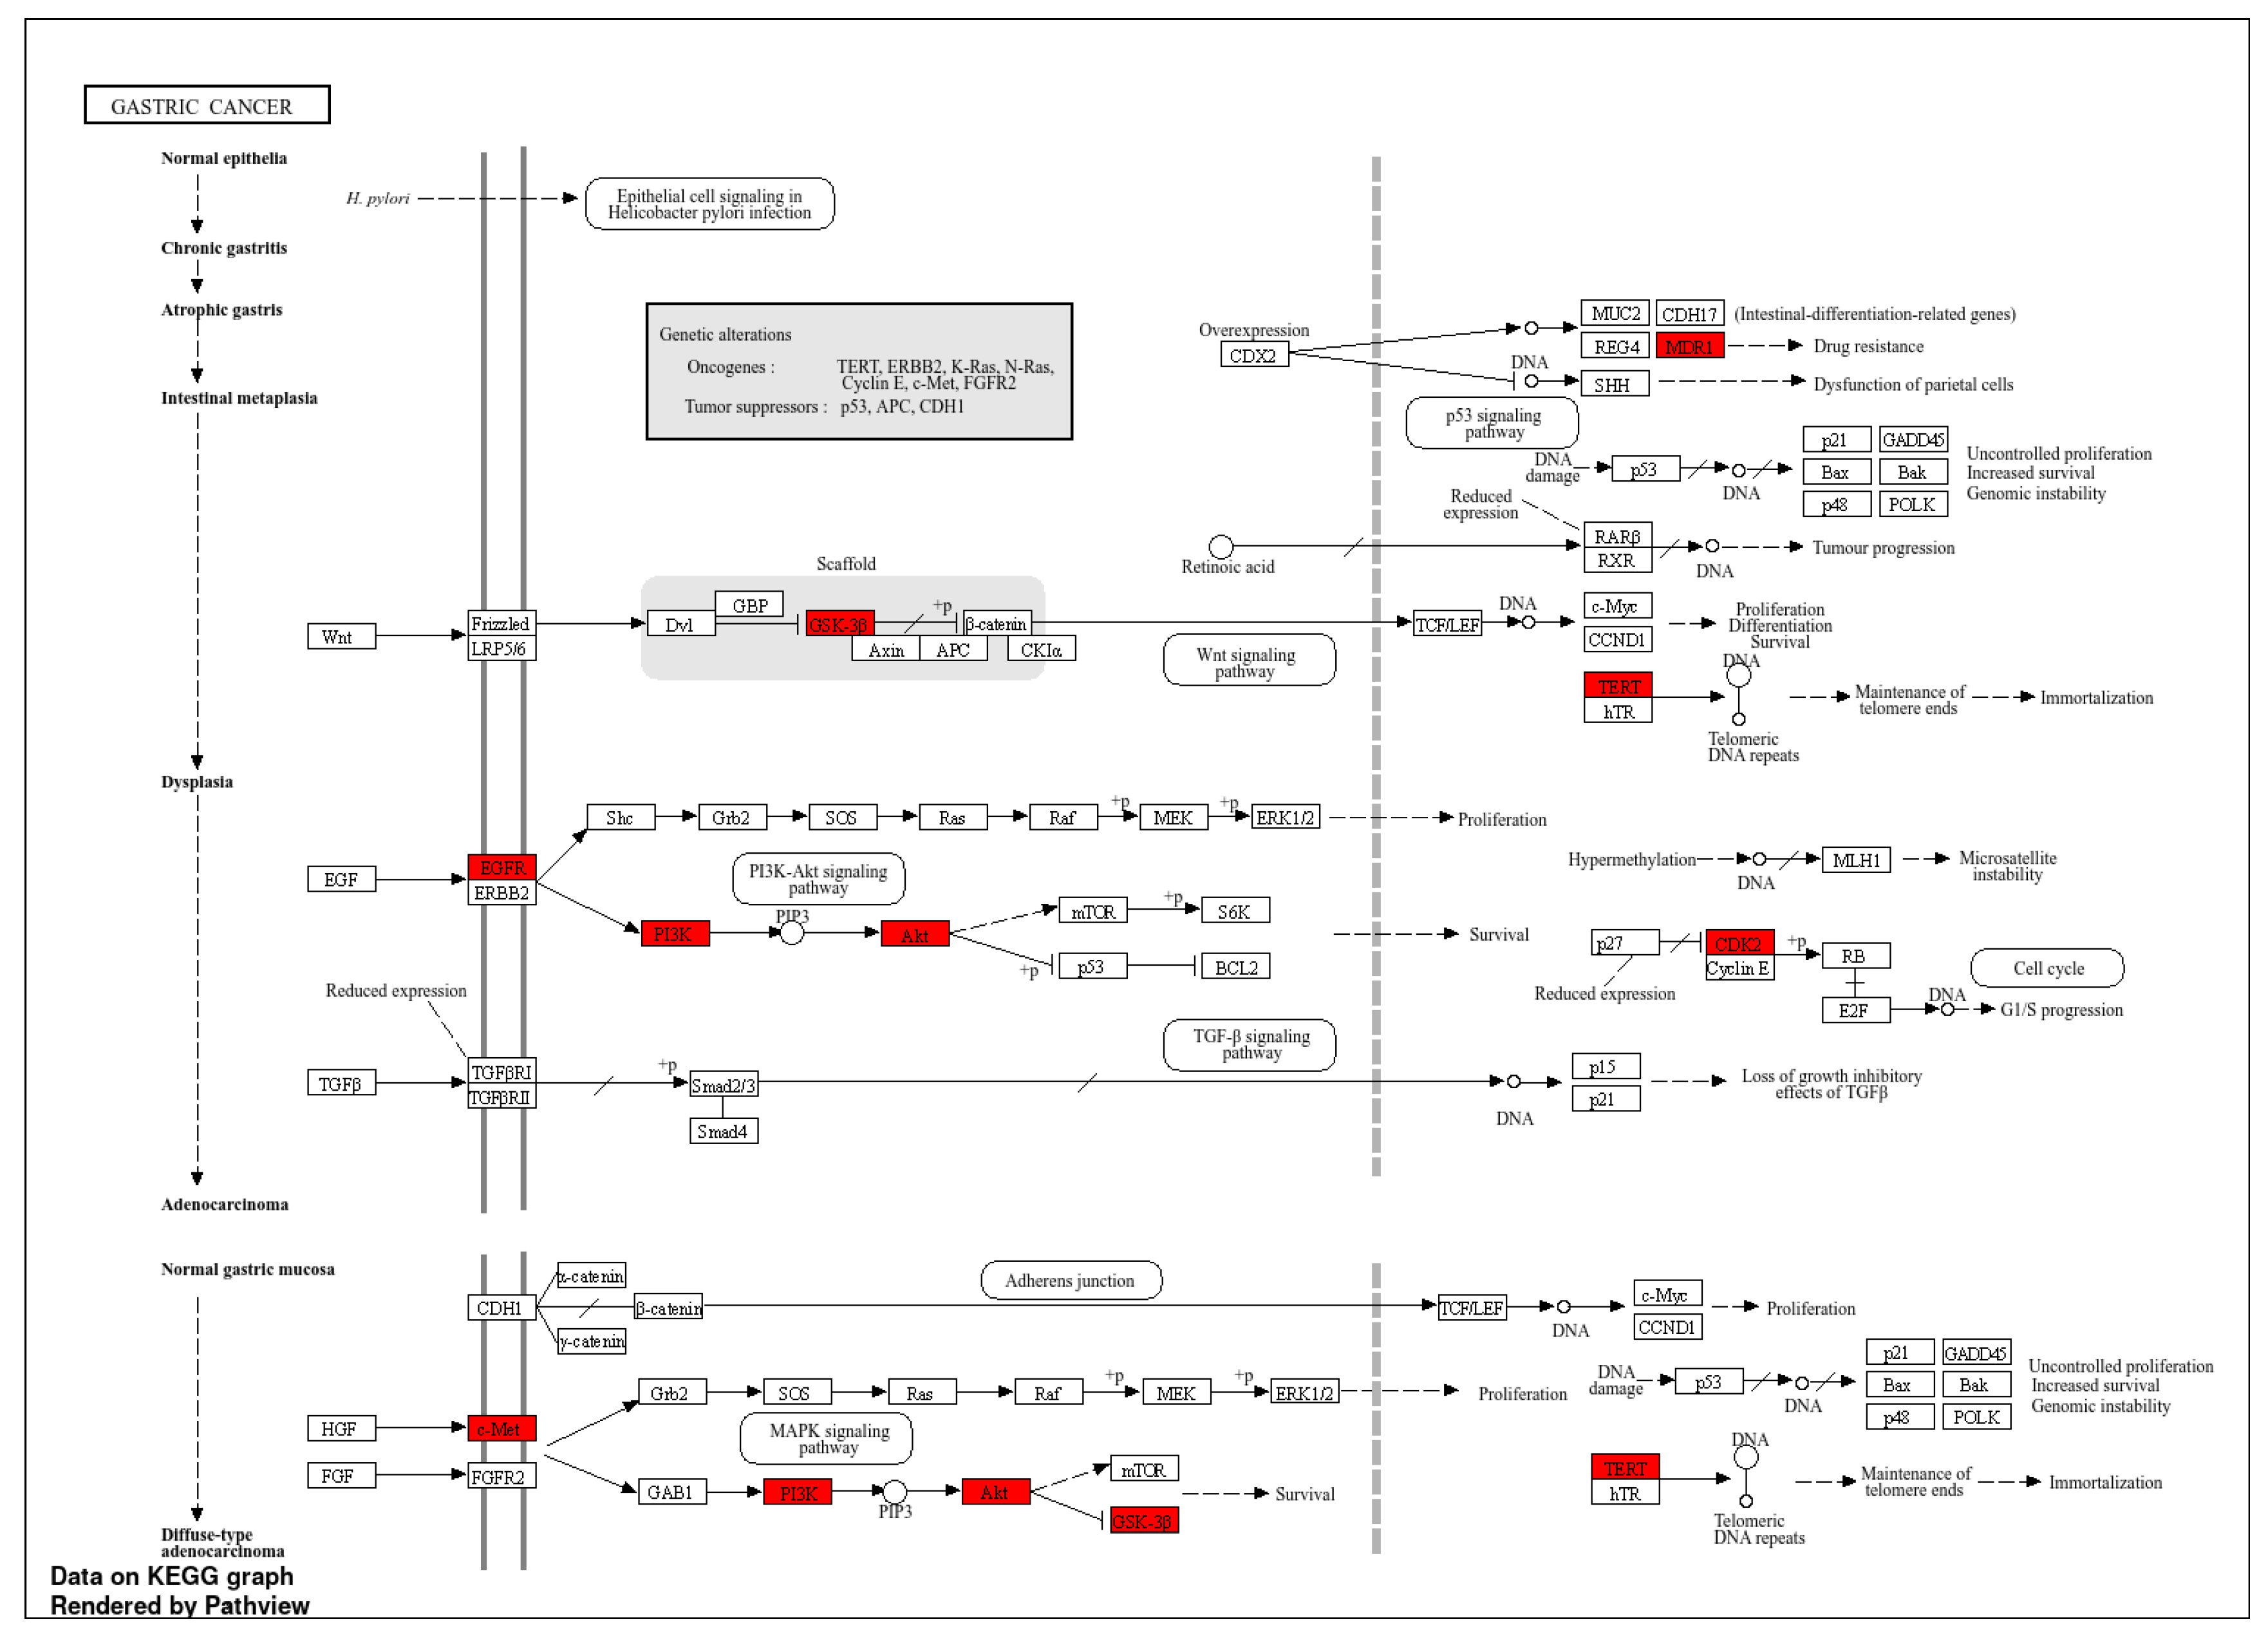
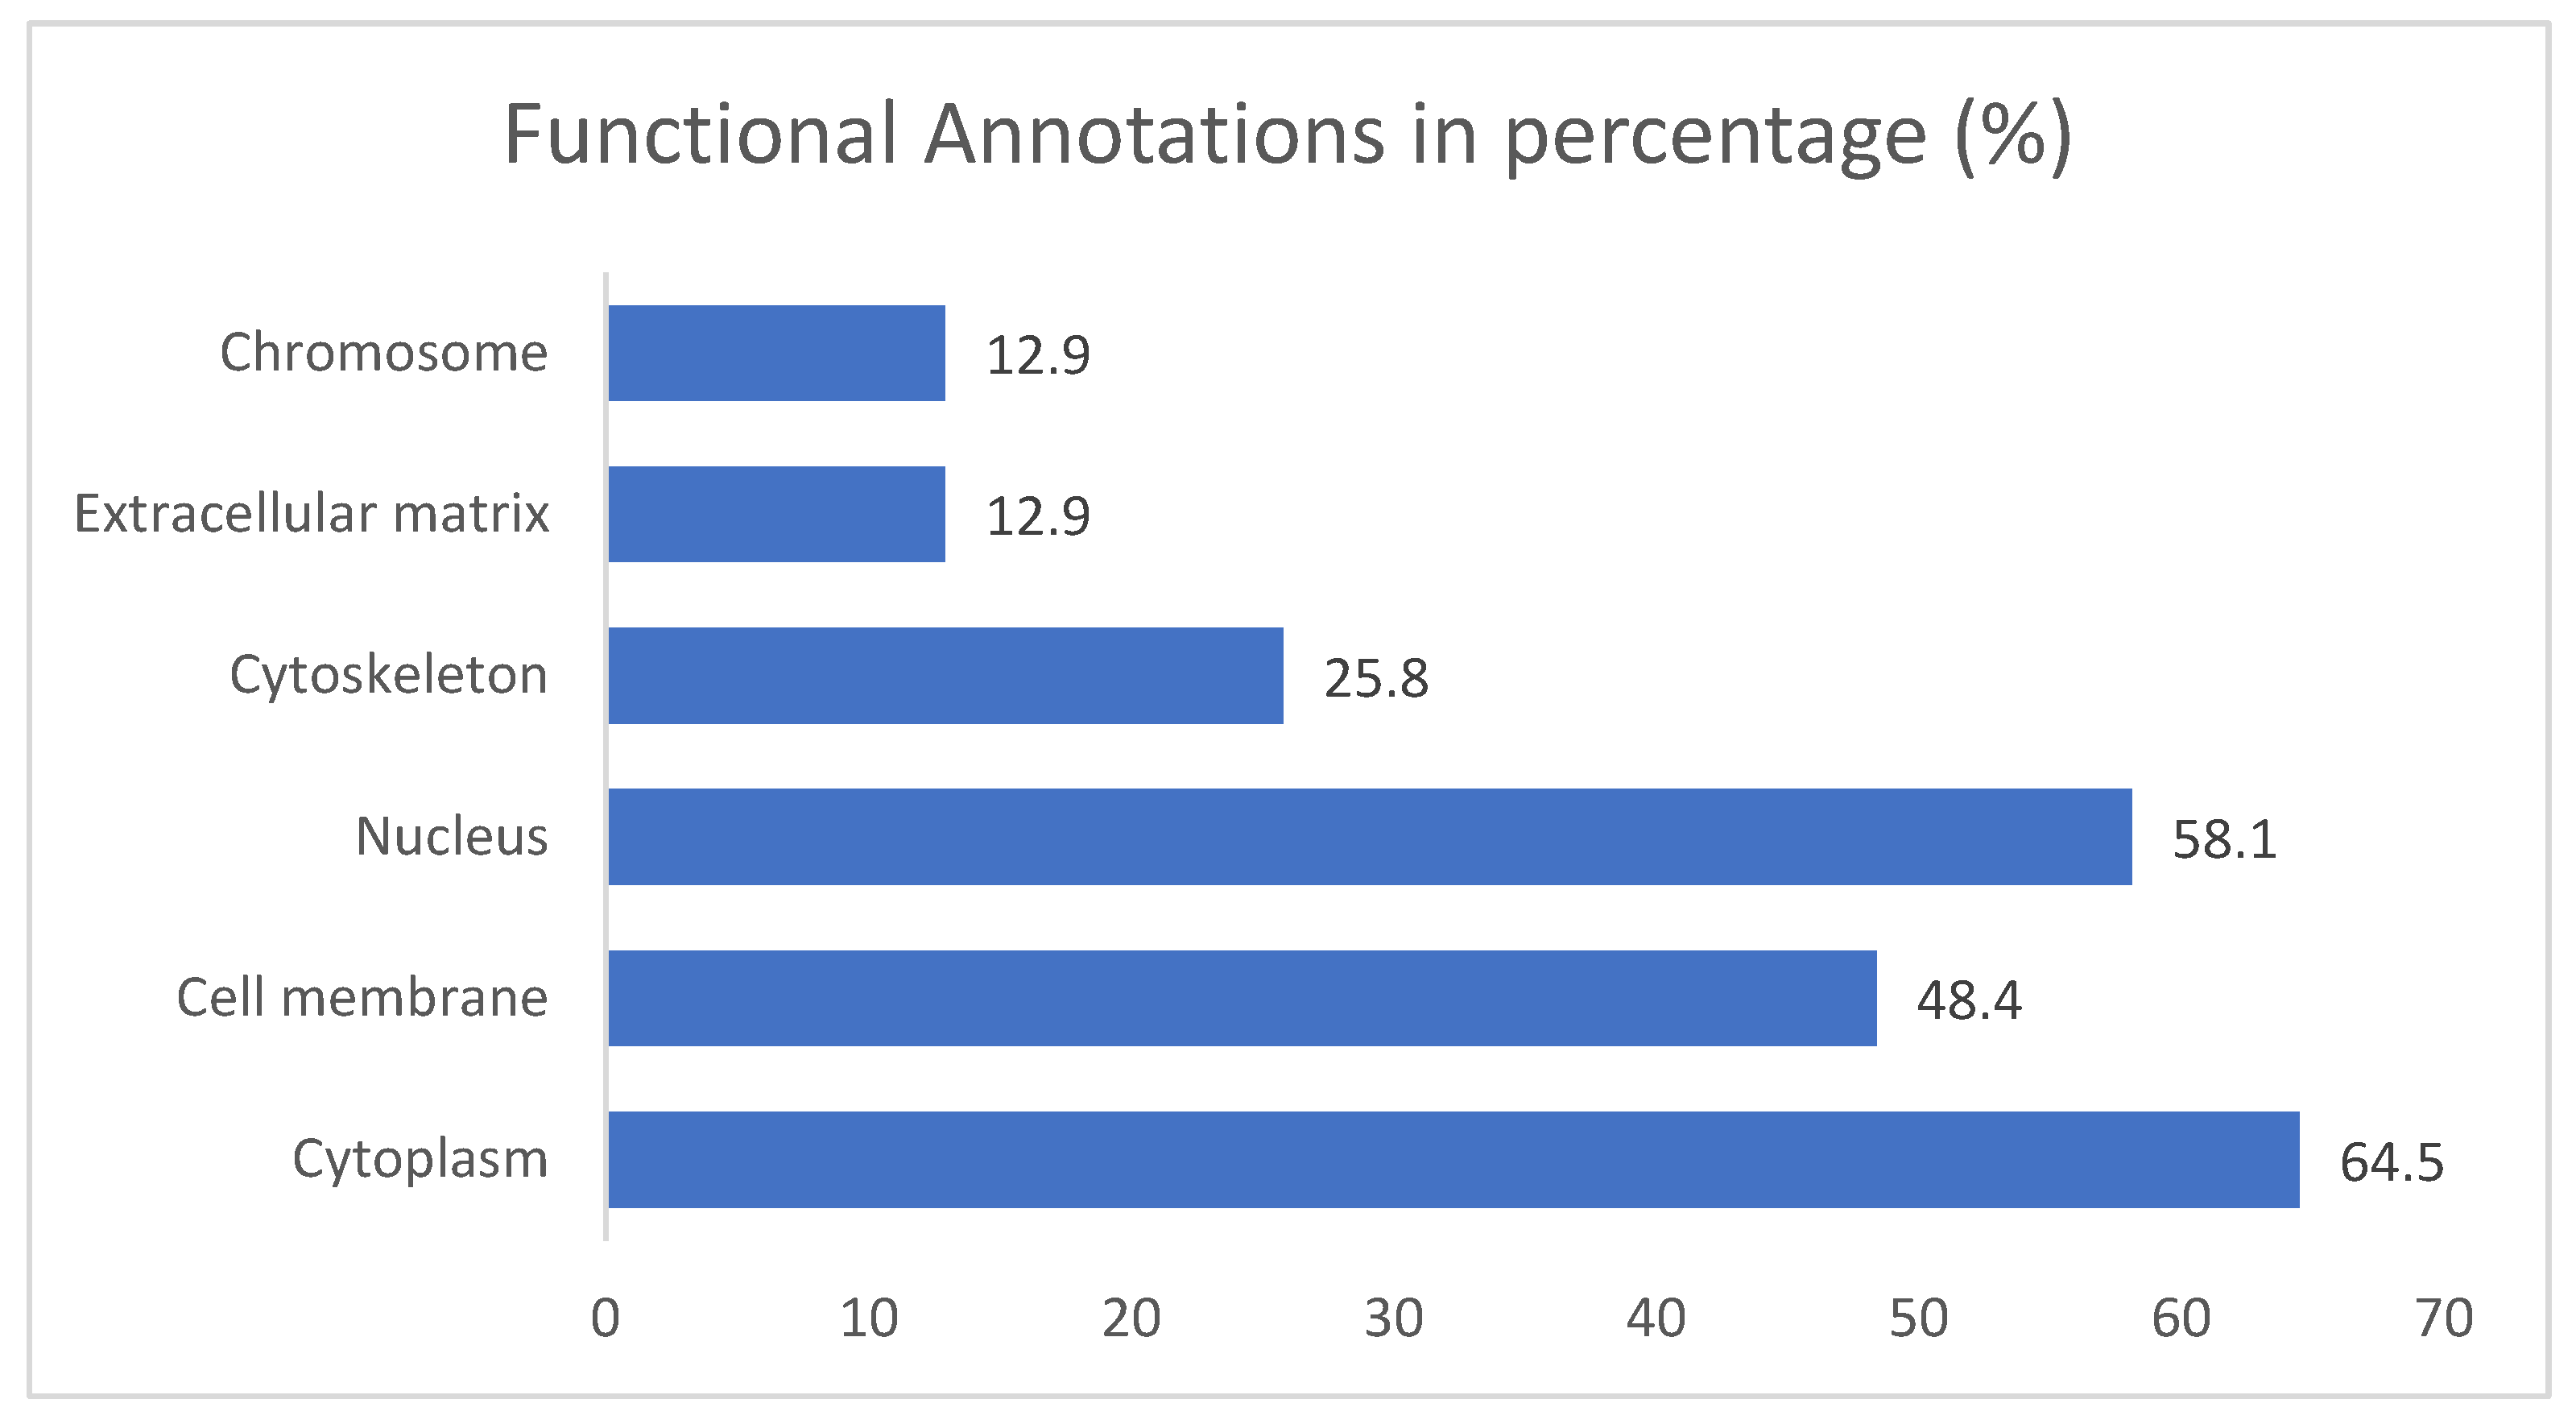
The results for the gene ontology assay are shown in Figure 3, Figure 4 and Figure 5 for the information obtained from the ShinnyGo 0.8 site (http://bioinformatics.sdstate.edu/go/) these include the pathway assessment chart, Pathway Network Analysis, and KEGG pathway with highlighted genes directly related to Gastric cancer. Figure 6 shows the cellular component analysis by DAVID Bioinformatics (https://david.ncifcrf.gov/tools.jsp).

3.3. Protein-to-Protein Analysis

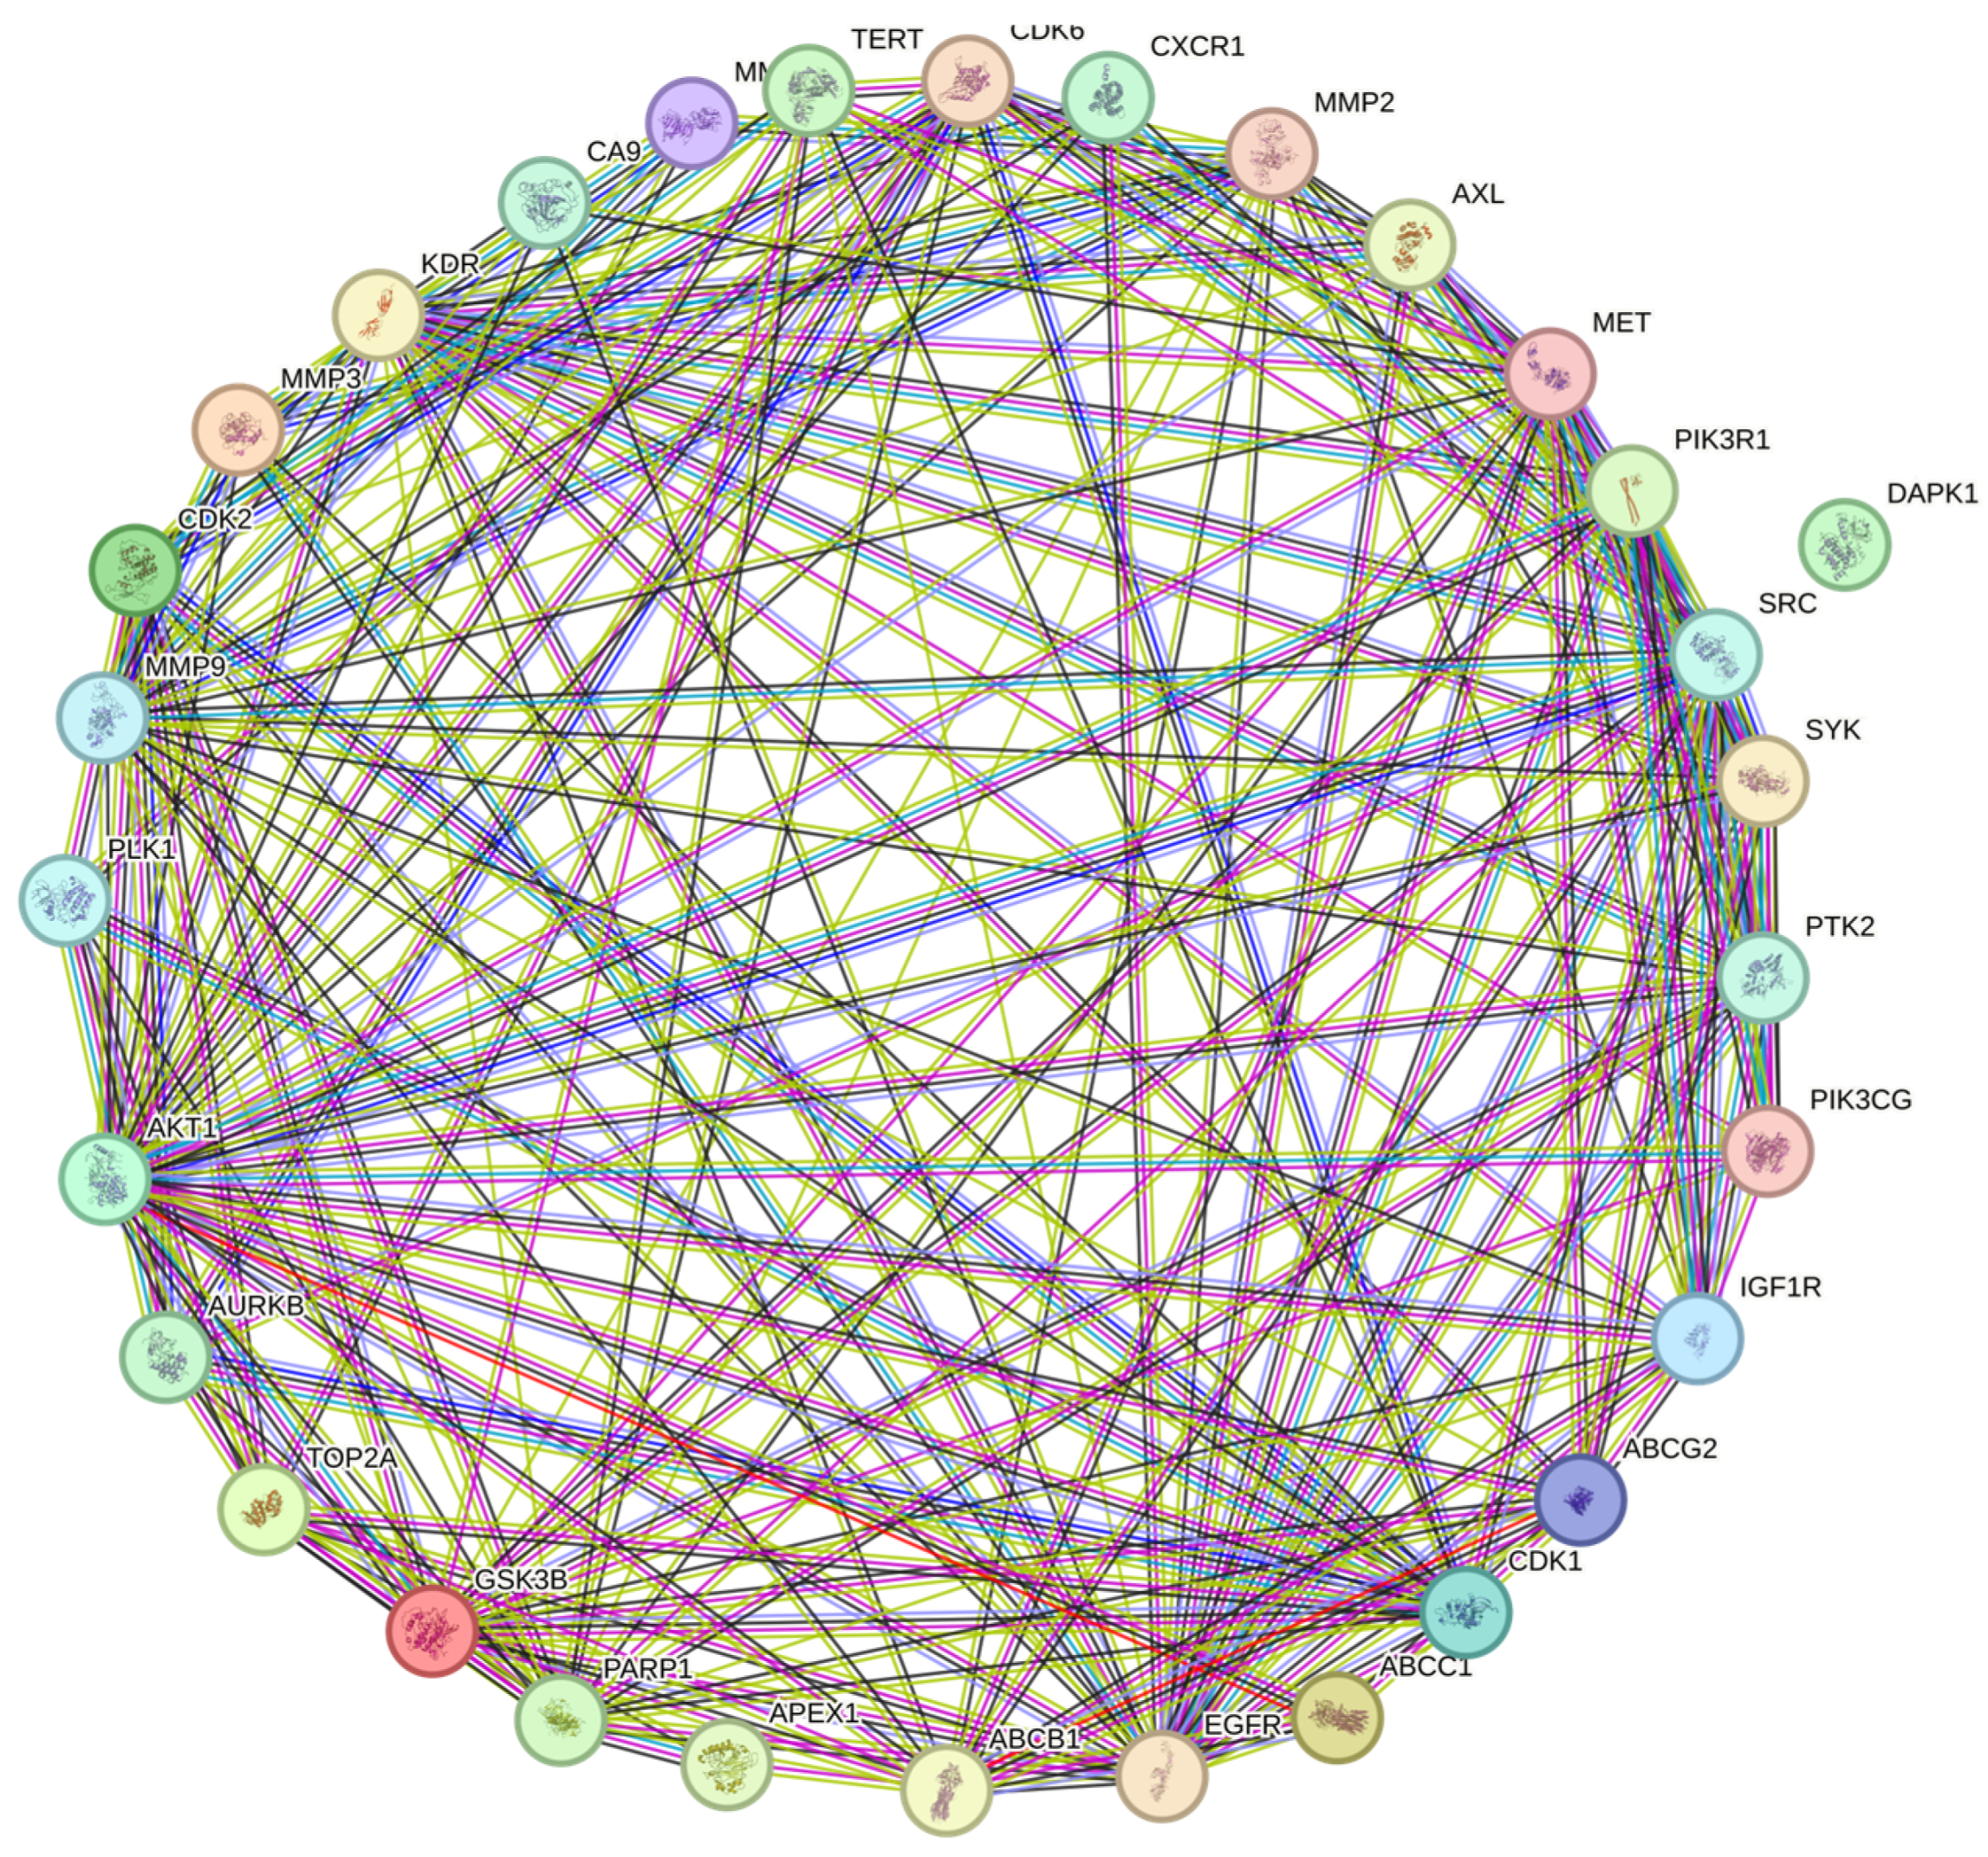
The protein-to-protein (PPI) analysis from StringDB (https://string-db.org/) is shown in Figure 7, containing relationships between proteins coded from the 31 common genes. The 30 genes with the most interactions were chosen as hub genes for survival and infiltration analysis.

3.4. Survival Graphs

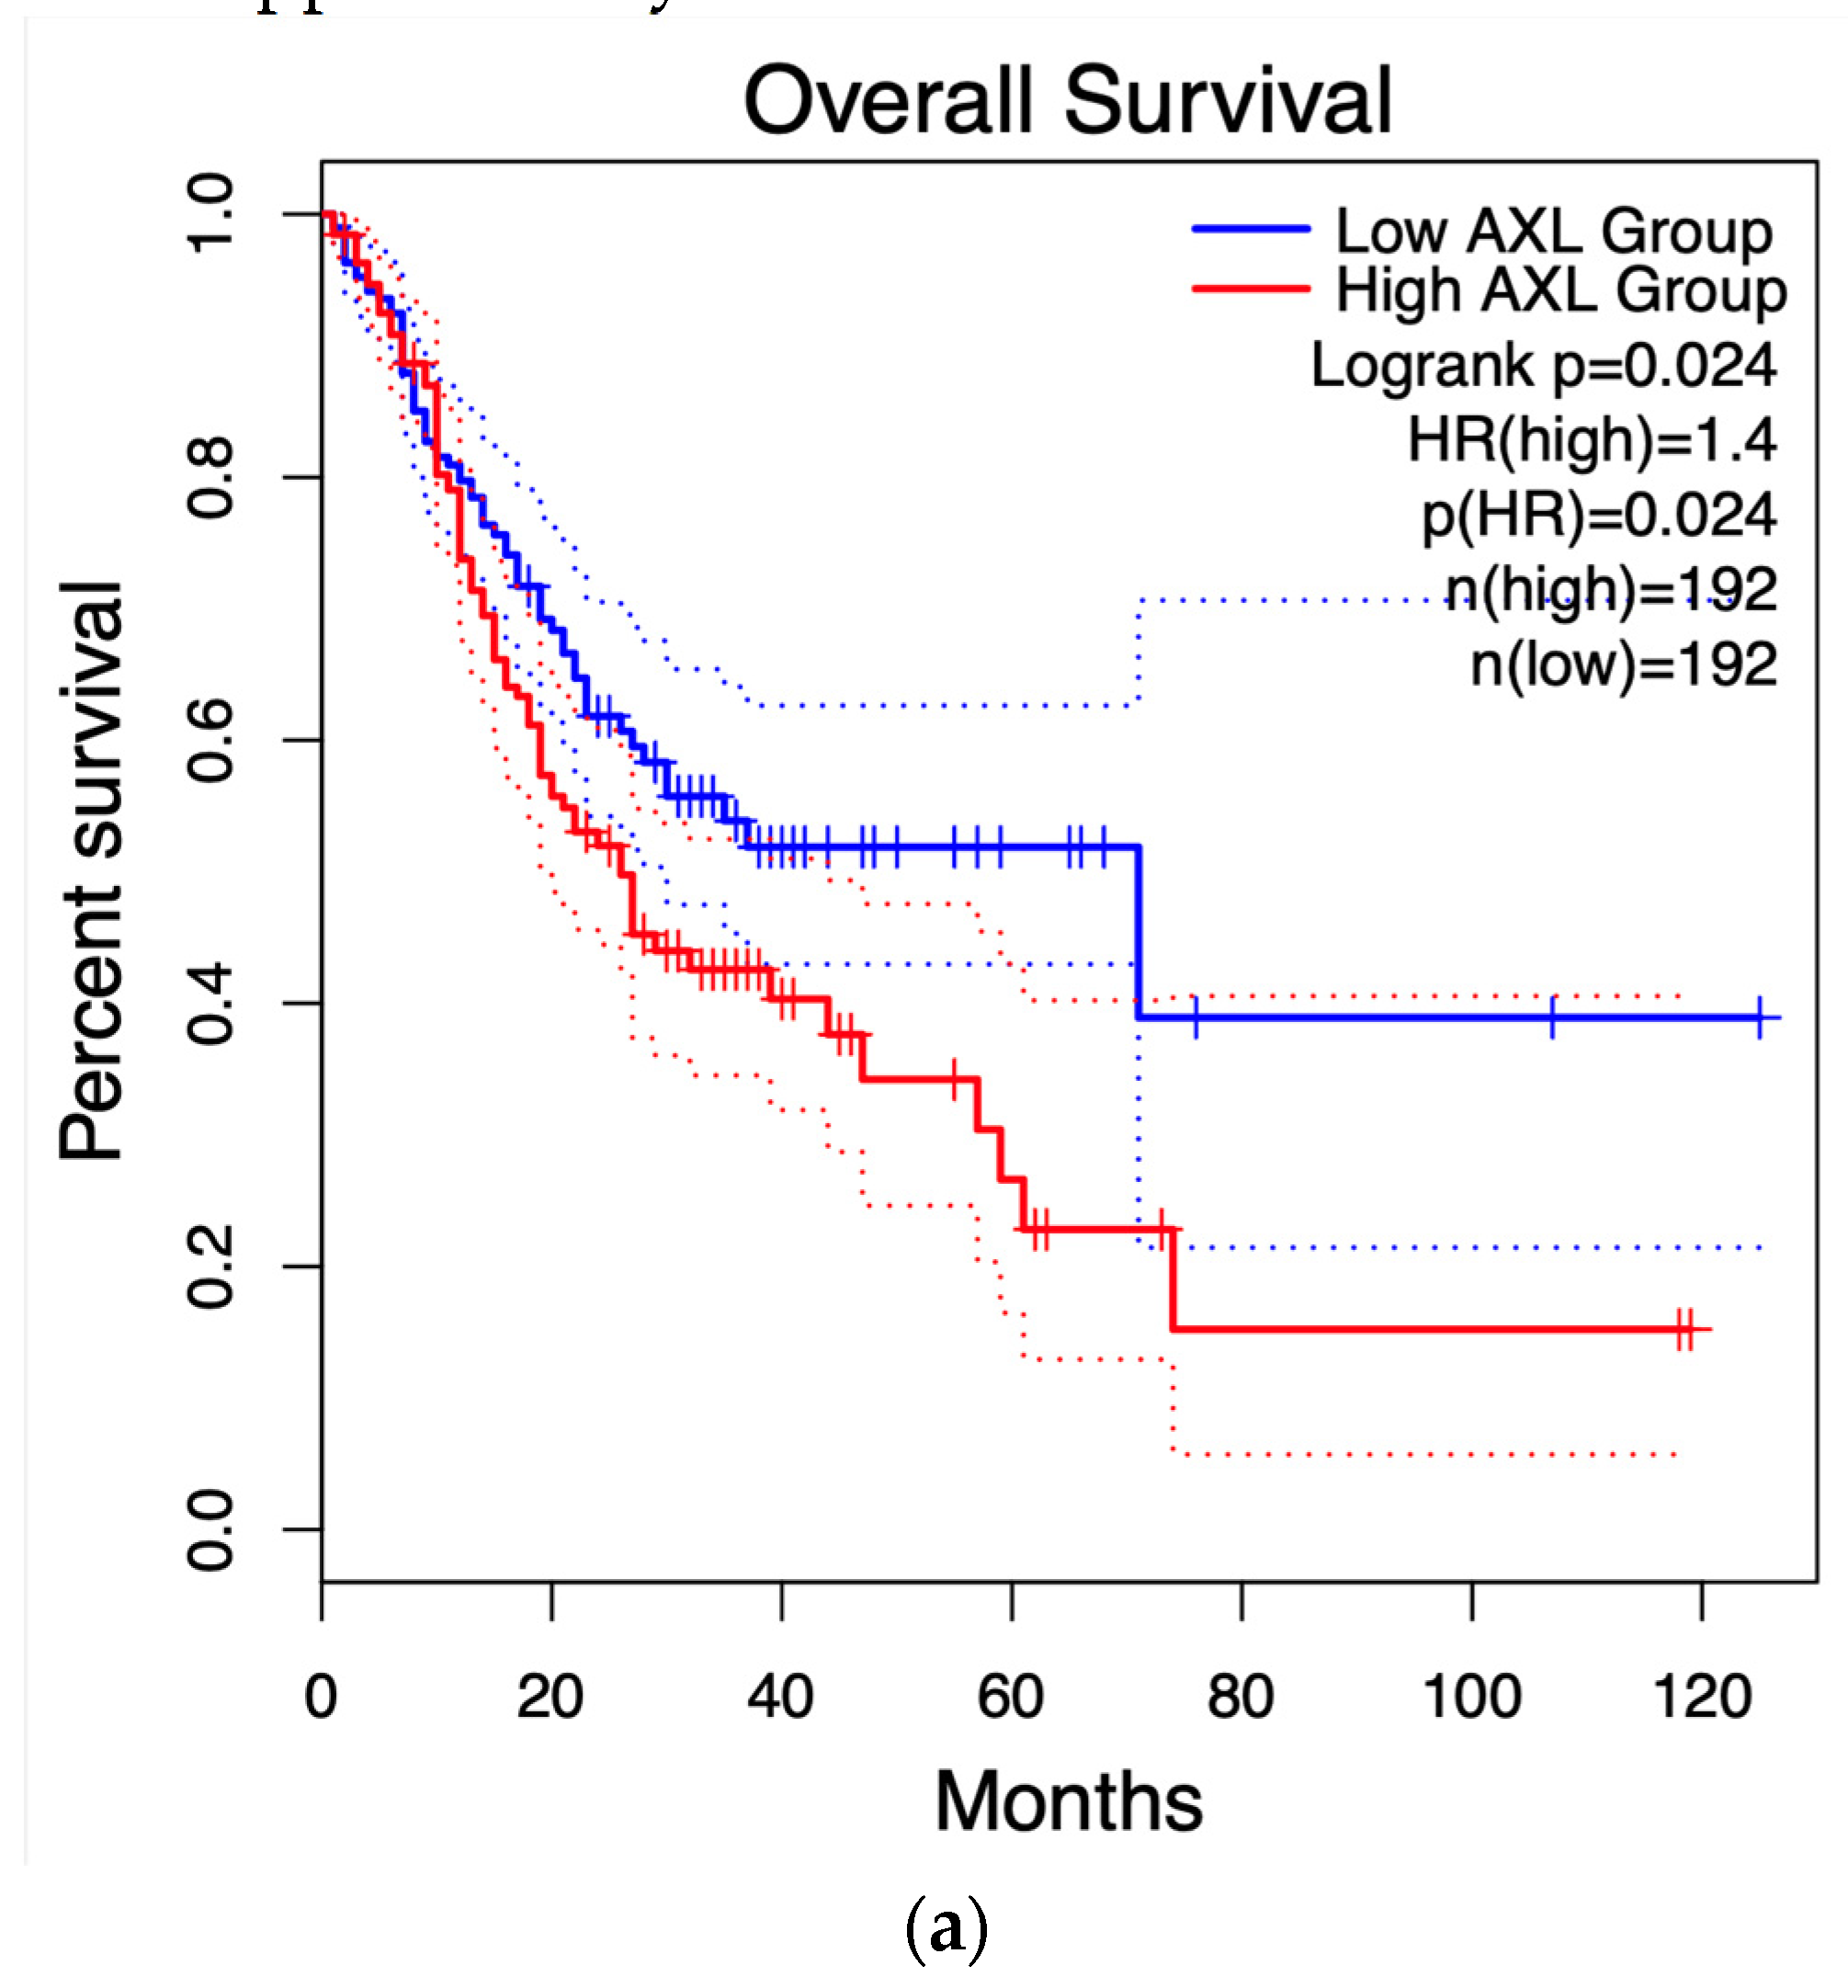
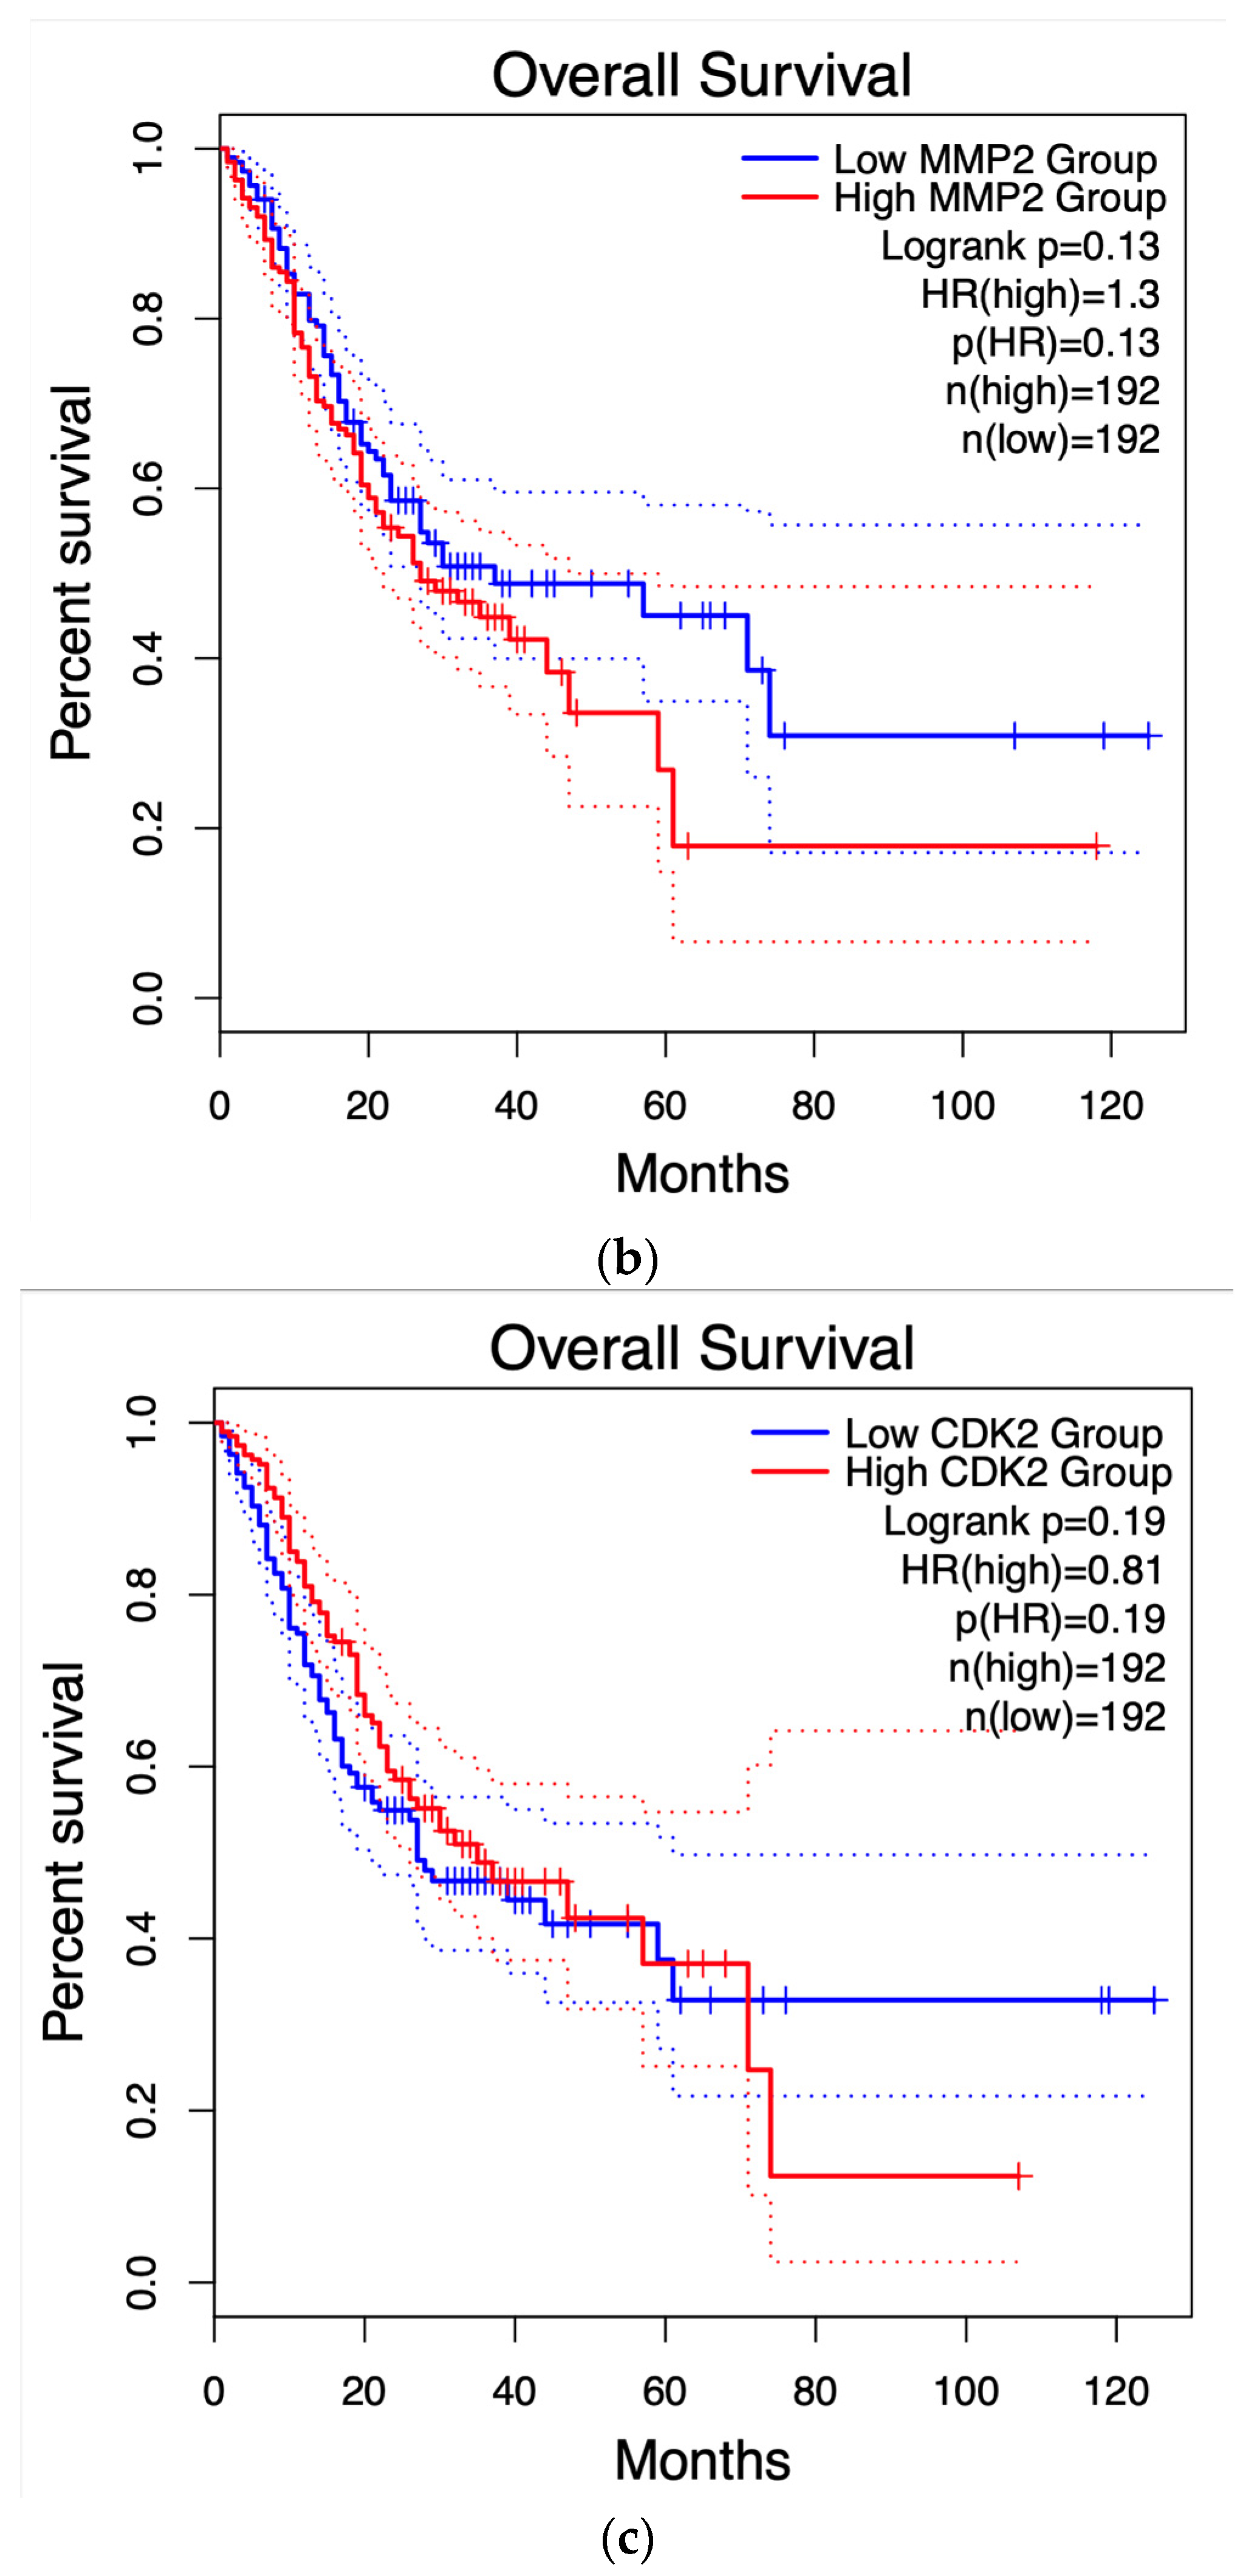
Figure 8 displays the survival graph for AXL, the only gene that showed statistical significance, along with others that were closer to reaching statistical significance for reference. The remaining graphs can be found in the supplementary material.

3.5. Immune System Infiltration

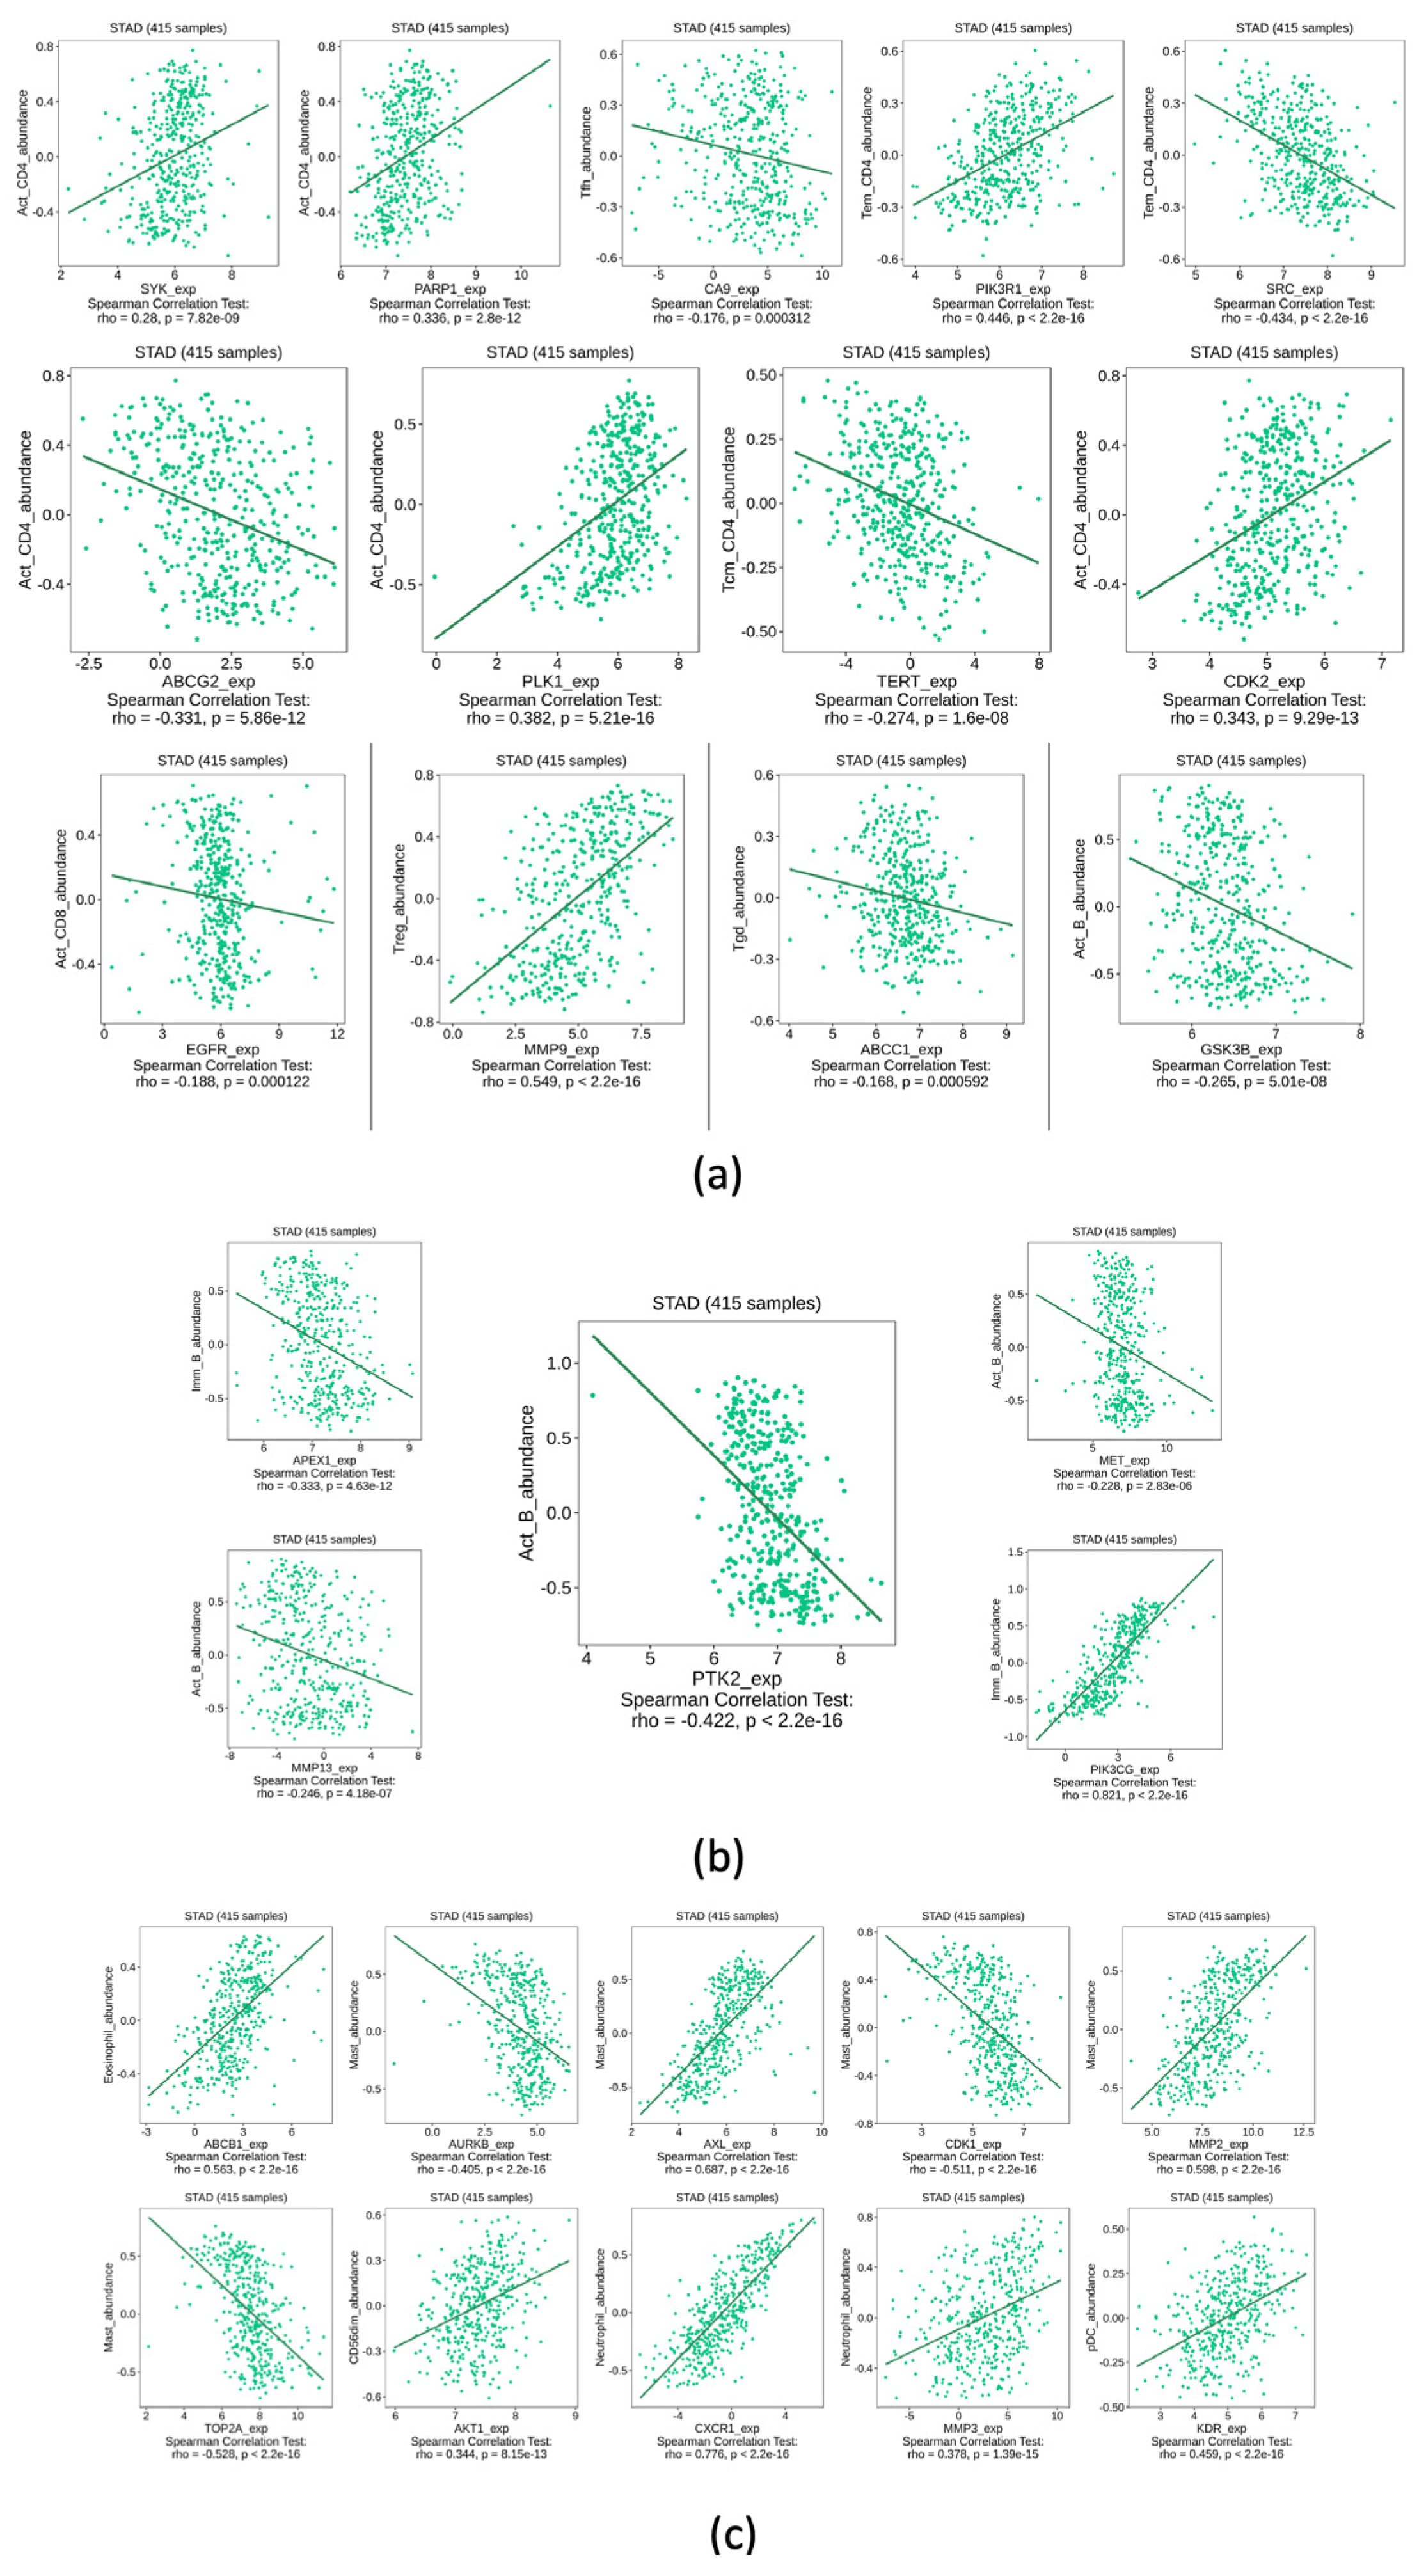
Figure 9 shows the immune infiltration for each gene, as determined by the TISIDB website (http://cis.hku.hk/TISIDB/). This section only displays information for cells with the closest rho value to -1 and/or 1; the rest is available in the supplementary material.

3.6. Docking Analysis

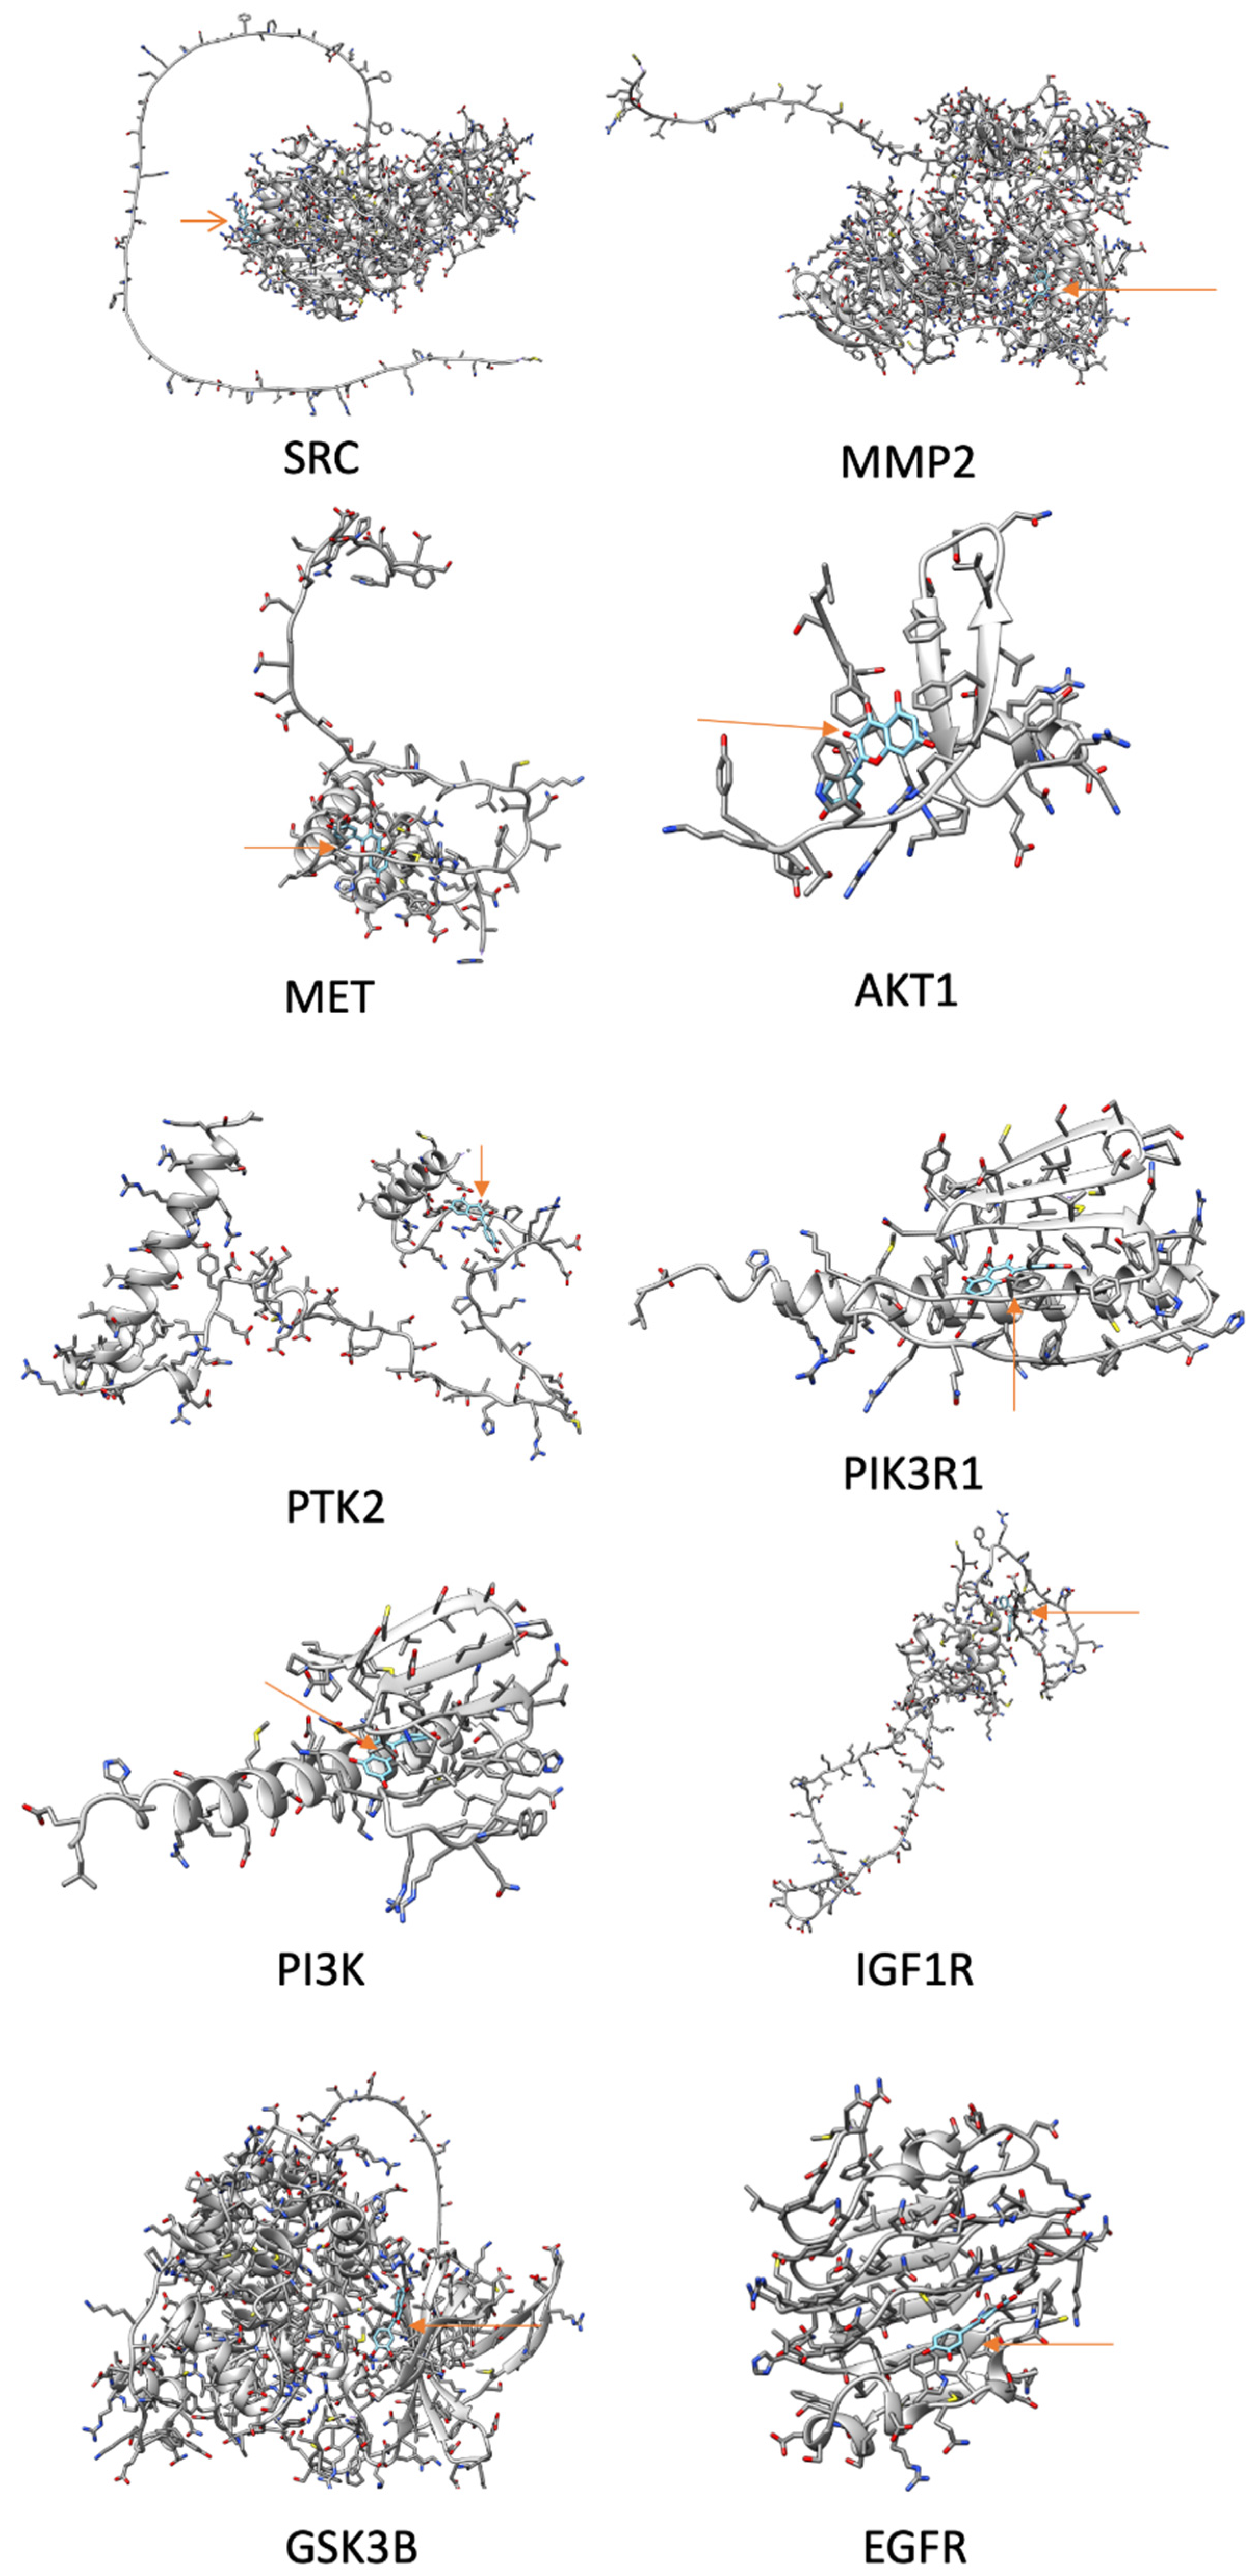
For the molecular docking analysis, Cytoscape was used to determine which HUB genes are related to mechanisms activating cancer invasion and metastasis. These were MET, EGFR, MMP2, MMP9, TOP2A, AKT1, KDR, SRC, PTK2, IGF1R, PIK3CG, PIK3R1, and GSK3B. The SwissDock website (http://www.swissdock.ch/) was then used to perform molecular docking analysis between the proteins of the final 13 genes and QRC, and the results were visualized using UCSF CHIMERA software (https://www.cgl.ucsf.edu/chimera/docs/ContributedSoftware/webdata/webdata.html#browser). Docking figures are shown in Figure 10.

4. Discussion

Bioinformatic tools have emerged in the last two decades as a collection of strategies that are helpful in determining potential therapeutic targets of various chemical compounds, to make further research more precise and with a higher degree of certainty. The results of this study suggested a relationship between QRC and GC pathways (13), leading to the idea of conducting a more concise and complete analysis of that result was conceived and presented in this work.
For the results presented in Figure 2, we compared the genes associated with GC and the potential therapeutic targets of QRC using the Venny 2.1.0 website. The information on each one was obtained from two different websites. As for the GC-associated genes, the database was Malacards (15), which provides extensive information and has been used in several publications (36,37). Here, the information on all the GC genes is obtained by using an algorithm that generates a comprehensive list by taking into account the known GeneCards Search mechanism, Genetic testing resources, Genetic Variation resources, and manually curated association of a disease with specific genes. On the other hand, QRC target genes were obtained through SwissTargetPrediction. This tool analyzes the molecule of interest in five dimensions using the Tanimoto Index (13,14). these two tools have been widely used in studies aimed at identifying molecular targets broadly or in specific diseases. (38). As such using these tools to identify relevant genes for this study was crucial, as shown in Figure 3.
Figure 3 displays the associated pathways of the 31 genes common to QRC and GC. Among these results, several are immediately interesting. For example, in stem cancer cells EGFR (Epidermal growth factor receptor) is a key tyrosine kinase that regulates the initiation, maintenance, and survival of cancer cells (39), also it has been reported that mutations in such gene trigger the onset of other types of cancer (40) and it has been known that in GC, EGFR acts as an oncogene (41). In general EGFR pathways are crucial for understanding cancer mechanisms. Other interesting pathways include the PI3K-Akt signaling pathways, Proteoglycans in cancer, and Focal adhesion, as both Proteoglycans and Focal adhesion play key roles in cancer propagation and potential metastasis (42). Then, another pathway of interest is the Chemokine Signaling pathway, not only because cancer cells are known to produce pro-inflammatory molecules (43), but also because chemokines are important in immune system regulation and infiltration, processes linked to cancer propagation or mitigation (44) including (but not limited to) GC. All the signaling pathways obtained in the GO analysis were also tested in a Network Analysis (Figure 4), showing that most are closely linked to one another, suggesting that changes in one system could produce changes in all the other linked pathways. furthermore, in Figure 5, the KEGG pathway of GC is shown with the key genes identified in the comparison with QRC and GC highlighted in red. the information presented by this database is similar to the GO analysis as most of the highlighted molecules are linked to the EGFR, PI3K-Akt, Inflammation, and Cell cycle processes of GC. These results are not only suggested by bioinformatic tools but also supported by some publications that prove the importance of the suggested signaling pathways by the GO analysis (45). Finally, regarding Gene Ontology, Figure 6 shows the analysis by the DAVID bioinformatics database, giving insight into the cell structures linked to the 31 genes of interest. The most interesting results are the annotations for the Nucleus and Cytoplasm of the cells. These structures are crucial in many cell processes, but particularly in cell cycle regulation and cell replication for any type of cancer. These results are not surprising, as studies have suggested how QRC can modulate the cell cycle in cancer cells. For instance, Chou C et al. found that QRC can arrest the cell cycle and activate apoptosis in human breast cancer MCF-7 cells (46). It is also important to note that while the pathways suggested to be modified by QRC in GC are presented here, the relationship between the genes in any disease is not only linked between their pathways but also by in how the proteins transcribed from these genes interact with each other, this result is shown with PPI network analysis.
Figure 7 shows the PPI network analysis using Stringdb. Here, there is an interconnected network between most proteins derived from the genes of interest. This result aligns with expectations, as historically, many publications corroborate the idea that protein interactions are closely linked in cancer (47). This level of interconnection has many layers, as StringDB proclaims. The color of the strings indicates whether interactions are directly curated from databases (light blue), experimentally determined (purple), predicted by in-silico analysis (green, red, and navy blue), or another kind of interaction analysis: text-mining (light green), co-expression (black), and protein homology (gray). As briefly mentioned, most proteins have a higher degree of interconnection in cancer. However, most relationships between each HUB gene (and their corresponding proteins) have not been fully studied. Even so, some cancer studies have looked to add such interactions. Kim et al. (48) in a study comparing the effectiveness of two ginseng variants in SVEC4-10 cells to generate an anti-angiogenic effect, found that ginseng was capable of this, with the proposed mechanism linked to a phosphorylation chain of FAK, Src, Akt, and ERK diminishing VEGF-R2. This result is interesting for this study as it directly links at least two HUB genes (Src and Akt).
Furthermore, Sigstedt et al. (49) found a similar effect when testing Taraxacum officinale aqueous extract. Still, they also found that phosphorylation of genes like FAK reduced metalloproteases (MMP2 and MMP9), decreasing breast and prostate cancer cell invasion by promoting PIK-Akt pathway activity and keeping Nf-kB in the cytoplasm of the cancer cell. This result is not isolated; Villegas-Comonfort et al. tested arachidonic acid’s capacity to promote migration and invasion in MDA-MB-231 breast cancer cells (50) and found a close relationship between PI3K-Akt and both migration and invasion, also by promoting Nf-kB activity. All these results are noteworthy since most tested biocompounds against cancer and found some interaction to highlight. However, one interaction not presented is the impact of HUB genes on other aspects of cancer as a disease, for example, survival.
Using the HUB genes obtained through PPI network analysis (30 genes total), survival analysis was performed using GEPIA2. Survival curves have been useful in determining the efficiency of certain clinical treatments or the progression of cancer types (51). Nowadays, they are also useful to see the importance of any protein/gene in survival odds against any cancer. As for the results presented in Figure 8, only one HUB gene, AXL, had statistical significance in this test. This gene is transcribed and translated to the AXL receptor tyrosine kinase. AXL has been identified as a receptor that transduces signals from the extracellular matrix into GAS6, regulating biological processes like cell survival, proliferation, migration, and differentiation (52). One proposed mechanism for AXL to enable these processes is through transcriptional regulation of MMP9 (another HUB gene in this study)(53), Tai et al. (54) showed how several cancer cell lines, when AXL transcription increases, activate the Nf-κB pathway, concluding with an increase in MMP9 levels, a protein closely related to metastasis. Nevertheless, to our knowledge, the relationship between AXL and GC has not been fully tested. Interestingly, Nf-κB is a common mechanism between numerous processes related to cancer evolution, including metastasis and immune system infiltration, a process discussed next.
Since their seminar study delimited the important factors for cancer appearance and evolution, Hanahan and Weinberg (55), made it clear that the immune system is a very complicated but important part of that disease. For instance, there is a relationship between the type of macrophage cells surrounding tumor cells. If the macrophages are of the M2 kind, they will promote cancer proliferation (by promoting angiogenesis)(56), thus M2 cells promote the ideal microenvironment for cancer. On the other hand, M1 macrophages can do the opposite; M1 cells are adept at combating the disease. Just like this example, many cells of the immune system can have either of those roles. In this study, the correlation between the HUB genes and GC was tested. Figure 9 is divided into parts. In part (a), the only results shown are those of the CD4+ type cells. CD4+ cells have been associated with a predominant role in the progression and evolution of infectious and autoimmune diseases (57). However, in the last decades, the role of CD4+ cells in general cancer prognosis and treatment have taken on a more interesting role. For instance, Zhen-Quan et al. showed how CD39 expression of CD4+ cells is associated with poor survival in GC (58). Also, since our results suggest that most of the CD4+ cells have not only been statistically significant with some of the HUB genes (SYK, PARP1, CA9, PI3KR1, SRC, ABCGW, PLK1, TERT, CDK2, EGFR, MMP9, ABCC1, GSK3B) but all of them have a rho value different than 0, the idea that those genes have a key role in the infiltration for this kind of cell is reinforced. However, the implication of the presence of any gene and CD4+ is not something that this methodology can assess, but it is possible to make some connections when looking at other research. Similar results can be seen in other kinds of immune cells as well. CD8+ cells showed how, for most cases, there is a negative correlation (rho equal to or less than 0) between the HUB genes and the infiltration of this kind of cells in GC. This could be because the role of some of the tested genes like AXL or PI3CG are linked to the activation of metabolic pathways that increase the energy consumption of the cancer cells (59). Also, there is an important relationship between the energy consumption of CD8 cells and their proliferation and survival in cancer (60). The malignant cells will outcompete the immune cells and, as such, cause them to decrease their number in the disease. Furthermore, most cancers trigger “sickness-induced anorexia” which reduces the number of nutrients available for all cells and, therefore, can reduce the infiltration of CD8+ cells to tumors (61). Our results could be important since, for example, QRC can, in the case of GC, reduce the transcription of the genes that increase tumor energy consumption. This would be a mechanism in which QRC helps in cancer treatment, especially in GC, a type of cancer that by itself makes it harder for the patient to get nutrients.
Another important result from Figure 9 is shown in part (c), where the infiltration of other cells of the immune system in GC was tested. As for the mast cells, the result of the analysis is mixed, with the HUB genes having both a positive and negative correlation. This result is significant due to the relationship of mast cells in cancer. At the early stages of the appearance of the malignant cells, mast cells are key in the recruitment of the immune system for their destruction (62). However, mast cells can increase the angiogenesis of tumors and promote the infiltration of M2 macrophages (and other cells) that promote metastasis and cancer progression (56). As such, further understanding of QRC and its relationship to the activation of mast cells is important but outside the scope of this study. Finally, the last cells to be discussed are eosinophils, neutrophils, and NK cells. While most of their infiltration in GC is positively correlated to the HUB genes, their role in the disease mirrors closely that of the mast cells (62,63), o their understanding in relation to GC and QRC is still limited. The biggest limiting factor of this test is that, while we can know if the HUB genes that are affected in GC by QRC have an impact on immune system infiltration, it cannot be known if the interaction by QRC will increase or reduce the transcription of a certain gene, or even if the interaction between the molecules can happen to begin with. Fortunately, while the levels of protein transcriptions are beyond the scope of this study, the molecular docking is not.
Figure 10 shows the docking analysis results of the genes linked to metastasis in GC (filtered by Cytoscape). This analysis is made by using the SwissDock site, which uses EADock DSS. This algorithm uses a binding model within every potential 3D cavity to identify the targets of chemicals on proteins. Grosdidier A., Zoete V., and Michielin O. report that this software has a near-70% accuracy rate in properly predicting binding models in this task (30). Additionally, it uses tools like Chemistry at Harvard Macromolecular Mechanics (CHARMM) and Fast Analytical Continuum Treatment of Solvation (FACTS) (64), which help it distinguish and filter its results. In combination, these tools allow ligands with less than 15 free dihedral angles and/or test complexes with defined binding pockets to achieve a 96% success rate in EADock DSS. Later, to analyze the obtained data, attention was put to the “Delta G” of each of the proteins with QRC. The lower the Delta G value, the higher the molecule’s bond to the protein. According to this, most of the proteins related to metastasis of GC can be bound to QRC. Some studies have found evidence of alteration of these genes-related pathways, and those could be started by the chemical binding of QRC to the proteins.

5. Conclusions

According to the whole results of this study, QRC has the potential of being at least a coadjuvant factor in the treatment of GC. It has a wide spectrum of potential targets that have been associated with multiple types of cancer with survival, proliferation, and evolution of the disease. This study also provides a more generalized view of the effects of the compound on other cells that directly or indirectly also affect cancer, such as the immune system cells. However, this study, by its nature, has some limitations. First, while bioinformatic tools are incredibly useful in obtaining a more precise idea of complex problems such as the effects of a molecule in a disease (QRC and GC) to make further research more focused, it is important to remark that the information is still incomplete. For instance, in this article, more than 30 possible biological targets of QRC were detected, but to date, there is little to no information about most of them in GC. Therefore, while this study accomplishes its general objective, it is only a step toward the bigger picture of effectively using QRC in the treatment of GC.

6. Patents

Author Contributions

Conceptualization, S.R.Z.-H. and C.M.R.-R.; Data curation, A.P.-L.; Formal analysis, A.P.-L.; Funding acquisition, C.M.R.-R.; Investigation, S.R.Z.-H. and M.M.-C.; Methodology, Y.K.G.-M. and C.M.R.-R.; Project administration, Y.K.G.-M.; Resources, M.M.-C.; Supervision, T.G.-I. and C.M.R.-R.; Visualization, G.C.-H.; Writing—original draft, S.R.Z.-H.; Writing—review and editing, T.G.-I., M.M.-C., A.P.-L., Y.K.G.-M., G.C.-H. and C.M.R.-R. All authors have read and agreed to the published version of the manuscript.

Funding

This research received no external funding.

Institutional Review Board Statement

Not applicable.

Informed Consent Statement

Not applicable.

Data Availability Statement

The original contributions presented in the study are included in the article and supplementary material, further inquiries can be directed to the corresponding authors.

Conflicts of Interest

The authors declare no conflicts of interest.

References

  1. Sitarz R, Skierucha M, Mielko J, Offerhaus J, Maciejewski R, Polkowski W. Gastric cancer: epidemiology, prevention, classification, and treatment. Cancer Manag Res. 2018 Feb;Volume 10:239–48.
  2. Mukkamalla SKR, Recio-Boiles A, Babiker HM. https://www.ncbi.nlm.nih.gov/books/NBK459142/. 2024. Gastric Cancer.
  3. World Health Organization. https://gco.iarc.fr/en. 2022. Global Cancer Observatory.
  4. Wipperman J, NT, & WT. Cervical Cancer: Evaluation and Management.. Am Fam Physician. 2018;97(7):4449–54.
  5. Herranz-López, Olivares-Vicente, Rodríguez Gallego E, Antonio Encinar, Pérez-Sánchez A, Ruiz-Torres et al. Quercetin metabolites from Hibiscus sabdariffa contribute to alleviate glucolipotoxicity-induced metabolic stress in vitro. Food Chem Toxicol. 2020;(144):111606.
  6. Herranz-López M, Olivares-Vicente M, Rodríguez Gallego E, Encinar JA, Pérez-Sánchez A, Ruiz-Torres V, et al. Quercetin metabolites from Hibiscus sabdariffa contribute to alleviate glucolipotoxicity-induced metabolic stress in vitro. Food and Chemical Toxicology. 2020 Oct 1;144.
  7. Azizi E, Fouladdel S, Komeili Movahhed T, Modaresi F, Barzegar E, Ghahremani MH, et al. Quercetin Effects on Cell Cycle Arrest and Apoptosis and Doxorubicin Activity in T47D Cancer Stem Cells. Asian Pacific Journal of Cancer Prevention. 2022 Dec 1;23(12):4145–54.
  8. Chen K, Rekep M, Wei W, Wu Q, Xue Q, Li S, et al. Quercetin Prevents In Vivo and In Vitro Myocardial Hypertrophy Through the Proteasome-GSK-3 Pathway. Cardiovasc Drugs Ther. 2018 Feb 1;32(1):5–21.
  9. Dhanya R, Arun KB, Syama HP, Nisha P, Sundaresan A, Santhosh Kumar TR, et al. Rutin and quercetin enhance glucose uptake in L6 myotubes under oxidative stress induced by tertiary butyl hydrogen peroxide. Food Chem. 2014 Sep;158:546–54.
  10. Chen WJ, Tsai JH, Hsu LS, Lin CL, Hong HM, Pan MH. Quercetin blocks the aggressive phenotype of triple-negative breast cancer by inhibiting igf1/ igf1r-mediated emt program. J Food Drug Anal. 2021;29(1):98–112.
  11. Henning SM, Wang P, Lee RP, Trang A, Husari G, Yang J, et al. Prospective randomized trial evaluating blood and prostate tissue concentrations of green tea polyphenols and quercetin in men with prostate cancer. Food Funct. 2020 May 1;11(5):4114–22.
  12. Costa LG, Garrick JM, Roquè PJ, Pellacani C. Mechanisms of Neuroprotection by Quercetin: Counteracting Oxidative Stress and More. Oxid Med Cell Longev [Internet]. 2016 [cited 2022 May 19];2016. Available from: https://pubmed.ncbi.nlm.nih.gov/26904161/.
  13. Zúñiga-Hernández SR, García-Iglesias T, Macías-Carballo M, Pérez-Larios A, Gutiérrez-Mercado YK, Camargo-Hernández G, et al. Targets and Effects of Common Biocompounds of Hibiscus sabdariffa (Delphinidin-3-Sambubiosid, Quercetin, and Hibiscus Acid) in Different Pathways of Human Cells According to a Bioinformatic Assay. Nutrients. 2024 Feb 19;16(4):566.
  14. Daina A, Michielin O, Zoete V. Swiss Target Prediction: updated data and new features for efficient prediction of protein targets of small molecules. Nucleic Acids Res. 2019 Jul 2;47(W1):W357–64.
  15. Rappaport N, Nativ N, Stelzer G, Twik M, Guan-Golan Y, Iny Stein T, et al. MalaCards: an integrated compendium for diseases and their annotation. Database. 2013 Jan 1;2013.
  16. Ge SX, Jung D, Yao R. ShinyGO: a graphical gene-set enrichment tool for animals and plants. Bioinformatics. 2020 Apr 15;36(8):2628–9.
  17. Dennis G, Sherman BT, Hosack DA, Yang J, Gao W, Lane HC, et al. DAVID: Database for Annotation, Visualization, and Integrated Discovery. Genome Biol. 2003 Aug 14;4(9):R60.
  18. Pawitan Y, Michiels S, Koscielny S, Gusnanto A, Ploner A. False discovery rate, sensitivity and sample size for microarray studies. Bioinformatics. 2005 Jul 1;21(13):3017–24.
  19. Szklarczyk D, Franceschini A, Wyder S, Forslund K, Heller D, Huerta-Cepas J, et al. STRING v10: protein–protein interaction networks, integrated over the tree of life. Nucleic Acids Res. 2015 Jan 28;43(D1):D447–52.
  20. Franceschini A, Szklarczyk D, Frankild S, Kuhn M, Simonovic M, Roth A, et al. STRING v9.1: protein-protein interaction networks, with increased coverage and integration. Nucleic Acids Res. 2012 Nov 29;41(D1):D808–15.
  21. von Mering C, Jensen LJ, Kuhn M, Chaffron S, Doerks T, Kruger B, et al. STRING 7--recent developments in the integration and prediction of protein interactions. Nucleic Acids Res. 2007 Jan 3;35(Database):D358–62.
  22. Szklarczyk D, Franceschini A, Kuhn M, Simonovic M, Roth A, Minguez P, et al. The STRING database in 2011: functional interaction networks of proteins, globally integrated and scored. Nucleic Acids Res. 2011 Jan 1;39(Database):D561–8.
  23. Szklarczyk D, Morris JH, Cook H, Kuhn M, Wyder S, Simonovic M, et al. The STRING database in 2017: quality-controlled protein–protein association networks, made broadly accessible. Nucleic Acids Res. 2017 Jan 4;45(D1):D362–8.
  24. Jensen LJ, Kuhn M, Stark M, Chaffron S, Creevey C, Muller J, et al. STRING 8--a global view on proteins and their functional interactions in 630 organisms. Nucleic Acids Res. 2009 Jan 1;37(Database):D412–6.
  25. Szklarczyk D, Gable AL, Lyon D, Junge A, Wyder S, Huerta-Cepas J, et al. STRING v11: protein–protein association networks with increased coverage, supporting functional discovery in genome-wide experimental datasets. Nucleic Acids Res. 2019 Jan 8;47(D1):D607–13.
  26. Szklarczyk D, Gable AL, Nastou KC, Lyon D, Kirsch R, Pyysalo S, et al. The STRING database in 2021: customizable protein–protein networks, and functional characterization of user-uploaded gene/measurement sets. Nucleic Acids Res. 2021 Jan 8;49(D1):D605–12.
  27. Szklarczyk D, Kirsch R, Koutrouli M, Nastou K, Mehryary F, Hachilif R, et al. The STRING database in 2023: protein–protein association networks and functional enrichment analyses for any sequenced genome of interest. Nucleic Acids Res. 2023 Jan 6;51(D1):D638–46.
  28. Tang Z, Kang B, Li C, Chen T, Zhang Z. GEPIA2: an enhanced web server for large-scale expression profiling and interactive analysis. Nucleic Acids Res. 2019 Jul 2;47(W1):W556–60.
  29. Ru B, Wong CN, Tong Y, Zhong JY, Zhong SSW, Wu WC, et al. TISIDB: an integrated repository portal for tumor–immune system interactions. Bioinformatics. 2019 Oct 15;35(20):4200–2.
  30. Grosdidier A, Zoete V, Michielin O. SwissDock, a protein-small molecule docking web service based on EADock DSS. Nucleic Acids Res. 2011 Jul 1;39(suppl):W270–7.
  31. Shannon P, Markiel A, Ozier O, Baliga NS, Wang JT, Ramage D, et al. Cytoscape: A Software Environment for Integrated Models of Biomolecular Interaction Networks. Genome Res. 2003 Nov;13(11):2498–504.
  32. Burley SK, Bhikadiya C, Bi C, Bittrich S, Chao H, Chen L, et al. RCSB Protein Data Bank (RCSB.org): delivery of experimentally-determined PDB structures alongside one million computed structure models of proteins from artificial intelligence/machine learning. Nucleic Acids Res. 2023 Jan 6;51(D1):D488–508.
  33. Jumper J, Evans R, Pritzel A, Green T, Figurnov M, Ronneberger O, et al. Highly accurate protein structure prediction with AlphaFold. Nature. 2021 Aug 26;596(7873):583–9.
  34. Sayers EW, Bolton EE, Brister JR, Canese K, Chan J, Comeau DC, et al. Database resources of the national center for biotechnology information. Nucleic Acids Res. 2022 Jan 7;50(D1):D20–6.
  35. Pettersen EF, Goddard TD, Huang CC, Couch GS, Greenblatt DM, Meng EC, et al. UCSF Chimera—A visualization system for exploratory research and analysis. J Comput Chem. 2004 Oct;25(13):1605–12.
  36. Huang AY, Xiong Z, Liu K, Chang Y, Shu L, Gao G, et al. Identification of kaempferol as an OSX upregulator by network pharmacology-based analysis of qianggu Capsule for osteoporosis. Front Pharmacol. 2022 Sep 23;13.
  37. Kolobkov DS, Sviridova DA, Abilev SK, Kuzovlev AN, Salnikova LE. Genes and Diseases: Insights from Transcriptomics Studies. Genes (Basel). 2022 Jun 28;13(7):1168.
  38. Yan L, Zhang Z, Liu Y, Ren S, Zhu Z, Wei L, et al. Anticancer Activity of Erianin: Cancer-Specific Target Prediction Based on Network Pharmacology. Front Mol Biosci. 2022 Mar 17;9.
  39. Reya T, Morrison SJ, Clarke MF, Weissman IL. Stem cells, cancer, and cancer stem cells. Nature. 2001 Nov;414(6859):105–11.
  40. Harrison PT, Vyse S, Huang PH. Rare epidermal growth factor receptor (EGFR) mutations in non-small cell lung cancer. Semin Cancer Biol. 2020 Apr;61:167–79.
  41. Levantini E, Maroni G, Del Re M, Tenen DG. EGFR signaling pathway as therapeutic target in human cancers. Semin Cancer Biol. 2022 Oct;85:253–75.
  42. Lin X, Zhuang S, Chen X, Du J, Zhong L, Ding J, et al. lncRNA ITGB8-AS1 functions as a ceRNA to promote colorectal cancer growth and migration through integrin-mediated focal adhesion signaling. Molecular Therapy. 2022 Feb;30(2):688–702.
  43. Song X, Traub B, Shi J, Kornmann M. Possible Roles of Interleukin-4 and -13 and Their Receptors in Gastric and Colon Cancer. Int J Mol Sci. 2021 Jan 13;22(2):727.
  44. Zhang SC, Hu ZQ, Long JH, Zhu GM, Wang Y, Jia Y, et al. Clinical Implications of Tumor-Infiltrating Immune Cells in Breast Cancer. J Cancer. 2019;10(24):6175–84.
  45. Lei ZN, Teng QX, Tian Q, Chen W, Xie Y, Wu K, et al. Signaling pathways and therapeutic interventions in gastric cancer. Signal Transduct Target Ther. 2022 Oct 8;7(1):358.
  46. Chou CC, Yang JS, Lu HF, Ip SW, Lo C, Wu CC, et al. Quercetin-mediated cell cycle arrest and apoptosis involving activation of a caspase cascade through the mitochondrial pathway in human breast cancer MCF-7 cells. Arch Pharm Res. 2010 Aug;33(8):1181–91.
  47. Kim M, Park J, Bouhaddou M, Kim K, Rojc A, Modak M, et al. A protein interaction landscape of breast cancer. Science (1979). 2021 Oct;374(6563).
  48. Kim J, Yoo JM, Park JS, Kim J, Kim SG, Seok YJ, et al. Anti-angiogenic effect of mountain ginseng in vitro and in vivo: Comparison with farm-cultivated ginseng. Mol Med Rep. 2021 Jun 29;24(2):615.
  49. Sigstedt SC, Hooten CJ, Callewaert MC, Jenkins AR, Romero AE, Pullin MJ, et al. Evaluation of aqueous extracts of Taraxacum officinale on growth and invasion of breast and prostate cancer cells. Int J Oncol. 2008 May;32(5):1085–90.
  50. Villegas-Comonfort S, Serna-Marquez N, Galindo-Hernandez O, Navarro-Tito N, Salazar EP. Arachidonic acid induces an increase of β-1,4-galactosyltransferase I expression in MDA-MB-231 breast cancer cells. J Cell Biochem. 2012 Nov 18;113(11):3330–41.
  51. Wei C, Wang B, Peng D, Zhang X, Li Z, Luo L, et al. Pan-Cancer Analysis Shows That ALKBH5 Is a Potential Prognostic and Immunotherapeutic Biomarker for Multiple Cancer Types Including Gliomas. Front Immunol. 2022 Apr 4;13.
  52. Zhu C, Wei Y, Wei X. AXL receptor tyrosine kinase as a promising anti-cancer approach: functions, molecular mechanisms and clinical applications. Mol Cancer. 2019 Dec 4;18(1):153.
  53. Han S, Wang Y, Ge C, Gao M, Wang X, Wang F, et al. Pharmaceutical inhibition of AXL suppresses tumor growth and invasion of esophageal squamous cell carcinoma. Exp Ther Med. 2020 Sep 2;20(5):1–1.
  54. Tai KY, Shieh YS, Lee CS, Shiah SG, Wu CW. Axl promotes cell invasion by inducing MMP-9 activity through activation of NF-κB and Brg-1. Oncogene. 2008 Jul 3;27(29):4044–55.
  55. Hanahan D, Weinberg RA. Hallmarks of Cancer: The Next Generation. Cell. 2011 Mar;144(5):646–74.
  56. Genin M, Clement F, Fattaccioli A, Raes M, Michiels C. M1 and M2 macrophages derived from THP-1 cells differentially modulate the response of cancer cells to etoposide. BMC Cancer. 2015 Dec 8;15(1):577.
  57. MacLeod MKL, Clambey ET, Kappler JW, Marrack P. CD4 memory T cells: What are they and what can they do? Semin Immunol. 2009 Apr;21(2):53–61.
  58. Duan Z, Li Y, Qiu Y, Shen Y, Wang Y, Zhang Y, et al. CD39 expression defines exhausted CD4 + T cells associated with poor survival and immune evasion in human gastric cancer. Clin Transl Immunology. 2024 Jan 18;13(3).
  59. Dolina JS, Van Braeckel-Budimir N, Thomas GD, Salek-Ardakani S. CD8+ T Cell Exhaustion in Cancer. Front Immunol. 2021 Jul 20;12.
  60. Reina-Campos M, Scharping NE, Goldrath AW. CD8+ T cell metabolism in infection and cancer. Nat Rev Immunol. 2021 Nov 12;21(11):718–38.
  61. Rao S, Schieber AMP, O’Connor CP, Leblanc M, Michel D, Ayres JS. Pathogen-Mediated Inhibition of Anorexia Promotes Host Survival and Transmission. Cell. 2017 Jan;168(3):503-516.e12.
  62. Komi DEA, Redegeld FA. Role of Mast Cells in Shaping the Tumor Microenvironment. Clin Rev Allergy Immunol. 2020 Jun 29;58(3):313–25.
  63. Davis BP, Rothenberg ME. Eosinophils and Cancer. Cancer Immunol Res. 2014 Jan 1;2(1):1–8.
  64. Grosdidier A, Zoete V, Michielin O. Fast docking using the CHARMM force field with EADock DSS. J Comput Chem. 2011 Jul 30;32(10):2149–59.
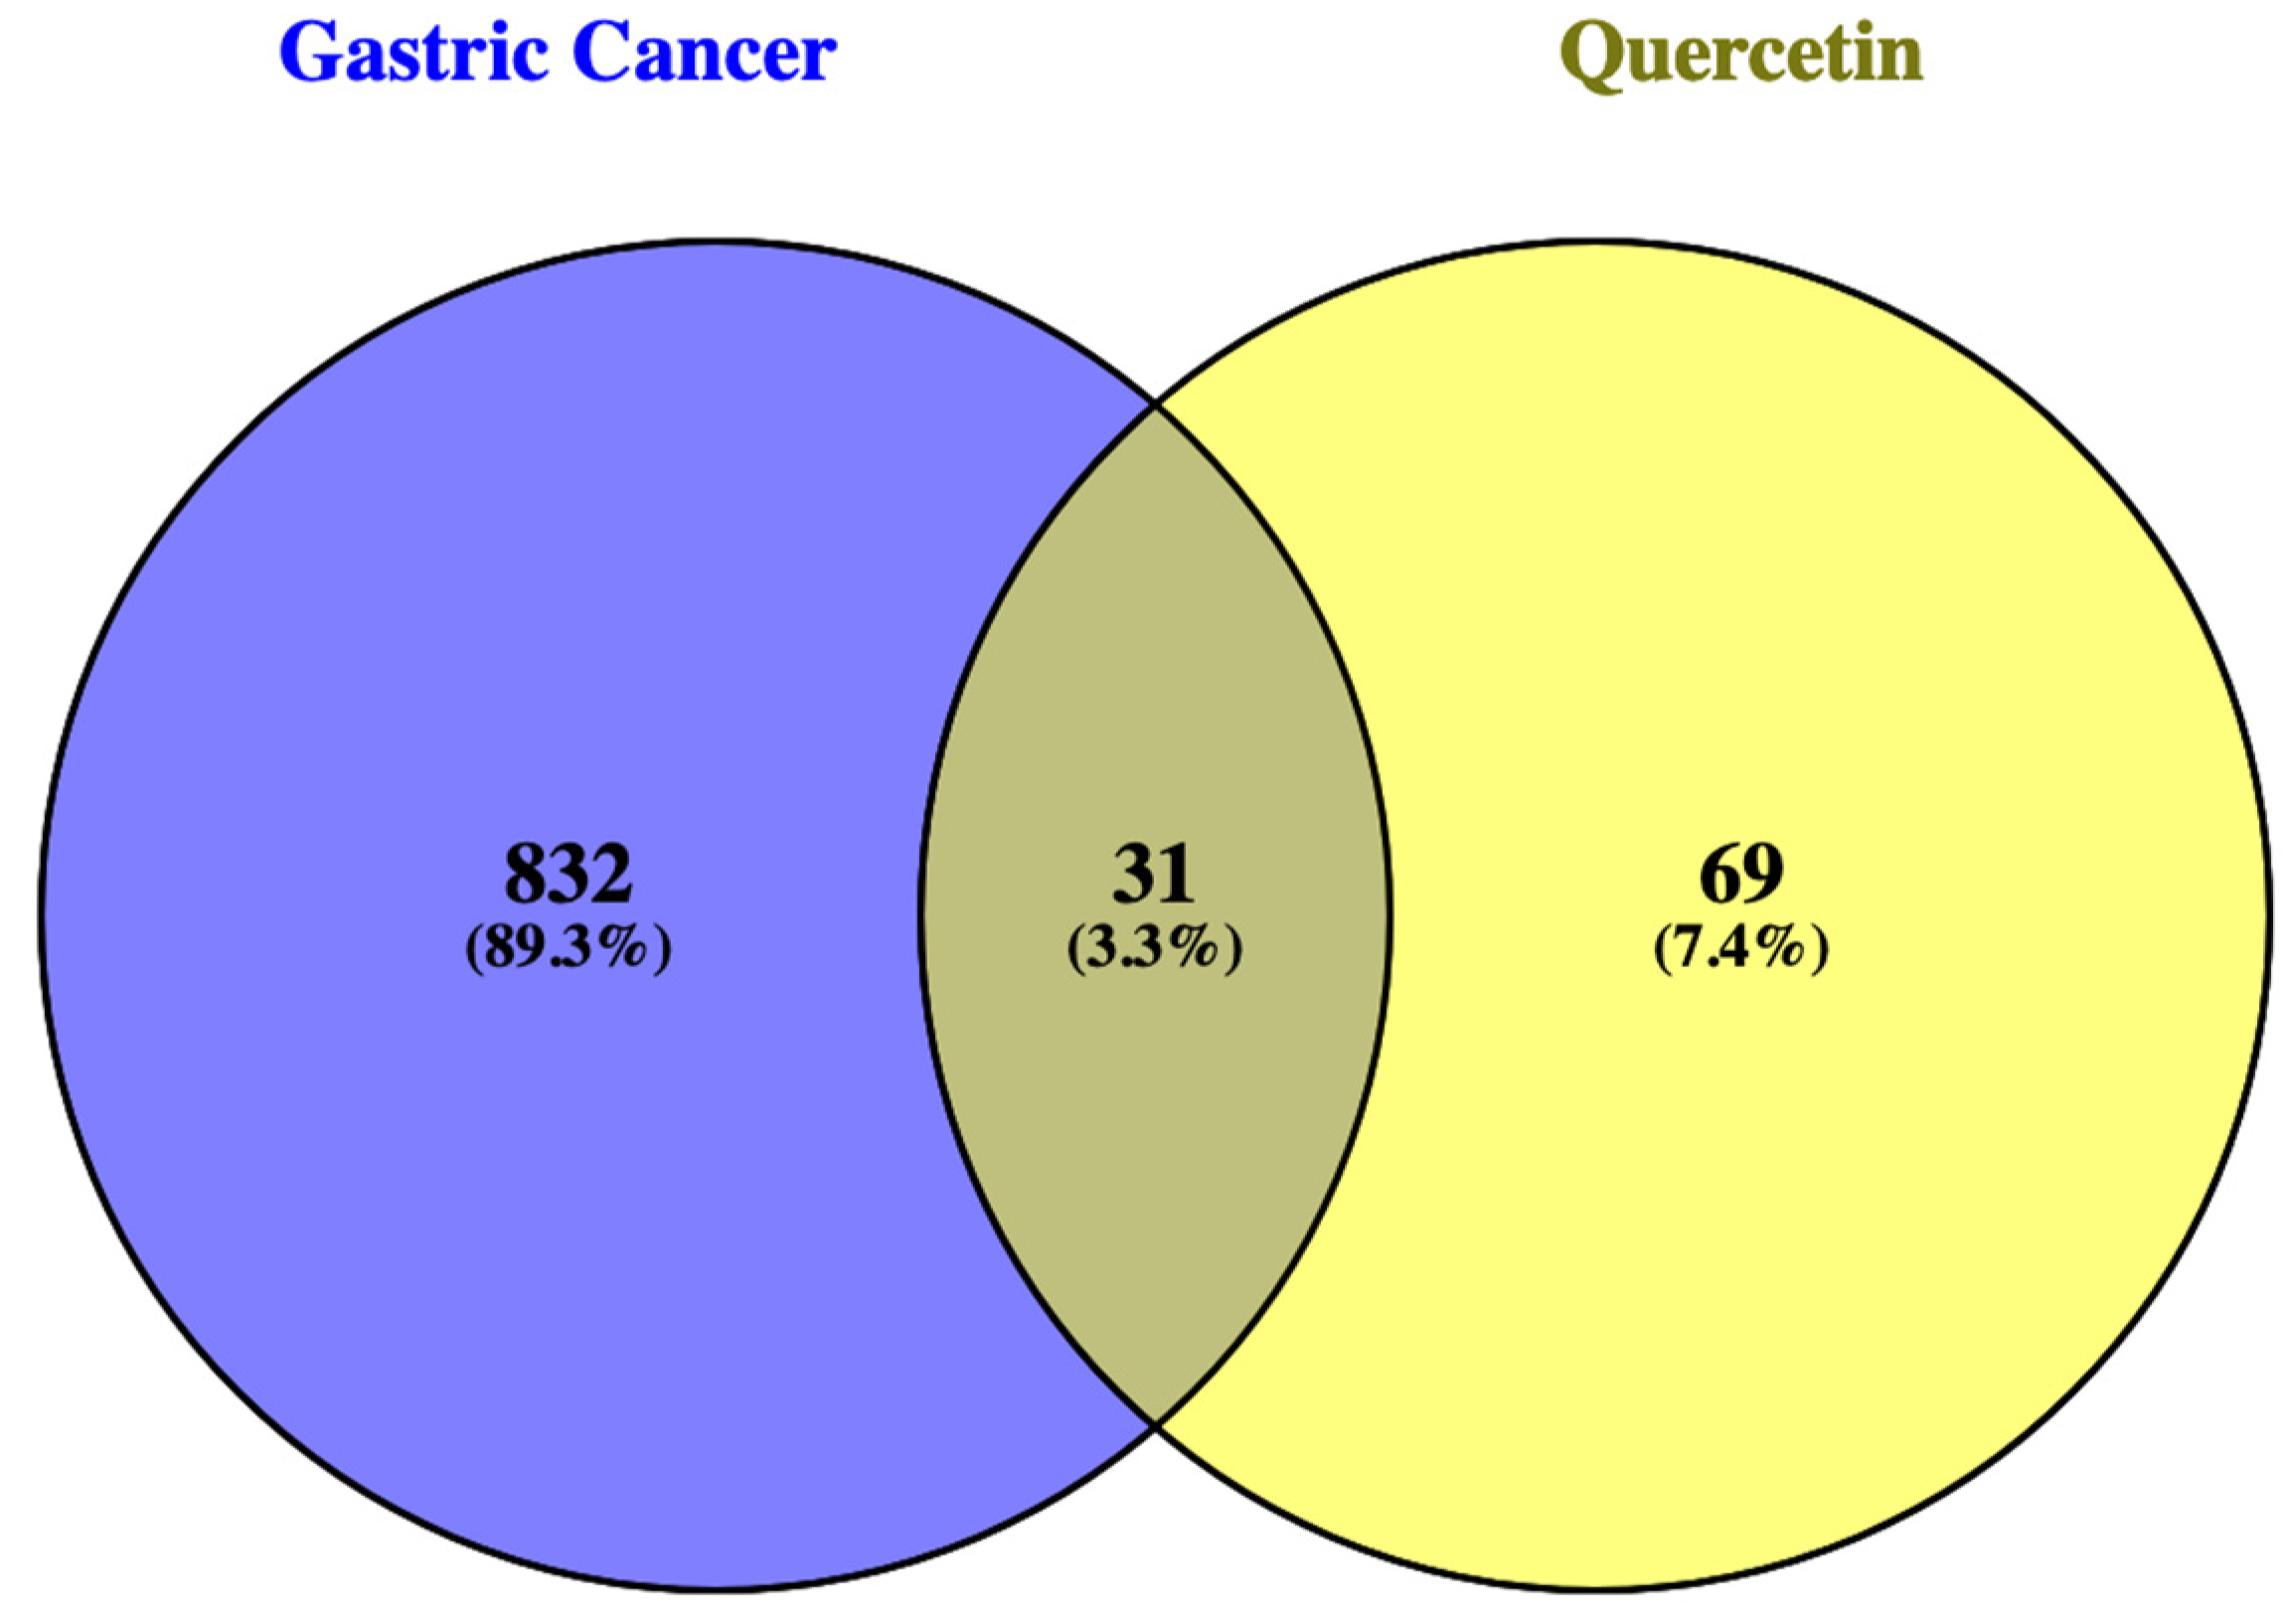
Figure 2. Genes in common between GC and QRC.
Preprints 110246 g001
Figure 3. Pathway Assessment Chart of the 31 genes in common between QRC and GC sorted by FDR.
Preprints 110246 g002
Figure 4. Pathway Network Analysis of genes in common between GC and QRC.
Preprints 110246 g003
Figure 5. KEGG Pathview of GC with possible QRC target genes highlighted.
Preprints 110246 g004
Figure 6. Functional Annotations of Cellular components related to genes in common between GC and QRC according to the DAVID bioinformatics database.
Preprints 110246 g005
Figure 7. Protein-to-protein analysis of GC and QRC target genes. Total nodes: 31, edges: 192, average node degree: 12.4, avg. local clustering coefficient: 0.734, expected edges: 74, PPI enrichment p-value: < 1.0e-16.
Preprints 110246 g006
Figure 8. Survival curves of the HUB genes. .
Preprints 110246 g007aPreprints 110246 g007b
Figure 9. Full immune system infiltration analysis segmented by cell type. All genes showed a p ≤ 0.05 and the highest or lowest rho score from -1 to 1. a) T-cell-related genes. b) B-cell-related genes. c) Other immune system cell-related genes.
Preprints 110246 g008
Figure 10. Docking images were obtained from UCSF Chimera using information from SwissDock. The protein genes are shown mostly in gray, QRC is light blue with an orange arrow pointing to it. Only the molecules with the ΔG ≤ -6.
Preprints 110246 g009
Disclaimer/Publisher’s Note: The statements, opinions and data contained in all publications are solely those of the individual author(s) and contributor(s) and not of MDPI and/or the editor(s). MDPI and/or the editor(s) disclaim responsibility for any injury to people or property resulting from any ideas, methods, instructions or products referred to in the content.
Copyright: This open access article is published under a Creative Commons CC BY 4.0 license, which permit the free download, distribution, and reuse, provided that the author and preprint are cited in any reuse.
Prerpints.org logo

Preprints.org is a free preprint server supported by MDPI in Basel, Switzerland.

Subscribe

© 2024 MDPI (Basel, Switzerland) unless otherwise stated