1. Introduction
A significant number of concrete dams built mainly before the mid-20
th century have been affected by alkali-aggregate reactions (AAR) around the world. AAR is a chemical reaction that occurs between the alkali hydroxides provided mainly by the Portland cement and certain types of reactive silica minerals present in some aggregates. It can lead to the development of several cracking over decades as a consequence of internal expansions, sometimes accompanied by the appearance of efflorescence and exudations on the faces of the dam. This reaction does not represent a potentially catastrophic or rapid failure issue for dams [
1]. AAR is a slowly developing mechanism that can cause significant degradation in the mechanical properties of the concrete leading to a considerable reduction in its ability to resist other loads. In the extreme, the advanced state of degradation caused by AAR can lead to the demolition of the dam and its substitution for a new one.
The environmental conditions to which the dam is exposed play a major role in dictating the progression and manifestation of this reaction [
2]. The effect of temperature on the rate of silica dissolution, which is a critical process in the development of AAR, have been extensively reported. Warmer average temperatures in general will accelerate silica dissolution and subsequent formation of AAR gel.
Amberg
et al. [
3] analyzing the behavior of Swiss dams affected by AAR concluded that radiant heat significantly influences swelling behavior. They observed that gravity dams tend to drift towards north due to the greater expansion experienced by the face exposed southward, which receives more solar insolation.
Arch dams, instead, always move towards upstream due to AAR expansion [
4]. But, as the amount of temperature rise due to solar radiation depends on the slope and orientation of the exposed surface, the rate of expansion will differ from one point to another, remaining highest in the zones that receive more solar insolation.
However, in the numerical thermal-mechanical simulation of AAR affected dams, the solar radiation and its associated shadow effects have received little attention. The spatiotemporal distribution of the solar radiation incidence on the dam surfaces has often been addressed in a simplified way or has just been neglected. Yet, far less attention has been given to shadows cast by the dam’s own geometry or the slopes.
For the diagnosis of AAR in the Isola arch gravity dam, Saouma and co-workers [
5,
6] introduced the effect of solar radiation by modifying the upstream and downstream air temperature. In the case of the Pian Telessio arch gravity dam, also suffering from the effects of AAR, Stucchi and Catalano [
7] calculated the dam temperature using the one-dimensional algorithm given in [
8], in which the interior temperature is calculated from the measured temperatures at upstream and downstream faces of the dam. In this way, the solar radiation is implicitly considered from the measured surface temperatures. Lamea and Mirzabozorg [
9], instead, introduced the solar radiation effect in an explicit manner in the assessment of the Dez double curvature arch dam. However, these authors did not consider the self- and external shadows, although the dam has 203 m of height and it is located in a steep sided valley. Moreover, it is not clear if the dam is effectively affected by AAR expansion or it is an academic example, since no comparison between computed and observed values is presented.
In the present study, the Alto Ceira dam is selected in order to evaluate the influence of the solar radiation and the shadow effects in the development of AAR expansion. During all its service life, the AAR expansion led to irreversible vertical and horizontal deformations, which never showed signs of slowing down. From the beginning, the observed deformation revealed an uneven distribution along the dam with the largest deformation registered on the right side, which corresponded to the side receiving a greater amount of annual solar insolation. In 1995, using the displacements measured from 1950 to 1993, a 3D finite element back analysis was performed in order to estimate the swelling strains, which would cause those displacements [
10,
11]. However, regardless of the proximity obtained between the monitored and computed displacements, this simplified approach did not allow gaining neither a new knowledge nor a deep understanding of the various phenomena that could influence or affect the AAR expansion. In this study, instead, a complete thermal-mechanical analysis is presented. In this way, the solar radiation or its occlusion are explicitly represented in the thermal analysis. Whereas, the mechanical analysis introduces the AAR evolution through its kinetic law instead of using imposed deformation as in the old analysis. In addition, and contrary to the old version, the new mechanical model explicitly represents the nonlinear behaviour induced by the opening/closing of the contraction joints and the dam-foundation interface by using zero thickness interface elements.
2. Dam description
Alto Ceria dam, shown in Error! Reference source not found., was located in the center of Portugal at the headwaters of the Ceira river, a little downstream of the confluence of the Fornea river.
Figure 1.
Downstream view of Alto Ceira dam.
Figure 1.
Downstream view of Alto Ceira dam.
Designed by Halcrow & Partners, its construction was completed in 1949. Its function was to divert the water of the river Ceira and of its tributaries to the reservoir of Santa Luzia dam.
The dam was a thin arch dam with a maximum height of 37 m above the river bed, a crest length of 120 m, and a thickness between 1.5 m at the crest and 4.5 m at the base of the central cantilever. A masonry spillway was located on the right bank.
Shortly after it started its operation, a geodetic surveying system for monitoring absolute displacements of object points on the dam was implemented. The system was based on a separate horizontal and vertical control network: a triangulation network composed of nine object points on the downstream face of the dam and a geometric levelling line composed of seven object points on the crest of the dam as it is shown in Error! Reference source not found..
Figure 2.
Downstream elevation view, geodetic surveying targets.
Figure 2.
Downstream elevation view, geodetic surveying targets.
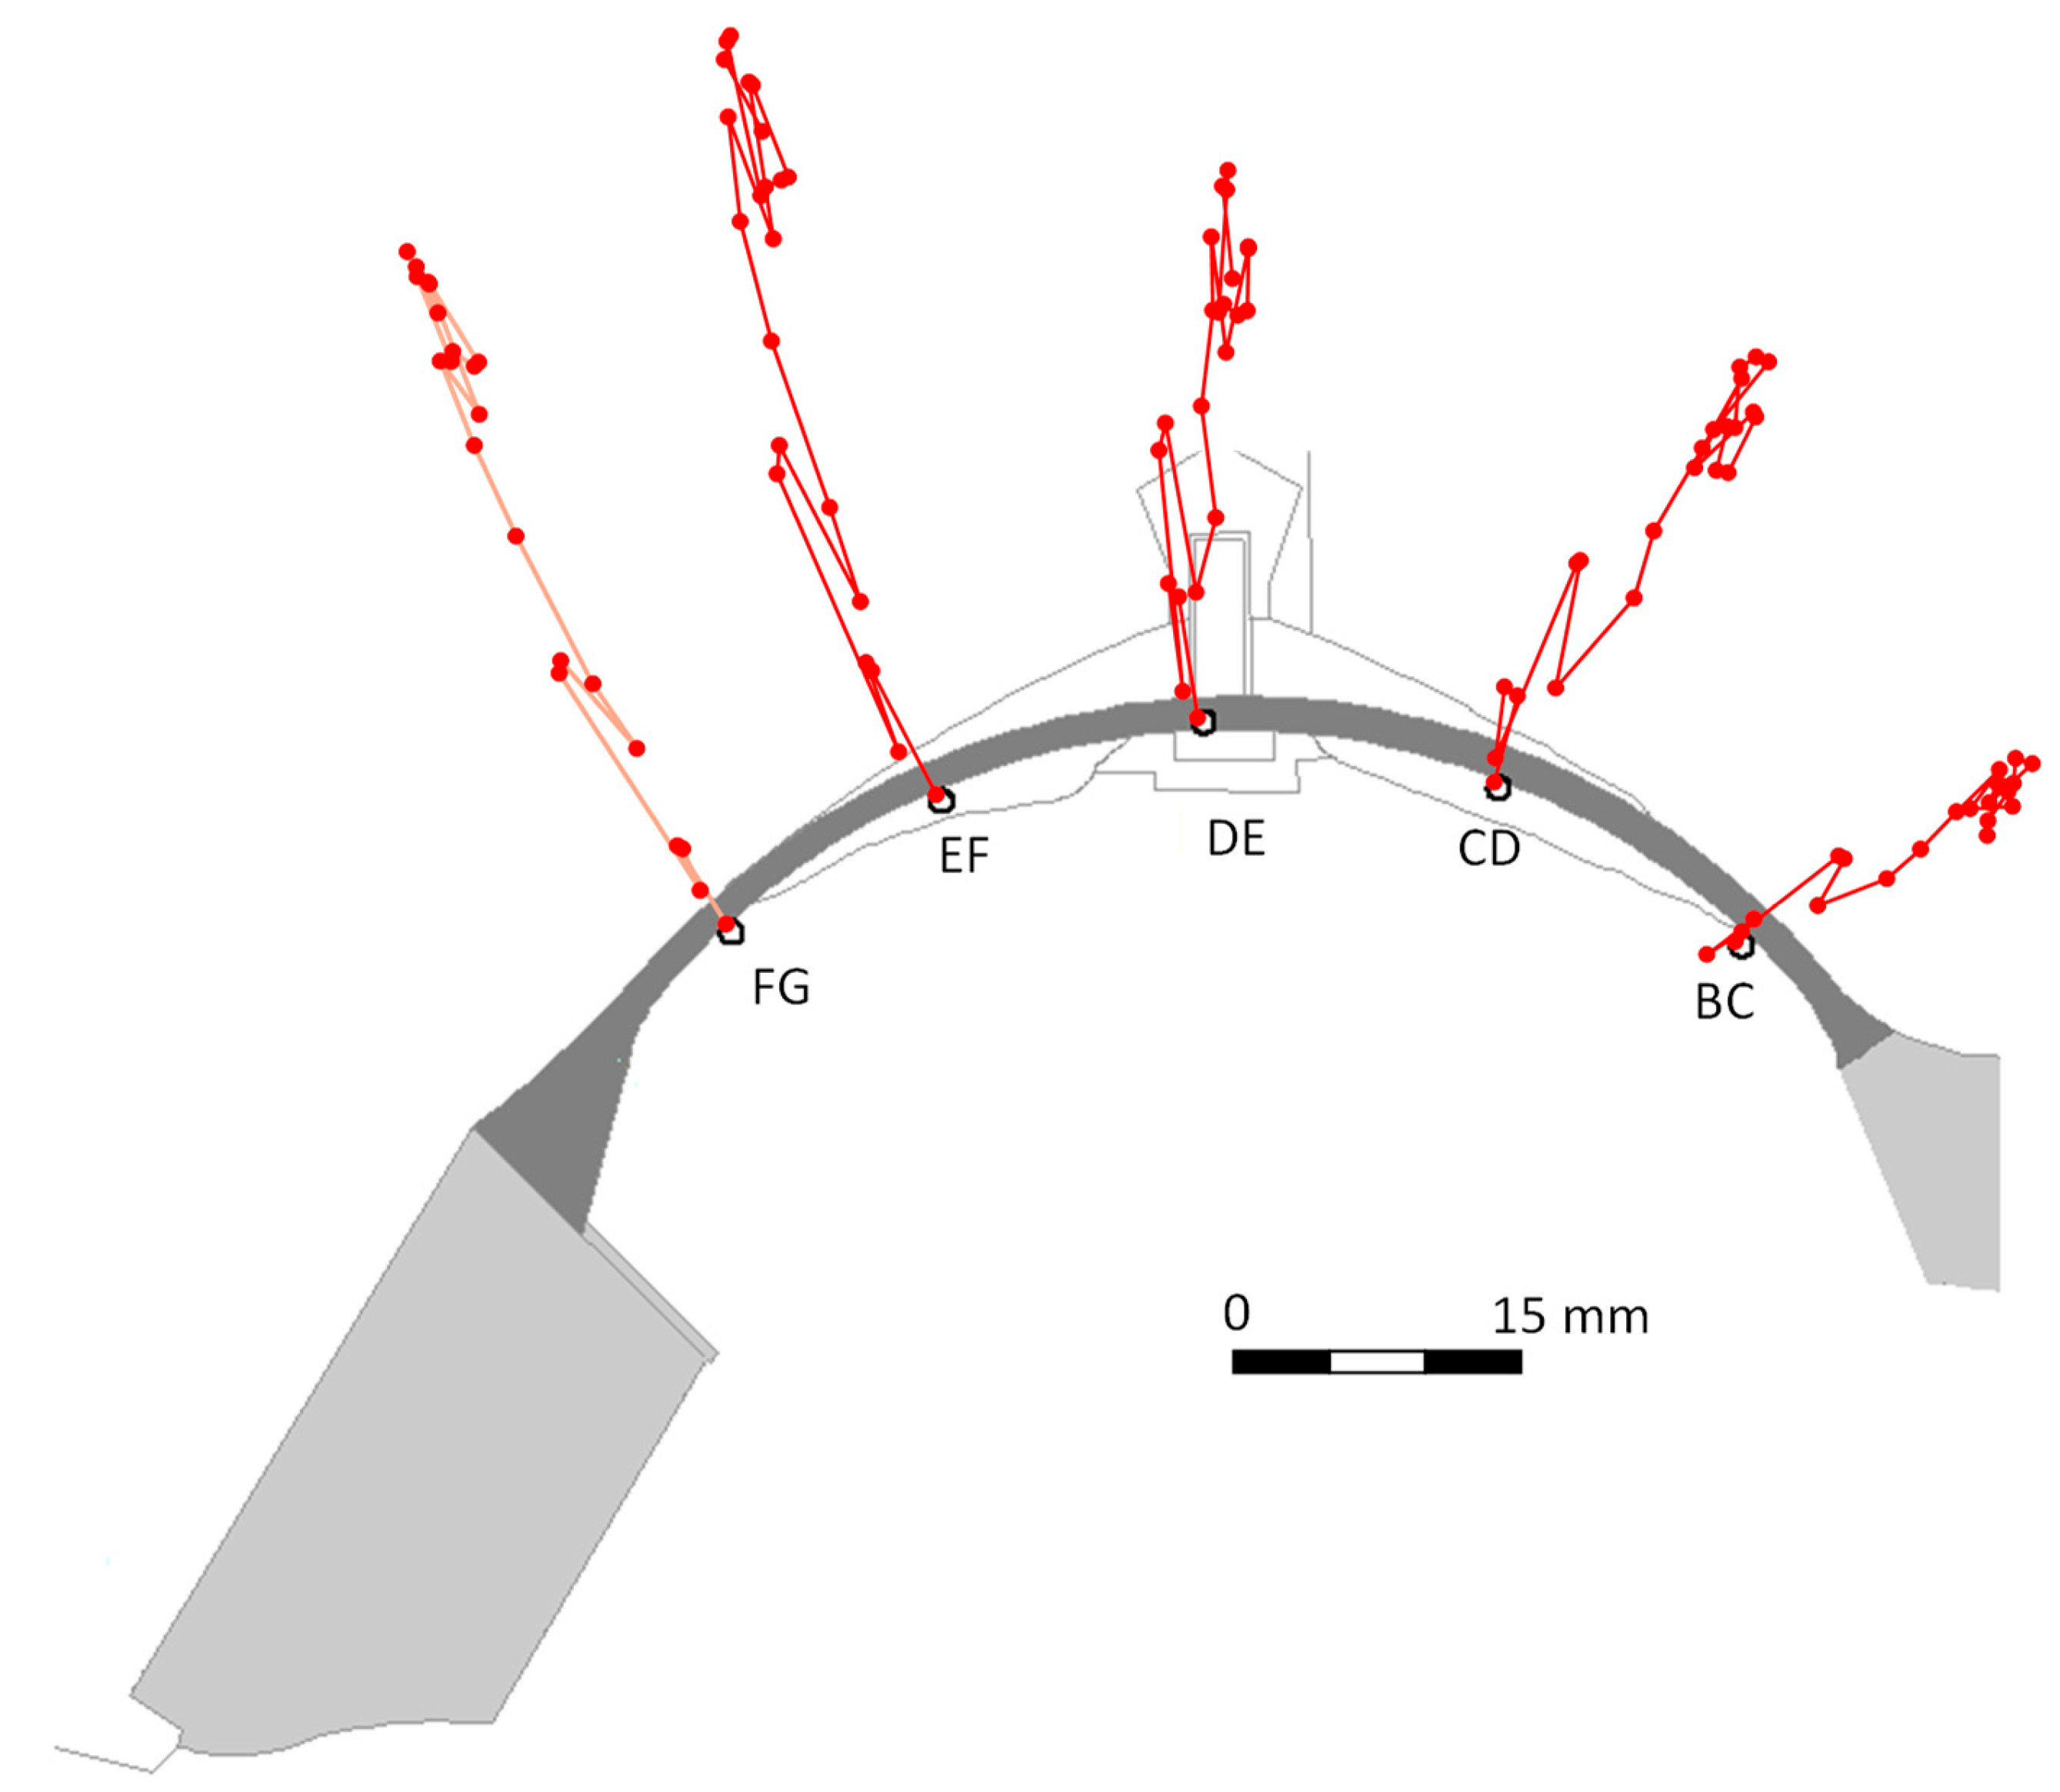
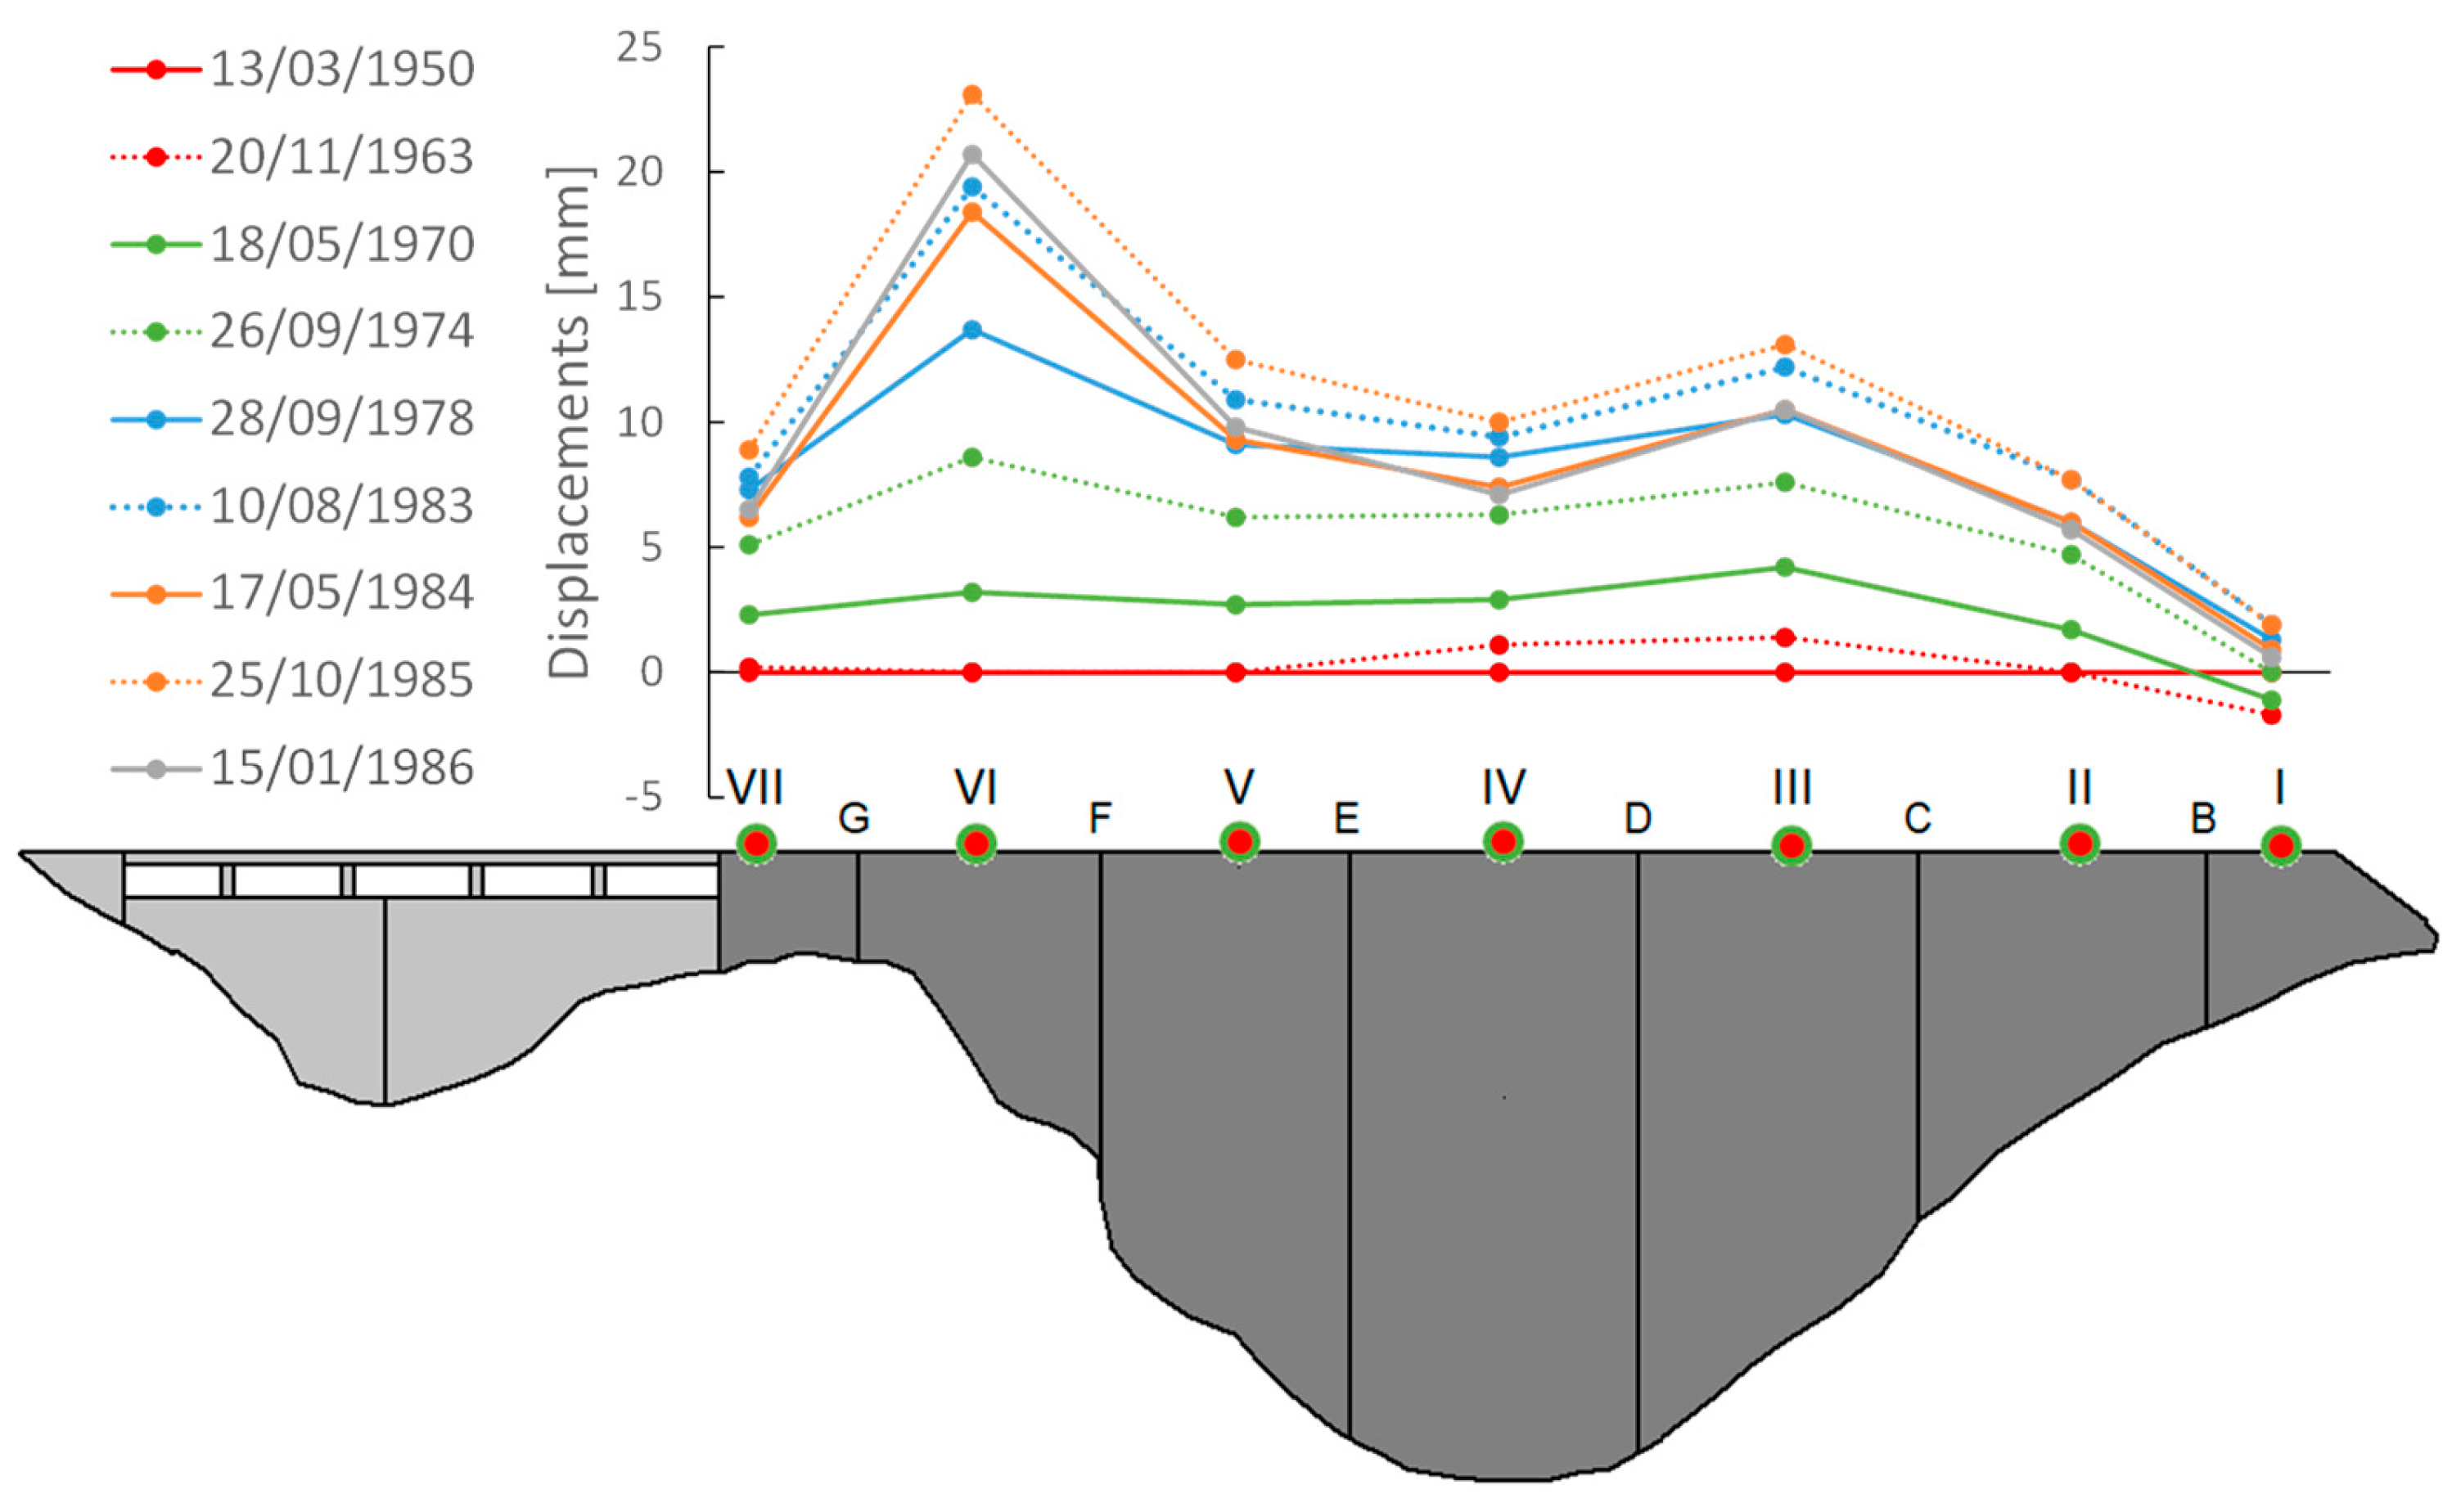
Since its early lifetime, the dam began experiencing increasing movements in the upstream and upward directions, accompanied by extensive cracking especially concentrated in the flanks and on the crest.
Figure 3 and
Figure 4 illustrate the evolution of the horizontal and vertical displacements measured between 1950 and 1986.
Figure 3.
Horizontal displacements of the object points at level 663.0 m between 1950 and 1986.
Figure 3.
Horizontal displacements of the object points at level 663.0 m between 1950 and 1986.
Figure 4.
Vertical displacements of the object points on the crest between 1950 and 1986.
Figure 4.
Vertical displacements of the object points on the crest between 1950 and 1986.
From 1950 to 1978, the geodetic measurements were carried out sporadically. The first two surveys, in 1950 and 1963, involved the emptying and subsequent filling of the reservoir, just for the sake of characterizing the behavior of the dam.
After that, other three surveys were made, in 1970, in 1974 and in 1978. The comparison between the displacements obtained in the surveys of 1974 and 1978, carried out at the same time of the year and with the same reservoir water level, confirmed the tendency of the dam to experience anomalous increasing movements in the upstream and upward directions. This evidence led to the reduction of the time intervals between surveys to, at least, once per year.
In 1986, another emptying and filling of the reservoir was carried out in order to determine the source of the anomalous behavior experienced by the dam [
11]. Numerous studies including visual inspections, mapping of cracks, core testing, and petrographic analysis of concrete samples were carried out in order to identify the source of such expansion.
Laboratory testing on concrete cores allowed to conclude that alkali-silica reactions were responsible for the observed expansion, essentially due to reactive silica of cataclastic quartz and cryptocrystalline quartz, occurring between lamellas of quartzite and metapellites, and alkalis, mainly potassium, from feldspars, namely microcline [
12].
For the computational modeling of the evolution of damage and assessment of the structural response, two different finite element analyses considering the induced expansion as imposed deformation were performed in 1995 [
11] and 2004 [
13]. For these studies, the dam was a priori divided in different zones of constant swelling and the imposed deformation of each zone was determined based on the horizontal and vertical observed displacement by a back-analysis procedure. In order to take into account the anisotropic expansion behavior, the imposed deformations were considered in separated horizontal and vertical components.
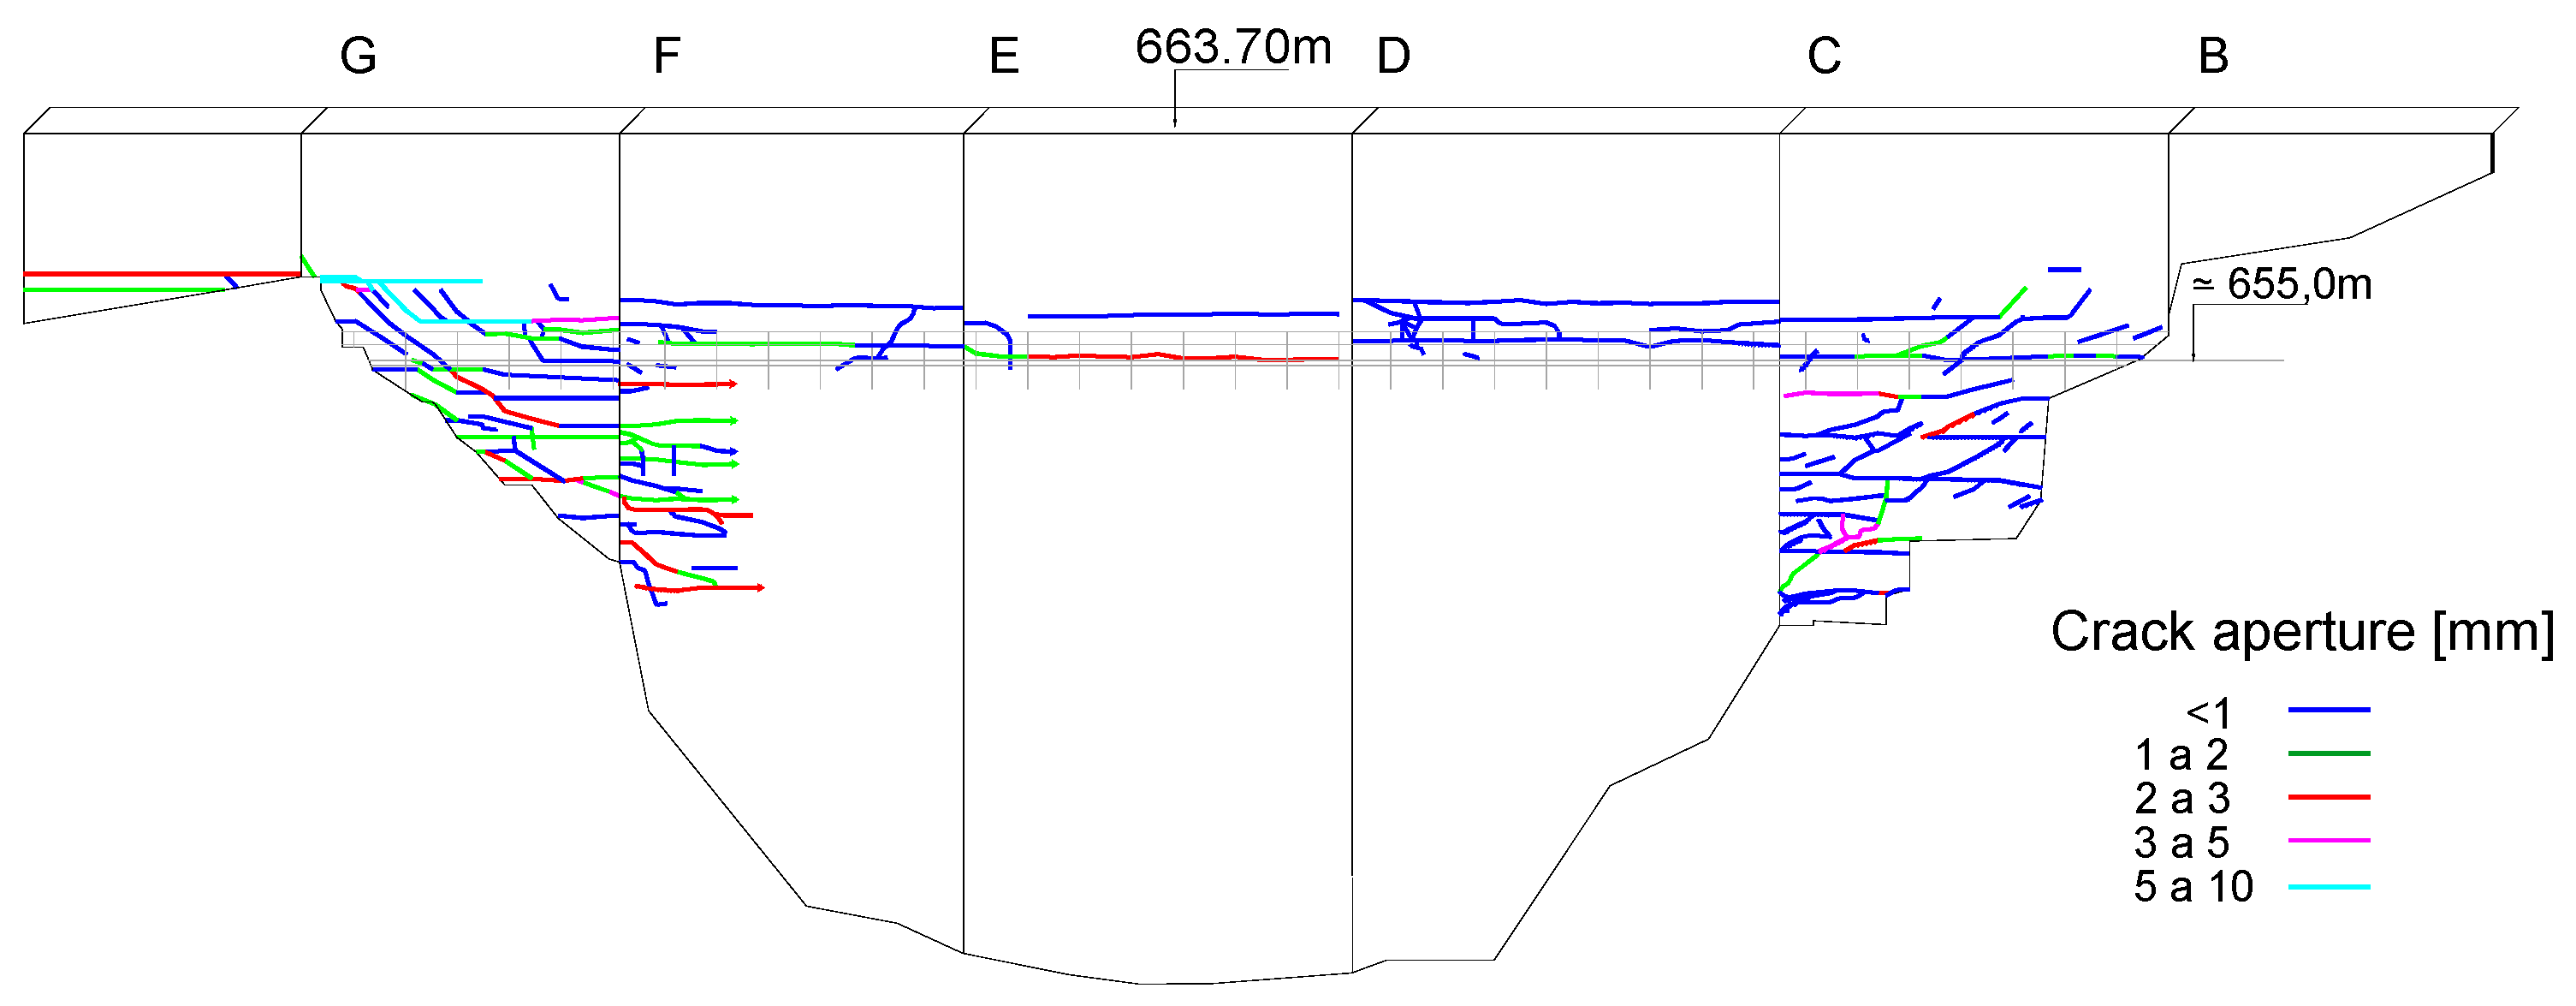
Crack mapping surveys were performed in 1986, 1994 and 2001. These surveys allowed to follow the progressive changes in cracking.
Error! Reference source not found. shows the crack mapping survey performed in 2001, indicating length, width and location of the visible cracks [
14].
Figure 5.
Crack mapping on the downstream face of the dam performed in 2001.
Figure 5.
Crack mapping on the downstream face of the dam performed in 2001.
By the year 2006, the considerable depth reached by the cracks and the relatively intensive leakage through the dam body had begun to represent a threat to the safety of the dam. Since its rehabilitation was considered very difficult and expensive, it was decided to replace the affected dam with a new one. The new dam is located approximately 200 m downstream of the original one that was partially demolished and submerged by the new reservoir in 2013.
3. Finite Element Model
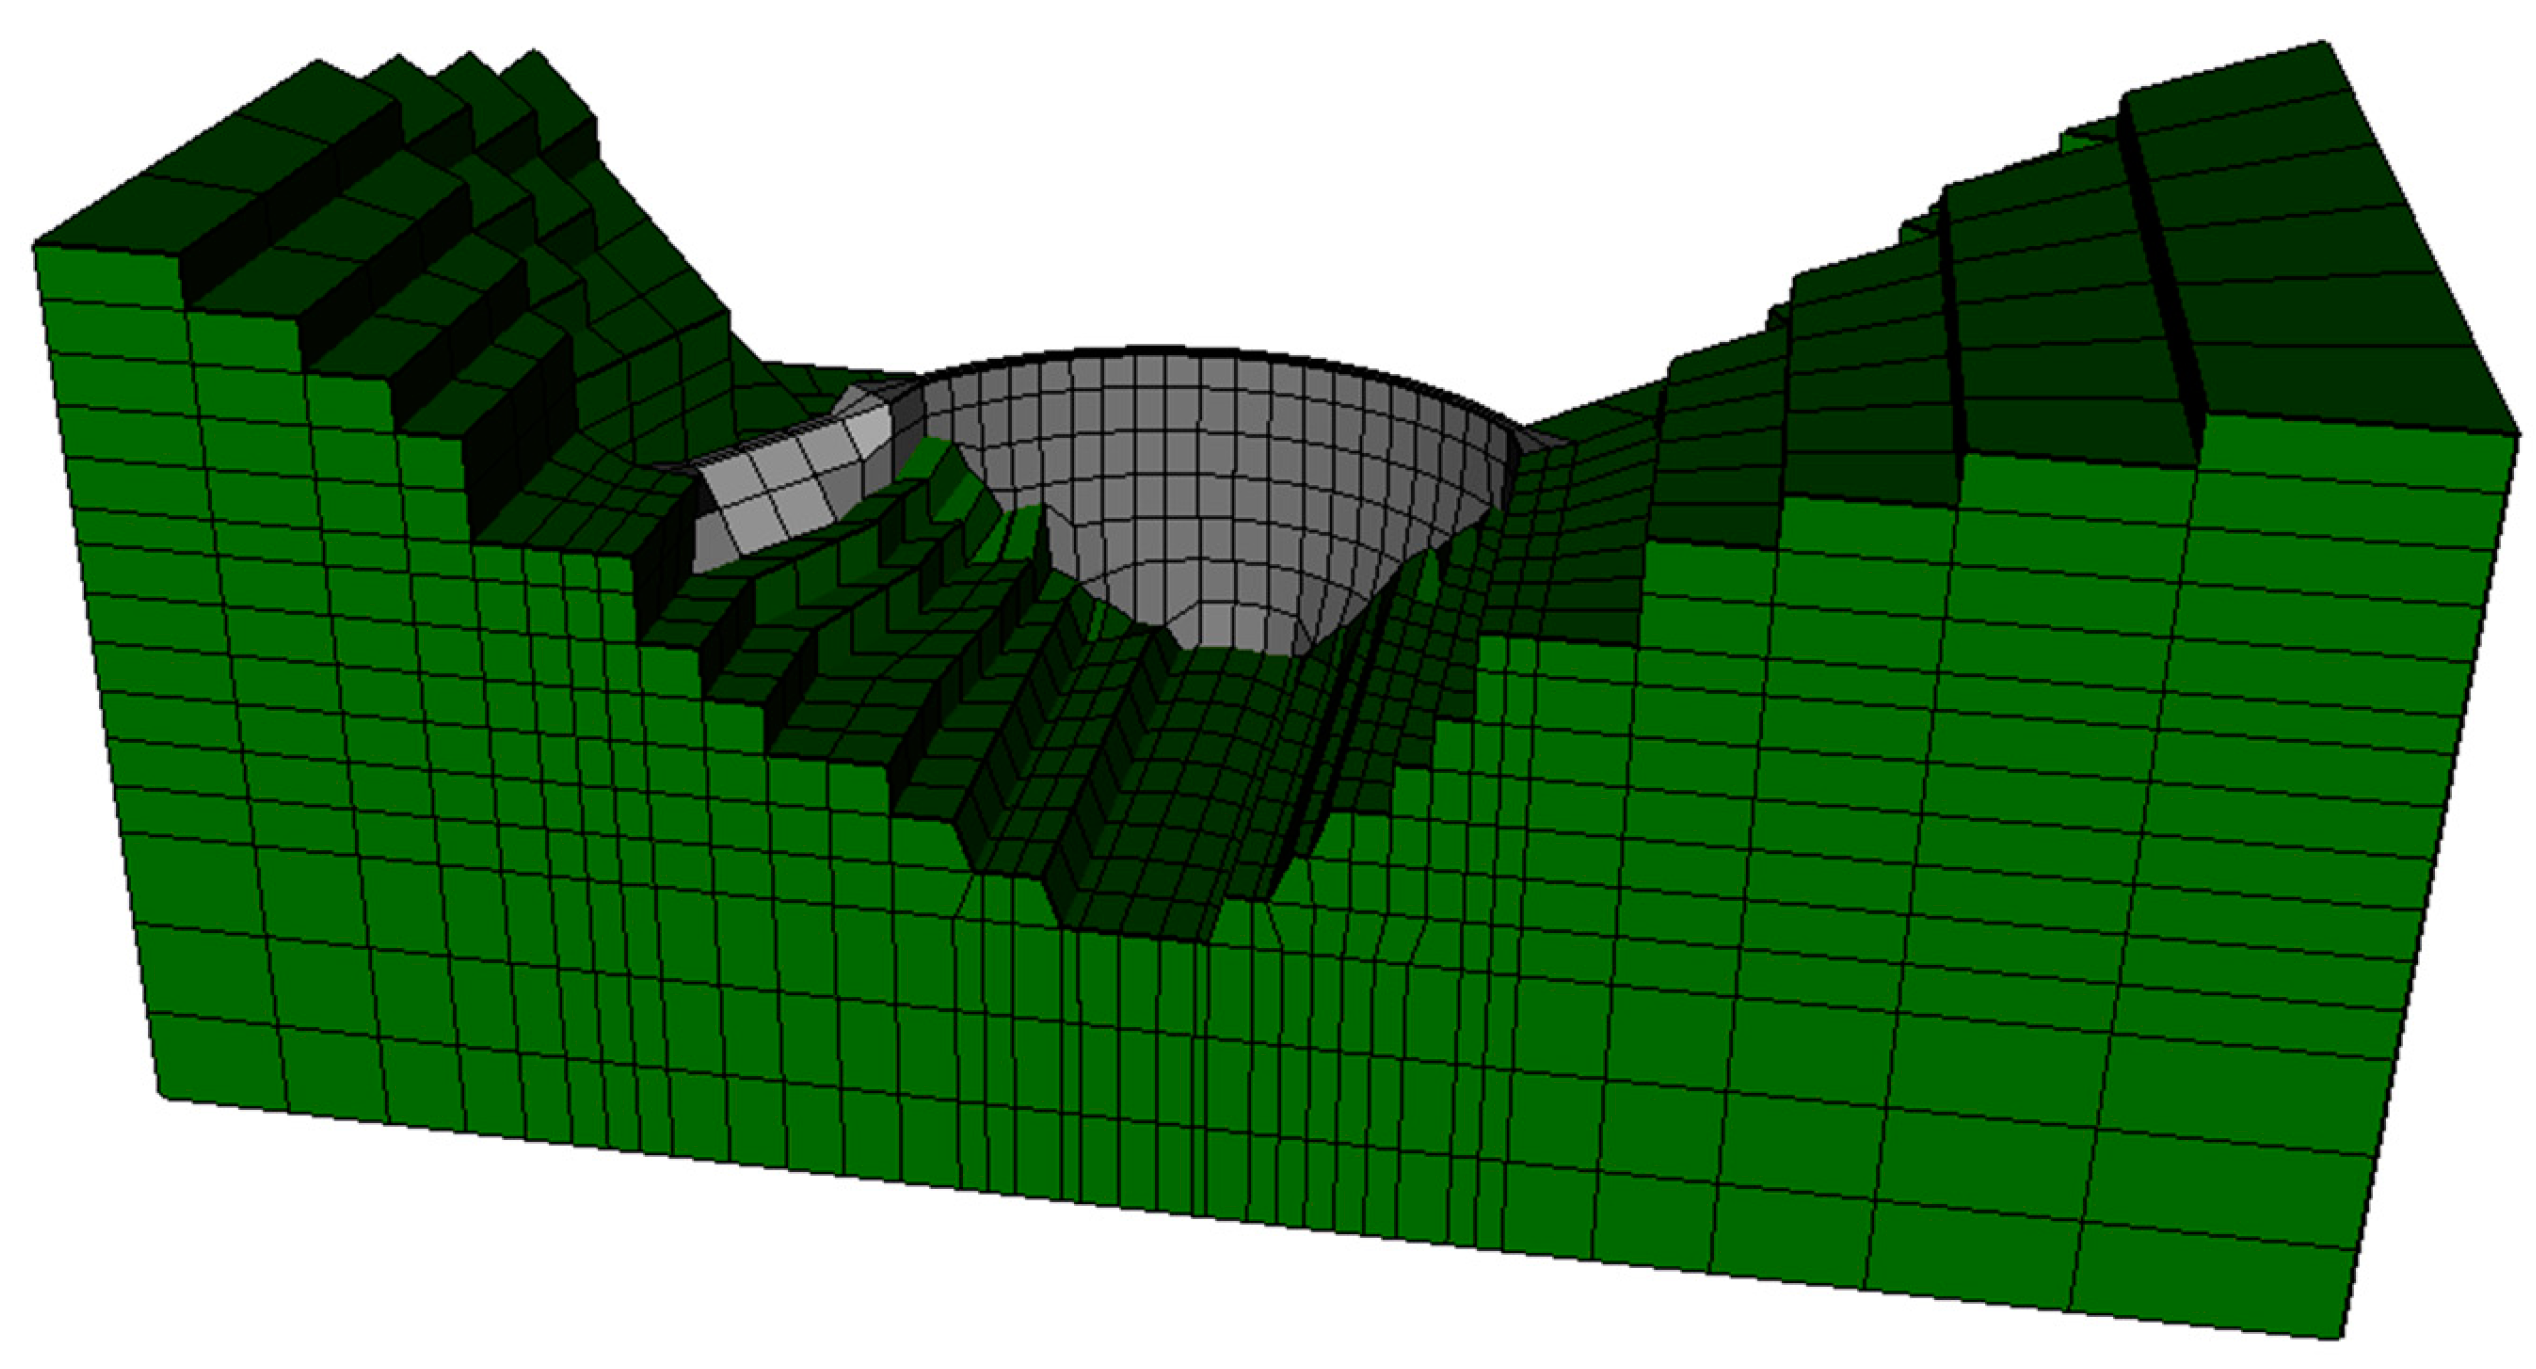
The finite element model represents the concrete arch dam, the masonry spillway and an appropriate volume of the foundation, Error! Reference source not found..
The dam model comprises two layers of 20 node solid elements through its thickness. For practical reasons, the same solid elements mesh was used for both the thermal and the mechanical analysis.
For the mechanical analysis, the arch was divided into seven blocks separated by radial vertical contraction joints. The contraction joints and the dam-foundation interface were represented by 16 node zero thickness interface elements. The model is comprised of 3166 solid elements and 124 interface elements.
Figure 6.
Finite element model of Alto Ceira dam.
Figure 6.
Finite element model of Alto Ceira dam.
4. Thermal Analysis
4.1. General Remarks
Seasonal variations of the environmental actions strongly affect the behavior of concrete arch dams. During summer, temperature rise leads the dam to move towards upstream. During winter, temperature decrease leads the dam to move towards downstream. These displacements usually are of the same size or higher than the displacements due to water level variation.
Moreover, if the dam is affected by AAR, temperature, like in all other chemical reactions, will influence the evolution of this reaction. In general, the rate of reaction and formation of gel will increase as the temperature rises.
Despite their great influence in the structural behavior, standards provide more comprehensive information about mechanical loadings than environmental actions. This results in a variety of different criteria for selecting the main phenomena involved in the thermal analysis. In this sense, Salazar
et al. [
15] remark that some phenomena have been considered in all relevant works published over the last decade, namely, the heat exchange by convection and the water temperature applied at the upstream face of the dam. Other phenomena, instead, such as dam-air exchange fluxes due to solar (short wave) and atmospheric (long wave) radiation, reflected solar and atmospheric radiation, evaporation or night cooling, have received less attention or have simply been neglected.
As it was mentioned before, solar radiation has a great influence on the rate of AAR expansion. Therefore, in this paper, special attention is given to the modelling of the solar radiations and the occlusion of the sun’s rays due to the geometry of the dam or the slopes.
4.2. Governing Equations
The heat flowing inside a dam, and the heat entering and leaving the dam, are governed by different mechanisms. The heat inside the dam moves by conduction and it is treated as the governing equation expressed by the heat conduction equation. The heat entering or escaping the dam moves by convection, or radiation, or both, and it is usually considered as boundary conditions. These equations are given by:
with the following boundary conditions
and the following initial condition
where
is the time;
is the temperature;
,
and
are the thermal conductivities;
is the internally generated heat per unit of volume and time;
is the material density;
is the specific heat;
is the temperature at the boundary
;
is the heat flux due to convection;
is the heat flux due to atmospheric (long wave) radiation and
is the solar (short wave) radiation at the boundary
;
,
and
are the direction cosines; and
is the temperature at time
. It is worth noting that the convention in expression (3) is positive when heat flux flows outwards from the body.
The heat exchange by convection between the surface of the structure and the air depends on wind speed and air temperature. The heat gain or loss from a surface due to convection is given by the Newton law
where
is the air temperature and
is the convection heat transfer coefficient, which is a function of the wind speed.
The temperature difference between the surface of the structure and the air gives origin to electromagnetic radiation, which is measured by the Stefan-Boltzmann law
where
is the emissivity of the surface and
is the Stefan-Boltzmann constant given as
W(m
2 K
4). When
and
are close, which is the case in civil engineering structures, it is possible to rewrite (6) in a quasi-linear form
where
is the radiation linear coefficient defined as follows
Combining the contribution of both heat transfer mechanisms, convection and radiation, it is possible to define a new coefficient called total thermal transmission coefficient, . This new coefficient, in essence, is a convection heat transfer coefficient that is updated to consider radiation.
The solar radiation boundary condition is given by
where
is the absorption coefficient and
is the solar irradiance.
4.3. Thermal Properties and Boundary Conditions
Due to the lack of information, the same thermal properties were adopted for the concrete and the rock mass. The conductivity was set to 2.62 W/(m K), the specific heat capacity to 920 J/(kg K), and the density to 2400 kg/m3.
Regarding the boundary conditions: convection and atmospheric and solar radiation actions were considered at the exposed surfaces of the dam; fixed reservoir water temperature was applied in all submerged boundaries. For the rock mass foundation: convection and atmospheric radiation boundary conditions were applied in all air-exposed boundaries; fixed reservoir water temperature boundary conditions were applied in all submerged boundaries; adiabatic boundary conditions were considered at the lateral boundaries; and a fixed temperature boundary condition of 13°C was imposed at the bottom.
4.4. Convection heat transfer
The daily air temperature was represented as the superposition of two harmonic functions, one of annual period and another with a one day period:
with
where the parameters involved in these functions were calculated based on the daily air temperatures registered at the dam site using the least squares method.
The convection coefficient was set to 20 W/(m2 K) while a constant value of 5 W/(m2 K) was adopted for the linearized radiation coefficient. Therefore, a constant value for the total thermal transmission coefficient =25 W/(m2 K) was applied to the whole model.
3.4. Reservoir Water Temperature
The water temperature of the reservoir was introduced as a prescribed temperature using the approximation given by Bofang [
16]:
with
where
is the depth of the water,
is the fractional day of the year and
,
and
are the annual mean temperature, the amplitude of annual variation and the phase difference of water temperature at depth
. The parameters involved in these equations were estimated based on the water temperature measured at the new Alto Ceira II dam. The analysis was run for a constant water level of 660.00 m.
4.5. Solar Radiation
4.5.1. The Path of the Sun across the Celestial Sphere
Solar radiation that reaches the boundaries of the Earth’s atmosphere is beam radiation, also known as direct radiation. This radiation travels directly from the sun to any point on the Earth along a straight line connecting the sun with the selected point on Earth. Upon passing through the Earth’s atmosphere, some radiation gets scattered. As a result, any point on the Earth’s surface is reached by both beam radiation and radiation scattered by the atmosphere. Beam radiation is strictly directional, while the scattered radiation reaches the Earth’s surface from all directions. Any tilted surface (in reference to a horizontal one) on Earth is reached by not only beam and scattered radiation, but radiation reflected by the Earth’s surface and various objects located nearby.
For a better understanding of the paths of the sun in the sky, one can imagine a celestial sphere with the Earth at its center and the sun revolving around it (geocentric system). Location of any surface in reference to the sun is determined with fundamental concepts of spherical geometry relating to the Earth’s movement in relation to the sun. The apparent motion of the sun is caused by the combined effects of the rotation of the Earth around its proper axis and the translation around the sun. Therefore, the angle at which the direct component of light will strike the Earth exhibits daily and yearly changes in east-west (E-W) and south-north (S-N) directions, respectively.
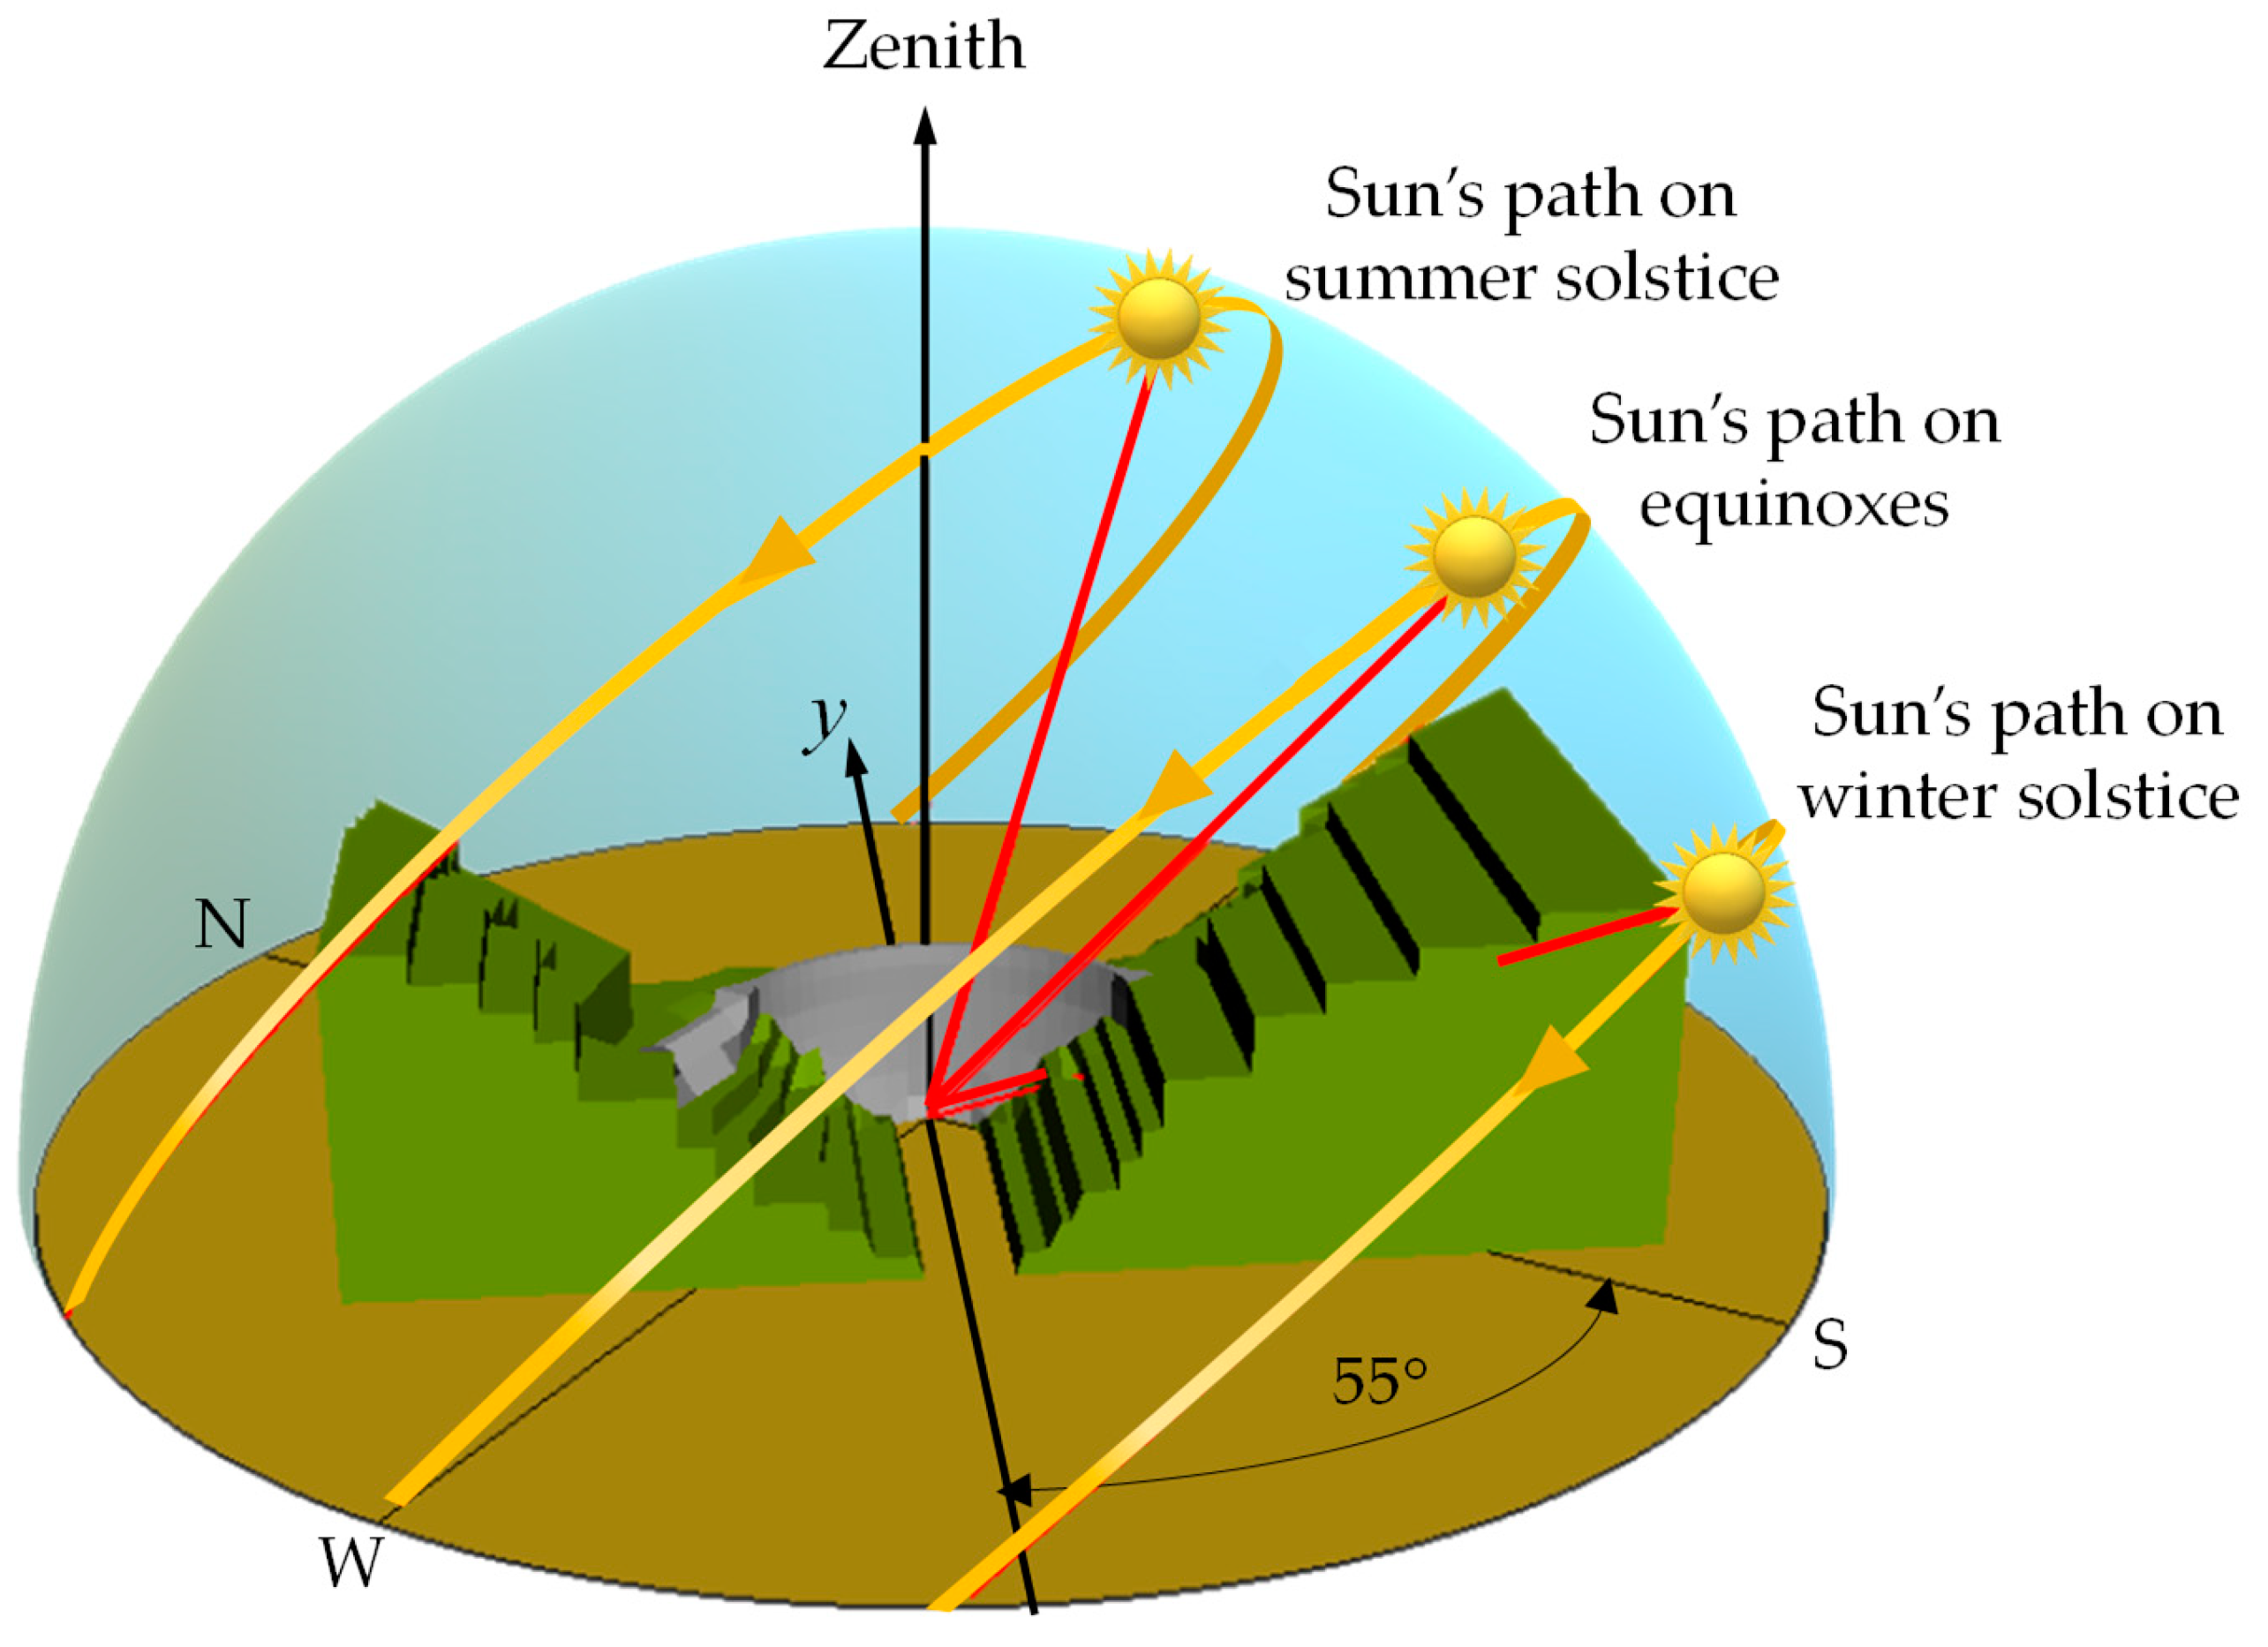
Error! Reference source not found. shows the apparent motion of the sun and its position at solar noon at the equinoxes and solstices, relative to the base of the Alto Ceira dam.
Figure 7.
The sun’s paths across the sky as seen from the dam.
Figure 7.
The sun’s paths across the sky as seen from the dam.
As can be seen in the figure the sun’s path reaches its extreme excursions at the winter and summer solstices, around December 22 and June 21, respectively, since Alto Ceira dam is located in the northern hemisphere. At the solstices, the altitude at solar noon is decreased or increased by the inclination of the earth’s axis (23°27’), respectively. At the equinoxes, around March 21 and September 23, the sun rises due east and sets due west, and at solar noon the altitude equals 90° minus the latitude.
4.5.2. Solar Position
Before describing the equations that govern the solar flux, it is important to note that the time used in these equations is the apparent solar time
AST, which directly tracks the diurnal motion of the sun. Meanwhile, the chronological time that clocks use, called local standard time
, corresponds to a certain time zone, in which noon does not necessarily correspond to the time when the sun is highest in the sky. Additionally, the Earth does not rotate perfectly, rather, it wobbles on its axis creating what is known as an analemma. Therefore, to convert between local standard time and apparent solar time involves the equation of time
and a longitude correction, which corresponds to four minutes of time per degree difference between the local longitude
and the longitude of the local standard meridian
for the time zone [
17]:
with
where
, where
is the day of the year considering a year with 365 days, and
is either 0 or 1 hour, depending on whether daylight saving time is applied.
The solar hour angle converts the solar time
into the number of degrees that the sun moves across the sky. By definition, the solar hour angle is 0° at solar noon. Since the Earth rotates 15° per hour, each hour away from solar noon corresponds to an angular motion of the sun in the sky of 15°. In the morning, the solar hour angle is negative, in the afternoon the solar hour angle is positive:
while the Earth orbits the sun, its axis is constantly tilted at 66°33’ to the orbit plane. Seasonal changes in the mutual location of the Earth and the sun are described by the parameter known as the sun’s declination
. The declination is defined as the angle between the line connecting the Earth and the sun, and the equatorial plane at the solar noon. It can be represented by Spencer’s formula, given by:
The sun position is described by two angles: the solar altitude above the horizontal
and the solar azimuth measured from the south
. Both angles are a function of the sun’s declination
, the earth’s latitude
and the solar hour angle
:
4.5.3. Angle of Incidence
Usually, the infrastructure boundaries are tilted against the horizontal surface. Tilt is described by the tilt angle against the horizontal plane, which varies in the range of .
The incident angle
of beam radiation on a tilted surface of any orientation is expressed in terms of the surface angle
, the Sun’s declination
, the Earth’s latitude
, the solar hour angle
and the azimuth
[
18]:
with
If the right-hand side of Eq. (22) is negative, the sun’s rays will not strike the front side of the surface and therefore it will be shaded.
3.5.4. Solar Radiation Components
According to the Liu-Jordan theory [
19], the solar radiation
that reaches a surface tilted at an angle
(in reference to a horizontal plane) is described by the equation:
where
and
are, respectively, the beam and the diffuse radiation intercepting on an horizontal surface,
is the surface (ground) reflectance and
,
and
are, respectively, the correction factors for beam, diffuse and reflected radiation
4.5.5. Solar Irradiance
The average solar irradiance in the site where the dam was located can be represented by the average solar radiation measured at Penhas Douradas station given by [
20,
21]:
where
is the solar constant (1367 W/m
2). In fact, the solar irradiance measured in the solar radiation station corresponds to the global horizontal irradiation, which is the sum of the beam and diffuse radiations. However, as no data is available to decompose the radiation, all measured irradiance was considered as beam radiation and the diffuse radiation was neglected.
The absorption coefficient was set to 0.65 for the dam and the spillway. No solar radiation was considered for the rock foundation in order to take into account the vegetation cover.
4.5.6. Shading of Beam Radiation
It can be observed from Error! Reference source not found. that self- and external obstructions can prevent the direct component of light from reaching the dam faces. Therefore, it is important to determine which part of the dam faces will be shaded at any particular time to correctly predict the solar radiation flux.
One of the most popular methods is the ray-tracing technique. The basic idea of this method is to start a ray at the object and send it to the sun. If this backward ray reaches the sun without hitting any object along its way, then the beam radiation strikes the object, otherwise, it will be in shadow. The problem of the intersection of a ray with an object is one of the classical problems in the field of Computer Graphics, where many algorithms for ray-tracing have been developed. For this work, the ray-triangle intersection algorithm presented in [
22] was adopted.
4.6. Preliminary Results
The transient thermal analysis was performed with the same version of the in-house code PAT used in [
23]. This code applies a fully-implicit Euler backward finite difference scheme for the time discretization and a finite element scheme for the spatial discretization. The analysis was conducted considering an incremental time of 1 h.
Before addressing the whole thermo-mechanical results in section 6, some previous interesting analysis will be presented.
On the one hand, in order to analyze the uneven distribution of the received solar irradiation along the downstream face of the dam, the concept of daily and annual solar irradiance is used. In this sense, the total amount of solar irradiance for one day or for the year is calculated by integrating (i.e. summing) the individual hourly solar irradiance values obtained within the corresponding period. Error! Reference source not found. illustrates the values obtained for the daily solar irradiation on the downstream face on the winter and summer solstices and on the equinoxes.
Figure 8.
Daily solar irradiance calculated at the solstices and equinoxes over the downstream face of the dam.
Figure 8.
Daily solar irradiance calculated at the solstices and equinoxes over the downstream face of the dam.
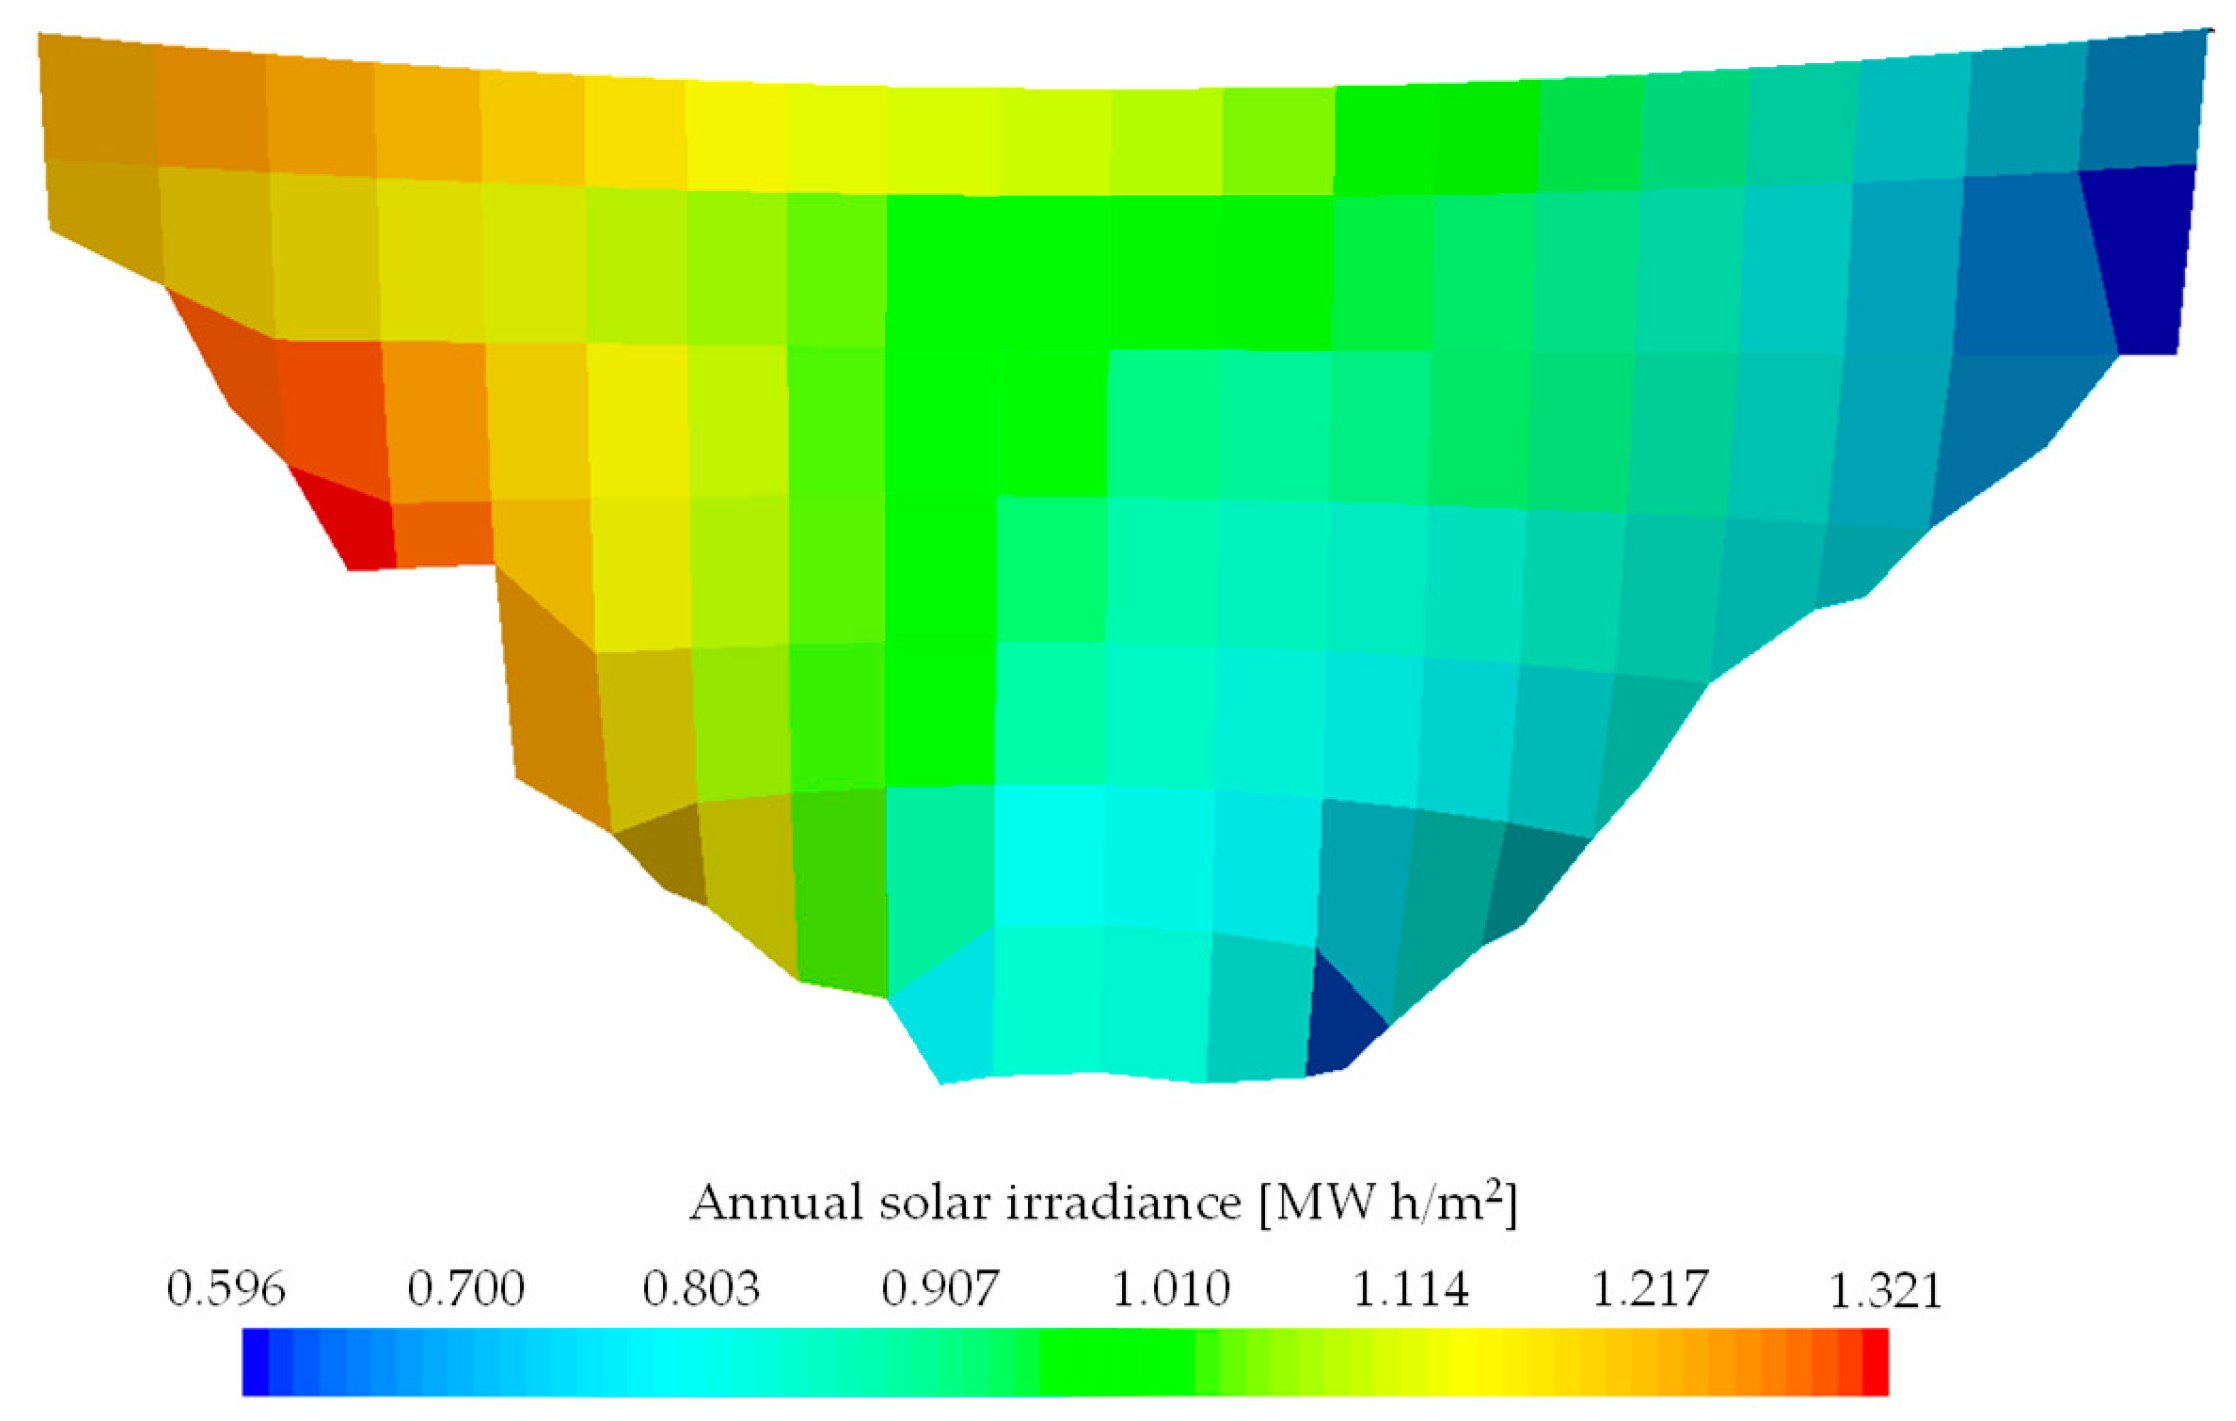
As can be seen, the right flank of the dam received much more sunshine than the left flank from autumn to spring. As a result of that, the total annual irradiance received by the right flank of the downstream face of the dam is more than twice as large than the amount received by the left flank, Error! Reference source not found..
Figure 9.
Annual solar irradiance over the downstream face of the dam.
Figure 9.
Annual solar irradiance over the downstream face of the dam.
On the other hand, due to the lack of thermal monitoring and in an attempt to validate the numerical results, a comparison between the image obtained by a thermal survey and the corresponding FEM values are shown in Error! Reference source not found..
The thermal survey was carried out by LNEC two weeks before the demolition of the dam, on 4
th of June of 2013 at approximately 3 pm. The object of the thermal survey was to evaluate the suitability of a thermal camera to detect resurgences of water on the downstream surface of dams [
24]. For the survey, the camera was mounted on a tripod placed on the left bank and 26 images were recorded. Later, these images were stitched creating the panoramic image represented in the figure. Although there is not an associated color scale, the blue color corresponds to cold areas, the red color corresponds to hot areas and the white color is reserved for the hotter areas.
The FEM results correspond to the temperature distribution obtained for 4th of June at 3 pm, day and time of the thermal survey. As can be inferred from Error! Reference source not found., near the summer solstice, the sun at 3 pm is further west than the one represented in the picture. In that position the sun strikes the downstream face of the dam in an almost symmetric way.
Figure 10.
Thermal panoramic image and FEM simulation on 4th June at 3 pm.
Figure 10.
Thermal panoramic image and FEM simulation on 4th June at 3 pm.
It is worth noting that the numerical simulation uses average values of the thermal actions. However, in spite of the variability of the air temperature, nebulosity and wind speed, it is still possible to recognize a close resemblance between the two images. Both of them show a hotter zone above the walkway located at level 655.0 m, with the maximum near the crest, and a cooler zone below the walkway with an increment of the temperature from the center of the dam to the abutments.
5. Structural Analysis
5.1. General Remarks
The structural problem was solved incrementally through time, considering a time step of 2 weeks. The analysis was carried out with the code PAVK developed by the author.
For the concrete, masonry and rock, an elastic behavior was adopted. The only non-linear behavior considered was the one introduced by the representation of the contraction joints and the dam-foundation interface. The elasticity modulus adopted were 30 GPa for the concrete and 20 GPa for the masonry and the rock mass, and all the Poisson coefficients were set to 0.2.
The analysis began with all the contraction joints open, i.e. without any interaction between two consecutive blocks. In this way, it was possible to simulate the installation of the dead load on the cantilever monoliths prior to the grouting of the contraction joints. In the next step, the displacements were reset to zero, simulating the grouting of the contraction joints, and the corresponding interface elements were activated. At this stage, the hydrostatic pressure on the upstream face of the dam was applied. After that, the hydrostatic pressure was maintained unchanged at level 660.0 m and thermal and AAR expansions were applied for the period from 13th of March of 1950, date of the first geodetic survey, to 31st of December of 1978.
5.2. Thermal load
Since no construction records are available, the reference (closure) temperature had to be adopted in order to calculate the temperature load. In this regard, the criterion adopted in [
25], which considers a uniform reference temperature equal either to the mean annual concrete temperature or to the mean annual air temperature, was considered unrealistic because concrete temperatures always present a spatial distribution [
15]. Instead, it was assumed as reference the temperatures obtained for the 27
th of April, which is the day when the annual harmonic function reaches the mean temperature.
5.3. AAR model
According to [
26] the incremental volumetric AAR expansion strain is given by:
where
is a parameter which reduces the expansion in the presence of large tensile stresses (macro-cracks absorbing the gel);
is a parameter which accounts for the absorption of the gel due to compressive induced stresses;
is a function of the relative humidity (set to zero if the humidity is below 80%);
is the rate form of the kinetics law; and
is the final volumetric expansion.
The swelling process evolution is taken into account by the kinetics law proposed by Larive [
27]:
or, in rate form:
where
and
are the latency and characteristic times, respectively, corresponding to the initiation and the development period of AAR from a practical point of view. Both time parameters depend on the temperature and the relative humidity. If only the temperature factor is taken into account, the dependence was proposed in the form:
where
is the temperature,
=38
°C is the reference temperature, and
and
are the Arrhenius activation energies (
and
).
The factor that accounts for the reduction of the rate of volumetric AAR expansion under compressive stresses is adopted following the work of Liaudat
et al. [
28]:
where
is the volumetric stress defined as
,
are the principal stresses and
is a parameter that stands for the volumetric stress under which AAR expansion would be totally suppressed taken as -9.7 MPa.
Since the present study is limited to exploring the influence of the non-uniform temperature distribution due to solar radiation and shading, a simplified version of Eq. (29) is used in which the factors and are set to one. Therefore, the reduction of the free volumetric AAR expansion due to large tensile stresses and humidity are not considered in this work. These specific effects will be further explored in future studies.
At each new time step
the increment of the swelling
is computed as:
where
, and
is computed using the stress state obtained at the beginning of the interval.
Once the volumetric AAR strain is determined, it is decomposed into a tensorial strain in accordance to the three weight factors associated with the principal stresses by means of the formula given in [
29] as follows:
where
is the AAR expansion rate in the principal axis
; and
is a weight factor for the principal axis
, which is a function of the principal stresses. This weight factor is calculated following the procedure proposed by Souma and Perotti [
29], except when
in which case it is adopted
, instead of
as indicated in [
29], to be consistent with the bilinear shape function interpolation.
Finally, a coordinate transformation is applied to the tensor from the principal axis to the global axis using the principal direction matrix.
5.4. Discontinuities Modelling
Concrete arch dams are constructed as a system of monolithic blocks separated by contraction joints. The monoliths are constructed separately so that cooling and shrinkage may take place independently in each one. After the construction period, the contraction joints are grouted under high pressure with the aim of forming a complete monolithic structure. However, contrary to the conventional view that grouting of contraction joints brings monolithic behaviour to dams, contraction joints continue working through the entire dam’s lifespan since grouted joints can take little or no tension [
30,
31].
Additionally, high tensile stresses can be expected to occur mainly at the upstream heel due to the water load exerted by the reservoir, leading to crack formation. These cracks are usually stable, as long as shear stresses do not exceed the shear strength of mass concrete and rock. However, if the crack at the base of a dam opens, the deformations of the dam will increase resulting in a redistribution of the stresses, thus increasing the arch stresses.
To capture the influence of such discontinuities, zero-thickness interface elements are placed along the contraction joints and the dam–foundation interface. In this approach, the contact constraint is enforced by the penalty method, where the normal stiffness and the tangential stiffnesses and play the role of penalty coefficients. This means that they have to be set as high as possible to guarantee that no penetration takes place while joints are closed, but not so high as to avoid ill-posed problems. In this way, the normal and tangential stiffness have no physical meaning and therefore no additional material parameter is required. Moreover, it is assumed no-tension and no-sliding conditions to characterize the normal and tangential behavior, respectively, which also avoid the need for extra material parameters.
6. Results
The thermo-mechanical analysis was run from 13th of March of 1950, date of the first geodetic survey, to 31st of December of 1978, when the level of cracking was incompatible with the assumption of linear behaviour of the concrete. For a generic year, the considered dates were: 15th of January, 29th of January, 12th of February, 26th of February, 12th of March, 26th of March, 9th of April, 23rd of April, 7th of May, 21st of May, 4th of June, 18th of June, 2nd of July, 16th of July, 30th of July, 13th of August, 27th of August, 10th of September, 24th of September, 8th of October, 22nd of October, 5th of November, 19th of November, 3rd of December, 12th of December and 31st of December. In general, all the intervals last two weeks with the exception of the interval between 31st of December and 15th of January, and, in leap years, the interval between 21st of February and 12th of March, for which it lasts 15 days. In all cases, the temperatures obtained at midday (12:00 local time) were considered.
In order to compute the volumetric AAR expansion it was adopted 4.5 years and 4 years for the latency and characteristic times, respectively, and 0.0045 for the final volumetric expansion.
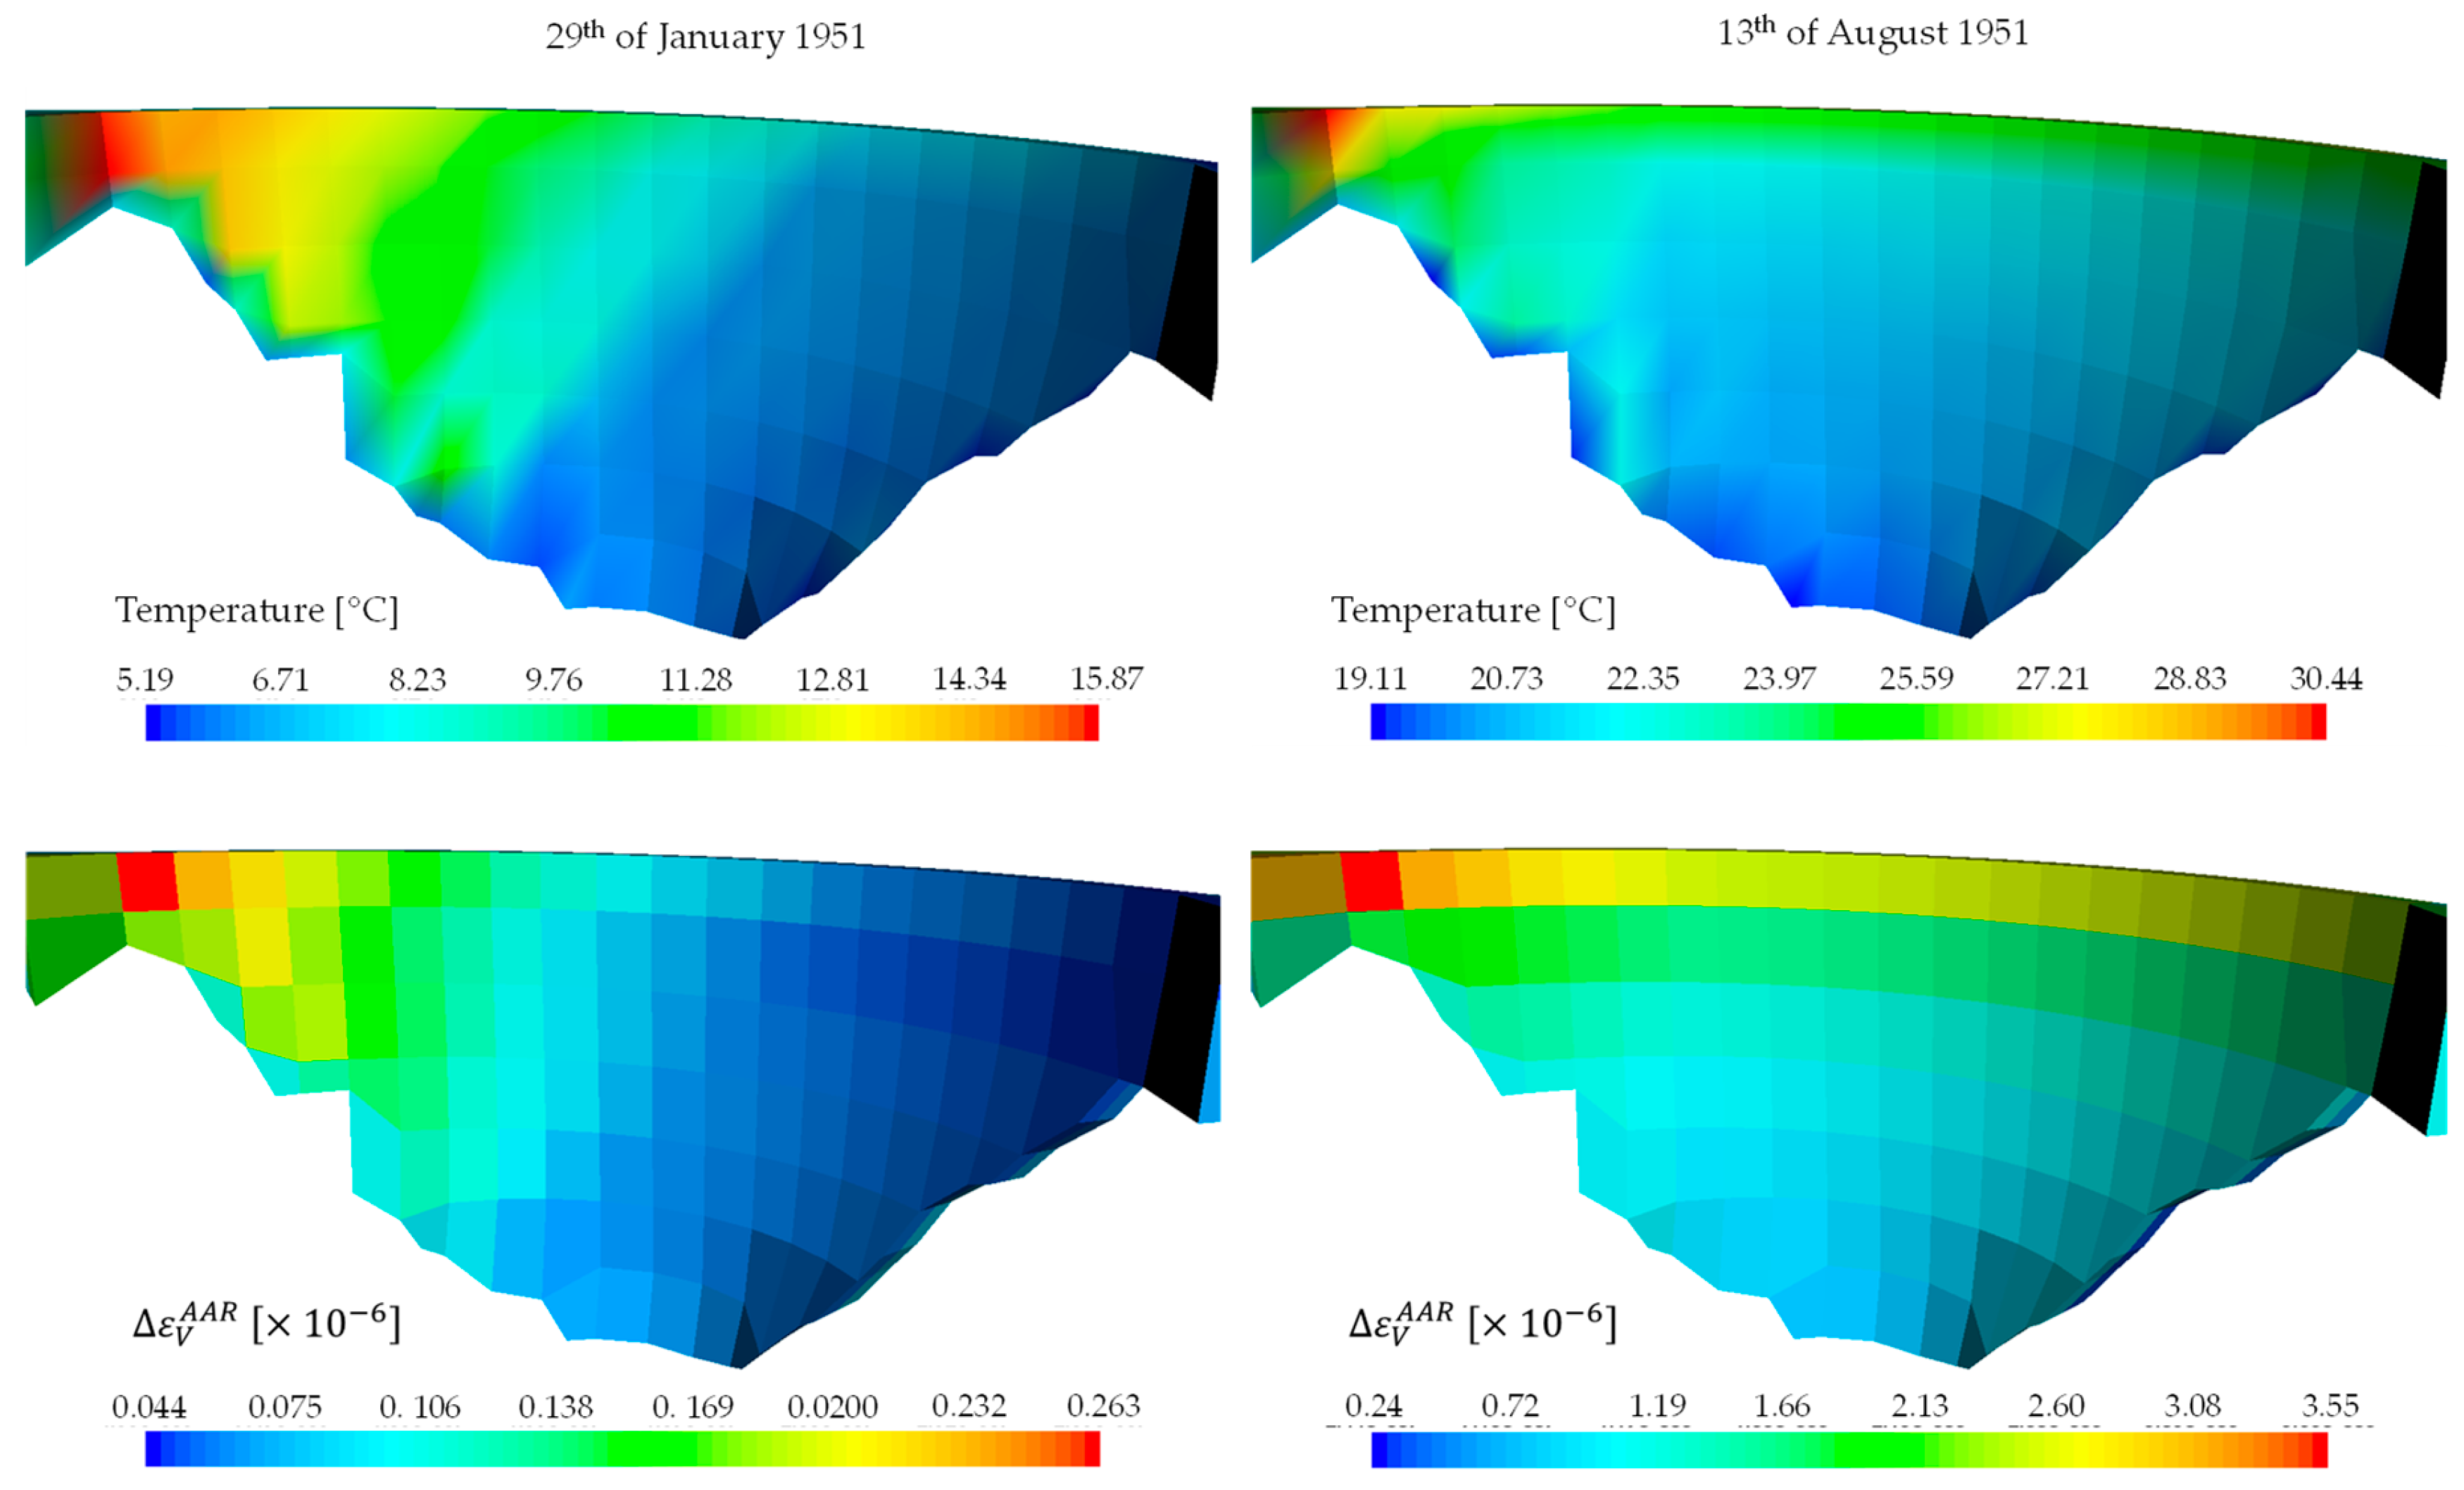
Error! Reference source not found. illustrates the values of the temperatures and the two weeks increment of the volumetric AAR expansion obtained on 29th of January and 13th of August of 1951.
Figure 11.
Temperature and volumetric AAR expansion increment calculated on 29th of January and 13th of August of 1951.
Figure 11.
Temperature and volumetric AAR expansion increment calculated on 29th of January and 13th of August of 1951.
As mentioned before, once the volumetric AAR strain was determined, it was decomposed into a tensorial strain in accordance to the three weight factors associated with the principal stresses, and after that, they were rotated from the principal axis to the global axis in order to compute the increment of displacement.
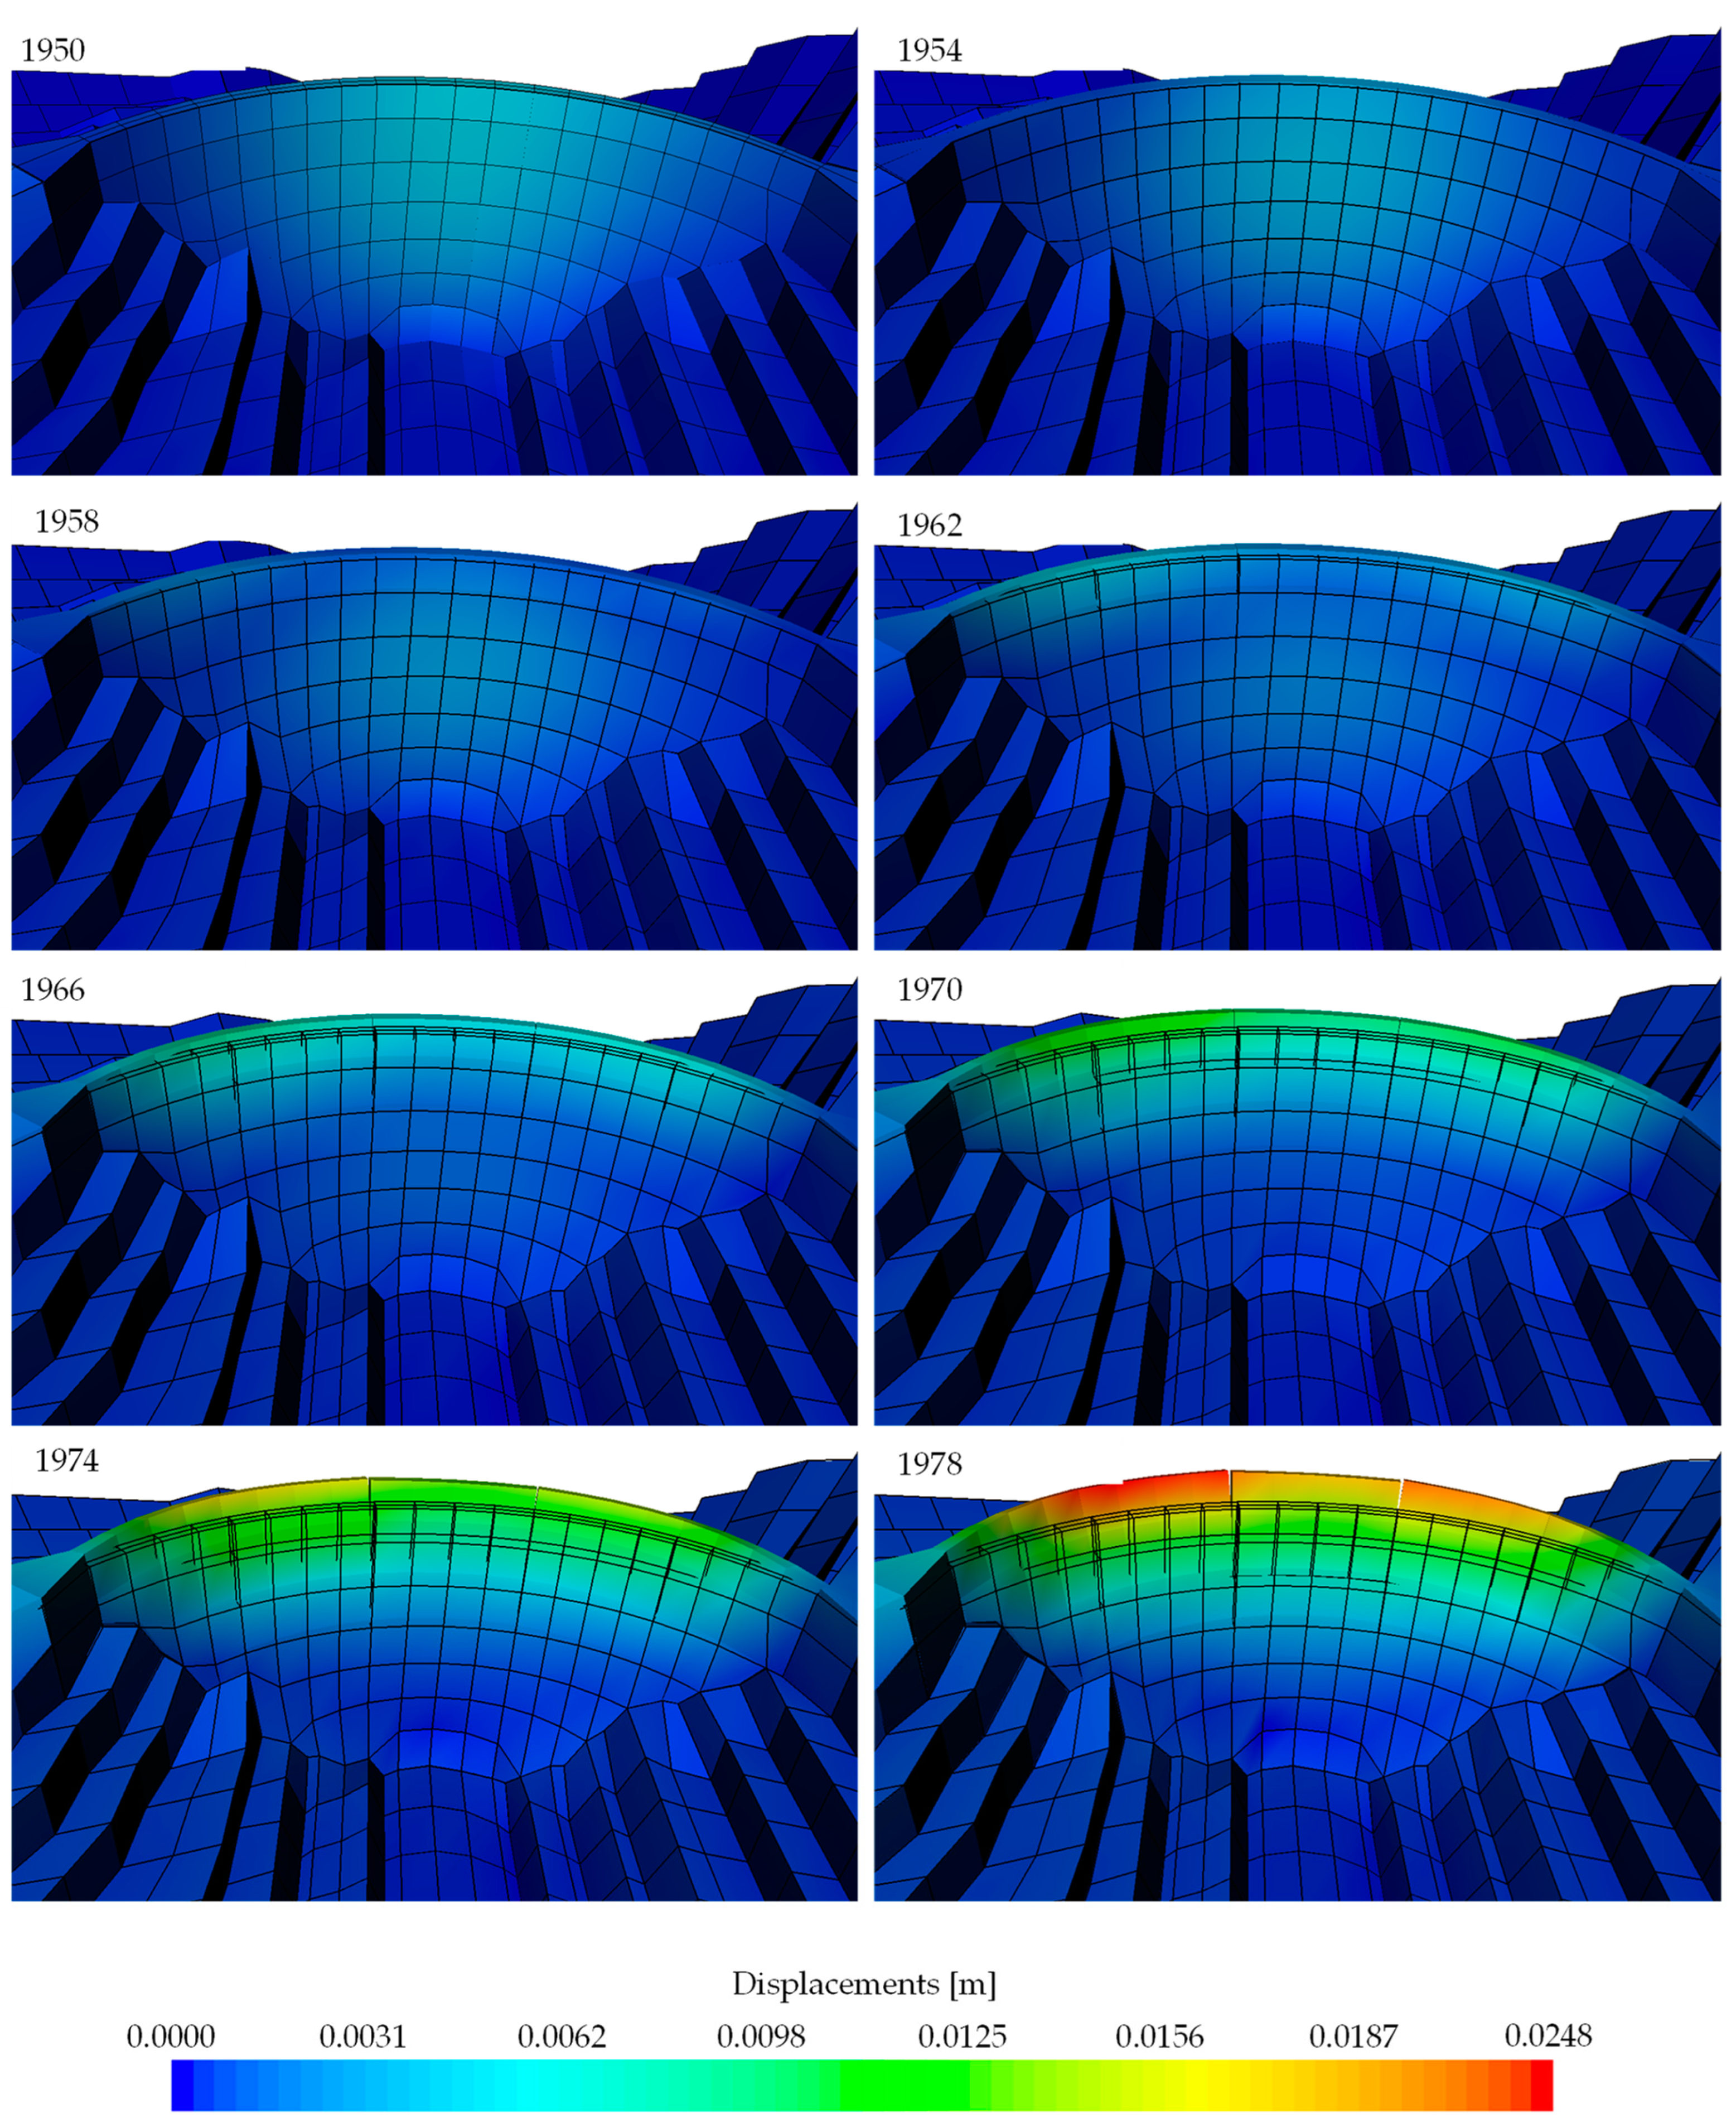
In Error! Reference source not found. the displacements computed on 13th of March, date of the first geodetic survey, and on 12th of March for every four years are presented. In this figure, the colour contour plot represents the total displacement and the deformed mesh is represented with a scale factor of 200. Additionally, in order to help the comparison, the deformed mesh computed in 1950 is superposed in each picture. It should be recalled that the zero position was defined for an empty reservoir and for the temperatures registered on 27th of April, adopted as reference temperature.
Figure 12.
Displacement contour plots calculated on 12th of March from 1950 to 1978.
Figure 12.
Displacement contour plots calculated on 12th of March from 1950 to 1978.
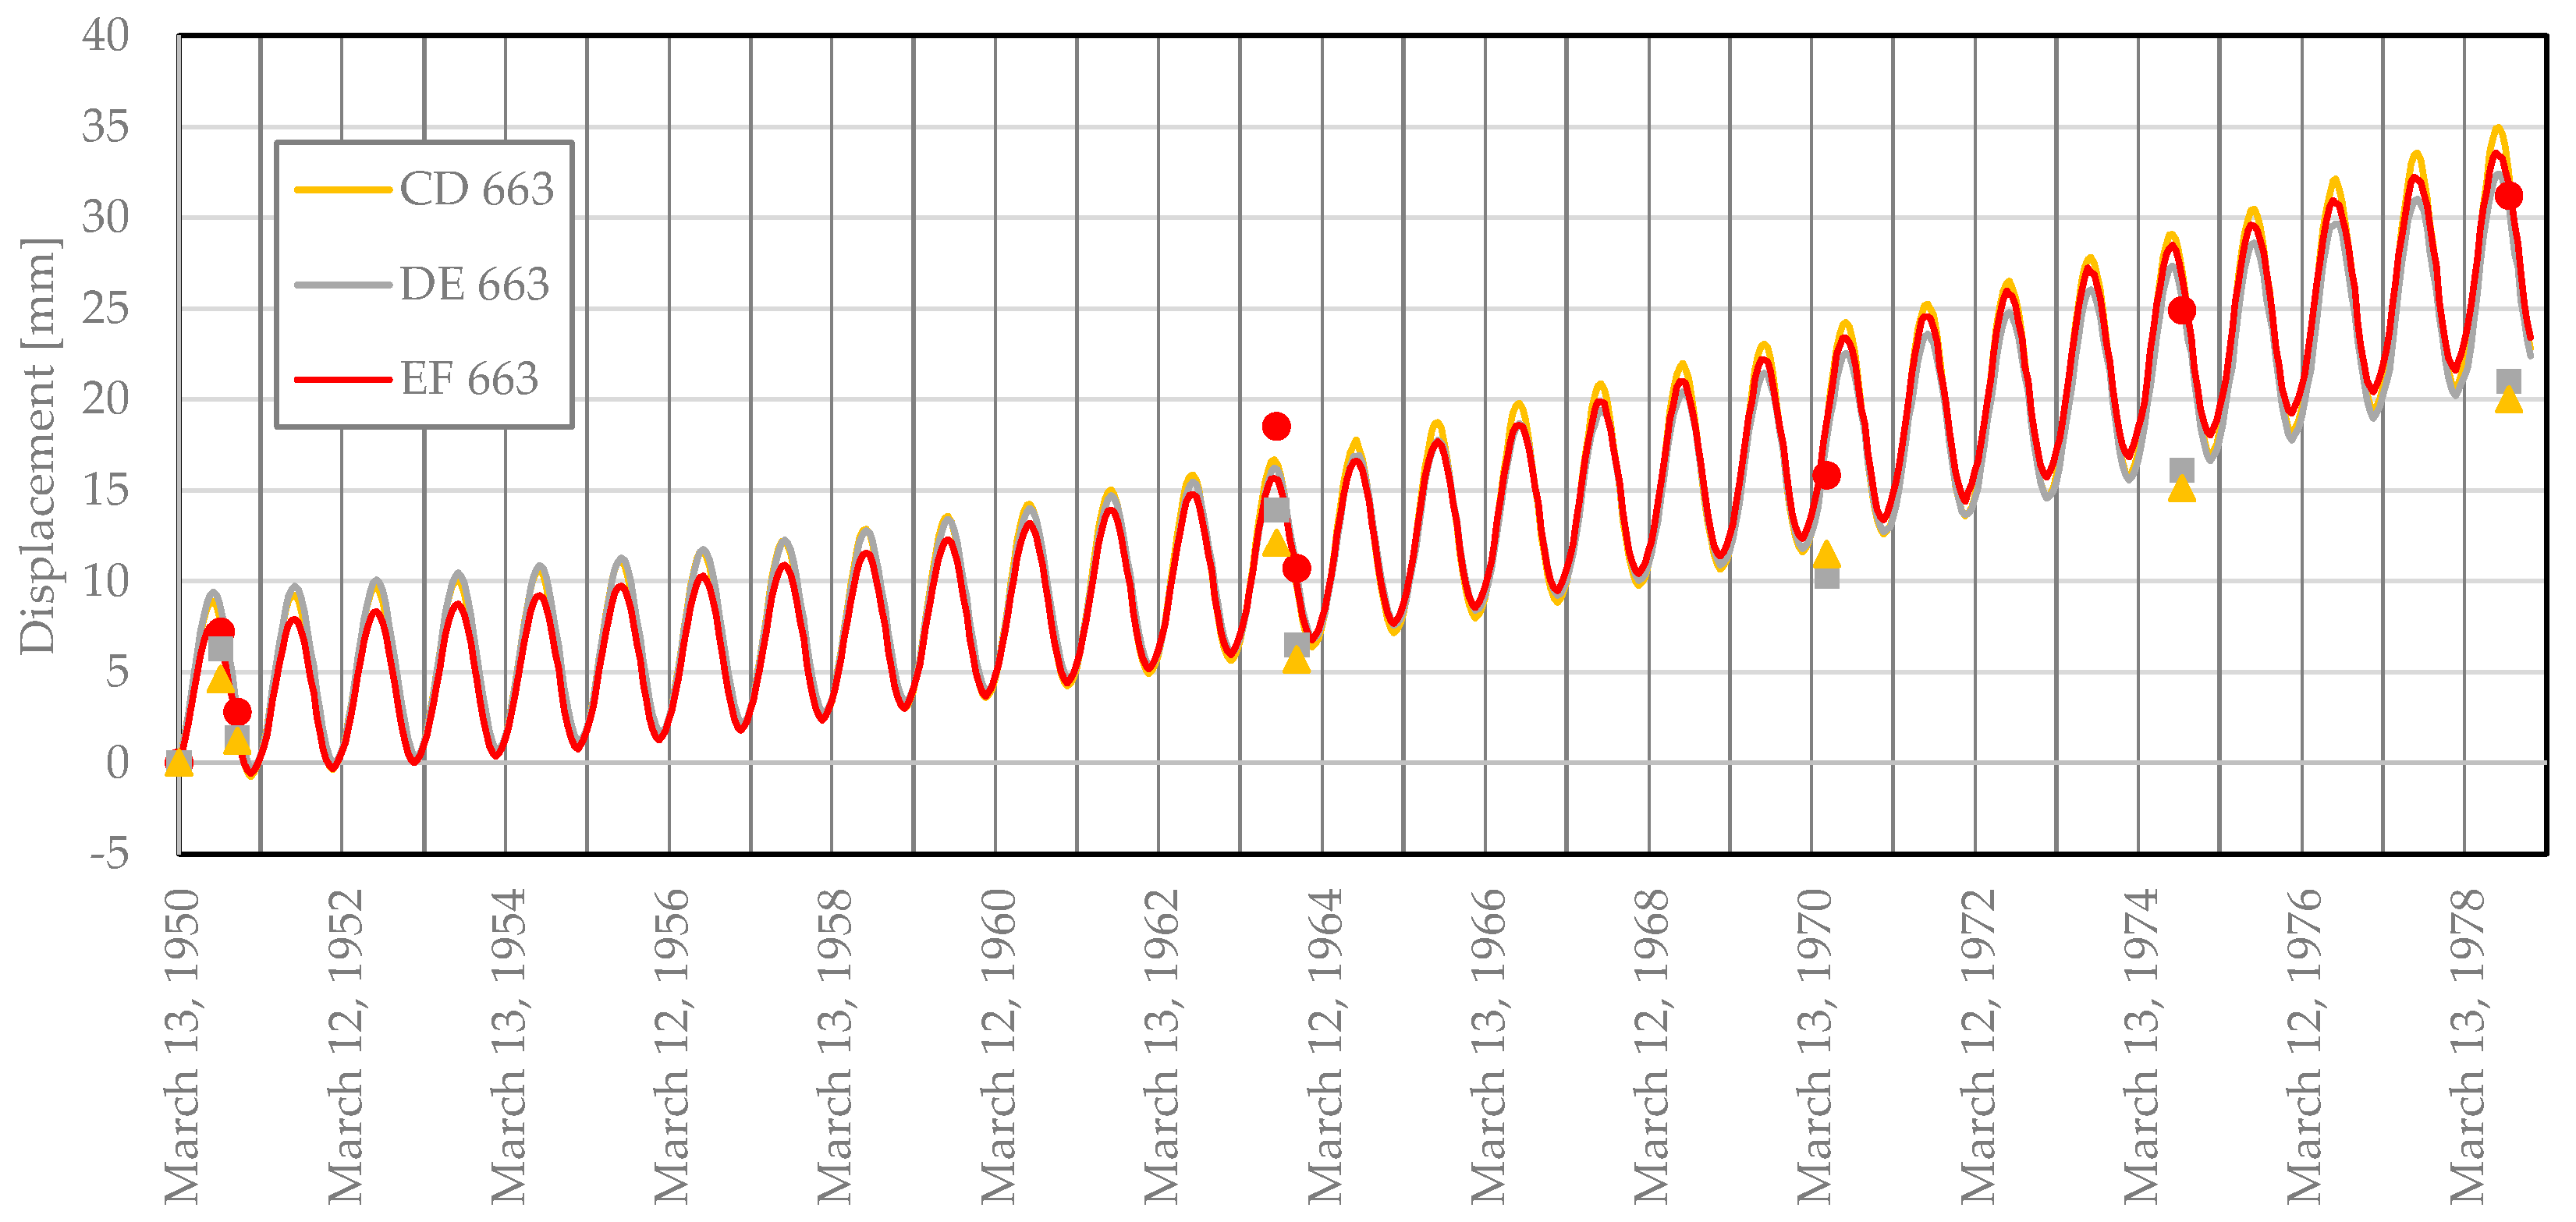
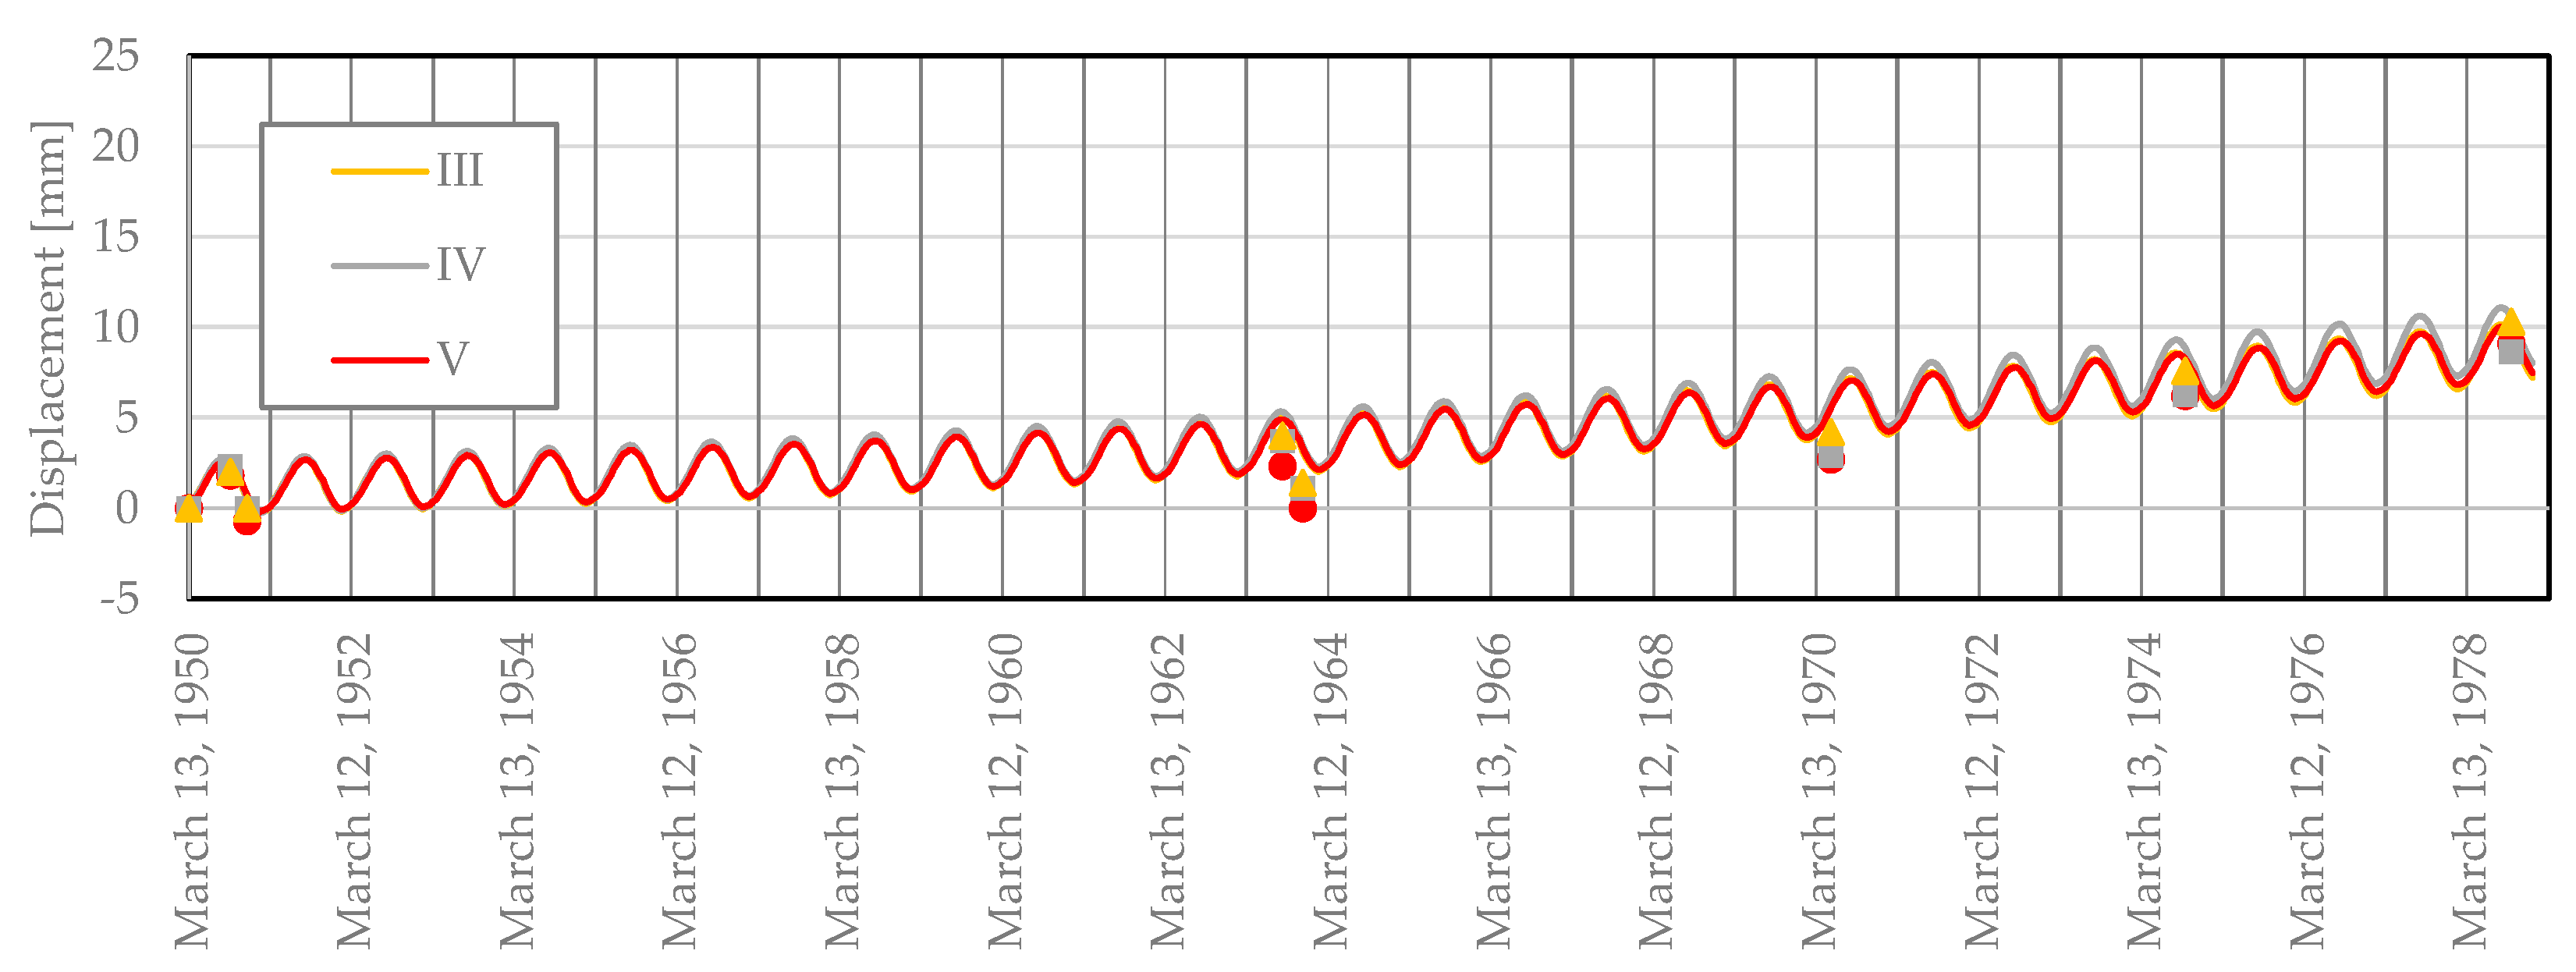
Finally, in
Figure 13 and
Figure 14, the radial and vertical displacement evolution obtained with the numerical model (solid line) and the measured values (discrete points) are compared. For these representations, the zero displacement corresponds to the one computed on 12
th of March of 1950.
Figure 13.
Radial displacements evolution from 1950 to 1978 for the object points CD 663, DE 663 and EF 663.
Figure 13.
Radial displacements evolution from 1950 to 1978 for the object points CD 663, DE 663 and EF 663.
Figure 14.
Vertical displacements evolution from 1950 to 1978 for the object points III, IV and V.
Figure 14.
Vertical displacements evolution from 1950 to 1978 for the object points III, IV and V.
7. Discussion
By analysing Error! Reference source not found., it is possible to observe the influence of the downstream temperatures on the volumetric AAR expansion. However, it is worth noting in this respect that temperature is a primary variable and, consequently, it is computed at each node, whereas the strain (in this case the AAR expansion) is a secondary variable, and it is computed at integration point level. Therefore, the values of AAR expansions not only depend on the temperature computed at the downstream face of the dam, but on the temperatures obtained at the total 20 nodes of each element.
It is also important to note that the volumetric AAR expansion represented in the figure corresponds to the average value of the expansion computed at each integration point of the element. Analysing these results, it should be noted that the difference between values computed in different elements at the same time of the year or from the same element but at different times of the year might differ by one order of magnitude.
Concerning the deformation of the dam induced by the AAR expansion, shown in Error! Reference source not found., it is worth pointing out that in the first picture, representing the displacements computed in 1950, the dam had moved towards downstream due to the effects of the water pressure and of the temperature decrease in relation with the reference temperature. The maximum displacement was computed at the centre of the dam and had a value of 0.00480 m. After that, since the water level was kept constant and the temperature varied in a cyclical manner, the difference in behaviour is only due to the AAR expansions, which induced displacements in the upstream and upward directions. In 1954, the maximum value had diminished to 0.00377 m. Eight years later, in 1958, the displacements near the crest at both sides of the dam began to show a greater increase than the displacements computed at the center of the dam, with greater values at the right side. By the year 1970, it is also possible to note that the central contraction joints had begun to open.
Regarding the evolution of the radial displacements, as seen in Error! Reference source not found., point EF at level 663 m presents a lower amplitude of the annual variation than points DE and EF at the same level. This is due to the higher amount of solar radiation received by the right side of the dam during winter, which raises the minimum temperature. It can also be observed that point EF presents the highest and the middle point presents the lowest rate of expansion. However, compared with the measured radial displacements, the model overestimates the rate for points DE and EF.
About the evolution of the vertical displacements, shown in Error! Reference source not found., the model in general follows the rate of growth observed in the geodetic survey of the vertical displacements. However, in 1963, some discrepancies that warrant further study can be observed.
Based on the above results, it can be concluded that:
Solar radiation contributes to the uneven development of AAR expansion, introducing up to one order of magnitude difference between the side exposed to the sun’s rays and the shady side.
Simplified solar radiation models should be avoided in order to obtain a representative distribution of the AAR expansion.
As AAR evolves, the displacements in upstream direction tend to open the contraction joints. Given that, the representation of the contraction joints is unavoidable in the mechanical analysis.
Finally, it is worth mentioning that it is an ongoing study. Therefore, some issues still warrant further investigation in order to obtain a better representation.
Funding
This research received no external funding.
Data Availability Statement
Conflicts of Interest
The author declares no conflicts of interest.
References
- ICOLD. Alkali-aggregate reaction in concrete dams – Review and recommendations. Bulletin 79. Commission Internationale des Grands Barrages, Paris, Prance, 1991.
- Fournier, B.; Ideker, J.H.; Folliard, K.J.; Thomas, M.D.A.; Nkinamubanzi, P.; Chevrier, R. Effect of environmental conditions on expansion in concrete due to alkali–silica reaction (ASR). Mater. Charact., 2009, Vol. 60(7). [CrossRef]
- Amberg, F.; Droz, P.; Leroy, R.; Maier, J.; Otto, B.; Bremen, R. Concrete Swelling of Dams in Switzerland. Report of the Swiss Committee on Dam on the state of concrete swelling in Swiss Dams. Switzerland, 2017.
- Amberg, F. Performance of dams affected by expanding concrete. In Dams and Reservoirs under Changing Challenges, Schleiss, A; Boes, R., Eds.; Taylor & Francis Group, London, UK, 2011; pp. 115-122.
- Saouma, V.; Perotti, L.; Shimpo, T. Stress analysis of concrete structures subjected to alkali-aggregate reactions. ACI Struct. J., 2007, Volume 104(5), pp. 532-541. [CrossRef]
- Saouma, V.E.; Hariri-Ardebili, M.A. Aging, Shaking, and Cracking of Infrastructures, From Mechanics to Concrete Dams and Nuclear Structures. Springer Cham, Switzerland, 2021.
- Stucchi, R.; Catalano; E. Numerical modelling of the Pian Telessio dam affected by AAR. In Role of Dams and Reservoirs in a Successful Energy Transition, 1st ed., Boes, R.; Droz, P.; Leroy, R. Eds.; London, UK, 2023, pp. 964-971.
- Lombardi, G.; Amberg., F.; Darbre, G.R. Algorithm for the prediction of functional delays in the behaviour of concrete dams. Lombardi Engineering Limited, 2006.
- Lamea, M.; Mirzabozorg, H. Evaluating sensitivity of an AAR-affected concrete arch dam to the effects of structural joints ans solar radiation. Strength Mater., 2015, Volume 47, pp. 341–354. [CrossRef]
- Mora Ramos, J.; et al. Reliability of arch dams subject to concrete swelling: Three cases histories, In Proceedings of the 2nd International Conference on Alkali-Aggregate reaction in Hydraulic Plants and Dams, Chattanooga, USA, October 1995.
- Oliveira, S.B. et al. Assessment of the behaviour of the Alto Ceira Dam. Structural safety evaluation (in Portuguese). Internal LNEC report, Lisbon, Portugal, 1995.
- Reis, M.O.; Silva, H.S.; Silva, A.S. AAR in Portuguese structures, some case histories. In Proceedings of the 10th International Conference on Alkali-Aggregate Reaction in Concrete, Melbourne, Australia, August 1996.
- Schclar Leitão, N.; Tavares de Castro, A.. Evaluation of Alto Ceira Dam Structural Safety (in Portuguese). Internal LNEC report, Lisbon, Portugal, 2004.
- Braga Farinha, M.L. Alto Ceira Dam. Assessment of the cracking using ultrasound test (in Portuguese). Internal LNEC report, Lisbon, Portugal, 2004.
- Salazar, F.; Vicente, D.J.; Irazábal, J.; de-Pouplana, I.; San Mauro, J. A review on thermo-mechanical modelling of arch dams during construction and operation: effect of the reference temperature on stress field. Arch. Comput. Methods Eng., 2020, Vol. 27, pp. 1681-1707. [CrossRef]
- Bofang, Z. Thermal Stresses and Temperature Control of Mass Concrete. 1st Edition. Butterworth-Heinemann, Oxford, Uk, 2014.
- ASHRAE, 2009 ASHRAE Handbook: Fundamentals, SI ed.; American Society of Heating, Refrigerating and Air-Conditioning Engineers, Inc., Atlanta, USA, 2009.
- Chwieduk. D. Solar Energy in Buildings: Thermal Balance for Efficient Heating and Cooling. Academic Press, Oxford, UK, 2014.
- Liu, B.Y.H.; Jordan, R.C. The long-term average performance of flat-plate solar-energy collectors. Sol Energy, 1963, 7(2), pp. 53-74. [CrossRef]
- Silveira, A. Temperatures variations in dams (in Portuguese). LNEC, Lisbon, Portugal, 1961.
- Leitão, N.S.; Castilho, E.; Farinha, M.L.B. Towards a Better Understanding of Concrete Arch Dam Behavior during the First Filling of the Reservoir. CivilEng 2023, 4, 151-173. [CrossRef]
- Scratchapixel 3.0, Ray-Tracing: Rendering a Triangle; Available online: https://www.scratchapixel.com/index.html (accessed on 6 July 2023).
- Leitão, N.S.; Oliveira, S. Insights about Modelling Environmental Spatiotemporal Actions in Thermal Analysis of Concrete Dams: A Case Study. Thermo 2023, 3, 605-624. [CrossRef]
- Henriques, M.J.; Ramos, P. Thermal Imaging of Concrete Dam Surfaces to Support the Control of the Evolution of Pathologies. In Proceedings of the Second International Dam World Conference, Lisbon; Portugal, 21st to 24th of April of 2015.
- FERC. Chapter 11: Arch Dams. In Engineering Guidelines for the Evaluation of Hydropower Projects, Federal Energy Regulatory Commission, Washington, USA. 1999.
- Saouma, V. Numerical Modeling of AAR, 1st ed.; CRC Press/Balkema; Leiden, The Netherlands, 2014.
- Larive, C. Apports combinés de l'expérimentation et de la modélisation à la compréhension de l'alcali-réaction et de ses effets mécaniques. PhD Thesis, Ecole Nationale des Ponts et Chaussées, France, 1997.
- Liaudat, J.; Carol, I; Lopez, C.; Saouma, V. ASR expansions in concrete under triaxial confinement. Cem. Concr. Compos., 2018, Volume 86, pp. 160-170. [CrossRef]
- Saouma, V.; Perotti, L. Constitutive Model for Alkali-Aggregate Reactions. ACI Mater. J. 2006, Volume 103(3), pp. 194-202. [CrossRef]
- Boggs, H.L., Jansen, R.B., Tabox, G.S. Arch Dam Design and Analysis. In Advanced Dam Engineering for Design, Construction, and Rehabilitation, Jansen, R.B. Ed. Springer, Boston, USA, 1988, pp. 493-539. [CrossRef]
- FERC. Chapter 11: Arch Dams. In Engineering Guidelines for the Evaluation of Hydropower Projects, Federal Energy Regulatory Commission, Washington, USA. 2018.
|
Disclaimer/Publisher’s Note: The statements, opinions and data contained in all publications are solely those of the individual author(s) and contributor(s) and not of MDPI and/or the editor(s). MDPI and/or the editor(s) disclaim responsibility for any injury to people or property resulting from any ideas, methods, instructions or products referred to in the content. |
© 2024 by the author. Licensee MDPI, Basel, Switzerland. This article is an open access article distributed under the terms and conditions of the Creative Commons Attribution (CC BY) license (http://creativecommons.org/licenses/by/4.0/).


