1. Introduction
In recent years, there has been a significant increase in the traffic of products and people due to economic growth and the development of commercial activities. These facts, coupled with the growing concern about environmental issues and climate change, have led the automotive and aviation sectors to set a new objective: the development of lighter means of transportation, thereby reducing environmental impact [
1,
2]. This inevitably results in a greater need to use different combinations of metals, which are difficult to successfully join using fusion-based processes [
3].
In the same vein, other sectors have been investigating innovative solutions to reduce environmental impact. The energy sector, for instance, has been studying the impact of heat pumps. Identified by the International Energy Agency (IEA) as the key technology for the energy transition, heat pumps are essential for increasing energy efficiency and reducing greenhouse gas emissions in homes and industries. Heat pumps have numerous copper components, among which are tubes. To perform their function adequately, it is crucial that these tubes are effectively welded. Therefore, it is necessary to explore welding techniques that ensure this efficiency. Ultrasonic welding, considered a green technology ([
4]), is a promising option for sealing copper tubes.
Ultrasonic welding is a process of joining two components using pressure and high-frequency ultrasonic vibrations that convert electrical energy into heat [
2,
5]. These vibrations generate friction between the surfaces to be welded, resulting in a localized temperature increase. This heat leads to the fusion of the surfaces (in the case of polymeric materials), forming a weld as the heat is removed, permanently joining the two surfaces. When applied to metals, it produces welds while maintaining the solid state, i.e., without melting the material. In this case, the material softens due to the temperature increase [
2,
5,
6,
7,
8,
9]. The temperature reached between the pieces is much lower than the melting point of the material (in the case of metals) [
10].
By allowing the joining of various materials from plastics to different metals, ultrasonic welding addresses the problem mentioned earlier. This technology is widely adopted by various sectors (electronic, medical, automotive, among others) due to its versatility, high speed, and being one of the welding technologies with the lowest energy consumption.
A common ultrasonic system has four essential components: generator, transducer, amplifier, and sonotrode. The ultrasonic generator is responsible for converting the input into electrical power [
11]. The core of ultrasonic welding lies in the generation of ultrasonic vibrations. These are generated by a piezoelectric transducer responsible for converting electrical energy into mechanical energy [
7]. Subsequently, the amplitude of the vibrations is amplified using a booster [
11]. These vibrations are transmitted to the parts to be welded through the horn. The horn can be manufactured from different materials, geometries, and patterns (one of the parameters influencing the quality of the weld) [
5,
6]. The material must have high fatigue, heat, and wear resistance, as well as good elastic properties and high toughness values. The same applies to the anvil, i.e., the support surface on which the materials to be welded are placed. Contrary to the horn, the anvil is designed to be an anti-resonant element. It also has a knurled surface to prevent the samples to be welded from slipping, keeping them static.
The quality of this type of welding is highly dependent on the careful selection of a set of parameters such as application time, applied pressure, vibration amplitude, and frequency [
2,
5]. Among these, the most relevant are the application time, as it affects the energy absorbed during welding, the pressure, and the amplitude [
2,
10].
Frequency is the rate of oscillation of the ultrasonic vibrations generated during the welding process. Its selection depends (as do the other parameters) on the material to be welded, the thickness of the components, and the type of joint. If incorrectly selected, this parameter can cause excessive melting and consequent deformation of the material. If the frequency is too high, insufficient heat may be generated for the material to melt, preventing the components from joining. Frequency is a characteristic of the equipment and depends on its power. Amplitude is also a relevant characteristic to consider. It refers to the magnitude of the oscillation and affects the amount of heat generated and, therefore, the quality of the joint. The pressure applied during welding is crucial for keeping both parts in contact and promoting adequate fusion, having a significant impact on the weld's strength along with the horn's amplitude [
5]. This must be meticulously controlled to avoid excessive deformations and ensure a uniform joint. It should be adjusted according to the geometry and properties of the material to be joined. Insufficient pressure can lead to slippage between the workpiece and the horn, resulting in tool wear [
7]. On the other hand, excessive pressure leads to plastic deformations, resulting in decreased mechanical strength [
5]. Finally, the application time (t) of the vibrations should be controlled to ensure complete but not excessive fusion [
5]. It is relatively short and depends on the parameters used. It is mainly determined by power (P) and energy level (E), obtained through Equation 1 [
7].
It is also important to consider the hold time (time for solidification and cooling after the cessation of vibrations), the hold force, and the initial contact force (force applied to the workpiece before initiating the vibrations). Before starting the vibrations, proper contact between the horn and the upper workpiece is essential. Welding cannot be successfully performed if the horn contacts the workpiece after the vibrations have started.
All parameters are clearly interrelated, and to select them properly, knowledge of the material characteristics is necessary. If there is a poor selection of frequency or amplitude, it may require an increase in welding time, and vice versa. The properties of the component to be welded, such as its dimensions, material, and joint configuration, are also highly relevant, as are the characteristics of the equipment used (such as the horn shape).
In the case of sheet welding, it is crucial to consider the thickness of the sheets. One of the limitations of this type of welding is that it is not suitable for joining very thick components, as the equipment does not have enough power to achieve the necessary material fusion. Therefore, only thin-walled components can be successfully joined [
10]. Of course, the "limit" thickness value depends on the equipment used, the geometry of the tool, and the weldability of the material in question. For thinner materials, the power required is much less than for thicker components. It is worth noting that the thickness of the lower component is not a limiting factor and does not significantly affect the welding process. This aspect should be considered when selecting the component to be in contact with the sonotrode (upper part).
It is important to consider the length and width of the upper component, as these will alter the resonance frequency, especially for larger components. According to [
2], the weld strength decreases when the length of the piece is half the longitudinal wavelength, necessitating equipment with lower power. For components whose dimensions are outside the order of magnitude of the ultrasonic wave vibration, the load that the weld can withstand will decrease, and the upper part will deform under the sonotrode. In this case, the thickness of the upper component has less influence.
According to ISO 6520-2:2001 [
12], which classifies imperfections in welded metals through pressure welding, common defects in ultrasonic welding include cracks, solid inclusions, incomplete welding, and imperfect shape. The presence of a complete and continuous welded joint is the desired outcome of ultrasonic welding [
7]. During the welding cycle, welded islands are created, meaning local welded spots interrupted by gaps [
13]. It is important to ensure that these welded islands are evenly distributed along the joint to ensure the quality and integrity of the weld as a whole.
Although ultrasonic welding has been widely studied, this work focuses on its application to the sealing of copper tubes, examining its particularities.
3. Results and analysis
3.1. Tensile Test
Based on the results of the tensile tests presented in
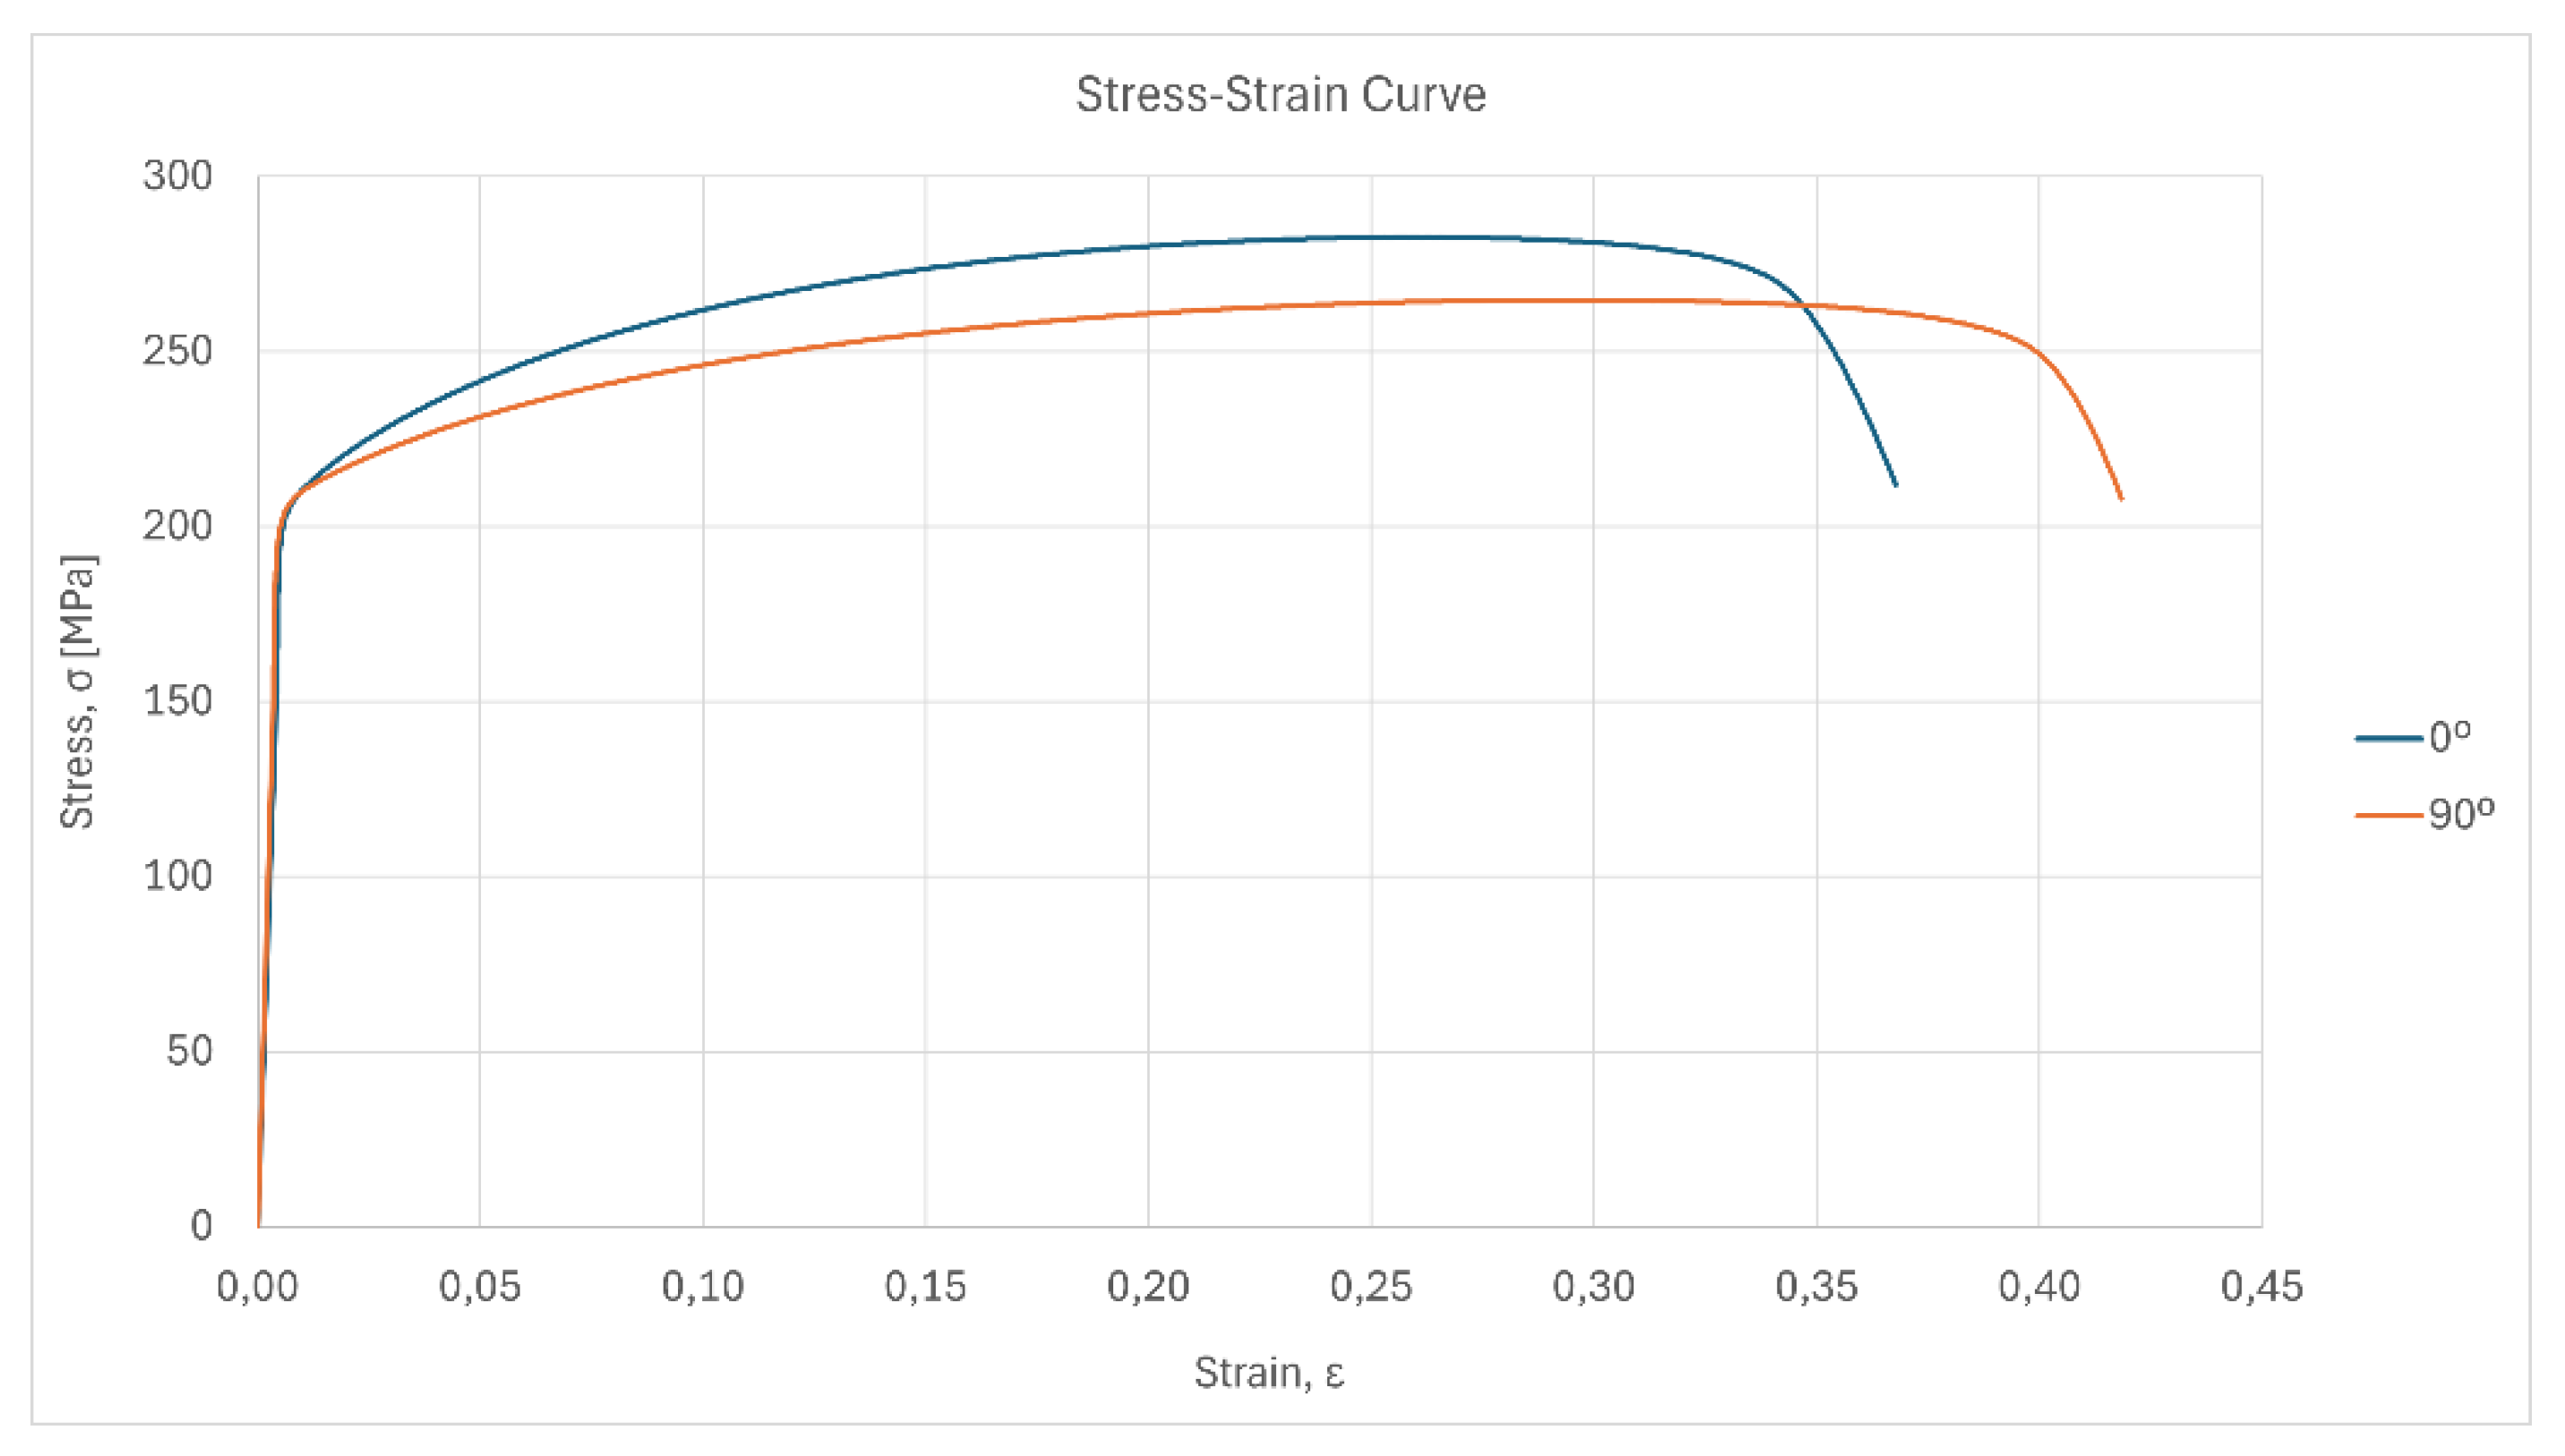
Figure 7, it is concluded that the specimens with the rolling direction exhibit higher tensile strength, with a percentage difference of approximately 6.29%.
When analyzing the first set of parameters from
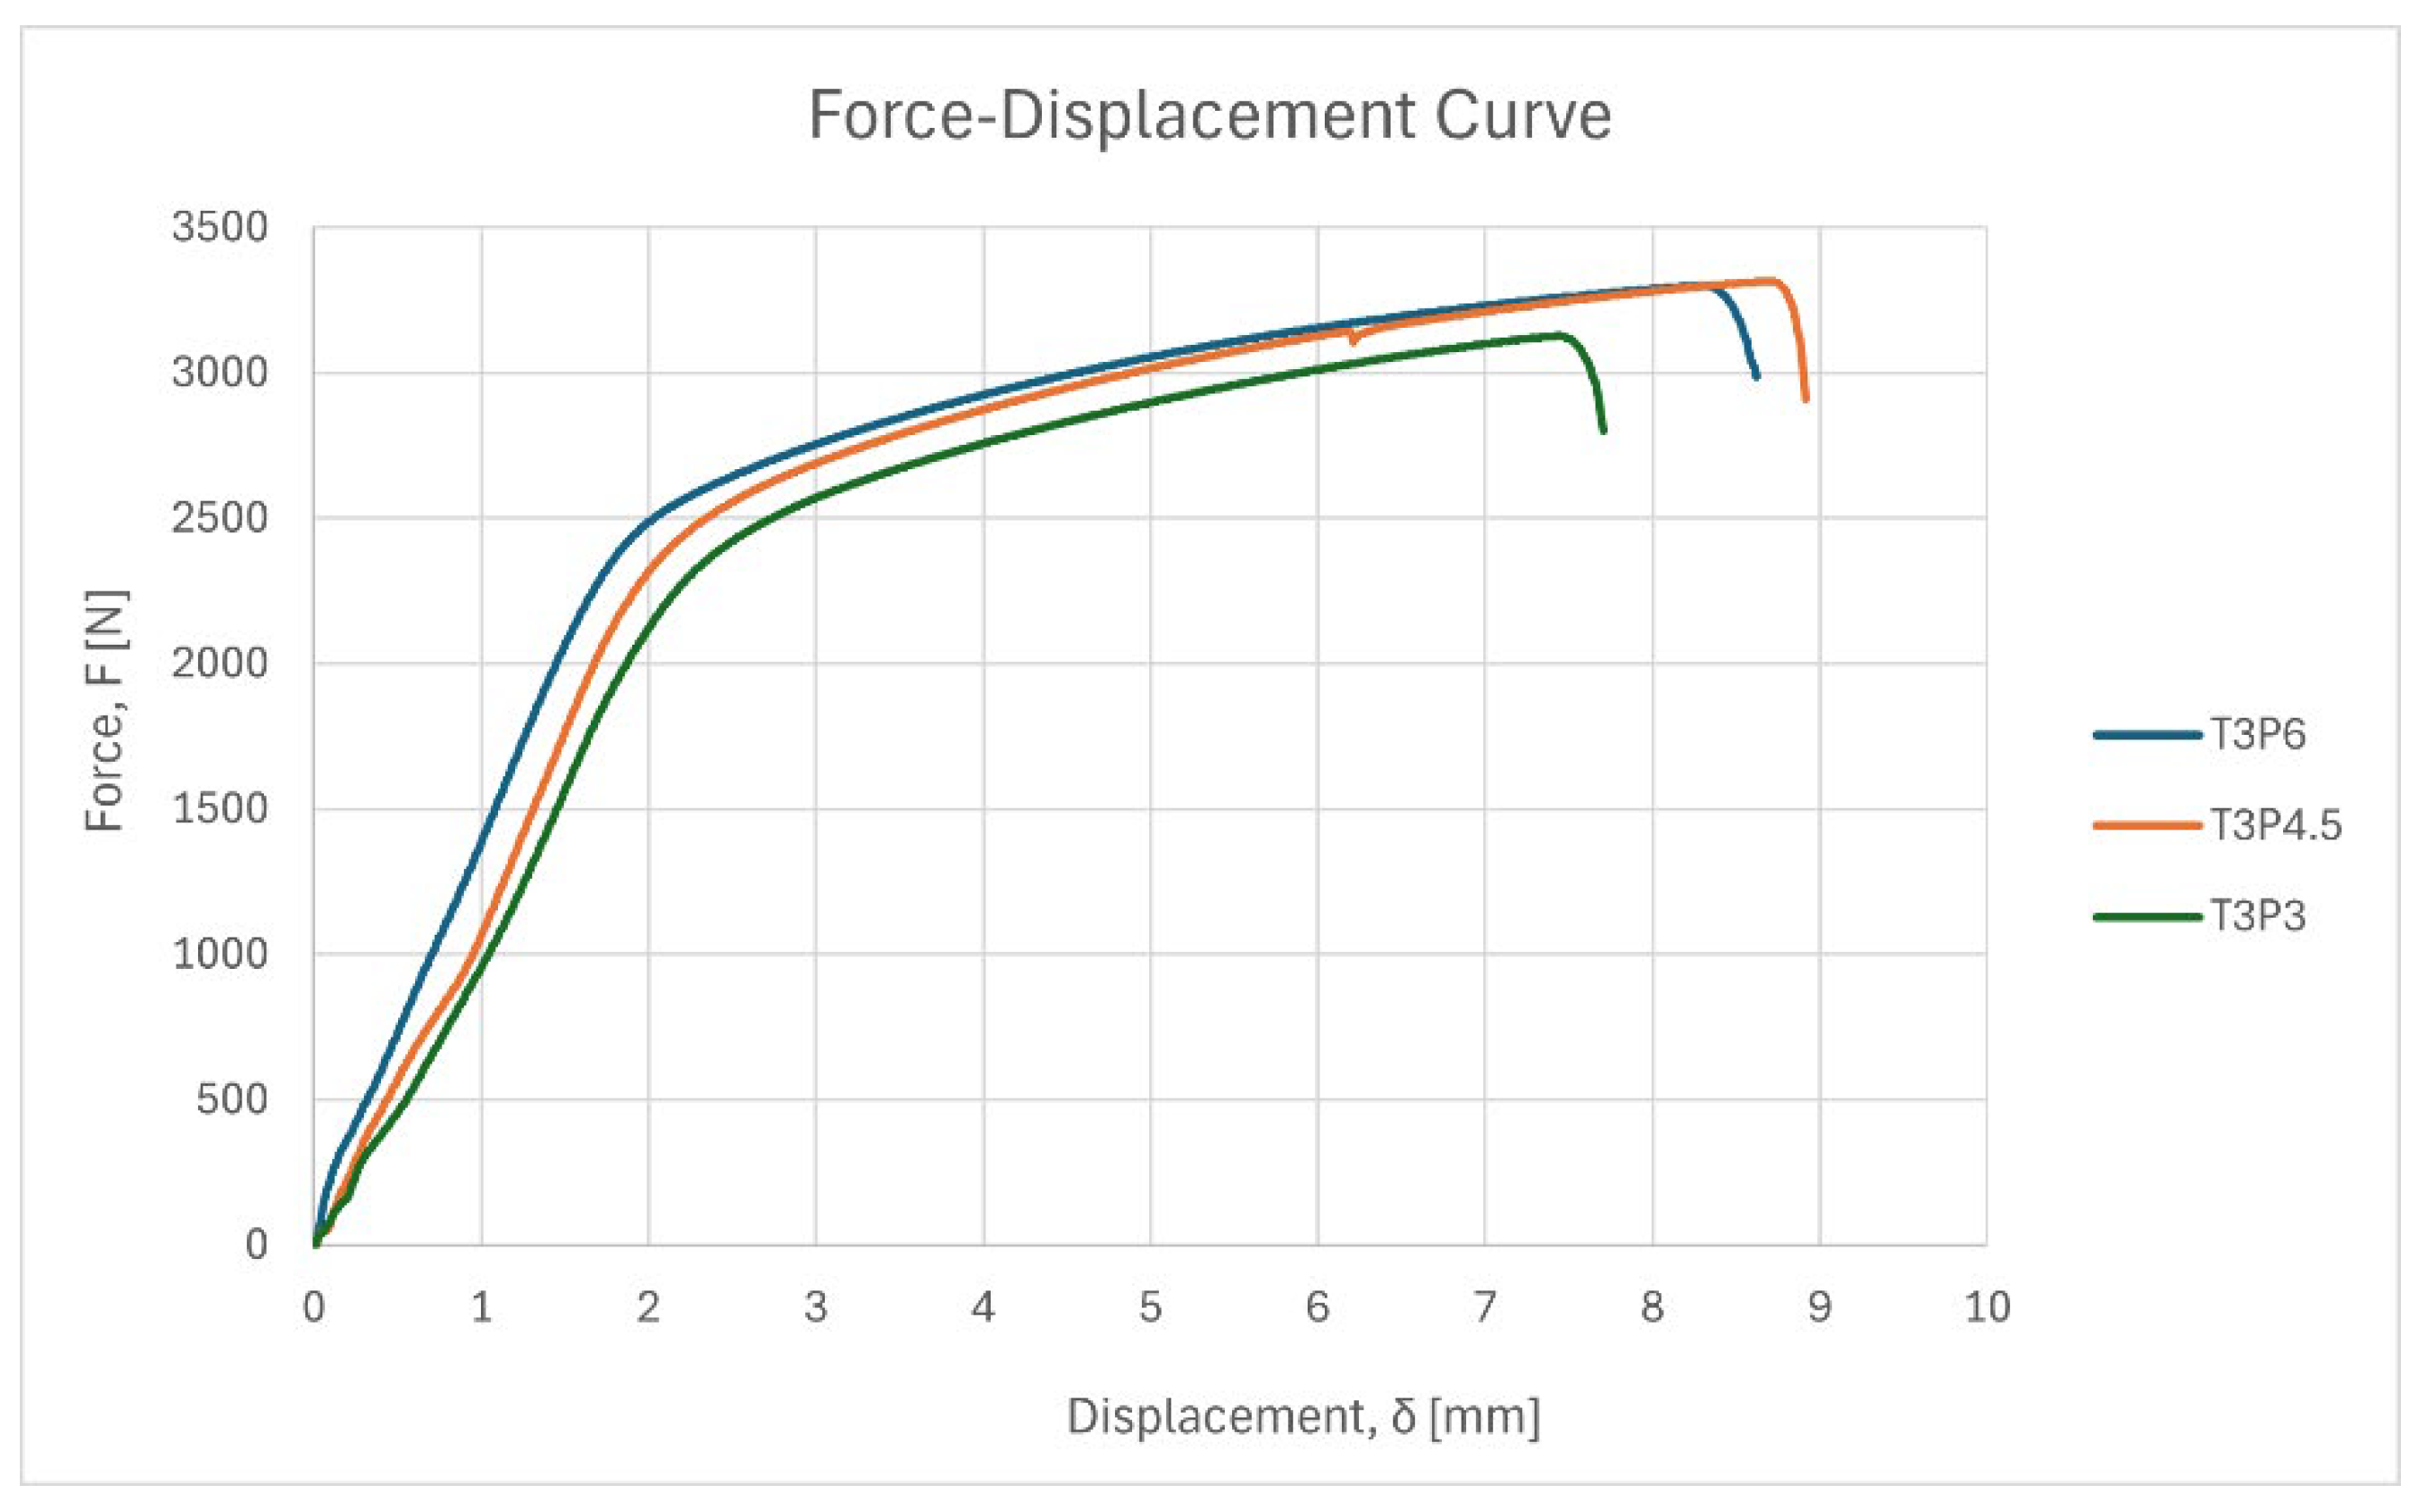
Table 1, characterized by a welding time of 0.01 s, it was found that no welding of the material occurred regardless of the applied pressure. Subsequently, welds were performed with a duration of 3 s, and only those with a minimum pressure of 3 bar provided satisfactory results in the tensile tests. The results of the three parameter combinations are shown in
Figure 8, where the force-displacement curves for each sample are presented. It should be noted that three tests were conducted for each parameter set, hence the graph in
Figure 8 shows the average for each sample.
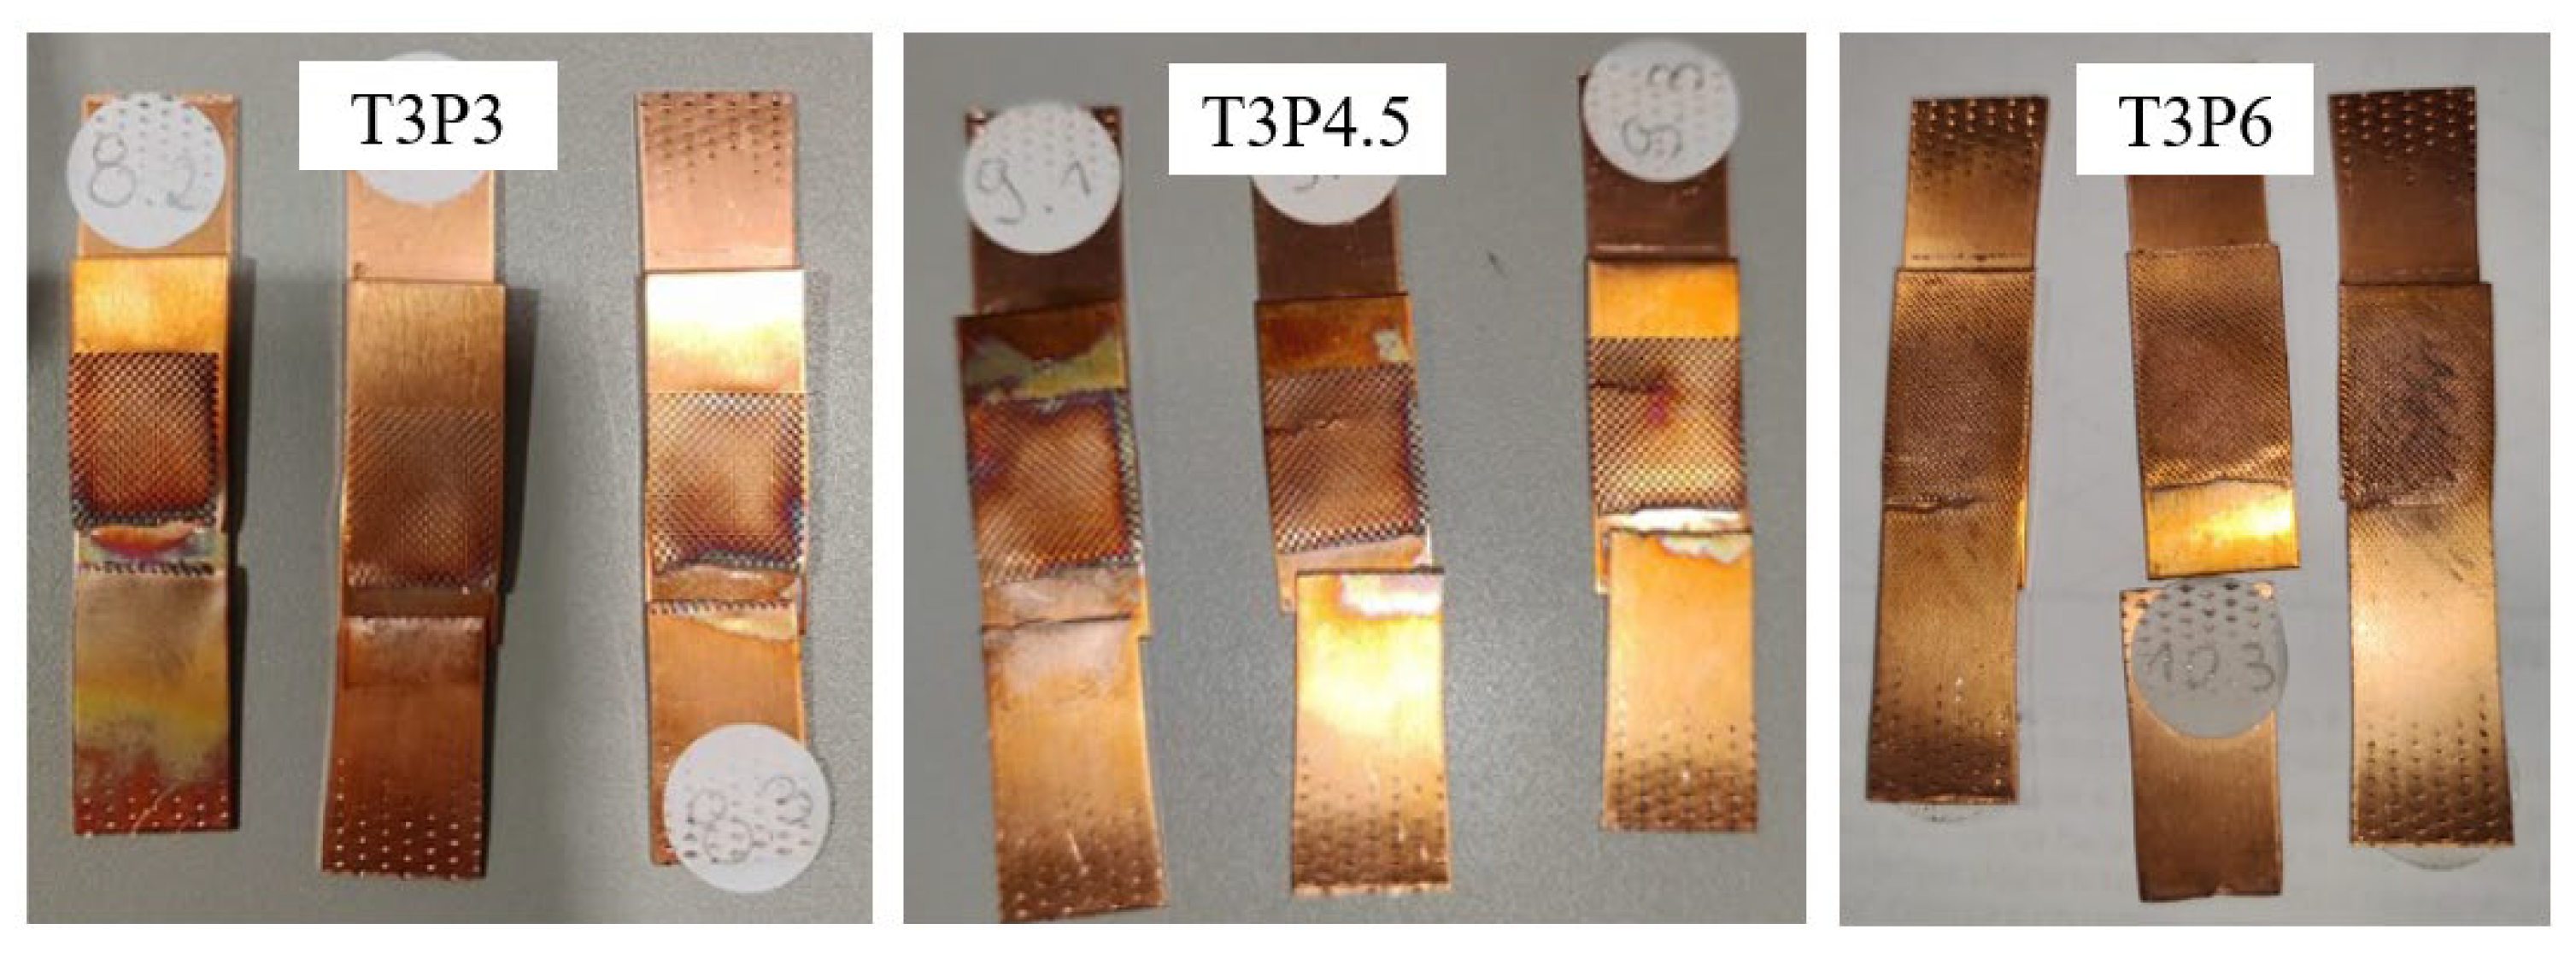
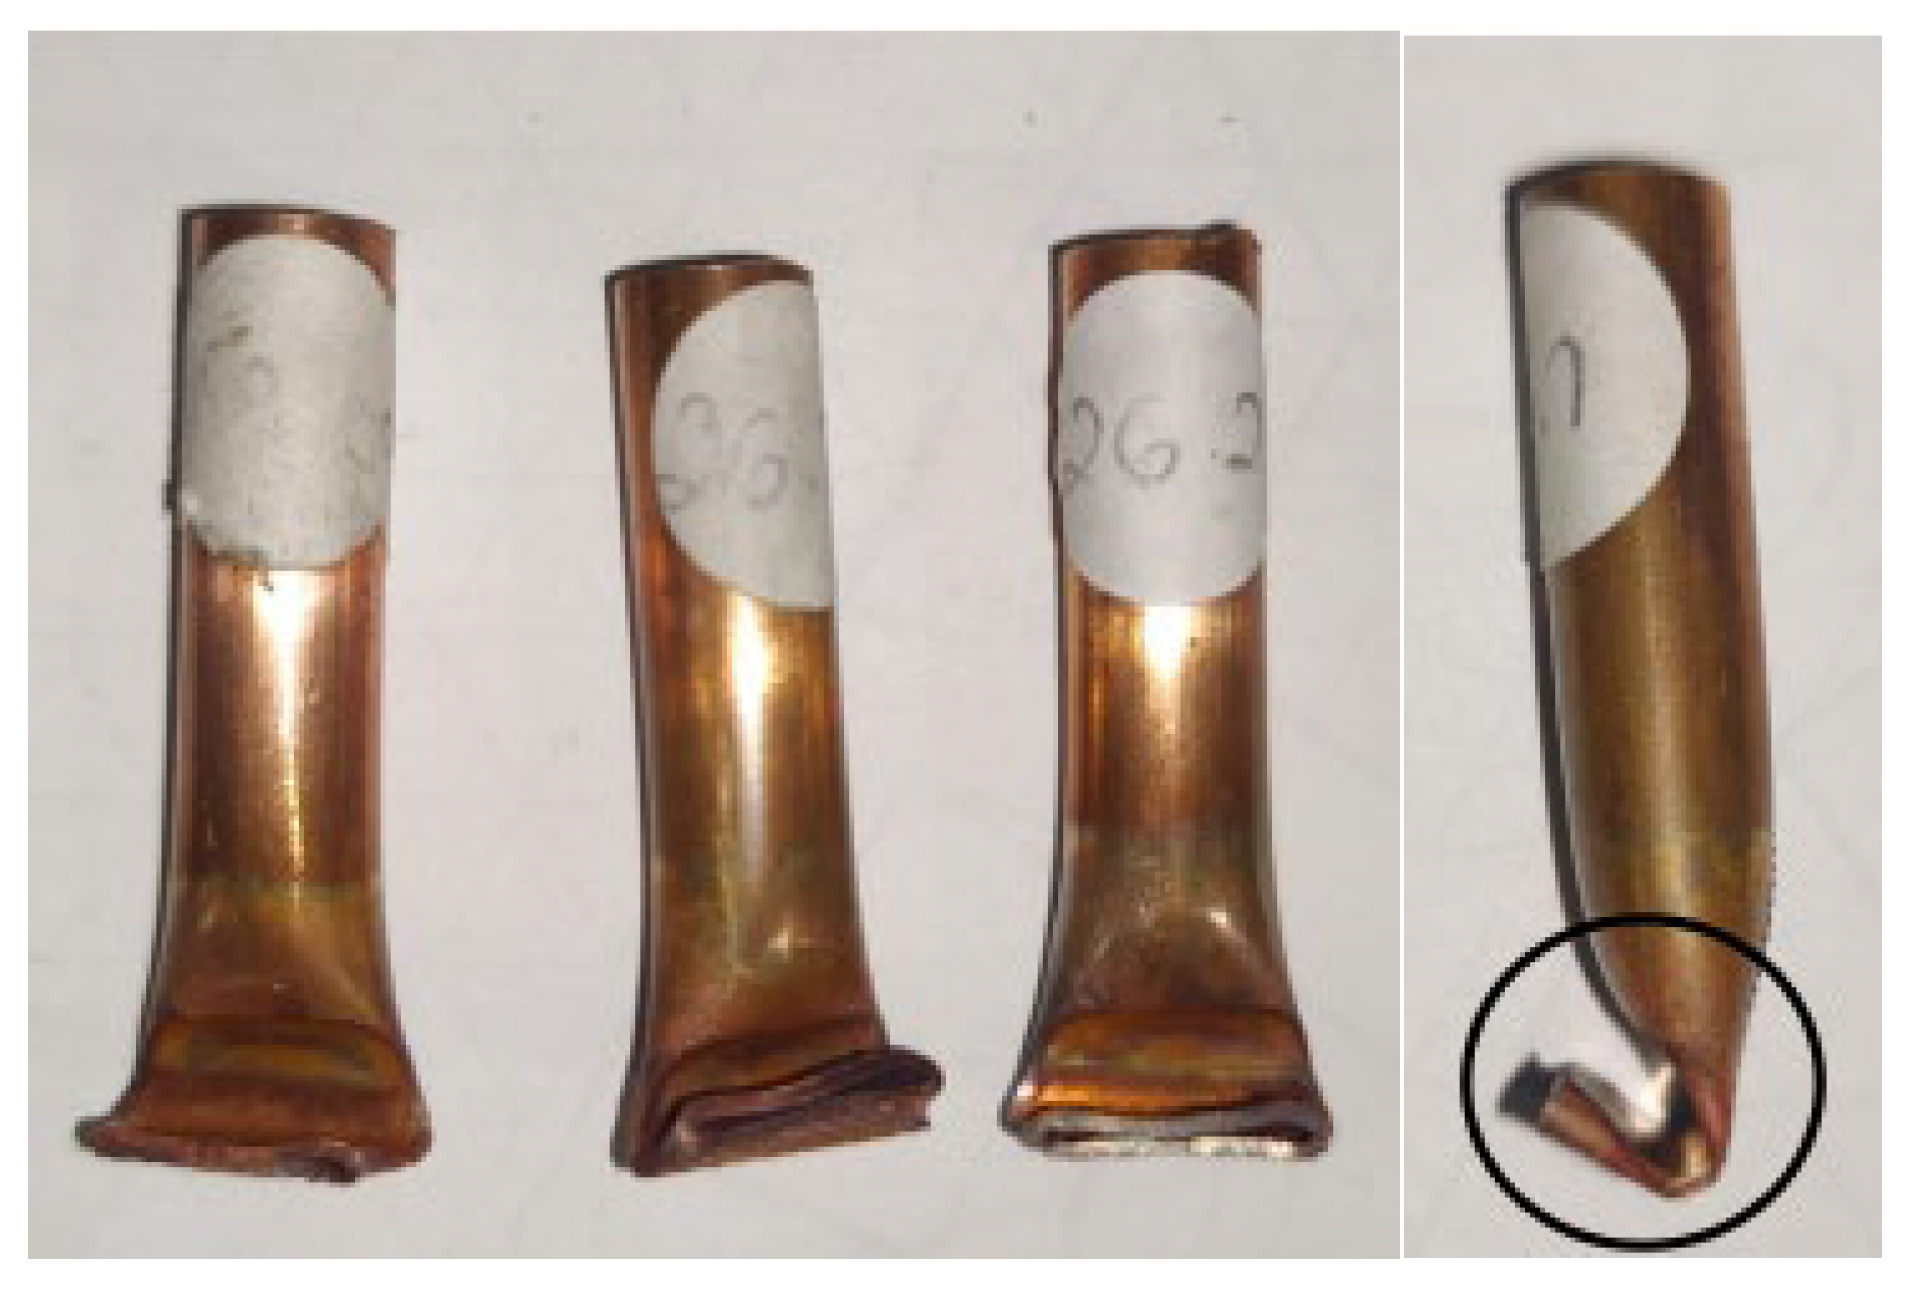
Analyzing Figure 9, it is evident that the fracture occurred immediately adjacent to the welded area, specifically at the transition between the zone pressed by the sonotrode and anvil, and the free part of the specimen, thus in the heat-affected zone.
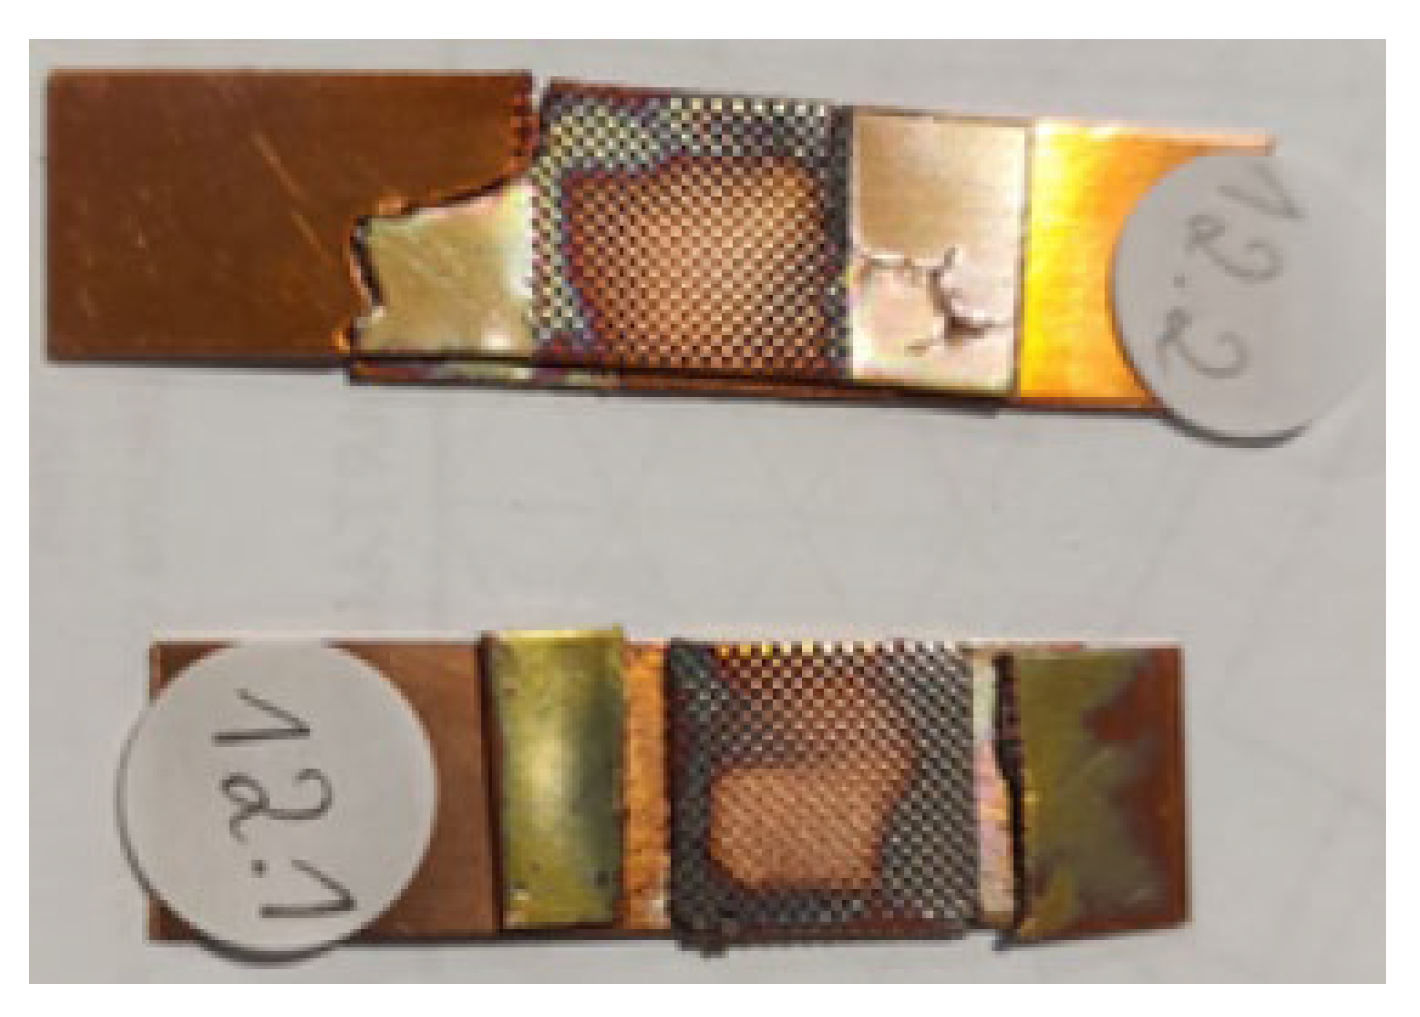
For a welding time of 5 s, only two combinations were tested: T5P0.5 and T5P1.5. In the case of the latter (T5P1.5), there was material failure during welding, as shown in
Figure 10, indicating that longer welding times at this pressure would be excessive. Therefore, all combinations of 7 s and 9 s with pressures equal to or greater than 1.5 bar were discarded. The image clearly shows the presence of defects such as fractures outside the weld zone. These are due to the high vibration to which the material is subjected, leading it to resonate and eventually fatigue, resulting in fracture. This phenomenon can be minimized by fixing the parts to be welded before starting the welding process. In this case, the issue was resolved by increasing the contact area between the sheets.
Following the sequence in
Table 1, welding proceeded using the subsequent parameters (7 s and 0.5 bar). There was a reduction in the applied force in the tensile tests compared to the results obtained with shorter welding times.
This led to the exclusion of the sample T9.99P0.5. Considering the goal of maximizing equipment productivity, it becomes evident that obtaining better results in shorter times makes it unnecessary to unnecessarily prolong the welding time.
After completing the welds according to Table x and analyzing the results obtained, it is concluded that the most effective parameter range is concentrated around 3 s. Therefore, additional tests were conducted with welding times of 2 s and 4 s.
It should be noted that welds with a duration of 4 s were performed only up to 3 bar of pressure. This is justified by the material breaking again at the welded zone during the process, indicating that higher pressure values with the same duration would be excessive.
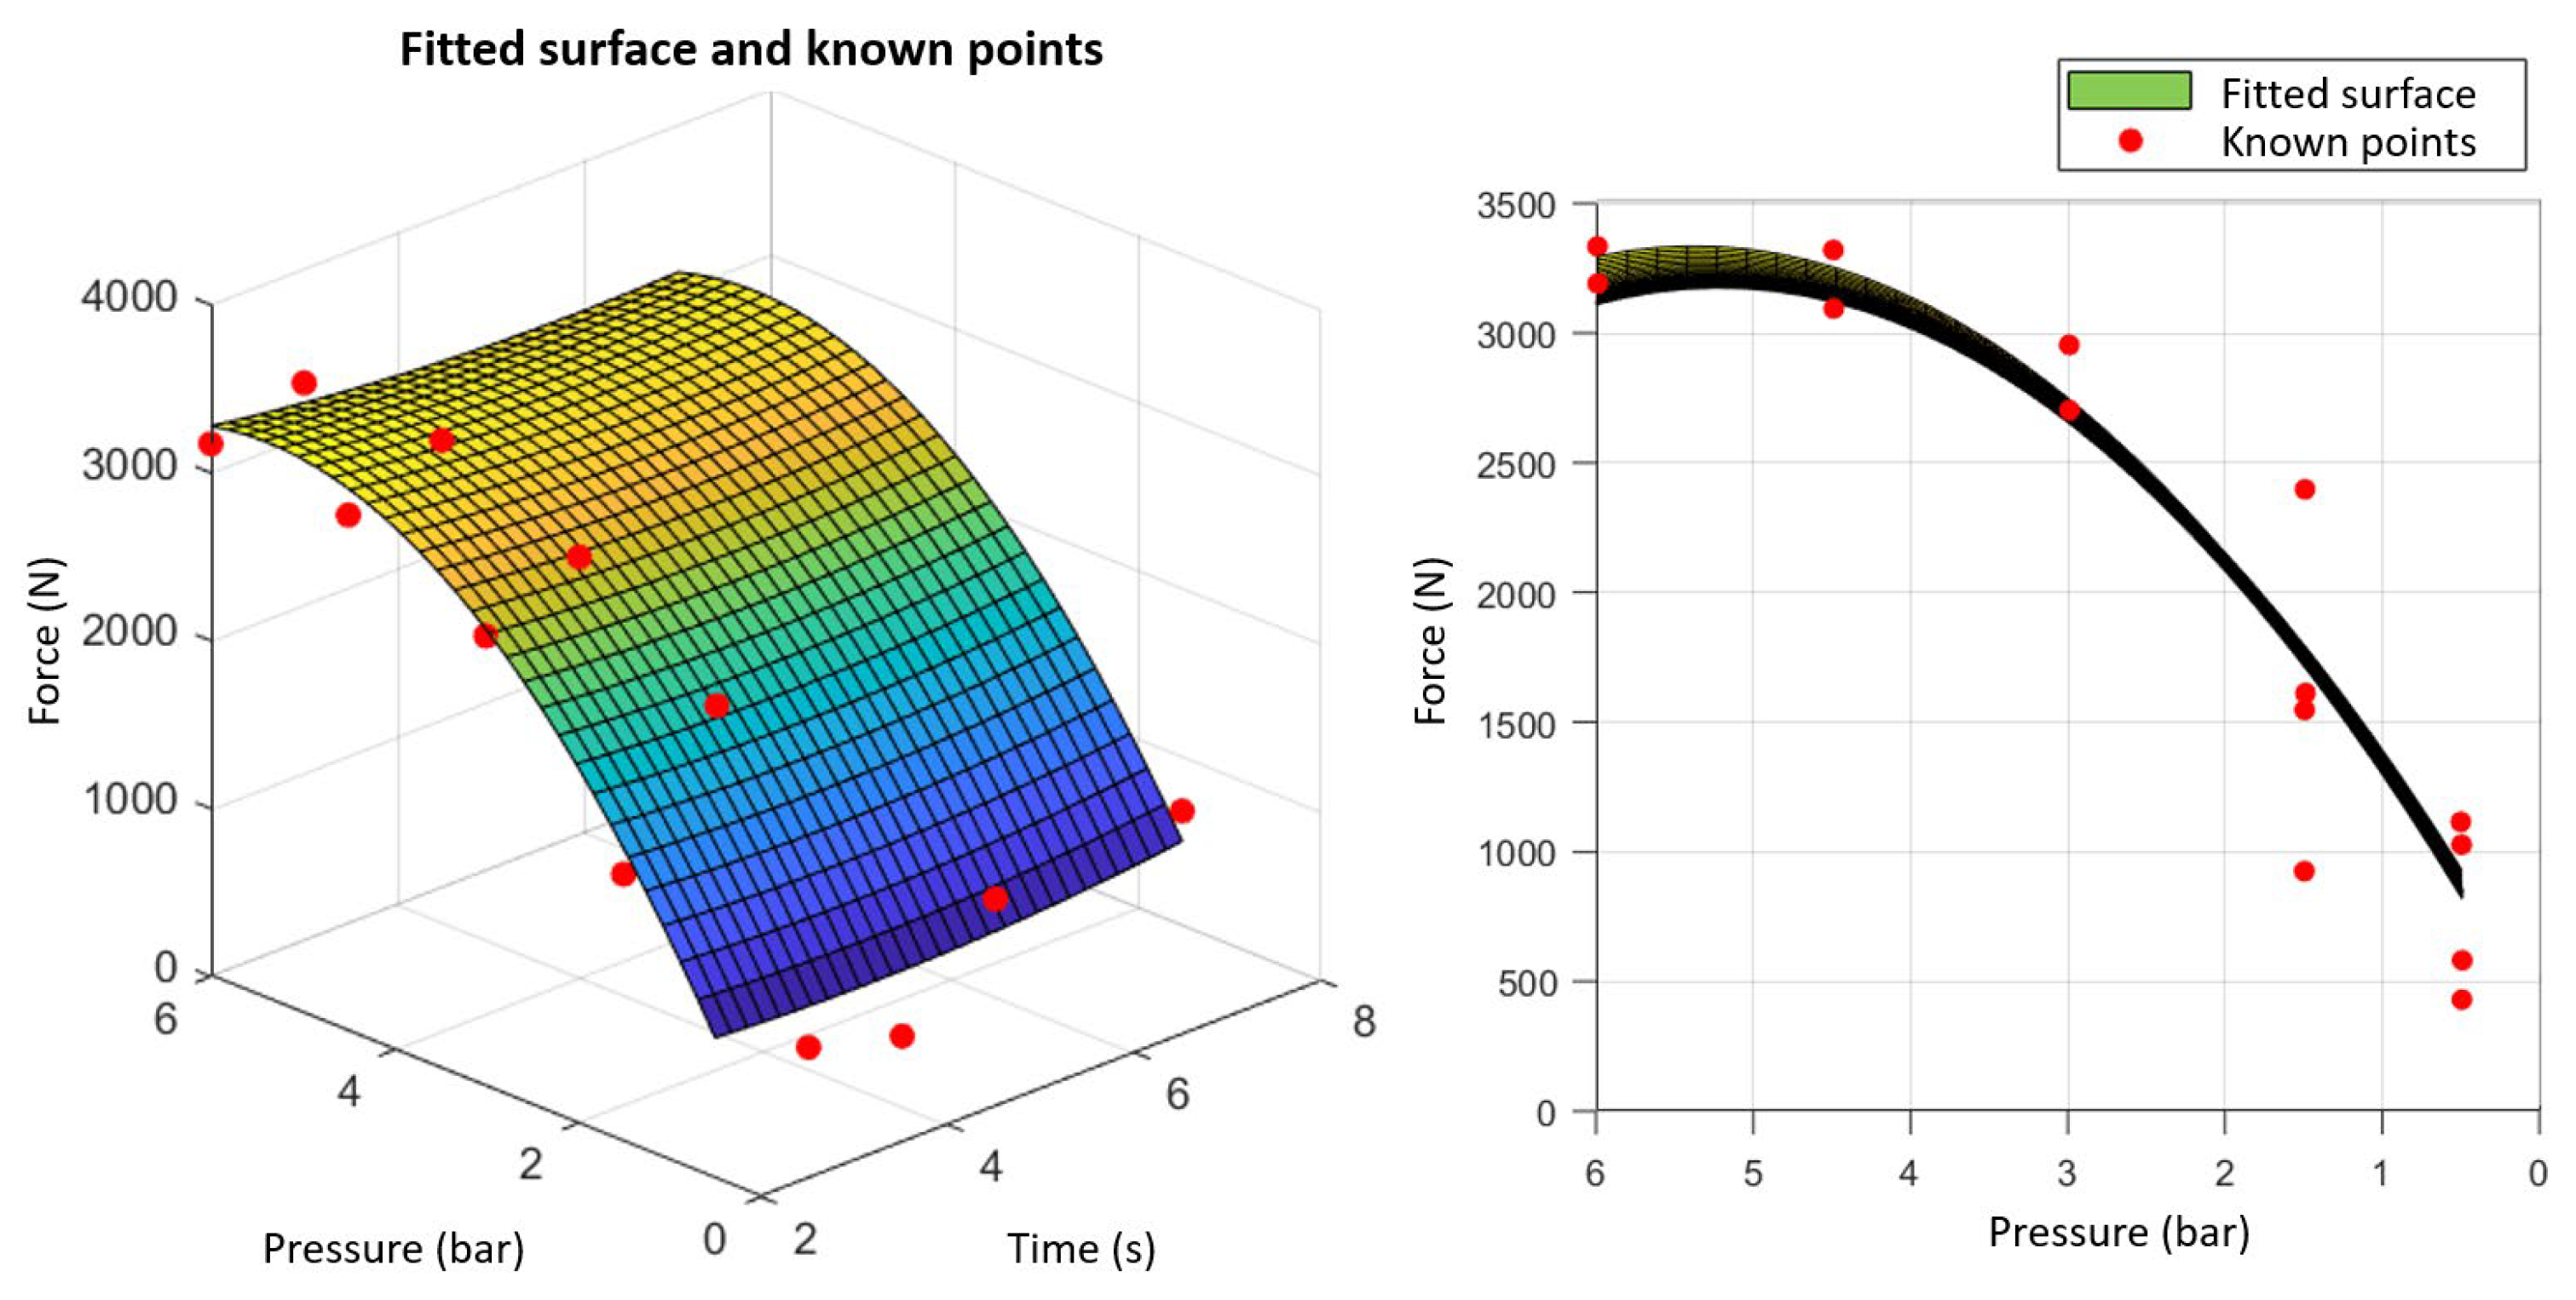
Using Matlab software and utilizing the time and pressure values along with the force results obtained from the tensile test, it was possible to arrive at a mathematical approximation of the results through Equation 3, where t corresponds to time, P to pressure, and F to force:
Through it, it was possible to obtain a three-dimensional graphical analysis, presented in Figure 11. Through its analysis, it was found that the most favorable results were obtained within the 3-second time range. Observing the graph, a noticeable trend can be seen regarding the maximum traction force applied to the sheets as a function of welding time and applied pressure. It is evident that, in general, the maximum force tends to increase along with increasing pressure, particularly in shorter welding time intervals. As the welding time extends, this trend tends to stabilize or even decrease.
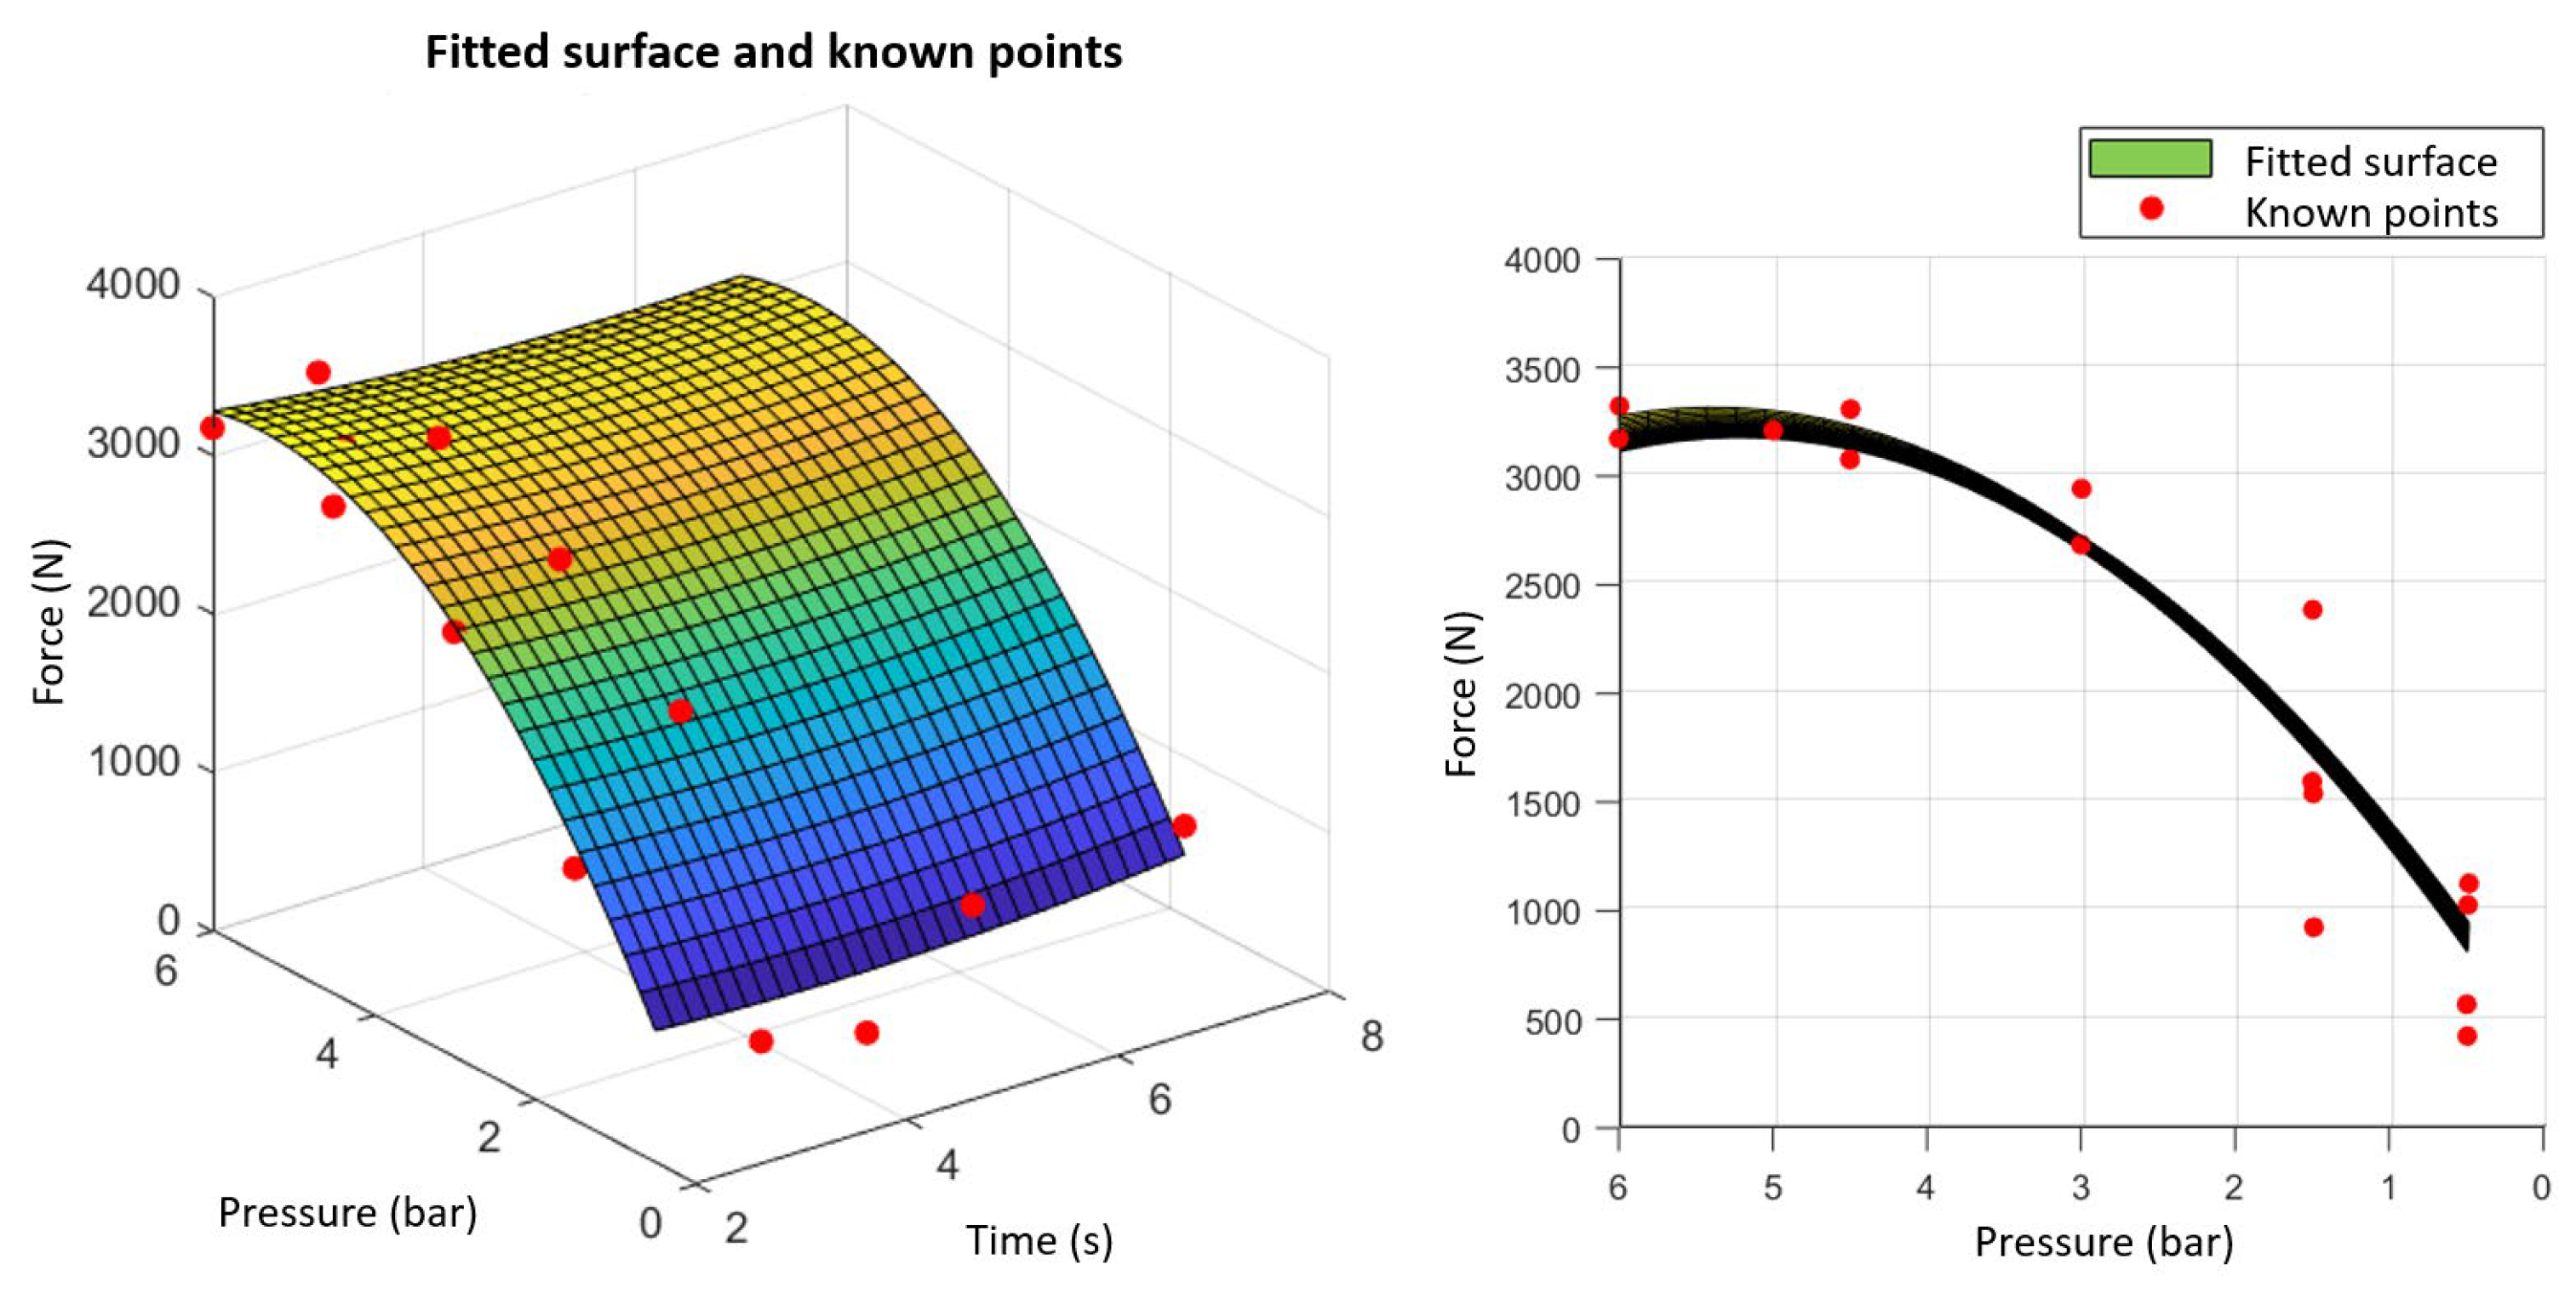
To confirm the results obtained, a new analysis was conducted with an additional parameter combination, consisting of a welding time of 2.5 s and a pressure of 5 bar. Redrawing the graph from
Figure 11 with all the values obtained, it is concluded that the optimal parameters for welding copper sheets are: 3 s and 6 bar, as evidenced in
Figure 12. The additional analysis further supports the observed trend, where the maximum tensile strength increases with pressure, especially at shorter time intervals.
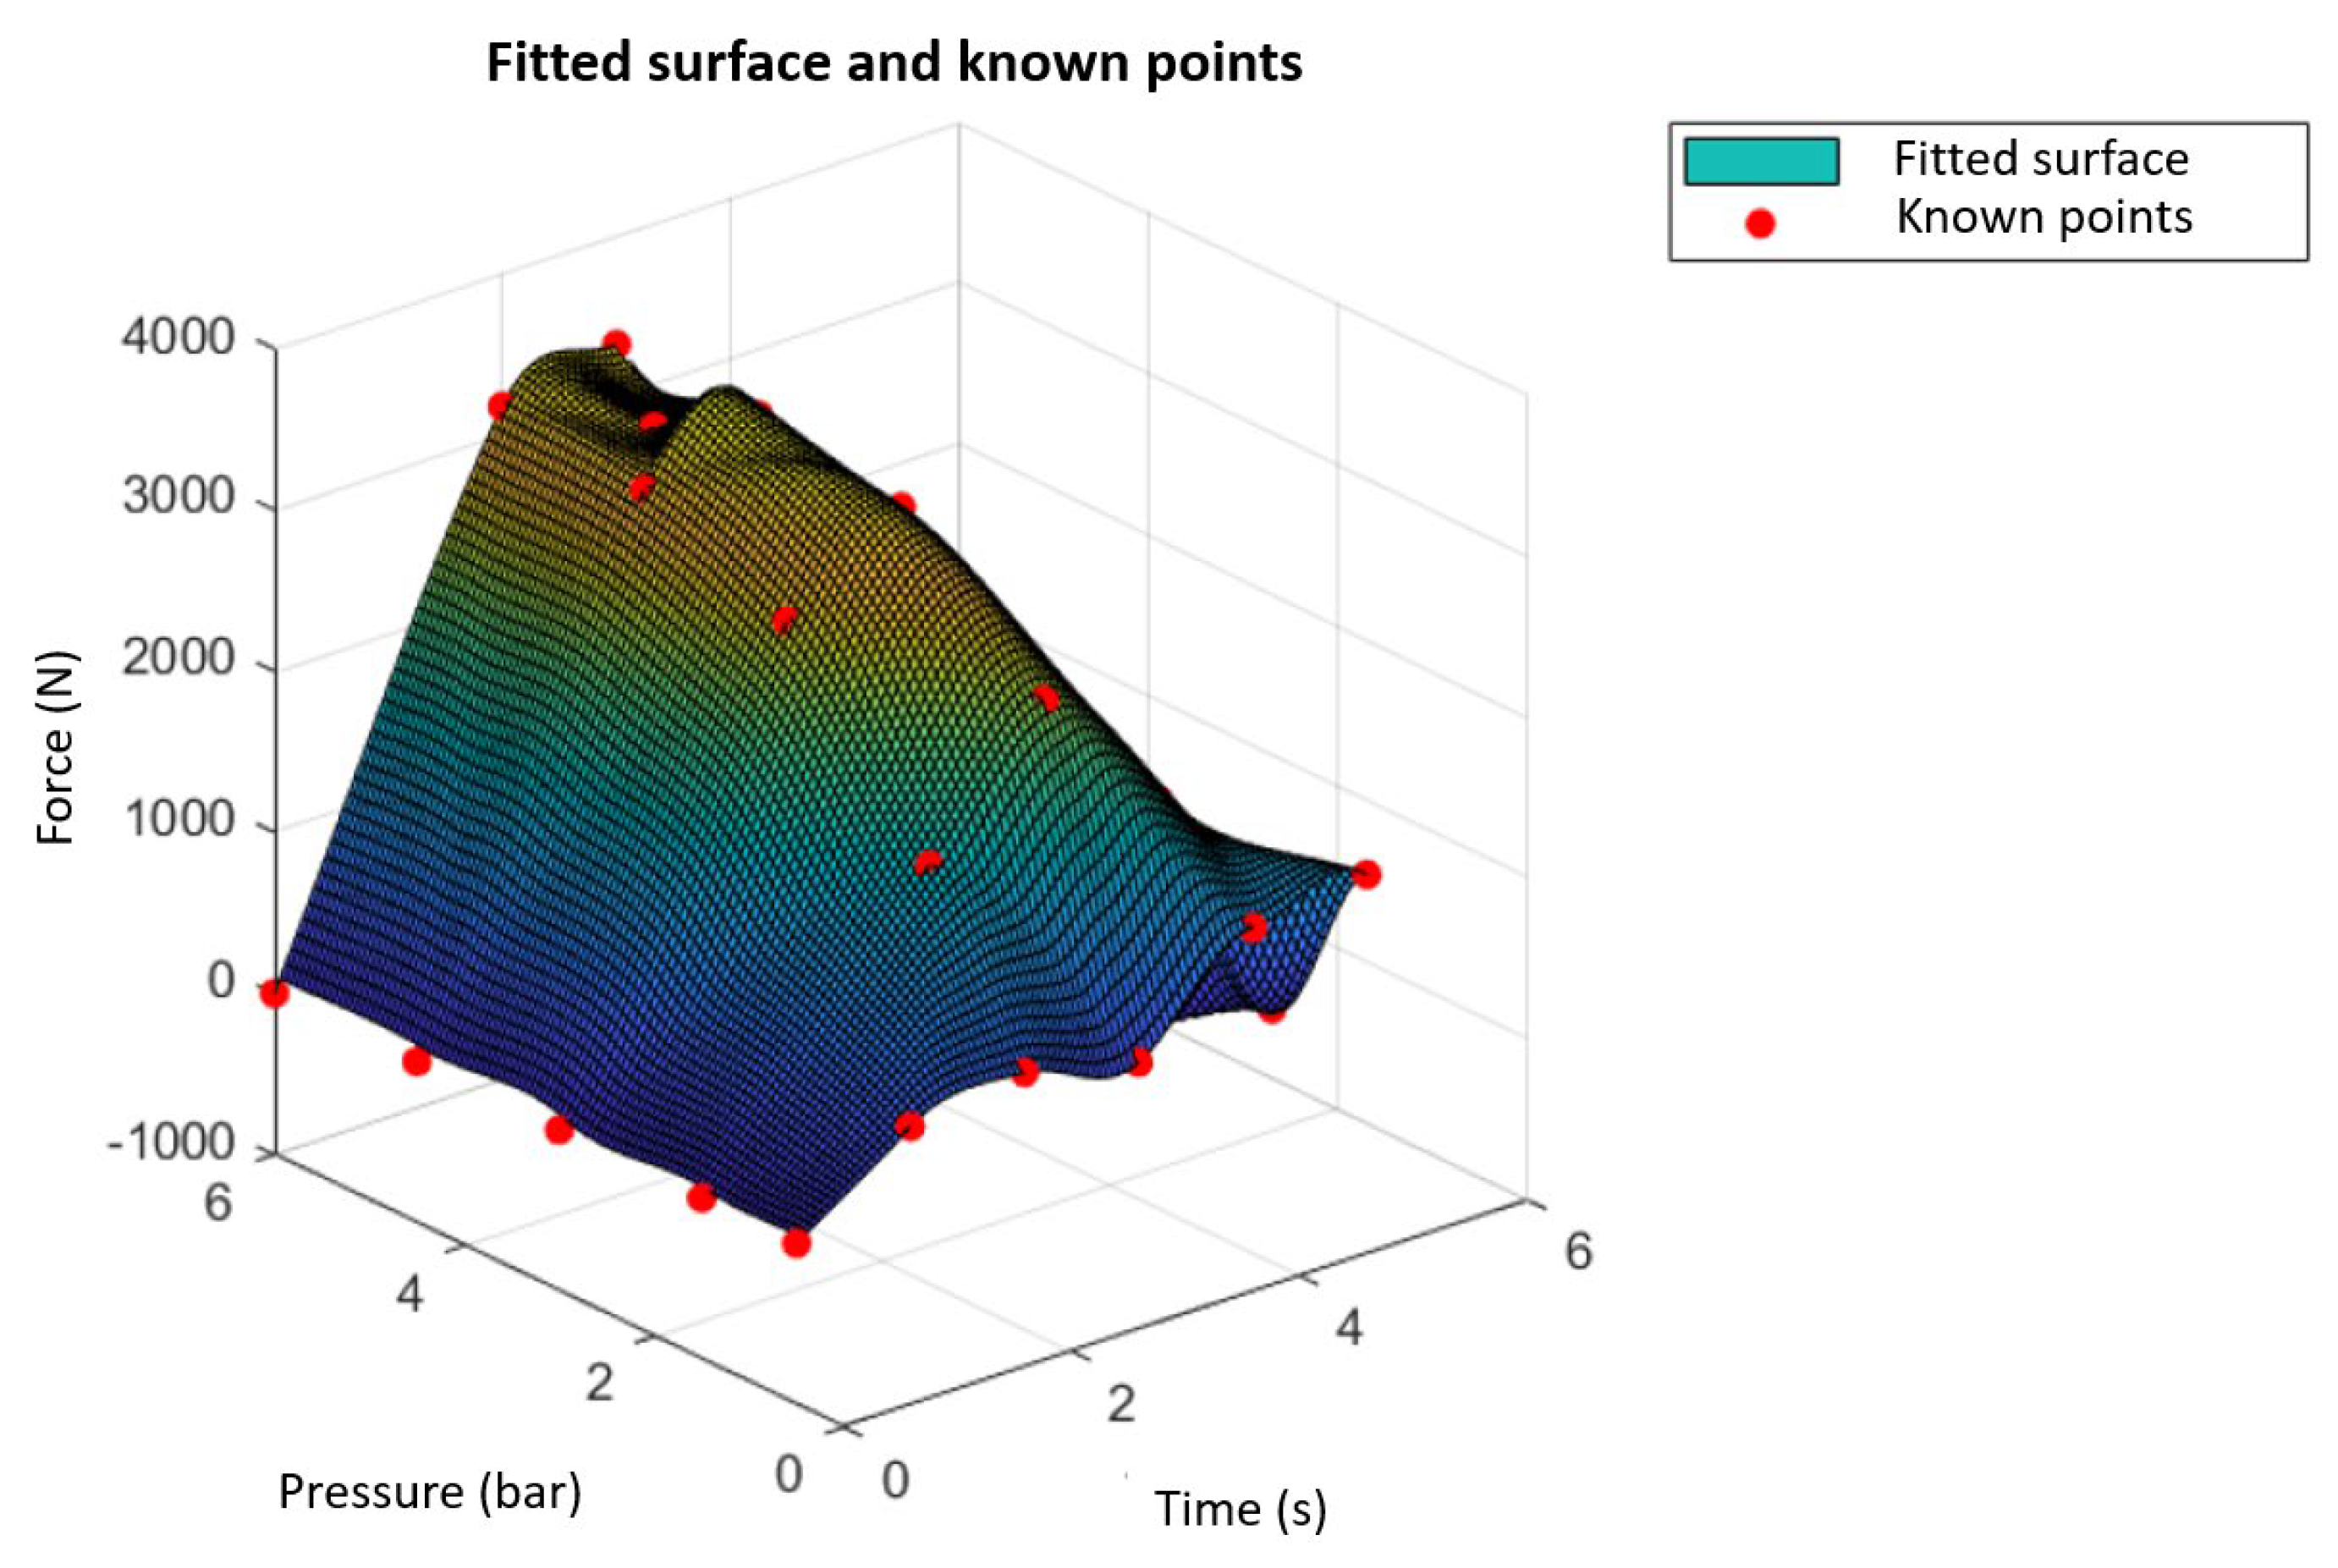
In
Figure 13, the interpolated surface is presented along with all known points, including the parameter sets that resulted in welds that were manually separated. For these cases, the considered force was 0 N.
Examining
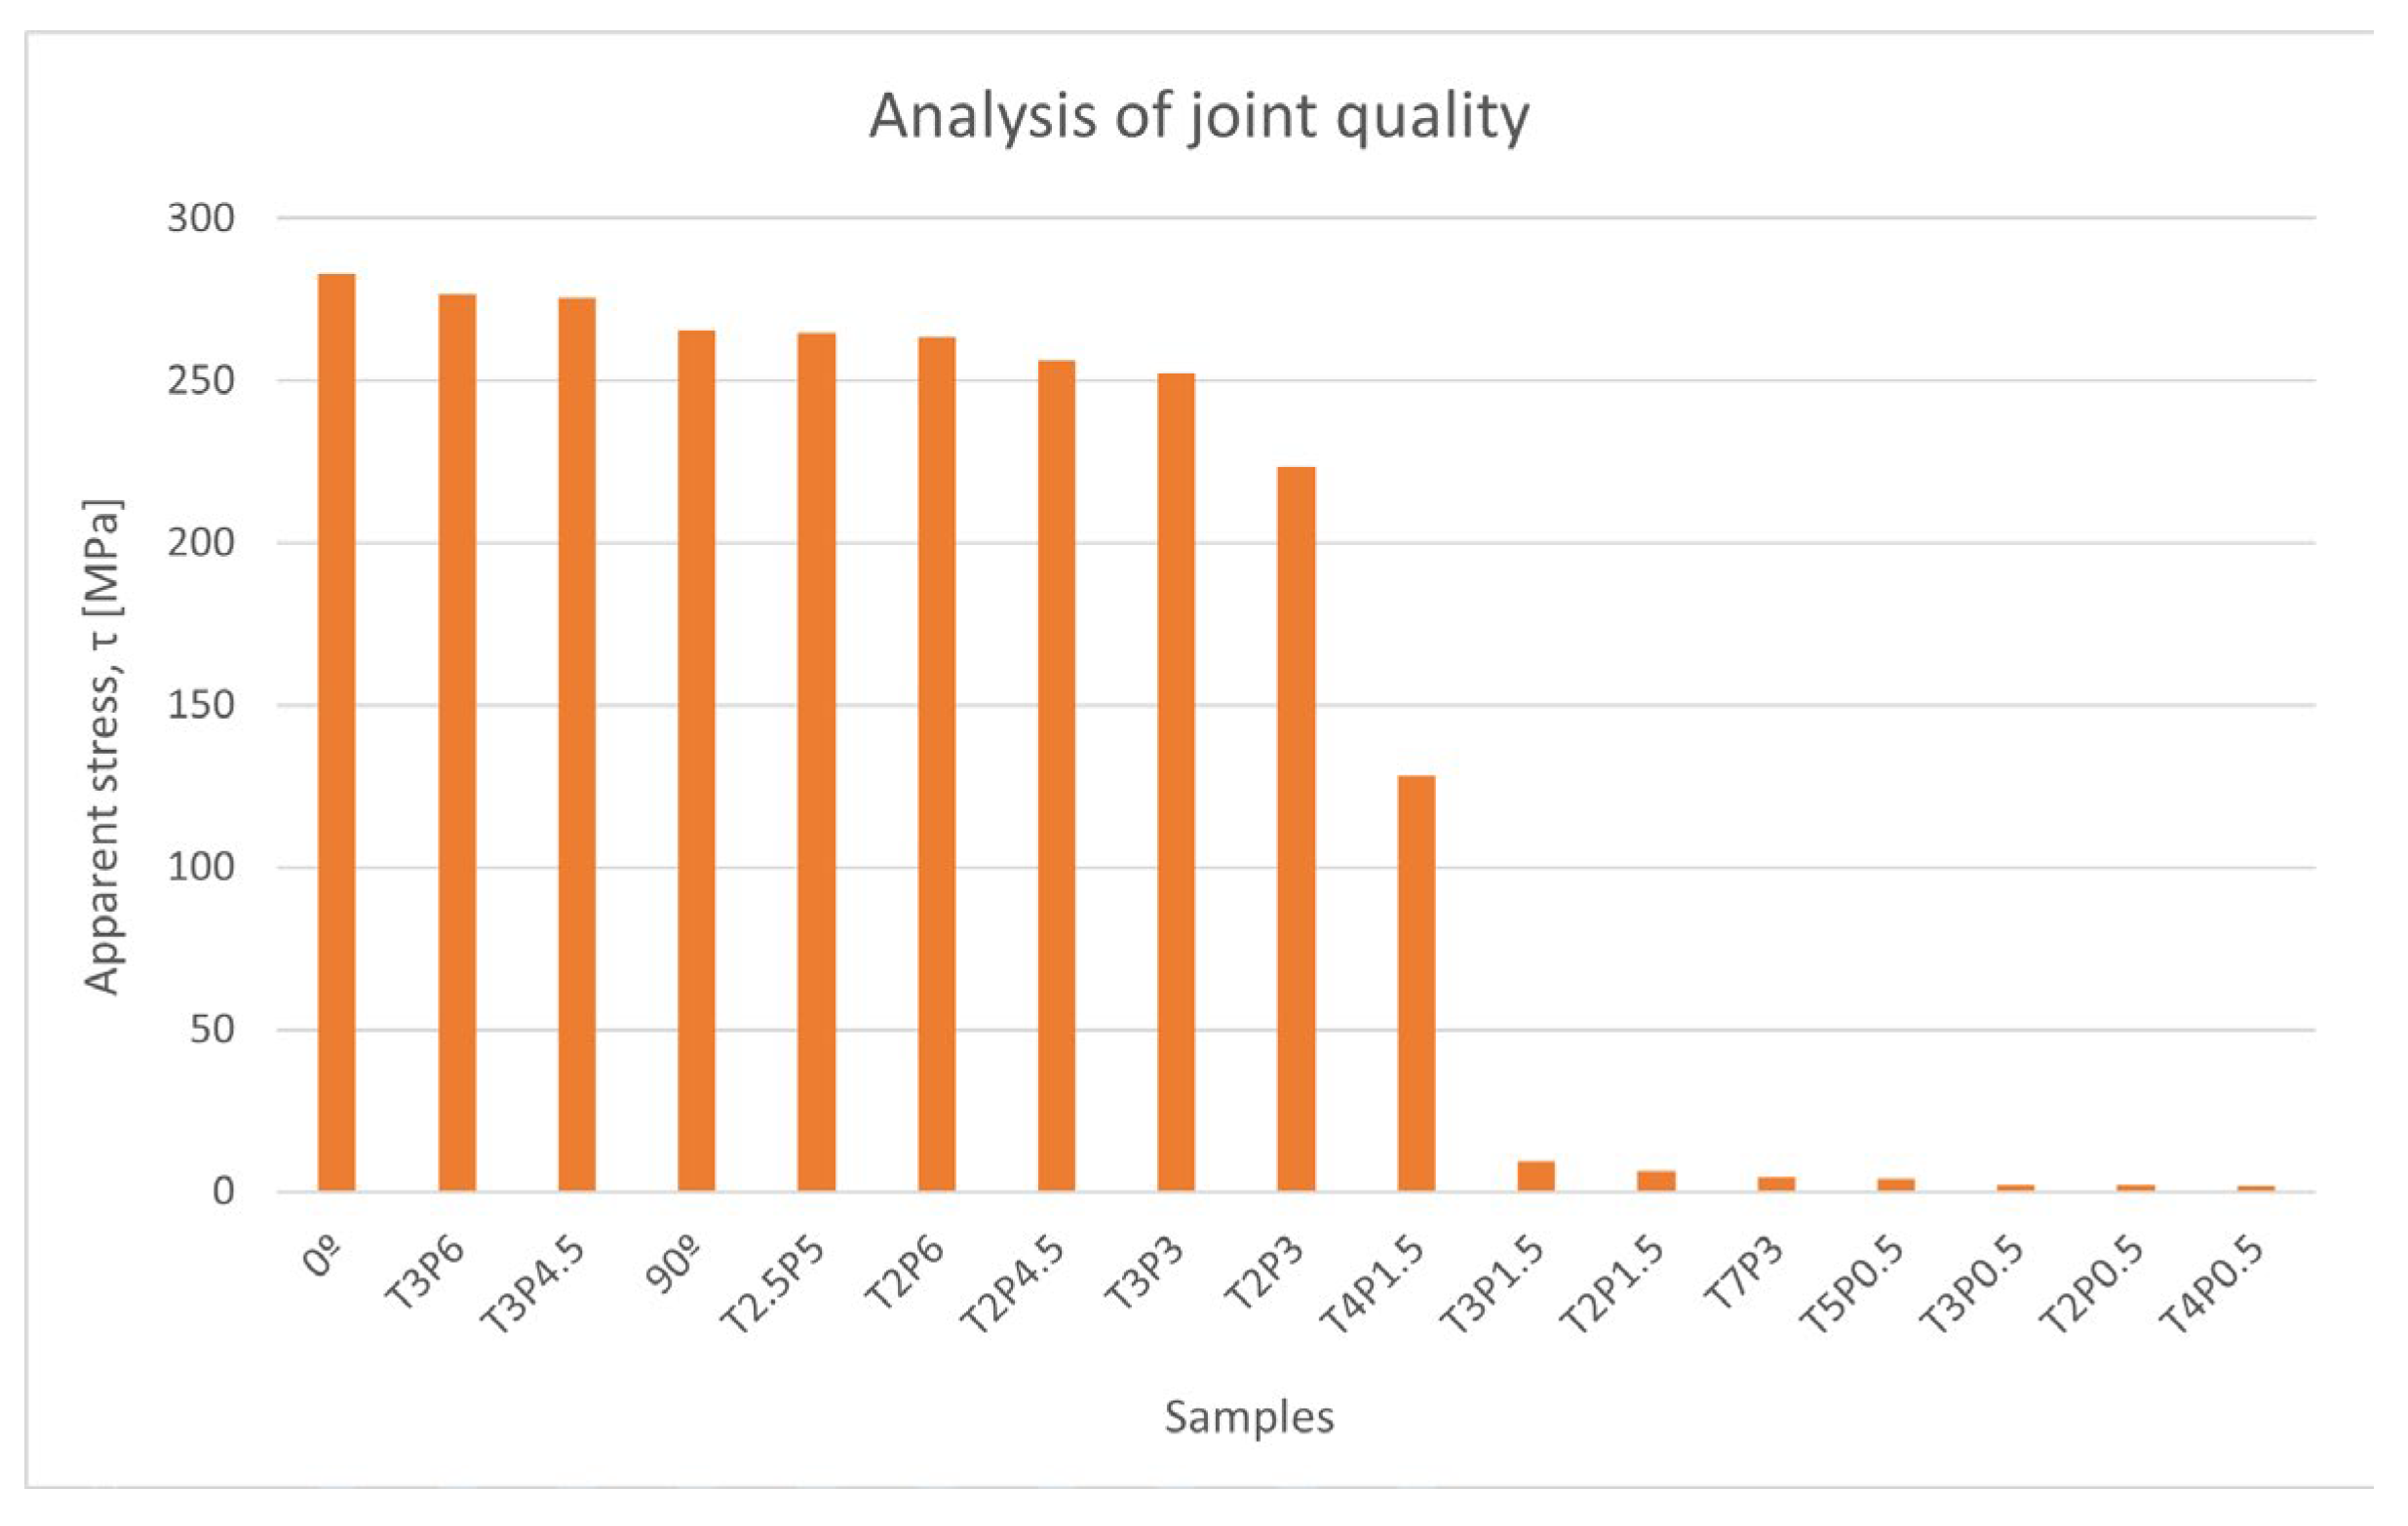
Figure 14, which presents the joint quality analysis comparing the apparent stresses of all samples with the base material stress, it is concluded that the best specimen exhibits a rupture strength of 97.7% of the base material.
3.2. Sealing Test
For any pressure value, 0.01 s proved to be insufficient time, with the tubes not even closing. The same was observed for samples T3P0.5, T3P1.5, and T3P3.
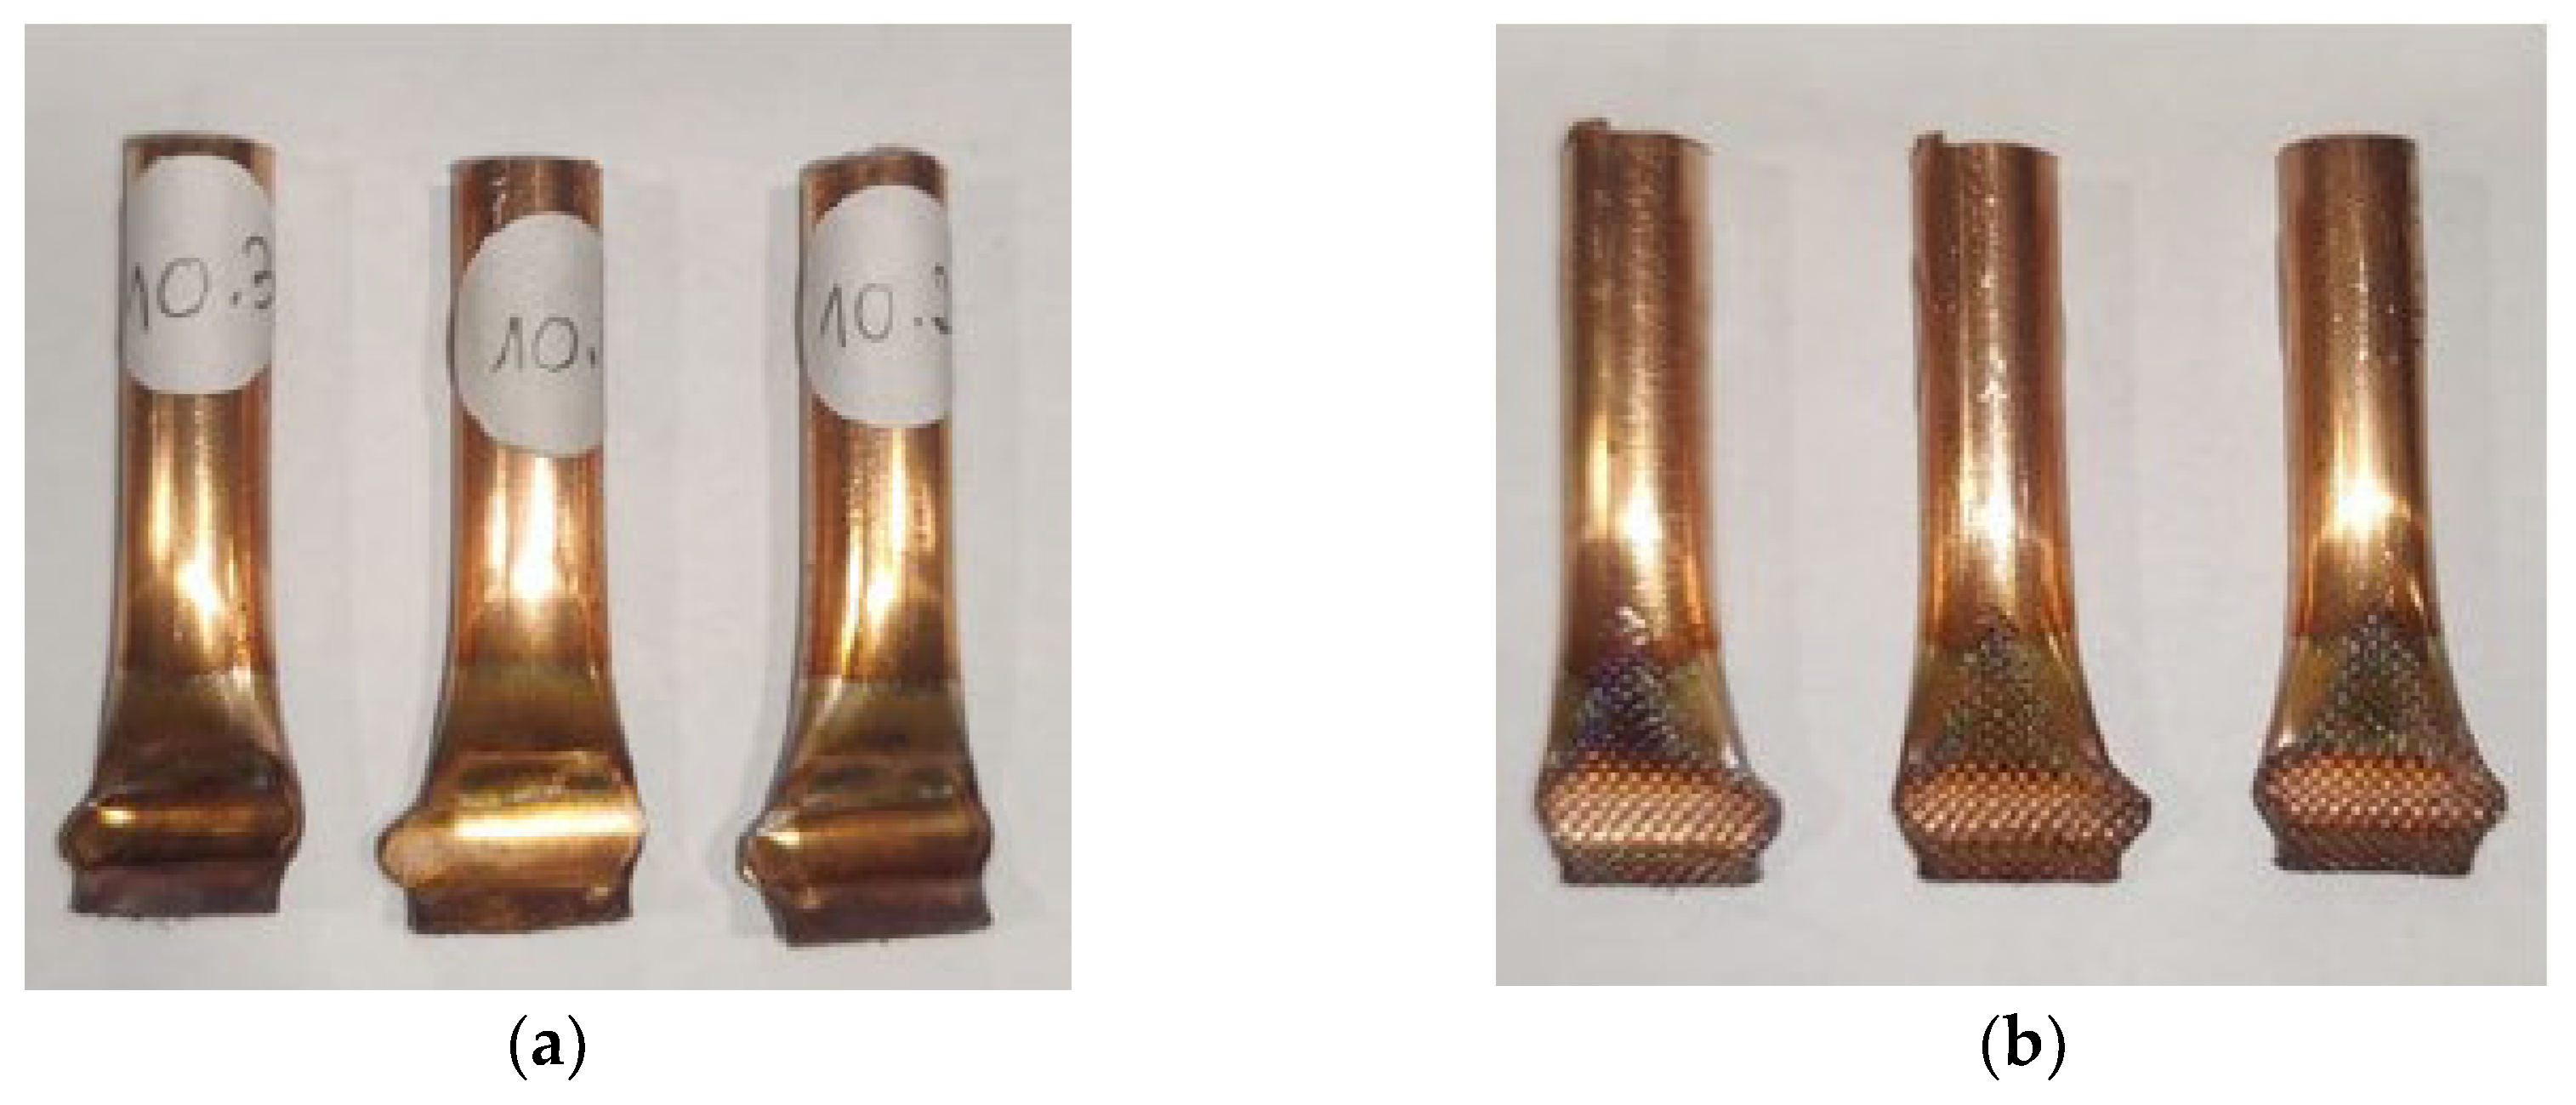
Conversely, sample T3P4.5 showed satisfactory results, passing the leak test. This set a limit on the parameters because, as can be seen in
Figure 15, there is an area where the thickness has significantly reduced. This indicates that welds at this pressure or higher, and for longer periods, would be excessive, posing a risk of damaging the sonotrode. Therefore, welds with a pressure equal to or greater than 4.5 bar were not performed for durations longer than 3 s.
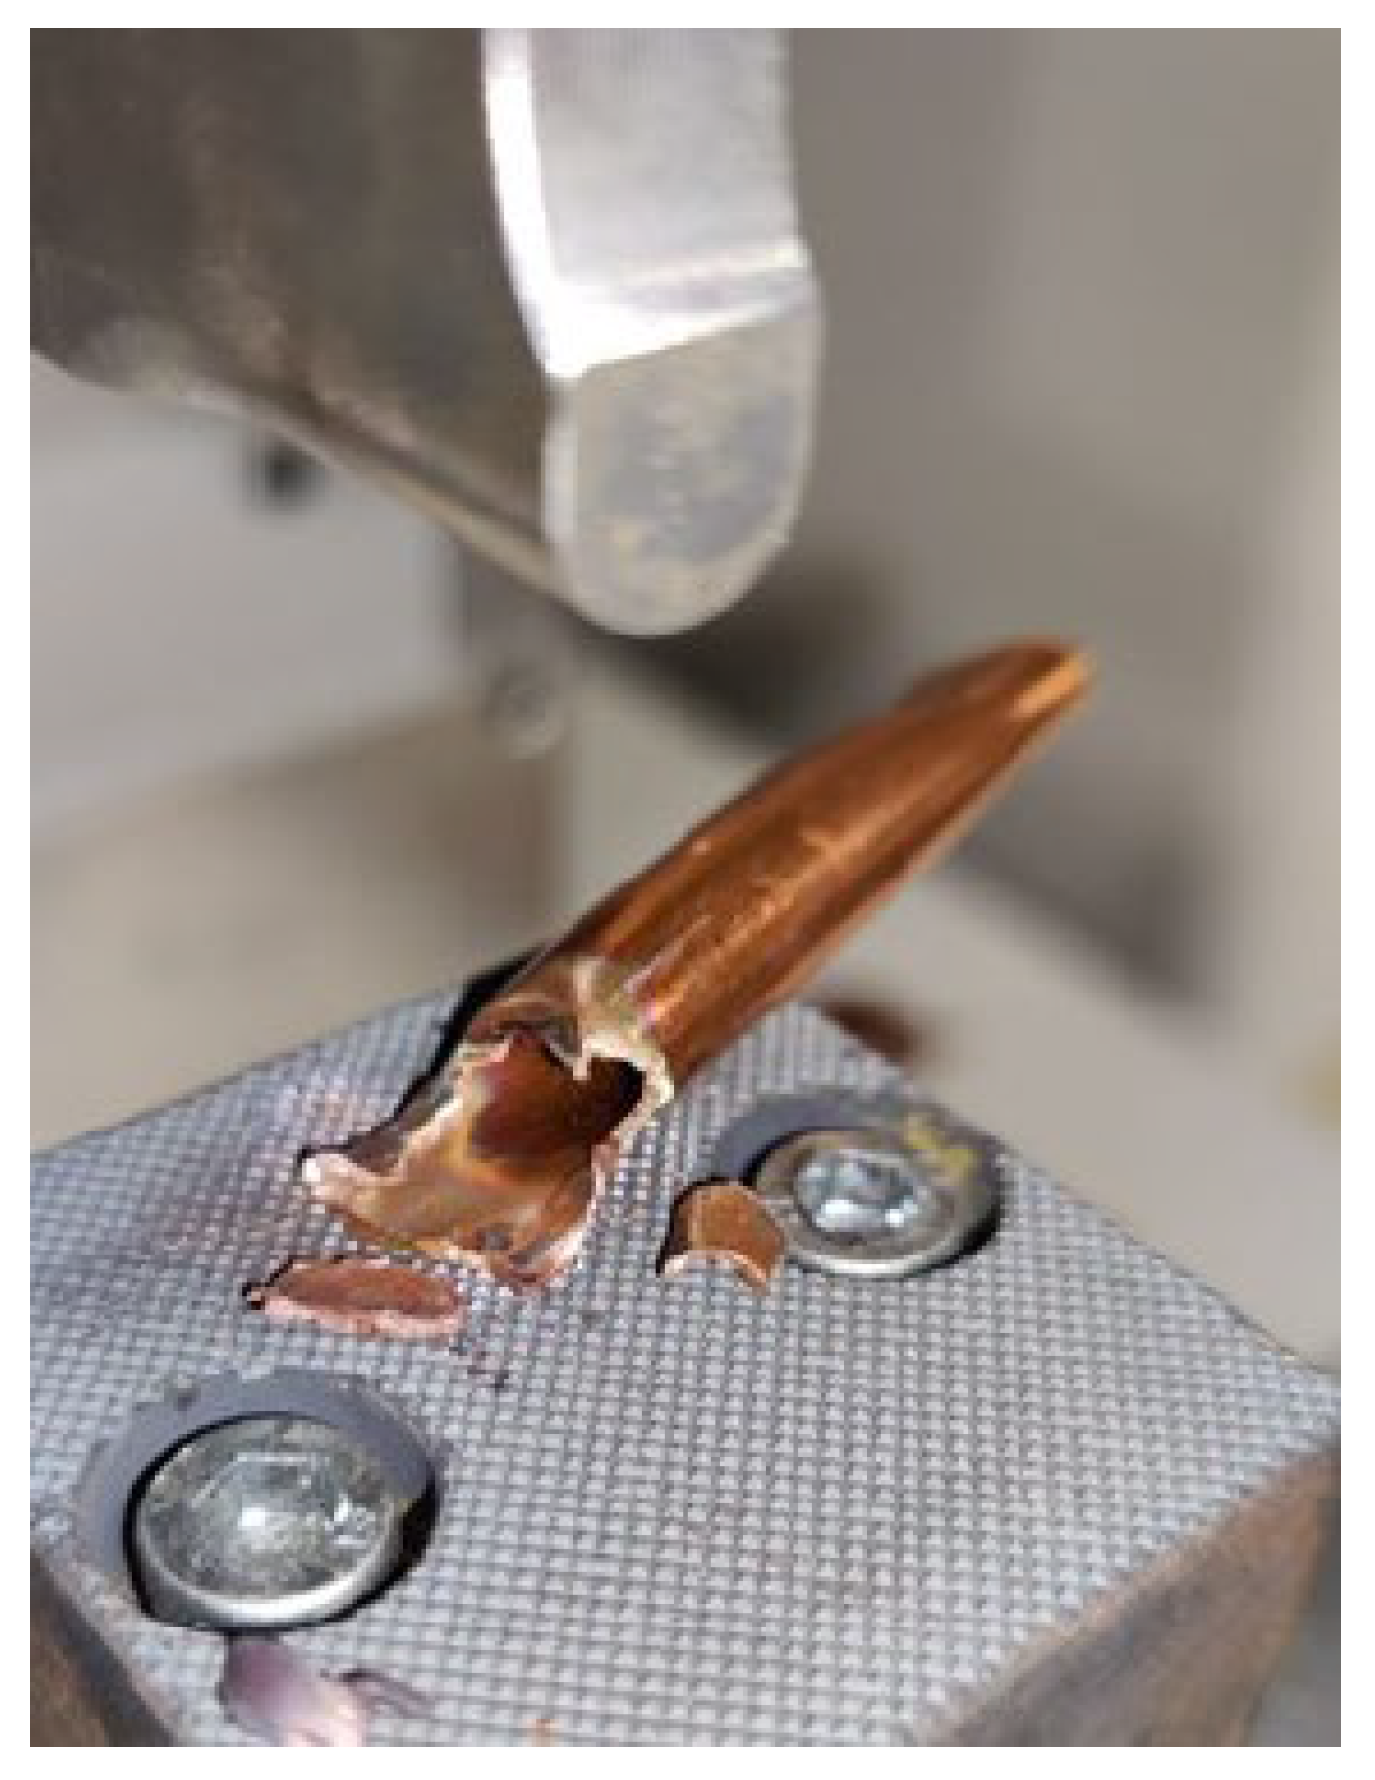
Pressures of 0.5 bar and 1.5 bar proved insufficient for both 5 s and 7 s periods, as none of the tubes were sealed. In the case of weld T5P1.5, the results were inconsistent with no repeatability. Some of the tubes fractured during the welding process. Sample T7P1.5 confirms that moderate pressures over an extended period cause defects in the welds. The prolonged exposure of the tube wall to vibrations and pressure leads to fracturing.
Figure 16 shows tube T7P1.5 during the welding process.
Finally, samples T5P3 and T7P3 were tested, but they showed highly unstable results. One of the T5P3 samples passed the leak test, but this result was not replicated. Regarding the T7P3 samples, although they appeared to be sealed, only a few of them passed the leak test. This suggests that this set of parameters, like the previous one, does not produce stable results.
Due to the limited number of satisfactory results, welds were performed using parameters within the same range as the successful tests. The T2.5P4 samples, despite appearing to be sealed, did not pass the leak test. The T3P4 samples are sealed and passed the leak test. In contrast to the T3P4.5 samples (
Figure 15), these do not show a significant reduction in thickness, making them more resistant.
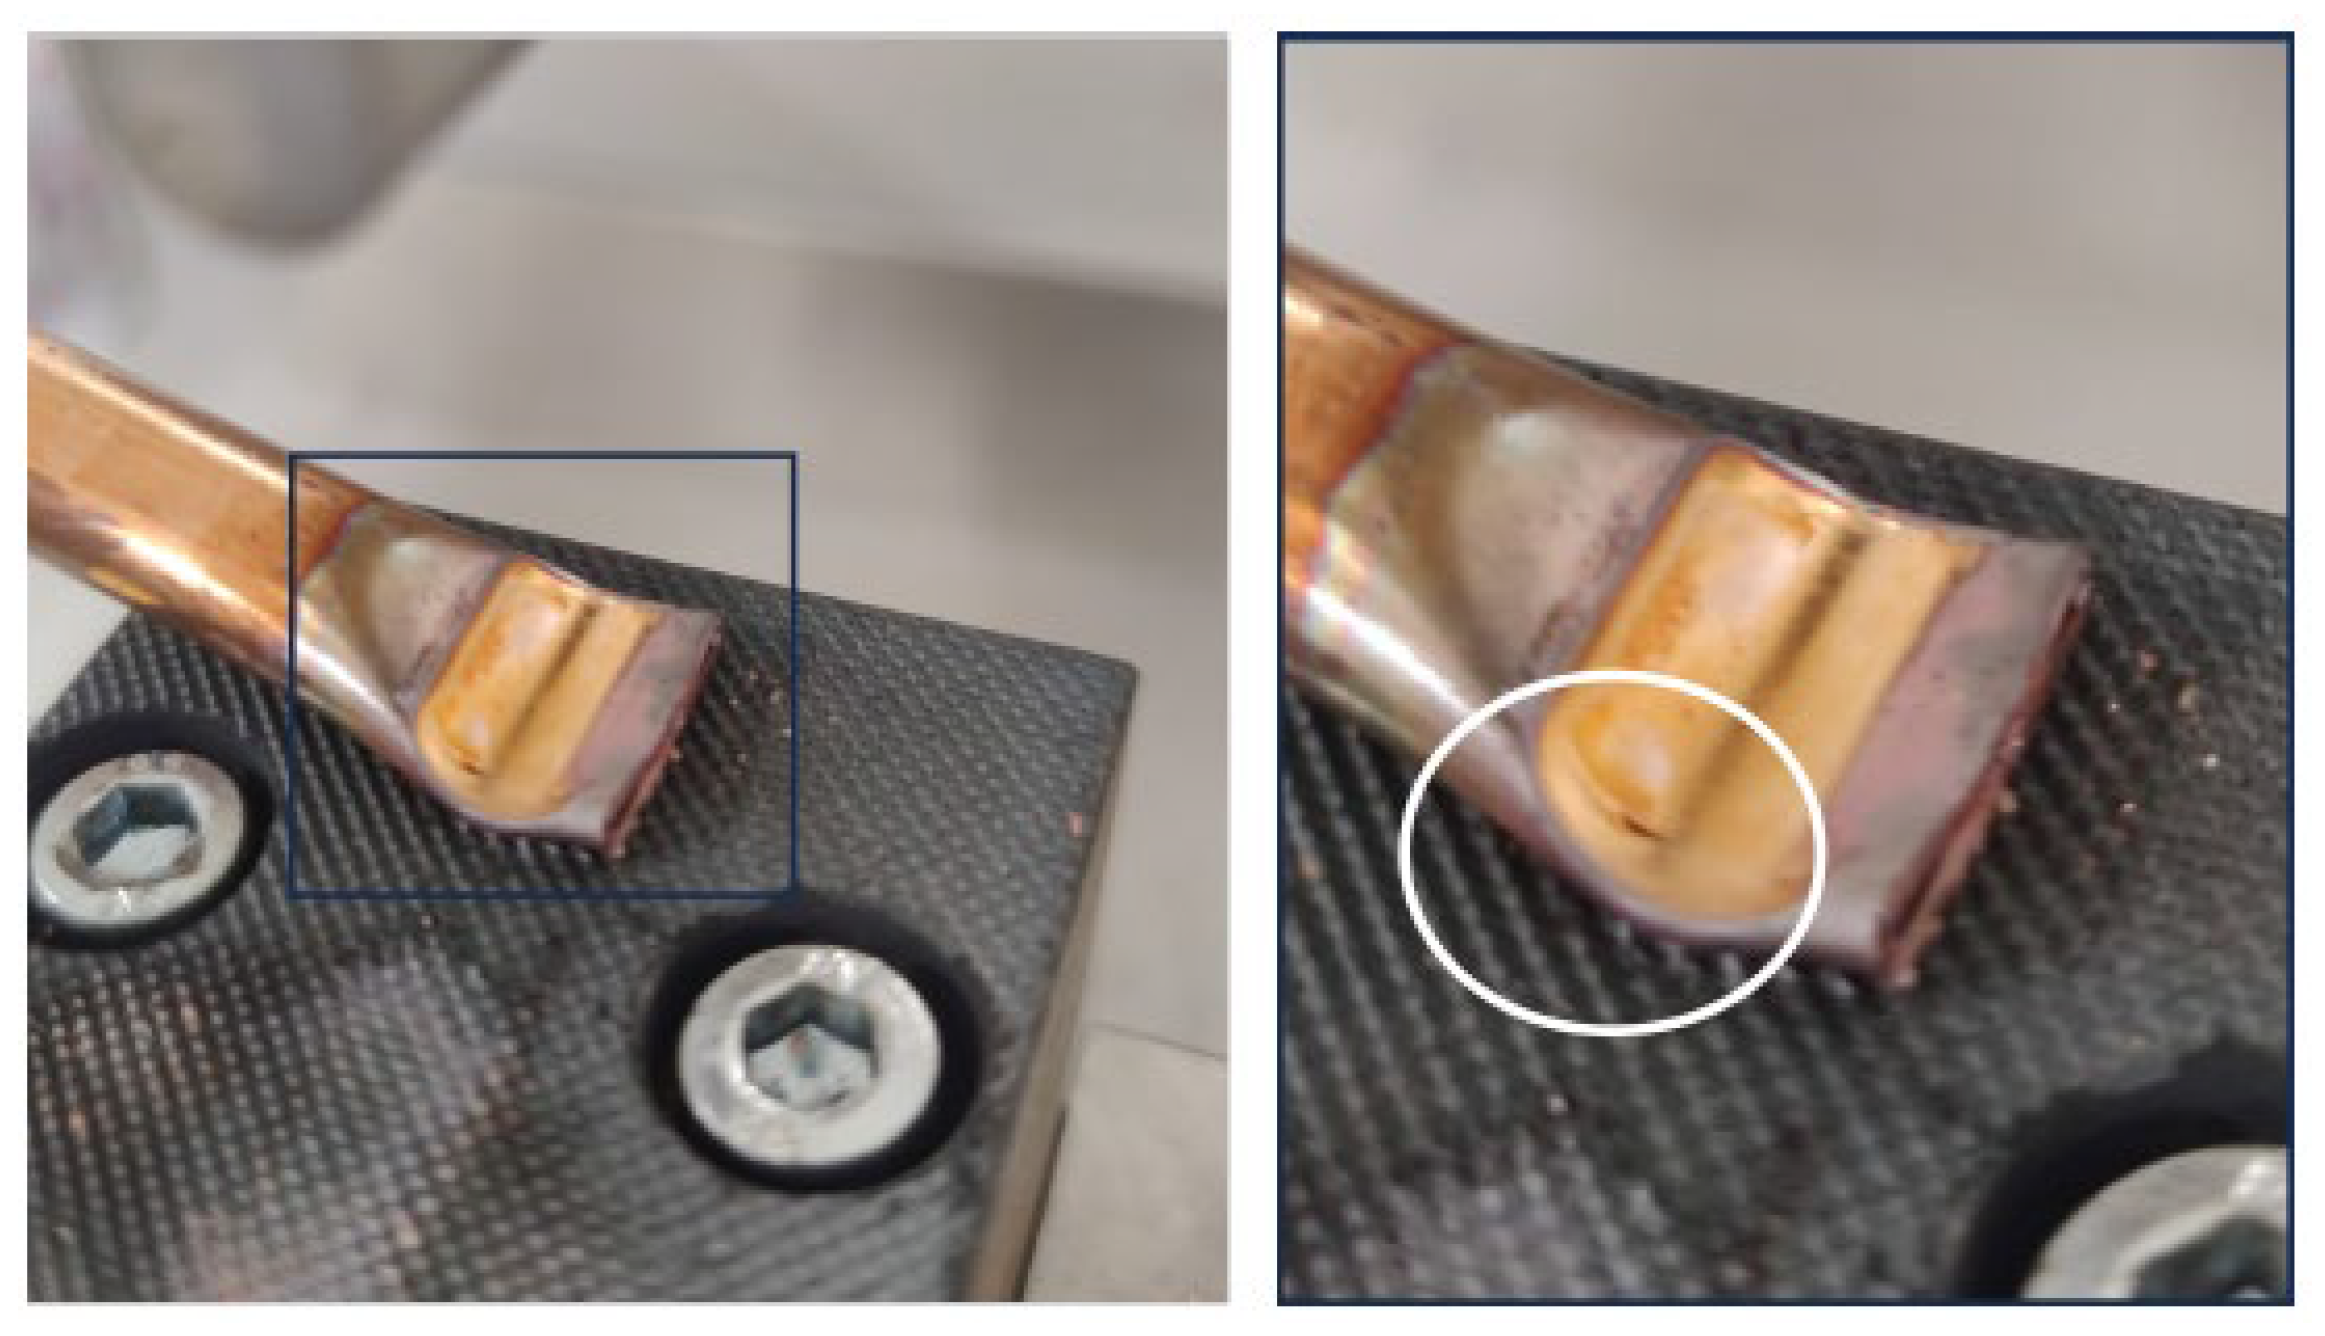
The combination of a 3 s time and a pressure of 3.5 bar proved to be sufficient to seal the tubes. However, if the time is increased to 3.5 s while keeping the pressure at 3.5 bar, fissures form during the welding process, as illustrated in
Figure 17.
Increasing the time to 4 s while keeping the pressure at 3 bar resolves this issue, even though the marks left by the sonotrode suggest this is a borderline situation. Maintaining 3.5 s and increasing the pressure to 4 bar successfully sealed the tube. However, during the leak test, one of the samples folded. This situation occurred with all samples welded using a time of 4 s and a pressure of 4 bar. This suggests that, despite being sealed, the welds are not sufficiently robust, as they easily fold under force when the tube is tightened in the leak test tool (
Figure 18).
Finally, with 4 s and 3 bar, the tubes were not sealed. This aligns with the results presented earlier, confirming that 3 bar is an insufficient pressure, regardless of the applied time.
Table 2 presents the results of all tests.
3.3. Macroscopy
Sheets
For macroscopic analysis, samples T3P6 and T5P1.5 were selected.
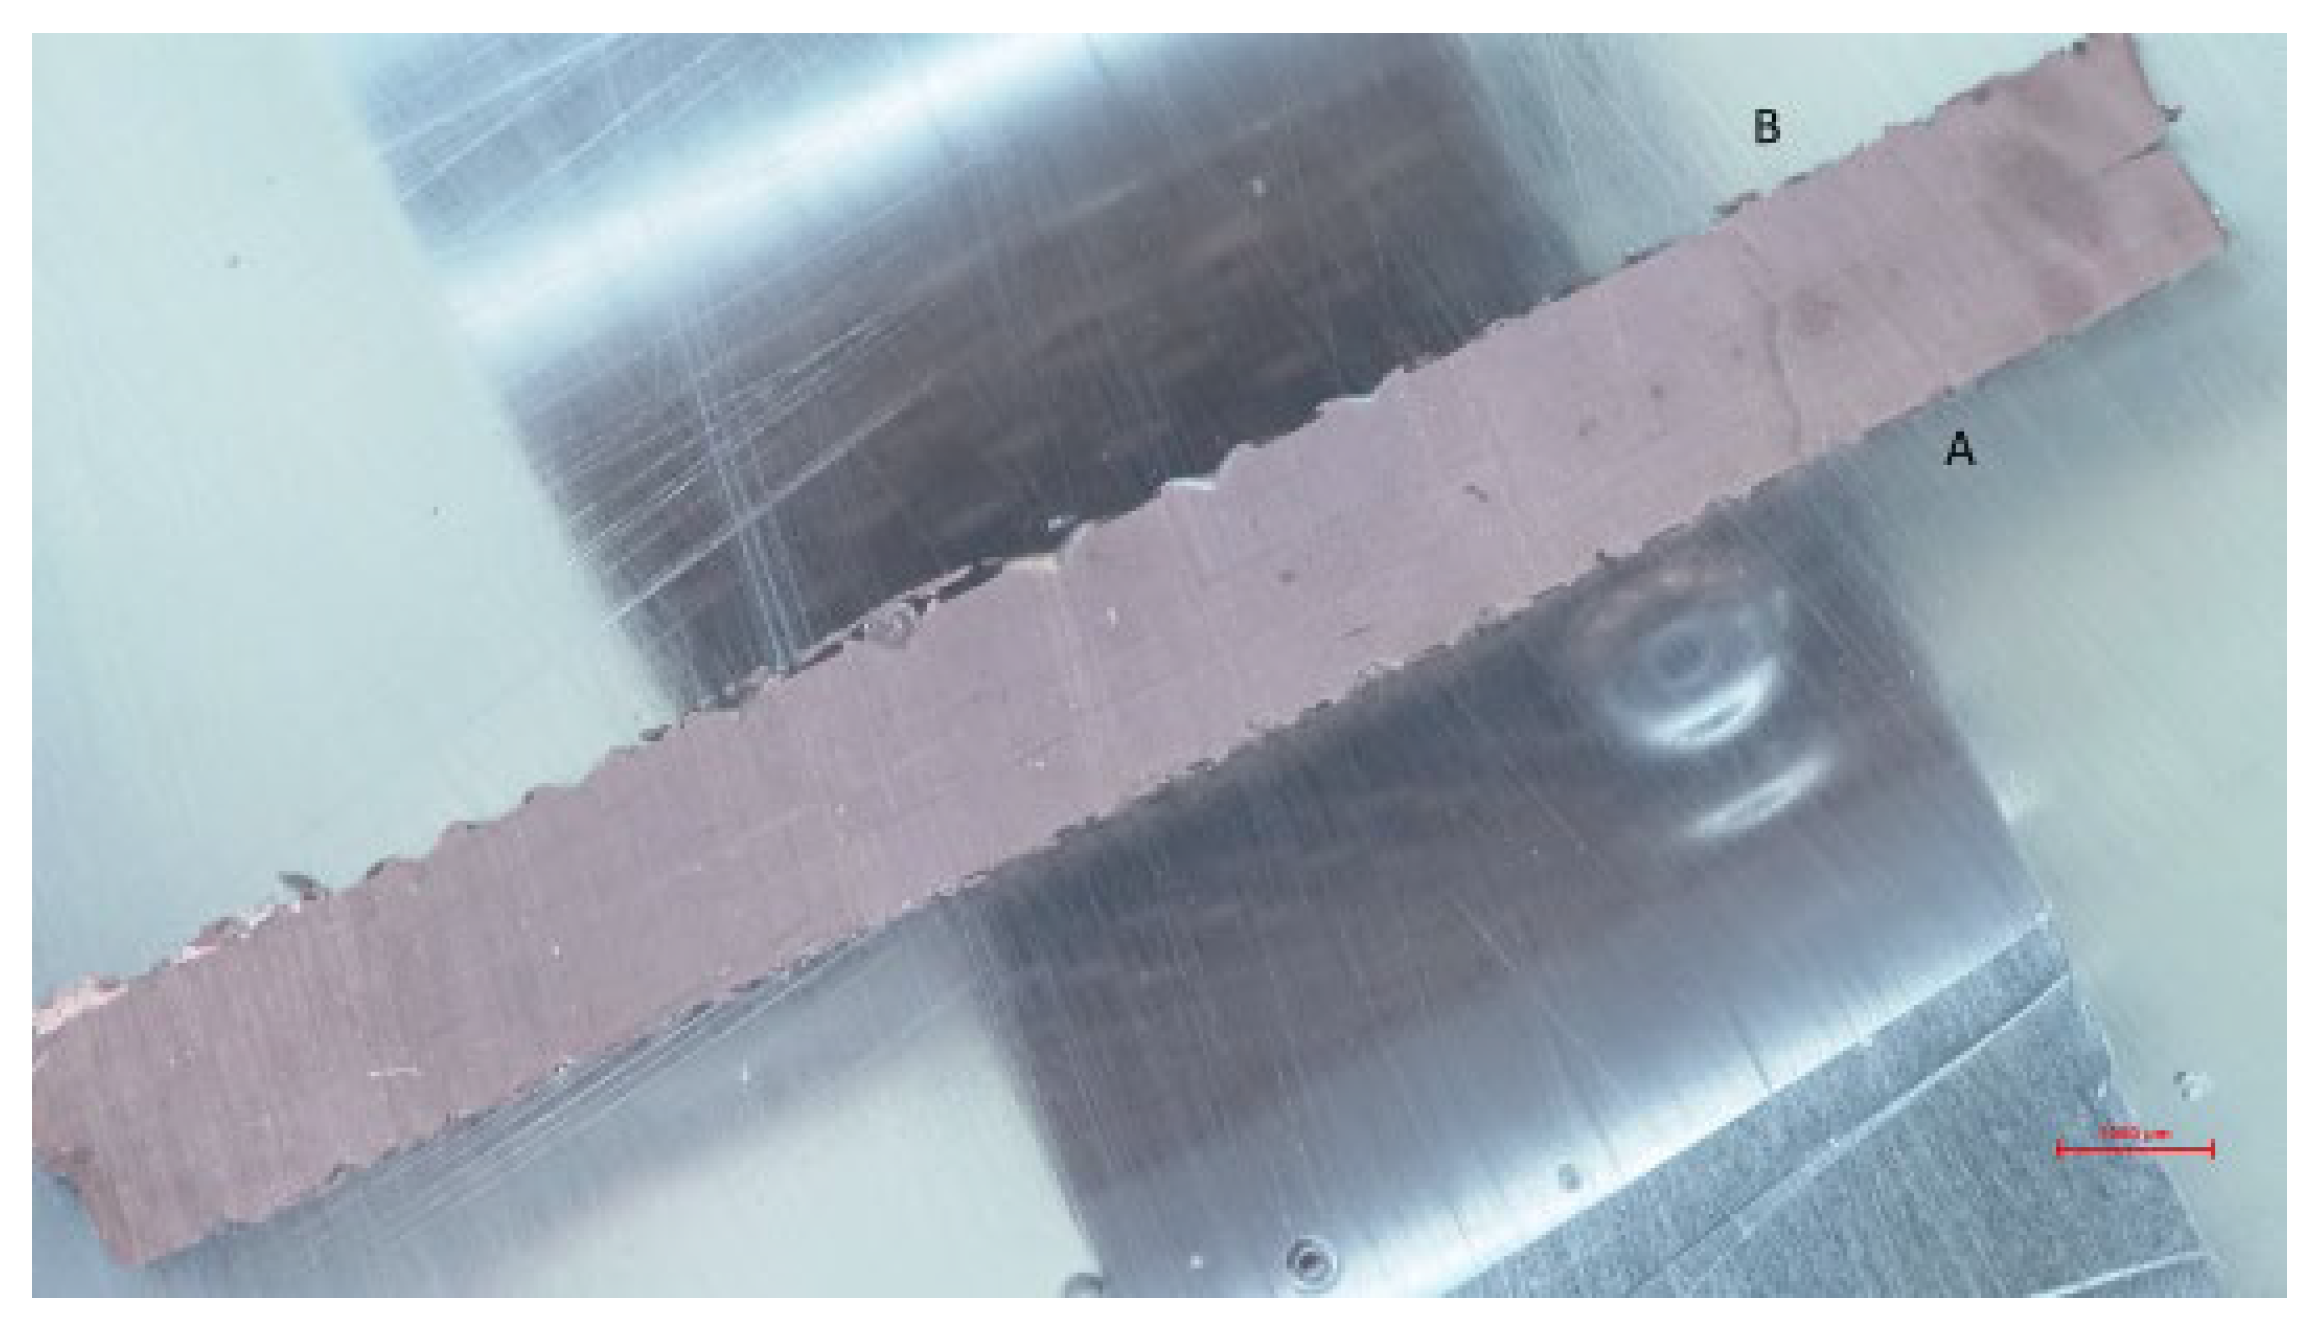
Figure 19 illustrates the macrography of sample T3P6, which showed better performance in the tensile test. The joining of the material along the entire seam is notable, indicating an effective weld.
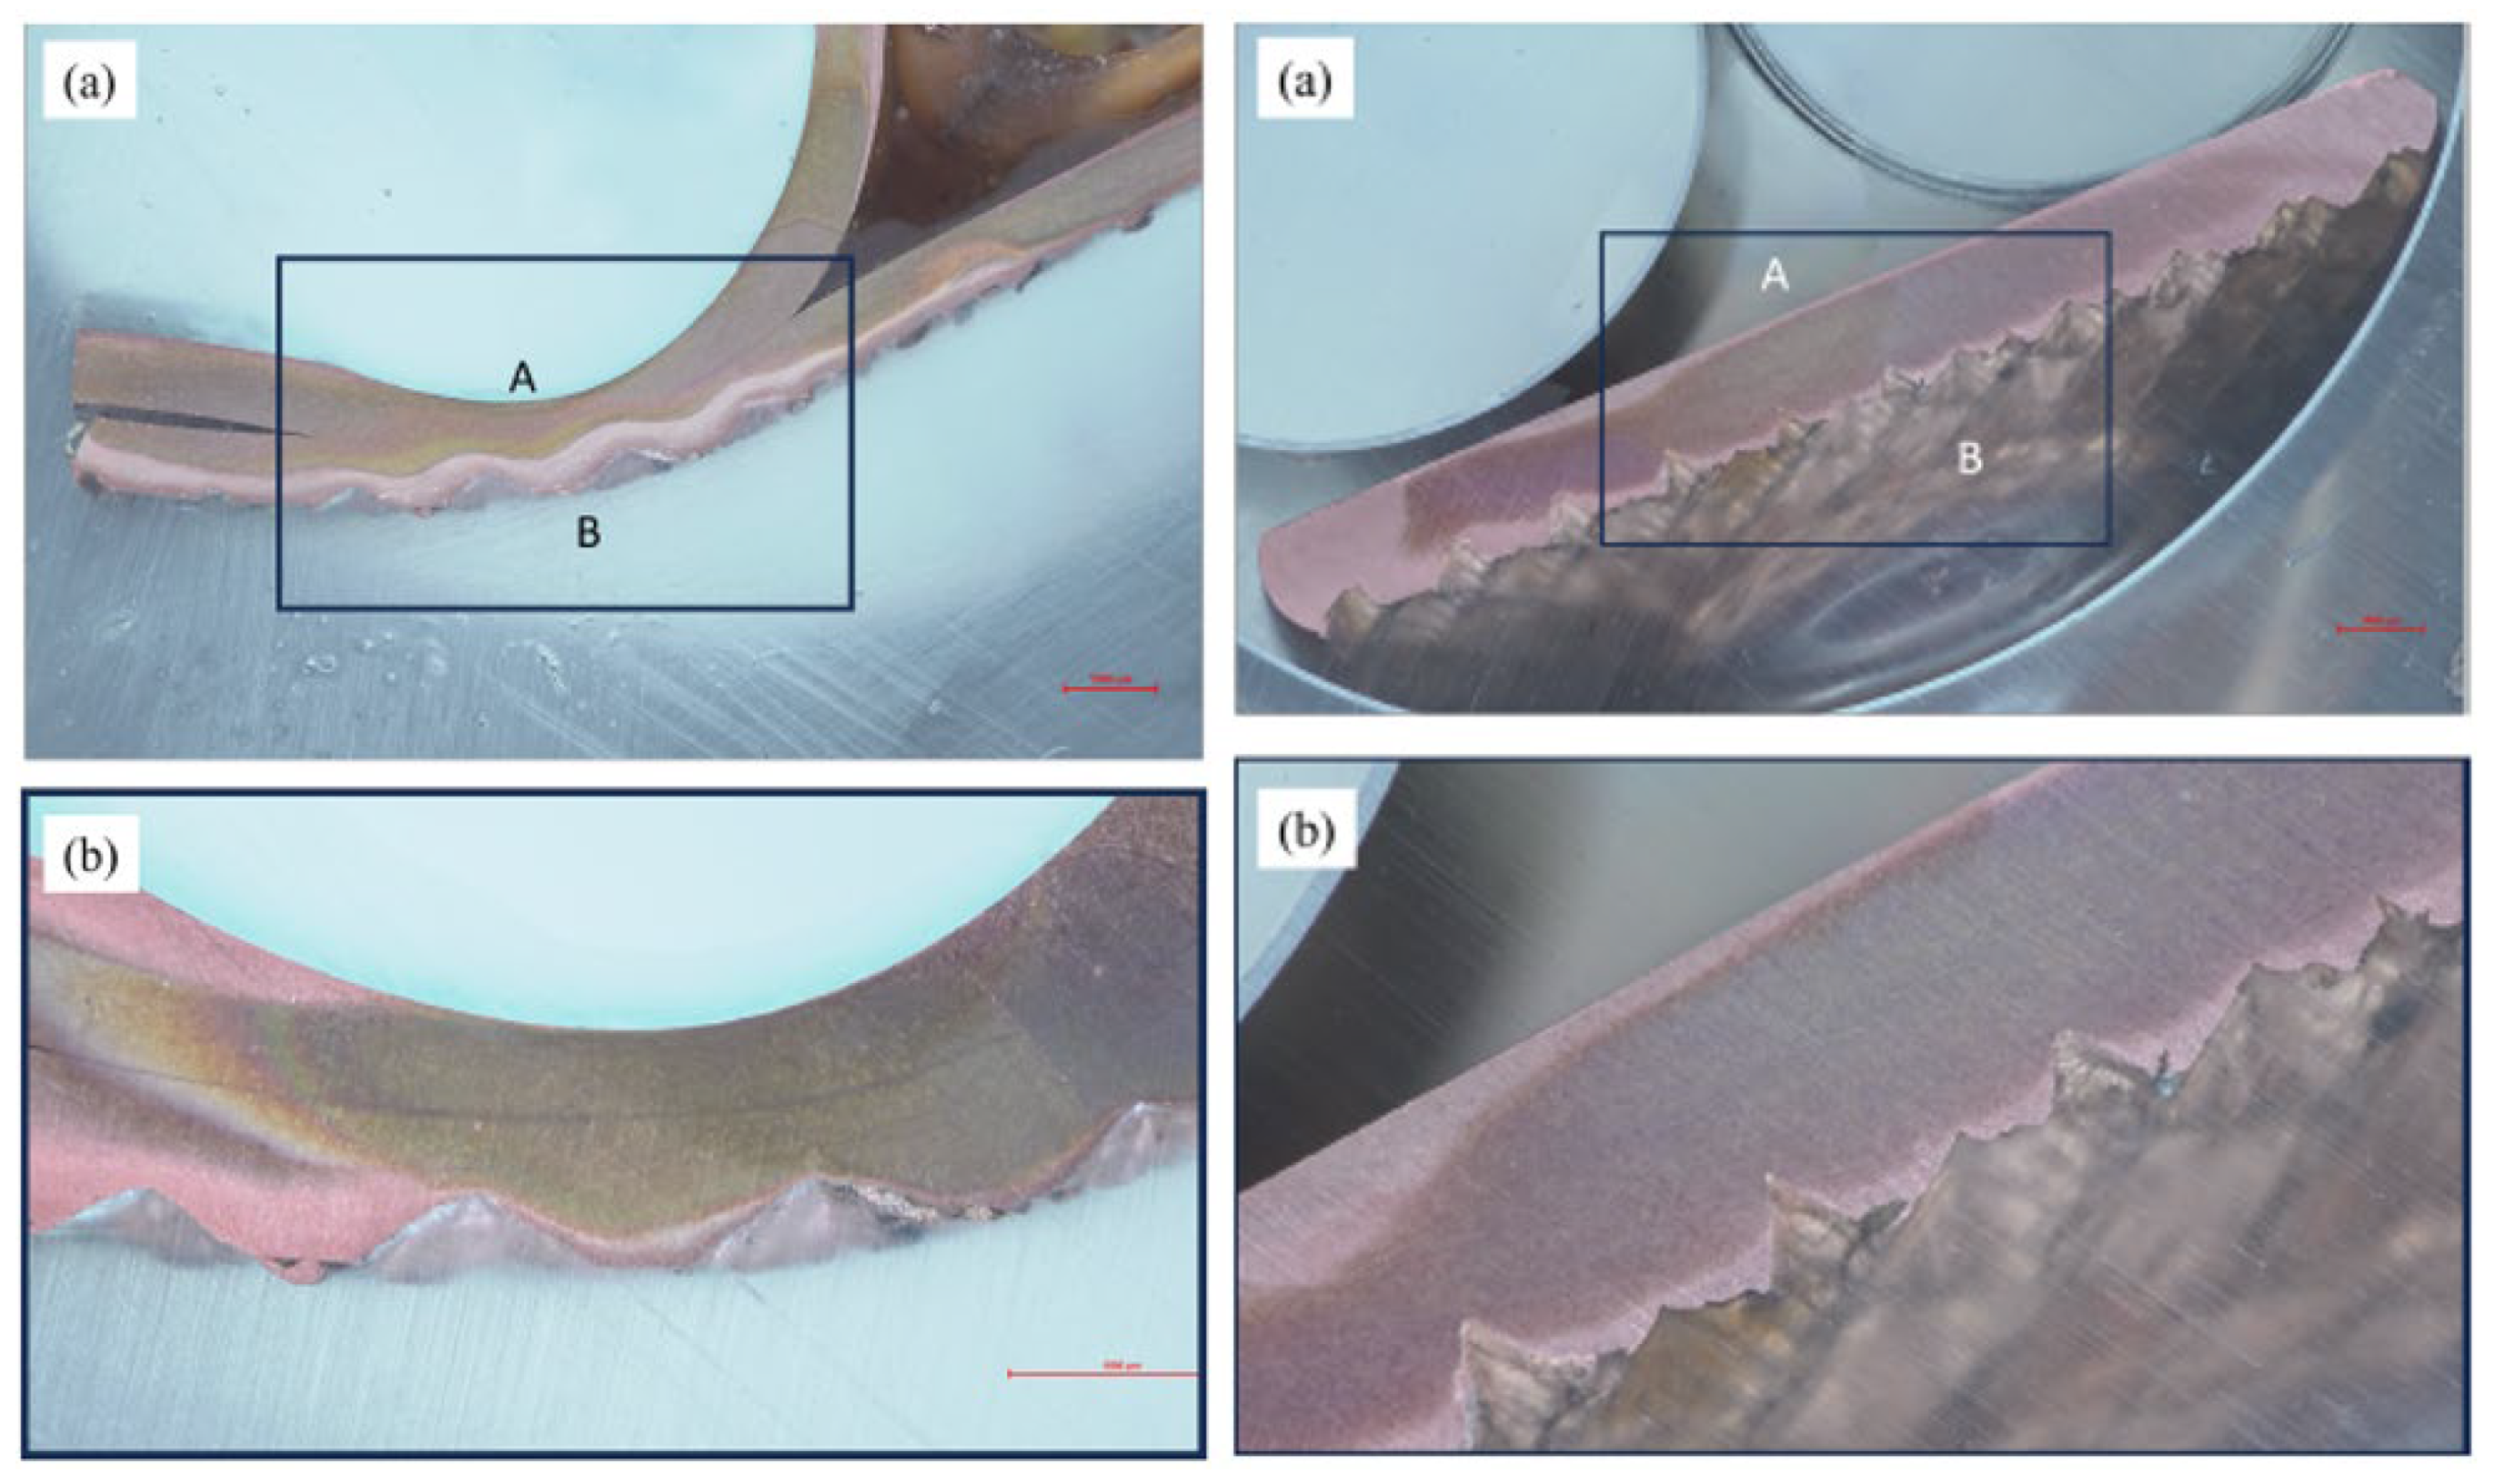
In sample T5P1.5, as shown in
Figure 20 (a), which was not subjected to tensile testing, the welding was incomplete, revealing a region where the two sheets remain distinct. In the same area, illustrated in
Figure 20 (b), the presence of welded islands is notable, indicating spots where the sheets were joined intermittently.
Tubes
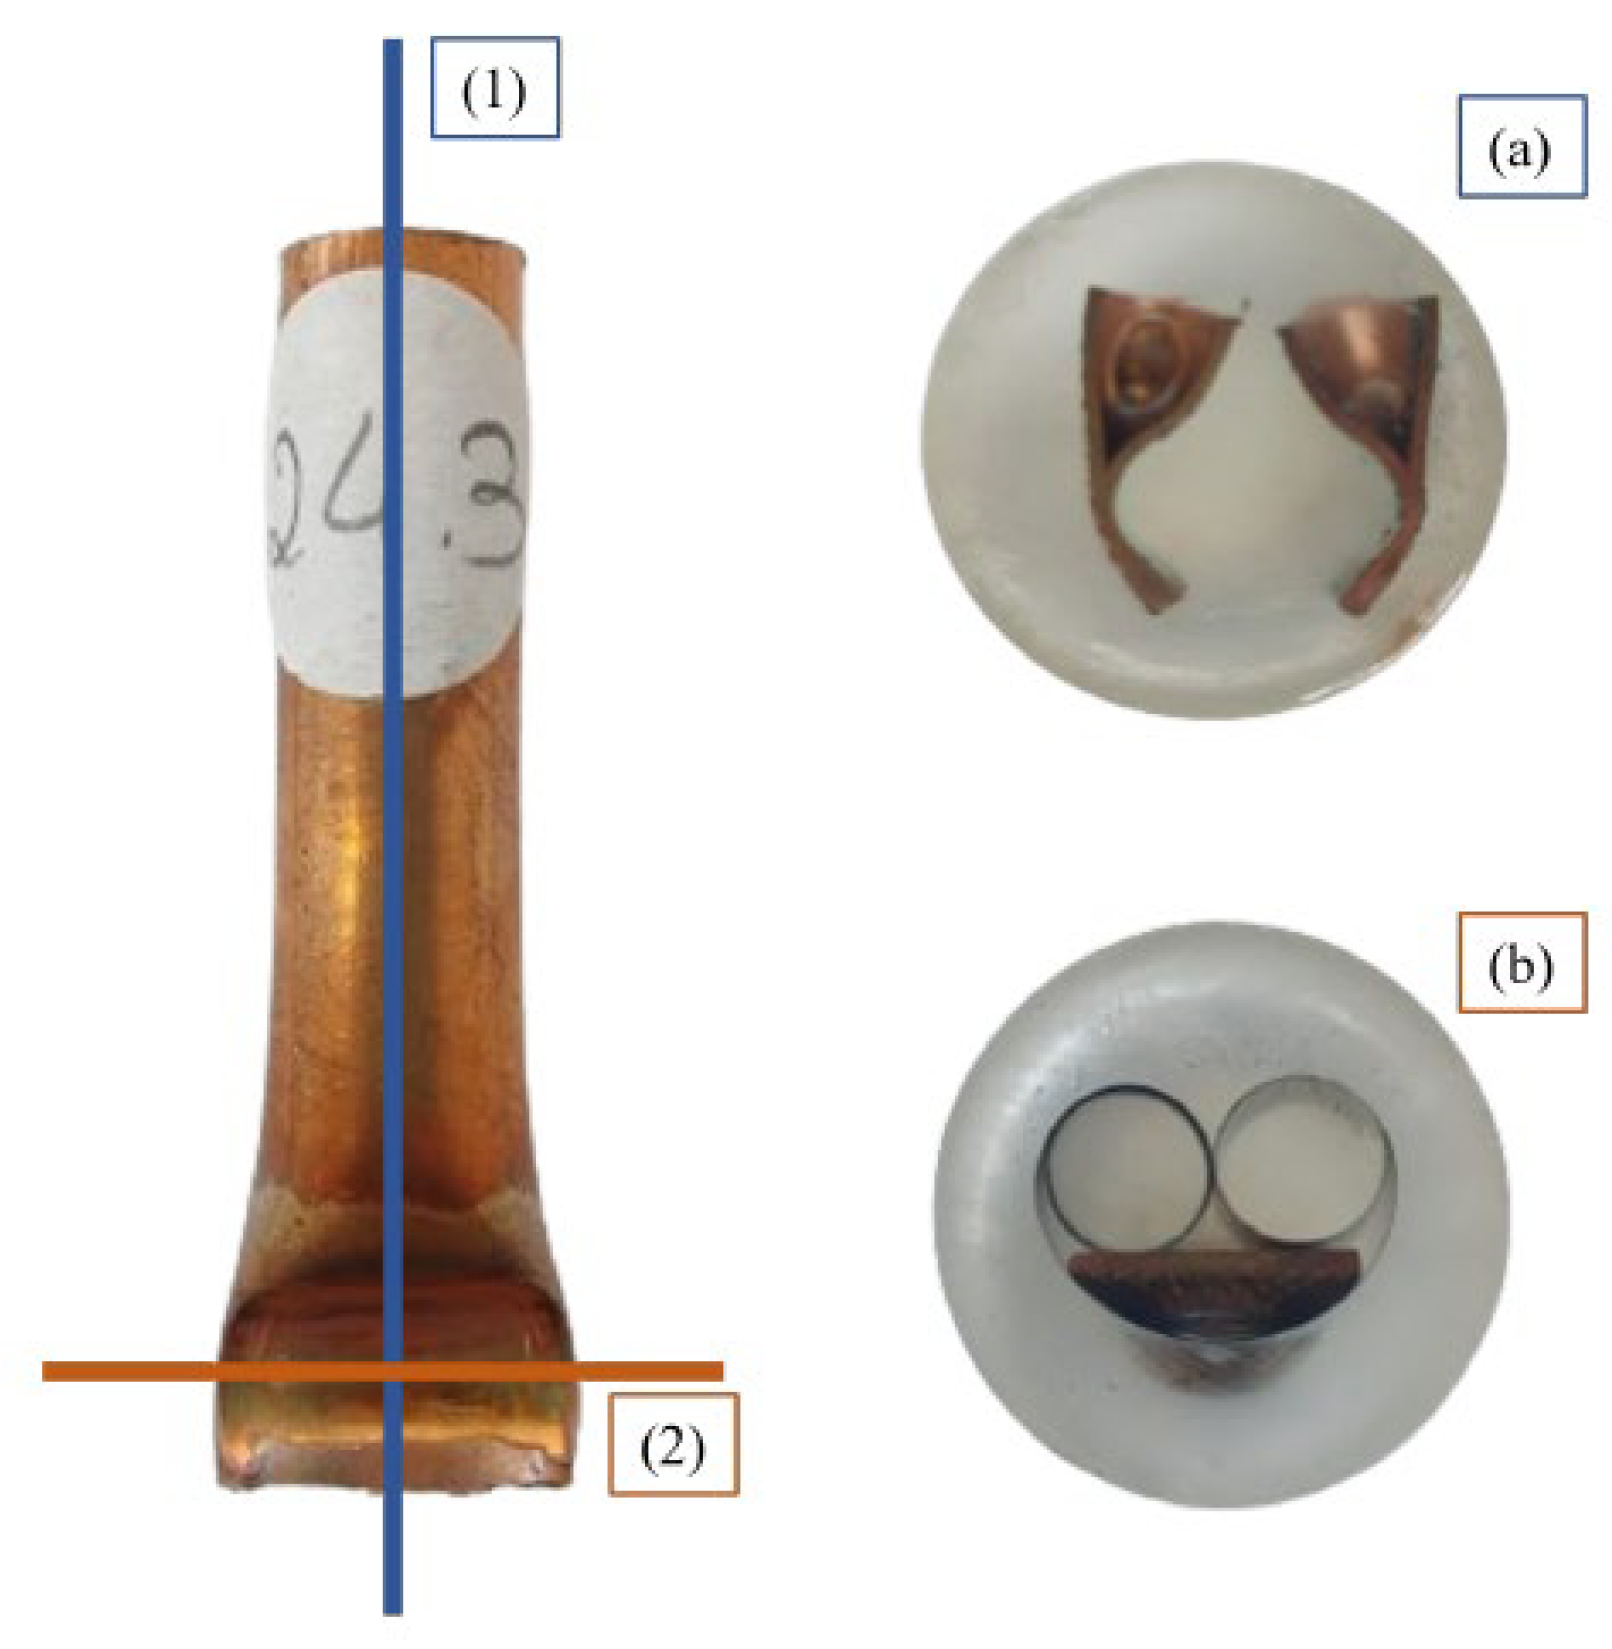
Next, macroscopic analyses of samples T3P4 are presented (
Figure 21). These samples were selected because, in addition to passing the leak test, they also appear to have the strongest welds. Two samples were used for this case. In one sample, a longitudinal cut was made, and the macroscopy of one half is presented in
Figure 21. It is possible to observe the line that divides the two tube walls. No defects are observed. The second sample was cut transversally, and its macroscopy is presented in
Figure 21. In this case, the line that divides the two tube walls is not observed, appearing to be a continuous material, refuting the previous idea.
3.3. Microscopy
Microscopic analysis was performed on the welded sheet with the best results (T3P6), on the T3P4 tubes, and on the base material for comparison.
Tubes
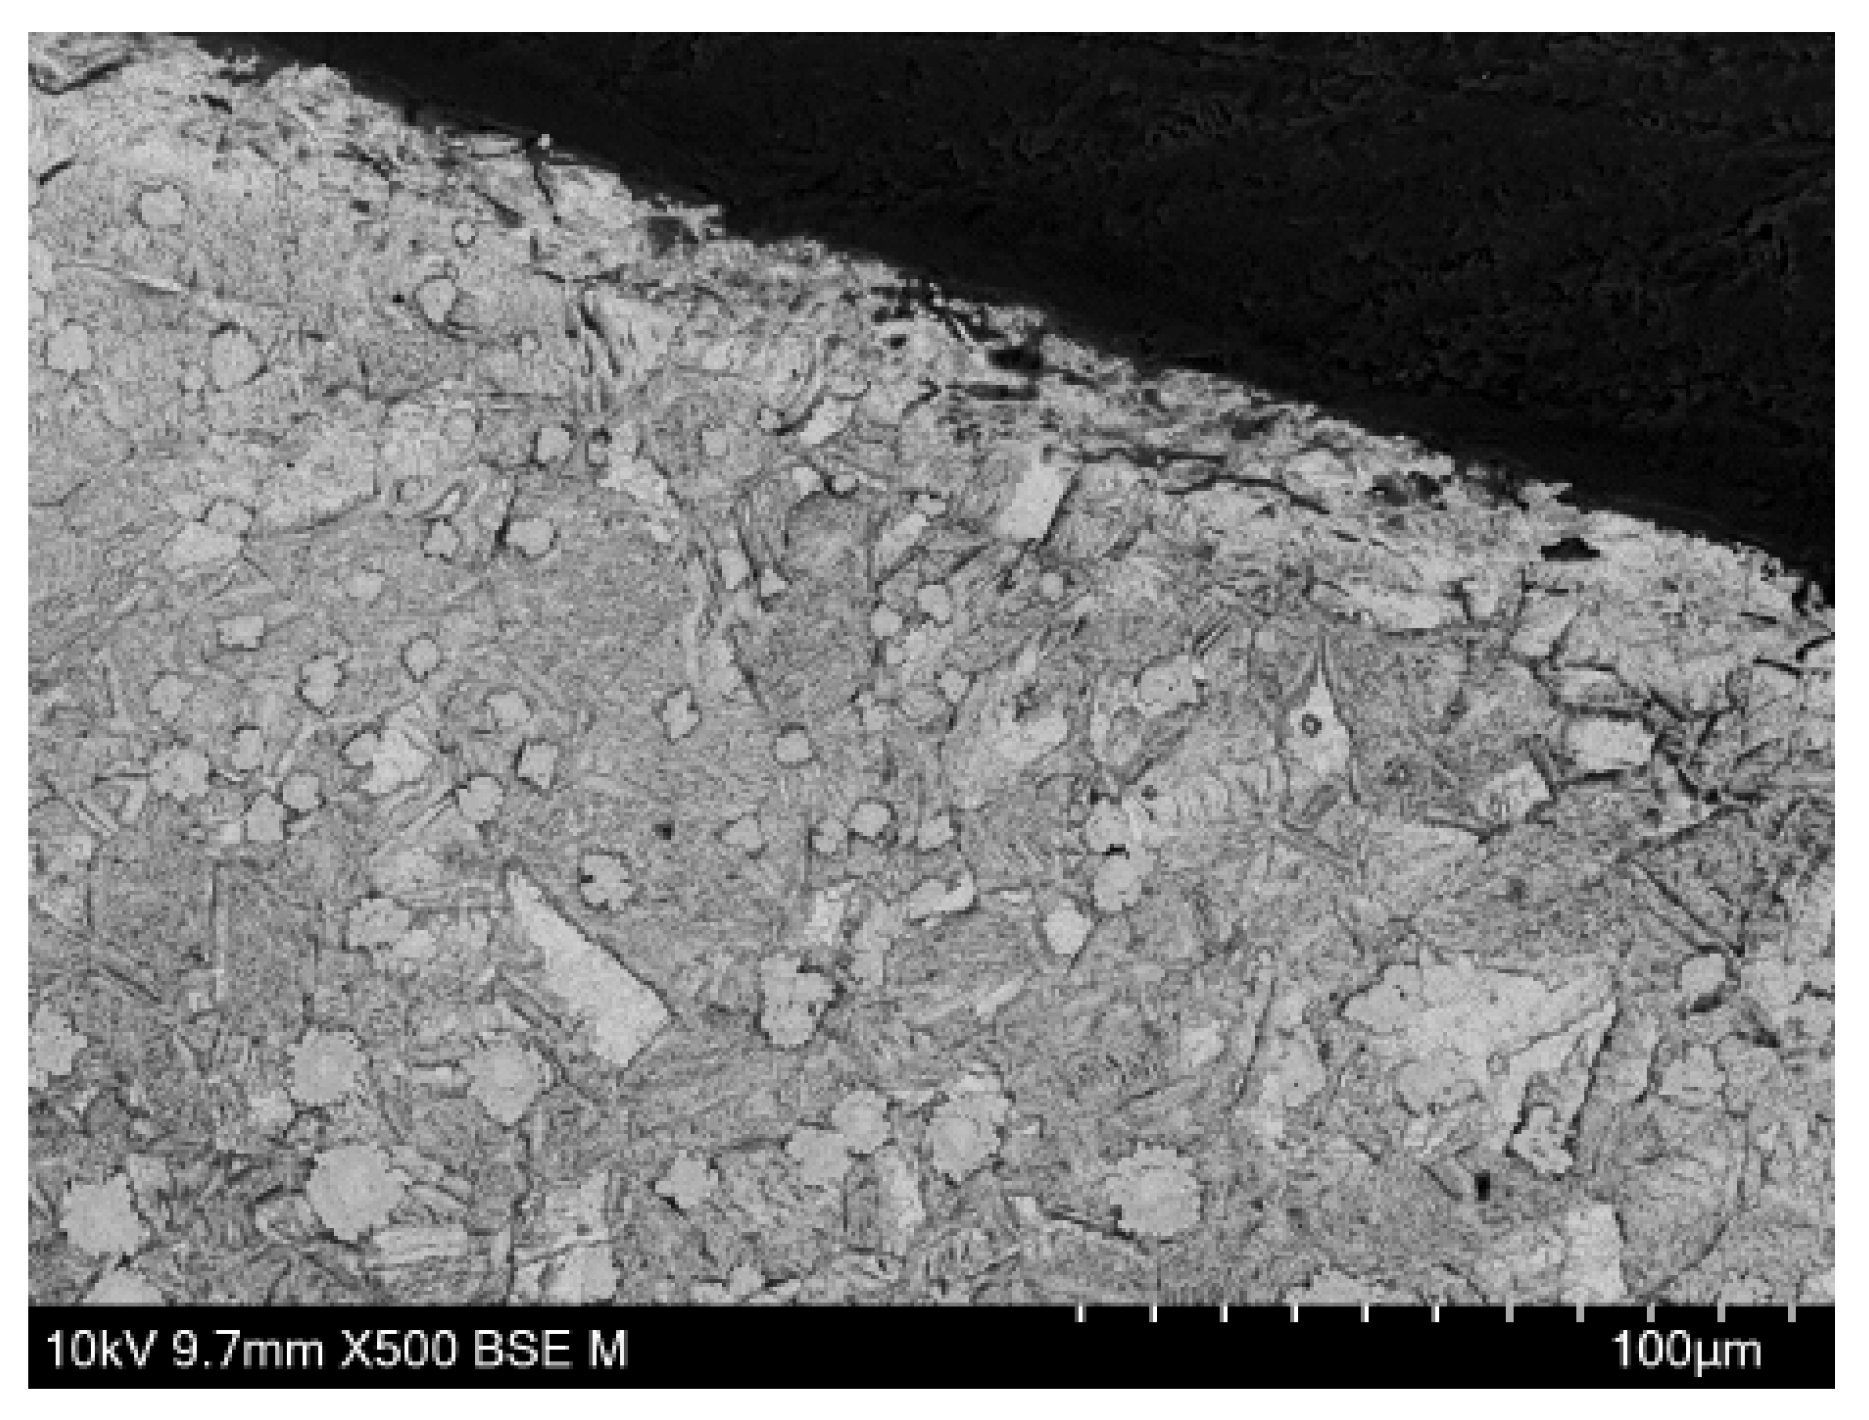
In
Figure 22, microscopy of the base material of the tubes is presented. Upon analysis, it is noticeable that the grain size is around 10 μm.
Interpreting the EDS analysis performed on the base material, the presence of elements from chemical etching is evident. The presence of copper chloride, for example, suggests that the exposure time of the sample to the chemical etchant should have been longer to ensure complete dissolution.
Sheet
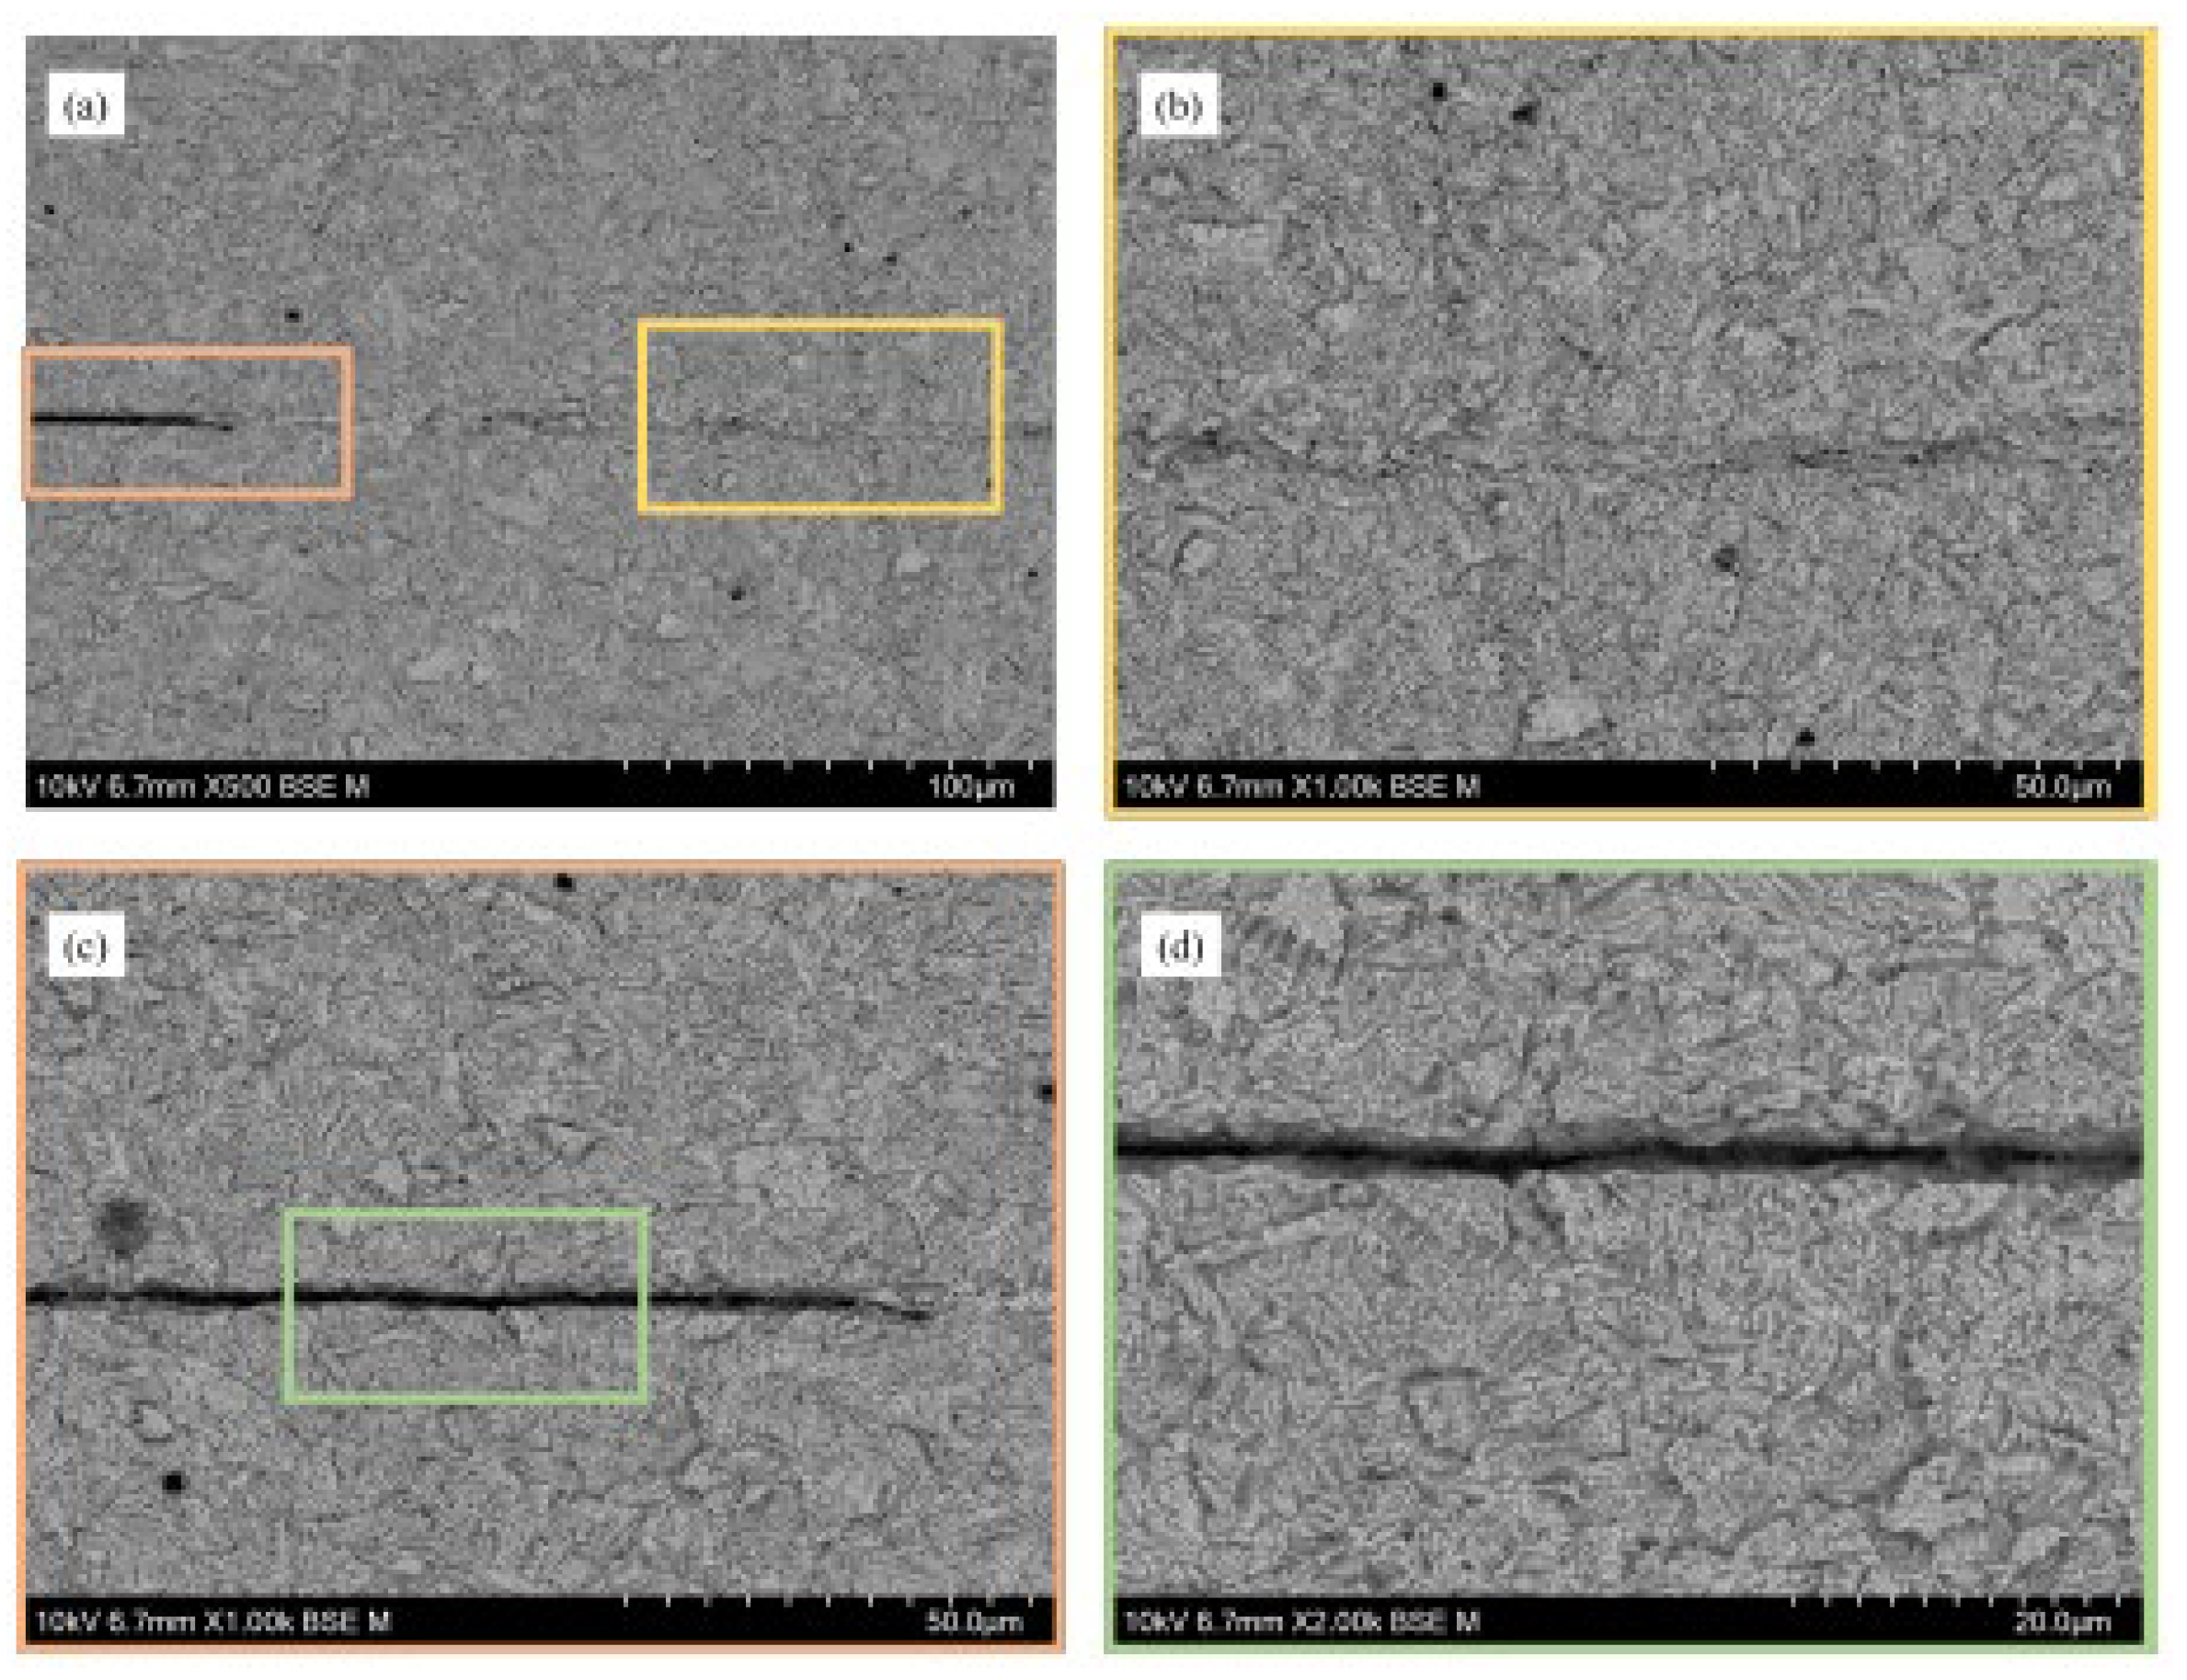
In Figure 23, microscopy of the T3P6 sheet is presented.
Examining
Figure 23, the line dividing the two sheets is noticeable. However, there are areas where this line is less distinct. In
Figure 23 (a), this difference in zones is evident. In the orange area, it is clear that the sheets are separated. In the yellow zone, they appear to be joined, although there doesn't seem to have been material fusion. The green area shows an enlargement of the non-welded zone, confirming that there was no material union. EDS analysis performed in the green area of
Figure 23 (d) confirms that the copper concentration is low, indicating no material bonding.
Additionally, EDS was conducted in the region of
Figure 23 (a) to compare the chemical composition of both locations. The results show that in the seemingly welded zone, there are indeed areas with higher copper concentration.
Tubes
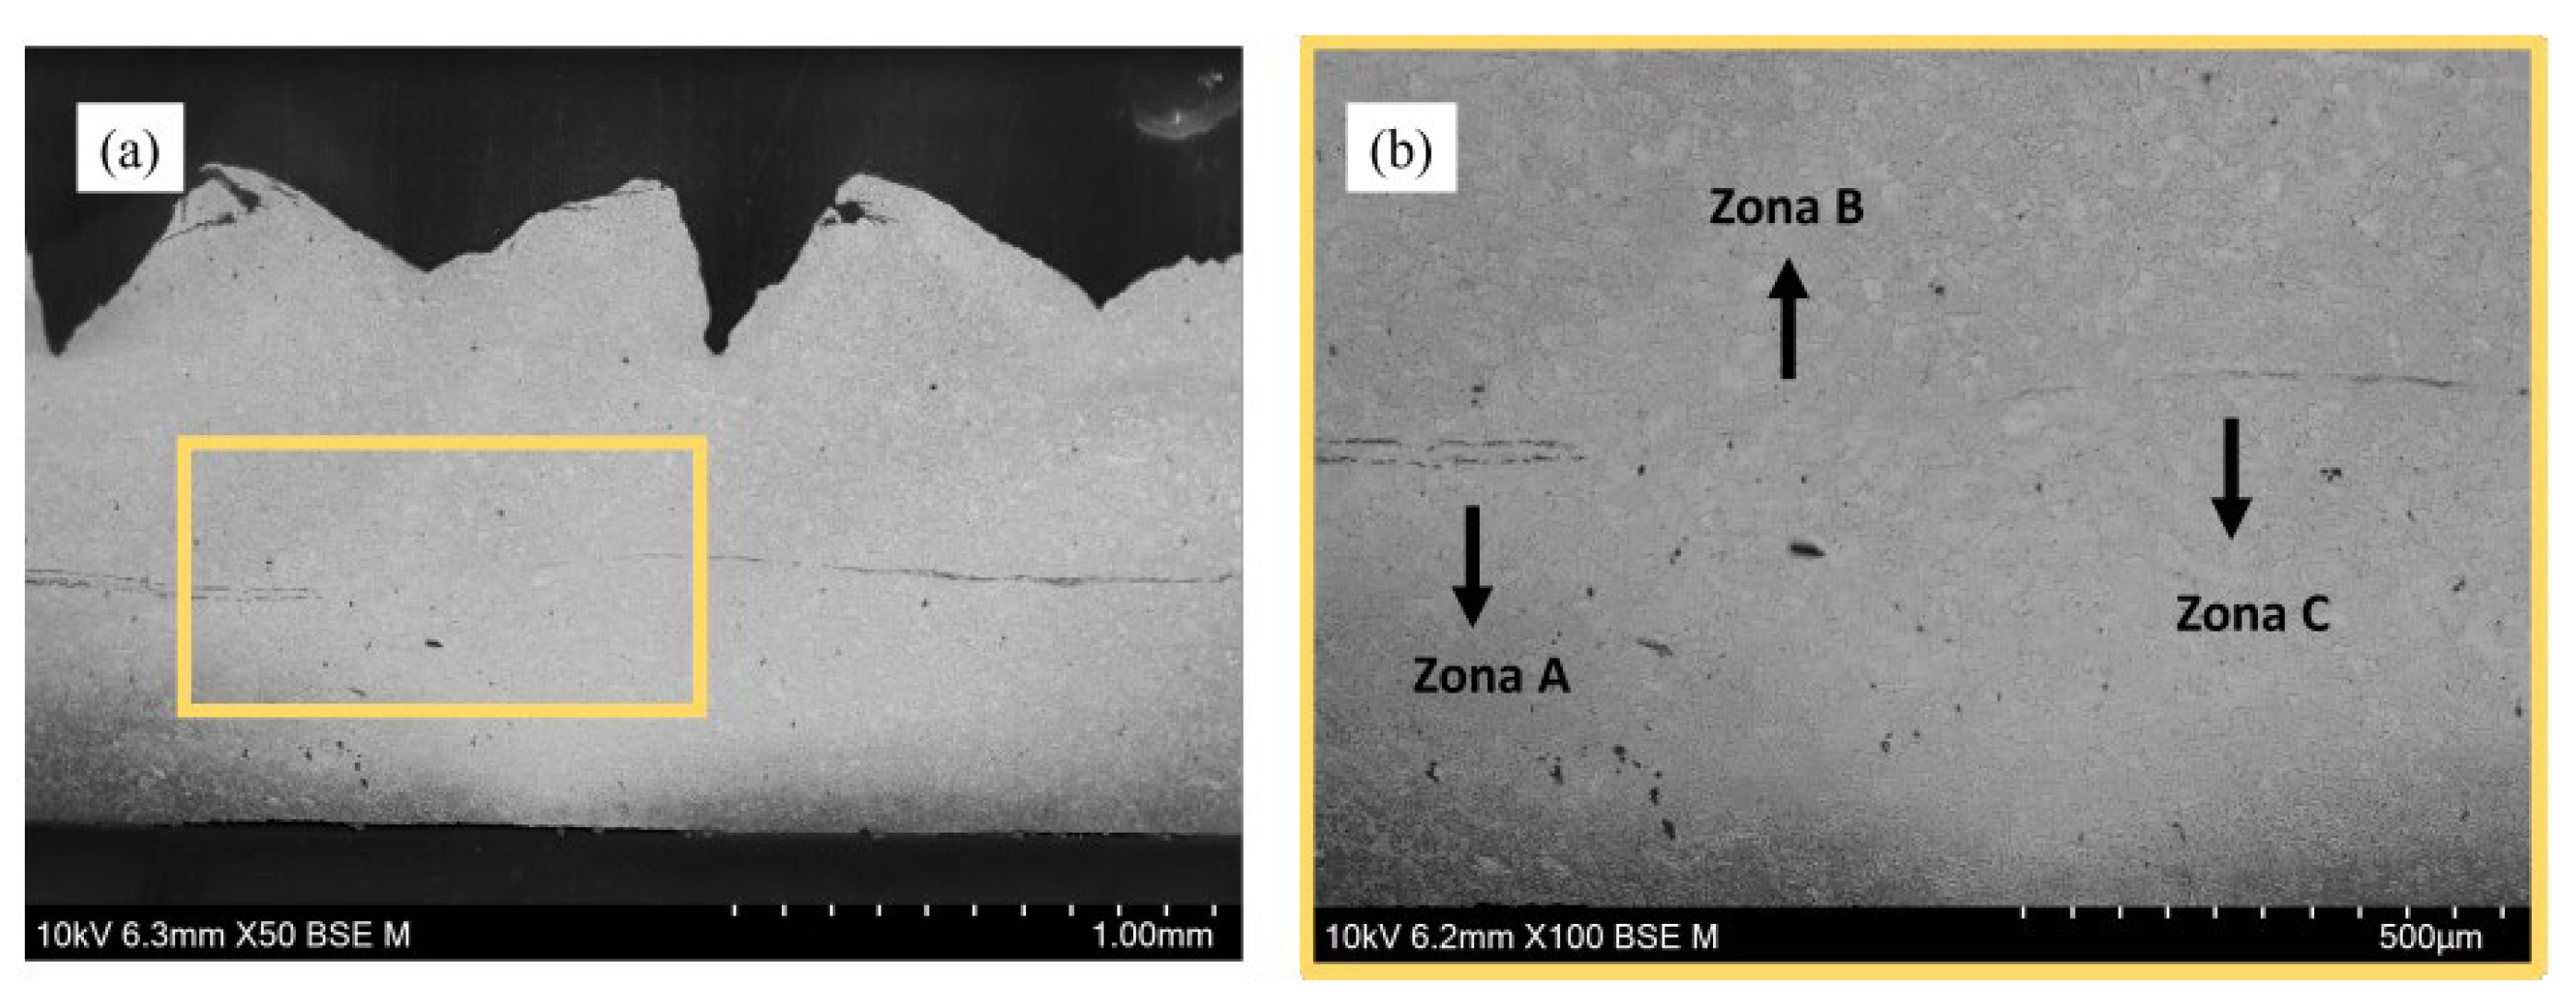
In
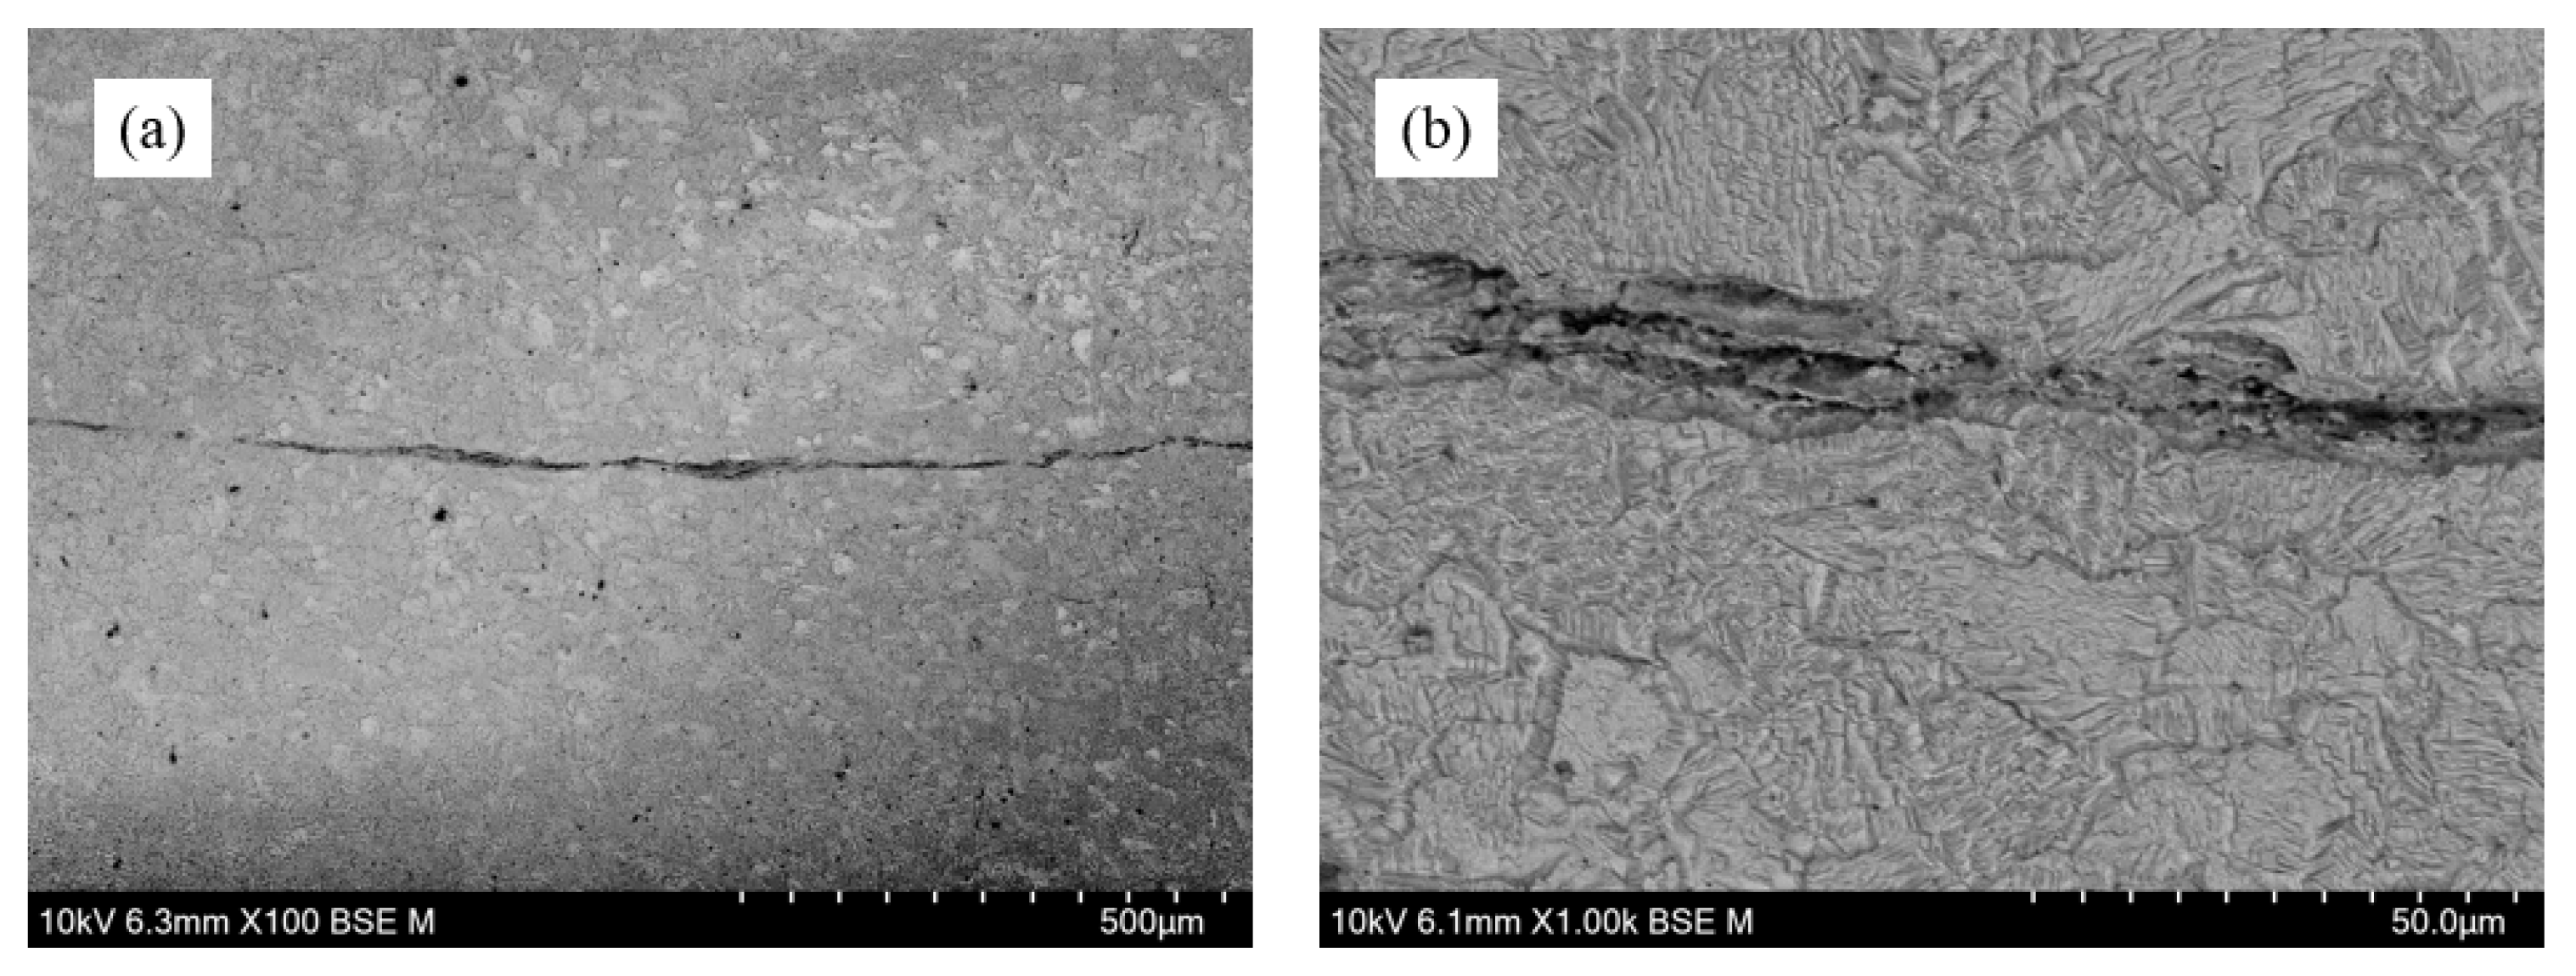
Figure 24, which shows the microscopic image of the tube, three distinct zones are clearly observable. The first zone, identified as Zone A, displays two visible lines. The second zone, designated as Zone B, does not exhibit any visible lines. Finally, the third zone, referred to as Zone C, shows only a single visible line.
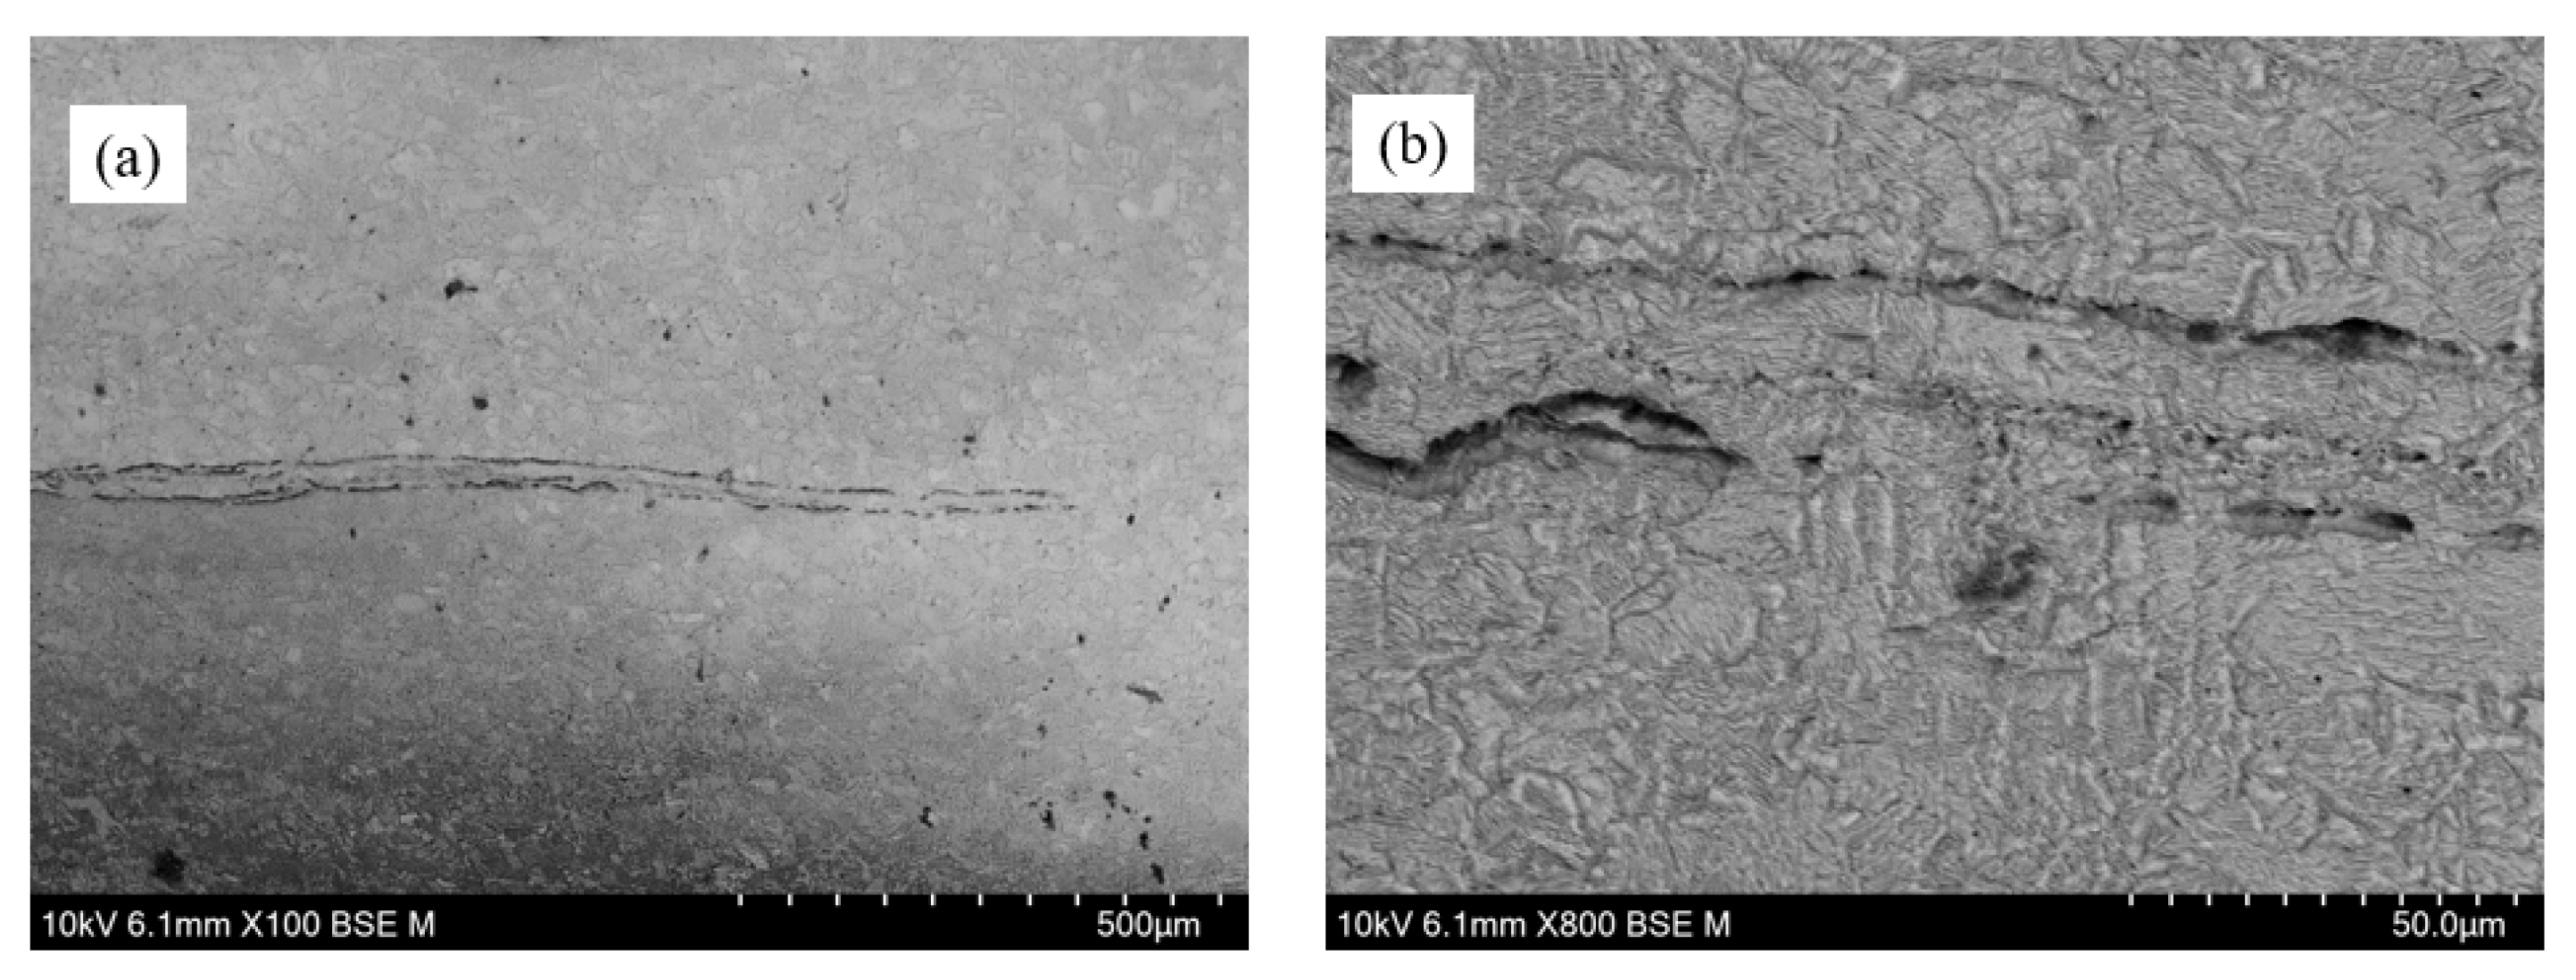
In the microscopic image presented in
Figure 25, zone A is shown where two distinct lines are visible. The tube has two walls to be welded, so it was expected that there would be only one line separating them. The presence of two lines could be the result of burrs between the two walls.
However, in
Figure 25 (b), areas are visible where material fusion appears to have occurred, suggesting that the fusion process started in that region. EDS analysis was conducted at this location, which showed that in the darker areas of the line, the percentage of copper is reduced, with oxygen and the chemicals used in the etching process (chlorine, iron, and carbon) predominating.
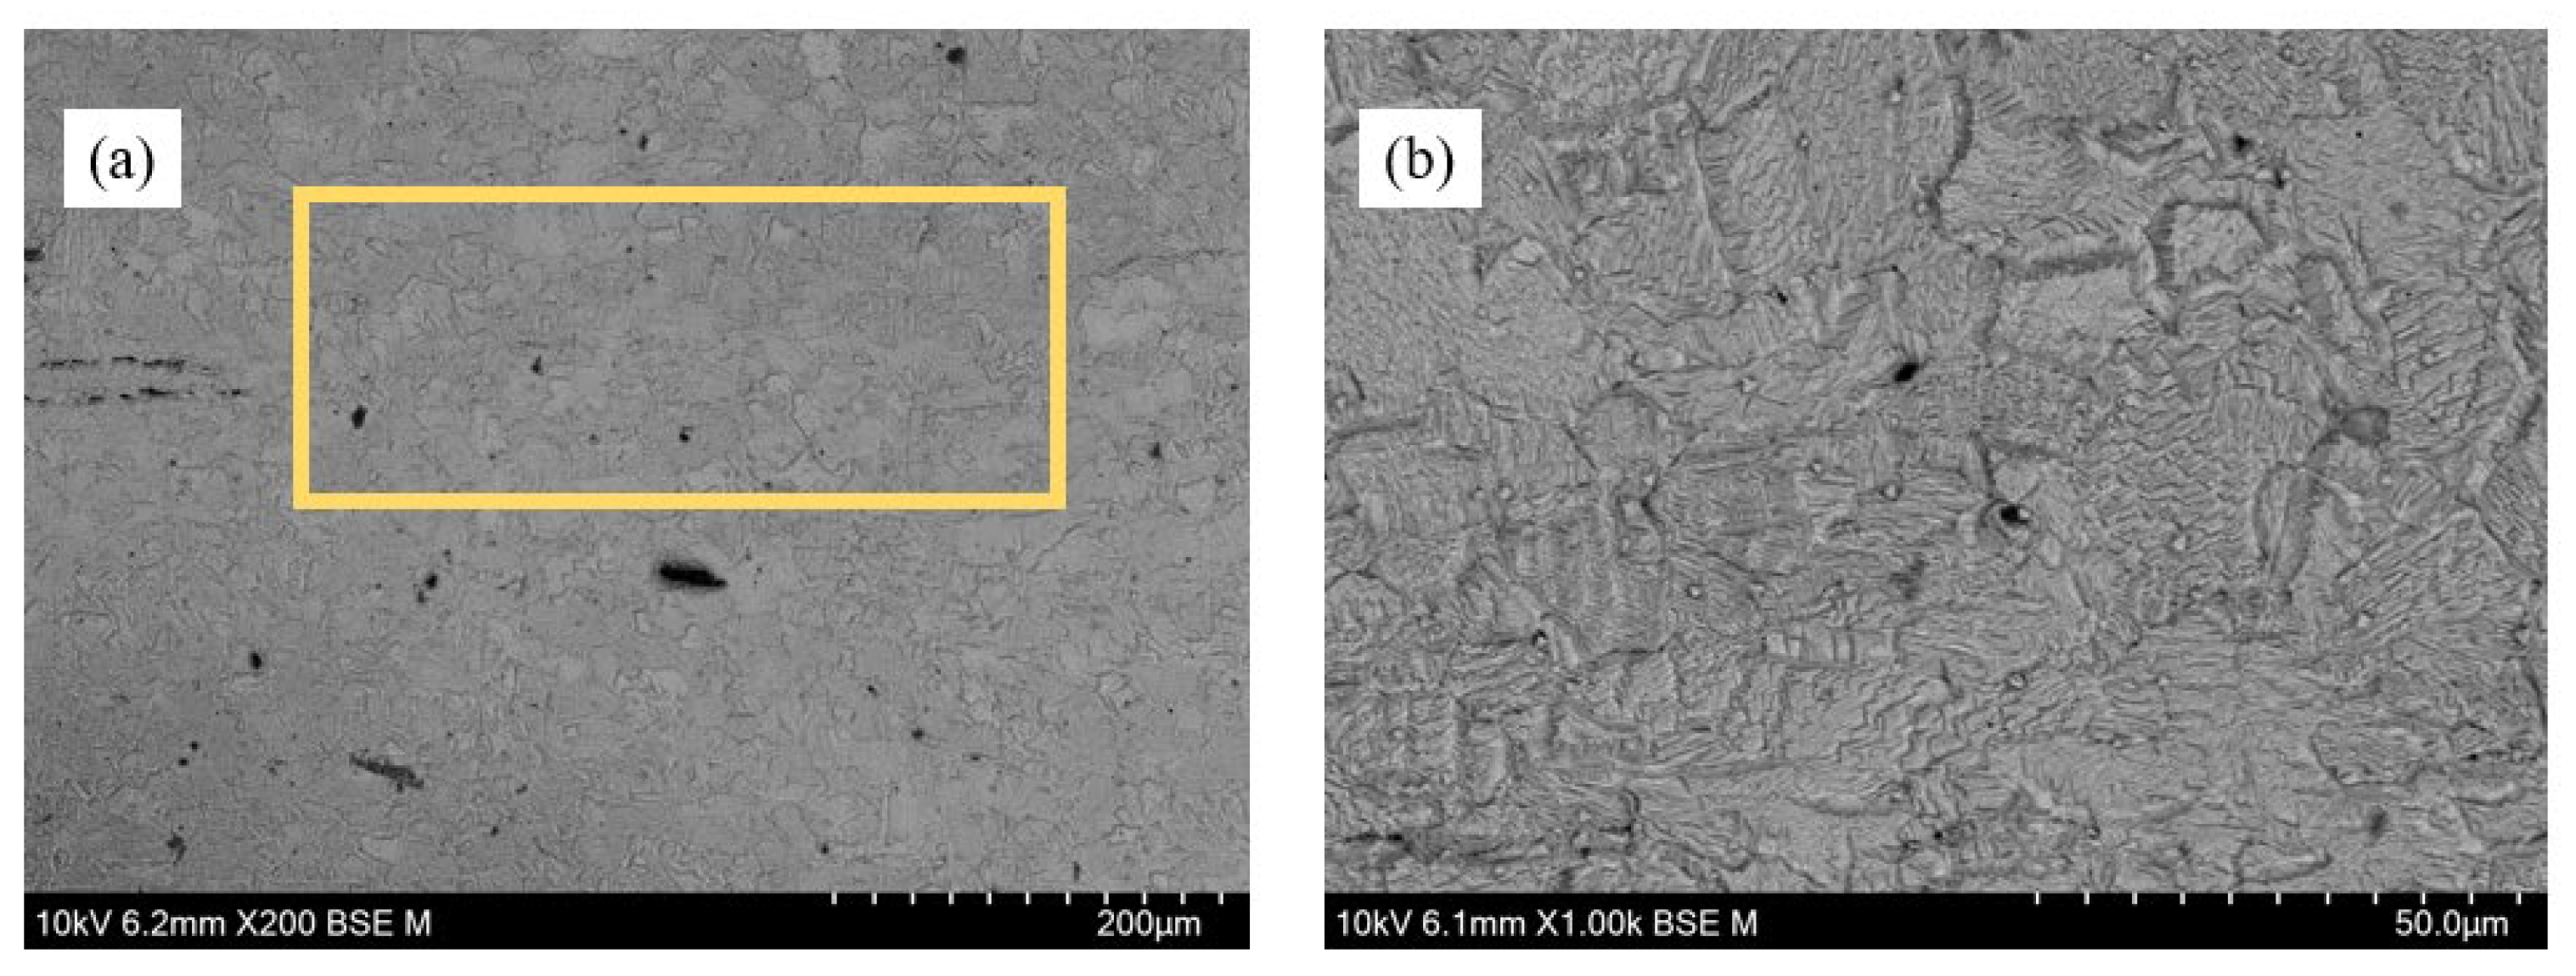
In
Figure 26, zone B is depicted. In this area, no separation line is visible.
Figure 26 (b) confirms that there has been material fusion because it appears very homogeneous and continuous, resembling a single wall rather than the junction of two walls.
Finally, in
Figure 27, it is zone C. Here, a single line separating the two walls of the tube is visible. In
Figure 27 (b), it is evident that, despite there being no material fusion, it is partially united.
The EDS analysis conducted in this area, in addition to identifying the reagents used in the chemical etching, indicates that there was no material fusion because the presence of copper in the line is not continuous.
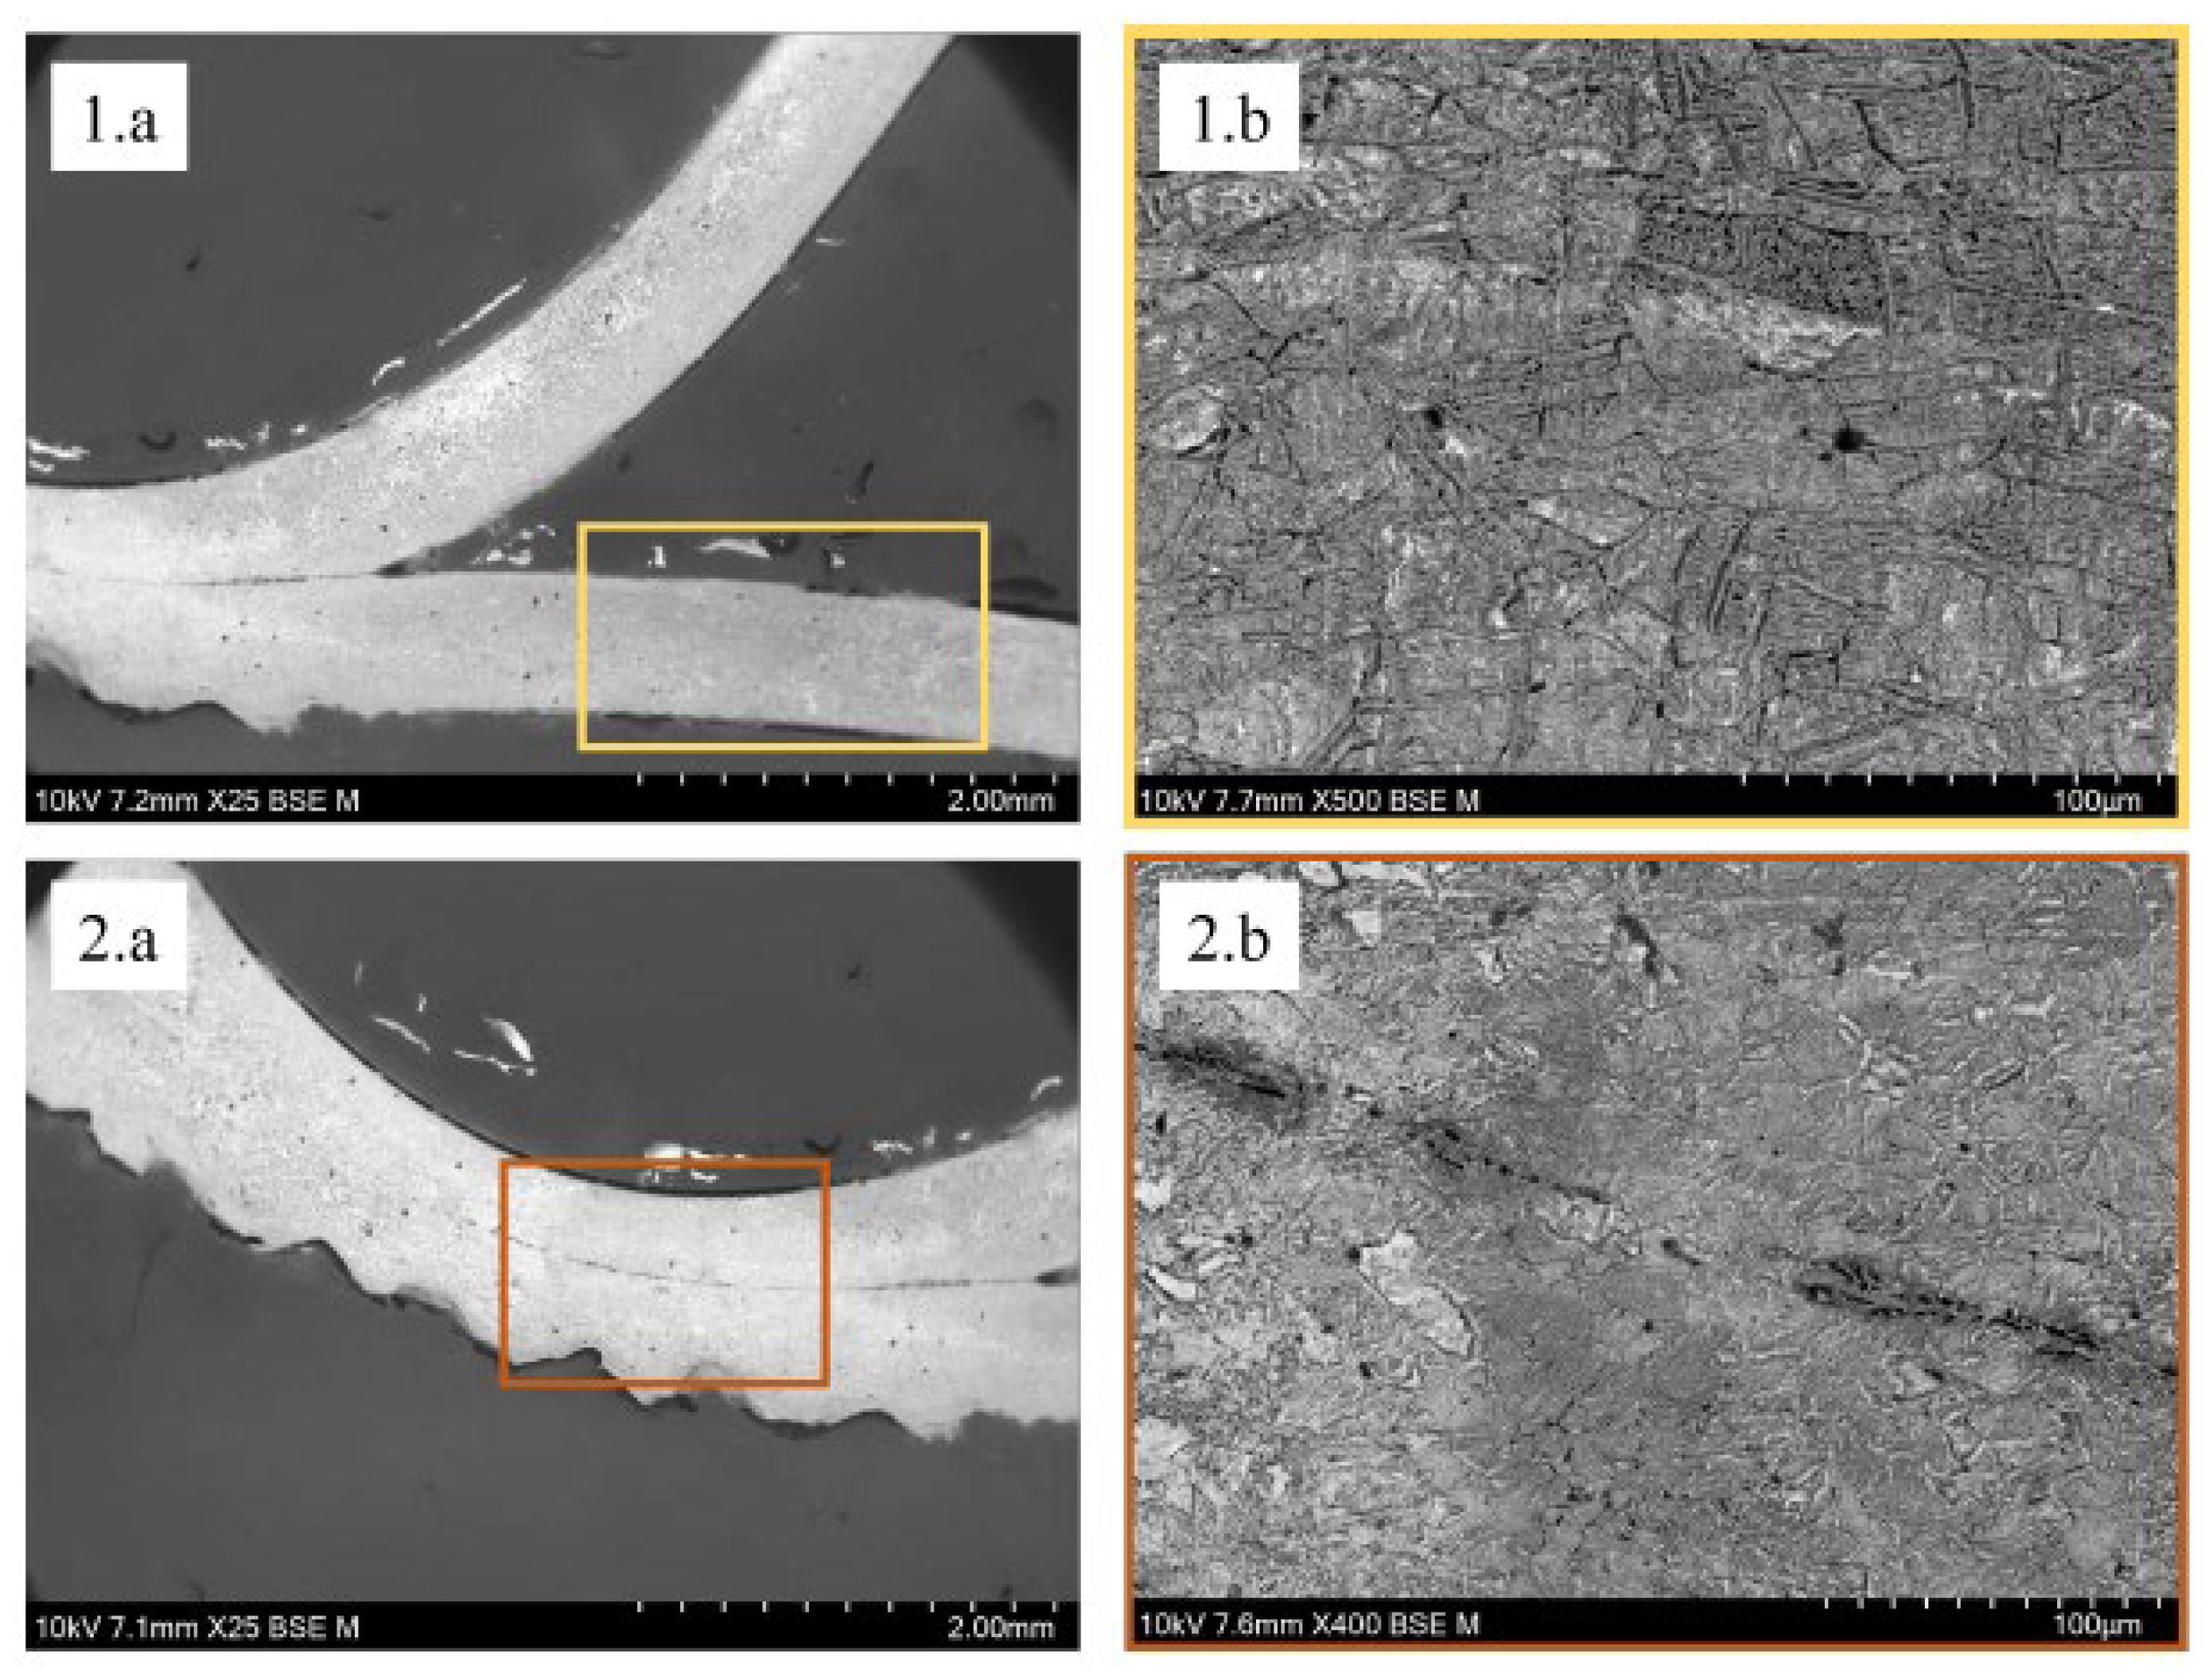
Microscopy was also performed on a longitudinally cut T3P4 sample relative to the weld (as shown in
Figure 28).
Analyzing
Figure 28, it is concluded that there are no significant changes between the weld zone and a more distant zone. This is because copper has high thermal conductivity, dissipating heat during the process. This results in a less noticeable thermally affected zone.
4. Conclusions
In this study, copper welding was successfully performed using the METAL WELDING DEVICE MCX CC21-01606. This equipment was used to weld copper sheets in lap joints and to seal copper tubes with a thickness of 0.8 mm.
Despite encountering difficulties, particularly with resonance effects, good welds were achieved through careful parameter optimization. The quality of the results was verified through tensile tests on the sheets, leak tests performed on the tubes, and macroscopic and microscopic analyses conducted on both.
In our experiments, we identified the optimal welding conditions for copper sheets and tube sealing as follows,
Copper sheets:
Welding time: 3 seconds
Pressure: 6 bar
Tube sealing:
Welding Time: 3 seconds
Pressure: 4 bar
For both applications, the process parameters were consistent and included:
Retention time: 0.62 seconds
Initial pressure: 2 bar
Retention pressure: 2 bar
Sonotrode rising pressure: 3 bar
It is natural that tube welding required lower pressure compared to sheets due to the different contact areas. Specifically, the area ratio of the sheet/tube weld zone is approximately 3.6. These settings were crucial in achieving the best outcomes in the respective welding processes.
In conclusion, it has been demonstrated that despite copper's high thermal conductivity, excellent welds can be achieved through ultrasonic welding.
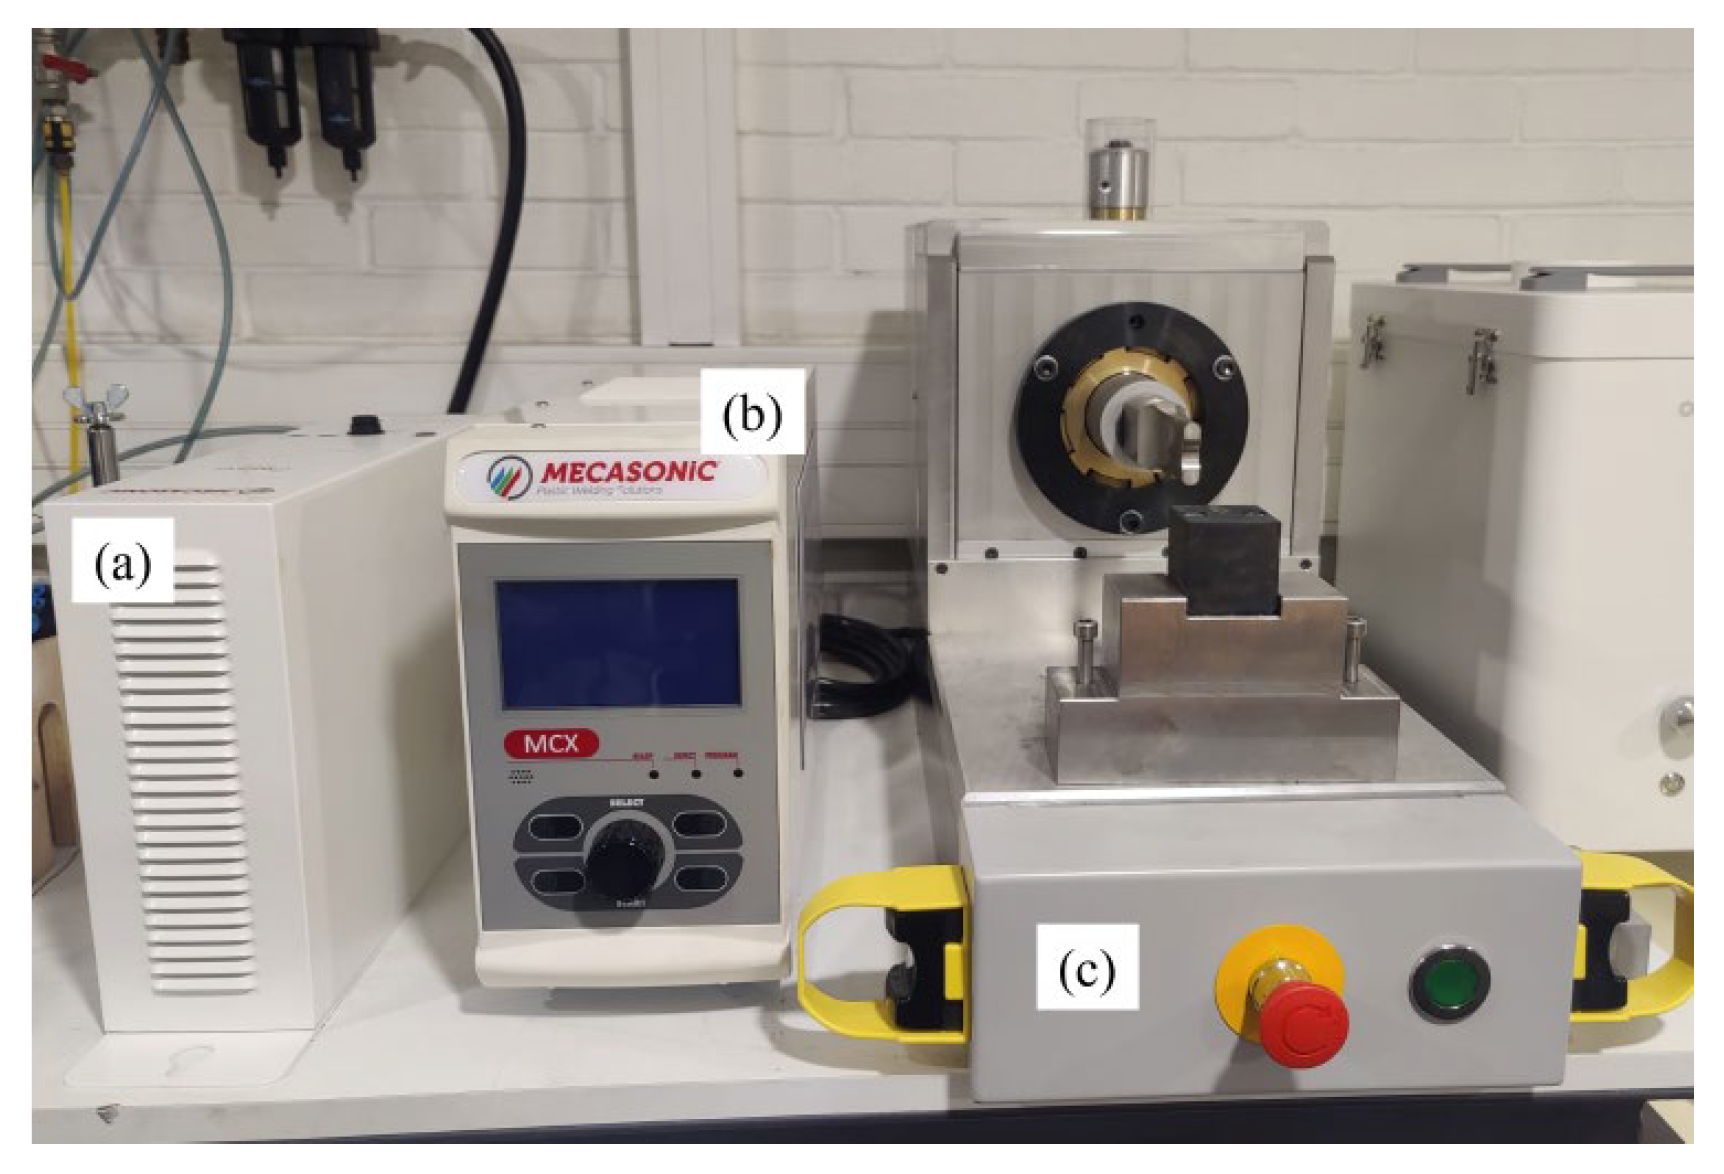
Figure 1.
Ultrasonic welding machine. (a) Generator; (b) Controller; (c) Welding machine.
Figure 1.
Ultrasonic welding machine. (a) Generator; (b) Controller; (c) Welding machine.
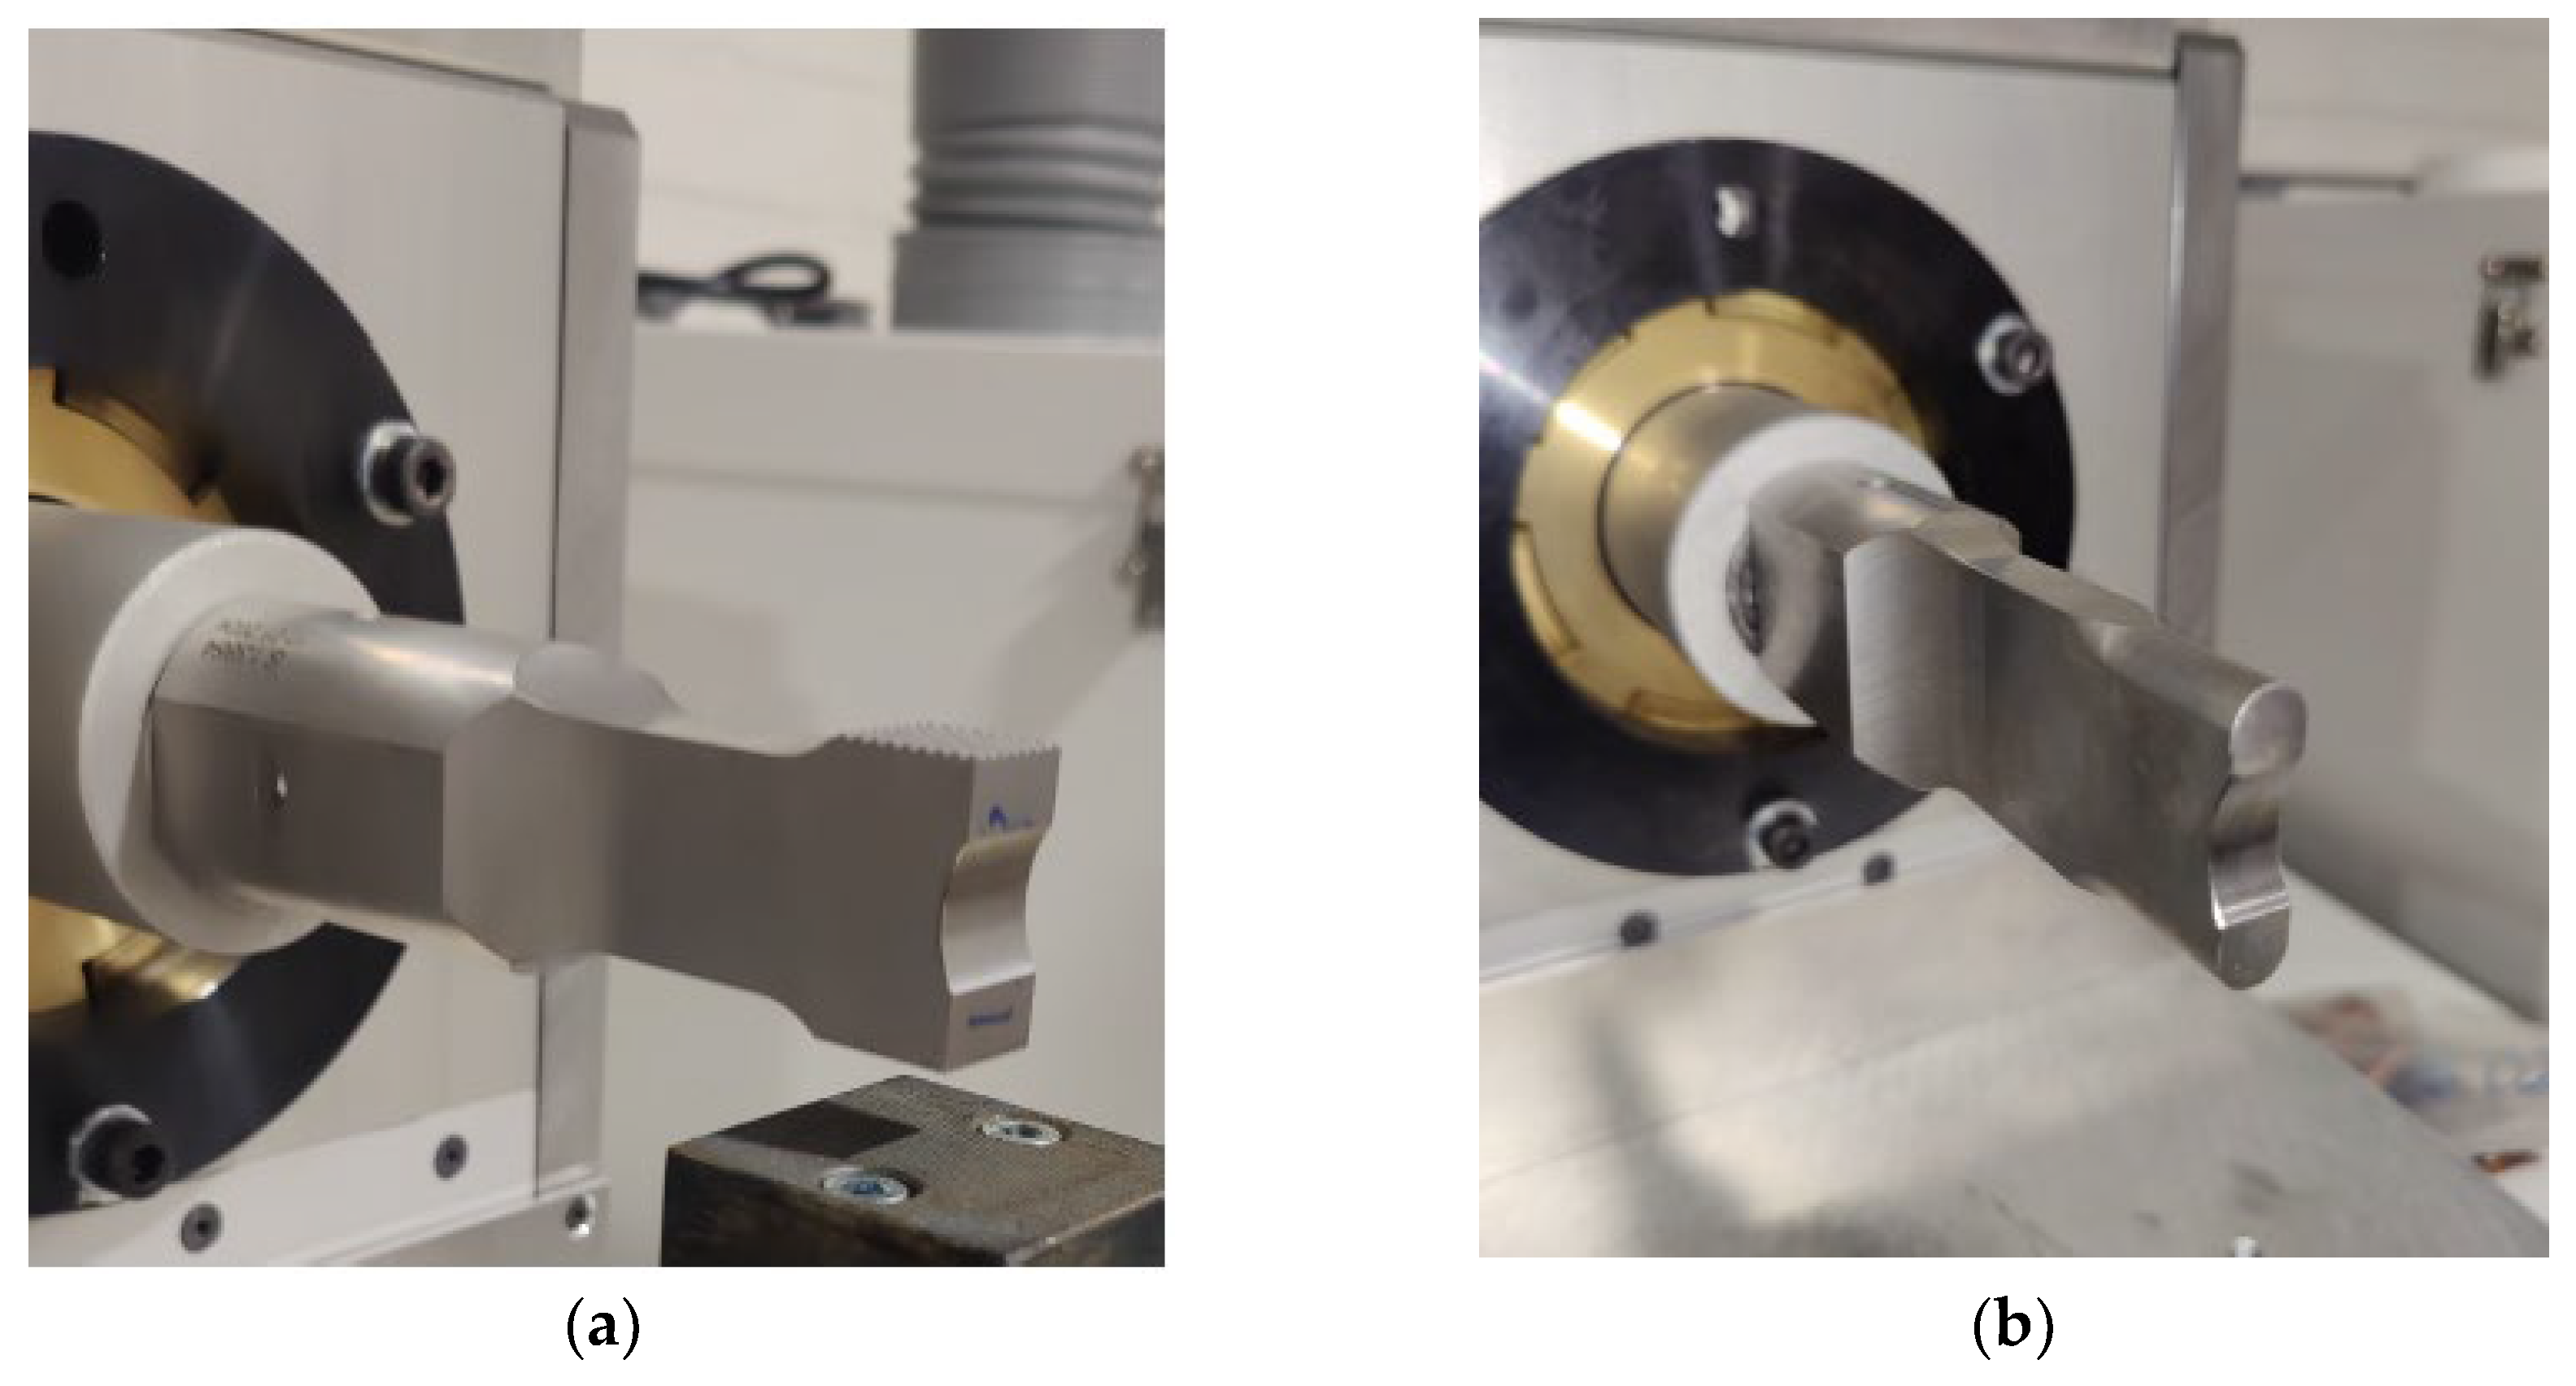
Figure 2.
Sonotrode used fore welding the sheets (b) Sonotrode used for sealing the tubes.
Figure 2.
Sonotrode used fore welding the sheets (b) Sonotrode used for sealing the tubes.
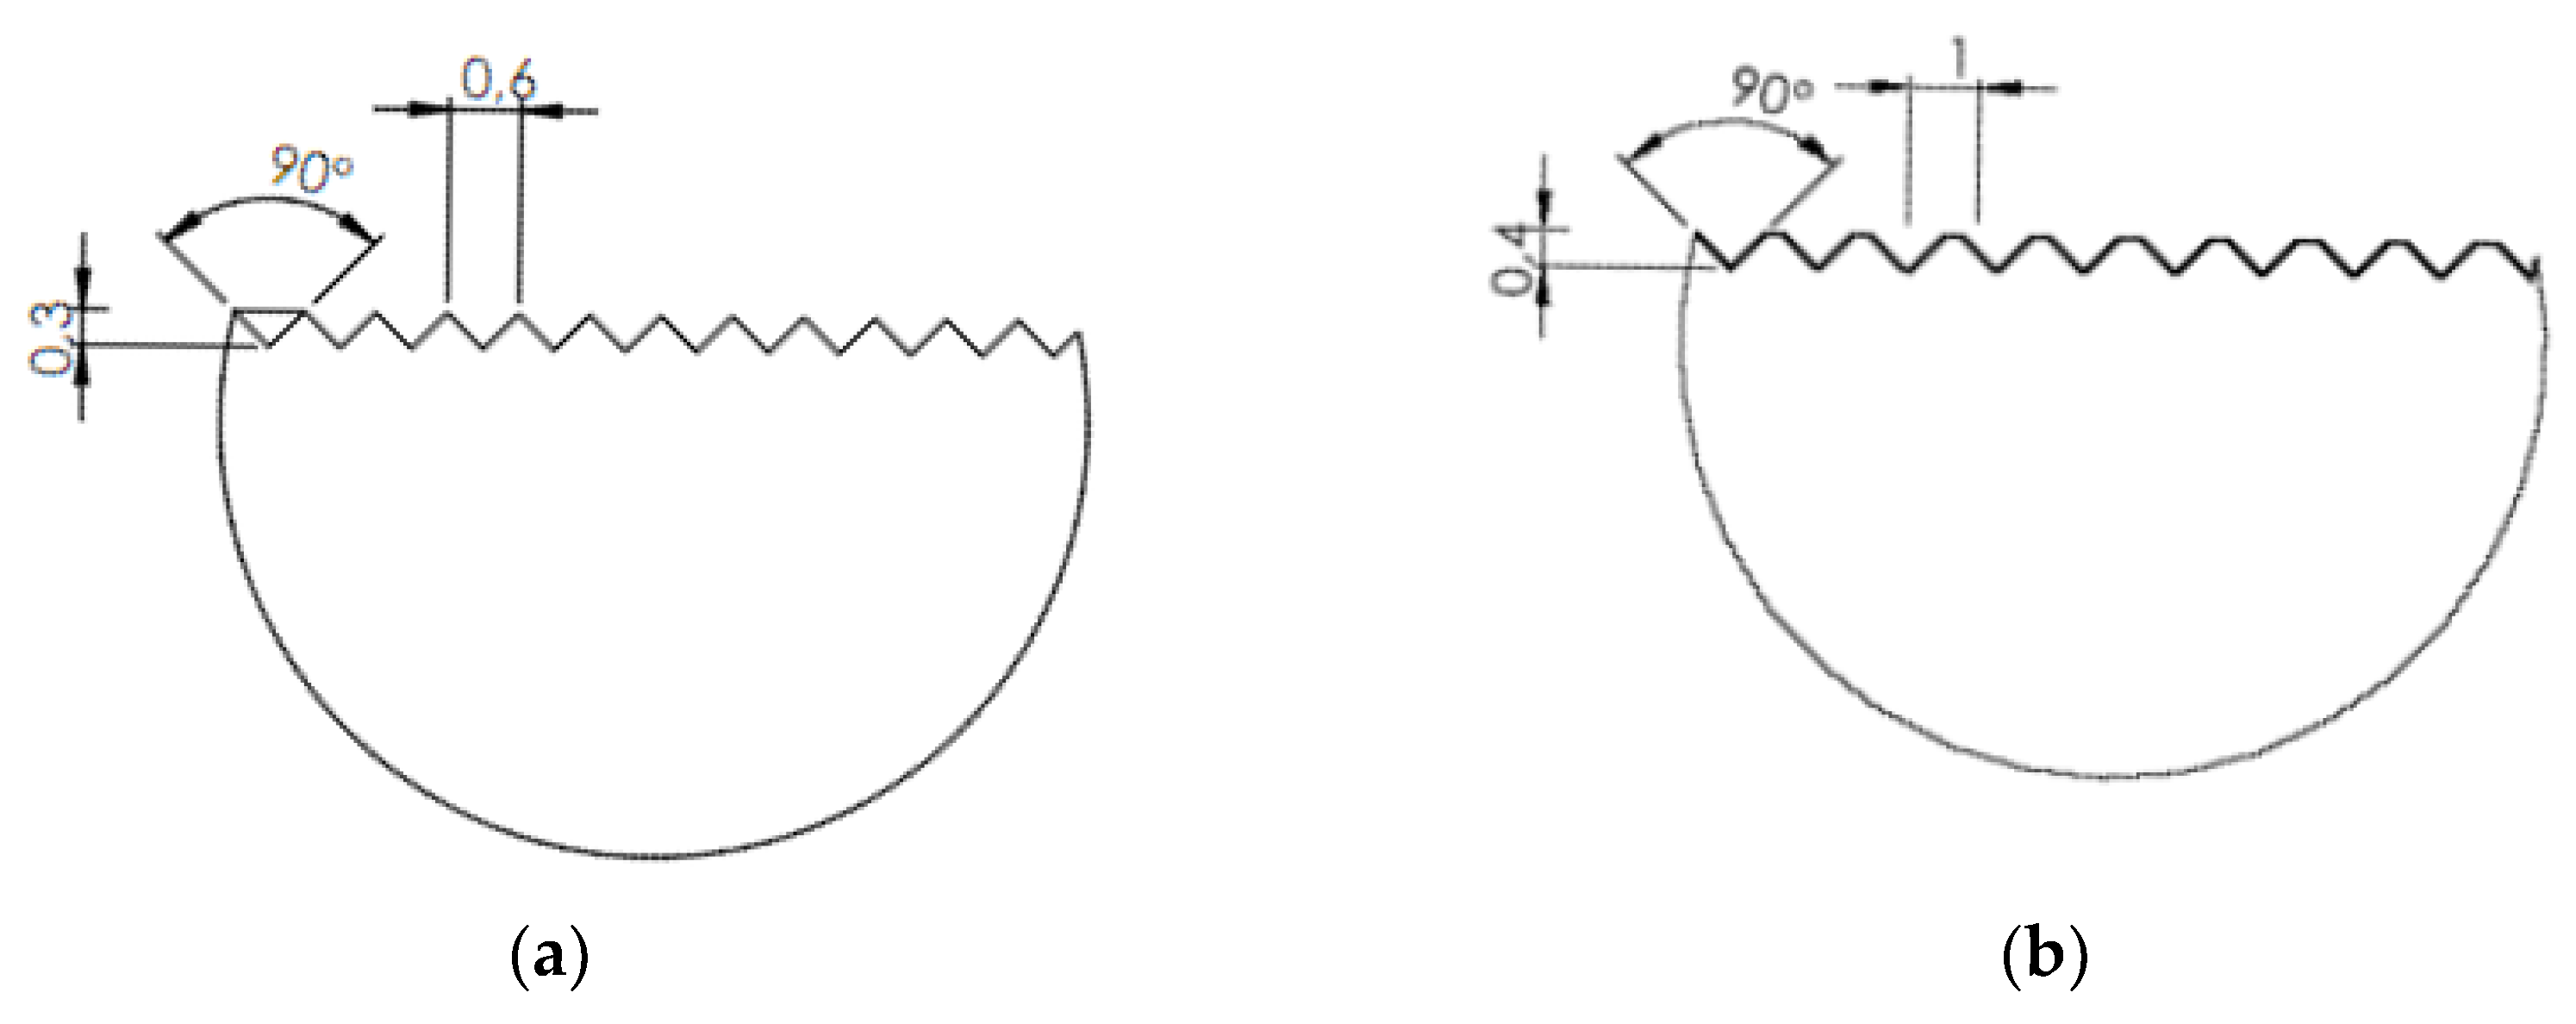
Figure 3.
(a) Pointed serration used on the anvil for welding sheets. (b) Flat-top serration used on the anvil for sealing tubes.
Figure 3.
(a) Pointed serration used on the anvil for welding sheets. (b) Flat-top serration used on the anvil for sealing tubes.
Figure 4.
A schematic representation of a specimen clamped during a tensile test. (a) Clamps; White rectangles represent the welded sheets; Small dark rectangles represent the spacers; F represents the applied force.
Figure 4.
A schematic representation of a specimen clamped during a tensile test. (a) Clamps; White rectangles represent the welded sheets; Small dark rectangles represent the spacers; F represents the applied force.
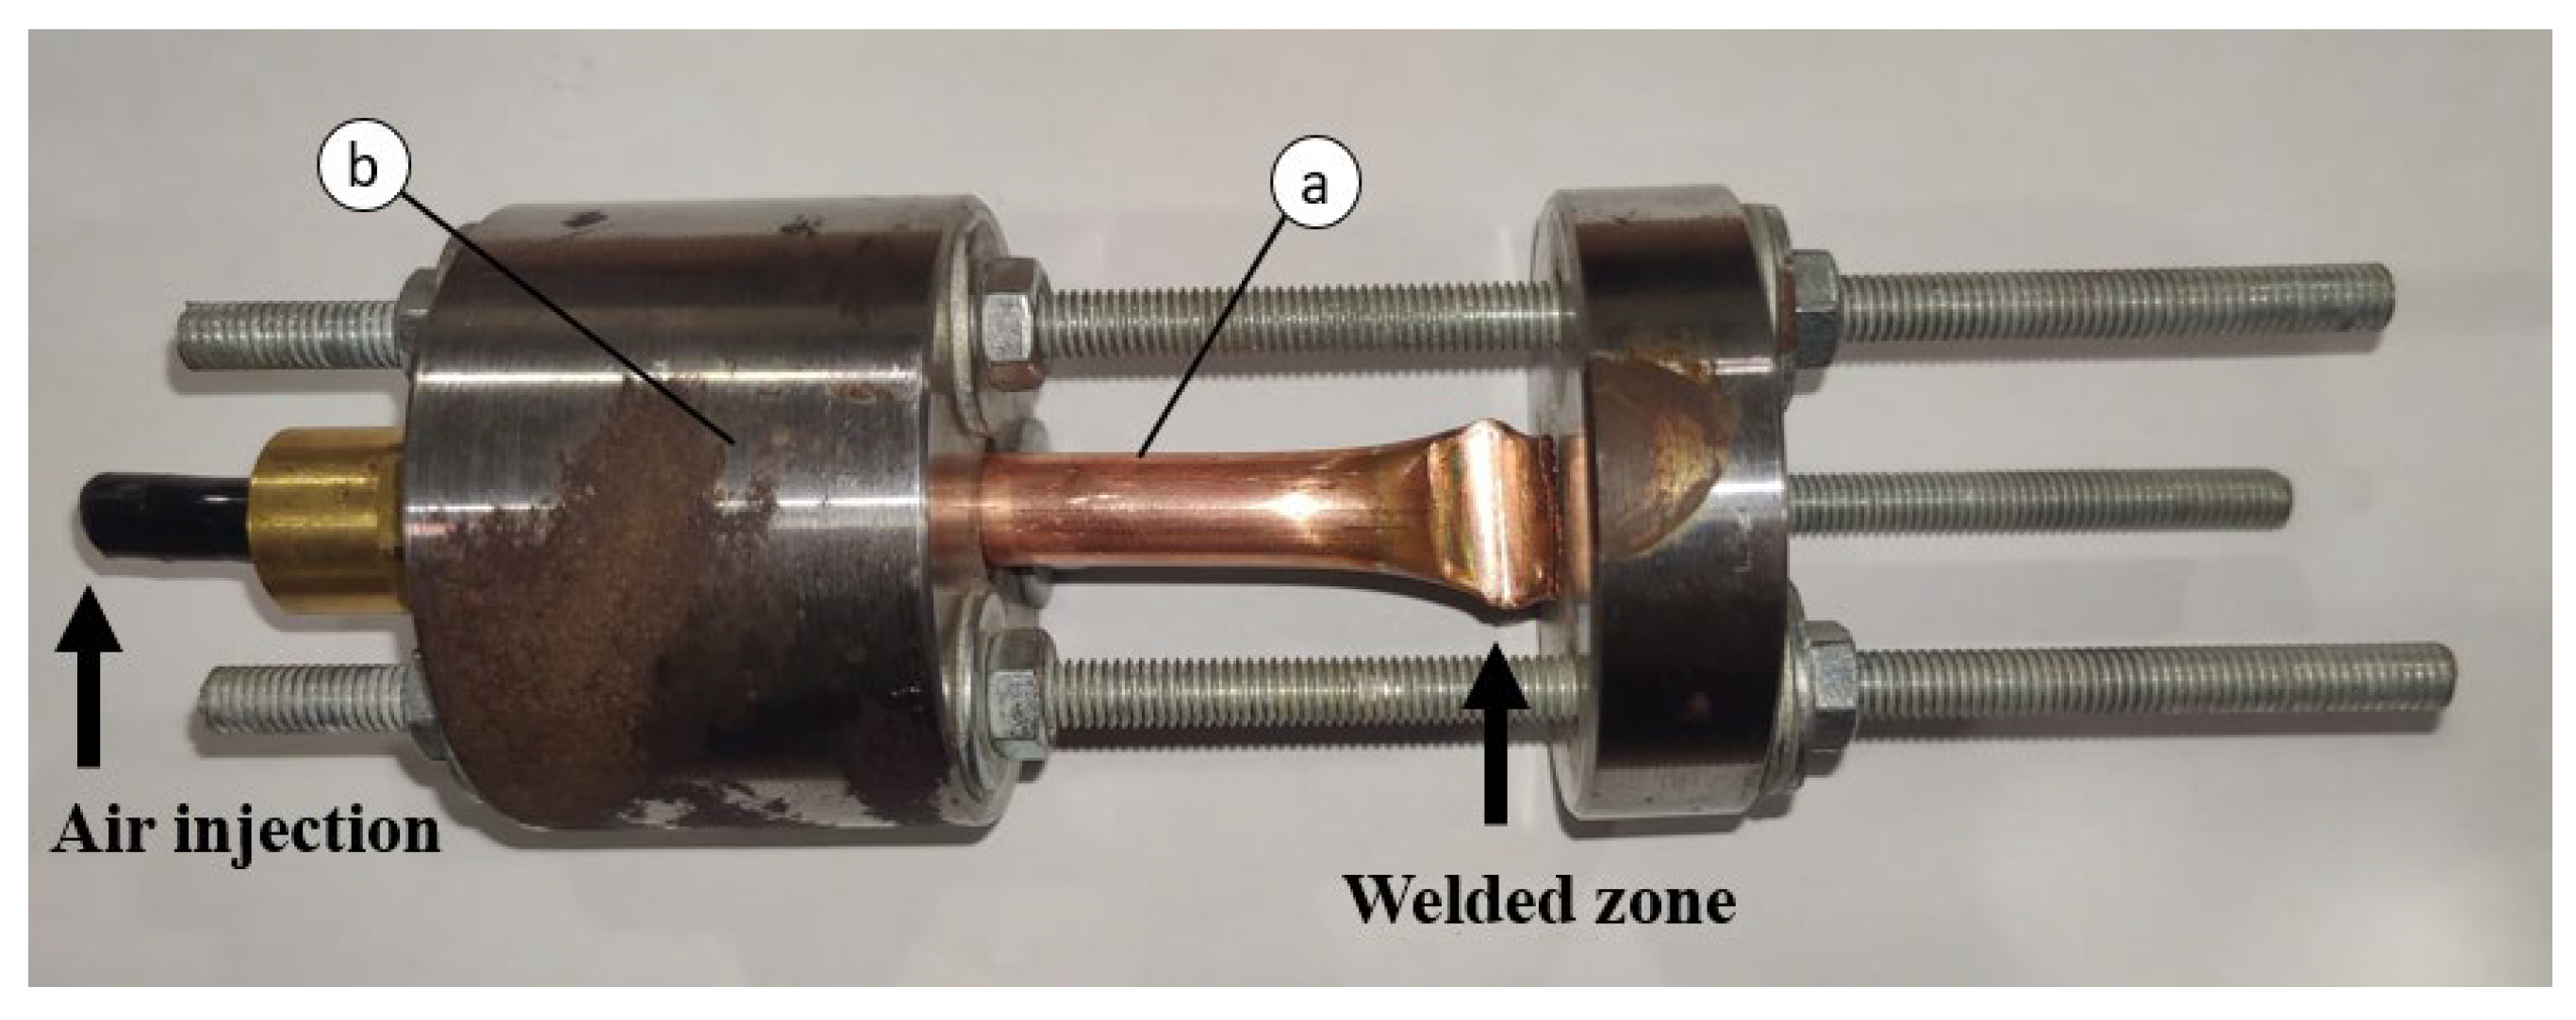
Figure 5.
(a) Tube under test; (b) Sealing test tool with seals.
Figure 5.
(a) Tube under test; (b) Sealing test tool with seals.
Figure 6.
Cuts made on the tubes and subsequent embedding. (1) Longitudinal cut; Cross-sectional cut; (a) Embedded sample after longitudinal cut; (b) Embedded sample after cross-sectional cut.
Figure 6.
Cuts made on the tubes and subsequent embedding. (1) Longitudinal cut; Cross-sectional cut; (a) Embedded sample after longitudinal cut; (b) Embedded sample after cross-sectional cut.
Figure 7.
Stress-Strain Curves of the base material with 0° and 90° rolling direction.
Figure 7.
Stress-Strain Curves of the base material with 0° and 90° rolling direction.
Figure 8.
Force-displacement graph. T3P6, T3P4.5, and T3P3 represent the average of three tensile tests conducted for each set of parameters.
Figure 8.
Force-displacement graph. T3P6, T3P4.5, and T3P3 represent the average of three tensile tests conducted for each set of parameters.
Figure 9.
T3P3, T3P4.5, and T3P6 sheets after tensile testing.
Figure 9.
T3P3, T3P4.5, and T3P6 sheets after tensile testing.
Figure 10.
T5P1.5 sheets after welding.
Figure 10.
T5P1.5 sheets after welding.
Figure 11.
Surface graphs.
Figure 11.
Surface graphs.
Figure 12.
Surface graphs.
Figure 12.
Surface graphs.
Figure 13.
Interpolated surface through all points.
Figure 13.
Interpolated surface through all points.
Figure 14.
Analysis of joint quality.
Figure 14.
Analysis of joint quality.
Figure 15.
(a) T3P4.5 tubes after welding (sonotrode side); (b) T3P4.5 tubes after welding (anvil side).
Figure 15.
(a) T3P4.5 tubes after welding (sonotrode side); (b) T3P4.5 tubes after welding (anvil side).
Figure 16.
T7P1.5 tube during welding.
Figure 16.
T7P1.5 tube during welding.
Figure 17.
Fissures created during welding in samples T3.5P3.5.
Figure 17.
Fissures created during welding in samples T3.5P3.5.
Figure 18.
Tubes T4P4 bent after leak testing.
Figure 18.
Tubes T4P4 bent after leak testing.
Figure 19.
Macroscopy of sample T3P6 (x10); A - Horn side; B - Anvil side.
Figure 19.
Macroscopy of sample T3P6 (x10); A - Horn side; B - Anvil side.
Figure 20.
Macroscopy of sample T5P1.5: (a) (x10); (b) Detailed image of the weld A - Horn side; B - Anvil side.
Figure 20.
Macroscopy of sample T5P1.5: (a) (x10); (b) Detailed image of the weld A - Horn side; B - Anvil side.
Figure 21.
Macrographic image of sample T3P4: (a) (x10); (b) Detailed image of the weld (x25); A - Horn side; B - Anvil side.
Figure 21.
Macrographic image of sample T3P4: (a) (x10); (b) Detailed image of the weld (x25); A - Horn side; B - Anvil side.
Figure 22.
Microscopy of the base material of the tubes.
Figure 22.
Microscopy of the base material of the tubes.
Figure 23.
Microscopy of plate T3P6. (a) Unwelded zone (orange) and welded zone (yellow); (b) Welded zone; (c) Unwelded zone; (d) Detailed view of unwelded zone.
Figure 23.
Microscopy of plate T3P6. (a) Unwelded zone (orange) and welded zone (yellow); (b) Welded zone; (c) Unwelded zone; (d) Detailed view of unwelded zone.
Figure 24.
(a) Microscopy of tube T3P4; (b) Distinction of three zones: zone A, zone B, and zone C.
Figure 24.
(a) Microscopy of tube T3P4; (b) Distinction of three zones: zone A, zone B, and zone C.
Figure 25.
Microscopy of tube T3P4 in zone B. (a) and (b) are images of the same location at different magnifications.
Figure 25.
Microscopy of tube T3P4 in zone B. (a) and (b) are images of the same location at different magnifications.
Figure 26.
Microscopy of tube T3P4 in zone B. (a) and (b) are images of the same location at different magnifications.
Figure 26.
Microscopy of tube T3P4 in zone B. (a) and (b) are images of the same location at different magnifications.
Figure 27.
Microscopy of tube T3P4 in zone C. (a) and (b) are images of the same location at different magnifications.
Figure 27.
Microscopy of tube T3P4 in zone C. (a) and (b) are images of the same location at different magnifications.
Figure 28.
Microscopy of tube T3P4 in zones 1 and 2. 1.a and 1.b are images of the same location (welded zone) at different magnifications; 2.a and 2.b are images of the same location (away from the weld zone) at different magnifications.
Figure 28.
Microscopy of tube T3P4 in zones 1 and 2. 1.a and 1.b are images of the same location (welded zone) at different magnifications; 2.a and 2.b are images of the same location (away from the weld zone) at different magnifications.
Table 1.
Combination of parameters for the welds.
Table 1.
Combination of parameters for the welds.
| Sample |
Time (s) |
Pressure (bar) |
T0.01P0.5
T0.01P1.5
T0.01P3
T0.01P4.5
T0.01P6
T3P0.5
T3P1.5
T3P3
T3P4.5
T3P6
T5P0.5
T5P1.5
T5P3
T5P4.5
T5P6
T7P0.5
T7P1.5
T7P3
T7P4.5
T7P6
T9.99P0.5
T9.99P1.5
T9.99P3
T9.99P4.5
T9.99P6 |
0,01
0,01
0,01
0,01
0,01
3
3
3
3
3
5
5
5
5
5
7
7
7
7
7
9,99
9,99
9,99
9,99
9,99 |
0,5
1,5
3
4,5
6
0,5
1,5
3
4,5
6
0,5
1,5
3
4,5
6
0,5
1,5
3
4,5
6
0,5
1,5
3
4,5
6 |
Table 2.
Results of the leak tightness test for all samples.
Table 2.
Results of the leak tightness test for all samples.
| Sample |
Time (s) |
Pressure (bar) |
|
T0.01P0.5
T0.01P1.5
T0.01P3
T0.01P4.5
T0.01P6
T3P0.5
T3P1.5
T3P3
T3P3.5
T3P4.5
T3.5P3.5
T3.5P4
T4P3
T4P3.5
T4P4
T5P0.5
T5P1.5
T5P3
T7P0.5
T7P1.5
T7P3
|
0,01
0,01
0,01
0,01
0,01
3
3
3
3
3
3,5
3,5
4
4
4
5
5
5
7
7
7
|
0,5
1,5
3
4,5
6
0,5
1,5
3
3,5
4,5
3,5
4
3
3,5
4
0,5
1,5
3
0,5
1,5
3 |
Nok
Nok
Nok
Nok
Nok
Nok
Nok
Nok
Ok
Ok
Nok
Ok
Nok
Ok
Ok
Nok
Nok
ND
Nok
Nok
ND |
