Submitted:
24 June 2024
Posted:
26 June 2024
You are already at the latest version
Abstract

Keywords:
1. Introduction
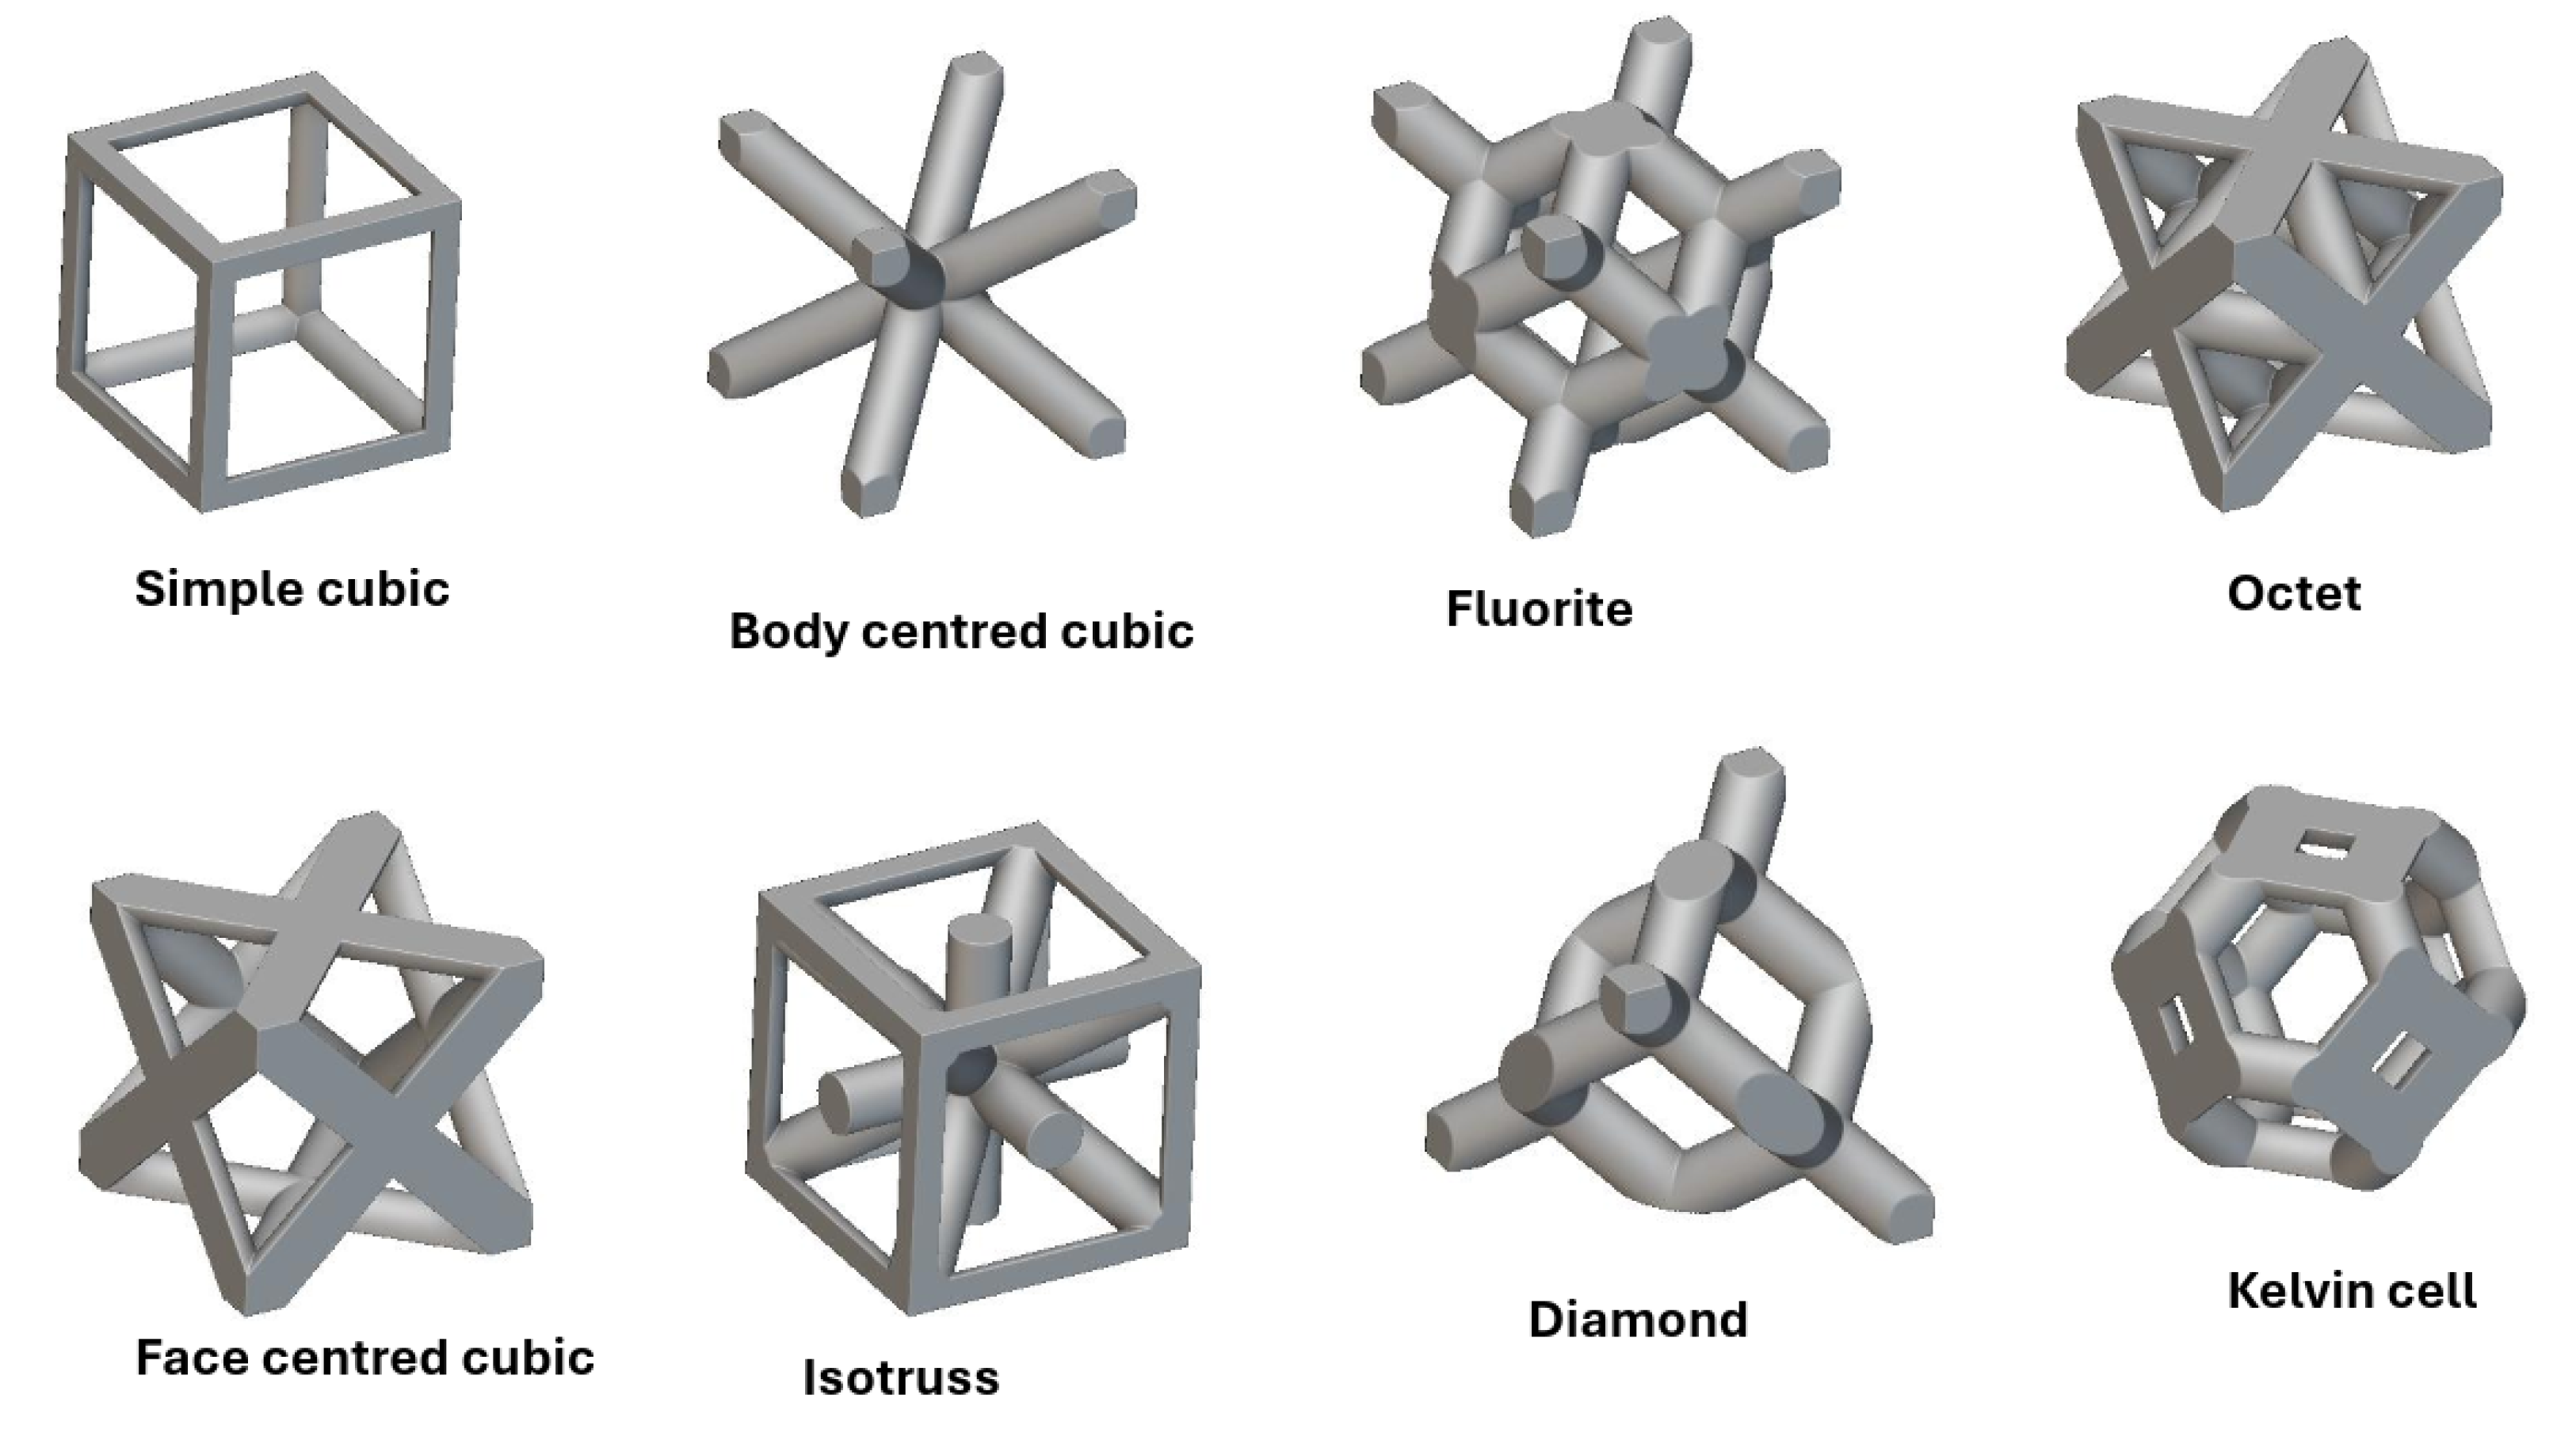
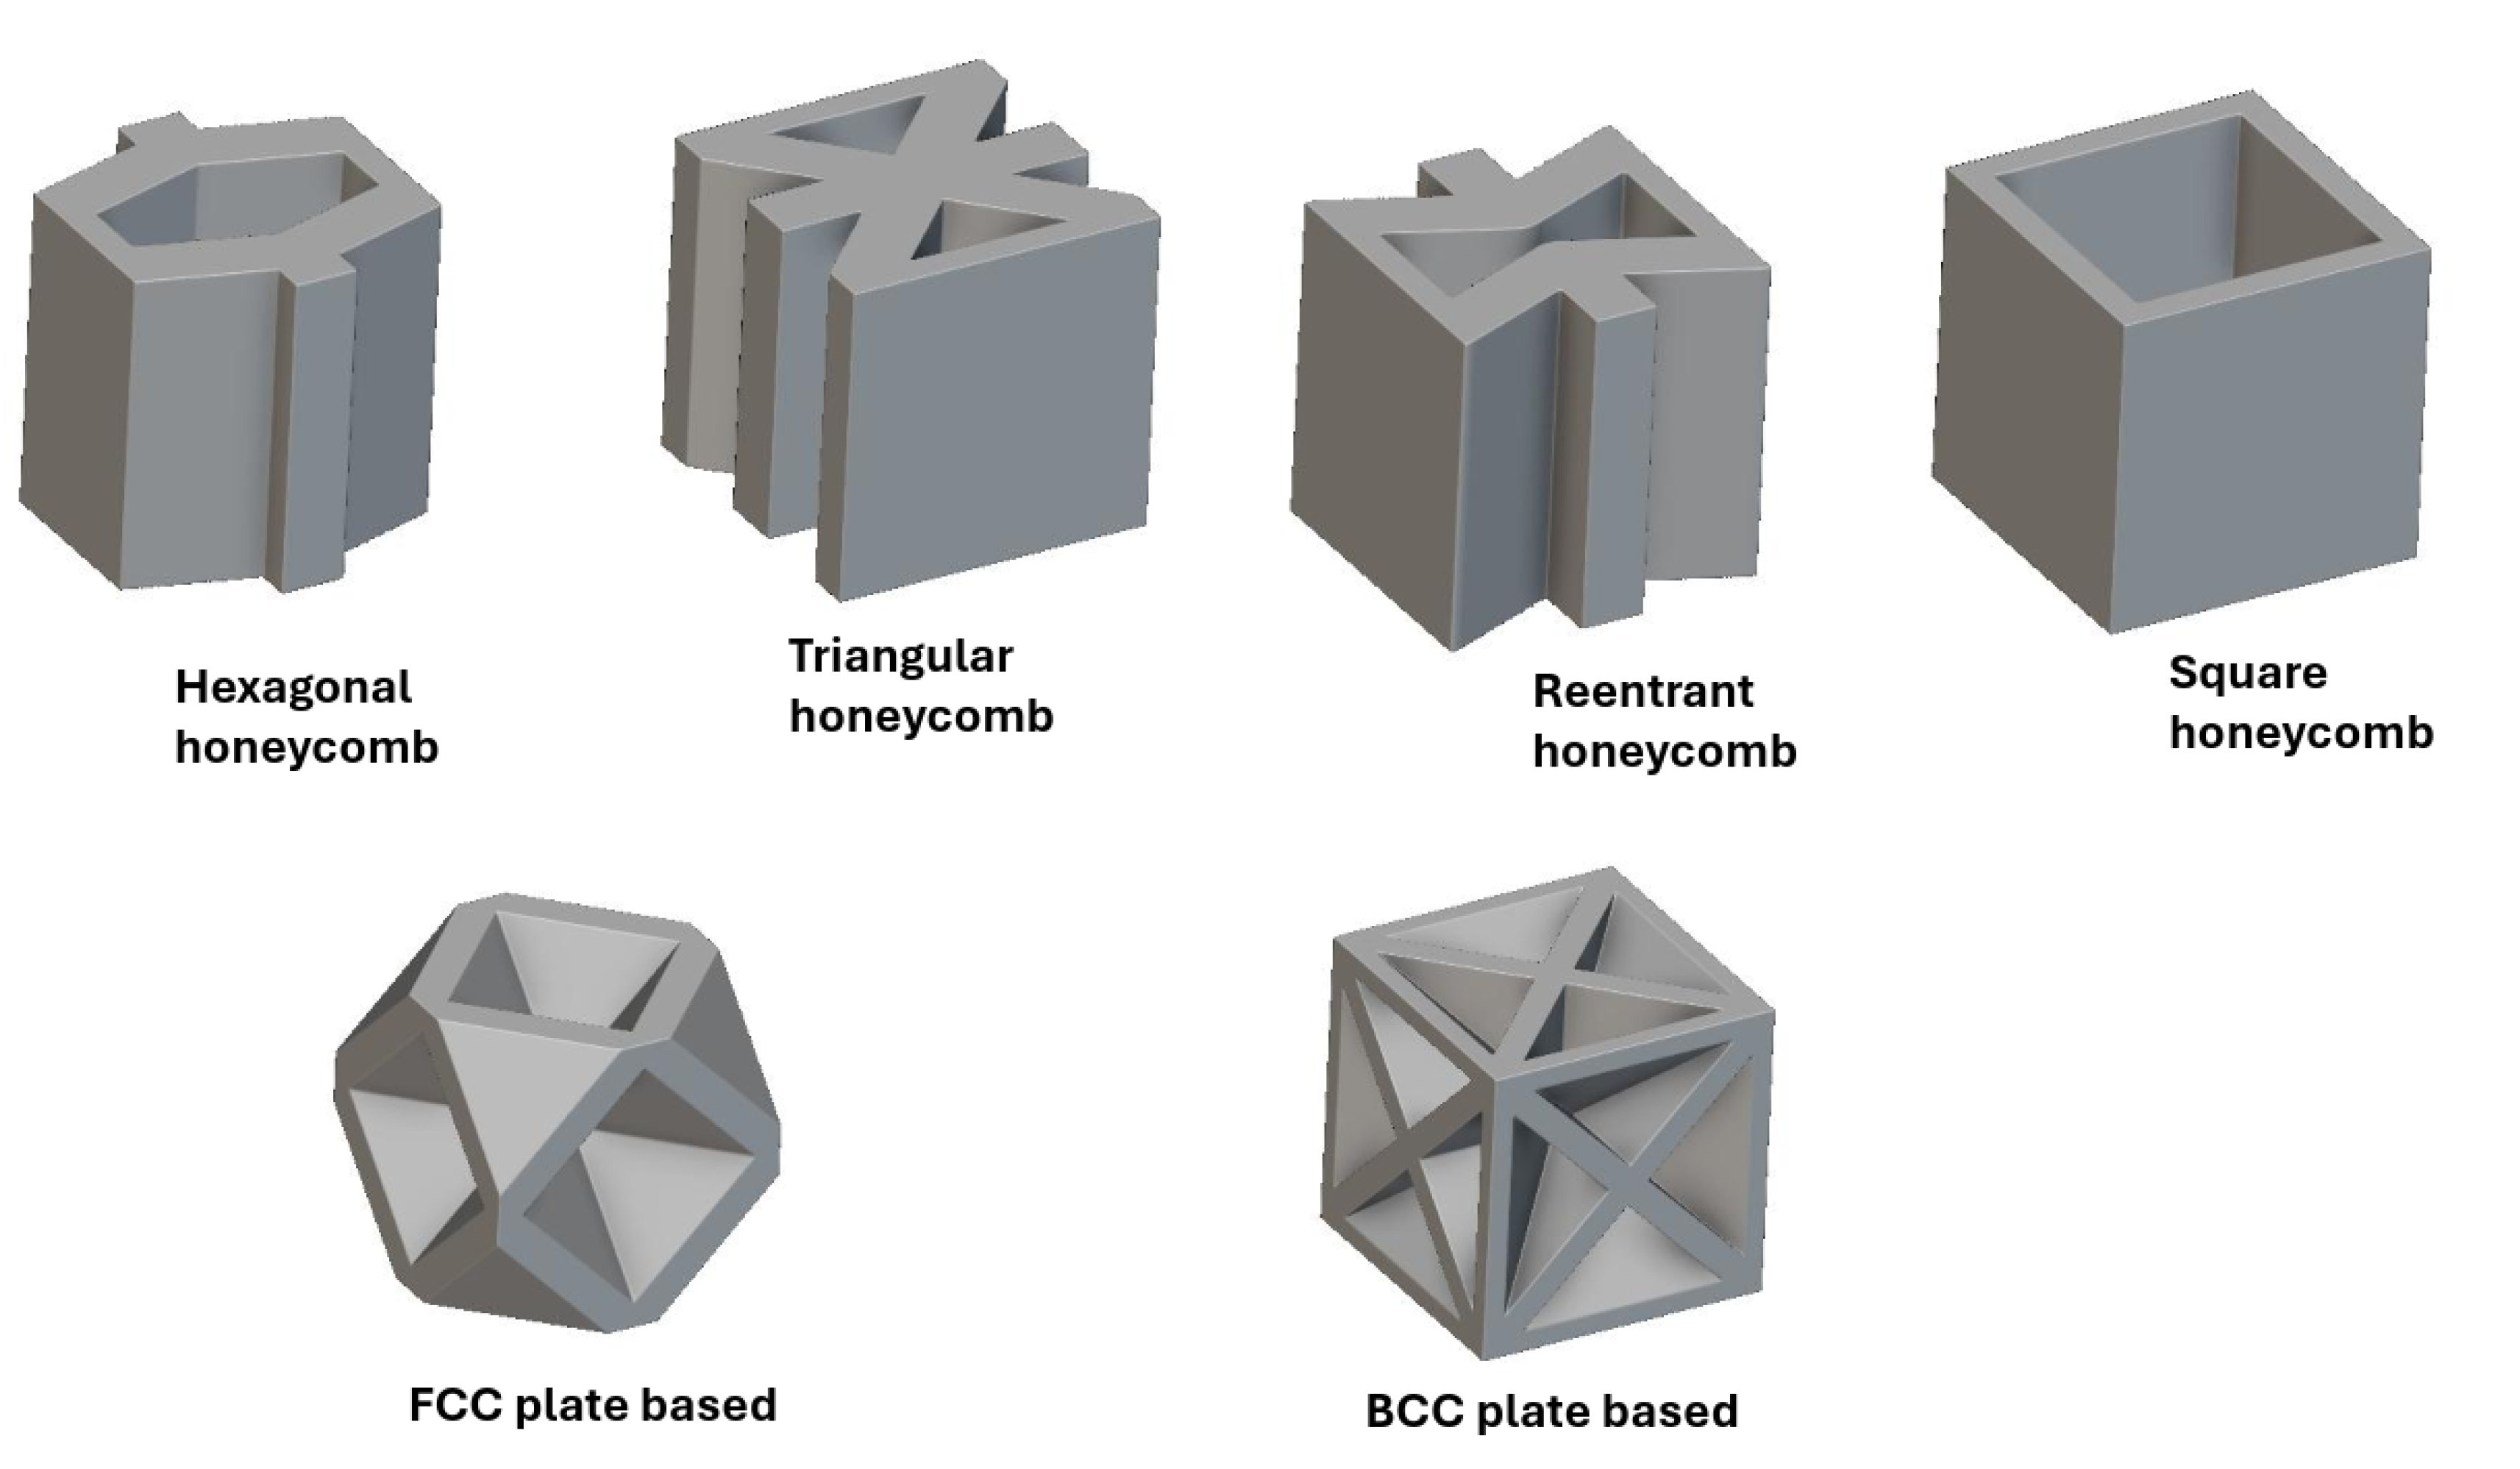
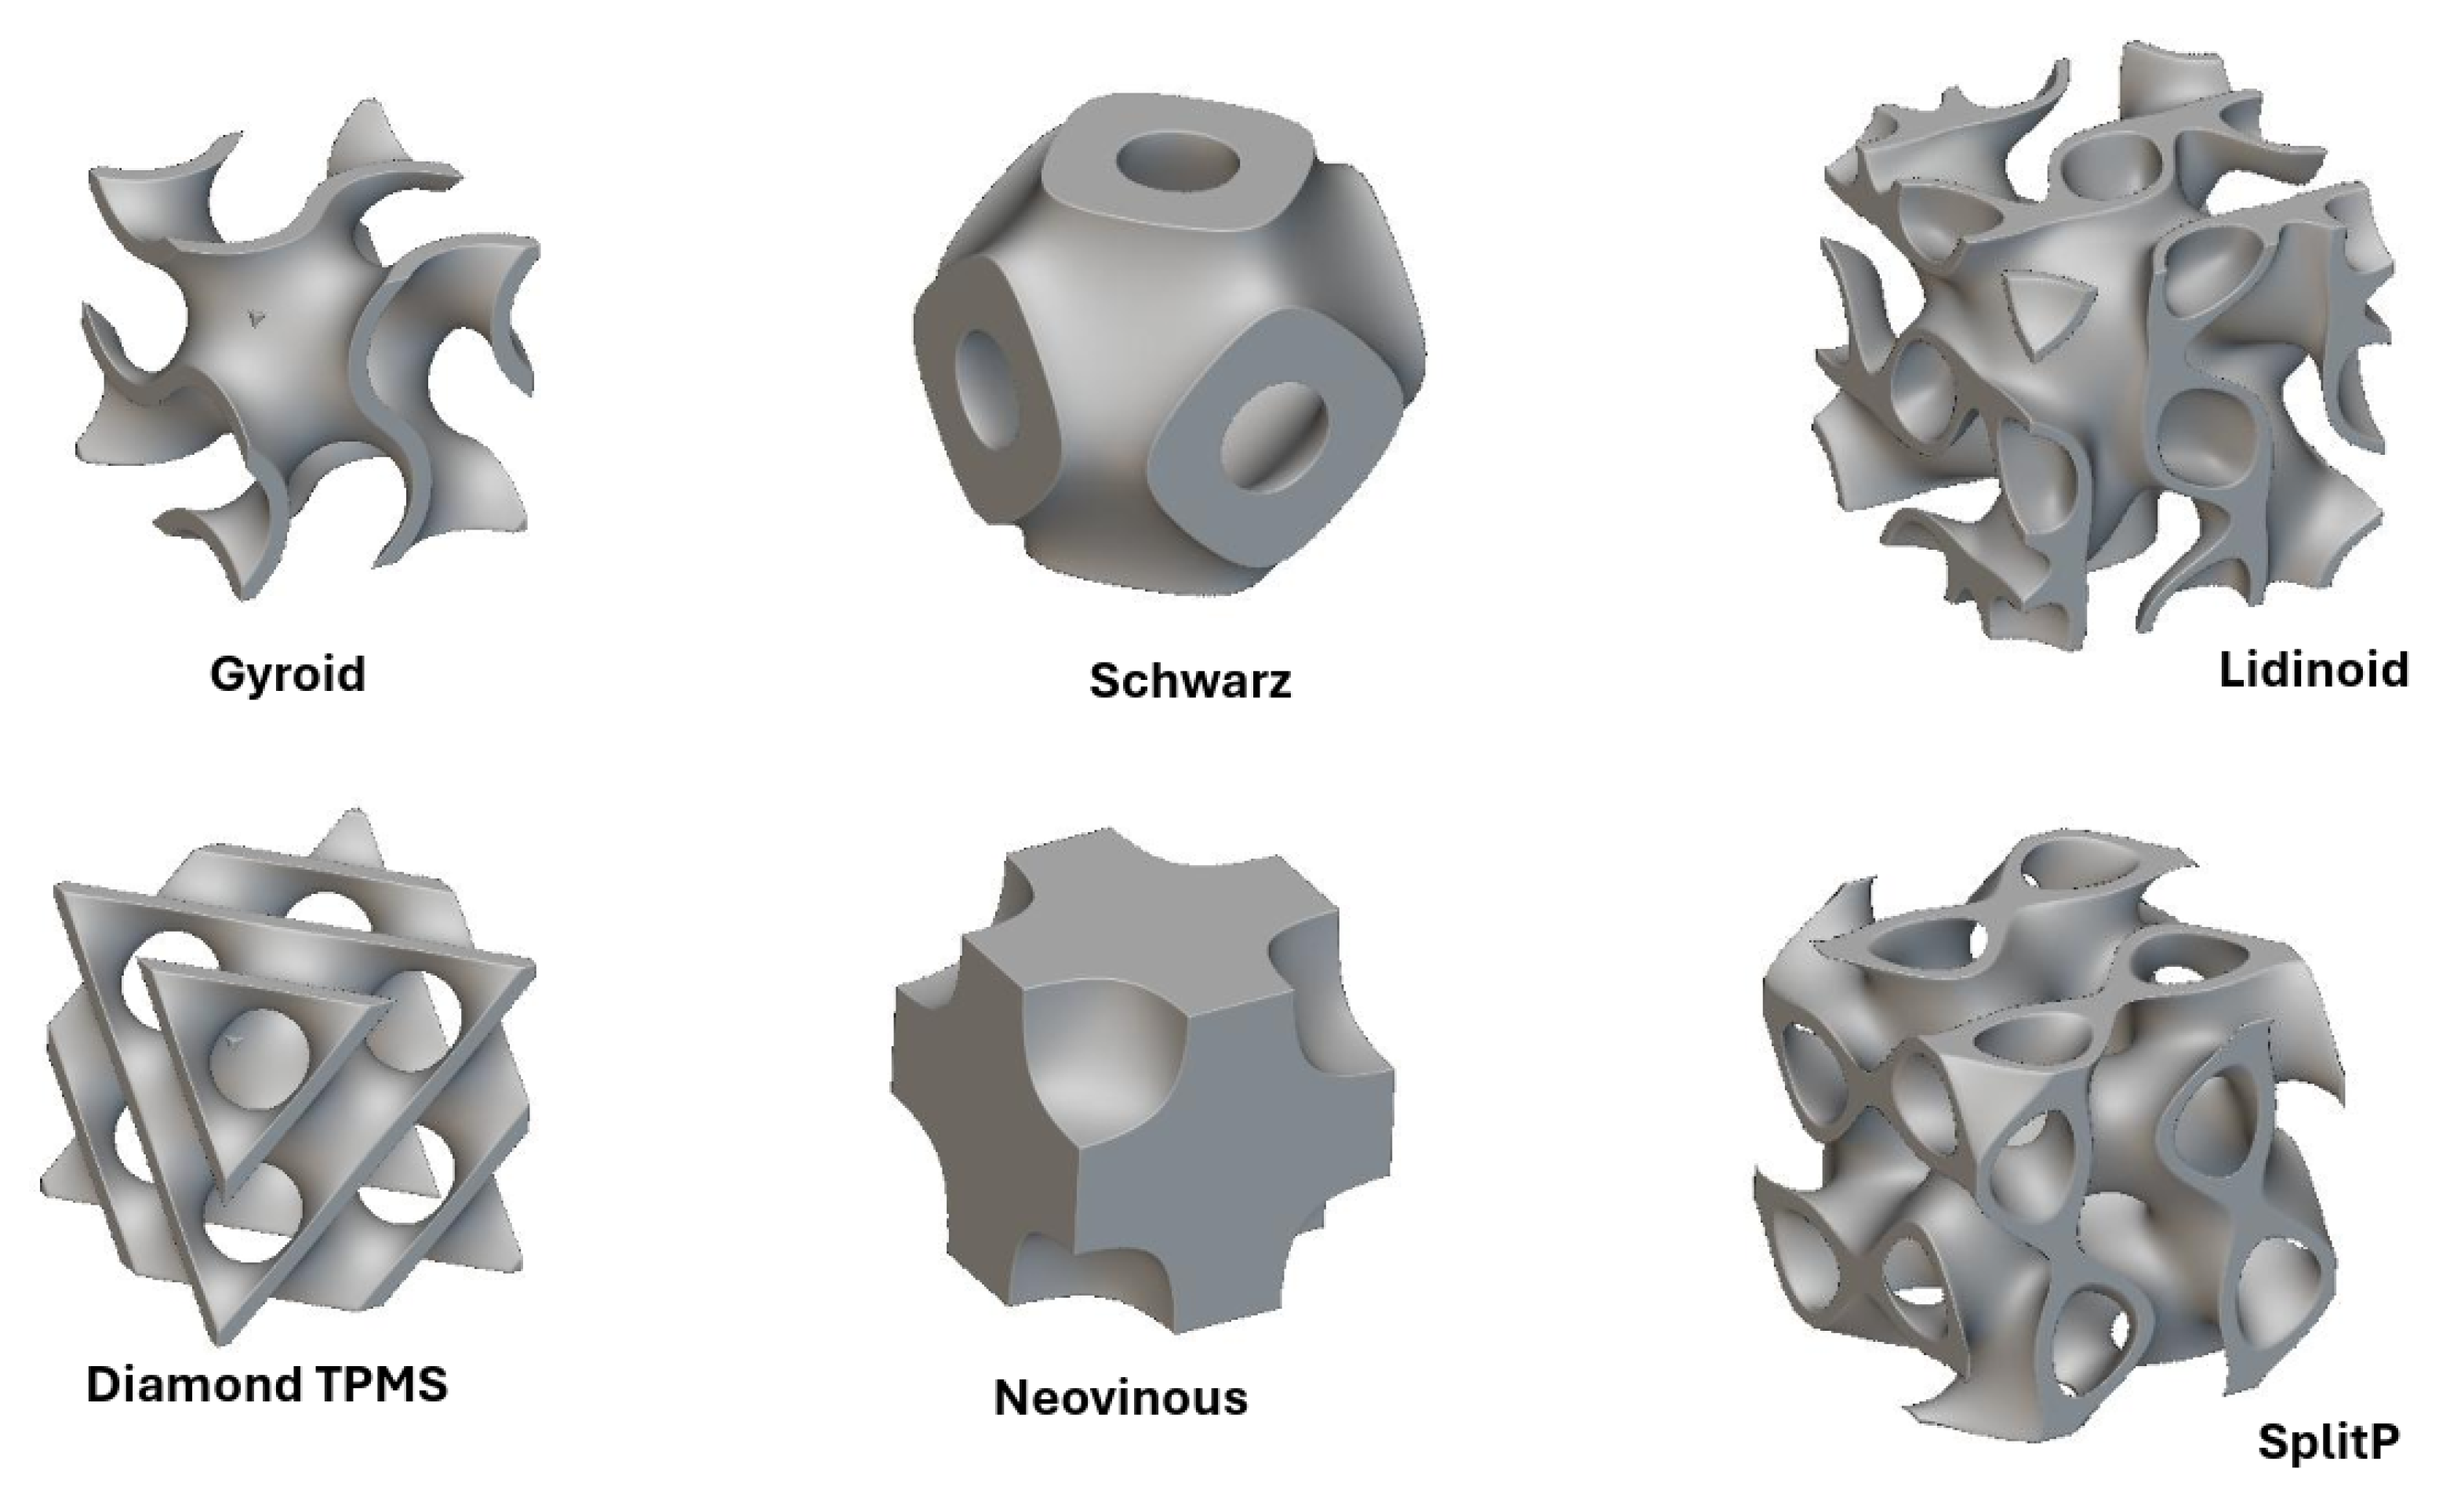
2. Lattice Structures
3. Modelling and Analysis
3.1. Geometric Modelling
3.2. Analysis
3.2.1. Material Properties
- Material: Al 6061 T6
- Density: 2713
- Poisson’s Ratio: 0.33
- Young’s modulus: 6.904E+10 Pa
- Bulk modulus: 6.7686E+10 Pa
- Isotropic Thermal Conductivity: 155.3 W/mK
- Ultimate Tensile strength: 3.131E+8 Pa
- Specific Heat(constant Pressure): 915.7 J/kgK
- Isotropic Secant Coefficient Of Thermal Expansion: 2.278E-5 /K
3.2.2. Boundary Conditions
- (1)
- Film coefficient: 25 W/m2; K
- (2)
- Heat flow(base): 100 W
- (3)
- Ambient temperature: 300 C

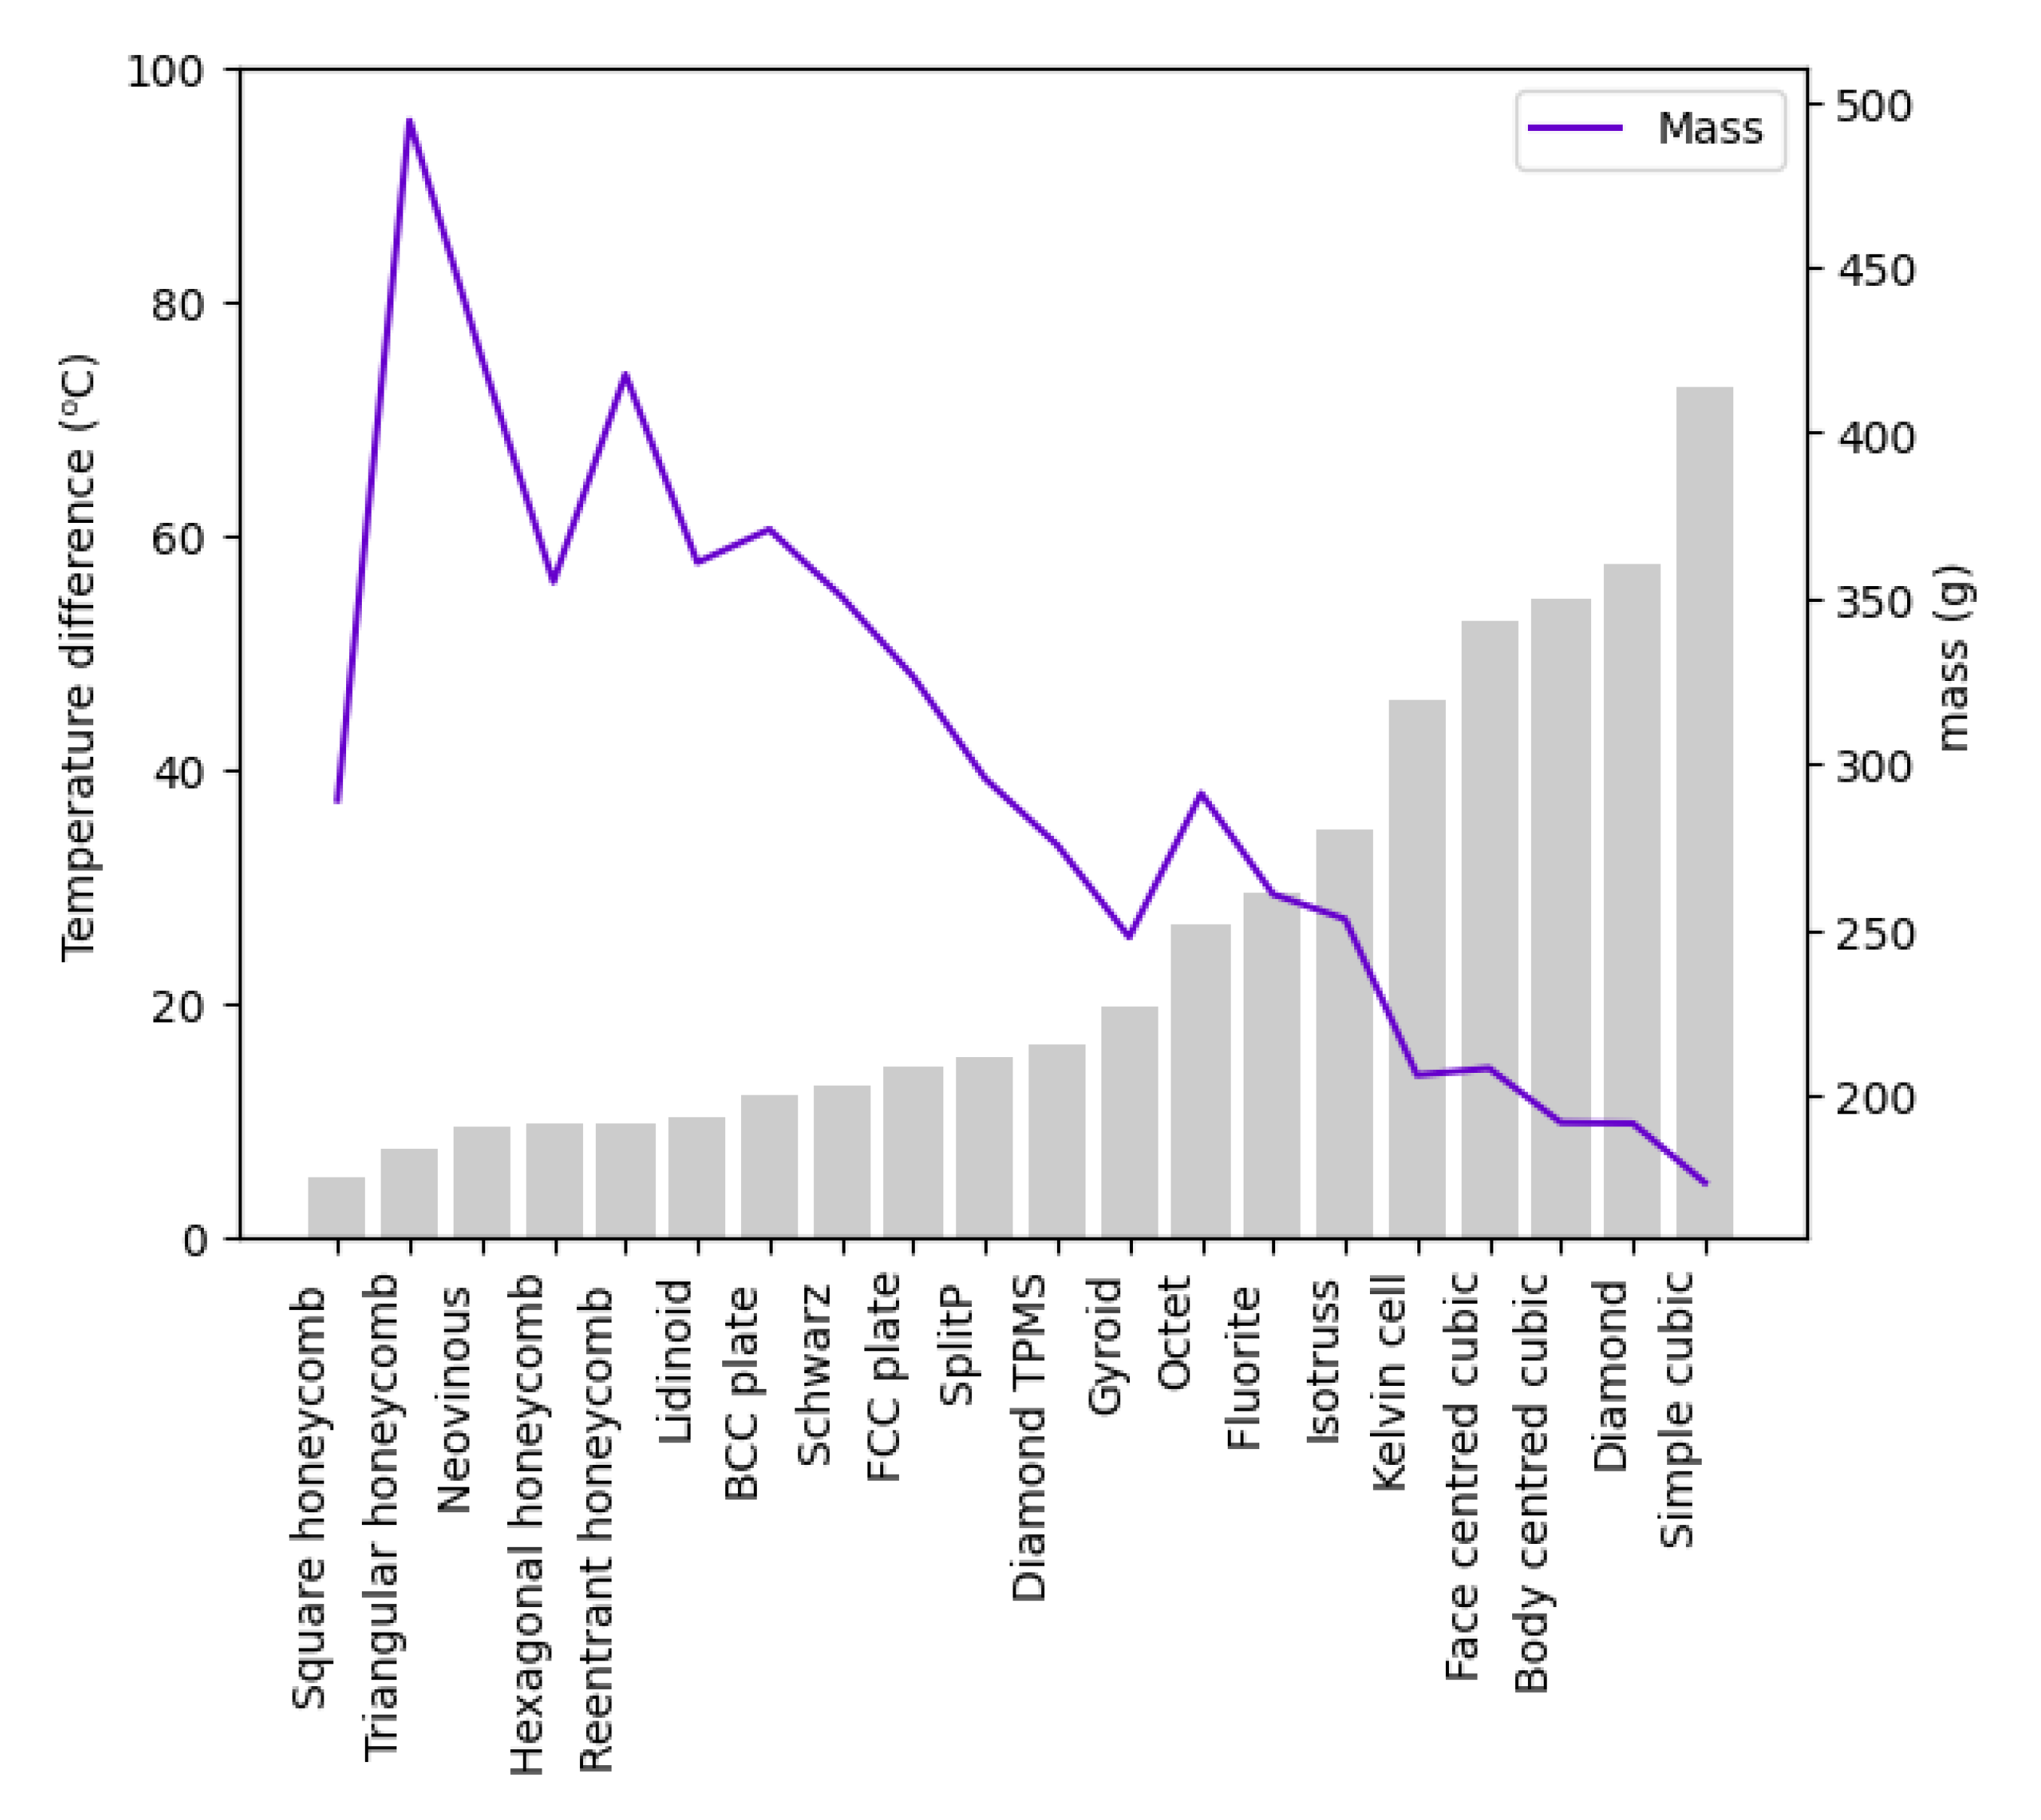
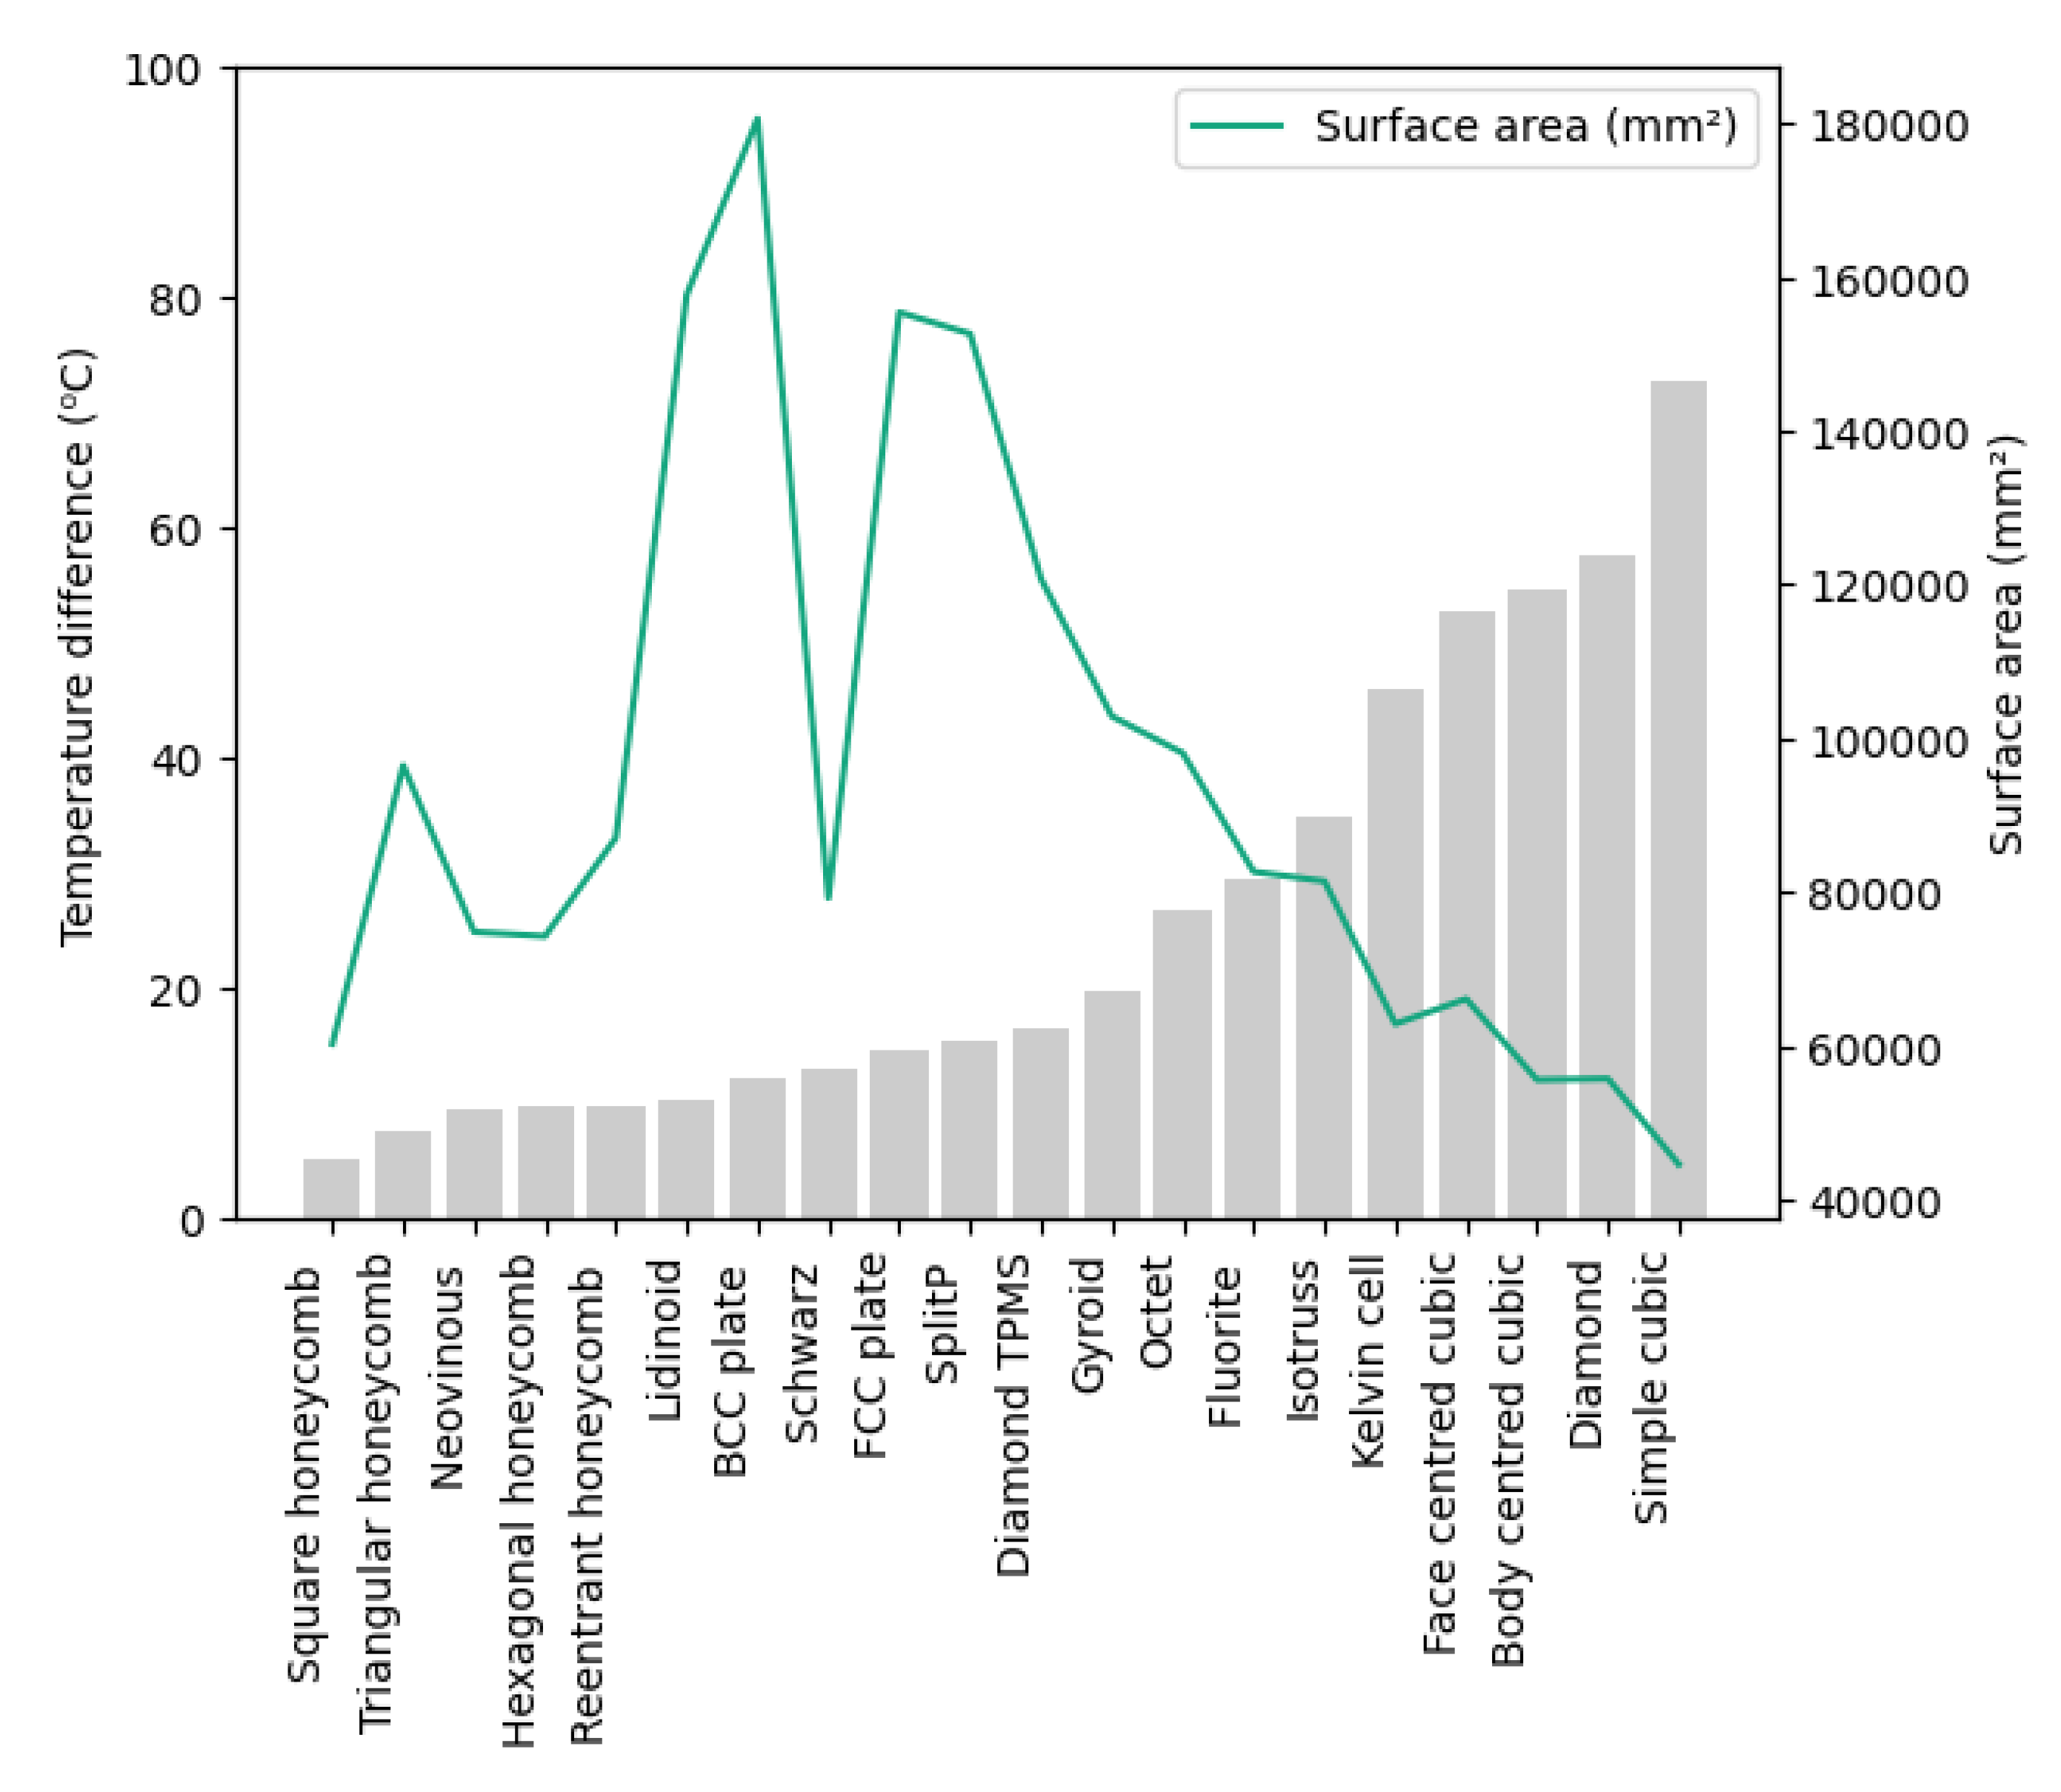
| Unit cell type | Thickness (mm) | Nodes | Elements | Mass(g) | Surface area (mm2;) | Wt. % |
|---|---|---|---|---|---|---|
| Simple cubic | 4 | 223143 | 138108 | 173.74 | 44571.33 | 22.87136012 |
| Body centred cubic | 3 | 279253 | 162839 | 191.86 | 55570.87 | 25.25670054 |
| Face centred cubic | 3 | 321148 | 187137 | 208.27 | 66091.82 | 27.41693434 |
| Diamond | 3 | 304447 | 181469 | 191.64 | 55724.85 | 25.22773946 |
| Octet | 3 | 526883 | 316205 | 291.18 | 98070.46 | 38.33131483 |
| Kelvin cell | 3 | 303670 | 177447 | 206.2 | 62850.66 | 27.14443684 |
| Fluorite | 3 | 438067 | 258296 | 260.78 | 82638.74 | 34.3294192 |
| Isotruss | 3 | 219156 | 136626 | 253.29 | 81405.53 | 33.34342583 |
| Triangular honeycomb | 3 | 343357 | 224716 | 494.2 | 96459.57 | 65.05713233 |
| Hexagonal honeycomb | 3 | 29284 | 122089 | 355 | 74245.7 | 46.73266284 |
| Reentrant honeycomb | 3 | 219977 | 135062 | 417.63 | 87043.11 | 54.9773577 |
| Square honeycomb | 3 | 123582 | 74924 | 289.2 | 60256.69 | 38.07066505 |
| FCC plate | 1 | 428251 | 253213 | 326.36 | 155390.4 | 42.9624559 |
| BCC plate | 1 | 477545 | 296874 | 370.86 | 180576.59 | 48.82049392 |
| Gyroid | 2 | 197347 | 103200 | 247.82 | 102846.45 | 32.6233479 |
| Schwarz | 2 | 207814 | 121741 | 350.62 | 79234.29 | 46.15607393 |
| Diamond TPMS | 2 | 226259 | 116393 | 275.64 | 120721.57 | 36.28560897 |
| Lidinoid | 2 | 281184 | 166176 | 360.86 | 157632.11 | 47.50408088 |
| SplitP | 2 | 609100 | 325740 | 295.65 | 152601.96 | 38.91975146 |
| Neovinous | 1 | 866475 | 597273 | 422.76 | 74812.35 | 55.65267758 |
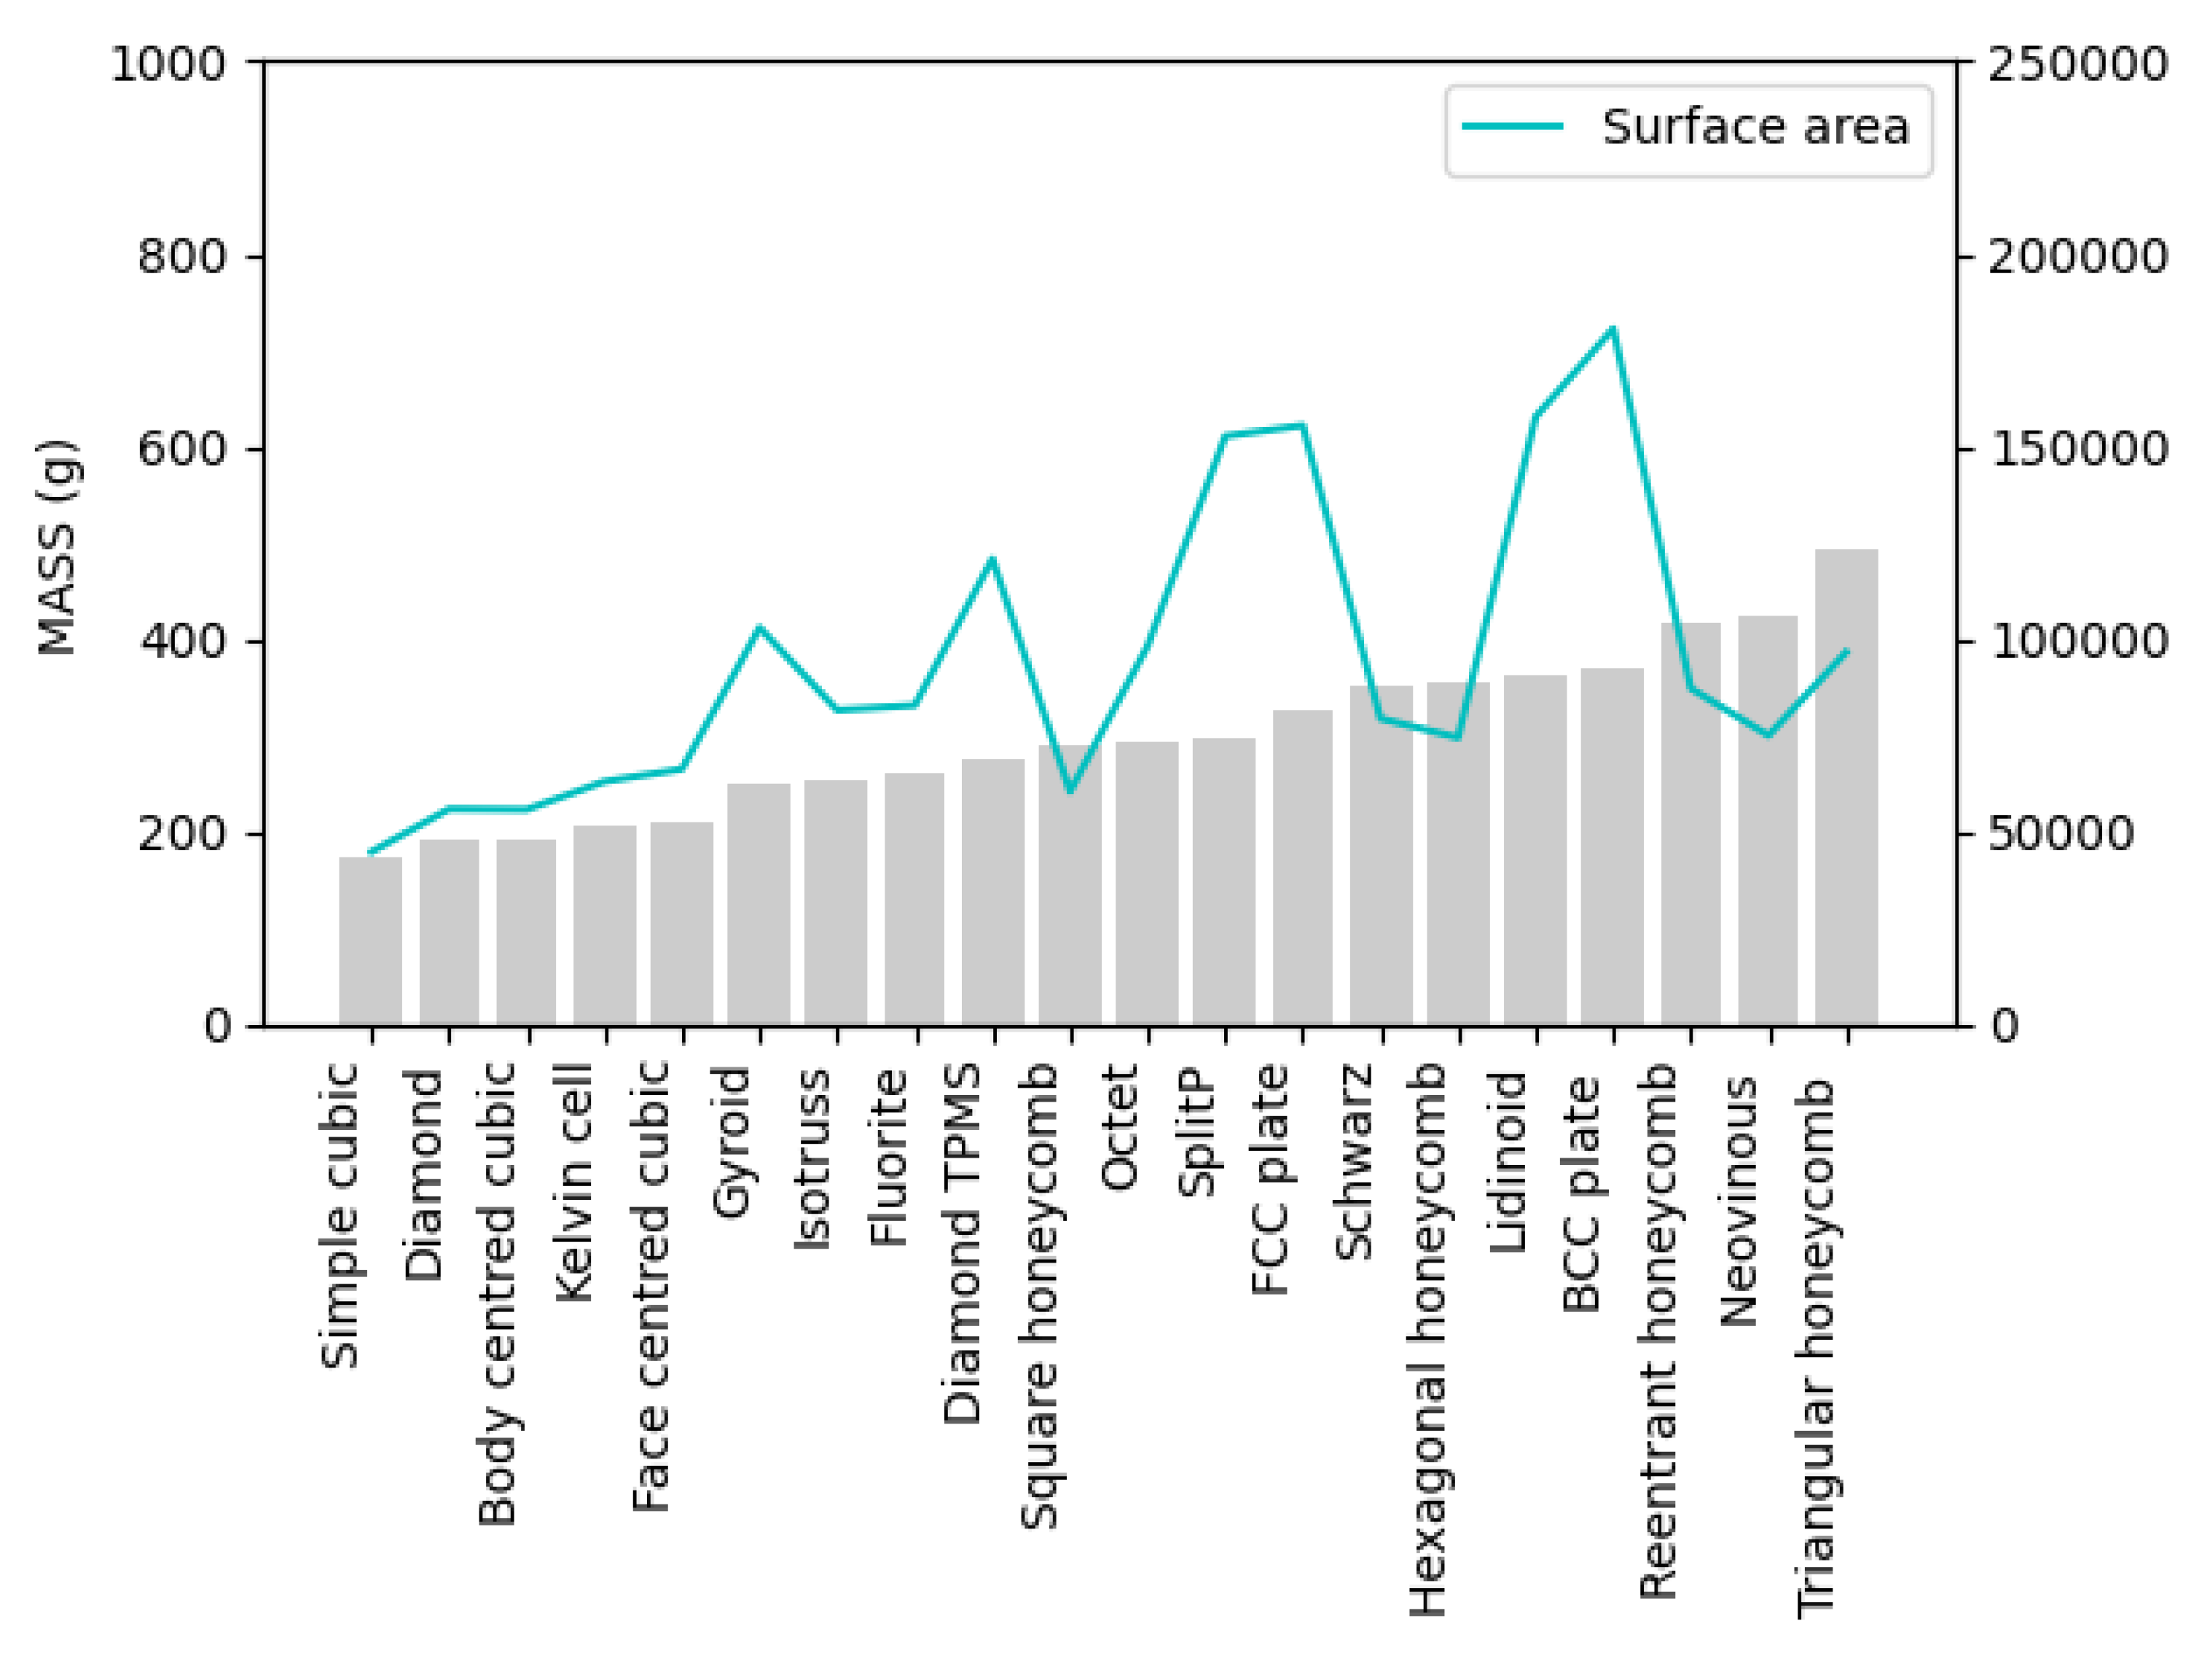
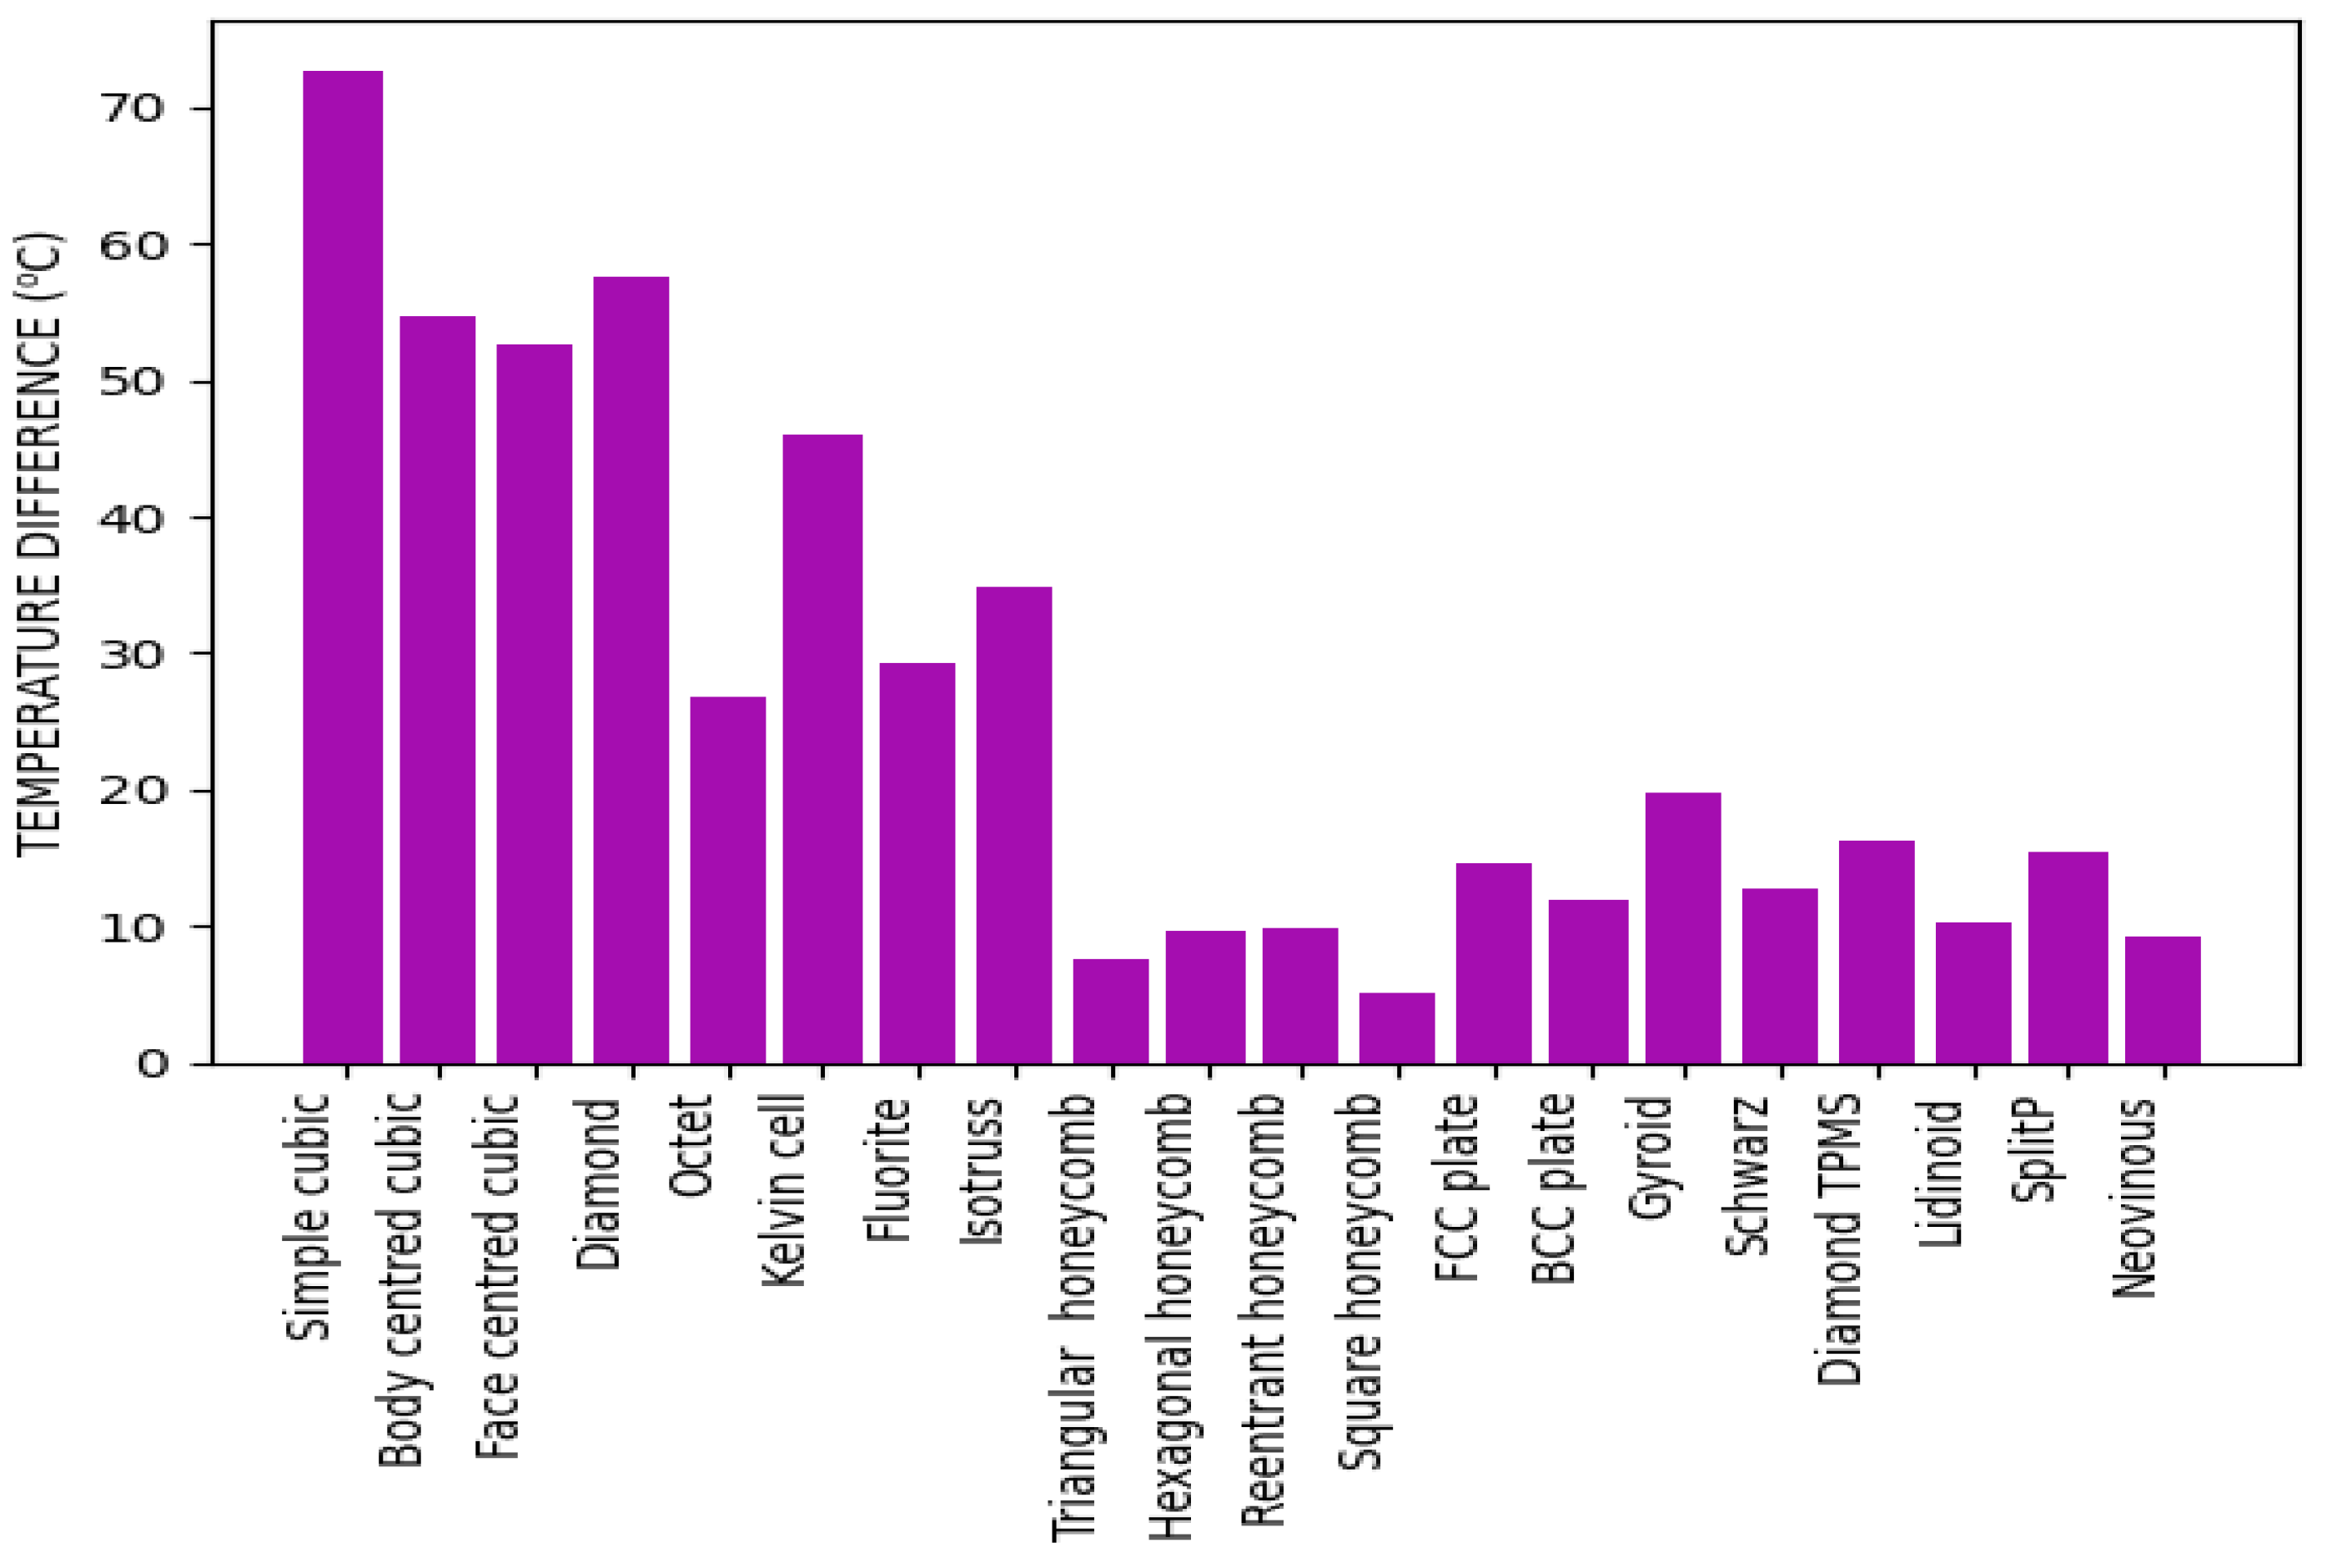
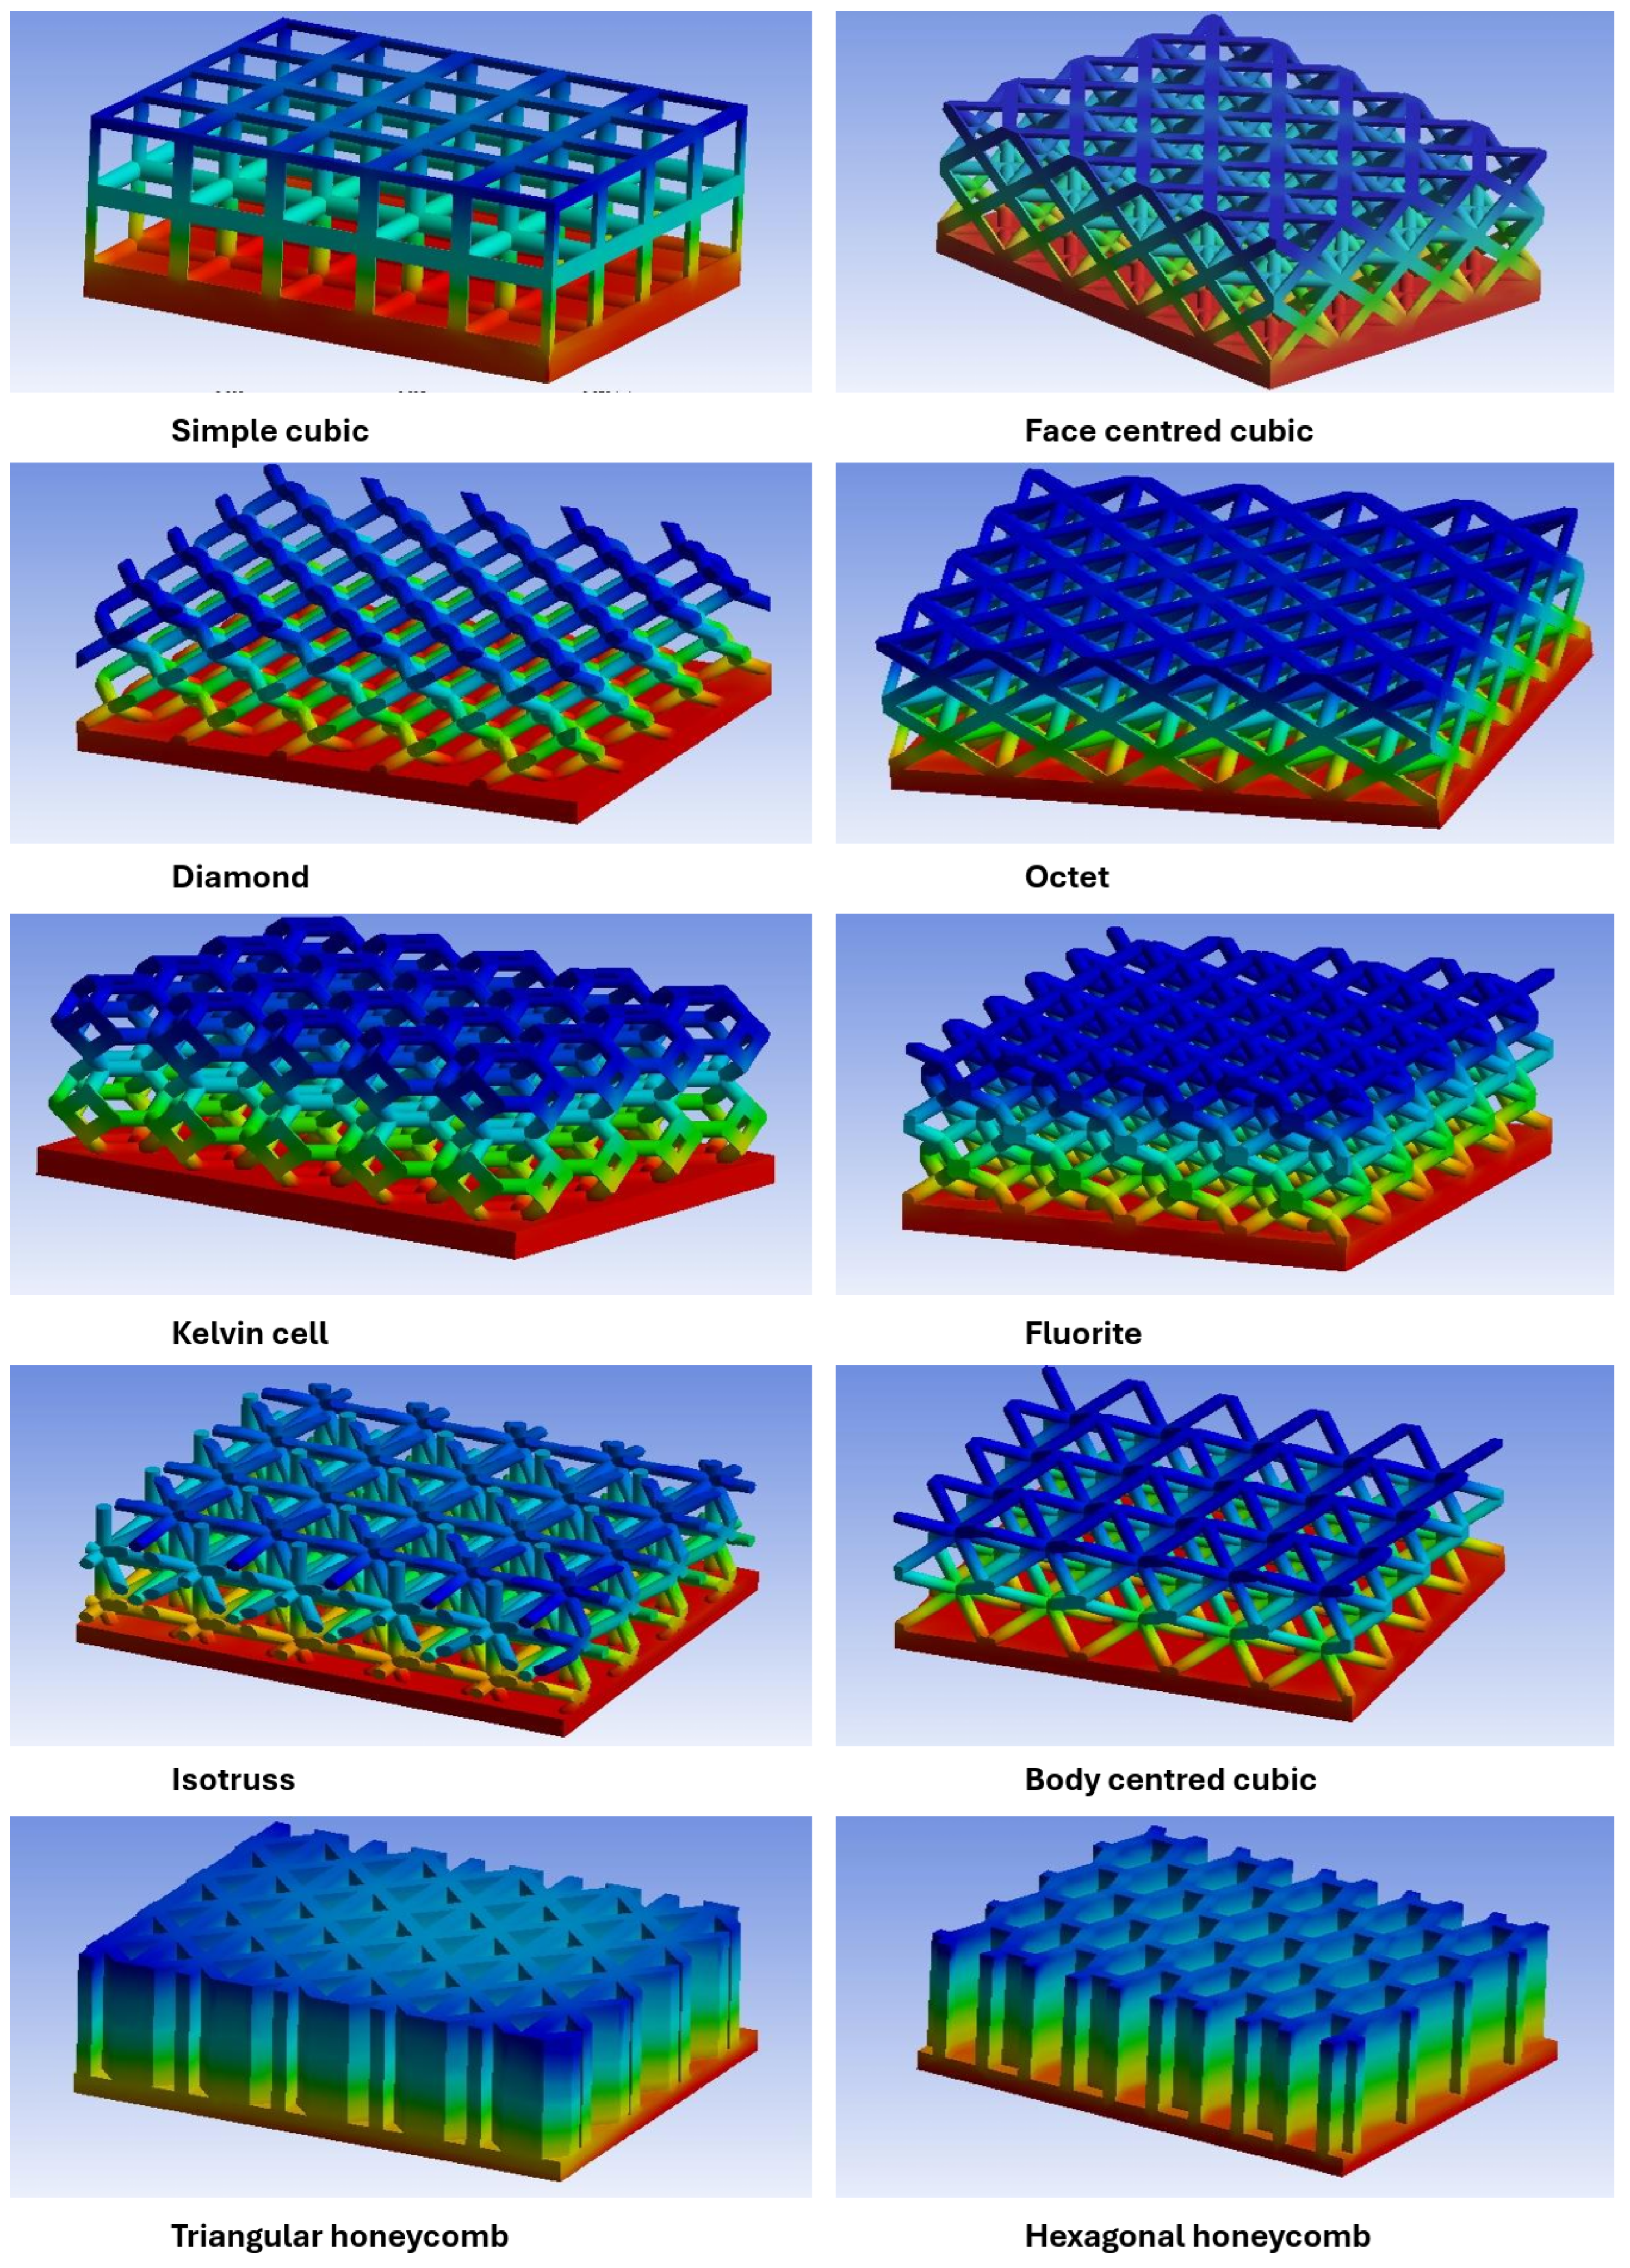
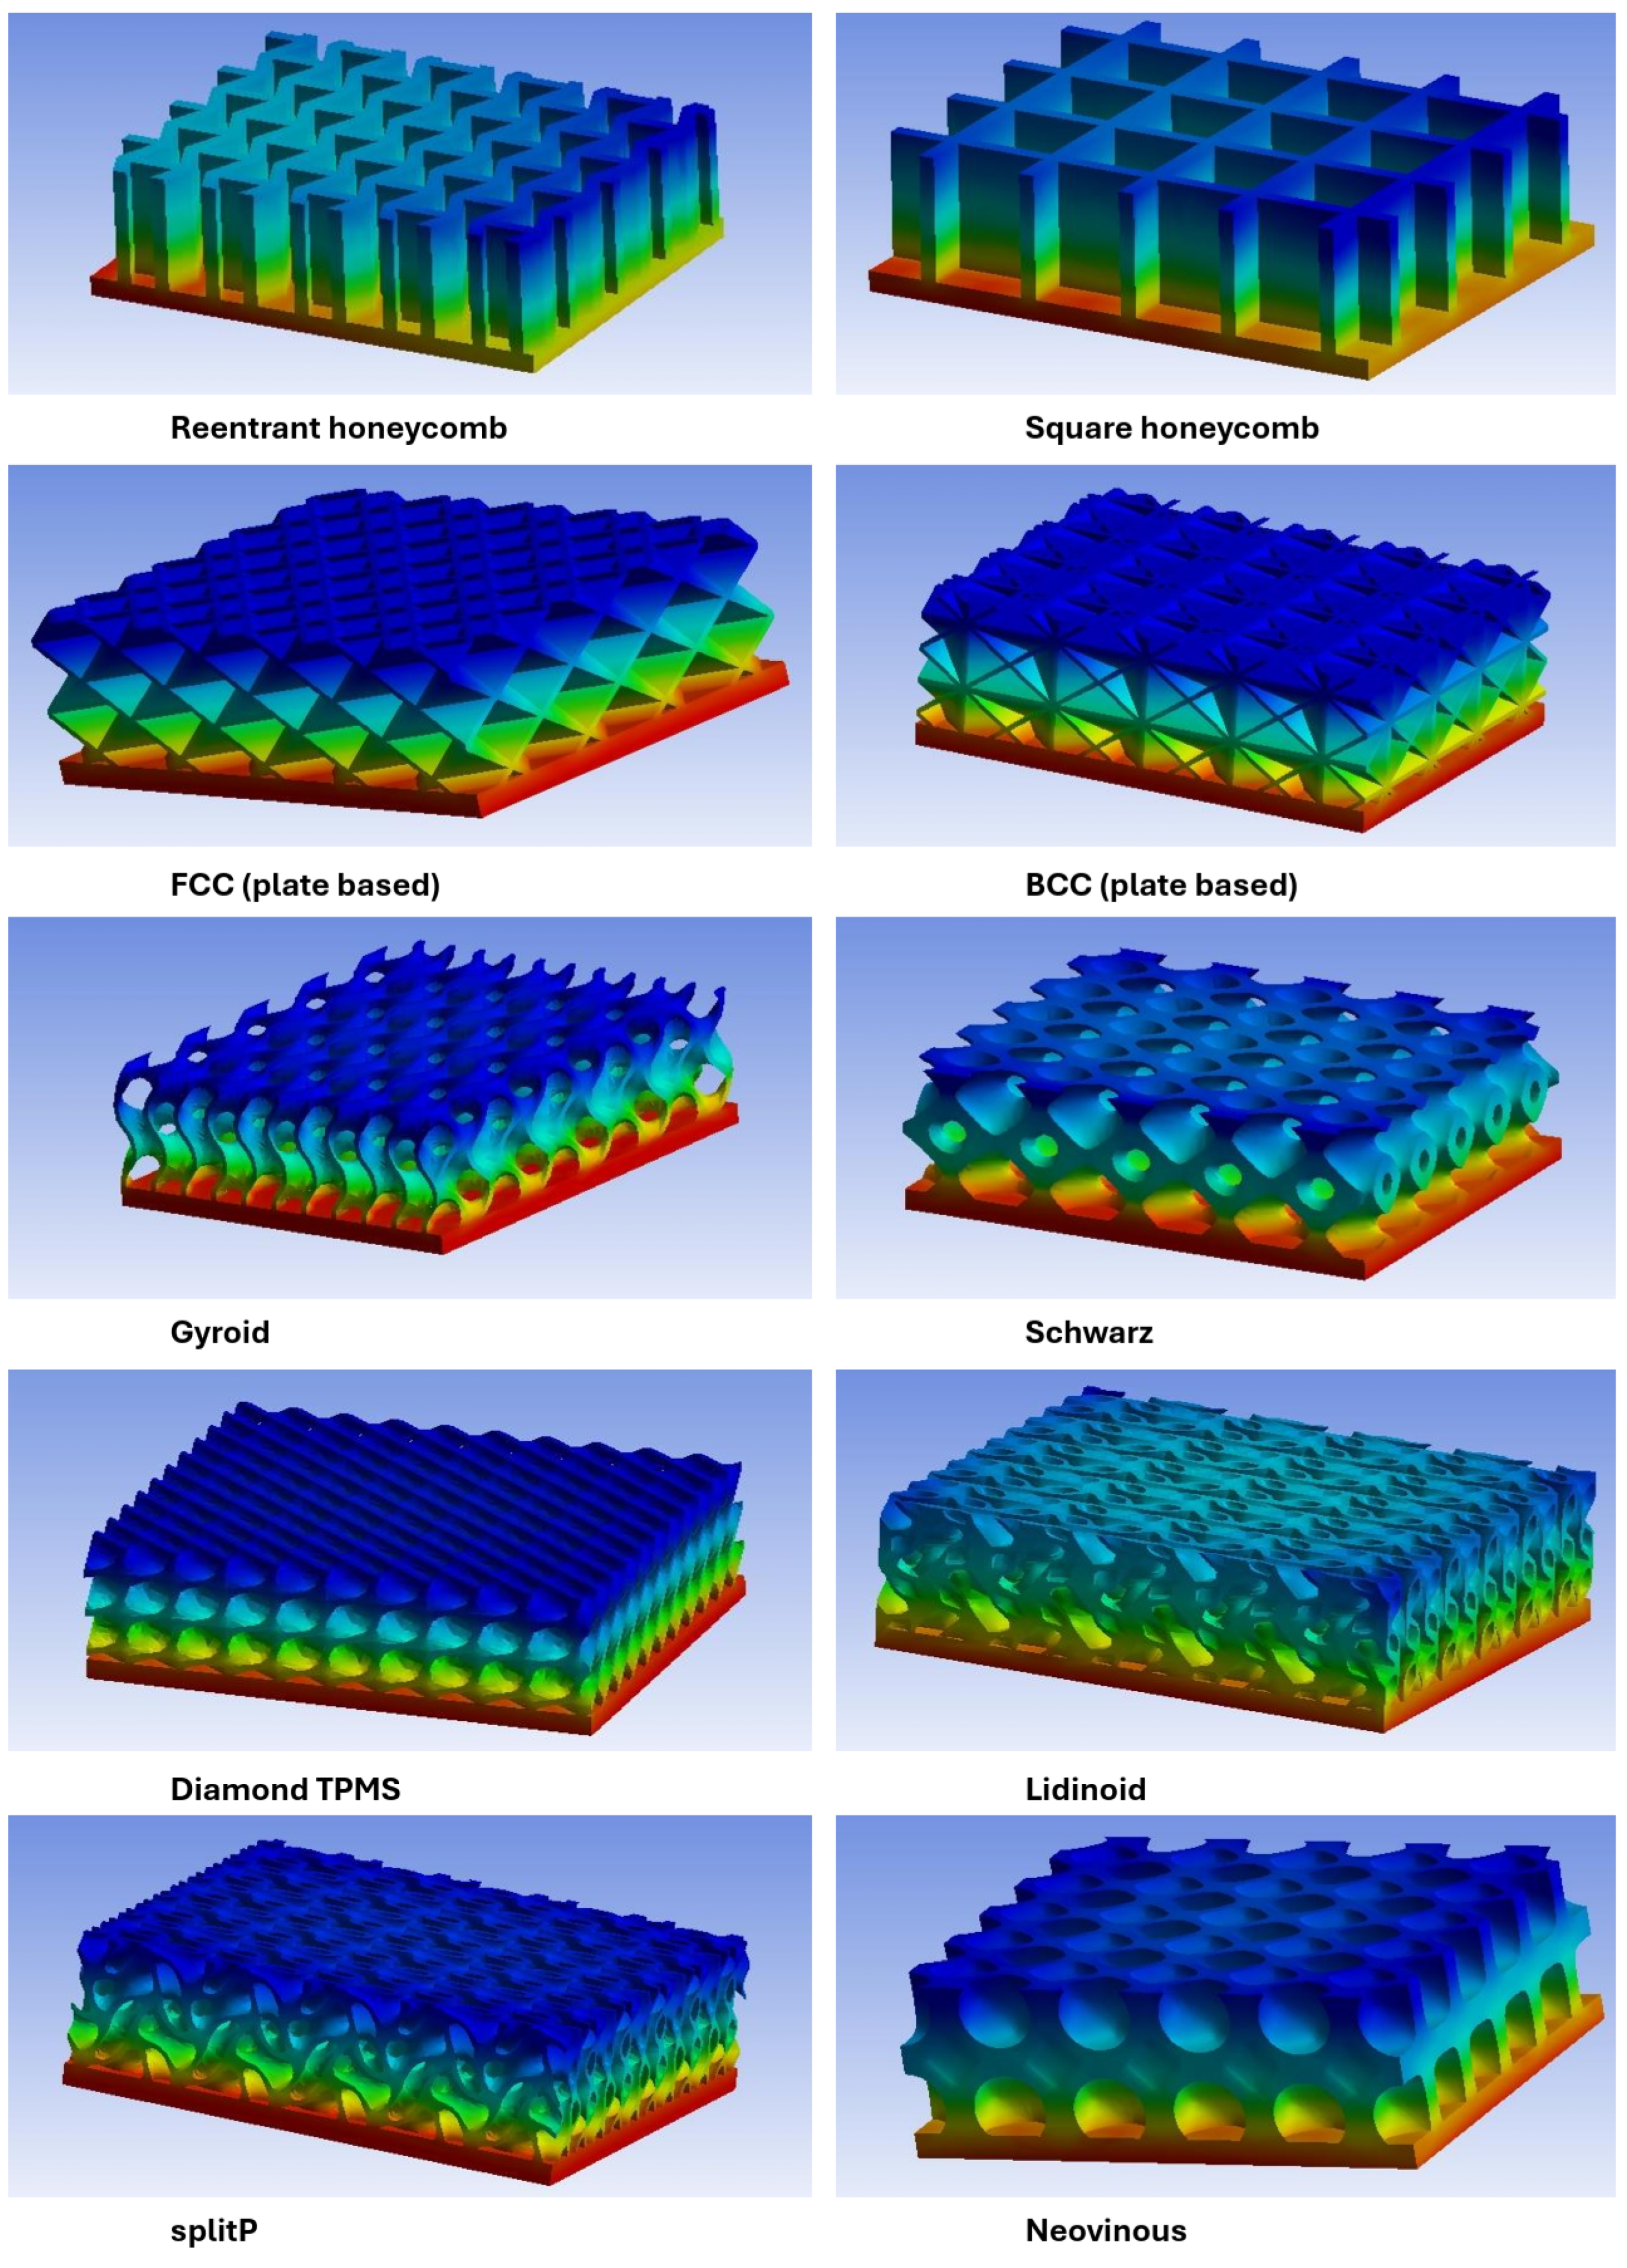
4. Results and Discussion
Acknowledgments
Conflicts of Interest
References
- Arefin, A.M.E. Thermal analysis of modified pin fin heat sink for natural convection. 2016 5th International Conference on Informatics, Electronics and Vision (ICIEV). IEEE, 2016, pp. 1–5.
- Kushwaha, A.S.; Kirar, R. Comparative study of rectangular, trapezoidal and parabolic shaped finned heat sink. IOSR J. Mech. Civ. Eng 2013, 5, 1–7. [Google Scholar] [CrossRef]
- Shah, S.I. Effect of Geometry and Arrangement of Pin Fin in Heat Exchanger: A Review 2016.
- Yardi, A.; Karguppikar, A.; Tanksale, G.; Sharma, K. Optimization of Fin spacing by analyzing the heat transfer through rectangular fin array configurations (Natural convection). International Research Journal of Engineering and Technology (IRJET) 2017, 4. [Google Scholar]
- Dewan, A.; Patro, P.; Khan, I.; Mahanta, P. The effect of fin spacing and material on the performance of a heat sink with circular pin fins. Proceedings of the Institution of Mechanical Engineers, Part A: Journal of Power and Energy 2010, 224, 35–46. [Google Scholar] [CrossRef]
- Catchpole-Smith, S.; Sélo, R.; Davis, A.; Ashcroft, I.; Tuck, C.; Clare, A. Thermal conductivity of TPMS lattice structures manufactured via laser powder bed fusion. Additive Manufacturing 2019, 30, 100846. [Google Scholar] [CrossRef]
- Nazir, A.; Abate, K.M.; Kumar, A.; Jeng, J.Y. A state-of-the-art review on types, design, optimization, and additive manufacturing of cellular structures. The International Journal of Advanced Manufacturing Technology 2019, 104, 3489–3510. [Google Scholar] [CrossRef]
- Perween, S.; Fahad, M.; Khan, M.A. Systematic experimental evaluation of function based cellular lattice structure manufactured by 3d printing. Applied Sciences 2021, 11, 10489. [Google Scholar] [CrossRef]
- Dong, G.; Tang, Y.; Zhao, Y.F. A survey of modeling of lattice structures fabricated by additive manufacturing. Journal of Mechanical Design 2017, 139, 100906. [Google Scholar] [CrossRef]
- Schaedler, T.A.; Carter, W.B. Architected cellular materials. Annual Review of Materials Research 2016, 46, 187–210. [Google Scholar] [CrossRef]
- Ashby, M.F.; Gibson, L.J. Cellular solids: structure and properties. Press Syndicate of the University of Cambridge, Cambridge, UK, 1997, pp.175–231.
- Jia, Z.; Liu, F.; Jiang, X.; Wang, L. Engineering lattice metamaterials for extreme property, programmability, and multifunctionality. Journal of Applied Physics 2020, 127. [Google Scholar] [CrossRef]
- Jia, Z.; Yu, Y.; Wang, L. Learning from nature: Use material architecture to break the performance tradeoffs. Materials & Design 2019, 168, 107650. [Google Scholar]
- Ritchie, R.O. The conflicts between strength and toughness. Nature materials 2011, 10, 817–822. [Google Scholar] [CrossRef] [PubMed]
- Bouville, F.; Maire, E.; Meille, S.; Van de Moortèle, B.; Stevenson, A.J.; Deville, S. Strong, tough and stiff bioinspired ceramics from brittle constituents. Nature materials 2014, 13, 508–514. [Google Scholar] [CrossRef] [PubMed]
- Benedetti, M.; Du Plessis, A.; Ritchie, R.; Dallago, M.; Razavi, N.; Berto, F. Architected cellular materials: A review on their mechanical properties towards fatigue-tolerant design and fabrication. Materials Science and Engineering: R: Reports 2021, 144, 100606. [Google Scholar] [CrossRef]
- Pei, E.; Kabir, I.; Breški, T.; Godec, D.; Nordin, A. A review of geometric dimensioning and tolerancing (GD&T) of additive manufacturing and powder bed fusion lattices. Progress in additive manufacturing 2022, 7, 1297–1305. [Google Scholar]
- Abou-Ali, A.M.; Lee, D.W.; Abu Al-Rub, R.K. On the Effect of Lattice Topology on Mechanical Properties of SLS Additively Manufactured Sheet-, Ligament-, and Strut-Based Polymeric Metamaterials. Polymers 2022, 14, 4583. [Google Scholar] [CrossRef] [PubMed]
- Guo, X.; Zheng, X.; Yang, Y.; Yang, X.; Yi, Y. Mechanical behavior of TPMS-based scaffolds: a comparison between minimal surfaces and their lattice structures. SN Applied Sciences 2019, 1, 1145. [Google Scholar] [CrossRef]
- Tancogne-Dejean, T.; Diamantopoulou, M.; Gorji, M.B.; Bonatti, C.; Mohr, D. 3D plate-lattices: an emerging class of low-density metamaterial exhibiting optimal isotropic stiffness. Advanced Materials 2018, 30, 1803334. [Google Scholar] [CrossRef]
- Andrew, J.J.; Alhashmi, H.; Schiffer, A.; Kumar, S.; Deshpande, V.S. Energy absorption and self-sensing performance of 3D printed CF/PEEK cellular composites. Materials & Design 2021, 208, 109863. [Google Scholar]
- Pronk, T.; Ayas, C.; Tekõglu, C. A quest for 2D lattice materials for actuation. Journal of the Mechanics and Physics of Solids 2017, 105, 199–216. [Google Scholar] [CrossRef]
- Opalach, A.; Maddock, S. An overview of implicit surfaces. Introduction to modelling and animation using implicit surfaces 1995, pp.1–1.
- Fayolle, P.A.; Fryazinov, O.; Pasko, A. Rounding, filleting and smoothing of implicit surfaces. Computer-Aided Design and Applications 2018, 15, 399–408. [Google Scholar] [CrossRef]
- Li, Q.; Hong, Q.; Qi, Q.; Ma, X.; Han, X.; Tian, J. Towards additive manufacturing oriented geometric modeling using implicit functions. Visual Computing for Industry, Biomedicine, and Art 2018, 1, 1–16. [Google Scholar] [CrossRef] [PubMed]
- Moreira, T.A.; Colmanetti, A.R.A.; Tibirica, C.B. Heat transfer coefficient: a review of measurement techniques. Journal of the Brazilian Society of Mechanical Sciences and Engineering 2019, 41, 1–25. [Google Scholar] [CrossRef]
- Gradziel, S.; Majewski, K.; Majdak, M. Experimental determination of the heat transfer coefficient in internally rifled tubes. Thermal Science 2019, 23, 1163–1174. [Google Scholar] [CrossRef]
- Bury, T.; Drapała, M.H. Evaluation of selected methods of the heat transfer coefficient determination in fin-and-tube cross-flow heat exchangers. MATEC Web of Conferences. EDP Sciences, 2018, Vol. 240, p. 02004.
- Erdoğdu, F. A review on simultaneous determination of thermal diffusivity and heat transfer coefficient. Journal of Food Engineering 2008, 86, 453–459. [Google Scholar] [CrossRef]
- Abramkina, D.; Abramyan, A.; Shevchenko-Enns, E. Experimental Determination of Convective Heat Transfer Coefficients in Thermal Buoyacy Ventilation System. Herald of Dagestan State Technical University Technical Sciences 2019, 45, 133–141. [Google Scholar] [CrossRef]
- Korprasertsak, N.; Leephakpreeda, T. Real-time determination of convective heat transfer coefficient via thermoelectric modules. Journal of Heat Transfer 2017, 139, 101701. [Google Scholar] [CrossRef]

| Element | Wt. % |
|---|---|
| Al | 95.8- 98.6 |
| Cr | 0.04- 0.35 |
| Cu | 0.15- 0.4 |
| Fe | Max 0.7 |
| Mg | 0.8- 1.2 |
| Mn | Max 0.15 |
| Si | 0.4- 0.8 |
| Ti | Max 0.15 |
| Zn | Max 0.25 |
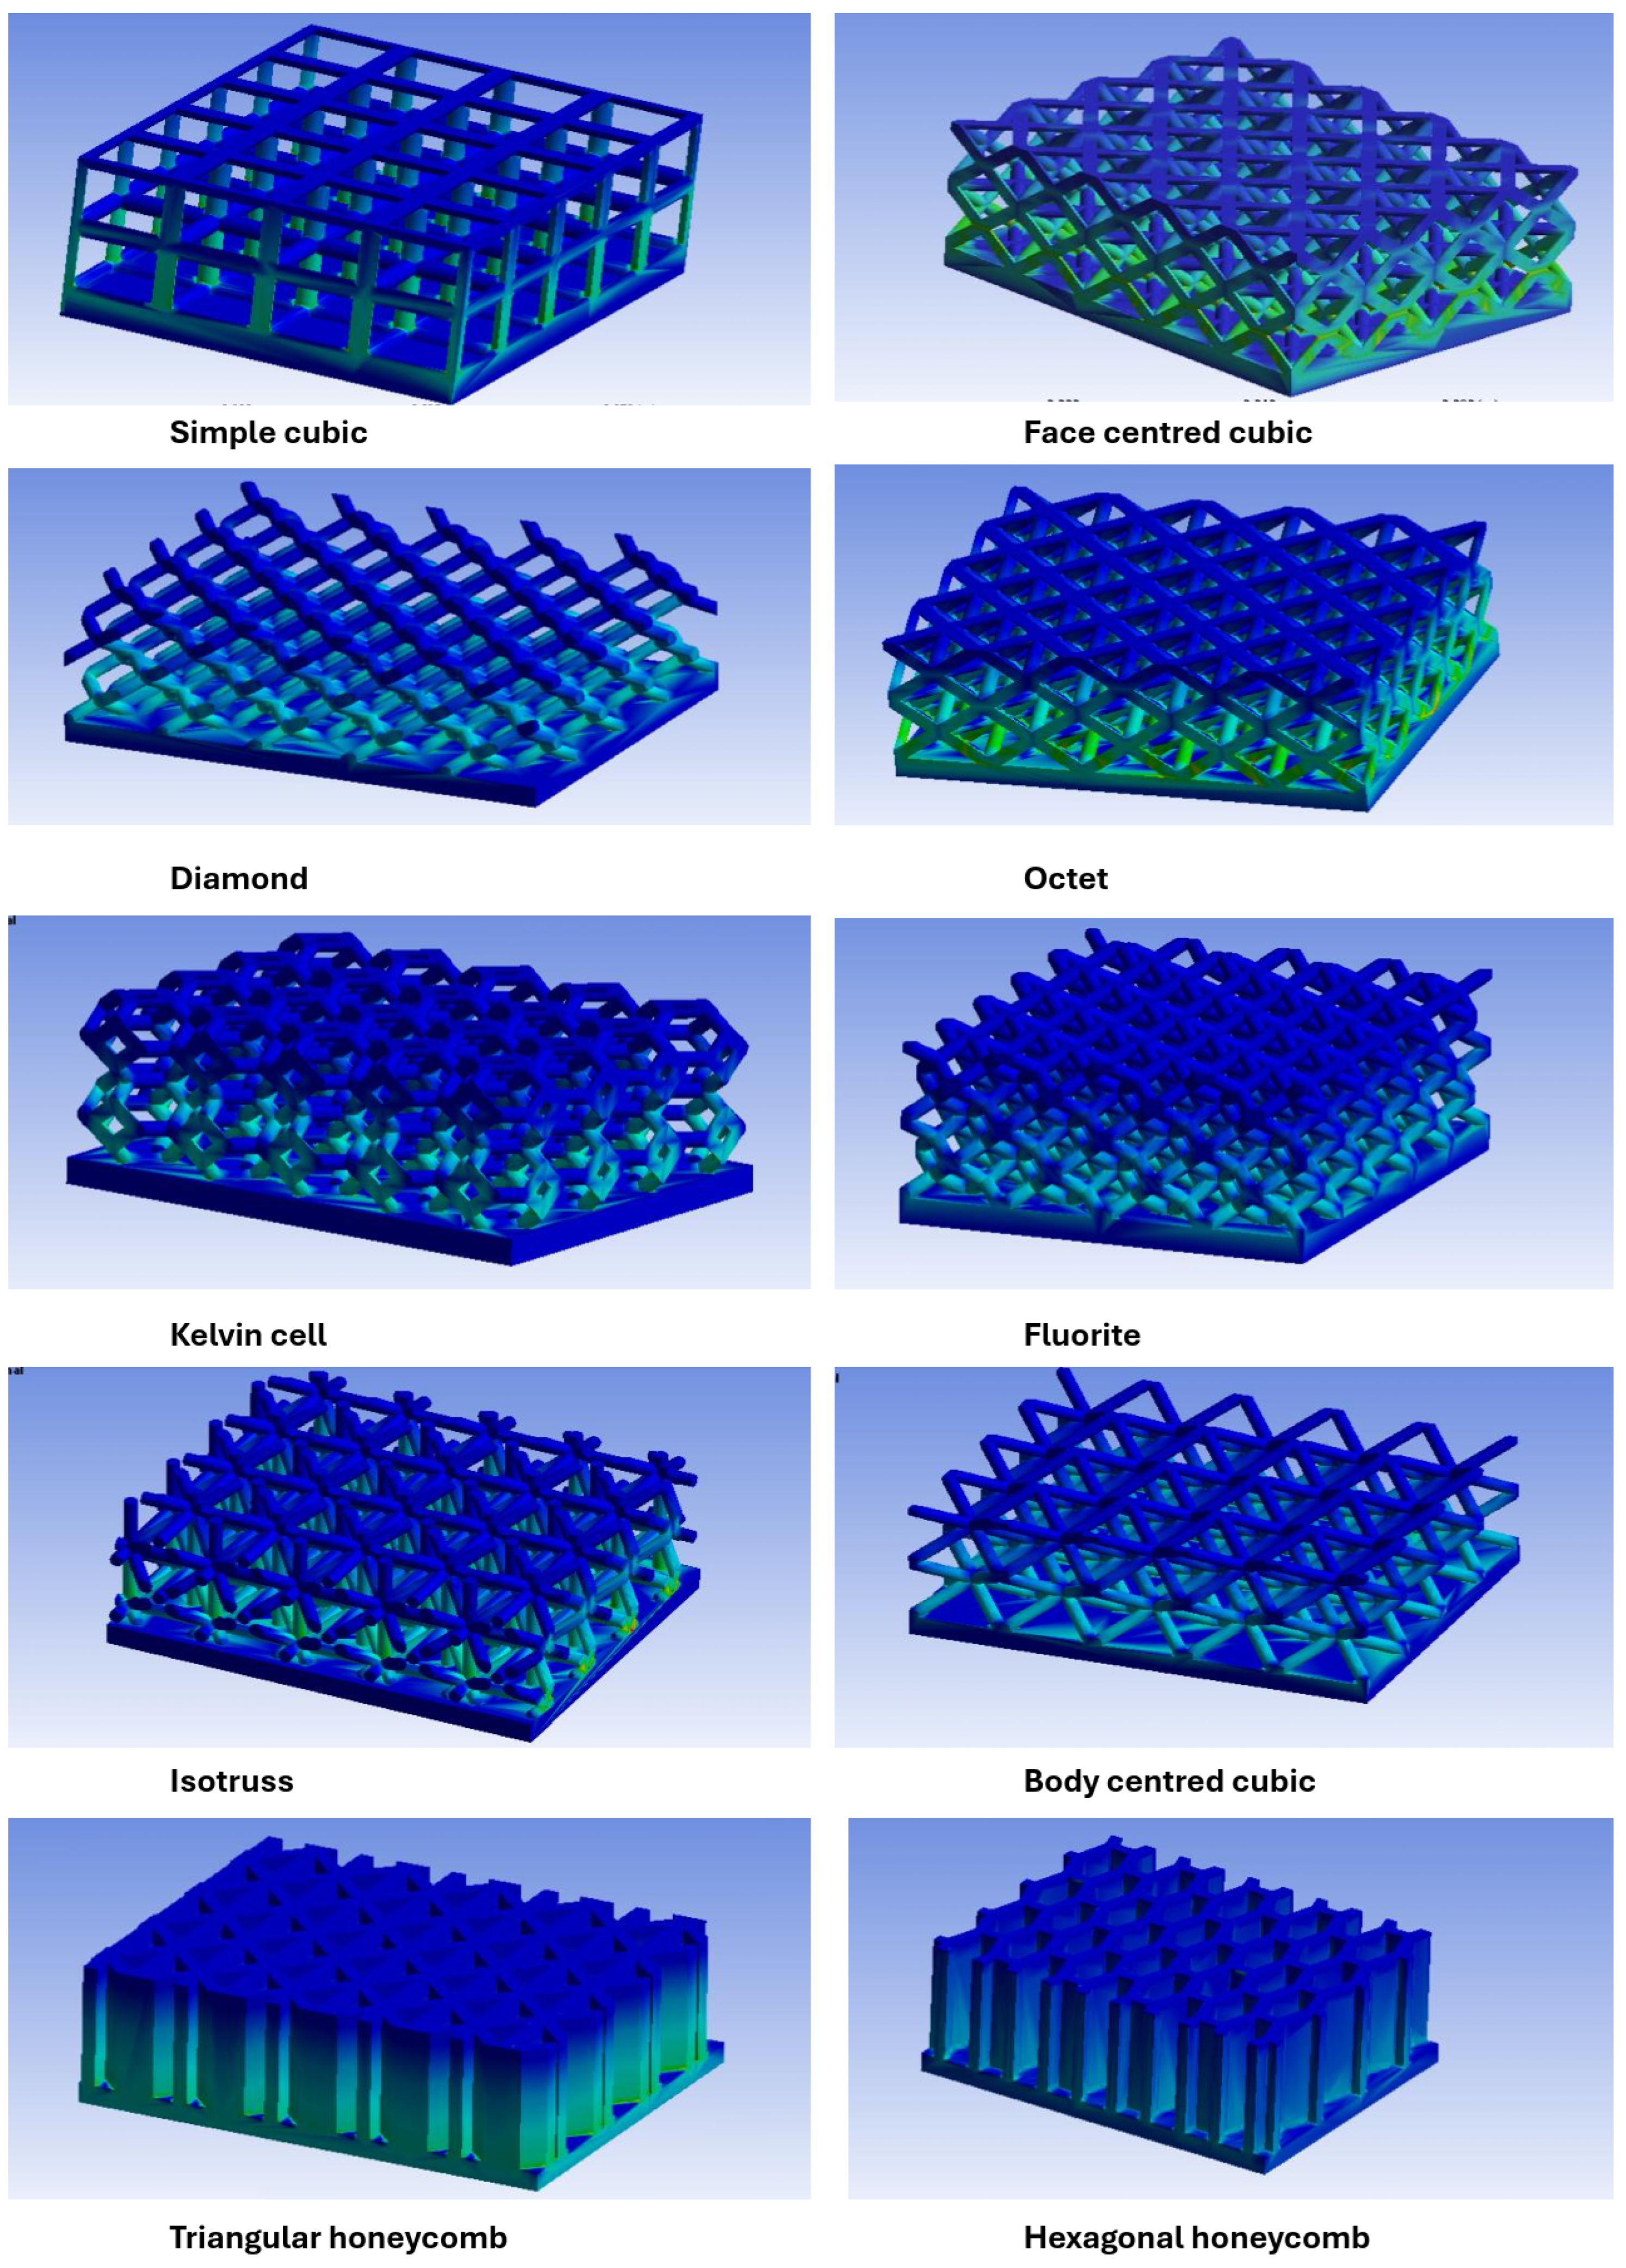
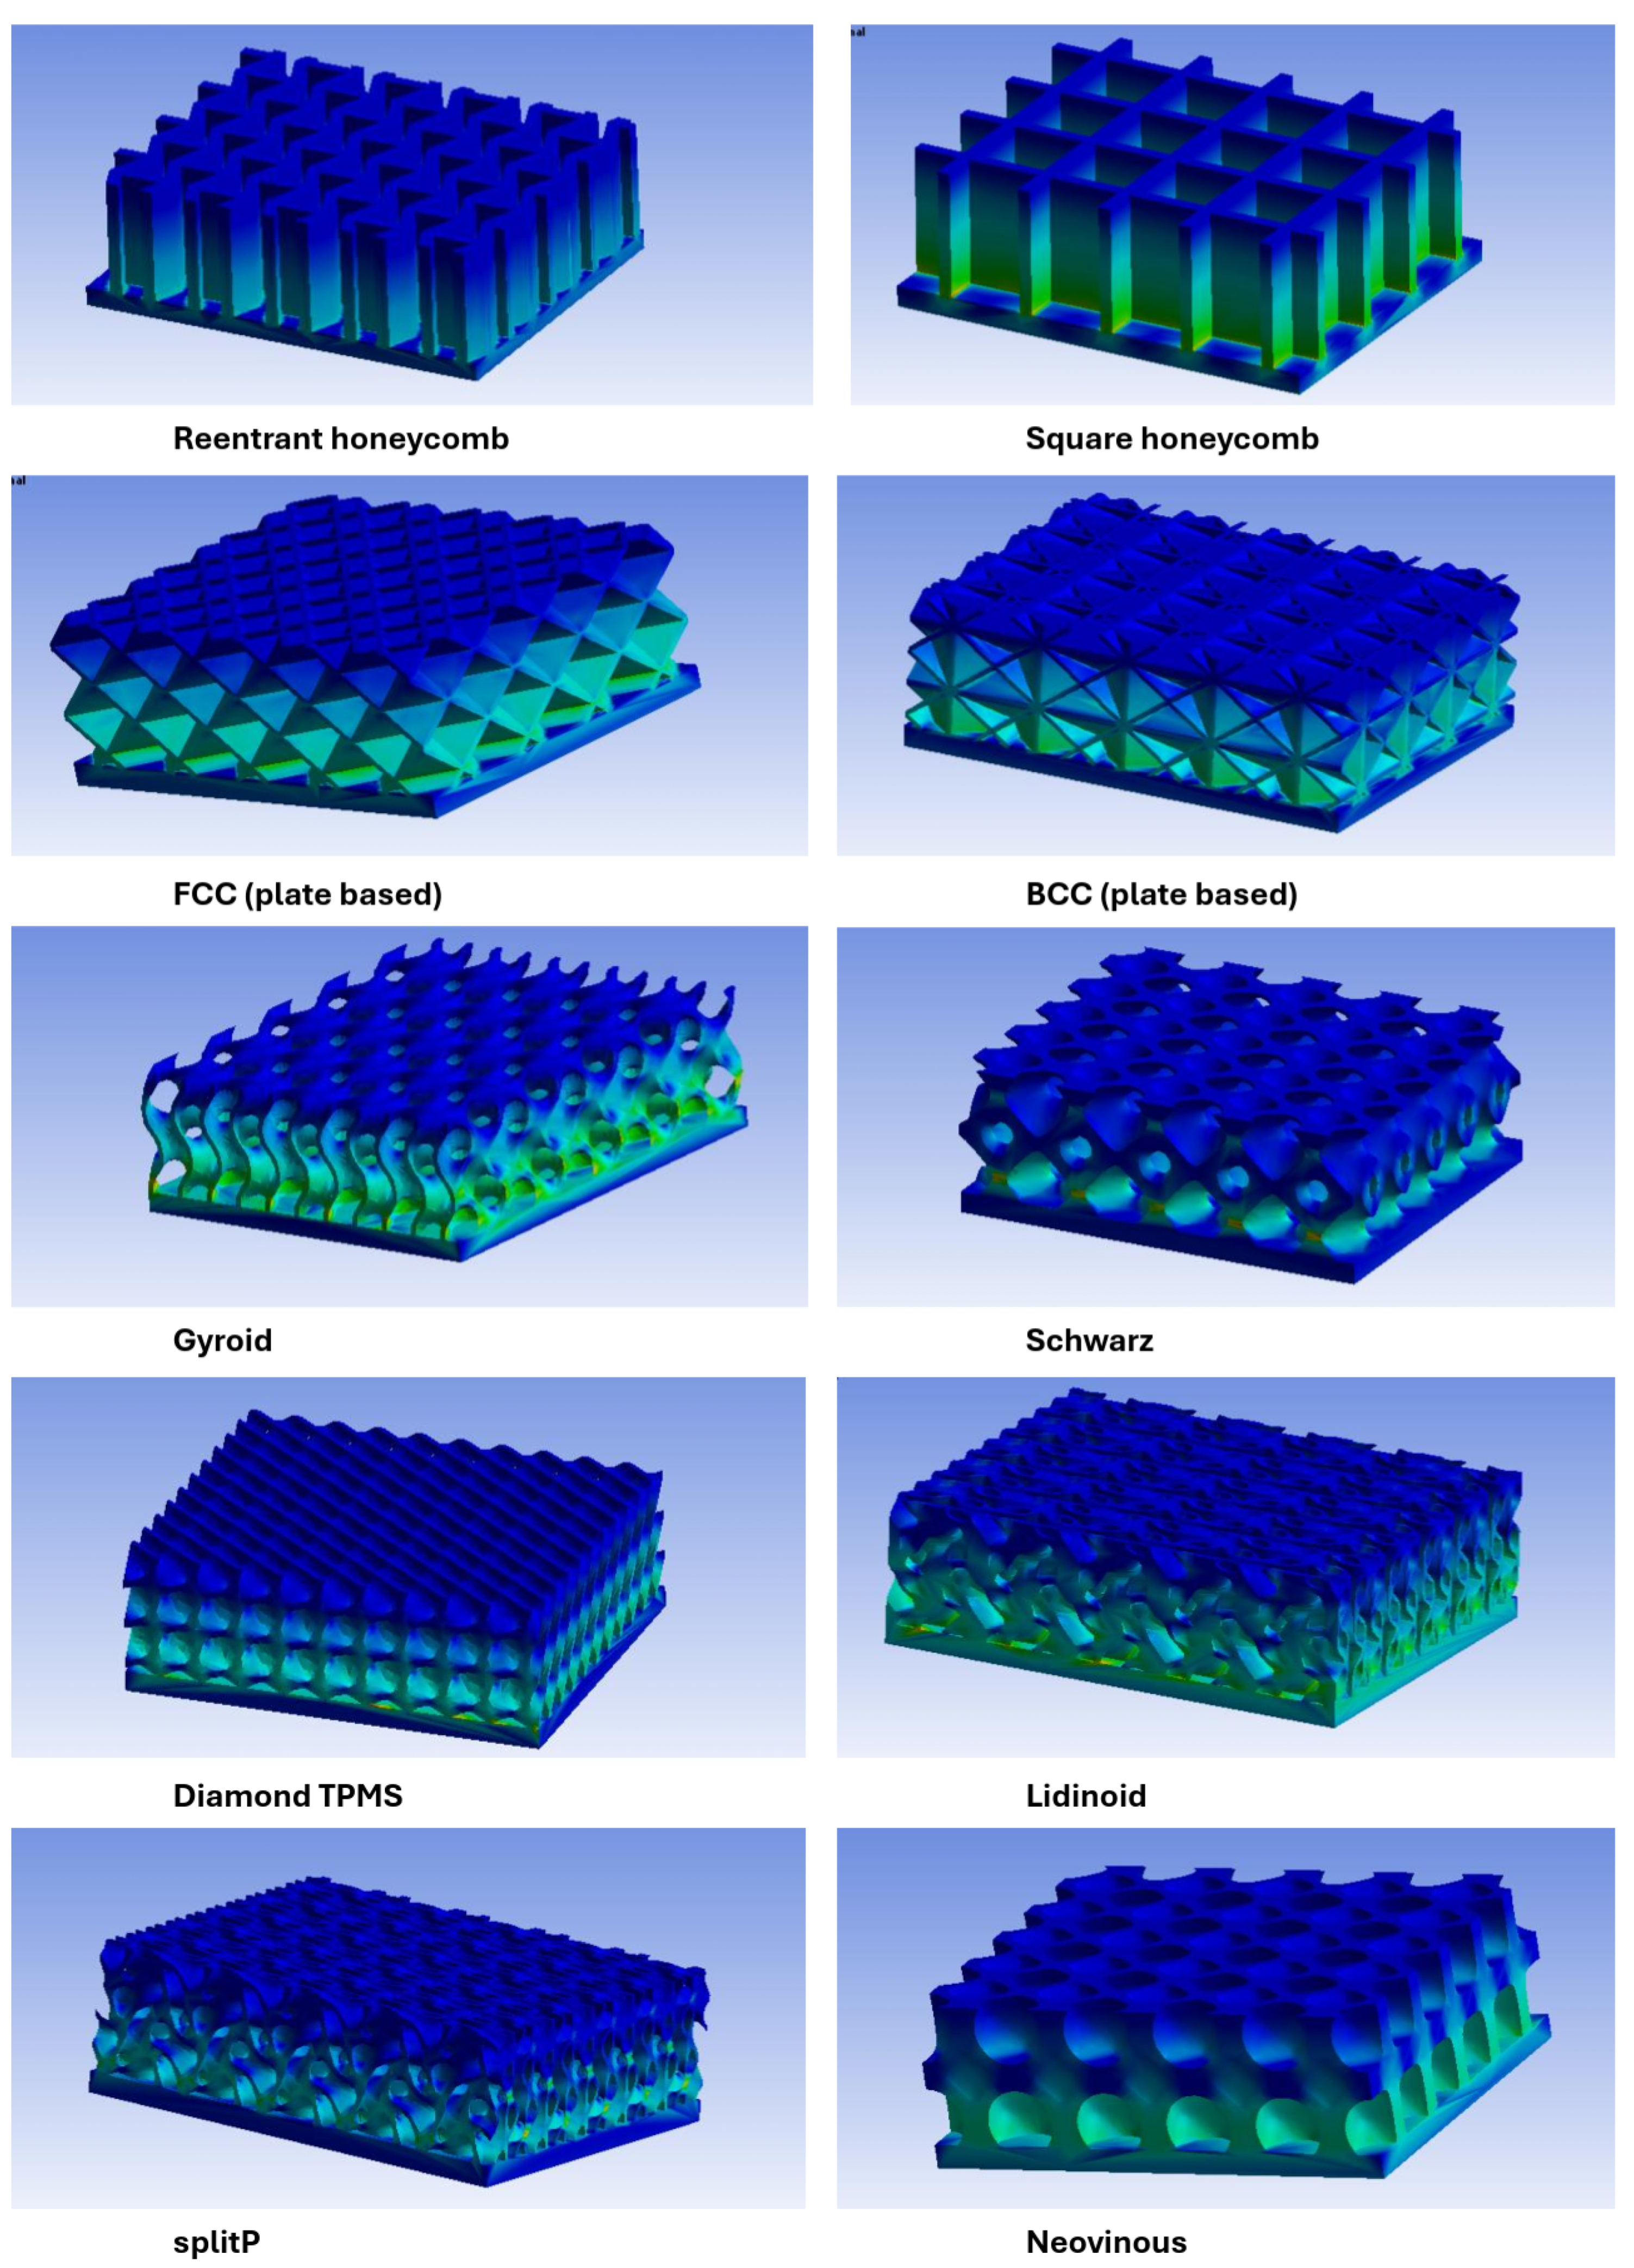
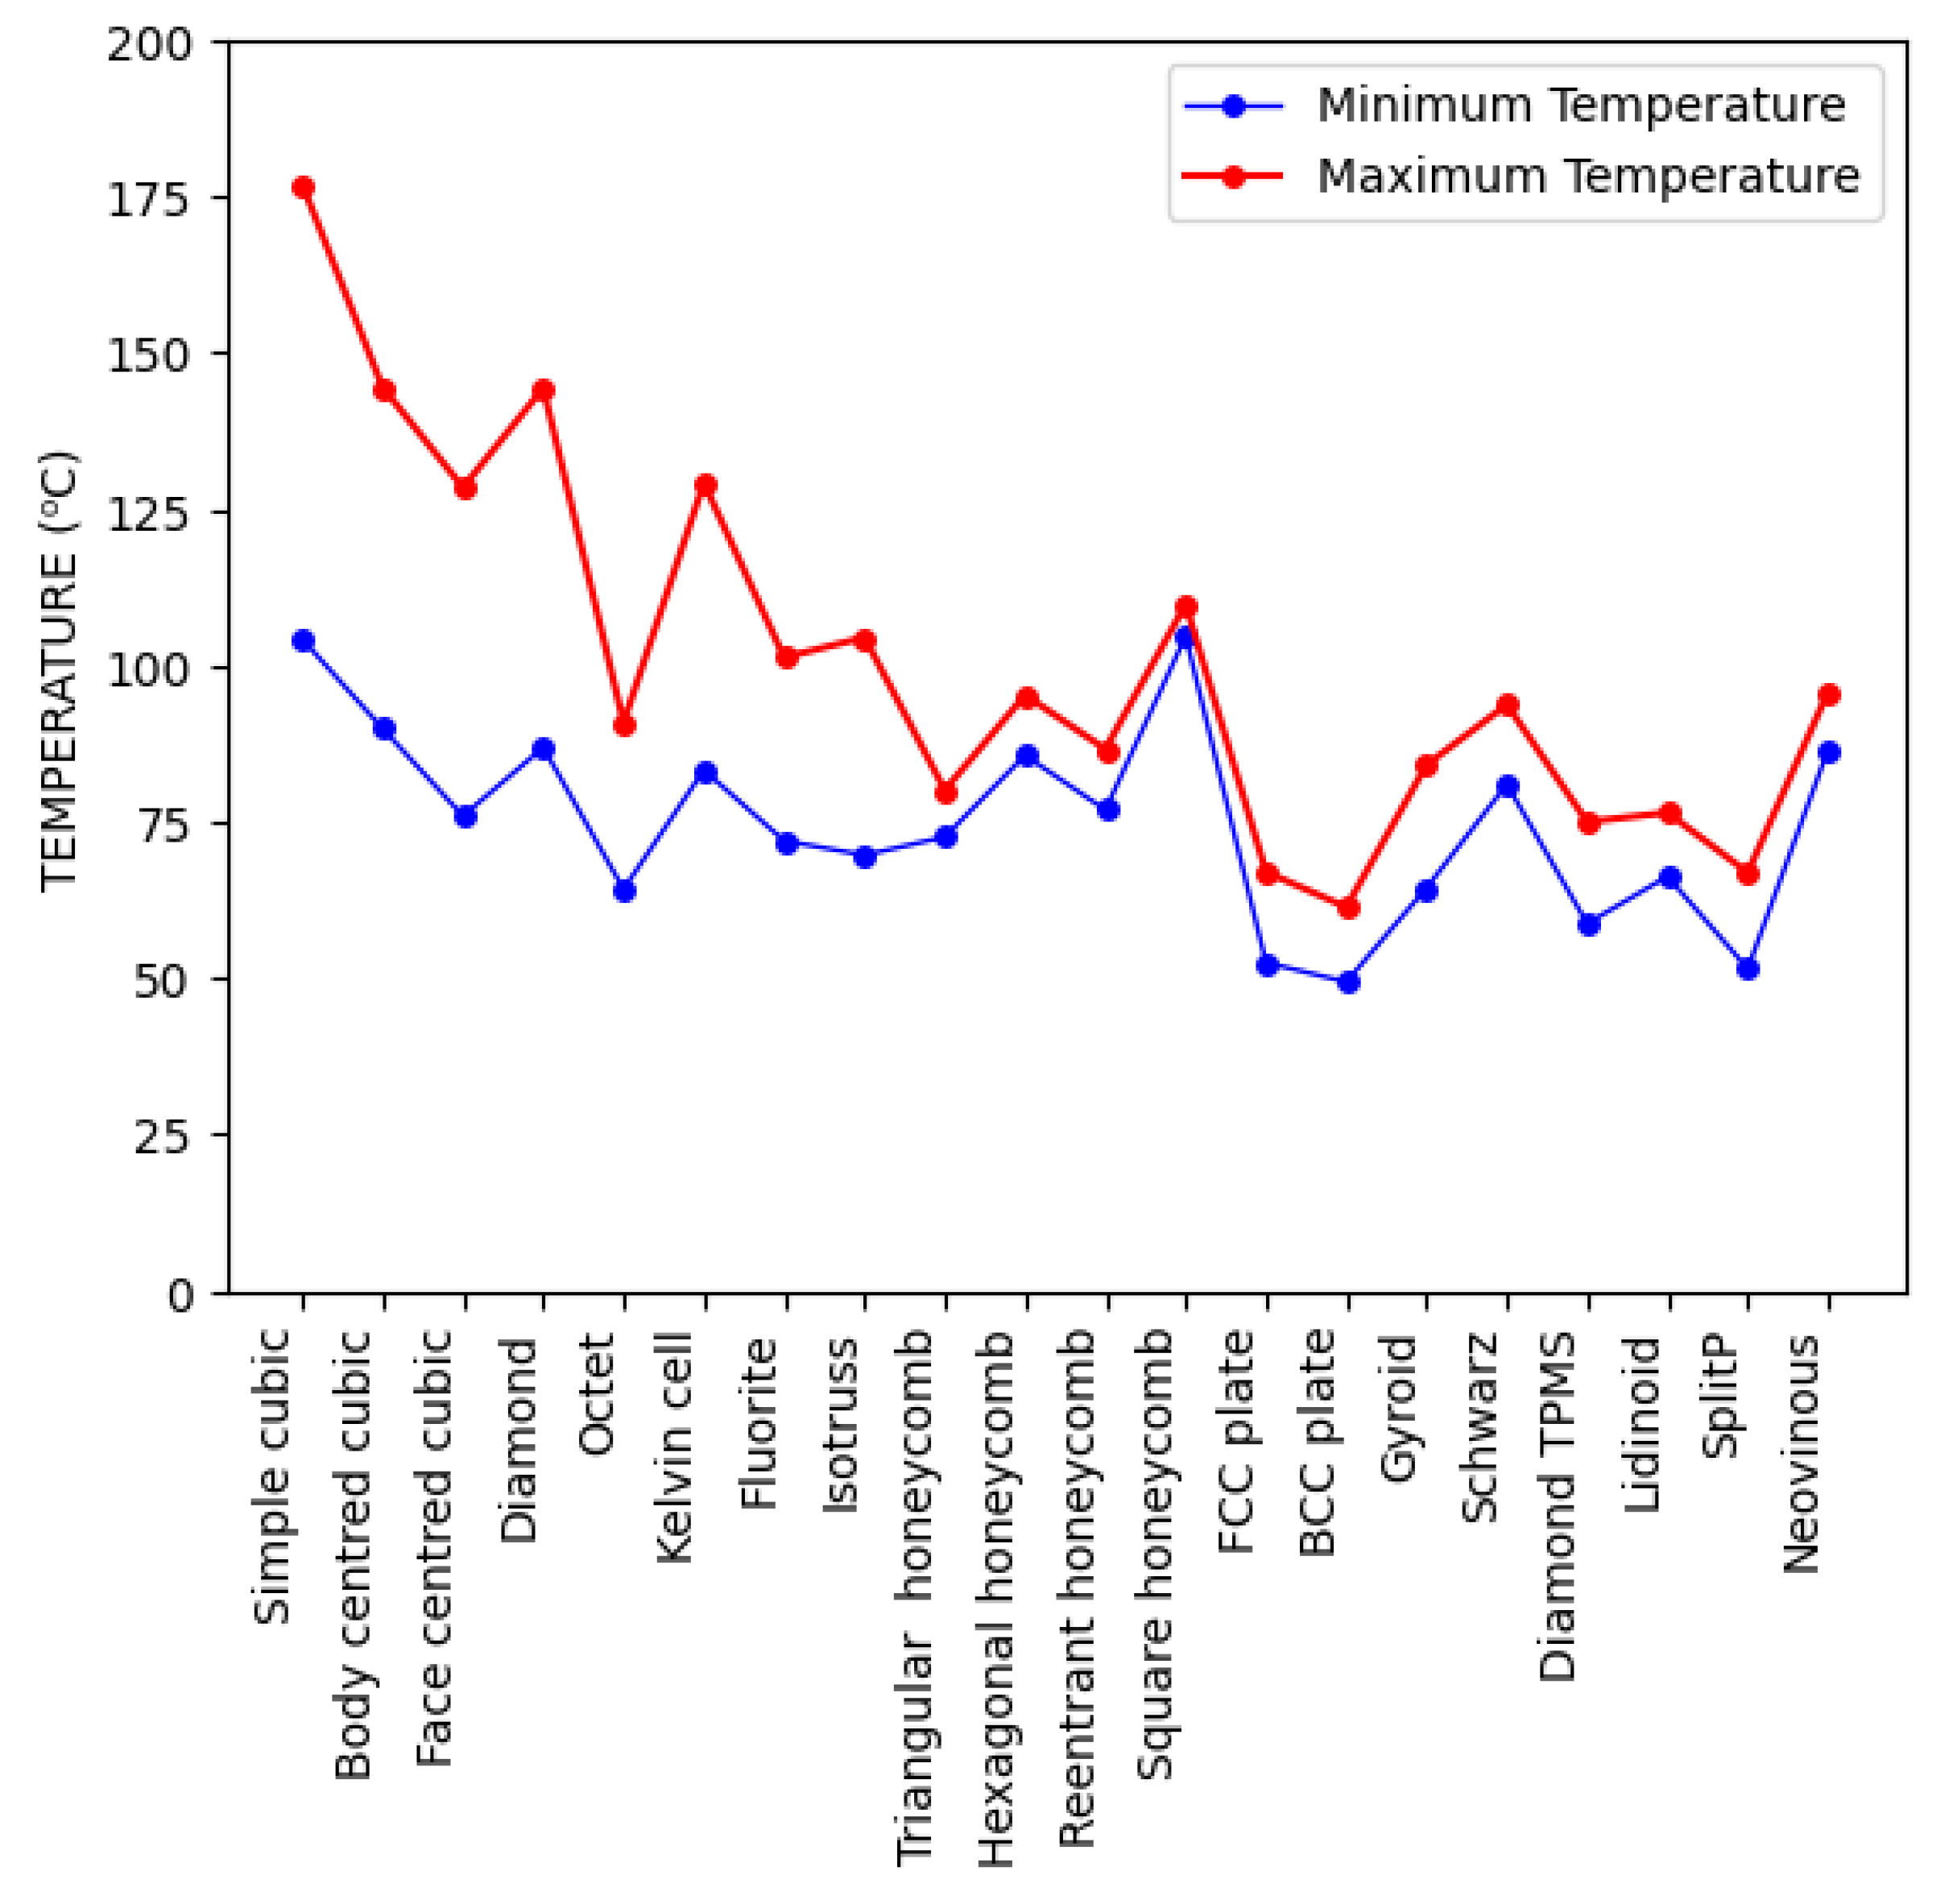
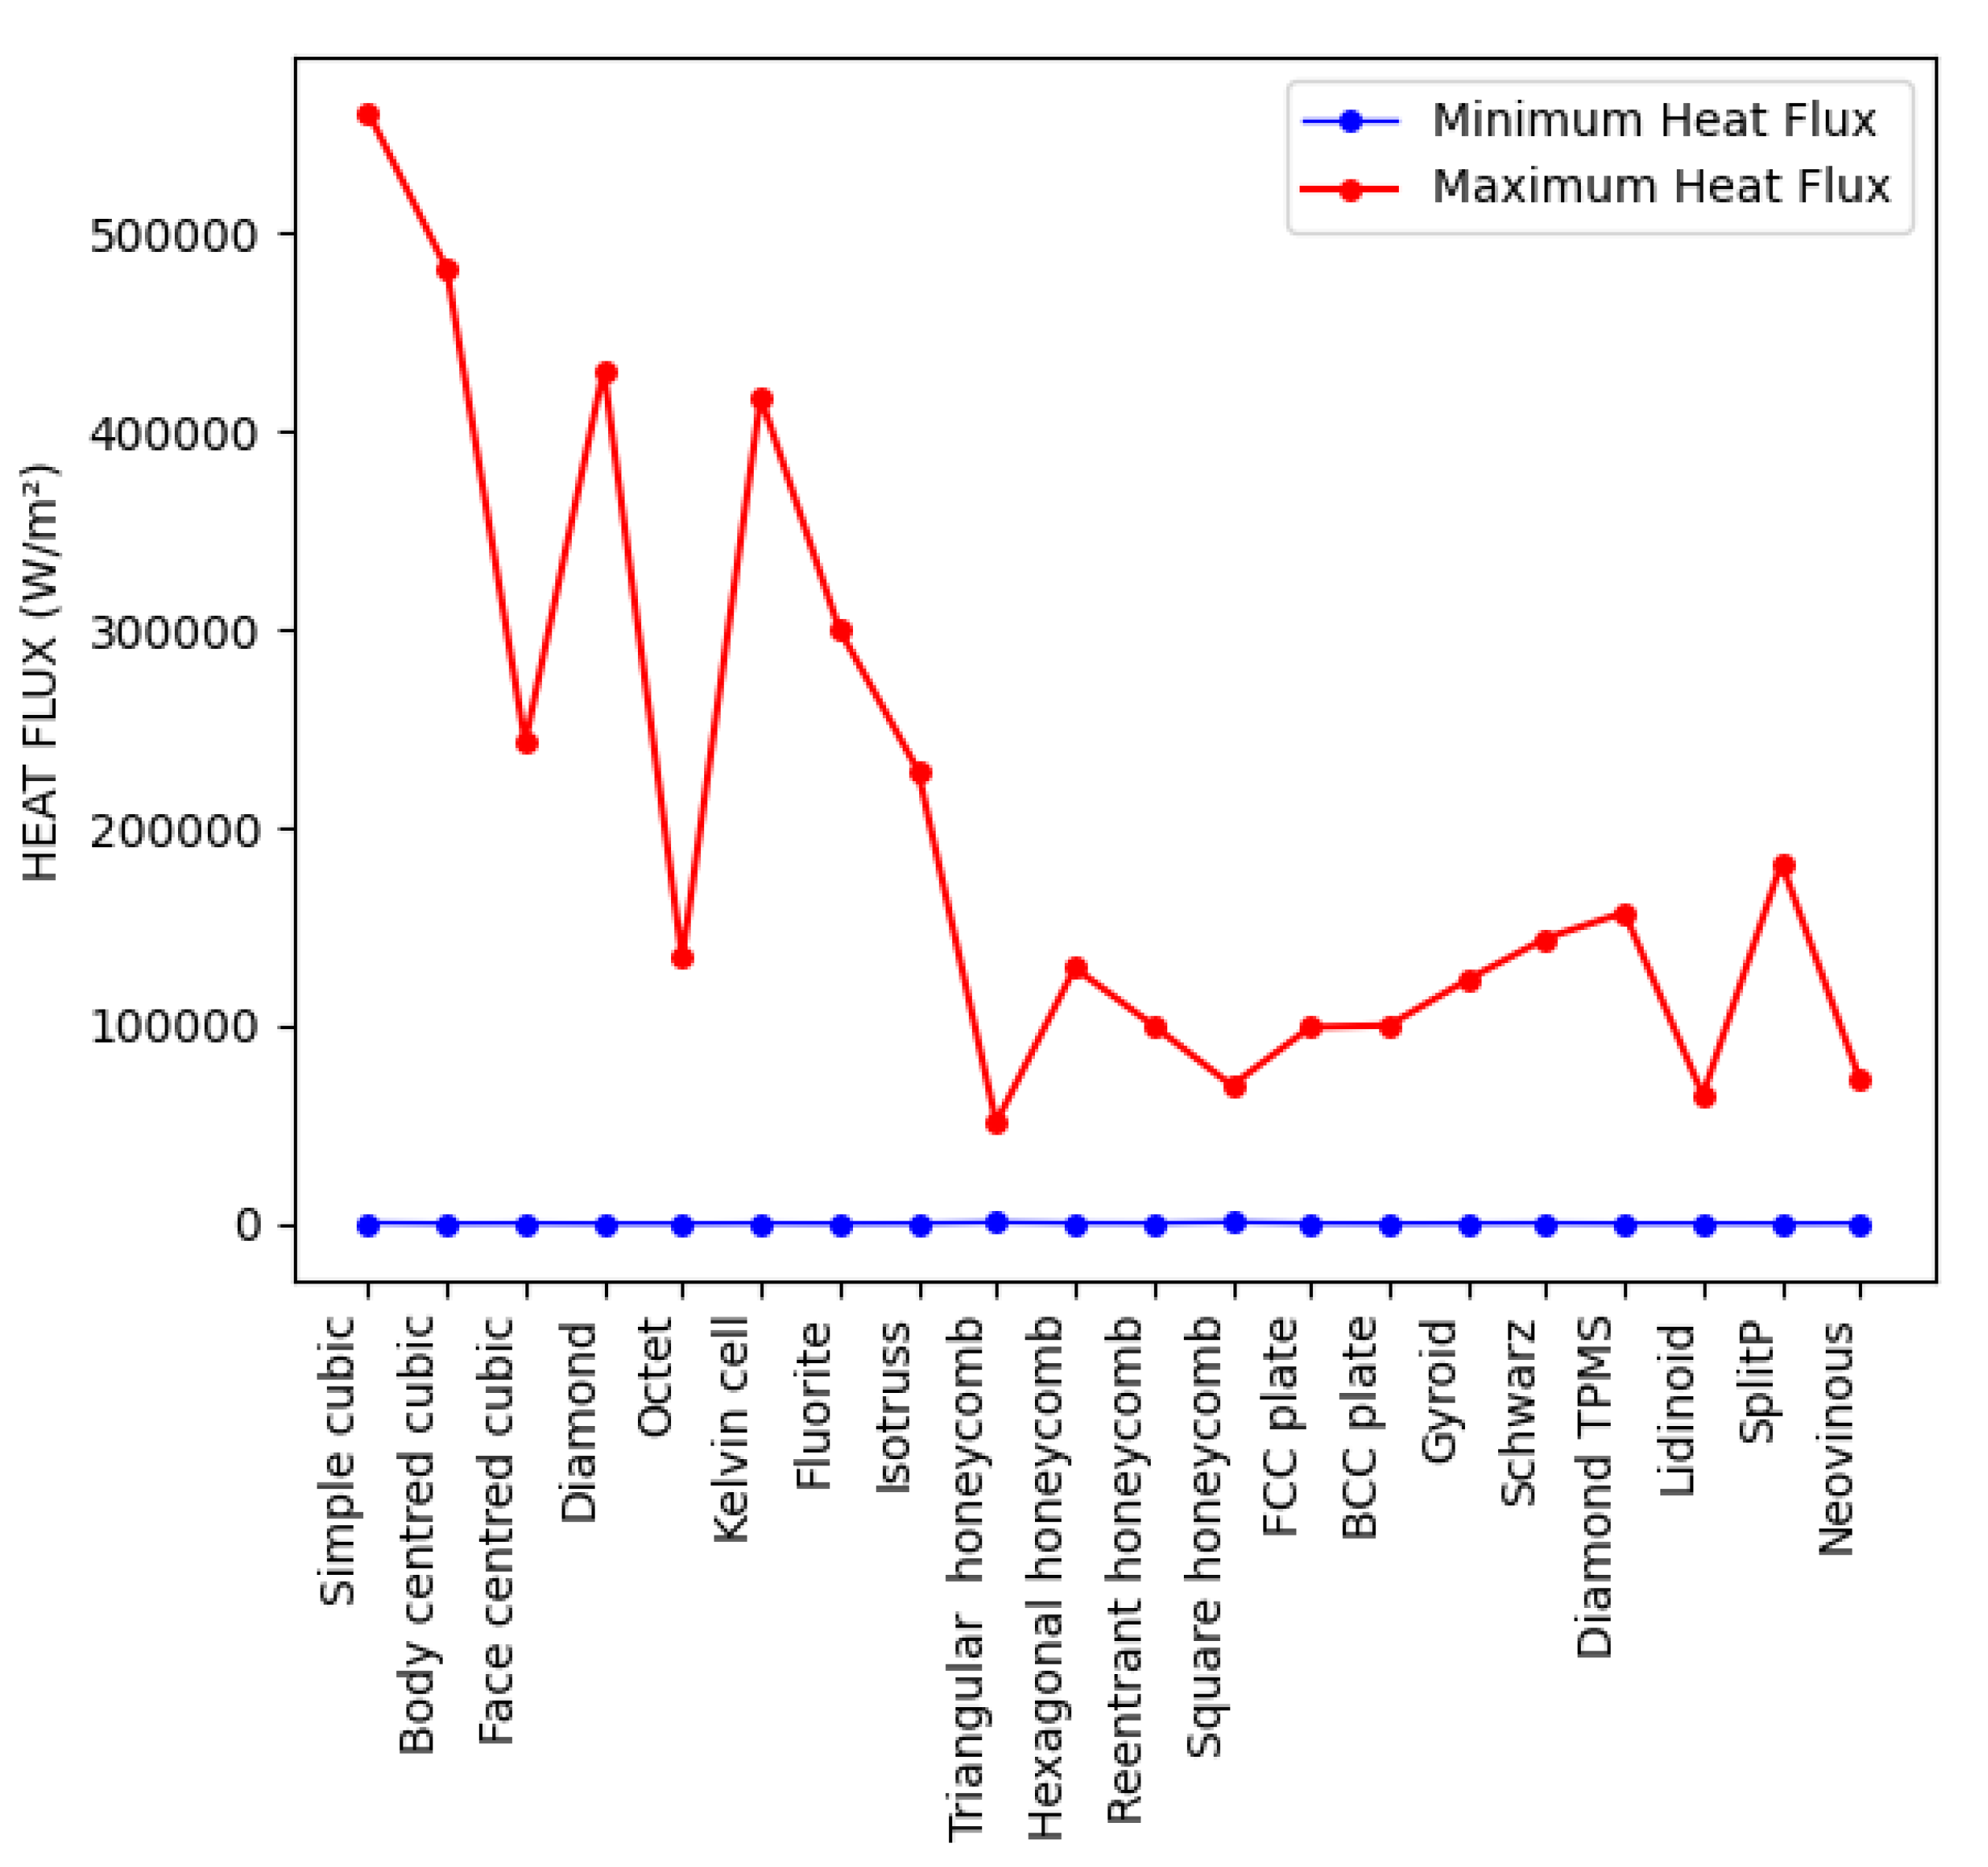
| Unit cell type | Min. temp. | Max. temp. | Temperature difference | Min. heat flux | Max. heat flux |
|---|---|---|---|---|---|
| Simple cubic | 104.16 | 176.89 | 72.73 | 365.95 | 5.61E+05 |
| Body centred cubic | 89.87 | 144.43 | 54.56 | 99.05 | 4.82E+05 |
| Face centred cubic | 75.89 | 128.43 | 52.54 | 171.42 | 2.43E+05 |
| Diamond | 86.84 | 144.33 | 57.49 | 41.645 | 4.31E+05 |
| Octet | 64.18 | 90.85 | 26.67 | 41.633 | 1.34E+05 |
| Kelvin cell | 83.23 | 129.14 | 45.91 | 175.63 | 4.17E+05 |
| Fluorite | 71.93 | 101.24 | 29.31 | 56.76 | 3.00E+05 |
| Isotruss | 69.61 | 104.44 | 34.83 | 135.36 | 2.29E+05 |
| Triangular honeycomb | 72.54 | 80.04 | 7.5 | 572.32 | 50991 |
| Hexagonal honeycomb | 85.58 | 95.22 | 9.64 | 246.49 | 1.29E+05 |
| Reentrant honeycomb | 76.86 | 86.59 | 9.73 | 195.95 | 99972 |
| Square honeycomb | 104.63 | 109.75 | 5.12 | 654.98 | 69641 |
| FCC plate | 52.44 | 66.94 | 14.5 | 143.12 | 99131 |
| BCC plate | 49.34 | 61.32 | 11.98 | 53.9 | 1.00E+05 |
| Gyroid | 64.4 | 84.07 | 19.67 | 149.76 | 1.23E+05 |
| Schwarz | 80.96 | 93.69 | 12.73 | 219.91 | 1.44E+05 |
| Diamond TPMS | 58.67 | 74.94 | 16.27 | 107.53 | 1.57E+05 |
| Lidinoid | 66.23 | 76.42 | 10.19 | 135.47 | 64755 |
| SplitP | 51.46 | 66.83 | 15.37 | 67.57 | 1.82E+05 |
| Neovinous | 86.51 | 95.77 | 9.26 | 129.53 | 72583 |
Disclaimer/Publisher’s Note: The statements, opinions and data contained in all publications are solely those of the individual author(s) and contributor(s) and not of MDPI and/or the editor(s). MDPI and/or the editor(s) disclaim responsibility for any injury to people or property resulting from any ideas, methods, instructions or products referred to in the content. |
© 2024 by the authors. Licensee MDPI, Basel, Switzerland. This article is an open access article distributed under the terms and conditions of the Creative Commons Attribution (CC BY) license (http://creativecommons.org/licenses/by/4.0/).


