1. Intraduction
After forty years of reform and opening, China's economy has experienced rapid development and made significant achievements in infrastructure. This is because both infrastructure development and the construction of high-rise buildings require a substantial amount of concrete. It's estimated that the world uses 3 billion tons of concrete annually. Cement is a crucial component of concrete, and the carbon dioxide (CO2) emissions from cement production account for nearly 5-7% of global CO2 emissions. Producing one ton of concrete (OPC) releases approximately one ton of CO2. [
2]These CO2 emissions contribute to the greenhouse effect, [
3]which leads to global warming, melting polar ice caps, rising sea levels, the inundation of coastal cities, land desertification, decreased agricultural productivity, disruption of ecosystems, and harm to human health, among other consequences. This situation is a cause for concern, and there is an urgent need to minimize carbon dioxide emissions from the cement industry.
Various industrial waste and natural materials are extensively utilized as cementitious supplementary materials or aggregates to reduce the environmental footprint in concrete production, including energy consumption, pollution, waste disposal, resource depletion, and global warming. A significant amount of industrial waste, primarily from construction and demolition, as well as natural resources like coconut shells, oyster shells, and bamboo, which were once considered waste materials, are now being repurposed.
The issues arising from the construction and automotive industries have become significant concerns for governments worldwide. Recently, there has been extensive exploration into the use of recycled aggregates from waste materials as supplements to cement and aggregates.
In recent years, alternatives to traditional cement concrete aggregates, such as rubber tire particles, mining waste, and natural waste materials, have emerged. Due to the development of transportation and rapid population growth, the production of car tires has increased significantly, resulting in a substantial increase in the generation of used tires and their rubber waste. The management of rubber waste has become a significant environmental issue worldwide. Adding rubber particles produced by grinding old tires into concrete can reduce the amount of cement required, thereby reducing carbon dioxide emissions and pollution from used tires.
Concrete is one of the most widely used construction materials due to its strength, durability, and versatility. However, traditional concrete has limitations in terms of tensile strength, cracking, and overall performance under various conditions. [
6]To address these limitations and enhance the sustainability of construction practices, there is a growing interest in incorporating composite materials into concrete mixtures. Composite materials, such as fibers, nanoparticles, and recycled components, offer the potential to improve the mechanical properties, durability, and sustainability of concrete structures.
Addressing these challenges and research gaps will facilitate the successful incorporation of composite materials in concrete construction. It will lead to the development of more resilient, durable, and sustainable concrete structures that can meet the evolving demands of the construction industry and reduce its environmental footprint.
In conclusion, the incorporation of waste materials into concrete is a multifaceted approach that offers numerous advantages, including environmental benefits, improved construction materials, and alignment with sustainability objectives. This practice not only reduces the environmental footprint of the construction industry but also promotes responsible and resilient building practices for a more sustainable future.
Experiments and Methods
3. Methods and Casting
The research methodology focusing on modeling using Abaqus. Problem Modeling and Preparation: Initially, researchers need to model the research object and determine the required boundary conditions, material parameters, etc. This includes selecting appropriate finite element models, meshing, and loading conditions. Simulation Setup: Once the modeling preparation is complete, simulation parameters need to be set, including time step size, convergence criteria, solver options, etc. These settings affect the accuracy and computational efficiency of the simulation. Simulation Execution: After completing the simulation setup, run the Abaqus simulation program for computation. Depending on the complexity of the problem and computational resource limitations, parallel computing or staged computation may be required. Result Analysis: Upon completion of the simulation, analyze the results. This includes analyzing physical quantities such as displacement, stress, strain, etc., and evaluating the validity and credibility of the simulation results. Parameter Study and Optimization: In some cases, researchers may conduct parameter studies or optimizations to assess the impact of different parameters on system behavior or to find the optimal design solution. Documentation Writing and Reporting: Finally, researchers need to write documentation and reports on the simulation results, presenting the modeling and simulation process, result analysis, and conclusions clearly.
3.1. Experimental Set-up
Designing an Abaqus model involves several steps, from creating the geometry to defining material properties, meshing, applying boundary conditions, and setting up the analysis.
3.2. Pre-Processing
- A.
Geometry modeling
Geometry modeling: This refers to the process of using the geometric modeling tools provided by Abaqus to create complex geometric models, which are typically used for Finite Element Analysis (FEA). During this process, users can utilize Abaqus functionalities to draw, modify, and edit geometric shapes, defining the dimensions, shapes, and geometric features of objects. Therefore, our model adopts millimeters (mm) for length and megapascals (MPa) for strength to ensure consistency and accuracy of model parameters. These geometric models may include parts, assemblies, or other complex structures. The model framework is a three-dimensional solid with extrusion dimensions of 3600mm*500mm*120mm.
- B.
Definition
Definition of the material parameters: This refers to the process of defining material properties for use in finite element analysis. These material properties describe the mechanical behavior of the materials used in the simulation, such as elastic modulus, Poisson's ratio, density, yield stress, etc. These properties are crucial for the accuracy of the simulation, as they determine the material's response during loading.
- C.
Layering method
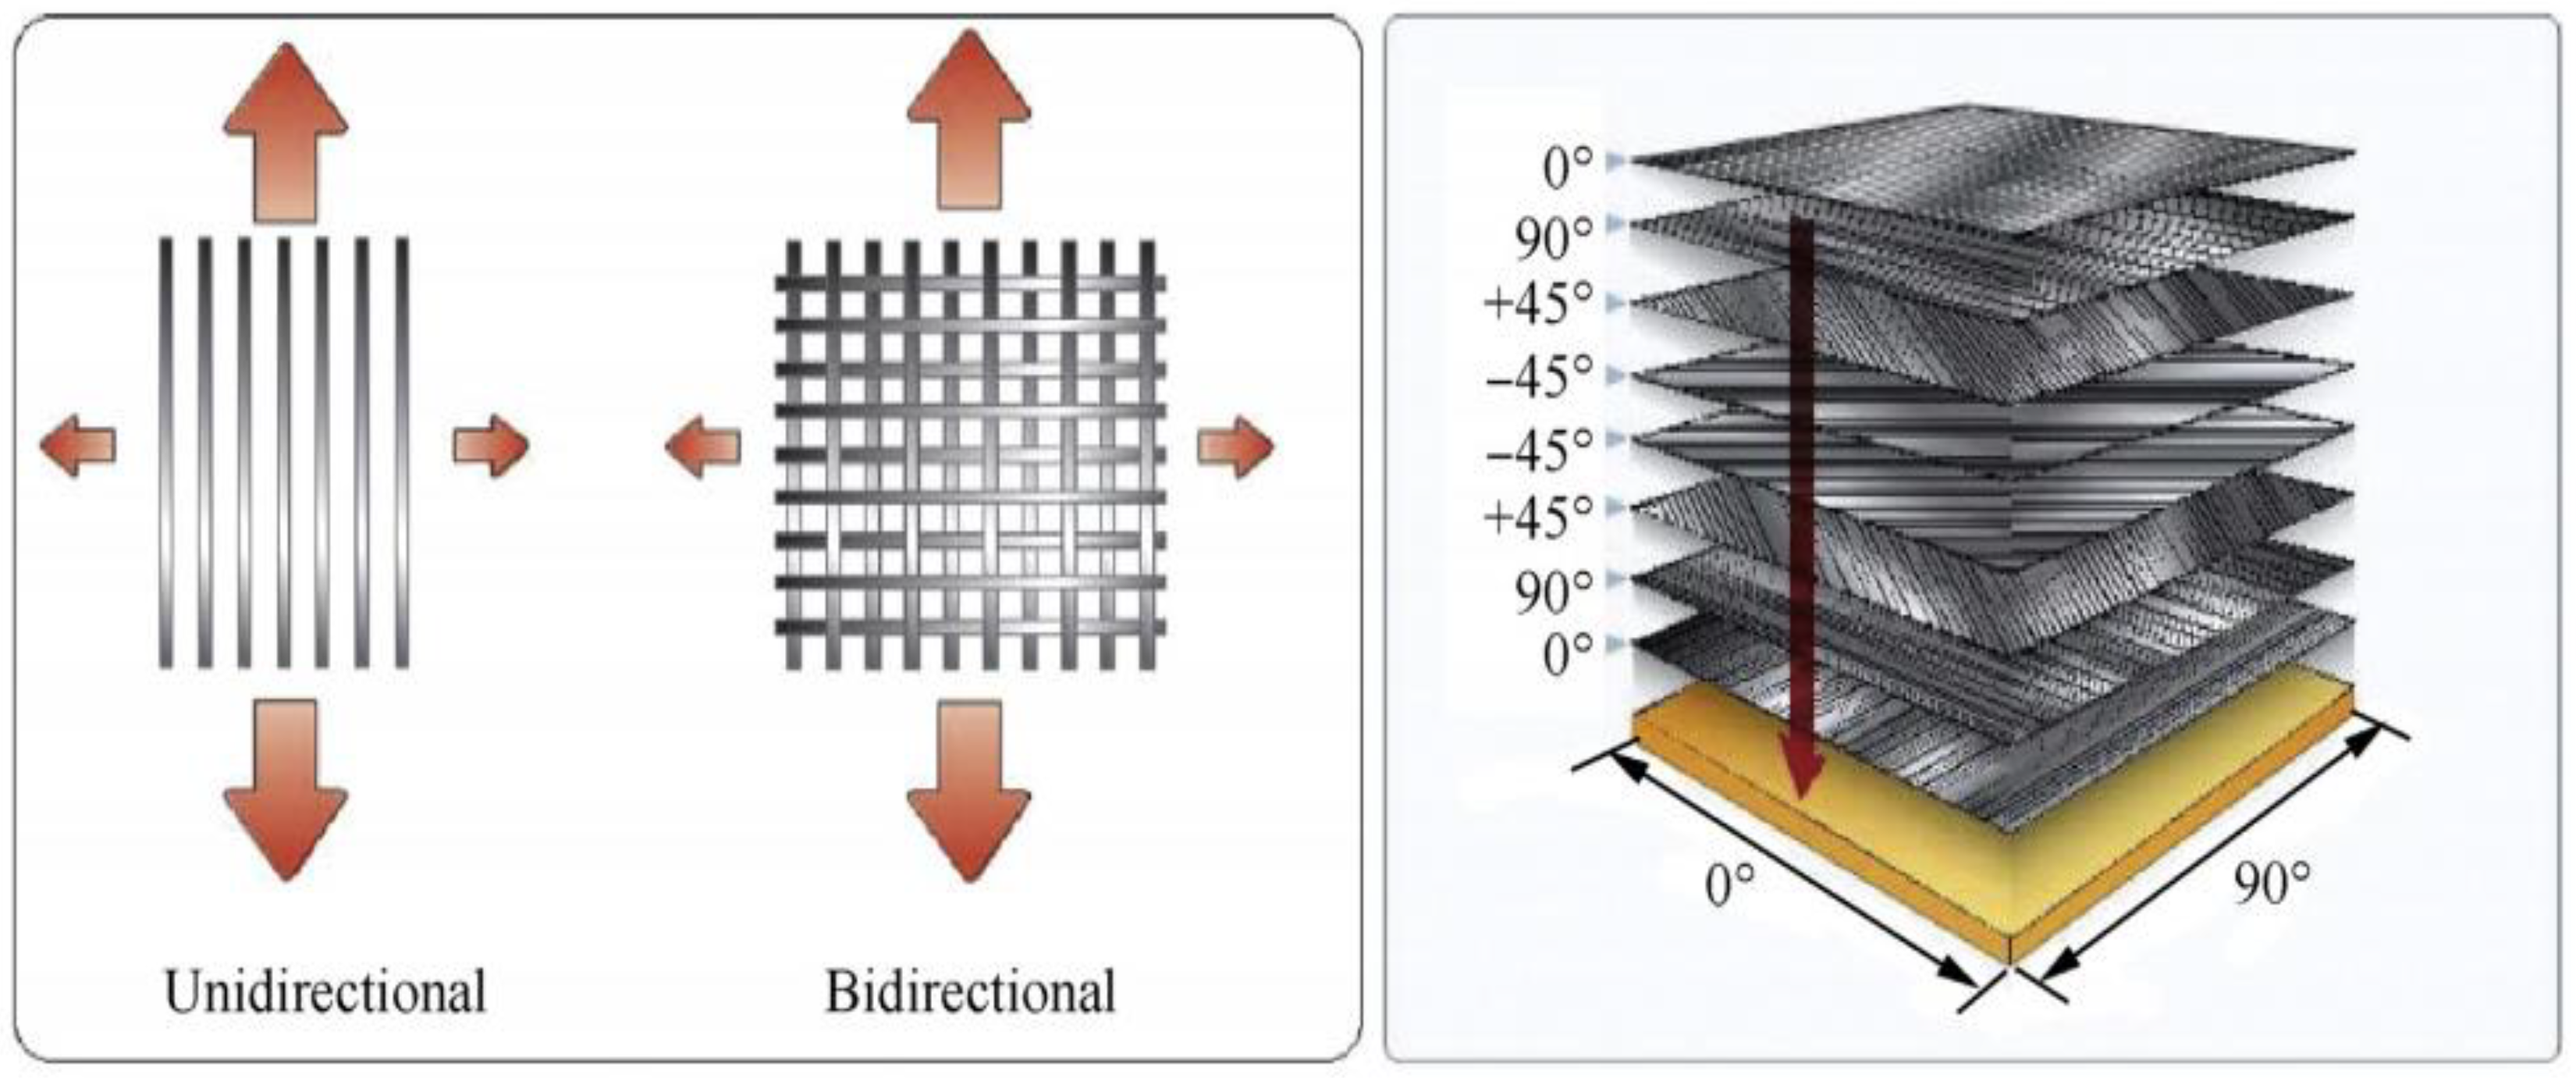
Layering method: This refers to the approach of dividing a structure or material into different layers or levels during model construction and specifying specific material properties or geometric features for each layer. This method is commonly used for simulating composite materials, laminated plates, or other materials or structures with layered configurations. Through the Layering method, users can define different material properties for each layer, such as elastic modulus, Poisson's ratio, density, etc., as well as different geometric features, such as thickness, interfacial layers, etc.
- D.
Construction of the mesh system
Assembly and meshing: Once the geometric model is constructed, it's assembled to constitute a comprehensive system. Subsequently, the system undergoes meshing to convert the geometric model into finite element meshes for discretization. During the assembly stage, users combine various parts of the model to form a complete structure. This may involve placing different components or parts in their correct positions and ensuring they have appropriate contacts, constraints, and boundary conditions. In complex assemblies, defining contact behaviors between parts, such as friction, separation, etc., may be necessary, along with adding appropriate boundary conditions and constraints to simulate real-world scenarios. Once the model is correctly assembled, the next step is to convert the geometry of the model into a mesh consisting of finite elements.
Material property definition: Material properties for different elements within the system are specified, encompassing attributes like material type, elastic modulus, Poisson's ratio, density, among others. To input properties such as elastic modulus, Poisson's ratio, density, etc., for CFRC, CRC, MC, OSWC, and WTCS into Abaqus.
3.3. Solve the Equation
- A.
Solver setup
Solver setup: This refers to the process of configuring solver parameters and options. The solver is the numerical method used to solve finite element models, calculating the response of the model based on user-defined boundary conditions, material properties, and loading conditions. In the Solver setup, users need to set various parameters to ensure that the solver can handle the model correctly and produce accurate results.
- B.
Parallel Computing Setting
Parallel Computing Setting: For large models or cases requiring faster computation, the solver can be configured to utilize parallel computing resources. This includes setting the type of parallel computing, the number of processes, etc. Other Parameter Setting: Depending on the requirements, other parameters such as output options, result file formats, storage options, etc., can also be set.
- C.
Connectivity Relationship Building
Connectivity Relationship Building: in Abaqus refers to the process of constructing the model by defining the connectivity between nodes and elements. In finite element analysis, the geometric shape of the model is discretized into a series of nodes and elements, and the connectivity between these nodes and elements determines the structure and behavior of the model.
- D.
Node Definition
Node Definition: Firstly, users need to define the nodes in the model, which represent discrete points in the geometric structure of the model, such as intersections, corners, etc.
- E.
Element Definition
Element Definition: Next, users define the elements in the model, which are basic building blocks used to approximate the geometric shape and physical behavior of the model. When defining elements, appropriate element types are selected, and the connectivity between nodes for each element is determined.
- F.
Connectivity
Connectivity: After defining the elements, users need to establish the connectivity between nodes and elements. This involves assigning nodes to the vertices of elements and ensuring correct connectivity between elements to build a complete model.
- G.
Contact Definition
Contact Definition: In some cases, different parts of the model may come into contact or interact with each other. Therefore, users also need to define contact conditions to describe the contact behavior between these parts and ensure the accuracy and realism of the model. By establishing the correct connectivity relationships, the model accurately describes the geometric shape and physical behavior of the actual system, providing a reliable basis for subsequent finite element analysis.
- H.
Boundary condition setting
Boundary condition setting: This refers to the process of defining constraints and loading conditions at the boundaries of the model. Boundary conditions are crucial in finite element analysis as they determine the behavior of the model at its boundaries, thus influencing the overall response of the model.
- I.
Constraints
Constraints: Defining constraints at the boundaries of the model to simulate real-world constraints. This includes fixing boundaries, fixing degrees of freedom, defining constraint relationships, etc. For example, certain nodes' displacements can be set to zero to simulate fixed boundaries.
- J.
Loads
Loads: Defining loading conditions at the boundaries of the model to simulate external forces, pressures, temperatures, etc. This includes applying forces, pressures, thermal fluxes, etc. For example, pressure or forces can be applied to the surface of the model to simulate external loads. By properly setting boundary conditions, the model can more accurately reflect the behavior of the actual system and produce reliable analysis results.
In Abaqus, users can define and set boundary conditions through the graphical user interface (GUI) or by inputting keywords.
3.4. Repossessing
- A.
Abaqus analysis results output as images
Abaqus analysis results output as images: This means generating visual representations of the analysis results in the form of images. In finite element analysis, Abaqus can produce various images to visualize the simulation results, typically including deformation, stress, strain, temperature distributions, etc.
- B.
Deformation plots
Deformation plots: These show the deformation of the model after applying loads or boundary conditions, providing insight into the model's behavior under load.
- C.
Stress plots
Stress plots: These display the distribution of stresses throughout the model, aiding in the assessment of material capacity and structural safety. Strain plots: These illustrate the distribution of strains across the model, helping understand material deformation and structural stability.
- D.
Temperature plots
Temperature plots: These demonstrate
the temperature distribution across different locations in the model, essential for thermal conduction analysis and thermal stress analysis.
- E.
Contour plots
Contour plots: These represent the distribution of various physical quantities, such as temperature, using contour lines. They offer a comprehensive understanding of the model's behavior.
4. Composite Materials Result and Analysis
Figure 5.
Finite element model diagram.
Figure 5.
Finite element model diagram.
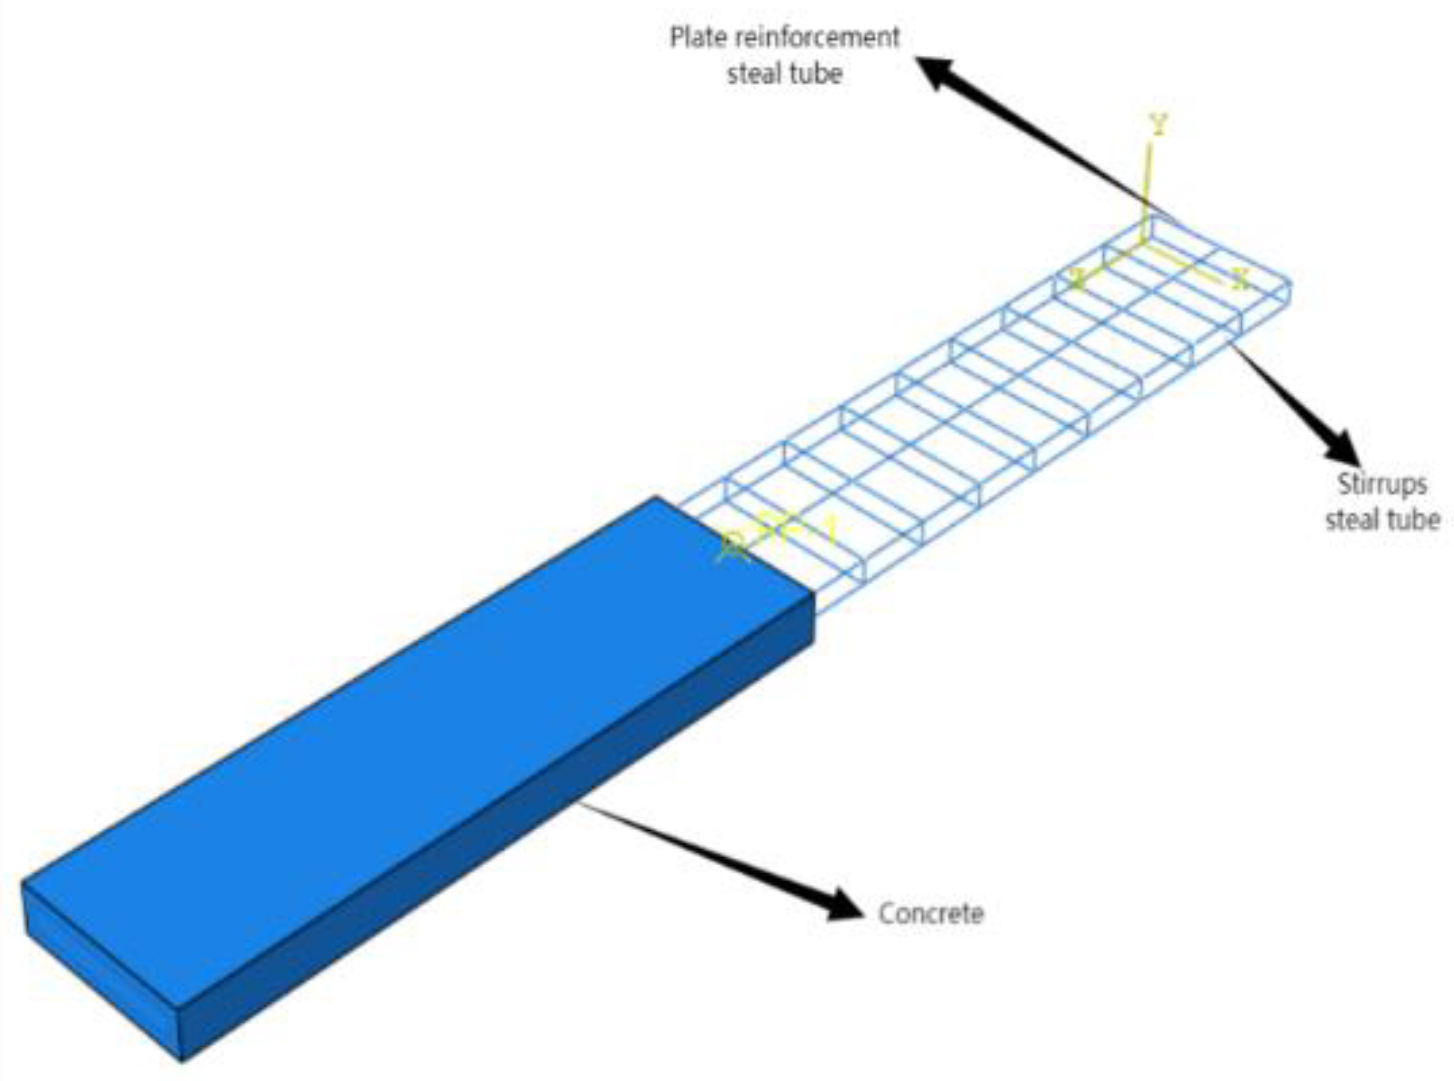
The article uses numerical simulation software ABAQUS to study the axial compression mechanical properties of square steel pipes filled with initial stress and initial defects in reinforced concrete slabs. The established numerical model consists of two parts: steel pipes and concrete. All members are represented as solid elements using 8-node simplified integrated three-dimensional solid elements (C3D8R).Finite element analysis is carried out in two steps. In the first step, the initial stress and material data are applied to the components, and the method of applying initial stress to the steel pipes is adopted. Firstly, the initial stress coefficient is determined, and the simulated steel pipe initial stress field is imported into the axial compression model. Then, the finite element simulation analysis of the bearing capacity under initial stress axial compression conditions is carried out. The modeling of steel pipes and steel cores is provided using the isotropic elastoplastic model provided by ABAQUS finite element software.
The interaction between steel pipes and concrete is simulated using the normal and tangential surface contact method. The tangential behavior is described using the Coulomb friction model with a friction coefficient of 0.The normal behavior is set as hard contact. The steel pipes are embedded in the concrete matrix using the embedding method, and the interactions between the end plates and other components are modeled using straps. Boundary conditions include four-point fixation, and forces or displacements are applied at the top end based on the loading process. The schematic model is shown in
Figure 5.
4.1.Model Parameter Selection
Based on the numerical model validated above, a rectangular concrete slab model with embedded steel pipes was established. The mechanical properties under the influence of initial stress were analyzed. The yield strengths of the steel pipes and structural reinforced concrete are 400MPa and 238MPa, respectively. The concrete design strength is CHRB400(HRB400 is a hot-rolled ribbed steel bar, also known as grade 3 steel. Its yield strength standard value is 400MPa, and its tensile strength standard value is 540MPa.) was used, with a vertical reinforcement arrangement of three reinforcing bars above and two below, uniformly distributed. The length of the vertical reinforcement is 3600mm, and the diameter is 12mm. The dimensions of the stirrup reinforcement are 440*60mm, with a diameter of 6mm. Both the vertical reinforcement and stirrup reinforcement are made of HRB400.
The true stress and true strain are obtained from the stress and strain data obtained by modeling through the following formulas. The calculation formulas for true stress and true strain are as follows:
In which, σ is the initial stress of the model, ε is the initial strain of the model, σT is the true stress of the model, and εT is the true strain of the model.
4.2. Load Displacement Curve Analysis
Longitudinal compression damage of concrete slabs: Under compression loads, concrete slabs experience compression along their length. This compression causes bending in the central region of the slab and may lead to cracking or rupture in the central area. Additionally, because the compressive strength of concrete is much higher than its tensile strength, during compression, if the slab experiences uneven pressure, local cracks may develop.
Significant changes in damage patterns: In the low-load stage, concrete slabs may only experience minor deformation and surface cracks. However, as the load increases, there may be greater bending and compression, leading to more severe cracking and structural damage. This change is caused by the nonlinear stress and strain behavior of the material.
Load-displacement curve: This curve displays the displacement behavior of a component under different loads. In the low-load stage, the curve may be relatively flat, indicating that the component can easily withstand this load. However, as the load increases, displacement may increase rapidly, and the curve may exhibit sharp upward or downward trends. This indicates that the stiffness of the component is changing, and it may be approaching or exceeding its load limit.
In the initial loading stage, the bearing capacity of the specimen is mainly maintained by concrete and steel pipes. In the later stage of loading, due to strain softening of concrete, its bearing capacity decreases, and steel pipes become the main load-bearing unit. When the relative displacement in the loading stage is zero, the component has already been affected by the load. When the yield strength is reached, the steel pipe has not yet exerted complete restraint on the concrete. The triaxial stress state in the concrete is weak, which leads to a overall decrease in the bearing capacity of the component. In the later stage of loading, the bending of the steel pipe weakens its circumferential effect on the concrete. At the same time, due to the bending deformation of the component, the loading on the concrete cross section becomes uneven. This leads to a rapid decrease in the cross-sectional bearing capacity of both steel pipes and concrete, resulting in a decrease in ductility performance of the specimen. Buckling failure prevents the component from reaching its ultimate strength stress state, thereby reducing the impact of initial stress in steel pipes on the bearing performance of the component.
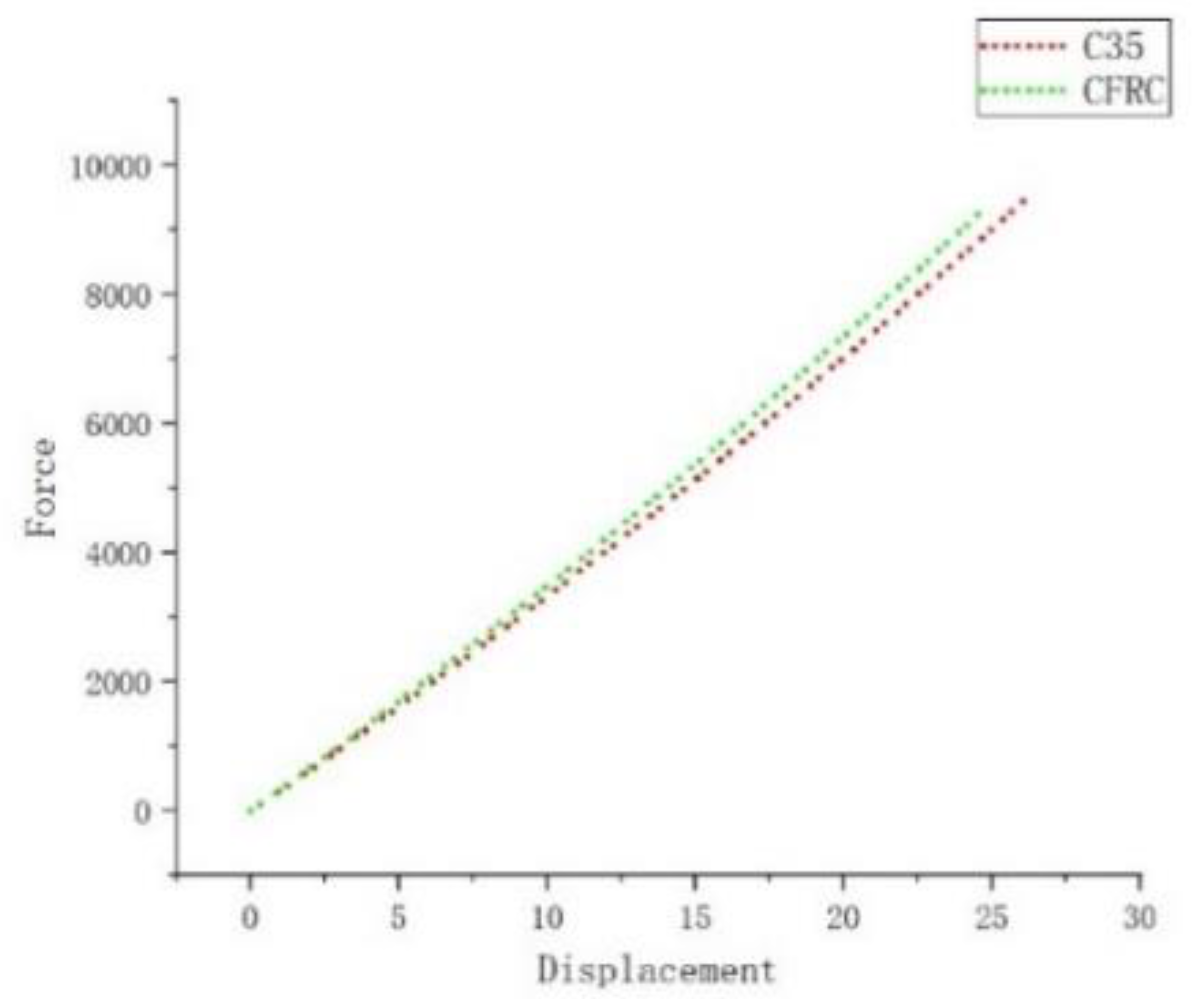
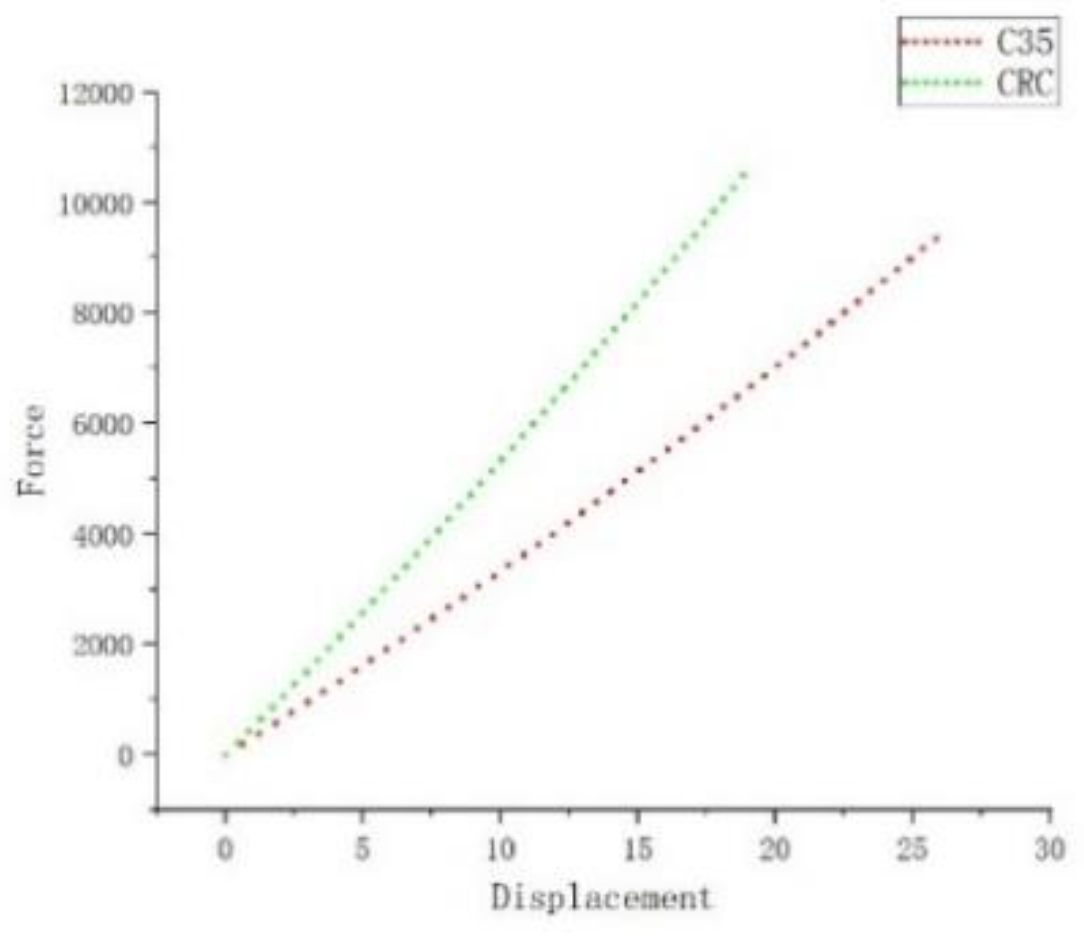
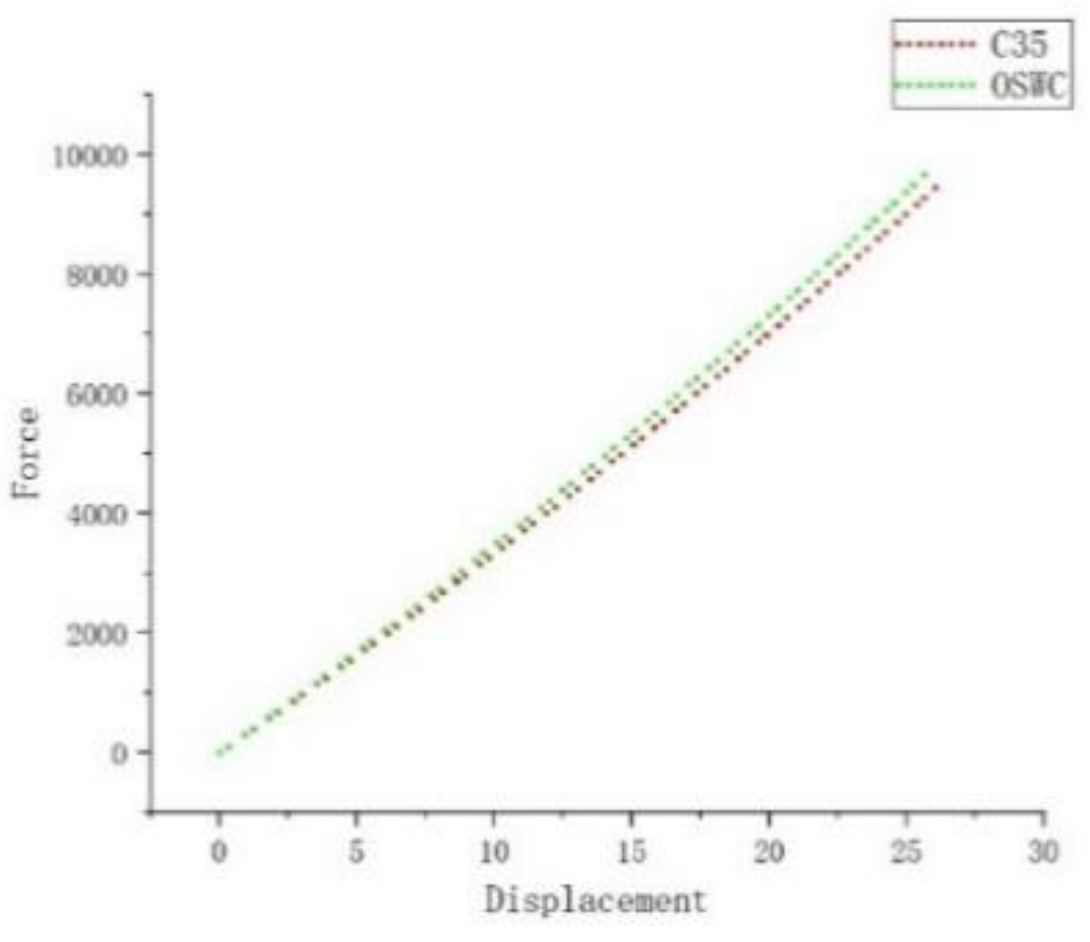
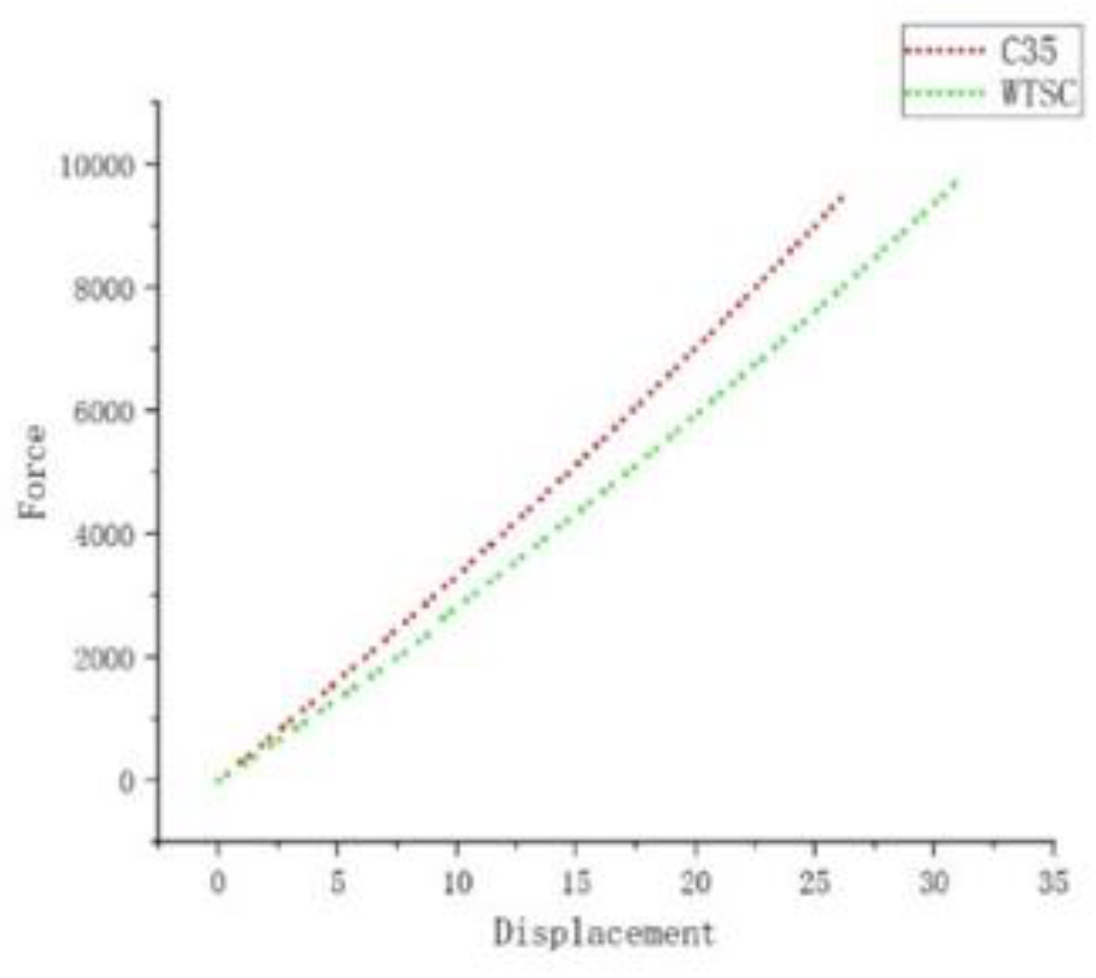
Reinforced concrete components under different concrete materials exhibit load-displacement curves as shown in .
In
Figure 6, during the initial loading stage, the Poisson's ratio of C35 concrete components is higher than that of CFRC concrete components, leading to smaller lateral deformation in CFRC concrete components compared to C35 concrete components. Therefore, in this stage, the load-displacement curve of CFRC concrete components lies below that of C35 concrete components. However, when the concrete components are reloaded, the Poisson's ratio of CFRC concrete components increases rapidly. The load-displacement curve of CFRC concrete components then lies above that of C35 concrete components and continues to rise. In
Figure 7, we can observe the following: In the initial loading stage, the Poisson's ratio of C35 concrete components is higher than that of CRC concrete components.
As a result, the lateral deformation of CRC concrete components is smaller than that of C35 concrete components. Therefore, in this stage, the load-displacement curve of CRC concrete components lies below that of C35 concrete components. In
Figure 8, we can observe the following: In the initial loading stage, the Poisson's ratio of C35 concrete components is higher than that of MC concrete components. As a result, the lateral deformation of MC concrete components is smaller than that of C35 concrete components. Therefore, in this stage, the load-displacement curve of MC concrete components lies below that of C35 concrete components. In
Figure 9, we can observe the following: In the initial loading stage, the Poisson's ratio of C35 concrete components is higher than that of OSWC concrete components. As a result, the lateral deformation of OSWC concrete components is smaller than that of C35 concrete components. Therefore, in this stage, the load-displacement curve of OSWC concrete components lies below that of C35 concrete components. In
Figure 10, we can observe the following: In the initial loading stage, the Poisson's ratio of WTSC concrete components is lower than that of C35 concrete components. As a result, the lateral deformation of WTSC concrete components is smaller than that of C35 concrete components. Therefore, in this stage, the load-displacement curve of WTSC concrete components lies above that of C35 concrete components.
Figure 11,
Figure 12,
Figure 13,
Figure 14 and
Figure 15 shows the longitudinal stress profile of concrete under end-loading conditions. Compared to normal loads, it is evident that specimens with an initial stress state exhibit a higher ultimate longitudinal stress in concrete. This is due to the restraining effect of reinforcing steel on the concrete, leading to an increase in the peak strength of concrete near the steel. This observation indicates that when designing concrete structures, considering the initial stress state and the restraining effect of reinforcing steel is crucial for ensuring structural stability and safety. Therefore, engineers and designers need to fully understand and consider these factors to ensure that the designed concrete structures perform well and reliably in actual use.
Based on the provided data, describing the stress magnitudes and distributions for five different structural schemes: Stress Magnitudes: Among the five schemes, the highest stress is observed in
Figure 15 (0.1016 MPa), which is the WSTC scheme. The lowest stress is in
Figure 12 (0.06044 MPa), which represents the CRC scheme.
Stress Concentration: Across all schemes, the stress concentration areas are similar, generally located at the bending parts of the profile, especially where vertical ribs meet the panel. This indicates that these areas might be the weak points of the structure, suggesting a need for further attention and potential reinforcement.
Stress Distribution: Although the stress concentration areas are consistent, there's a difference in the stress distribution across the schemes:
Figures 11, 13, and 14 show more concentrated stress distribution, indicating that certain localized areas may bear higher stress, raising concerns about potential material fatigue or structural damage.
Figure 12 and
Figure 15 have more even Mises stress distribution, suggesting that these schemes might better distribute stress, potentially indicating a more robust structure.
These analyses could serve as a reference for further structural optimization and design improvements. By comparing the stress magnitudes and distributions across different schemes, it is possible to optimize structural design, reduce stress concentration areas, and ensure safety and reliability.
Based on the provided data, the strain magnitudes, and distributions for five different structural schemes can be described as follows:
Strain Magnitudes:
The highest equivalent strain is found in
Figure 15, with a value of 3.720e-04 meters.
The lowest equivalent strain is in
Figure 12, with a value of 2.181e-04 meters.
The strain magnitudes for the other schemes fall between these two, with
Figure 11 at 2.846e-04 meters,
Figure 4.13 at 2.372e-04 meters, and
Figure 4.14 at 3.010e-04 meters.
Strain Distribution:
Across the five schemes, the distribution of equivalent strain is generally quite uniform. This indicates that strain is relatively evenly distributed within the structures, reducing the risk of localized strain concentration. Such uniform distribution suggests higher structural stability, with lower chances of localized deformation or failure.
Overall, despite differences in strain magnitudes across the schemes, the uniform distribution indicates that these structural designs are relatively robust. The data provide a basis for further analysis and structural optimization to ensure stability and reliability, reducing the potential for strain concentration or localized deformation.
4.3. Conclusion and Recommendation
This study demonstrates the feasibility of using industrial waste and natural materials in concrete production to reduce its environmental footprint. Experimental results show that green concrete, made by blending waste and natural materials, can match or exceed the performance of traditional concrete. This approach offers environmental protection, resource conservation, and economic benefits while maintaining structural performance. However, there are limitations regarding the variability in performance based on the type and proportion of waste materials and uncertainties in long-term durability. Further research is needed to explore these aspects and optimize material combinations.
