Preprint
Article

Microalgal Diversity and Molecular Ecology: A Comparative Study of Classical and Metagenomic Approaches in Ponds of the Eifel National Park, Germany

Submitted:

25 June 2024

Posted:

26 June 2024

You are already at the latest version

A peer-reviewed article of this preprint also exists.

Abstract
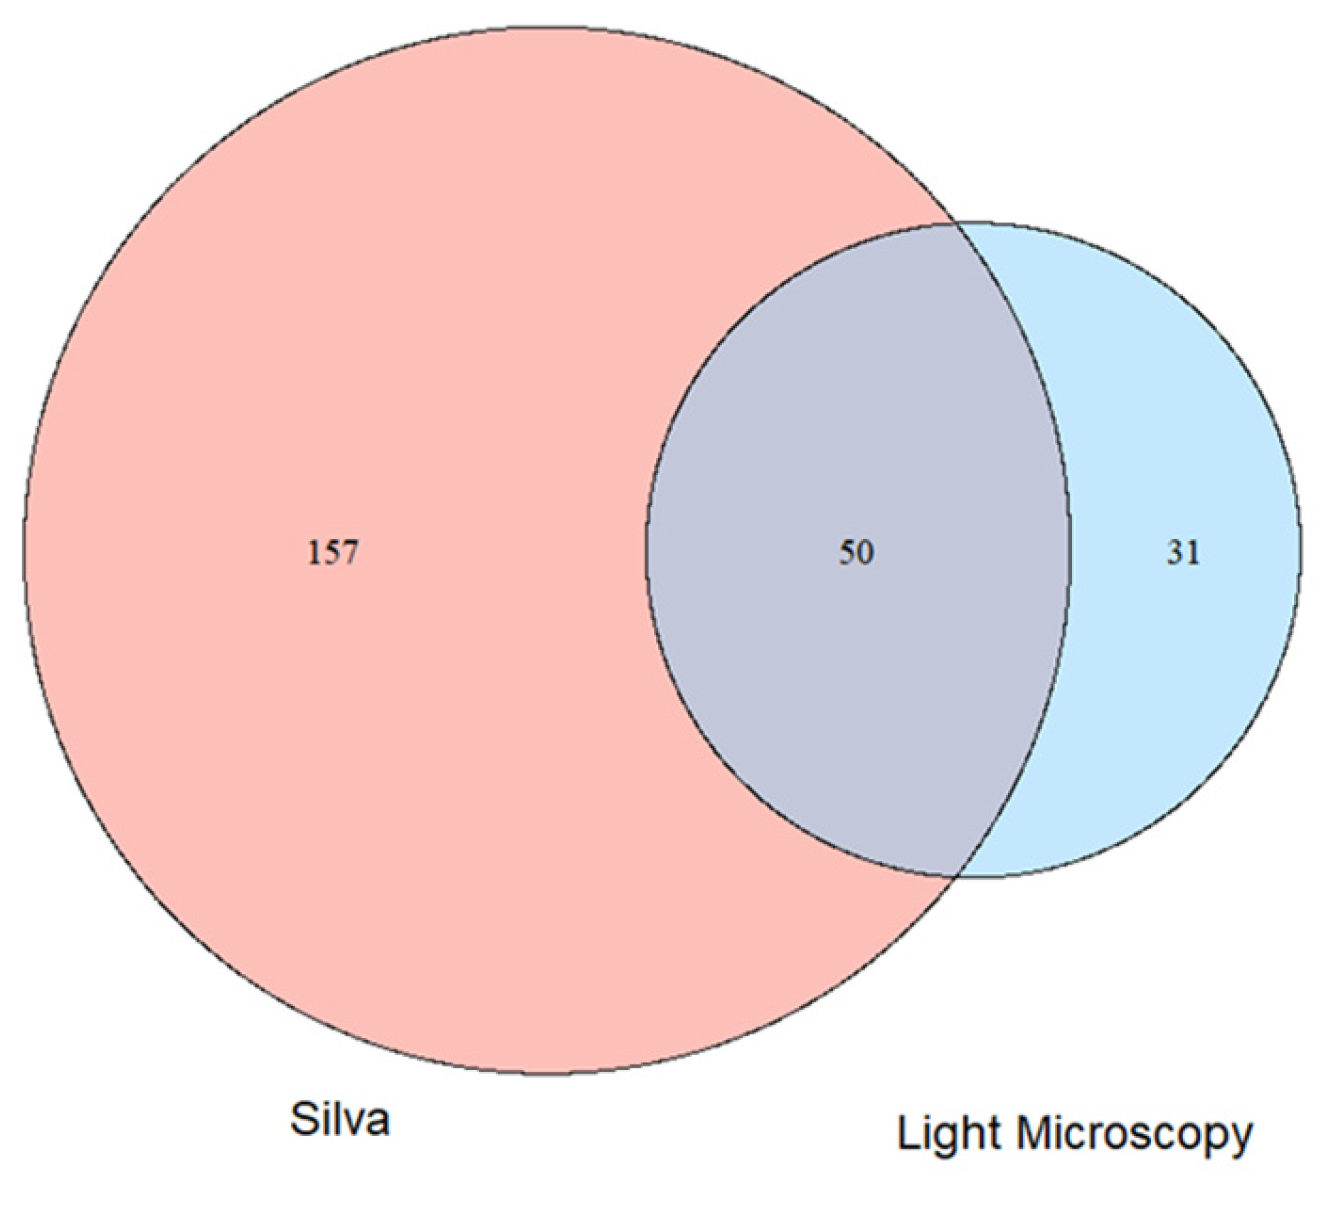
While molecular methods have begun to transform ecology, most algal biodiversity is still studied using the classical approach of identifying microalgae by light microscopy directly in sample material or using cultures. In this study, we compare both approaches (light microscopy and metagenomics as a molecular approach) using freshwater ponds of the Eifel National Park in Germany as a case study. The ponds were found to be rich in desmids by light microscopy. A total of 299 species representing 81 genera were identified by light microscopy. While the molecular method does not currently allow species identification in most cases, we were able to identify 207 different algal genera. 157 genera were detected only by metagenomics, 50 genera with both methods and 31 genera were found by light microscopy, highlighting the need to continue using light microscopy in addition to a molecular approach. The metagenomics method has several advantages over the light microscopy method: 1) deeper assessment of alpha biodiversity 2) better abundance numbers 3) complete coverage of all living matter. The latter is also a significant improvement over metabarcoding, as universal PCR primers are not available.
Keywords: 
Subject: 
Biology and Life Sciences  -   Plant Sciences

1. Introduction

The field of algal ecology is still largely dominated by classical approaches, such as microscopic identification of algae including abundance measurements, determination of chlorophyll A concentrations and other group-specific compounds by spectrometry, establishment of cultures for further analysis, etc. [1,2,3]. In contrast, molecular methods (metabarcoding, metagenomics, meta-transcriptomics) are widely used in other fields of microbial ecology (e.g., study of fungi and bacteria). Only barcoding is used to some extent in algal ecology, mostly to identify algae in culture at the molecular level.
In the light microscopic approach, the taxa of interest are typically identified by morphological characteristics such as colour, cell size and shape, or motility [4,5,6,7]. The use of light microscopy for identification is relatively fast and inexpensive compared to molecular techniques [8], but requires expert knowledge for many taxa, as morphological features are often difficult to recognise and distinguish [9].
Morphological characteristics are not always stable, as they can change in response to environmental factors [10]. Alternatively, a set of molecular sequence markers, known as barcodes, can be used when unialgal cultures are available [11]. Typical barcode sequences used for algae are the 16S/18S rRNA gene and internal transcribed spacer (ITS) rDNA, RuBisCO large subunit (rbcL), plastid elongation factor tufA, cytochrome oxidase I (COX I) [12,13,14,15,16,17,18]. A major drawback of this approach is that the majority of microorganisms present in environmental samples are unculturable [19,20,21,22]. To overcome the limitations of cultivation, metabarcoding can be used to assess biodiversity [23,24,25]. Total DNA (eDNA) is extracted from an environmental sample and used as a template to generate an amplicon mixture from a barcoding gene [23]. The resulting PCR products are then sequenced using high-throughput sequencing (HTS) technology [23,26]. Taxa are identified by annotating the resulting sequence reads against an appropriate database, and sequence counts provide information on taxonomic abundance in the sample [23,27]. However, (meta)barcoding also has several pitfalls, such as the introduction of sequence errors during PCR, the design of appropriate metabarcoding primers that cover all taxa of interest, and again the need for appropriate reference databases [23].
PCR-dependent bias and reliance on single barcodes can be avoided by using shotgun metagenomics and metatranscriptomics [28,29]. Similar to metabarcoding, total nucleic acids are isolated from an environmental sample, but the amplification step is omitted [28,29]. Instead, total DNA or cDNA is applied directly to HTS and the resulting sequences are assembled for any gene or transcript of interest, such as small ribosomal subunit RNA [30]. This powerful approach allows more reliable taxonomic identification than metabarcoding [31], but is dependent on the availability of correctly determined sequence data [28,32].
While working on biological soil crusts in polar regions, we identified a significant potential of metagenomics and metatranscriptomics for algal ecology e.g., [33,34, 35,36]. We were able to show that metabarcoding revealed higher biodiversity than the traditional light microscopy approach [34]. Furthermore, in a recent paper we showed that metagenomics is a more effective approach than metabarcoding for studying algal biodiversity in natural habitats [31]. In this study, we directly compare light microscopic and metagenomic methods to study the biodiversity of freshwater ponds in the Eifel National Park, Germany.
The Eifel National Park was established in 2004 by the German state of North Rhine-Westphalia. The park covers an area of approximately 110 square kilometres in the south-west of North Rhine-Westphalia. The aim of the park is to allow nature to develop mainly naturally, and it consists of areas that are completely closed to the public and managed areas that allow various types of activities. The Eifel National Park was created with the aim of playing a major role in the protection of flora and fauna in North Rhine-Westphalia. In order to achieve this goal, it is necessary to make an inventory of all organisms living in the national park (for an up-to-date summary, see [37]). While this is a relatively simple task for many macrophytes and metazoans, the detection and identification of microbial diversity is still time consuming and difficult. To this end, algal biodiversity in the Eifel National Park has been monitored using the classical approach by one of us (Linne von Berg) almost since its inception, and this work has been documented in annual reports. A total of 926 algal species, including 66 cyanobacteria, have been documented [38].
In this report, we attempt to determine the microalgal (focus on diatoms and zygnematophytes) by light microscopy and microbial diversity using a metagenomic approach of the 14 (5 by metagenomics) artificial water bodies located mainly in the closed area of the national park. All water bodies are man-made (fishing ponds), often constructed many years before the establishment of the national park, and were maintained when the national park was established. In a few cases, additional ponds were added after the establishment of the National Park. We show that although molecular methods offer considerable advantages, there were still a number of algal species that we only observed using classical methods.

2. Materials and Methods

2.1. Site Descriptions and Sampling

Samples were collected from a total of 17 ponds in the Eifel National Park at three sites between March and June 2021. In addition, samples for metagenomic studies were collected from five selected ponds in October 2022. The first site consists of six ponds called ‘Himmelsteiche’ (coordinates: N 50°30′20″; E 6°19′06″), which are perennial ponds surrounded by dense vegetation (Table 1). The six ponds vary in size, depth and surface mats of plants and algae, as well as in the presence and abundance of Sphagnum sp. (Table 1). The second site was the 10 ponds called “Schürhübelteiche” (coordinates: N 50°33′13″; E 6°26′03″). It is important to note that these ponds have the potential to dry out completely or fragment during periods of drought (Table 1). Of the ten ponds present, only six were sampled as four of them tend to dry out early in the year. Ponds 6-8 have a dominant clay composition in their soils, while the other ponds have a higher presence of organic compounds. All ponds are surrounded by dense vegetation, with Sphagnum sp. found in much lower abundance in only one of the ponds. The third site consists of two ponds located at “Helingsbach” (coordinates: N 50°33′18″; E 6°24′57″) within the public area of the Eifel National Park, whereas the other two sites are not accessible to the public. Both ponds are perennial and surrounded by dense vegetation, but lack Sphagnum sp. All 14 ponds are artificial, with the 2 ponds at “Helingsbach” being former tank canals, originally part of a military training area.
Two sampling strategies were used. Firstly, sediment sampling was carried out using a telescopic pole. Secondly, submerged vegetation material was squeezed and the rinse water collected. The two sampling strategies were combined for analysis.

2.2. Water Chemistry Analysis

Chemical analyses were carried out on all 14 ponds twice within a three-week period in May 2021 to determine the levels of phosphate, ammonia, nitrate, nitrite, carbonate and total water hardness. The average is given in Supplemental Table 1.
Nitrate was measured with the RQflex® 10 reflectometer using Reflectoquant test strips. Ammonia, phosphate and nitrite were quantified using the WTW PhotLab S12 photometer and Merck commercial ammonium, phosphate and nitrite tests. The sera aqua test box was used to determine carbonate hardness and total water hardness. It provides an indication in dH° value, which represents the degree of hardness.
On-site measurements of electrical conductivity and pH were carried out for all 14 ponds using the GMH 3400 series and the Greisinger G1500 pH meter. The average of 5 measurements at five different days is given in Supplemental Table 1.

2.3. Light Microscopy and Species Identification

The collected samples were first examined using a microscope (Olympus XC41 microscope) at 20x-60x magnification and images were taken for documentation. The species were identified using relevant literature [39,40,41,42,43,44,45]. To identify diatom species, photographs were taken using immersion oil (Olympus XC41 microscope) at 100x magnification. Alternatively, the Naphrax method was used. The sample was pipetted onto a microscope slide and dried under a hood. The slide was then heated with an ethanol burner and naphtha was added to the sample. A coverslip was placed over the sample and the slide was heated again to liquefy and spread the naphtha under the coverslip.

2.4. DNA Isolation and Metagenomic Sequencing

Total DNA was extracted from the five most diverse ponds (with two technical replicates of two field replicates collected) using the DNeasy PowerSoil Pro Kit (QI-AGEN, United States) according to the manufacturer’s instructions. Subsequently, the extracted DNAs were then sent to Eurofins Genomics (Konstanz, Germany) for metagenomic sequencing on a NovaSeq6000 platform. Raw reads were submitted to the Sequence Read Archive (SRA) at NCBI under the project number PRJNA1124436.

2.5. Bioinformatic and Statistical Analyses

The obtained FASTQ files were processed using the OmicsBox software package (Biobam Bioinformatics S.L., Valencia, Spain). The files were quality filtered and trimmed using the Trimmomatic [46]. Furthermore, 16S and 18S rRNAs rRNAs were separated from the dataset using the SortMeRNA [47] and taxonomically assigned using the SILVA database (v138.1).
Statistical analyses were carried out in R (v 4.3.2). To test for differences in various parameters among the sampling sites, a one-way analysis of variance (ANOVA) was conducted, followed by Tukey’s HSD post hoc test (p-value < 0.05). Normality of variance was assessed using Shapiro–Wilk’s test. Furthermore, to illustrate taxonomic differences between the sampling sites light microscopical abundance of taxa and metagenomic reads assigned to taxa, non-metrical multidimensional scaling (NMDS) was performed using the package vegan [48] and statistical difference was tested with ANOSIM test. Soil parameters were fitted into the ordination space using the function envfit and significance of the associations was determined by 9999 random permutations.

3. Results

3.1. Water bodies in the Eifel National Park

The investigated water bodies are a diverse collection of man made ponds with quite variable environmental parameters, such as size, depth, surface cover with plants and/or algae, presence of Sphagnum etc. Table 1 summarises the majority of these parameters. A comprehensive list can be found in Supplemental Table 1. Additionally, Supplemental Table S1 contains the number of algal species (total, desmids, diatoms) for each pond as well as the chemical characteristics of the ponds.
In brief, the pH varied between 5.8 and 7.3.The conductivity was low (29.1–77.9 µS) indicating that the majority of ponds were nutrient poor. The latter is supported by the rather low ammonia (0.04–0.28 mg/L), nitrite (below detection limit—up to 0.07 mg/L) and phosphate (0.10–0.65 mg/L) concentrations observed. Based on these chemical values the ponds would be assigned to the category good of the European water framework directive [49,50].

3.2. Algal Biodiversity of the Investigated Ponds: Classical Approach

A total of 299 different algal species (plus a number of morphological different taxa that could be not determined at the species level), including 117 desmids and 30 diatoms were identified by light microscopy in the 14 ponds examined (Supplemental Table S2). Four of the beautiful desmids found in the Eifel ponds are depicted as an example in Figure 1. We could not determine the exact species for all microalgae. For example, there are at least 9 clearly morphologically different Mougeotia species in addition to the two determined species (see Supplemental Table S2). However, for many of these species the presence of zygotes are required to determine the species correctly.
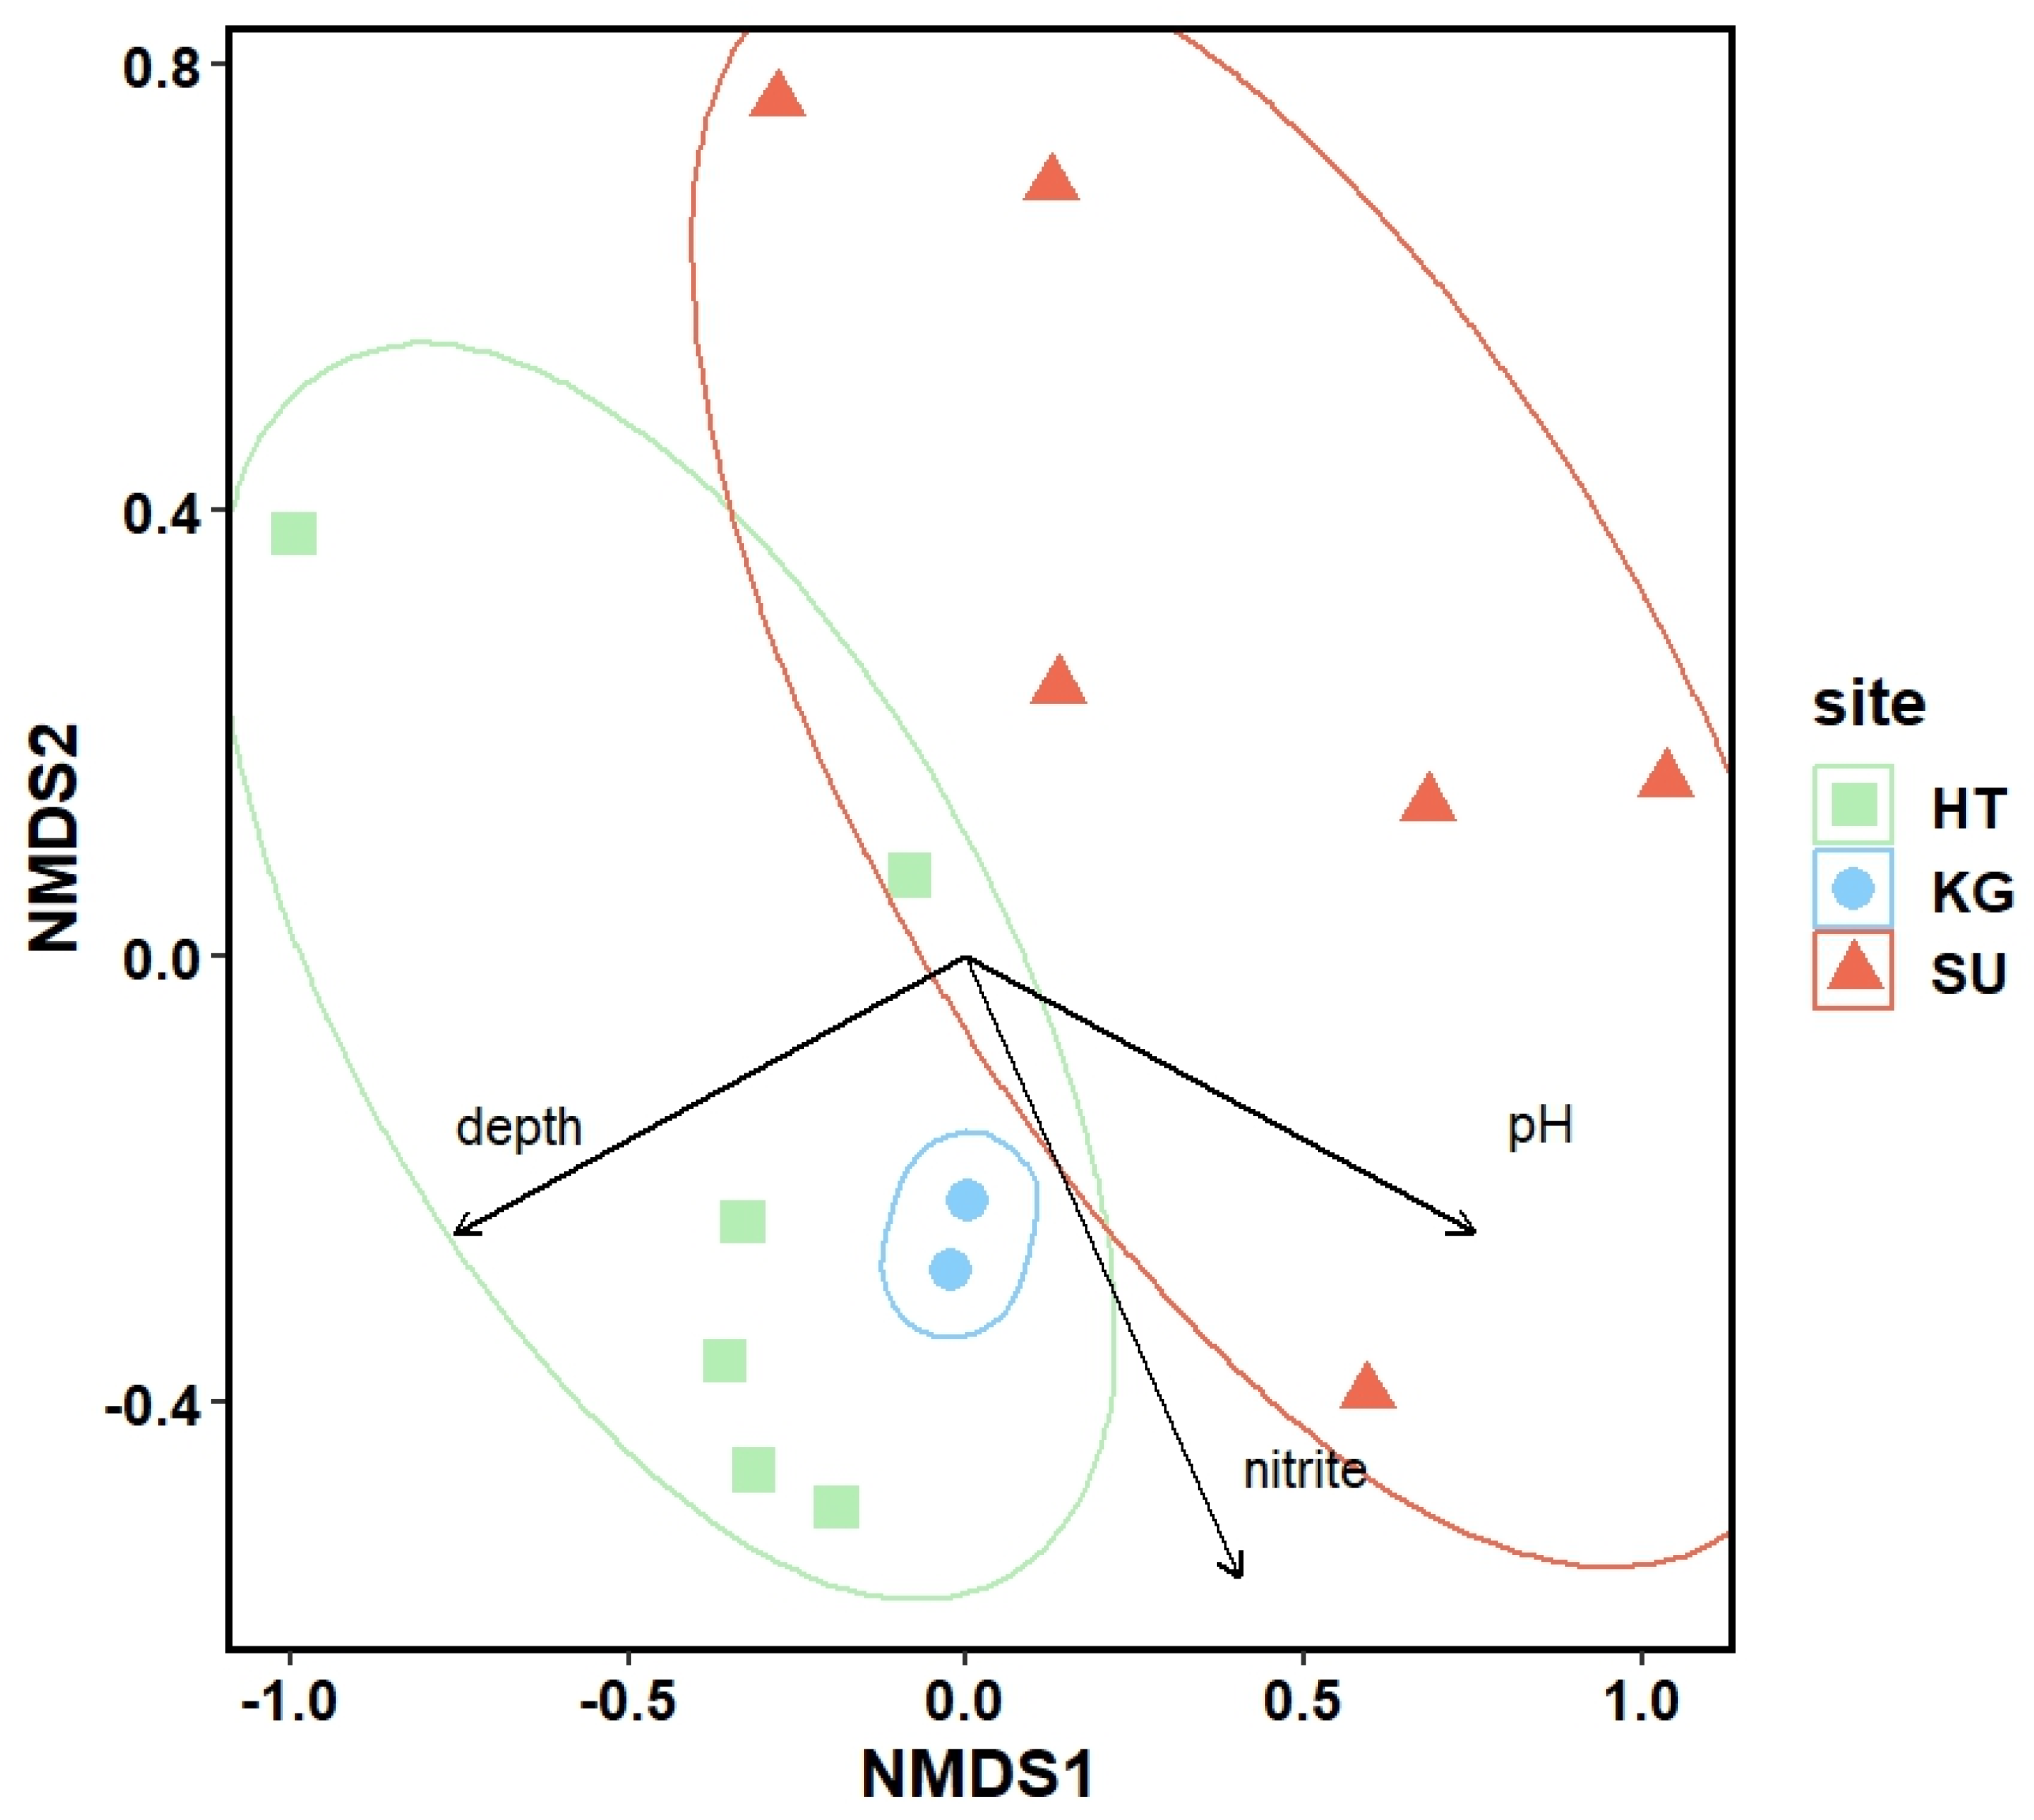
The number of algal species found in each pond varied between 19 (SU09) and 121 (HT03) and are included in Supplemental Table S1 together with the Shannon (between 3.08 and 4.25) and Simpson diversity (0.68–0.85) indices. All species are listed in Supplemental Table S2. HT06 had an especially rich micro algal flora containing 121 different algal species including 60 different desmids. To compare the different lakes with each other we used a non-metric multidimensional scaling (NMDS) method. The obtained plot is shown in Figure 2. Vectors indicate environmental factors showing a significant correlation with the observed micro algal diversity pattern. Pond depth, pH and nitrite were the only three environmental factors showing a significant correlation with the observed diversity pattern.

3.3. Microbial Diversity: Metagenomic Approach

5 ponds representing the observed light microscopical diversity (SU01, SU08, KG01, HT03 and HT06, see Figure 2) were selected for metagenomic analyses. 2 Technical replicates for 2 replicate samples each were analysed except for HT03 and SU08 (2 and 3 replicates, respectively) for each site were sequenced (Nova600, PE 150 bp) at the sequencing facility of Eurofins. Between 11,986,763–30,051,744 read pairs were sequenced and the ribosomal DNA reads extracted using the SortMeRNA tool. The rDNA reads were aligned with the Silva database and the reads counted as to measure the relative abundance.
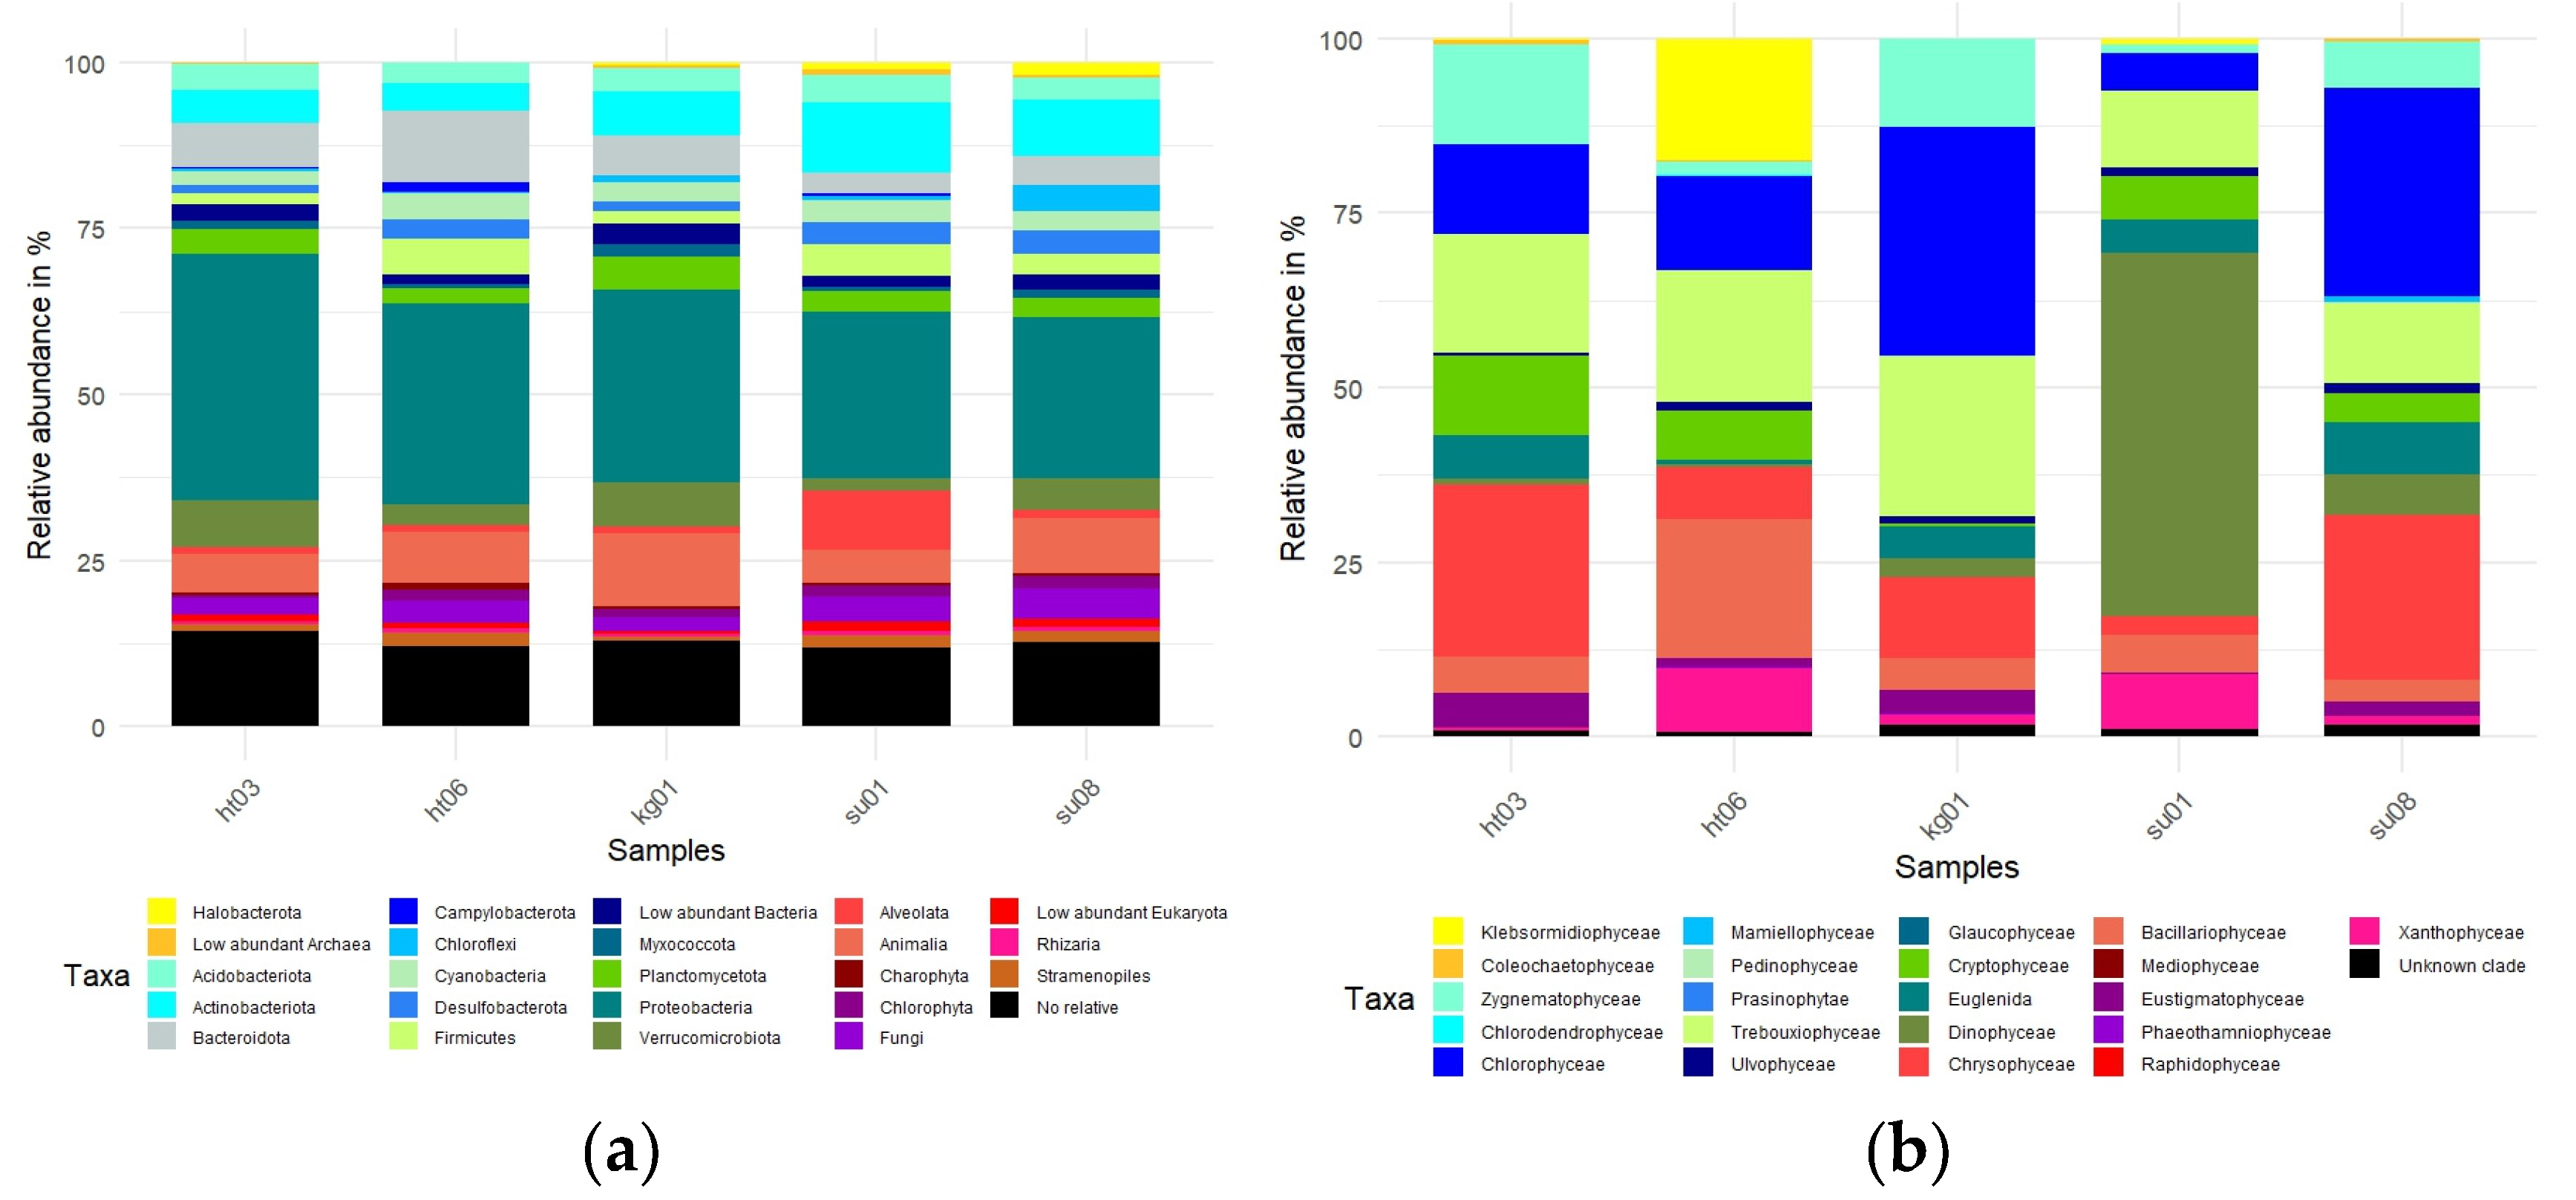
Figure 3a shows the relative abundance of various organismal groups in the total data set and Figure 3b the relative abundance of the microalgal sub data set. As is evident from Figure 3a,b the biodiversity was represented by a large number of different species, with all major eukaryotic groups detected in all ponds, although the various ponds differed in the relative abundance of the different groups. Interestingly, photoautotrophs represented only a minor fraction of the complete molecular diversity observed (relative abundance of exemplary photoautotrophs: cyanobacteria relative total abundance ~ 3.189, chlorophyta relative total abundance ~ 1.435). However, there were some major differences between the ponds in the micro algal communities, with different groups dominating in different ponds. Most strikingly, the micro algal sub metagenome of SU01 was dominated by dinoflagellates. Most of the dinoflagellate reads came from a single species, which interestingly we have never observed by the light microscopy. Klebsormidiophyceae were only present in large amounts in the HT06 pond, which lacked a large zygnematophyte population. Green algae represented 45 to 75 percent of the observed biodiversity, except for SU01 which is dominated by the single dinoflagellate. Bacillariophyceae had their largest abundance in HT06 (relative abundance ~ 19.904).
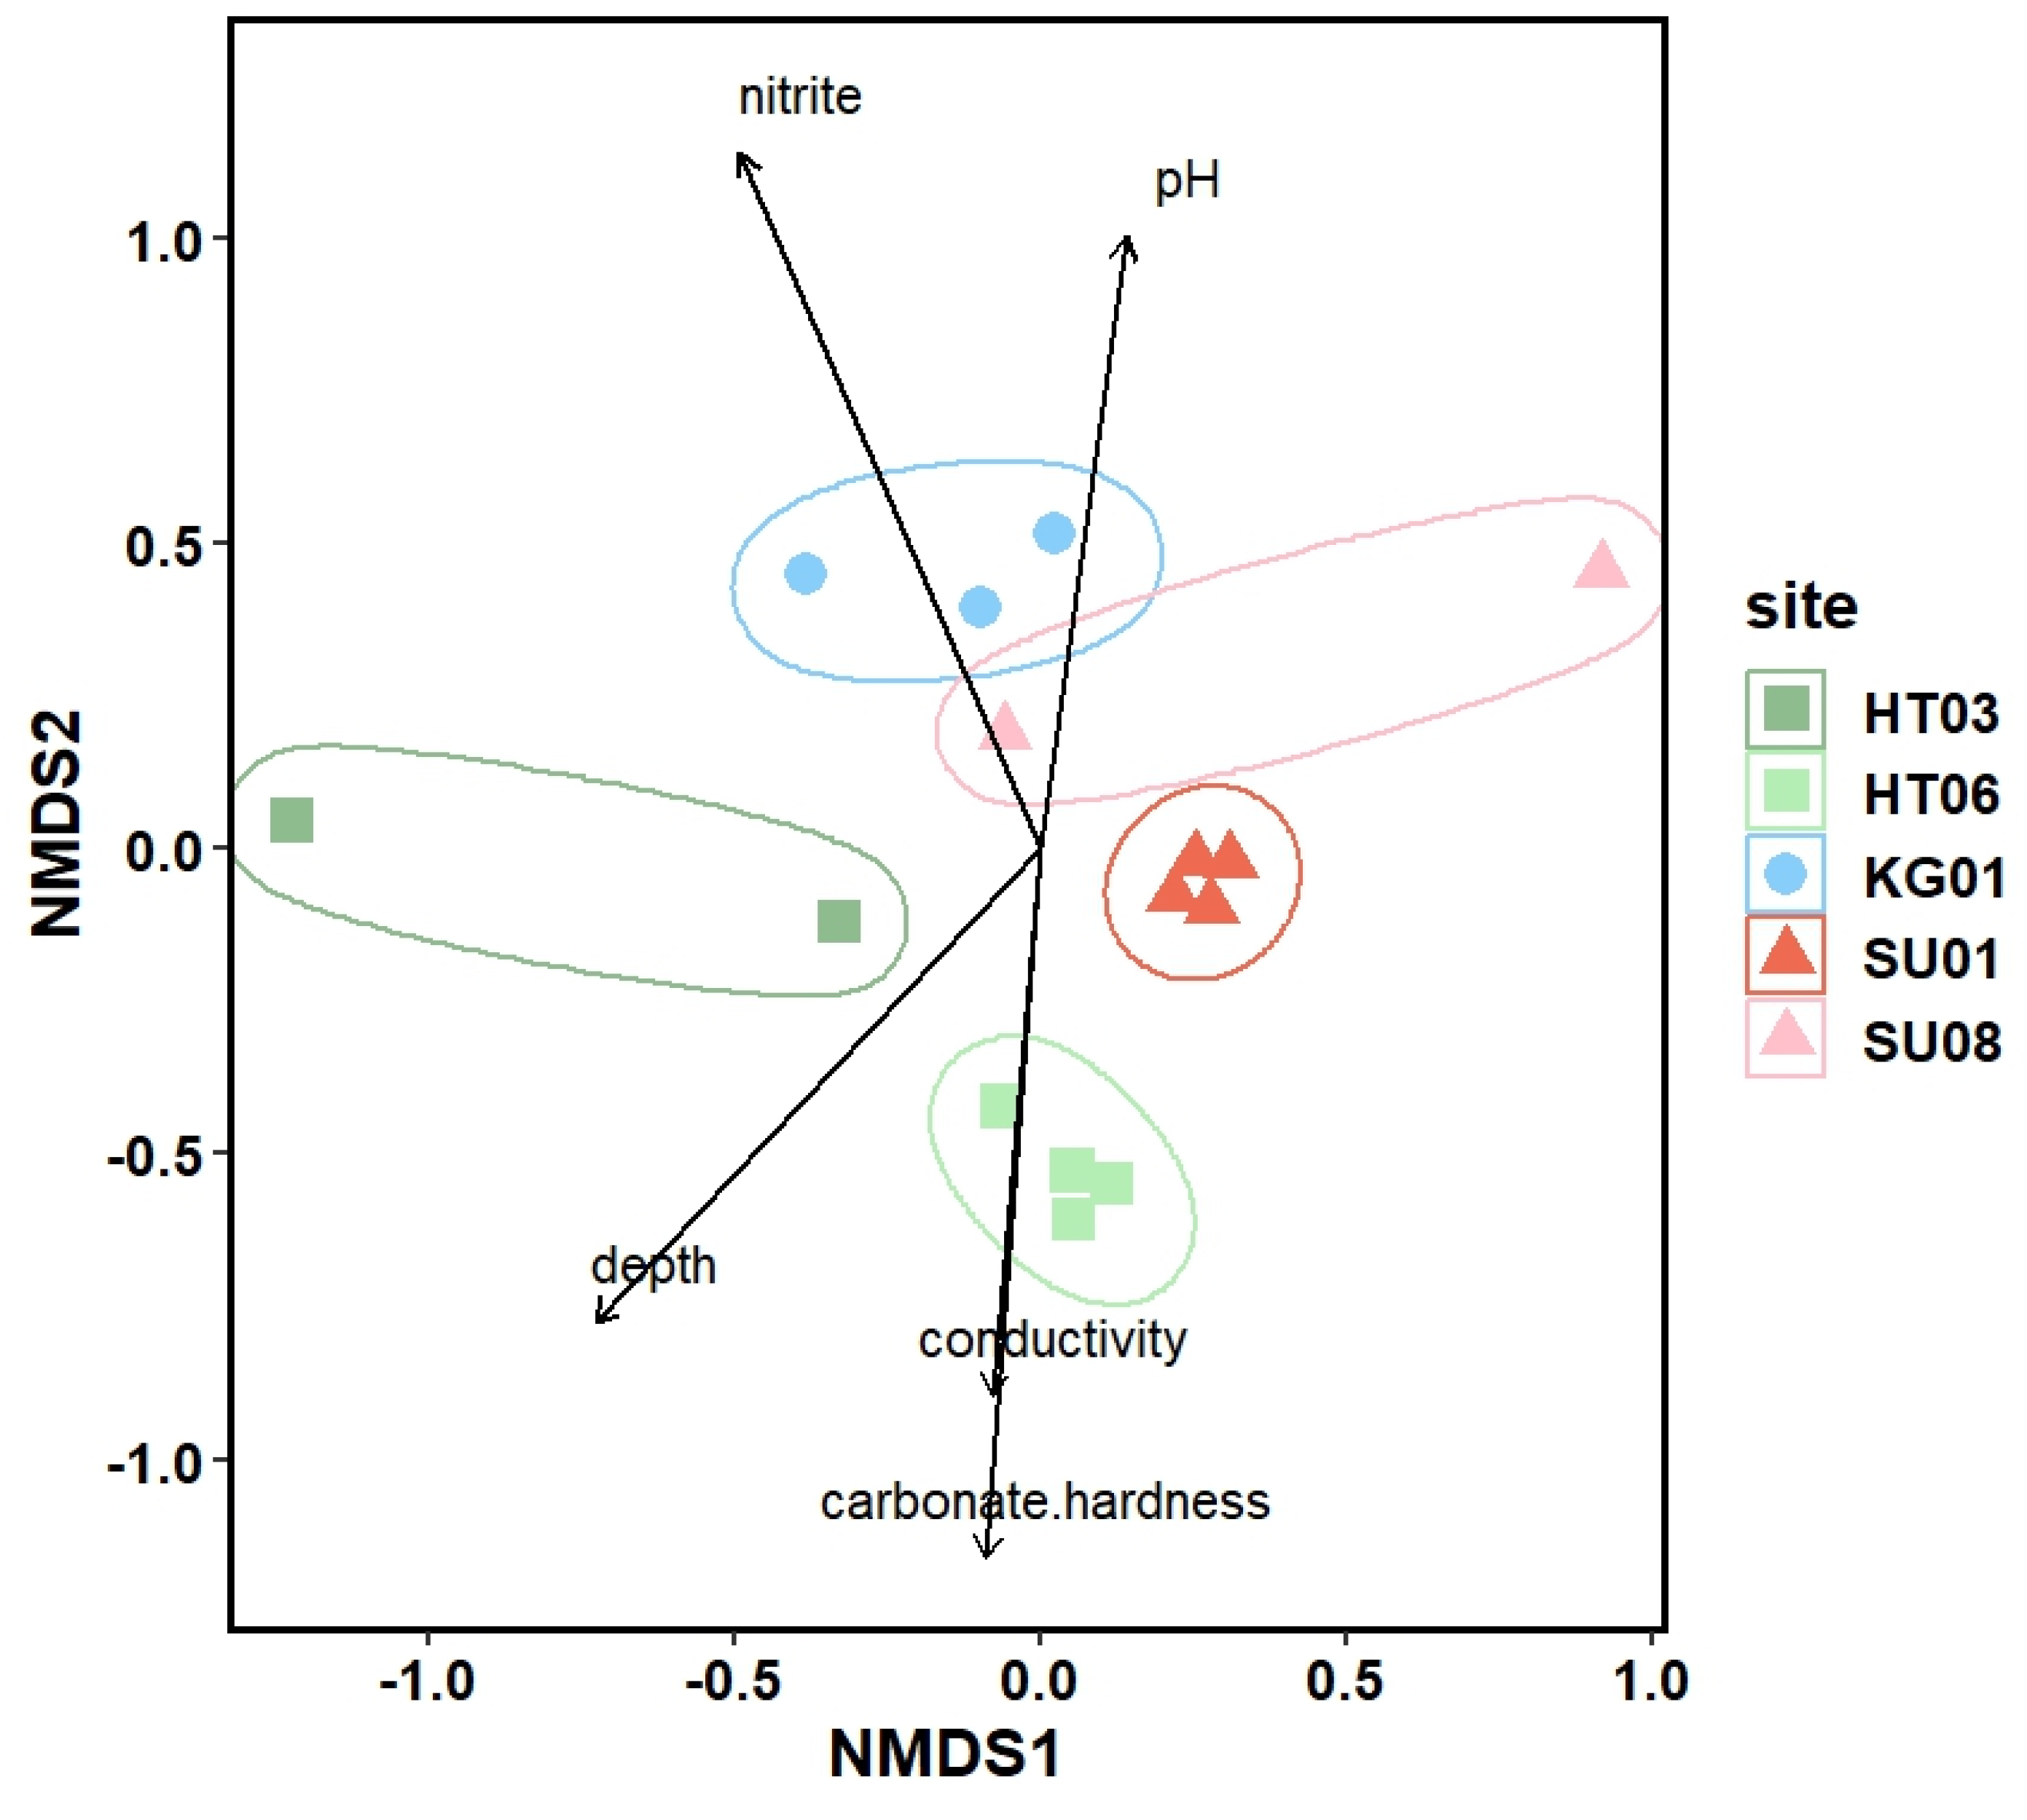
The NMDS approach using the molecular abundance data for the 5 investigated ponds gave a similar pattern as the light microscopy approach (Figure 4). The biodiversity of microalgae in the investigated ponds could be correlated with ph, nitrite and depth as distinguishing factors. For this data set we also observed a correlation with conductivity and carbon hardness.

3.4. Comparison of the Alpha Biodiversity Found by Light Microscopic and Molecular Analysis of Photoautotrophs

When we compared the microscopic analyses with the metagenomic analyses (Figure 4) more micro algal genera were found with the metagenomic analysis than with the microscopic method (207 to 81 genera respectively). 50 genera were observed with both methods, while 157 (31) were only found with the molecular method or the classical approach respectively.

4. Discussion

Microalgal Biodiversity of Eifel Ponds
The biodiversity of the microalgae in the Eifel National Park has been monitored almost since its establishment. By December 2020, 926 different algae, including 66 species of cyanobacteria, had been recorded [38]. Of these, 2016 are rare species included in red lists [38]. In this study, we provide molecular evidence for the presence of a further 157 previously unreported genera. This represents a huge increase in algal diversity. The real additional molecular diversity is likely to be much higher, as we only investigated 5 ponds using metagenomics, and due to the still incomplete databases, which only allow us to detect genera using the Silva database, the genera identified by molecular methods may represent many species (see for example in Supplementary Table S2 the large number of Desmid species identified by light microscopy representing a single genus in the ponds investigated). One of the most striking differences between the two methods in this study is the large number of rRNA reads found for the dinoflagellate Jadwigia spec. Jadwigia was only found in a single pond (SU1) and only by metagenomics. Jadwigia was only described in 2005 [51,52] and has never been observed in a pond in the Eifel National Park. As we also sampled sediments from the investigated ponds for the metagenomic approach, we think that a large number of hypnozygotes of Jadwigia could have been present in the sediment. Future studies are needed to support this explanation.
Differences between the Two Approaches
In this report we determined the micro algal biodiversity of 14 ponds using the classical approach (identification of species by light microscopy [4,5,6,7]. Based on the light microscopical results 5 ponds representing the light microscopically observed diversity were selected and analysed by a molecular approach, which has been suggested to be superior to the classical approach [23,24,25]. Initially most molecular studies were done using the metabarcoding approach, however more recently metagenomics has started to replace metabarcoding. We choose metagenomic sequencing of environmental DNA as an approach as this has recently shown by us to be preferential to metabarcoding [31]. Metagenomics allows a deeper investigation (detection of rare species) of the biodiversity and is not impeded by PCR biases as the metabarcoding approach. Similar to earlier results [34] we found a larger number of microalgal genera using the molecular method (207) than using the classical approach (81). In addition the metagenomics (mapping reads to sequence databases) always gives quantitative numbers that can be used for quantitative analyses [23,27], while it is still very difficult to infer the abundance of microalgae using the classical methods, either employing Utermöhl sedimentation chambers (fixed material, [53]), or more often artificial numbers to record the abundance of the microalgae observed. Another major advantage of the molecular method is that it allows the detection and analysis of the complete biodiversity of the investigated ponds. Light microscopical identification is based on expert training and there will be nobody worldwide who can identify all eukaryotic groups at the same time.
However it is important to note that molecular methods still have some problems on their own. Most strikingly 31 genera were only found using the light microscopy method, suggesting that the molecular method still introduces some artificial bias, either at the DNA isolation or sequencing stage of the investigation. Another drawback is that while microscopic observations often allow us to identify the microalgae at the species level, molecular methods generally allow only to assign algae at the genus level. Incomplete and wrongly annotated reference data are a major problem when performing molecular analyses of any kind and impair the correct determination of genera in environmental samples [23,32]. The microbial dark matter, meaning the total of unculturable microorganisms, complicates this matter even more, as classical methods fail to add sequence information to the databases [54]. However, the developing omics techniques can overcome the limit of culturability and supply the databases with novel sequences [54].
Molecular and light microscopical methods gave similar results regarding the ecology of the investigated ponds. Water depth, pH and nitrite were correlating with the observed biodiversity differences. Again the molecular method identified two additional factors correlating with observed differences: conductivity and carbon hardness. The reason for this better “resolution” of the discriminating factors might be twofold: 1. Greater alpha diversity and 2. better abundance numbers. The read number determined for the rRNA of the different species is directly correlated to the cell number of an alga. It might be different for different algae dependent on rRNA gene numbers and genome size, leading to different percentages of the genome coding for rRNA. However they are constant for each species and allow a direct comparison of the numbers for the different algae [23,27]

5. Conclusions

Our results show that overall a molecular determination of the biodiversity of photoautotrophs offers several advantages over the classical approach: greater alpha biodiversity, better abundance numbers and inclusion of all organismal groups. However, it is important to keep in mind that the molecular approach is still not able to detect some organisms found by light microscopy. In addition the databases are still missing many species, which can be therefore only detected at the genera level.For this reason if a complete determination of the algal biodiversity is required it is still preferential to use both approaches.

Supplementary Materials

The following supporting information can be downloaded at the website of this paper posted on Preprints.org, Table S1: Environmental parameters of the investigated ponds of the EifelNational Park; Table S2: Complete list of all algal species identified in the investigated ponds of the Eifel National Park.

Author Contributions

The work presented in this report was conceptualised by BB and LvB; samples were obtained by LvB and NK; light microscopy LvB and NK; isolation of DNA and molecular analyses LK and EP; writing—original draft preparation, LK.; writing—review and editing, LvB, EP, BB; visualisation, LK and EP; supervision, BB. All authors have read and agreed to the published version of the manuscript.

Funding

This research received no external funding

Institutional Review Board Statement

Not applicable

Data Availability Statement

All raw reads of the metagenomic analyses can be found at the NCBI Bioproject number: PRJNA1124436.

Acknowledgments

We like to thank the students of the Biology of Algae class in the winter term 2022 for their help with DNA isolation.

Conflicts of Interest

The authors declare no conflicts of interest

References

  1. Skinner CE (1932) Isolation in pure culture of green algae from soil by a simple technique. Plant Physiol 7:533–537. http s://doi.org/10.1104 /pp.7.3.533. [CrossRef]
  2. Bischoff H, Bold H (1963) Some soil algae from enchanted rock and related algal species. University of Texas Publications, Austin.
  3. Waterbury JB, Stanier RY (1978) Patterns of growth and development in pleurocapsalean Cyanobacteria. Microbiol Rev 42:2–44.
  4. Prescott GW (1964) How to know the fresh-water algae. Plenum Press, New York.
  5. Lind EM, Brook AJ (1980) A key to the commoner desmids of the English Lake District. Freshwater Biological Association.
  6. Cox EJ (1996) Identification of freshwater diatoms from live material. Chapman & Hall, London.
  7. John DM, Whitton BA, Brook AJ (2002) The freshwater algal flora of the British Isles: an identification guide to freshwater and terrestrial algae. Cambridge University Press, New York.
  8. Misawa S (1999) Rapid diagnosis of infectious diseases; features and limitations of the microscopic examination of clinical specimens. J Assoc Rapid Method Autom Microbiol 10:121–131.
  9. Manoylov KM (2014) Taxonomic identification of algae (Morphological and molecular): species concepts, methodologies, and their implications for ecological bioassessment. J Phycol 50:409–424. https://doi.org/10.1111 /jpy.1218 3. [CrossRef]
  10. Albrecht M, Pröschold T, Schumann R (2017) Identification of Cyanobacteria in a eutrophic coastal lagoon on the Southern Baltic coast. Front Microbiol 8:923. http s://doi.org/10.3389 /fmic b.2017.0092 3. [CrossRef]
  11. Vieira HH, Bagatini IL, Guinart CM, Vieira AAH (2016) tufA gene as molecular marker for freshwater Chlorophyceae. Algae 31:155–165. http s://doi.org/10.4490 /alga e.2016.31.4.14. [CrossRef]
  12. Buchheim MA, Chapman RL (1991) Phylogeny of the colonial green flagellates: a study of 18S and 26S rRNA sequence data. BioSystems 25:85–100. http s://doi.org/10.1016 /0303 -2647 (91)9001 5-D. [CrossRef]
  13. Wilmotte A (1994) Molecular evolution and taxonomy of the Cyanobacteria. In: Bryant D (ed) The molecular biology of cyanobacteria. Springer, Dordrecht, pp 1–25. 14. Doyle JJ, Doyle JL, Ballenger JA et al. (1997) A phylogeny of the chloroplast gene rbcL in the Leguminosae: taxonomic correlations and insights into the evolution of nodulation. Am J Bot 84:541– 554. https://doi.org/10.2307 /2446 030. [CrossRef]
  14. Doyle JJ, Doyle JL, Ballenger JA et al. (1997) A phylogeny of the chloroplast gene rbcL in the Leguminosae: taxonomic correlations and insights into the evolution of nodulation. Am J Bot 84:541– 554. https://doi.org/10.2307 /2446 030. [CrossRef]
  15. An SS, Friedel T, Hegewald E (1999) Phylogenetic relationships of Scenedesmus and Scenedesmus-like coccoid green algae as inferred from ITS-2 rDNA sequence comparison. Plant Biol 1:418–428. http s://doi.org/10.1111 /j.1438 -8677.1999.tb00 724.x. [CrossRef]
  16. Evans KM, Wortley AH, Mann DG (2007) An assessment of potential diatom “barcode” genes (cox1, rbcL, 18S and ITS rDNA) and their effectiveness in determining relationships in Sellaphora (Bacillariophyta). Protist 158:349–364. http s://doi.org/10.1016/j.prot is.2007.04.001:. [CrossRef]
  17. Sherwood AR, Vis ML, Entwisle TJ et al. (2008) Contrasting intra versus interspecies DNA sequence variation for representatives of the Batrachospermales (Rhodophyta): insights from a DNA barcoding approach. Phycol Res 56:269–279. http s://doi.org/10.1111 /j.1440 -1835.2008.0050 8.x. [CrossRef]
  18. Hall JD, Fucikova K, Lo C et al. (2010) An assessment of proposed DNA barcodes in freshwater green algae. Cryptogam Algol 31:529–555.
  19. Ward DM, Weller R, Bateson MM (1990) 16S rRNA sequences reveal numerous uncultured microorganisms in a natural community. Nature 345:63–65. http s://doi.org/10.1038 /3461 83a0. [CrossRef]
  20. Schloss PD, Handelsman J (2005) Metagenomics for studying unculturable microorganisms: cutting the Gordian knot. Genome Biol 6:229. http s://doi.org/10.1186 /gb-2005 -6-8-229. [CrossRef]
  21. Shi XL, Marie D, Jardillier L et al. (2009) Groups without cultured representatives dominate eukaryotic picophytoplankton in the oligotrophic South East Pacific Ocean. PLoS ONE 4:e7657. https://doi.org/10.1371 /jour nal.pone.0007 657. [CrossRef]
  22. Massana R, del Campo J, Sieracki ME et al. (2014) Exploring the uncultured microeukaryote majority in the oceans: reevaluation of ribogroups within stramenopiles. ISME J 8:854–866. https://doi.org/10.1038 /isme j.2013.204. [CrossRef]
  23. Taberlet P, Coissac E, Pompanon F et al. (2012) Towards next-generation biodiversity assessment using DNA metabarcoding. Mol Ecol 21:2045–2050. http s://doi.org/10.1111 /j.1365 -294X.2012.0547 0.x. [CrossRef]
  24. Yoon T-H, Kang H-E, Kang C-K et al. (2016) Development of a costeffective metabarcoding strategy for analysis of the marine phytoplankton community. PeerJ 4:e2115. http s://doi.org/10.7717 /.
  25. Elferink S, Neuhaus S, Wohlrab S et al. (2017) Molecular diversity patterns among various phytoplankton size-fractions in West Greenland in late summer. Deep Res Part I Oceanogr Res Pap 121:54–69. http s://doi.org/10.1016 /j.dsr.2016.11.002peer j.2115. [CrossRef]
  26. Margulies M, Egholm M, Altman WE et al. (2005) Genome sequencing in microfabricated high-density picolitre reactors. Nature 437:376–381. http s://doi.org/10.1038 /nature03 959. [CrossRef]
  27. Pawlowski J, Christen R, Lecroq B et al. (2011) Eukaryotic richness in the abyss: insights from pyrotag sequencing. PLoS ONE 6:e18169. http s://doi.org/10.1371 /jour nal.pone.0018 169:. [CrossRef]
  28. Urich T, Lanzén A, Qi J et al. (2008) Simultaneous assessment of soil microbial community structure and function through analysis of the meta-transcriptome. PLoS ONE 3:e2527. http s://doi.org/10.1371 /jour nal.pone.0002 527. [CrossRef]
  29. Urich T, Lanzén A, Stokke R et al. (2014) Microbial community structure and functioning in marine sediments associated with diffuse hydrothermal venting assessed by integrated meta-omics. Environ Microbiol 16:2699–2710. http s://doi.org/10.1111 /1462-2920.1228 3. [CrossRef]
  30. Geisen S, Tveit AT, Clark IM et al. (2015) Metatranscriptomic census of active protists in soils. ISME J 9:2178–2190. http s://doi.org/10.1038 /isme j.2015. [CrossRef]
  31. Becker, B., & Pushkareva, E. (2023). Metagenomics provides a deeper assessment of the diversity of bacterial communities in polar soils than metabarcoding. Genes, 14(4), 812.
  32. Klimke W, O’Donovan C, White O et al. (2011) Solving the problem: genome annotation standards before the data deluge. Stand Genom Sci 5:168–193. http s://doi.org/10.4056 /sigs.2084 864. [CrossRef]
  33. Rippin, M., Lange, S., Sausen, N., Becker. B. (2018a) Biodiversity of biological soil crusts from the Polar Regions revealed by metabarcoding. FEMS Microbiology Ecology, Volume 94, Issue 4, fiy036, https://doi.org/10.1093/femsec/fiy036. [CrossRef]
  34. Rippin, M., Borchhardt, N., Williams, L., Colesie, C., Jung, P., Büdel, B., Karsten, U., Becker. B. (2018b) Genus richness of microalgae and Cyanobacteria in biological soil crusts from Svalbard and Livingston Island: morphological versus molecular approaches. Polar Biol 41: 909. https://doi.org/10.1007/s00300-018-2252-2. [CrossRef]
  35. Pushkareva, E., Elster, J., Holzinger, A., Niedzwiedz, S., & Becker, B. (2022). Biocrusts from Iceland and Svalbard: Does microbial community composition differ substantially?. Frontiers in Microbiology, 13, 1048522.
  36. Pushkareva, E., Elster, J., Kudoh, S., Imura, S., & Becker, B. (2024). Microbial community composition of terrestrial habitats in East Antarctica with a focus on microphototrophs. Frontiers in Microbiology, 14, 1323148.
  37. Pardey, A.; Twietmeyer, S. Artenvielfalt im Nationalpark Eifel.Natur in NRW 2018, 11-15.
  38. Nationalparkforstamt Eifel,Wald und Holz NRW. Leistungsbericht 2020.
  39. Coesel, Peter F.M., Meesters, Koos (J.): Desmids of the Lowlands, KNNV Publishing, the Netherlands, 2007.
  40. Hofmann, Gabriele; Werum, Marcus: Diatomeen im Süßwasser-Benthos von Mitteleuropa, Horst Lange Bertalot, A.R.G. Gantner Verlag K.G., Rugell, 2011.
  41. John, D.M.; Whitton, B.A.; Broo, A.J.: The freshwater Algal Flora of the British Isles, Cambridge University Press, United Kingdom, 2002.
  42. Lenzenweger, Rupert: Desmidiaceenflora von Österreich—Teil 1, Band 101, Gebrüder Borntraeger, Berlin, Stuttgart, 1996.
  43. Lenzenweger, Rupert: Desmidiaceenflora von Österreich—Teil 2, Band 102, Gebrüder Borntraeger, Berlin, Stuttgart, 1997.
  44. Lenzenweger, Rupert: Desmidiaceenflora von Österreich—Teil 3, Band 104, Gebrüder Borntraeger, Berlin, Stuttgart, 1997.
  45. Lenzenweger, Rupert: Desmidiaceenflora von Österreich—Teil 4, Band 111, Gebrüder Borntraeger, Berlin Stuttgart, 1996.
  46. Bolger, A.M., Lohse, M., and Usadel, B. (2014) Trimmomatic: A flexible trimmer for Illumina sequence data. Bioinformatics 30: 2114–2120.
  47. Kopylova, E., Noé, L., and Touzet, H. (2012) SortMeRNA: Fast and accurate filtering of ribosomal RNAs in metatranscriptomic data. Bioinformatics 28: 3211–3217.
  48. Oksanen, J. (2013) Multivariate analysis of ecological communities in R:vegan tutorial. R documentation 43.
  49. The determination of ecological status in shallow lakes—a tested system (ECOFRAME) for implementation of the European Water Framework Directive. Aquatic Conservation: Marine and Freshwater Ecosystems, 13(6), 507-549.
  50. Moss, B., Stephen, D., Alvarez, C., Becares, E., Bund, W. V. D., Collings, S. E.,... & Wilson, D. (2003).
  51. Lindberg, K., Moestrup, Ø & Daugbjerg, N. (2005). Studies on woloszynskioid dinoflagellates I: Woloszynskia coronata re-examined using light and electron microscopy and partial LSU rDNA sequences, with description of Tovellia gen. nov. and Jadwigia gen. nov. (Tovelliaceae fam. nov.). Phycologia 44: 416-440.
  52. Moestrup, Ø. & Calado, A.J. (2018). Süßwasserflora von Mitteleuropa. Dinophyceae. Vol. 6 pp. [i]-xii, [1]-560, 421 figures. Berlin: Springer Spektrum.
  53. Paxinos, R.; Mitchell, J.G. A rapid Utermöhl method for estimating algal numbers. J.Plancton Res. 2000, 22, 2255–2262, https://doi.org/10.1093/plankt/22.12.2255. [CrossRef]
  54. Solden L, Lloyd K, Wrighton K (2016) The bright side of microbial dark matter: lessons learned from the uncultivated majority. Curr Opin Microbiol 31:217–226. http s://doi.org/10.1016 /j.mib.2016.04.020. [CrossRef]
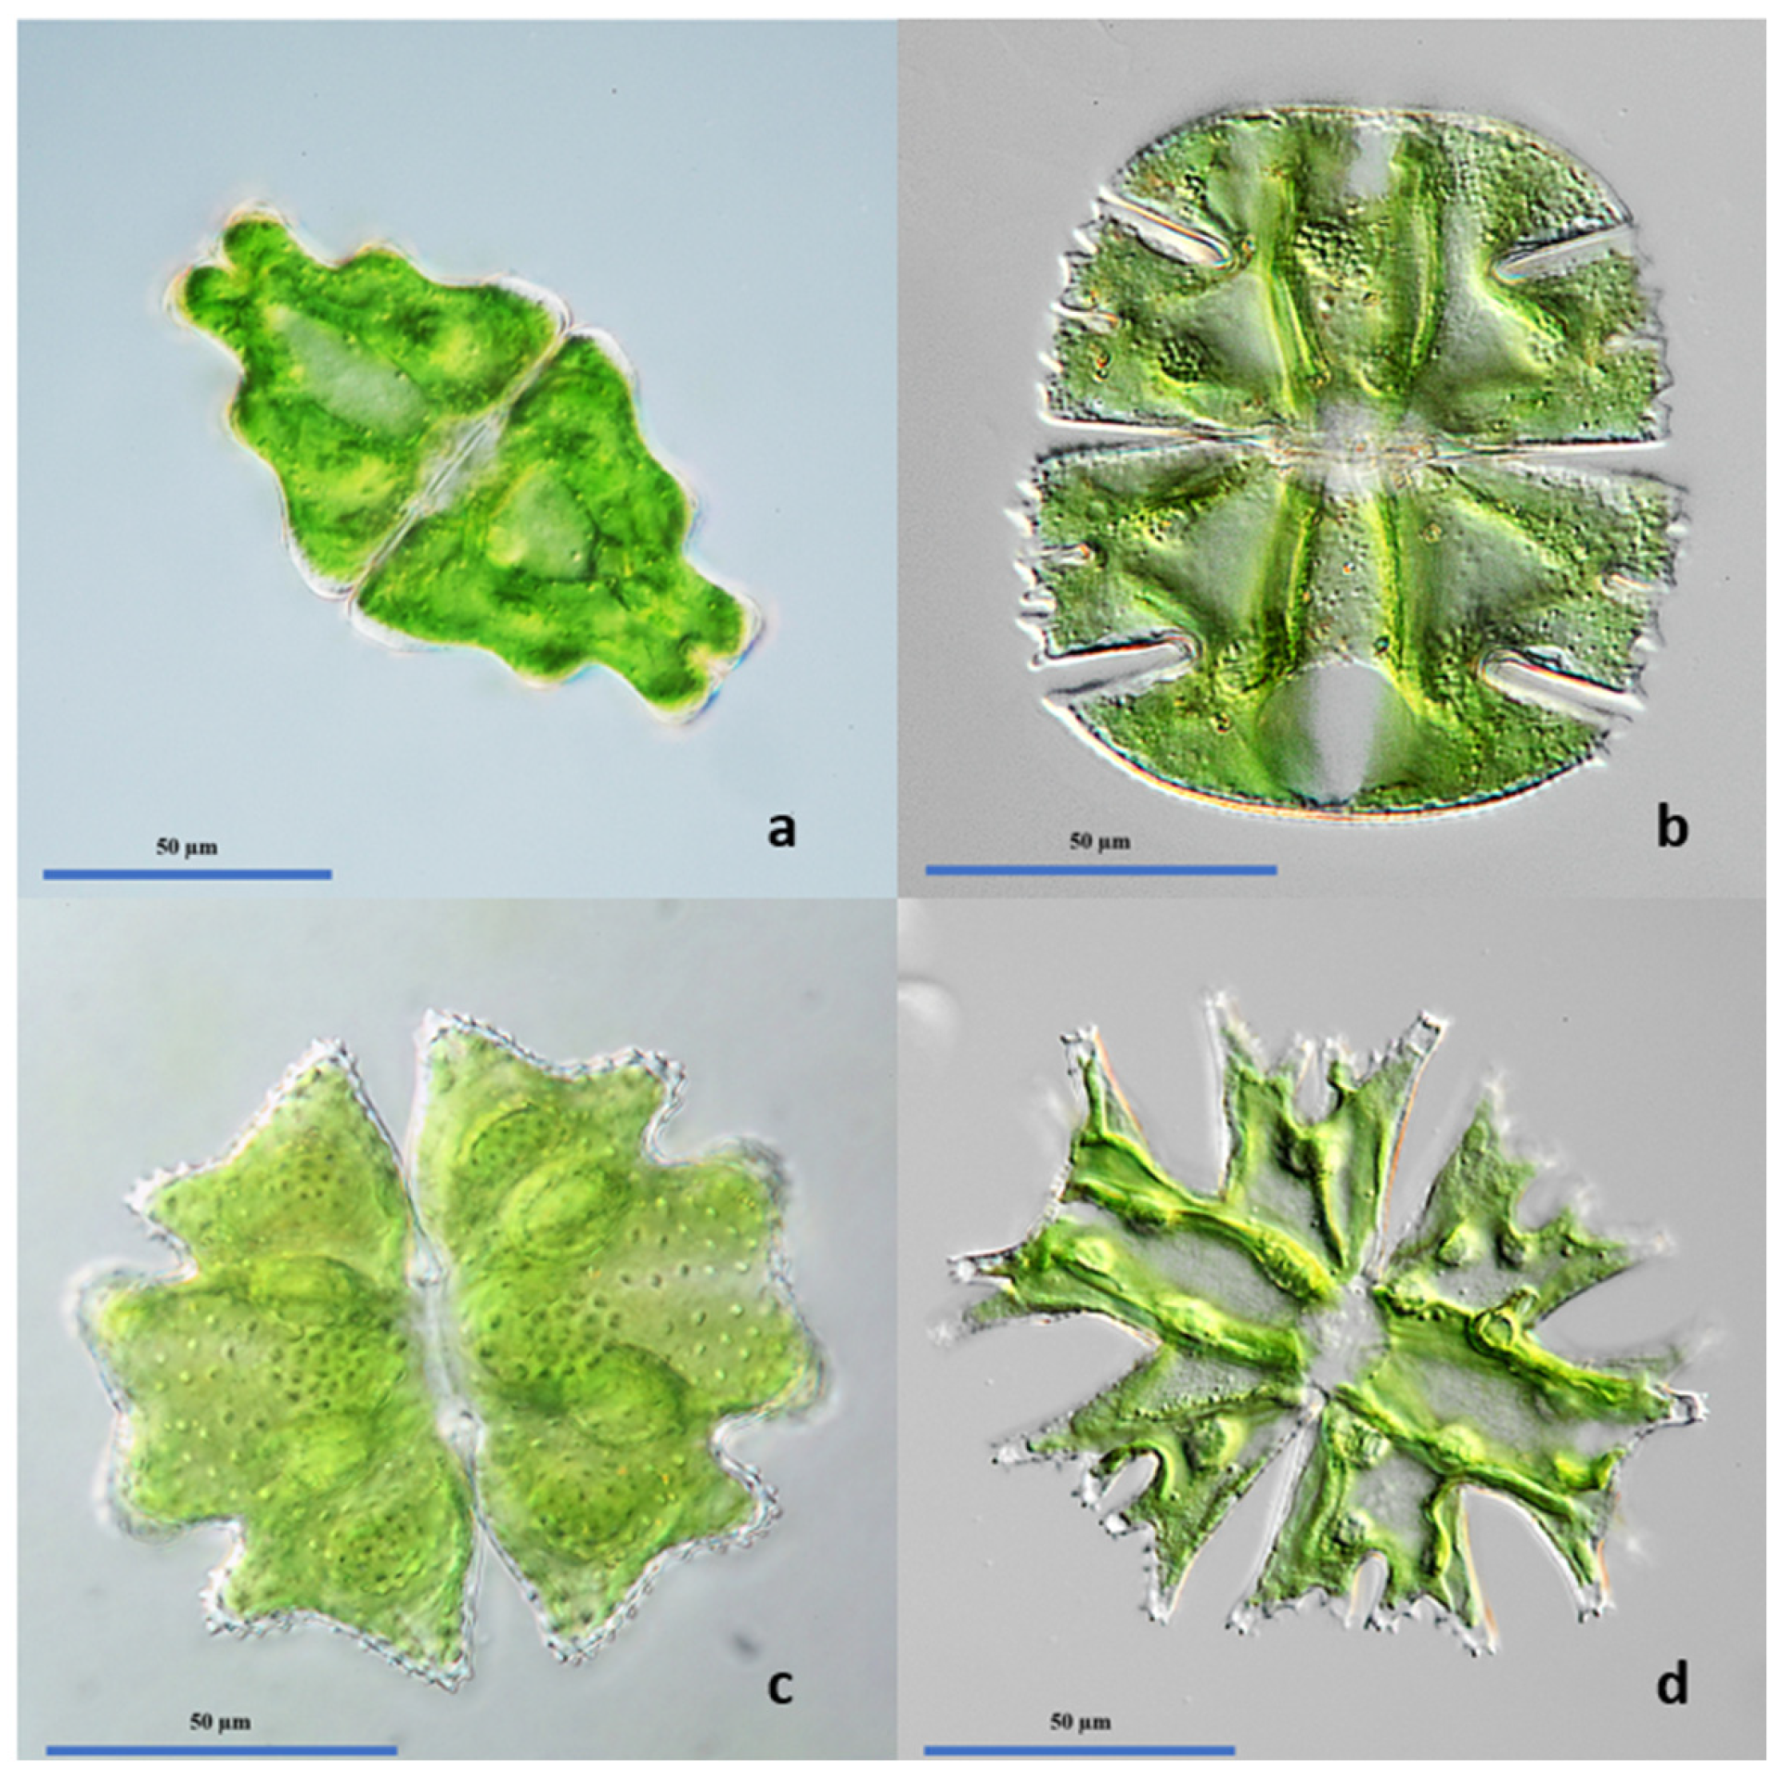
Figure 1. Examples of species identified with light microscopy a: Euastrum humerosum, b: Micrasterias truncata, c: Euastrum verrucosum, d: Micrasterias americana.
Preprints 110338 g001
Figure 2. Non metric multidimensional scaling (NMDS) based on algae species, identified with light microscopy, in different sites. Vectors indicate significant correlations between algae diversity and environmental variables (p-value for depth = 0.0029, p-value for nitrite = 0.0215, and the p-value for pH = 0.0042), (p < 0.05). HT = Himmelteiche, KG= Kleingewässer, and SU = Schürhübelteiche. Sampling sites used for metagenomic studies are indicated with their abbreviations.
Preprints 110338 g002
Figure 3. (a) Total microbial community composition of the different ponds. (b) Phototroph community composition based on genera identified with SILVA. The relative abundance as measured by the number of reads aligning with rRNA for the different groups is shown.
Preprints 110338 g003
Figure 4. Non metric multidimensional scaling (NMDS) based on the abundance of the micro algal ribosomal RNA reads from different sites. Vectors indicate significant correlations between algae diversity and environmental variables (p- value for depth = 0.0053, p-value for nitrite = 0.0004, p-value for conductivity = 0.293, p-value for carbonate hardness = 0.0010 and the p-value for the pH = 0.0089), (p < 0.05). HT = Himmelteiche, KG= Kleingewässer, and SU = Schürhübelteiche.
Preprints 110338 g004
Figure 5. Comparison of the total alpha diversity of micro algal genera in 5 different ponds in the Eifel National Park. Light microscopy: algae were determined by light microscopical identification. Silva: Algal genera were determined by aligning metagenomic reads with the Silva database. Cyanobacteria are not counted in this comparison.
Preprints 110338 g005
Table 1. Overview of descriptive site parameters of the sampled sites: Himmelteiche 1-6 (HT01-HT06), Schurhübelteiche 1,6-10 (SU01, SU06-SU10) and Kleingewässer am Helingsbach 1-2 (KG01-KG02).
Site Size (m²)1) Depth (m) Perennial Soil composition Vegetation cover (%)2) Presence of Spaghnum
HT01 126 0.4 Yes Organic 95 Yes
HT02 314 0.5 Yes Organic 30 Yes
HT03 162 0.6 Yes Organic 40 Yes
HT04 195 0.4 Yes Organic 50 Yes
HT05 64 0.6 Yes Organic 50 Yes
HT06 24 0.6 Yes Organic 100 Yes
SU1 20 0.4 No Organic 90 Little
SU6 96 0.3 No Mineralic 40 No
SU7 64 0.3 No Mineralic 30 No
SU8 35 0.3 No Mineralic 25 No
SU9 40 0.5 No Organic 100 Little
SU10 n.d. 0.4 No Organic 80 No
KG1 84 0.5 Yes Organic 90 No
KG2 102 0.6 Yes Organic 90 No
1)Date of Measurement: 10.03.2021 Schürhübelteiche, 24.03.2021 Himmelsteiche, 28.03.2021 Kleingewässer am Helingsbach. 2)Density of vegetation: Density on the water surface, data collection 17.07.2021, a few days after heavy rain. n.d. not determined: due to practical reasons it was not possible to determine the size of the pond.
Disclaimer/Publisher’s Note: The statements, opinions and data contained in all publications are solely those of the individual author(s) and contributor(s) and not of MDPI and/or the editor(s). MDPI and/or the editor(s) disclaim responsibility for any injury to people or property resulting from any ideas, methods, instructions or products referred to in the content.
Copyright: This open access article is published under a Creative Commons CC BY 4.0 license, which permit the free download, distribution, and reuse, provided that the author and preprint are cited in any reuse.
Alerts
Prerpints.org logo

Preprints.org is a free preprint server supported by MDPI in Basel, Switzerland.

Subscribe

© 2025 MDPI (Basel, Switzerland) unless otherwise stated