Preprint
Article

Sensor-based and Visual Behavioral Profiling of Dry Holstein Cows Presenting Distinct Median Core Body Temperature

Altmetrics

Downloads

107

Views

78

Comments

0

A peer-reviewed article of this preprint also exists.

Submitted:

26 June 2024

Posted:

26 June 2024

You are already at the latest version

Alerts
Abstract
The consequences of heat stress during the dry period can extend into the postpartum period, affecting health and productivity in the subsequent lactation. We hypothesized that cows with distinct core body temperatures (CBT) would exhibit disparate behaviors associated with different degrees of heat generation or dissipation. The primary objective was to investigate behavioral differences of dry Holstein cows (n=50) classified as high-temperature (HT) or low-temperature (LT) based on median CBT during the summer months using visual observations and accelerometer technology. A secondary objective was to investigate the transcriptome of white blood cells (WBC) collected from a subgroup of HT and LT cows (n=5; per group). Minor behavior differences were observed during the visual observations (performed for a total of 16h/cow). Based on the accelerometer data, HT cows displayed higher periods of high activity and lower periods of inactivity prepartum and diminished rumination time postpartum than LT cows. There were 16 differently expressed genes (DEG) in WBC of HT than LT cows. Despite the low number, several of the identified DEGs have been previously associated with heat stress. Results indicate that CBT and patterns of activity prepartum may serve as valuable predictors for identifying dairy cows with distinct tolerance to heat stress.
Keywords: 
Subject: Biology and Life Sciences  -   Animal Science, Veterinary Science and Zoology

Introduction

Economic losses due to heat stress are estimated to range between $0.9 to $1.5 billion annually for the dairy industry [1]. Successful dairy enterprises, therefore, prioritize cow comfort to mitigate the adverse impacts of elevated temperatures [2]. Heat stress in dairy cattle begins at a relatively low temperature-humidity index (THI) of 68 [3,4,5]. Adverse impacts on milk yield and reproductive efficiency were observed when THI reached or exceeded 69 [3]. Various research groups have further corroborated that heat stress adversely affects milk production, postpartum health, and reproductive efficiency in dairy cows [6,7,8,9,10].
At the individual cow level, core body temperature (CBT) serves as a reliable proxy for quantifying the degree of heat stress experienced by cows. Karimi et al. [11] reported that small differences in rectal temperature of dry cows under heat stress or subjected to cooling (39.5°C vs 39.2°C, respectively) during the close-up period were associated with greater respiration rates, decreased dry matter intake (DMI), decreased rumination, decreased lying duration, and decreased milk yield during the first 180 days in milk (DIM). Additional studies, including ours [9,12], which categorized cows into high temperature (HT) and low temperature (LT) groups based on median CBT during the dry period, support the notion that even modest variations in average CBT (~0.3°C) due to heat stress are associated with the development of postpartum diseases and reduced milk production in the subsequent lactation. Because animals adapt their behavior to cope with heat stress [13], it is conceivable that HT and LT cows may exhibit divergent behaviors influencing heat generation or dissipation. Such behavioral disparities could result in differing degrees of tolerance or susceptibility to heat stress, subsequently impacting health and productive outcomes postpartum.
Behavioral tendencies can be measured through visual observations or by automated activity monitor systems that capture patterns such as lying, standing, eating, activity level, and rumination. Several groups have demonstrated a relationship between the health status of transition cows and behavior captured by sensor technologies [14,15,16,17,18,19,20]. The amount of time cows spend ruminating, for instance, is an important indicator of postpartum health and is negatively correlated with THI [21]. Besides influencing rumination, heat stress is associated with additional behavioral and physiological changes in dairy cows, including alterations in the duration of lying bouts [22,23], eating behavior and DMI (West, 2003), and water consumption to cope with hyperthermia [25]. Therefore, the current study hypothesized that cows classified as HT and LT based on median CBT during late gestation [9,12] would exhibit distinct behavioral patterns during the pre and postpartum periods. Hence, the primary objective of this study was to investigate behavioral differences of dry Holstein cows classified as HT or LT during the summer months using a dual approach that incorporated visual observations and accelerometer technology.
Thermal stress also initiates a range of adaptive physiological and cellular responses, including the induction of heat shock proteins (HSPs) that alleviate hyperthermia and mitigate risk of mortality derived from extended cellular damage [26]. Given that circulating white blood cells (WBC) have been observed to react to heat stress in humans, even prior to any notable rise in core temperature following heat exposure [27], our second objective was to investigate the transcriptome of WBC from a subgroup of HT and LT cows. This analysis may provide insights into the genetic and molecular mechanisms that underlie the physiological differences in temperature regulation between HT and LT cows, rendering them more susceptible or resilient to heat.

Materials and Methods

Animals, Facilities, Management, and Enrollment

The study was conducted at the Kansas State University Dairy Teaching and Research Center from June through November 2019. Lactating Holstein cows were dried off between 192 and 221 d of gestation and were moved to the far-off dry pen (Figure 1). Once dry for at least 6 d, cows at 220 to 241 d of gestation having a locomotion score < 3 (1 = not lame and 3 = noticeably lame; [28] were enrolled in the study. A total of 50 cows were enrolled (19 primiparous and 31 multiparous [19 second-lactation cows and 12 third-lactation or greater]) in five replicates. Cows were reconfirmed pregnant at the time of enrollment. Body condition score was evaluated on the day of enrollment (d0), and again at 7 and 14 d after enrollment using a 5-point scale with 0.25-point increments [29].
Cows were moved to the close-up pen between 248 and 261 d of gestation. Cows in the far-off pen were housed in a free-stall barn and fed a total mixed ration once daily with free access to prairie hay and water. No active cooling was provided in the far-off pen; however, shade was provided over free-stall beds and feed bunks. Cows in the close-up pen were housed in an open-front barn on straw bedding over concrete, provided a total mixed ration once daily, and had free access to water. The back wall of the barn was equipped with cellulose cooling pads and fans. After calving, lactating cows were housed in free-stall barns equipped with sprinklers and fans and fed a TMR once daily (twice daily during summer). Lactating cows are milked thrice daily starting at 0400 and 1600 h.

Temperature Humidity Index (THI) and Assessment of Core Body Temperature (CBT)

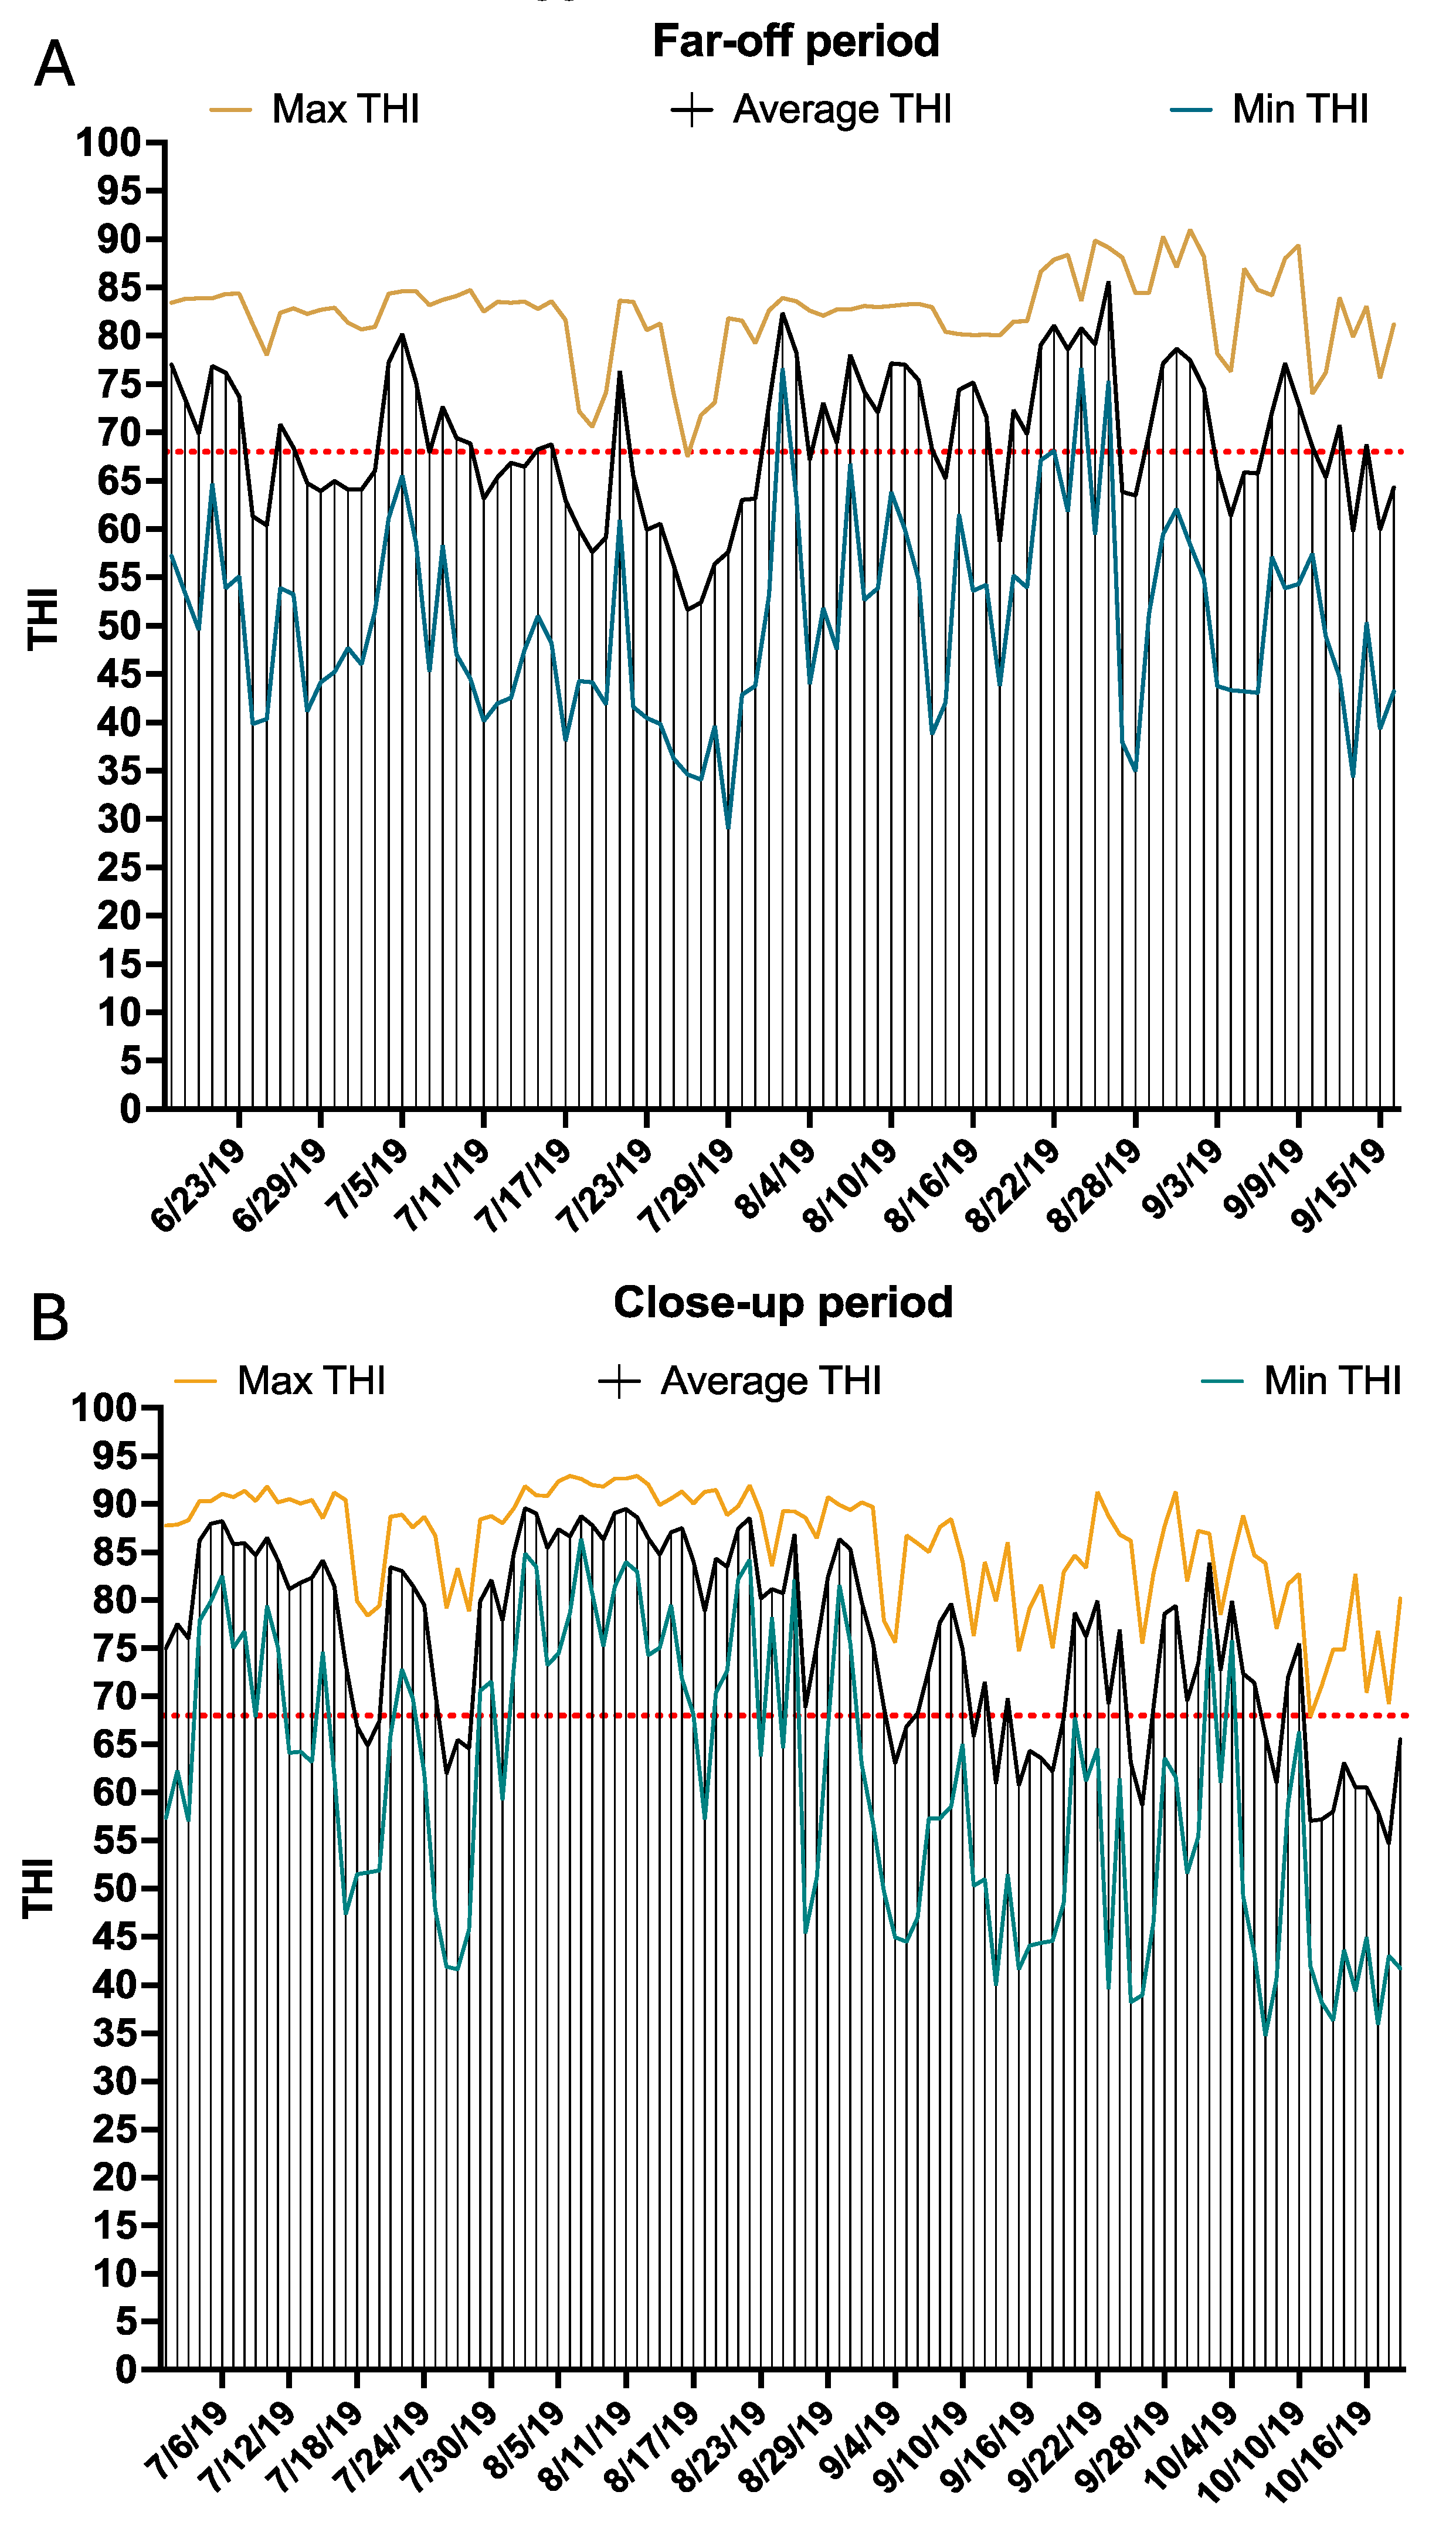
Ambient temperature and humidity were monitored in both the far-off (Figure 2A) and close-up (Figure 2B) pens by fixing a temperature logger (HOBO U23 Pro v2, Onset Computer Corp., Pocasset, MA) in each pen. Loggers were located approximately 3 m above the ground. Temperature and humidity measurements were recorded every 5 min in both pens. Temperature data were downloaded from the loggers and used to calculate THI as described in [9].
Core body temperature (CBT) was recorded by attaching a temperature logger (iButton DS1922L, Embedded Data Systems, Lawrenceburg, KY) to a blank intravaginal insert (CIDR, Zoetis, Parsippany, NJ). The iButton was attached to the insert with silicone aquarium sealant (Loctite®, Henkel Corporation, Rocky Hill, CT) and wrapped with Parafilm (Parafilm®, Carolina Biological Supply Company, Burlington, NC) once the sealant was dry. The insert was then placed intravaginally while cows were in the far-off pens and removed after 7 d when cows were moved to the close-up pen (Figure 1). The temperature logger recorded CBT every 5 min. Temperature loggers were calibrated for an accuracy of ± 0.13°C. Temperature loggers were inserted into the vagina of cows enrolled in the study between d 220 and 241 of gestation and removed between 228 and 248 days of gestation.
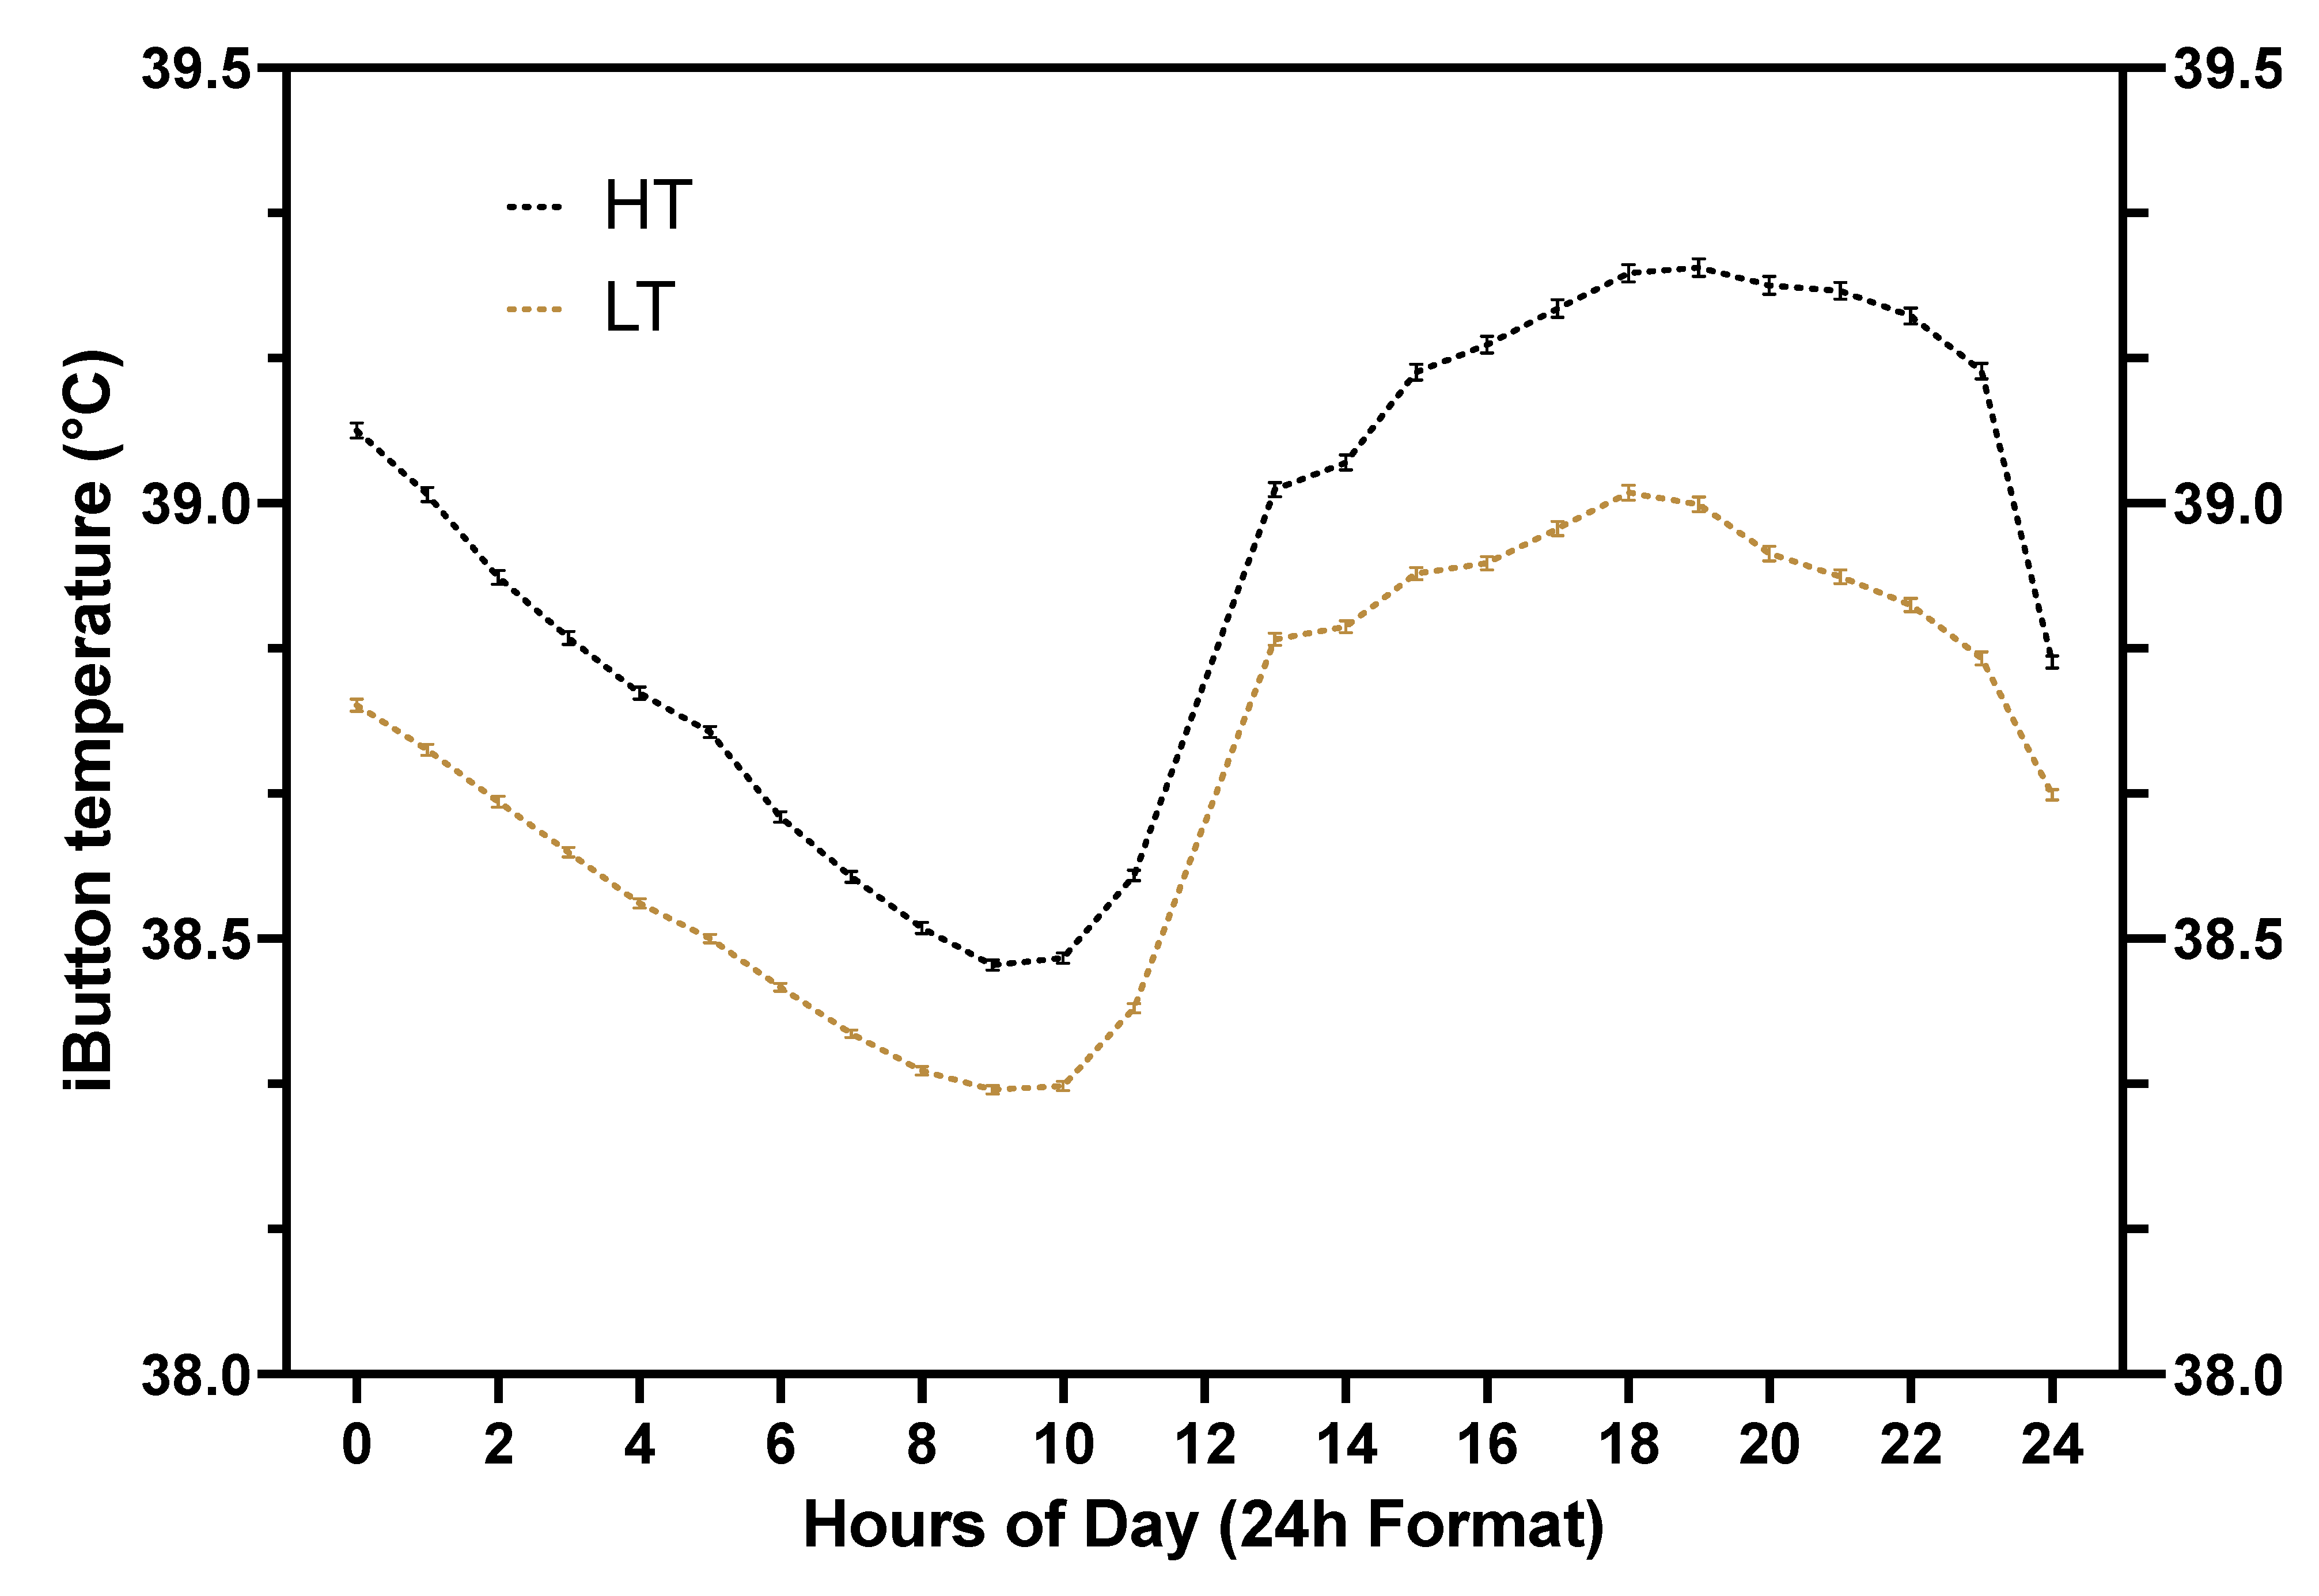
Upon insert removal, data from the loggers were downloaded to a computer and the average CBT was calculated as described by Scanavez et al., (2017). A total of 1,996 ± 0.7 (mean ± SEM) temperature observations per cow were used for CBT classification (assignment to HT or HL groups). Median values were calculated for each of the five replicates. Within replicate, 2 CBT groups were created: cows whose average CBT exceeded the median value were classified as high core body temperature (HT), and cows with an average CBT below the median value were classified as low core body temperature (LT). A summary of average (± SEM) CBT, according to hour of the day (24h format), for HT and low LT cows are presented in Figure 3.

Assessment of Dry Cow Behavior

Visual Observations

To assess behavior, each cow was observed continuously for a total of 16 hours throughout the dry period. Cows were observed for 8 hours in the far-off pen and 8 hours in the close-up pen. Each 8 h observation block consisted of two, 2 h morning observations (0600 to 0800 h) and two, 2 h afternoon observations (1600 to 1800 h). Behaviors were recorded during continuous visual observation by a total of 7 different observers. Observers underwent training in continuous behavior observation prior to commencing their first observation period. Additionally, they were accompanied by another observer during this initial period to ensure accurate and consistent observation practices. Furthermore, observers were blinded to which cows were HT or LT.
Each observer was randomly assigned two cows to monitor for each 2 h block. Observations in the far-off pen occurred during the first 10 days after cows were enrolled and during the first 10 days after cows were moved to the close-up pen. The five behaviors recorded were: lying, standing, eating, drinking, and perching (standing with only front feet in the free stall). Perching behavior was exclusively observed in the far-off pen, as the close-up pen lacked free stalls.

Automated Behavior Monitoring

Automated monitoring system (AMS) data were collected using CowManager Sensor ear tags affixed to the left ear of each cow (Agis Automatisering BV, Harmelen, Netherlands). The data captured by the ear tag equipped with accelerometers included: 1) ear surface temperature, and daily minutes of 2) high activity, 3) general activity, 4) inactivity, 5) eating behavior, and 6) rumination.
The CowManager ear tag sensors capture behavior data on a minute-by-minute basis, recording the predominant behavior observed during each minute. Ear and jaw movement aid in the classification of rumination and eating behaviors, and all other behaviors that are not eating, rumination, or resting (inactivity) are classified as active. High activity is used as an indicator of estrus-like activity. Accelerometer data from d -21 to 21 relative to calving (d 0) were analyzed. Ear surface temperature was collected every hour by the ear tags. Ear surface temperature was also analyzed from d -21 to 21 relative to calving (d 0 being calving). Importantly, in bunk-fed dairy cows equipped with the sensor ear tags, feeding, and ruminating activities are significantly correlated with visual observations (simple and concordance correlations exceeding 0.82 and 0.59, respectively; [30].

Isolation of White Blood Cells for Transcriptome Analysis

Upon removal of the blank CIDR insert housing the temperature logger from the vagina (the iButton recorded CBT data for 7 days), a blood sample was obtained from the median coccygeal vein or artery. The sample was collected into evacuated tubes containing K3 EDTA (Becton Dickinson Vacutainer Systems, Franklin Lakes, NJ, USA) for the isolation of WBC. Circulating WBC respond to heat stress [27] and therefore differences in gene expression of WBC collected from cows in the two distinct CBT groups (HT and LT) could help elucidate physiological differences in temperature regulation between HT and LT cows, rendering them more susceptible or resilient to heat.
For evaluating the transcriptome of WBC, blood samples were collected from a subgroup of 5 HT and 5 LT multiparous cows, from matching replicates. Blood samples were processed as described [31]. Briefly, blood samples were centrifuged at 1200 × g for 20 min at 4°C, and the buffy coat was transferred to a 15-ml centrifuge tube containing 12 ml of red blood cell lysis buffer (150 mM NH4Cl, 10 mM NaHCO3, 1 mM EDTA, pH 7). Tubes were vortexed and incubated at room temperature for 5 min, and then centrifuged at 300 × g for 10 min at 4°C to wash and pellet the WBC. After discarding the supernatant, the WBC pellet was washed twice (as described above) first using 5 ml of red blood cell lysis buffer, and second using 5 ml of ice-cold 1X Dulbecco Phosphate Buffered Saline (DPBS). Immediately after, the supernatant was discarded, and the WBC pellet was resuspended in 1.5 ml of TRIzol™ Reagent (Invitrogen, CA, USA) and stored at – 80°C.

Library Preparation and Sequencing – Assessment of WBC Transcriptome

Total RNA from WBC was extracted using the TRIzol™ Reagent (Invitrogen, CA, USA) following the manufacturer's protocol. RNA concentrations and quality were assessed using a Fragment Analyzer instrument (DNF-472, Advanced Analytical Technologies, Ames, IA). Total RNA samples were sent to BGI Genomics (Beijing, China) for library preparation and sequencing. PolyA-enriched RNA libraries were constructed using an MGIEasy RNA Library Prep Set (BGI, Beijing, China) according to the manufacturer’s protocol. Briefly, mRNA was purified using oligo (dT) attached magnetic beads and then fragmented into small pieces. Following first- and second- strands cDNA synthesis, double-stranded cDNA fragments were subjected to end-repair, adenylation, adaptor ligation, and PCR amplification. Each purified library was assessed using the Fragment Analyzer, quantified with a fluorometer (Qubit), and sequenced on a MGI DNBSEQ G400 instrument resulting in paired-end reads of 150 bp and an average read count of 67 million paired reads per sample.

Statistical Analysis

All statistical analyses of behavior data captured by either the accelerometer or visual observations were conducted using SAS Studio 3.81 Enterprise Edition (SAS Institute Inc., Cary, NC). All continuous data were assessed for normality using the UNIVARIATE procedure. Continuous data not normally distributed were log-transformed.
The proportions of multiparous cows (Table 1) and cows delivering twins within the CBT groups were analyzed by Chi-Square using the FREQ procedure. The remaining descriptive data were analyzed by fitting mixed-effect models using the GLIMMIX procedure. These models included CBT (HT vs LT) as the fixed effect, with the random effect of replicate nested within CBT. Out of the initial 50 cows enrolled in the study, two cows were removed because of lameness and spontaneous late-term abortion during the far-off period.
Behavior data from the visual observations (e.g., lying, standing, eating, drinking, and perching; Table 2) were collected and analyzed separately for the far-off and close-up periods. Similarly, behavioral data collected using the accelerometer (e.g. periods of high activity, general activity, inactivity, eating, rumination, and ear surface temperature) was analyzed separately for the prepartum and postpartum periods. For example, prepartum rumination was analyzed independently from postpartum rumination. The percentage of time attributed to each behavior (visual observations; Table 2) or the designated daily minutes assigned to each behavior by the accelerometer (Figure 4, Figure 5, Figure 6, Figure 7, Figure 8 and Figure 9) were analyzed by fitting mixed-effect models using the MIXED procedure of SAS. All models included the fixed effects of CBT, parity (primiparous vs multiparous), time, and the two-way interactions of CBT and parity, and CBT and time. Additional covariates offered to all models included gestation of twins (yes or no), and the average, minimal, and maximum daily ambient THI for the far-off and close-up pens, whenever available (e.g., THI data was not collected for the postpartum period). Covariates were removed from the models using a stepwise backward elimination method when P > 0.10. The covariance structure for the repeated measures within subjects was selected based on model convergence and fit statistics assessed using the smallest Akaike’s Information Criteria. The random effect of replicate nested within CBT was considered in all models. The lsmeans statement was employed to compute the least squares means (LSMEANS) for factors or interactions of interest, and utilized the pdiff option with Tukey's adjustment to compute post-hoc pairwise differences between LSMEANS adjusted for multiple comparisons. Statistical significance was defined as P < 0.05 and tendencies as 0.05 < P < 0.15.

Analysis of Gene Expression in White Blood Cells

The transcriptome of circulating WBC was evaluated in a subgroup of HT (n = 5) and LT (n = 5) cows following 7 days of temperature data collection. BGI Genomics (Beijing, China) performed RNA library preparation and sequencing. Raw sequence reads (fastq) were processed using fqtrim (https://ccb.jhu.edu/software/fqtrim/) to remove sequence adaptors and perform quality trimming. The read quality was examined using FastQC (Babraham Bioinformatics, Cambridge, UK). Trimmed paired-end reads were aligned to the Ensembl (https://useast.ensembl.org/) Bos taurus reference genome (ARS-UCD1.3) using Hisat2 [32]; https://daehwankimlab.github.io/hisat2/]. FeatureCounts was employed to quantify the number of reads mapped to exon sequences of annotated genes using the Bos taurus (ARS-UCD1.3) gtf annotation file from Ensembl [33]. The differentially expressed genes (DEG) were calculated from the read counts using a generalized linear model on edgeR robust [34].

Results

CBT Classification

Median CBT values for each of the 5 replicates were as follows: 38.78°C, 38.85°C, 38.84°C, 38.92°C, and 38.67°C for groups 1 through 5, respectively. Core body temperature ranged from 37.4 to 41.2°C for HT cows and from 37.4°C to 40.5°C for LT cows. Core body temperature was greater (P < 0.01) for HT cows than LT cows (Figure 3; Table 1). The average CBT of HT and LT cows varied throughout the day, spanning from morning to evening, as illustrated in Figure 3. Considering all cows, CBT dropped from midnight to around 9 AM, then sharply rose around noon, and continued to increase during the afternoon, peaking at around 6 PM, before beginning to decline again around 8 PM (Figure 3).

Temperature-Humidity Index in the Far-off and Close-Up Pens and Overall Descriptive Data

During the study, the overall THI daily average (Average THI), average minimum (Min THI), and average maximum (Max THI) for the far-off pen were 75.9, 60.8, and 85.7, respectively. Daily Average THI, Min THI, and Max THI for the far-off pen are depicted in Figure 2A. In the close-up pen, the overall Average THI, Min THI, and Max THI were 69.2, 50.3, and 82.6, respectively (Figure 2B). The observed THI during the far-off and close-up periods suggests conditions consistent with heat stress [3,4,5].
Lactation number at enrollment was greater (P = 0.05) for HT compared to LT cows, and the percentage of multiparous cows tended to differ (P = 0.15) between groups. Days in milk at dry-off did not differ (P = 0.94) between HT and LT cows (Table 1). Days of gestation at enrollment were lower (P = 0.04) for LT cows compared with HT cows. Cows classified as HT spent fewer days in the close-up pen (P = 0.03) compared with LT cows (Table 1). Gestation length tended (P = 0.09) to be shorter in HT than LT cows (Table 1). Body condition scores at enrollment (P = 0.94), and on days 7 (P = 0.78) and 14 (P = 0.36) post enrolment were not associated with CBT. Furthermore, twin gestation was not associated with CBT (P = 0.28); two HT cows and one LT cow delivered twins. Projected 305-d mature equivalent milk yield for the subsequent lactation did not differ (P = 0.90) between HT and LT cows.

Visual Behavior Monitoring

Far-off Period

For the visual observations (Table 2), there were no effects of CBT (P > 0.18) on lying, standing, eating, drinking, or perching behaviors while cows were in the far-off pen. There were, however, effects of time of day (P < 0.01) during which observations were performed (AM vs PM) on lying (AM = 60.0% ± 3.1; PM = 28.1% ± 3.1), standing (AM = 19.2% ± 2.6; PM = 35.1% ± 2.6), eating (AM = 8.7% ± 1.8; PM = 25.3% ± 1.8), and drinking (AM = 1.6% ± 0.4; PM = 2.4% ± 0.4) behaviors. Furthermore, the interaction between CBT and time (P = 0.02) was significant for drinking behavior, as HT cows were observed more frequently drinking water in the AM observations (1.8% ± 0.7 vs 1.5% ± 0.7) but less often in the PM observations than LT cows (1.2% ± 0.7 vs 3.6% ± 0.7). The interaction of CBT and parity tended to be significant (P = 0.15) for lying behavior, as primiparous LT cows were observed more frequently lying down than primiparous HT cows (52.1% ± 4.0 vs 41.2% ± 5.2) but no differences (P = 0.82) were observed between LT and HT multiparous cows. Furthermore, there were no significant effects of parity (P > 0.21) on any of the observations during the far-off period.

Close-Up Period

During the close-up period, there were no effects of CBT (P > 0.35) on lying, standing, and eating behaviors. However, there was a trend (P = 0.09) suggesting that HT cows drank water more frequently than LT cows during the close-up period. Furthermore, the interaction between CBT and parity affected (P = 0.04) drinking behavior, as HT primiparous cows were observed more frequently drinking water than LT primiparous cows (2.6% ± 0.5 vs 2.1% ± 0.4) although no differences in drinking behavior were observed for multiparous cows based on CBT (P = 0.73). Furthermore, parity affected drinking behavior (P = 0.01), as multiparous cows (1.6% ± 0.2) were observed less frequently drinking water compared to primiparous cows (2.3% ± 0.3) during the close-up period. Additionally, the interaction between CBT and parity was associated with (P < 0.01) eating behavior during the close-up period, as HT multiparous cows were observed less often eating than the LT multiparous (12.3% ± 1.6 vs 18.8% ± 1.8), but primiparous cows HT were observed more often eating than LT primiparous cows (21.8% ± 2.8 vs 13.4% ± 1.9). Parity also tended (P = 0.15) to be associated with standing behavior, as multiparous cows were observed more frequently standing (35.4% ± 1.8 vs 30.8% ± 2.6) than primiparous cows. Additionally, the time of day during which observations were performed (AM vs PM) was associated (P < 0.01) with the percentage of time cows were observed lying (AM = 81.5% ± 2.1; PM = 15.1% ± 2.1), standing (AM = 11.4% ± 1.9; PM = 54.8% ± 1.9), eating (AM = 6.5% ± 1.3; PM = 26.6% ± 1.3), and drinking (AM = 0.6% ± 0.3; PM = 3.3% ± 0.3).

Automated Behavior Monitoring

Periods of High Activity

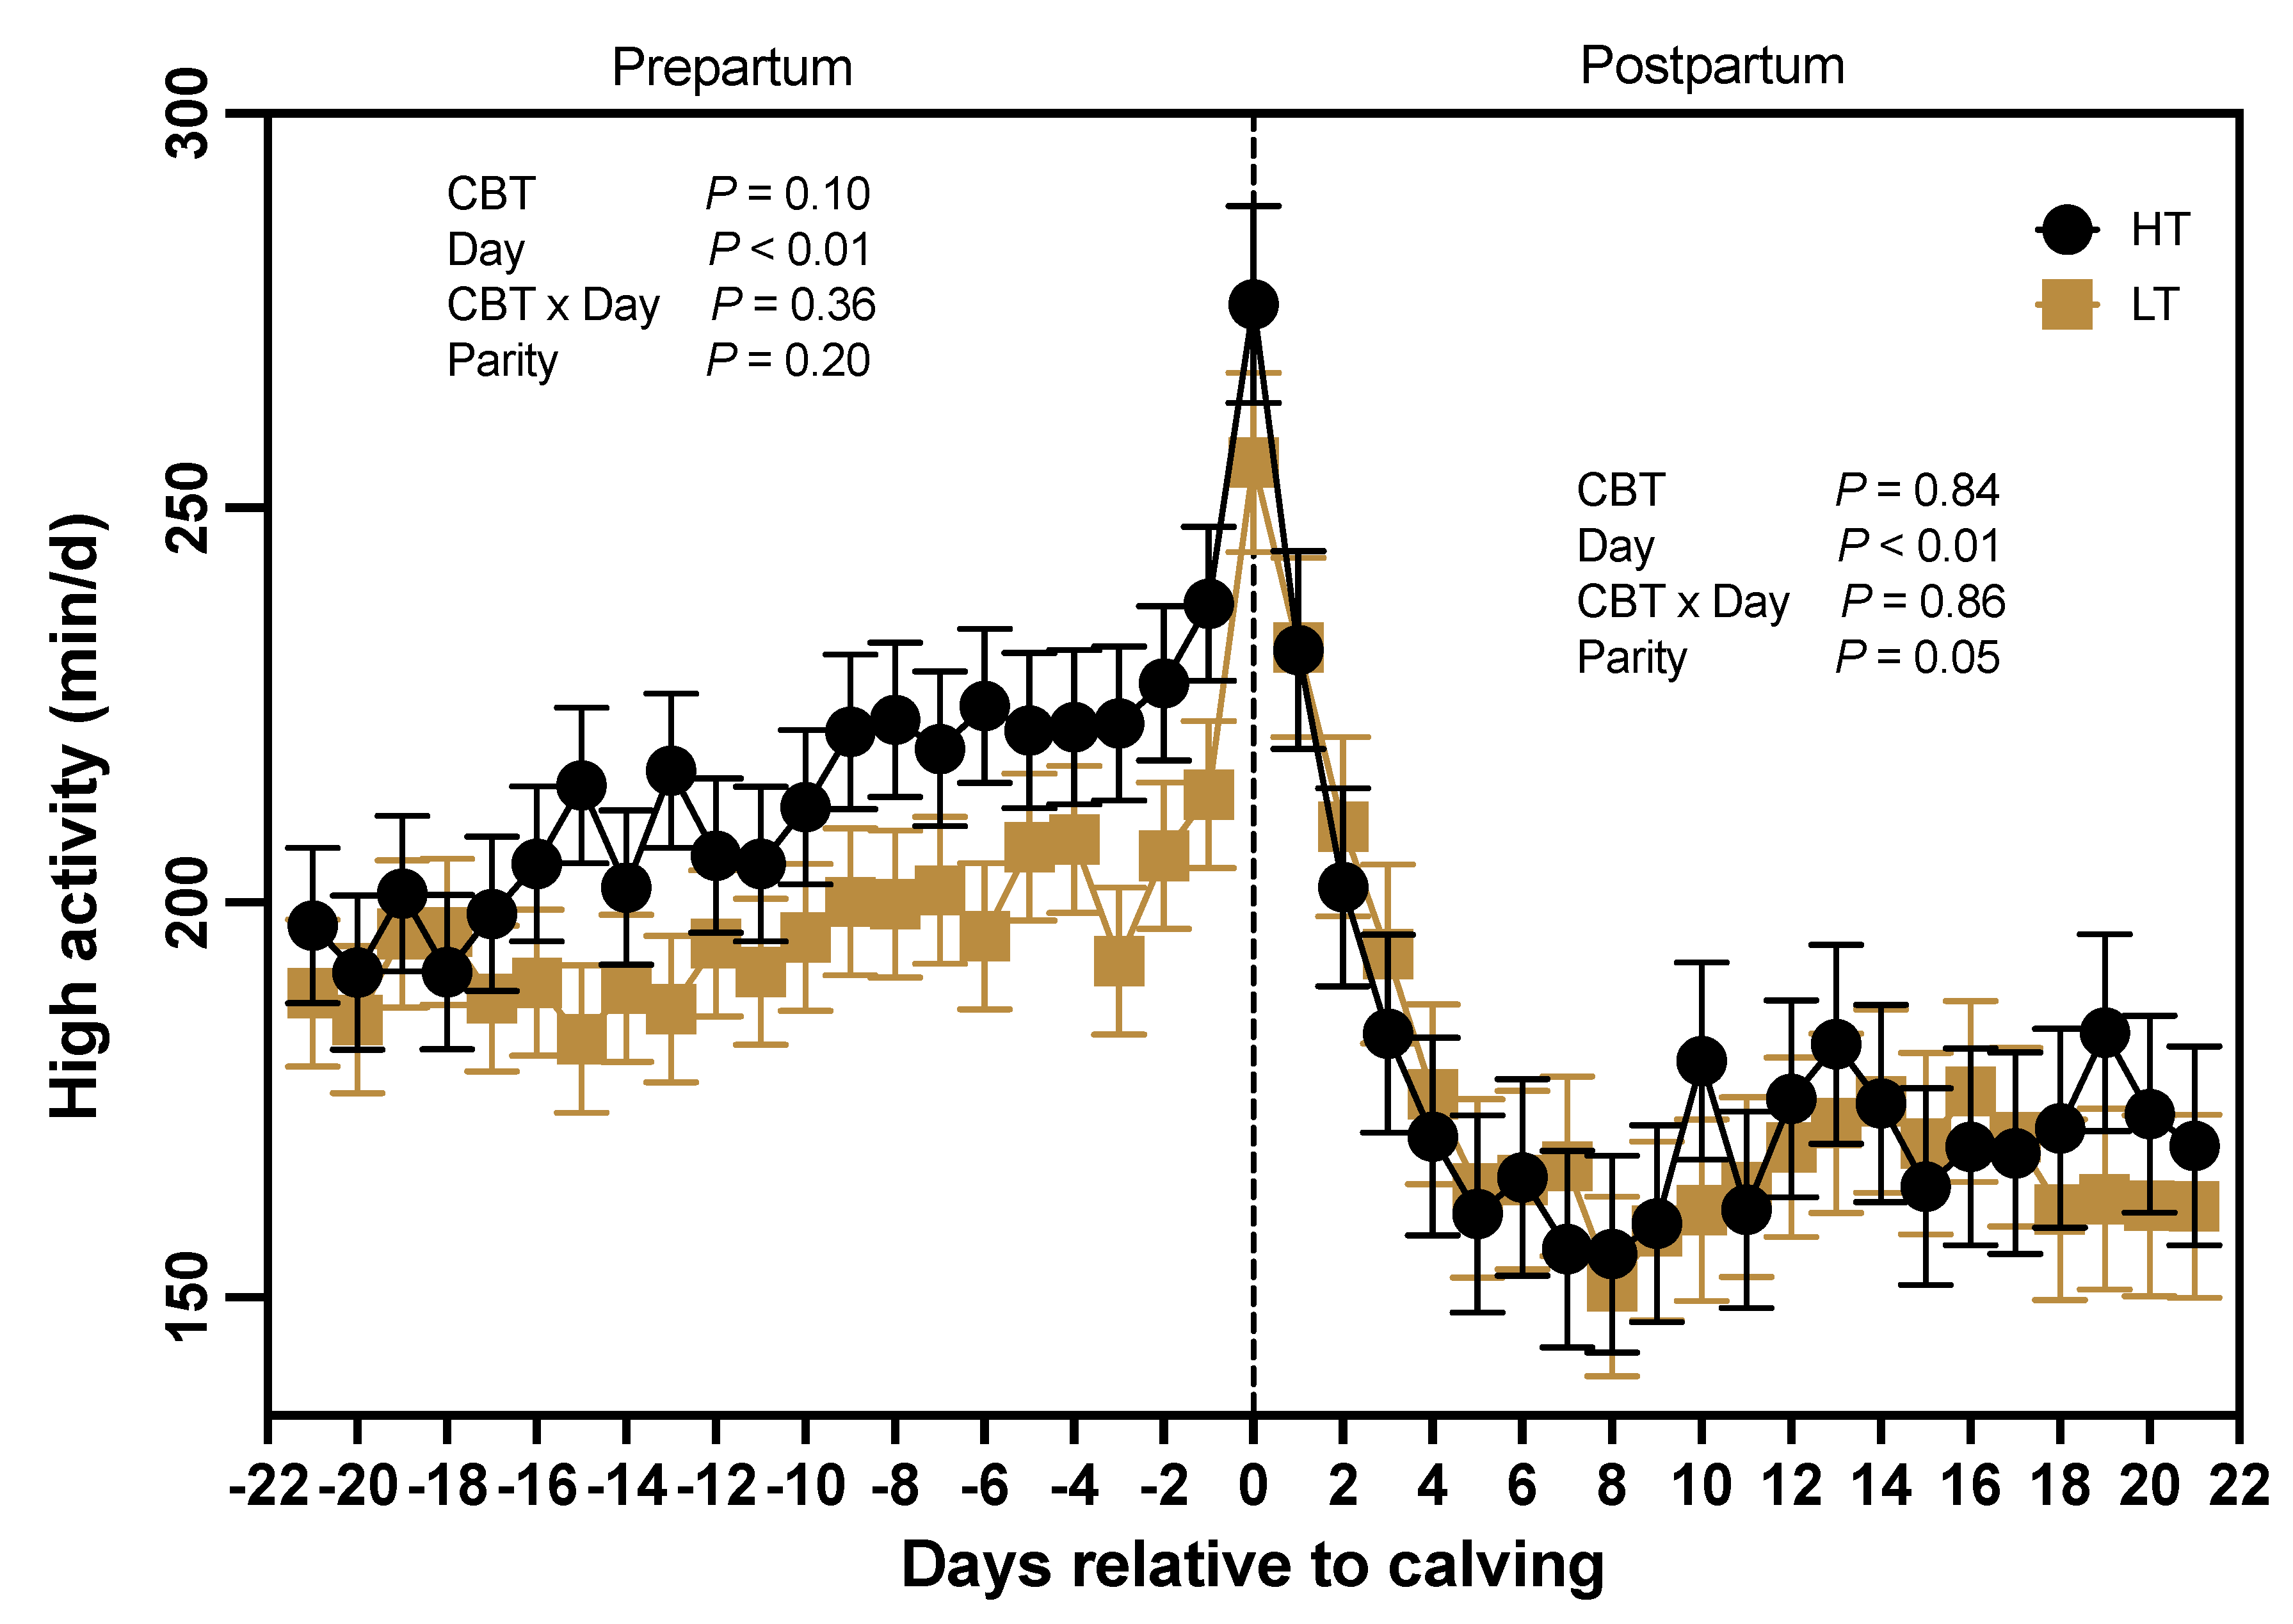
Based on data from the AMS, HT cows exhibited a trend (P = 0.10) towards longer periods of high activity compared to LT cows (212 ± 7 vs 195 ± 7 min) during the prepartum period (Figure 4). Additionally, days relative to calving significantly influenced (P < 0.01) the occurrence of heightened activity behavior during the prepartum period, with a notably increase in high activity minutes around the time of parturition (day 0; Figure 4). However, there was no observed interaction between CBT and day (P = 0.36), nor was there an effect of parity (P = 0.20) on the daily duration of high activity minutes during the prepartum period. In contrast, during the postpartum period (days 0-21; Figure 4), there was no effect of CBT groups (P = 0.84) or an interaction between CBT and days relative to calving (P = 0.86) on daily minutes of high activity. However, there was an effect of day (P < 0.01), as daily high activity minutes dropped significantly following calving (Figure 4). Parity also affected (P = 0.05) the daily high activity minutes during the postpartum, as primiparous cows (190 ± 10 min) were more active than multiparous cows (165 ± 7 min) but no significant interaction was observed between parity and CBT (P = 0.58).

General Activity

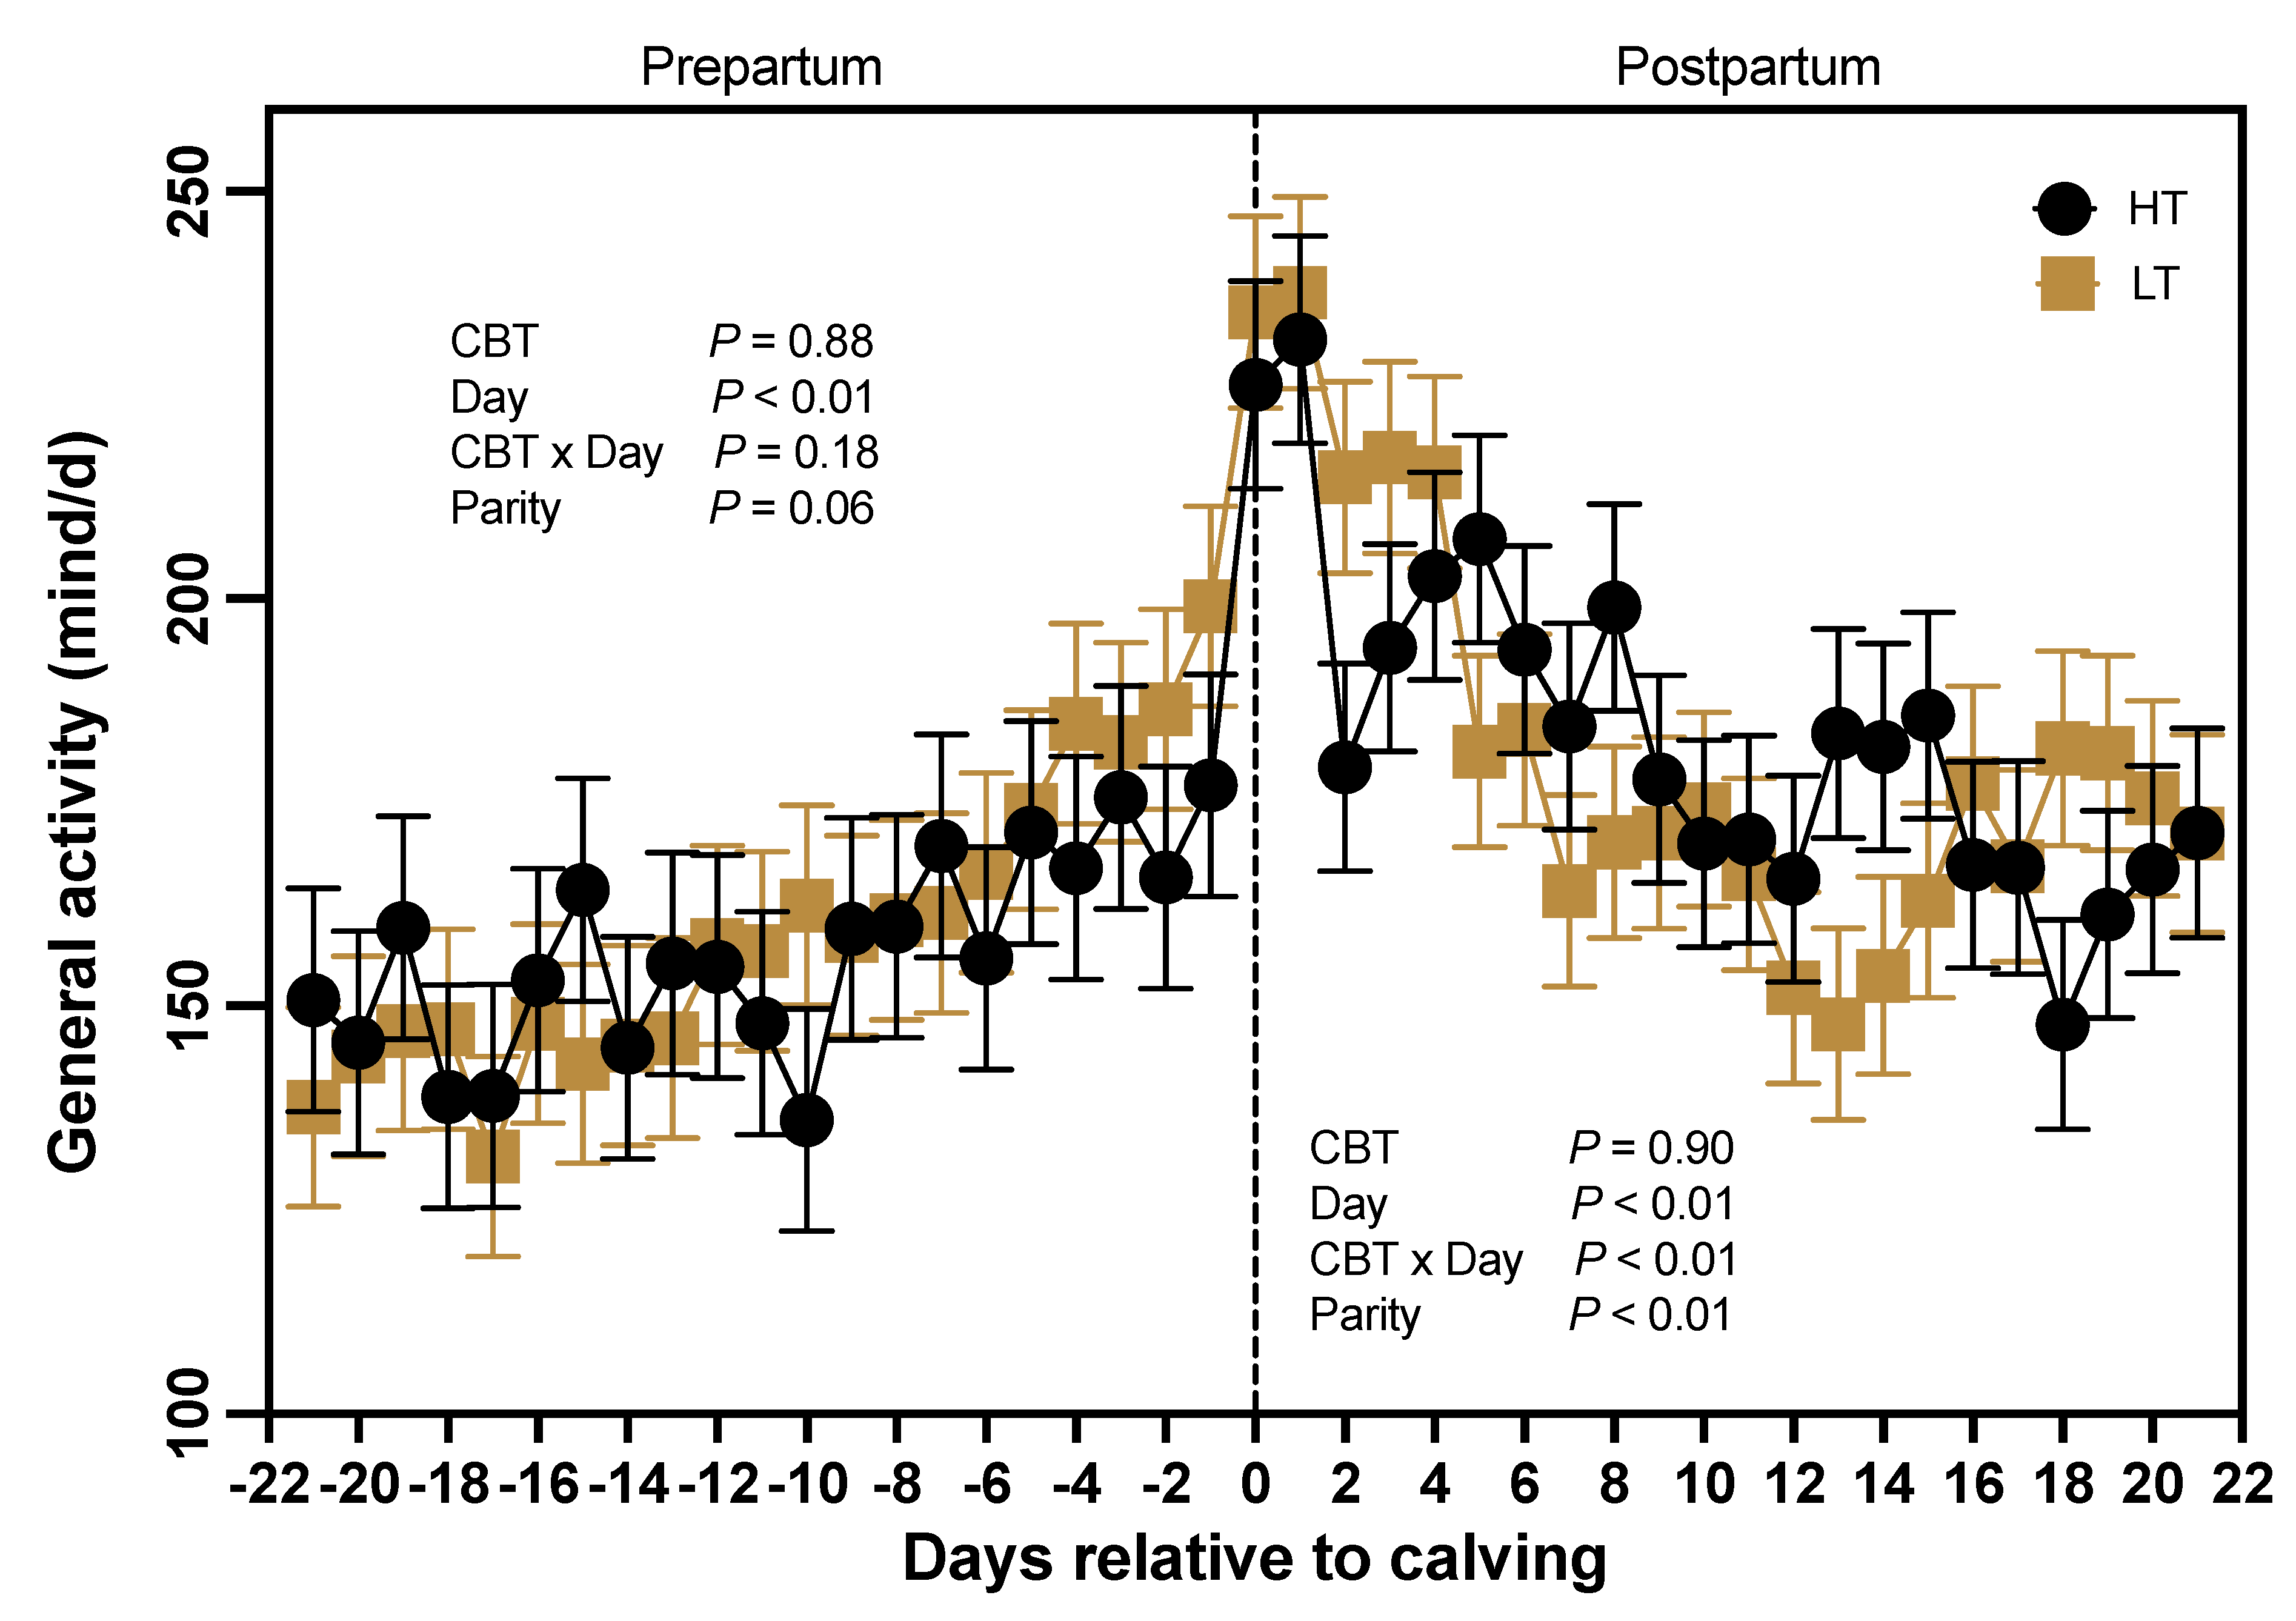
Prepartum general activity (Figure 5) was not different (P = 0.88) between HT and LT cows, with HT cows averaging 157 ± 11 and LT cows 159 ± 10 min of general activity, respectively. In contrast, days relative to calving affected (P < 0.01) the duration of general activity minutes, with a marked increase in daily active minutes at time of calving (Figure 5). Furthermore, parity tended (P = 0.06) to influence daily overall prepartum activity, as there was a trend for higher general activity in multiparous (172 ± 9 min) compared to primiparous (144 ± 12 min) cows. However, there was no interaction of parity and CBT groups (P = 0.30), or between CBT and days relative to calving (P = 0.18; Figure 5). Similarly, during the postpartum period, general activity was not different (P = 0.90) between HT (183 ± 8 min) and LT (181 ± 7 min) cows. However, there was an effect of parity (P < 0.01), as multiparous cows had greater daily activity than primiparous cows (198 ± 7 min vs. 167 ± 9 min, respectively). Nonetheless, the interaction of CBT and parity was not significant (P = 0.73). Furthermore, days relative to calving affected postpartum activity, as it decreased (P < 0.01) from a peak at parturition through d 21. The interaction of CBT and day was also significant (P < 0.01), as minutes of general activity in the postpartum differed between HT and LT cows for select days (Figure 5).

Inactive Daily Minutes

Cows classified as HT tended (P = 0.11) to spend less time inactive than LT cows during the prepartum period (410 ± 13 vs. 438 ± 12 min; Figure 6). Days relative to calving tended (P = 0.07) to be associated with inactive daily minutes, but there was no interaction between CBT and day (P = 0.39), nor an effect of parity (P = 0.24). From a peak following calving, inactive daily minutes slowly decreased (P < 0.01) until d 21 postpartum (Figure 6). Core body temperature did not affect (P = 0.39) postpartum inactivity, with HT cows spending an average of 409 ± 16 min per day being inactive compared with LT cows at 391 ± 14 min per day (Figure 6). There was, however, an effect of parity (P = 0.05), as multiparous cows spent more time inactive (420 ± 12 min) than primiparous cows (380 ± 17 min). Nonetheless, the interaction of CBT and parity was not significant (P = 0.41).

Time Eating

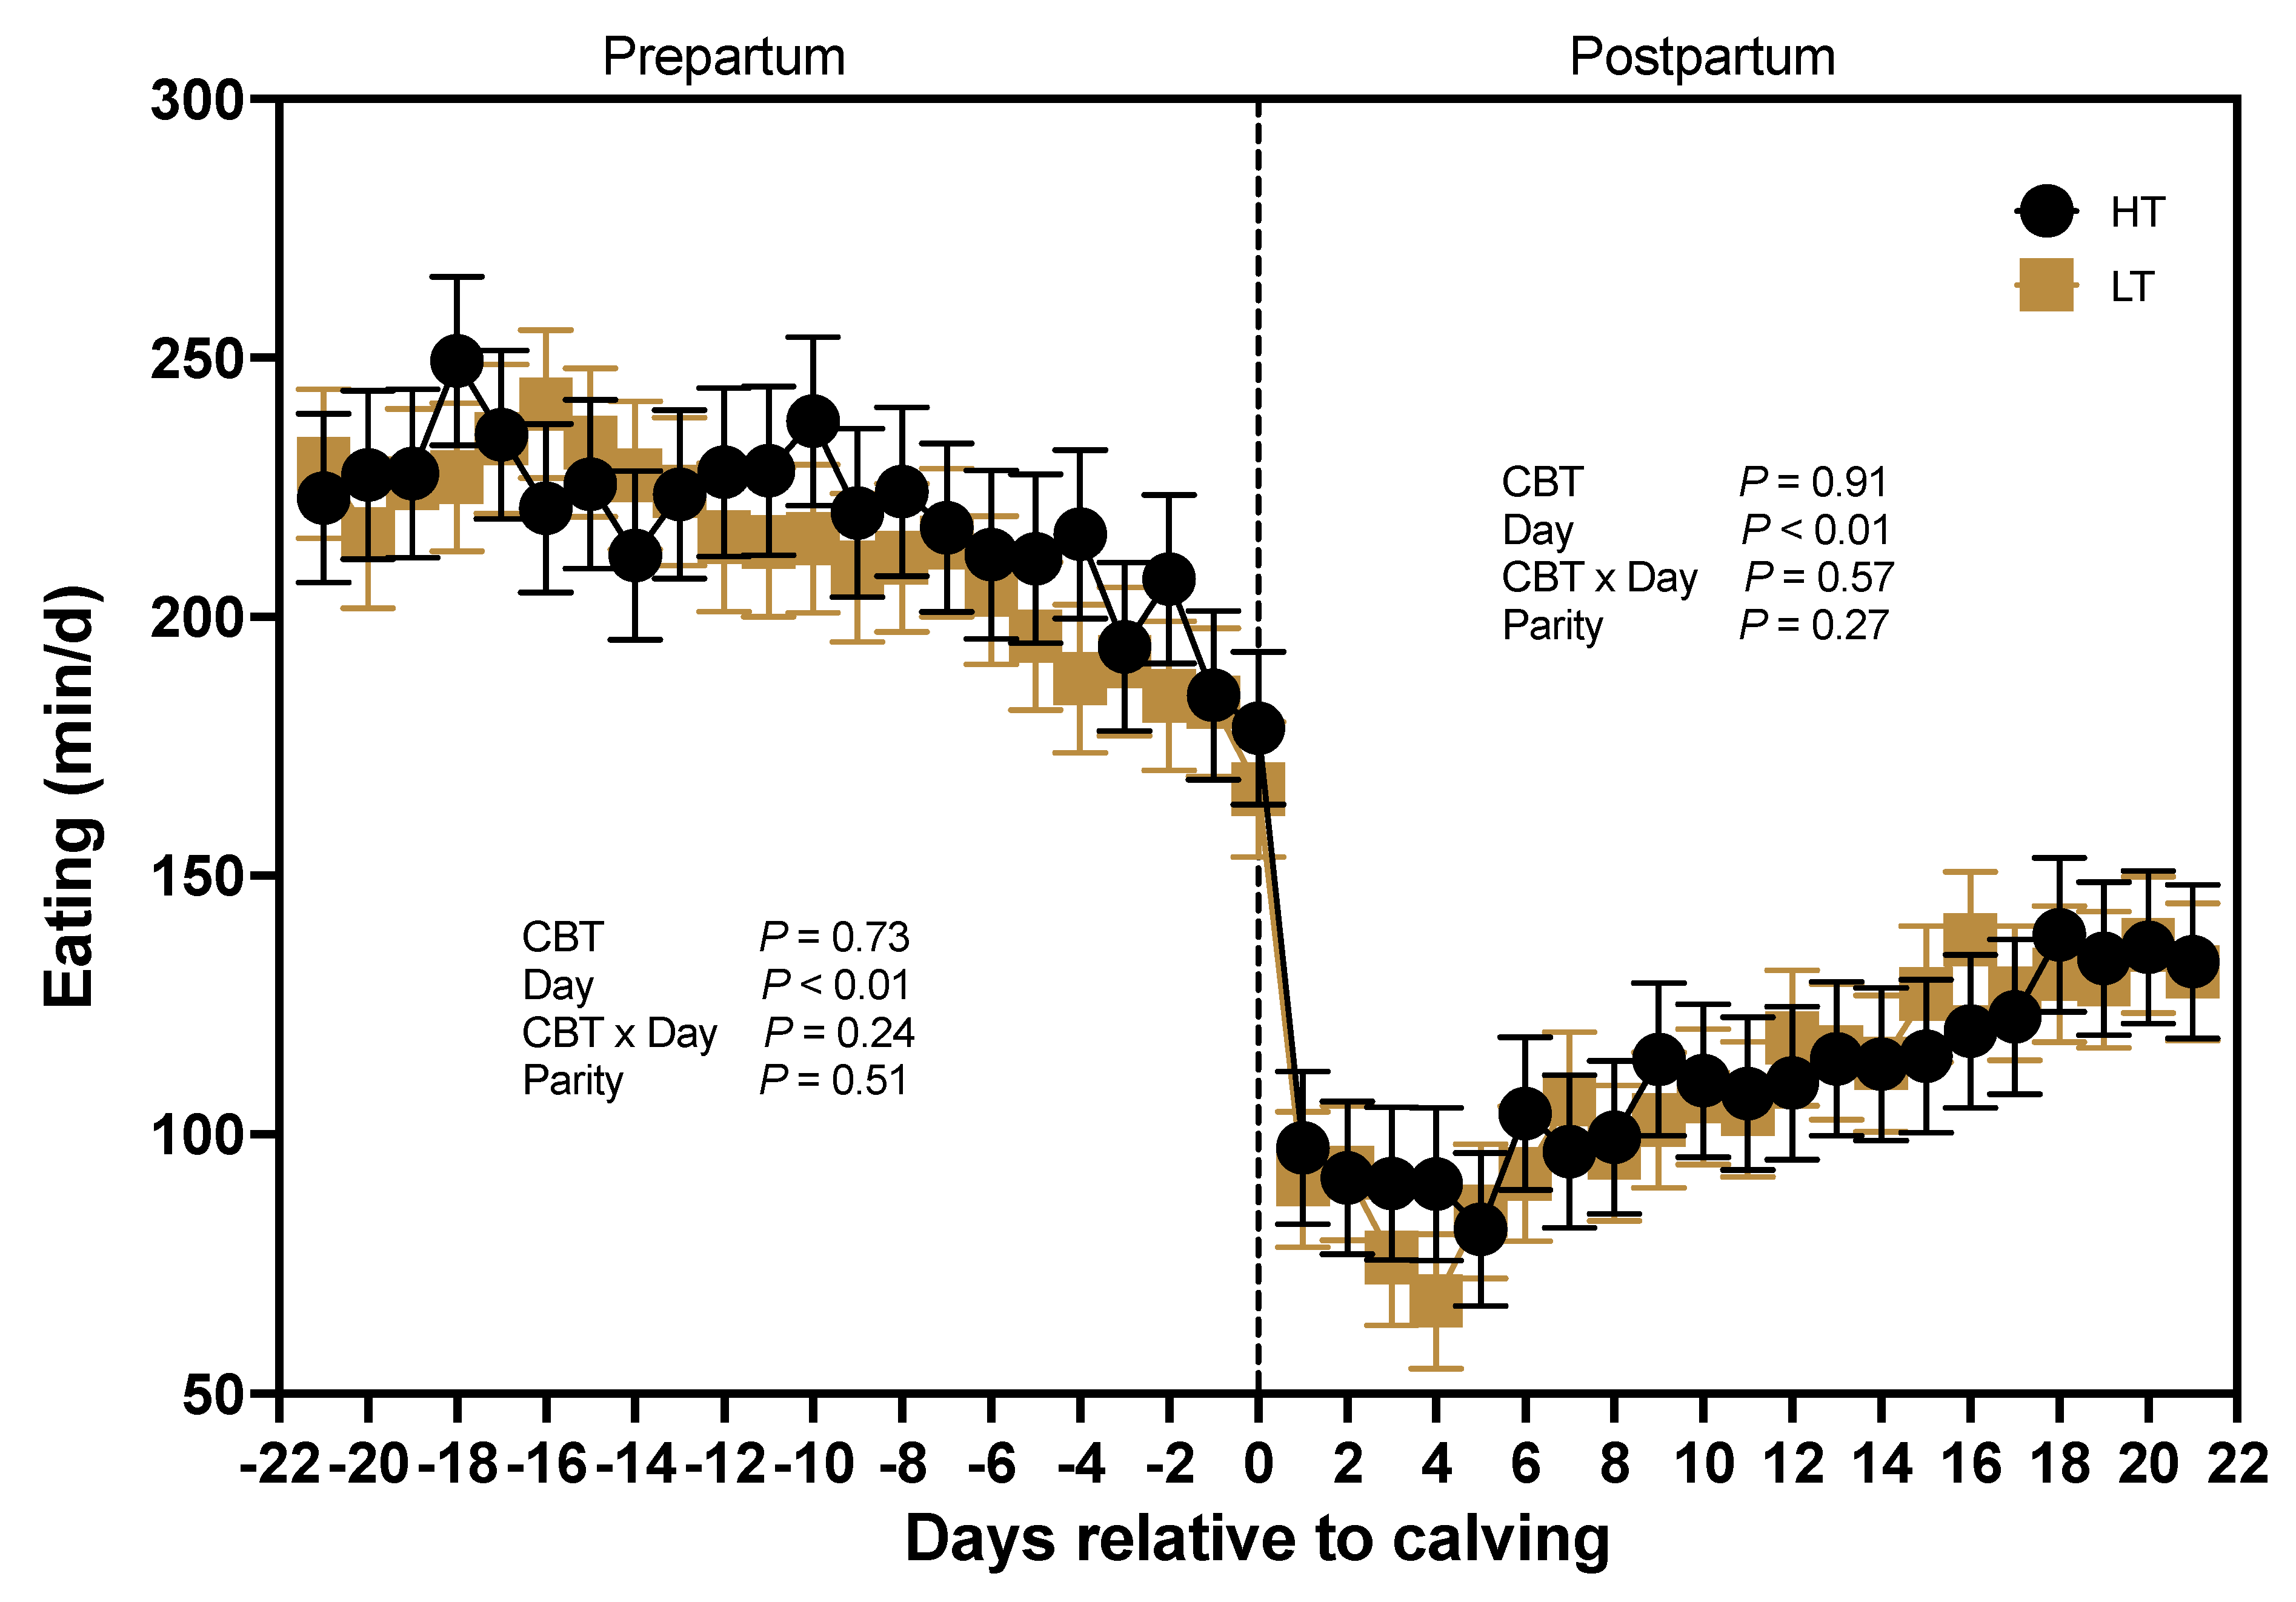
The average time cows spent eating daily during the prepartum period was not affected by CBT (P = 0.73) averaging (220 ± 14 vs. 214 ± 12 min) for HT and LT cows, respectively (Figure 7). There was a significant effect of days relative to calving (P < 0.01) on daily time spent eating, with a notable decrease as calving approached. In contrast, postpartum eating time was at a nadir around the time of calving and slowly increased (P < 0.01) to d 21 (Figure 7). Postpartum eating time was not affected by CBT (P = 0.91) and averaged 114 ± 13 min for HT cows and 112 ± 11 min for LT cows. Furthermore, there was no interaction between CBT and days relative to calving (P = 0.57), nor an effect of parity (P = 0.27).

Rumination Time

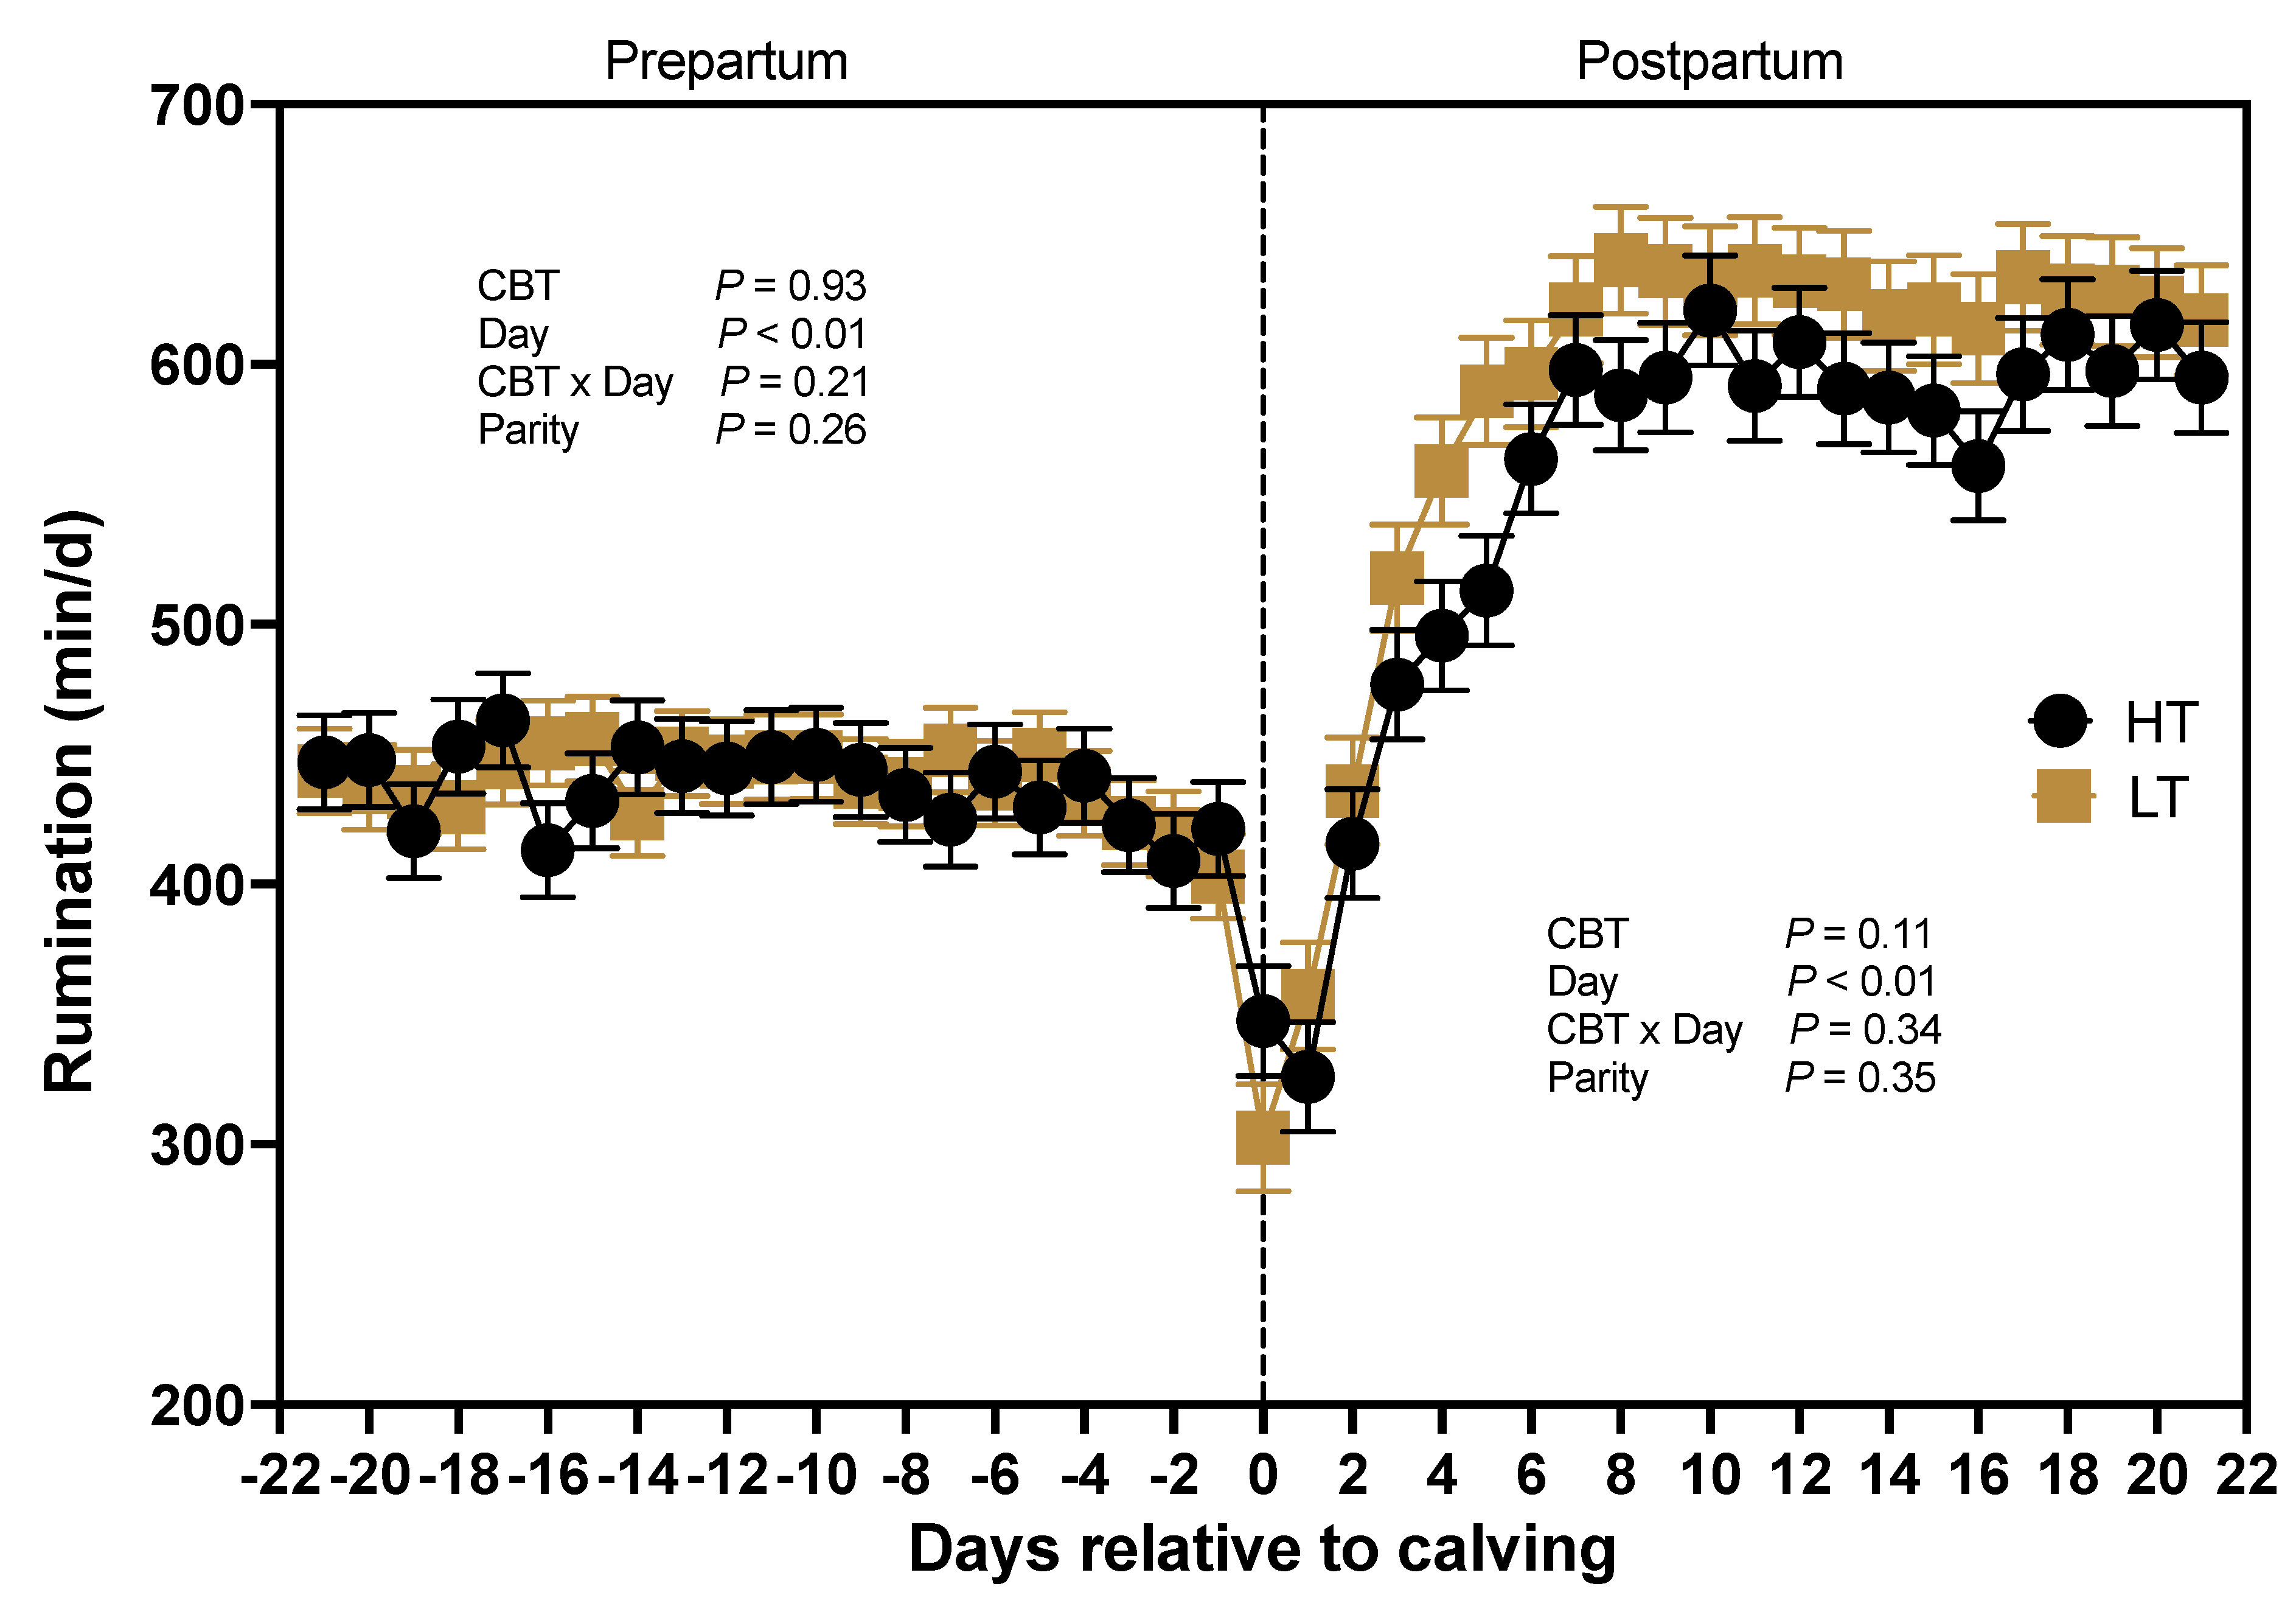
Core body temperature did not have a significant effect (P = 0.93) on the duration of time cows spent ruminating before calving, with HT cows averaging 437 ± 15 min and LT cows averaging 439 ± 15 min (Figure 8). Rumination time prepartum decreased as parturition approached (P < 0.01), and rapidly increased postpartum (P < 0.01) until reaching a peak at the end of the first week. Importantly, there was a tendency for the effect of CBT (P = 0.11) on postpartum rumination, (Figure 8) indicating that HT cows spend less time ruminating compared with LT cows after calving (549 ± 14 vs. 580 ± 14 min). No differences (P = 0.35) in postpartum rumination time were observed between primiparous and multiparous cows (Figure 8).

Ear Surface Temperature

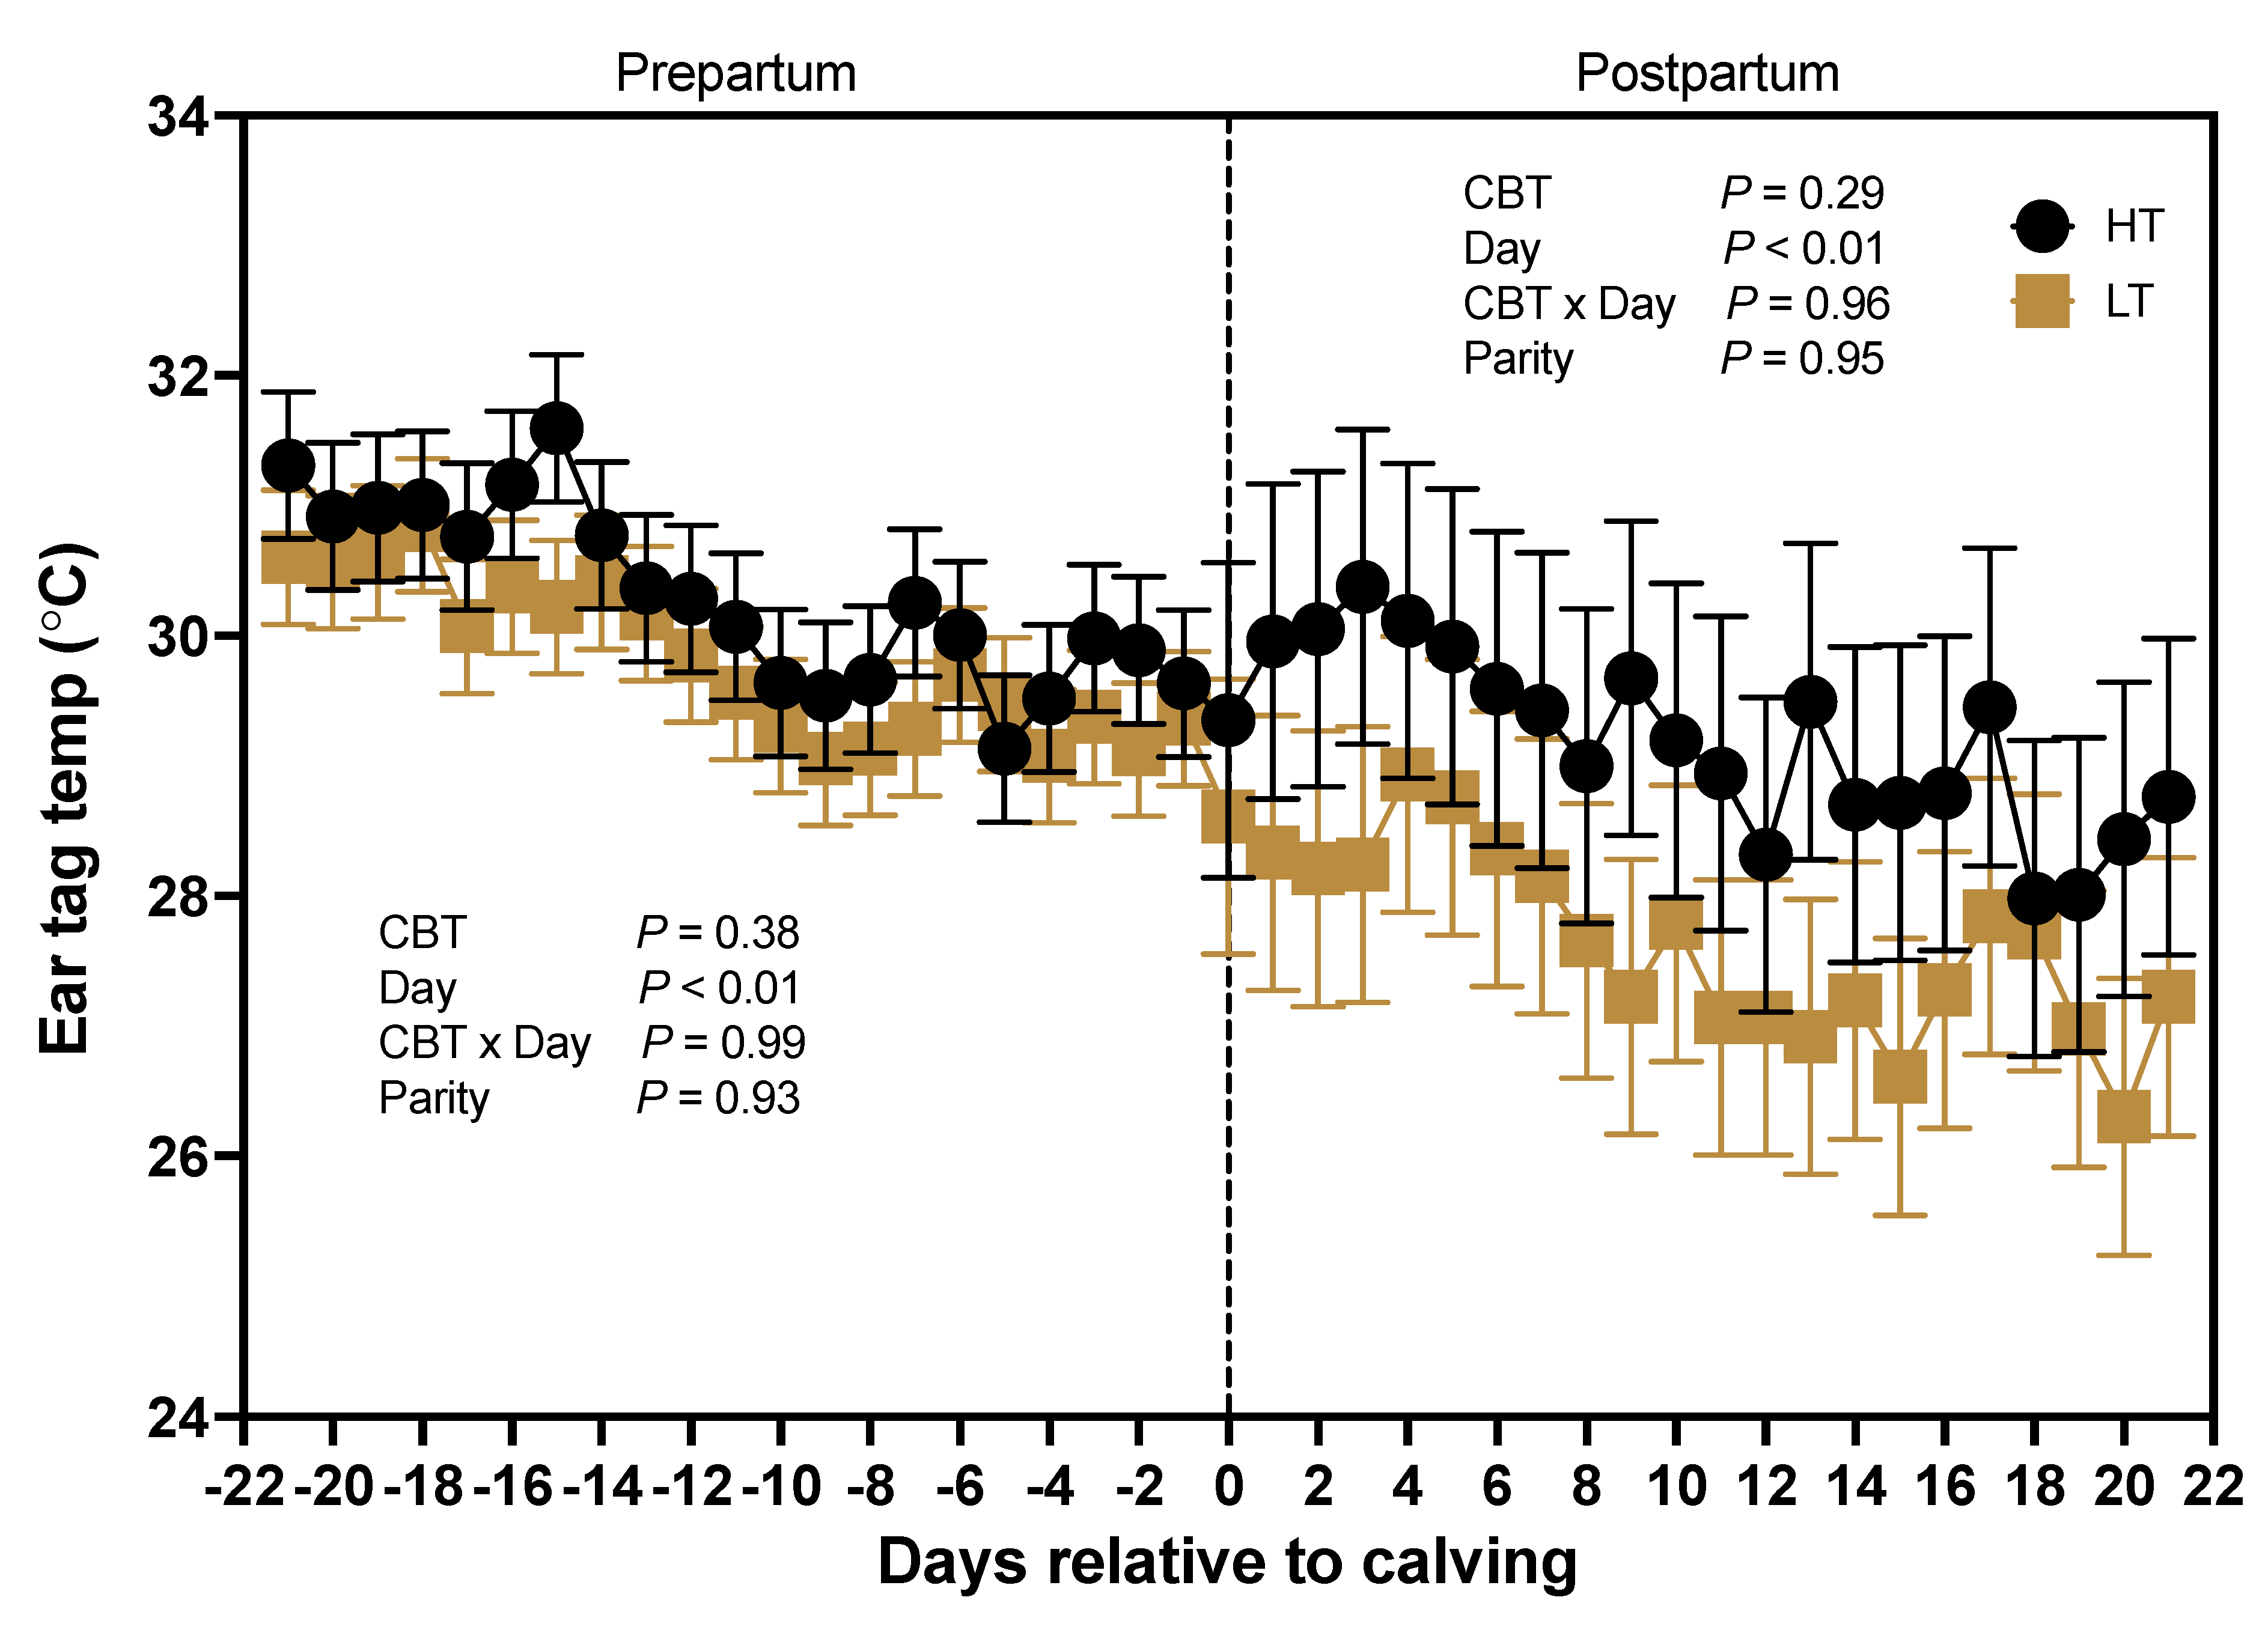
Although CBT was not significantly associated (P > 0.29) with ear surface temperature prepartum or postpartum, a trend can be seen for lower ear surface temperatures in
LT than HT throughout the peripartum period (d -21 to 2; Figure 9). Days relative to calving had an effect (P < 0.01) on ear surface temperature because temperature decreased in the prepartum as cows approached parturition. Parity (P > 0.93) and the interaction of CBT and days relative to calving (P > 0.96) did not affect ear surface temperature during the pre and postpartum periods.

Gene Expression Differences in WBC from HT and LT cows

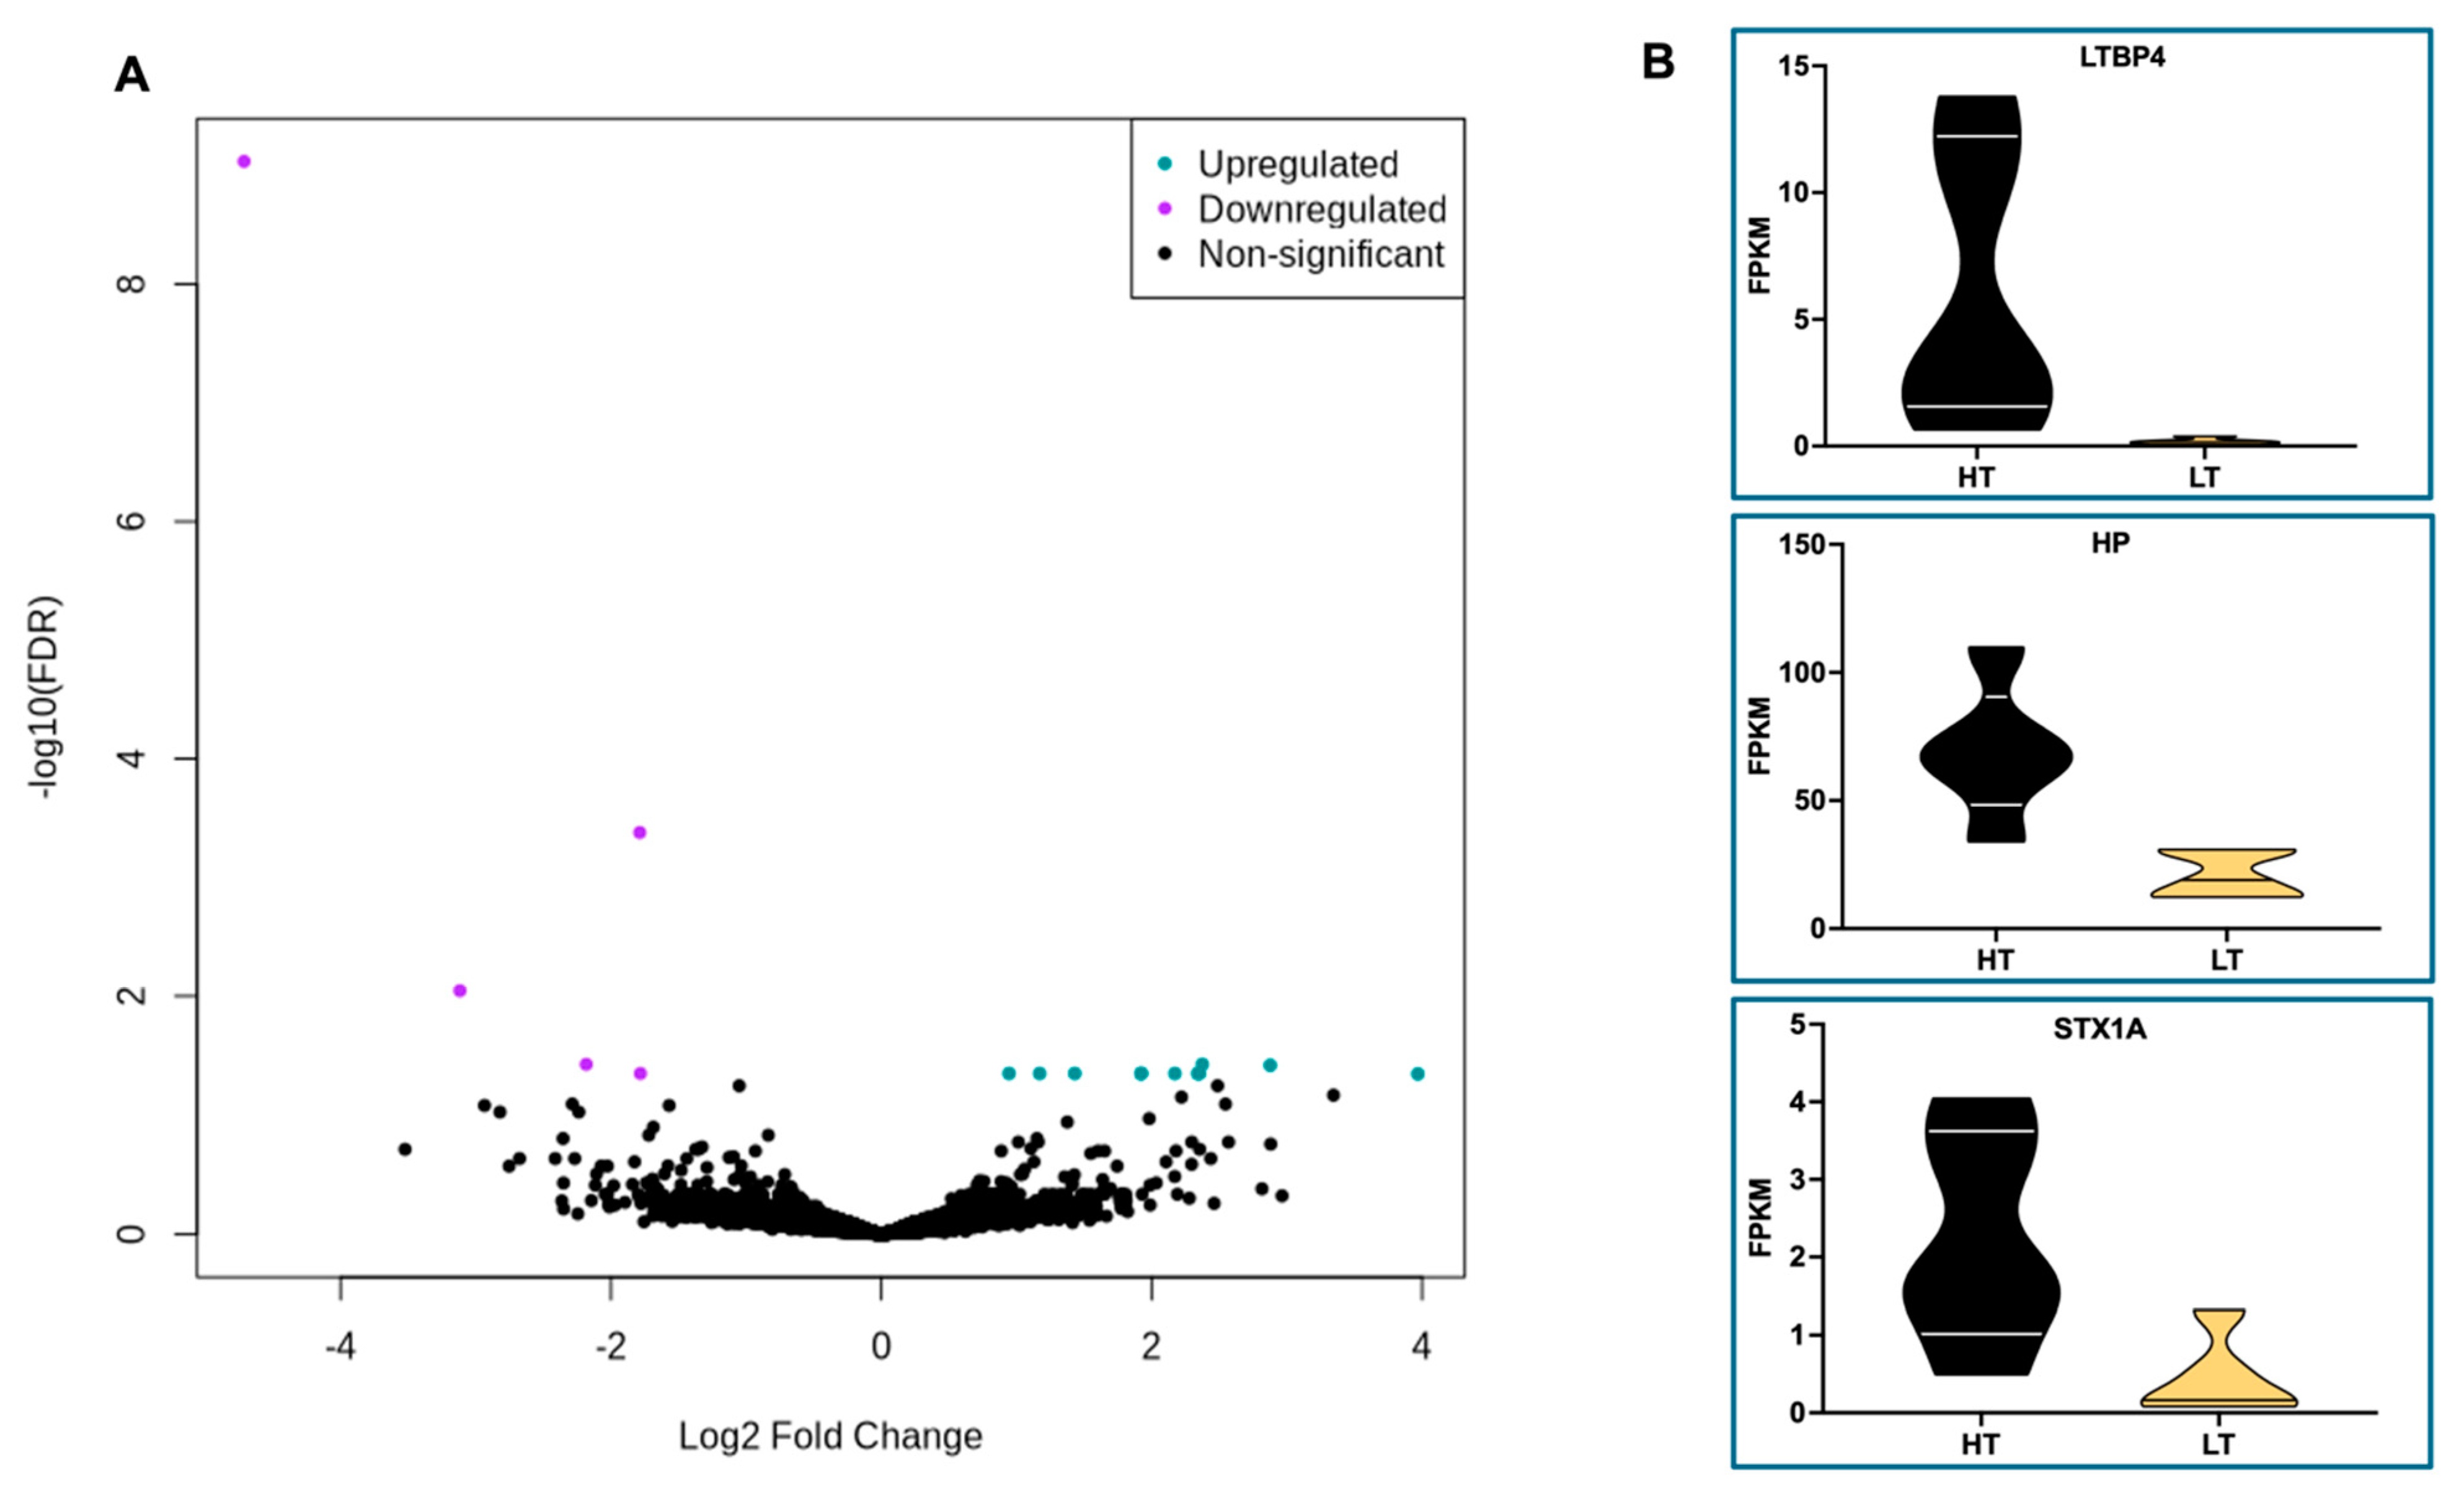
RNA sequencing analysis revealed only 16 DEG (FDR < 0.05) in WBC of HT compared to LT cows (Table 3 and Figure 10A). The expression of 5 genes increased while 11 genes decreased in WBC of HT compared to LT cows, respectively. Furthermore, 5 out of 16 DEG were uncharacterized (Table 3). The limited number of characterized DEG posed a constraint on the feasibility of conducting meaningful functional analyses. Therefore, the DEG were explored individually.
The expression levels of the top 3 DEG are depicted in violin plots in Figure 10B and increased in WBC from HT compared to LT cows (Figure 10A, 8B). The LTBP4 gene, or latent transforming growth factor beta binding protein 4, encodes a binding protein for transforming growth factor beta (TGFB) [35], an important cytokine involved in both pro- and anti-inflammatory responses [36]. The HP gene encodes haptoglobin, a major acute-phase protein secreted primarily by the liver and lungs [37]. The STX1A gene encodes the syntaxin 1A protein, part of the SNARE (Soluble NSF Attachment Receptor) complex [38], that mediates the fusion of vesicles with targeted membranes, playing a major role in calcium-dependent exocytosis and endocytosis. Furthermore, the fourth (ENSBTAG00000058633) and fifth (ENSBTAG00000034366) DEG which increased in WBC of HT compared to LT cows are classified as novel protein-coding genes by Ensembl.
ENSBTAG00000058633 encodes a protein comprising of 372 amino acids, aligning with the UniProt (https://www.uniprot.org/) identifier (A0A3Q1LIM9), denoting an immunoglobulin-like domain-containing protein. ENSBTAG00000034366 encodes a protein comprising of 211 amino acids, aligning with the UniProt identifier (F1N3V3), encoding the regulator of g-protein signaling 2 (RGS2). Members of the RGS family are regulatory proteins capable of deactivating the G protein subunits Gi alpha, Go alpha, and Gq alpha subtypes [39].
There were 11 genes with increased expression in WBC of LT compared to HT cows (Figure 10A). The upregulated genes in WBC of LT cows encode proteins associated with mRNA processing and export from nucleus (THOC7) [40], cell signaling (CNKSR2, TGFBR3, ADGRL1, RIMS3) [41,42,43,44], immunoglobulin synthesis (ENSBTAG00000054086, ENSBTAG00000048423), cell cycle regulation (CDCA7) [45], solute carrier transporters (SLC9B2, SLC29A4), and lastly, a paternally expressed imprinted gene, the retrotransposon-derived protein PEG10, with known roles in cell proliferation, differentiation, and apoptosis [46].

Discussion

To our knowledge, this is the first study demonstrating a relationship between CBT and activity during the prepartum period in Holstein cows amidst the challenges of summer heat stress. We hypothesized that cows with distinct CBT would exhibit disparate behaviors associated with different degrees of heat generation or dissipation. To monitor behavior, we employed a dual methodology incorporating visual observations and accelerometer technology. Additionally, we examined the transcriptome of WBC of cows with distinct CBT to potentially uncover insights into the genetic and molecular mechanisms that underlie the physiological differences in temperature regulation between HT and LT cows, rendering them more susceptible or resilient to heat.
Cattle adhere to distinct time allocations for engaging in essential behaviors, including feeding, drinking, resting, socializing, and ruminating. For instance, lactating dairy cows housed in a commercial free stall barn have been reported to spend approximately 12 h resting in stalls, 2.5 h standing in the alley, 4.3 h eating, and 2.7 h per day moving to and from the milking parlor [47]. Furthermore, dairy cows typically ruminate about 7 h per day during the transition period [48], and rumination time is positively correlated with milk yield [49]. Heat stress, however, can induce behavioral changes, such as alterations in lying duration [22,23,50], feeding behavior [50,51], and rumination time [51]. Allen et al. [22] demonstrated that standing bout duration increases and lying bout duration decreases as CBT rises. The same study reported that a CBT of 38.93°C indicated a 50% likelihood that a cow would be standing [22]. Other groups [23,52] have confirmed that, as THI rises and CBT increases, standing bout duration increases while lying bout duration decreases. Reductions in lying time, however, have strong detrimental effects on milk production [53,54,55] and may indirectly reduce rumination time, as cows spend the majority of their time ruminating while lying down [56]. Lying duration during the postpartum period has also been associated with health outcomes in dairy cattle. For instance, Piñeiro et al. [57] reported a quadratic relationship between lying time and postpartum blood concentrations of non-esterified fatty acids (NEFA), as cows with reduced (less than 9 hours/day) or increased (greater than 15 hours/day) lying time during the first two weeks postpartum had the highest NEFA concentration at 14 ± 3 and 7 ± 3 days postpartum. Furthermore, the same study reported a linear association between lying duration and risk of ketosis (e.g., defined as β-hydroxybutyrate (BHB) ≥1.2 mmol/L) within the first 14 postpartum [57]. In the present study, however, standing and lying behaviors, evaluated by visual observations during the far-off and close-up periods (Table 2) were not associated with CBT. In contrast, the interaction of CBT and parity during the far-off tended to affect lying behavior, as primiparous HT cows were observed less frequently lying down than primiparous LT cows, although no differences were observed among multiparous cows. Our findings for the primiparous cows, therefore, reinforce the notion of reduced lying time in cows with greater CBT. Given that primiparous and multiparous cows may exhibit varying social, feeding, and lying behaviors [58], and that CBT in response to heat stress may be influenced by parity [59], the fixed effect of parity and the two-way interaction of CBT and parity were considered in all models. Furthermore, lying duration and rumination time are associated with dry matter intake (DMI), which influences heat production and CBT. West [24] reported that DMI decreased by 0.82 kg for each degree (°C) increase in average air temperature, and every kilogram of DMI equates to approximately 1.4 to 1.9 kg of milk production [60]. In the present study, eating behavior was not associated with CBT. However, the interaction between CBT and parity influenced eating behavior, as HT multiparous cows were observed less often eating than the LT multiparous, but primiparous HT cows were observed more often eating than LT primiparous cows. Despite the observed interaction with parity, other groups have reported that heat stress diminishes eating behavior [50,51]. Furthermore, cooling heat-stressed dry cows can increase DMI [61], and greater DMI during the dry period is associated with improved postpartum health outcomes in dairy cows [62,63]. While hyperthermia is observed to suppress DMI, water consumption has been reported to increase during periods of heat stress to aid in thermoregulation, particularly in high-producing dairy cows [25]. In the present study, drinking behavior during the close-up period tended to increase in HT compared to LT cows. Furthermore, the interaction between CBT and time was significant for drinking behavior during the far-off, as HT cows were observed more frequently drinking water in the AM observations but less often in the PM observations than LT cows. In the summer months, daily ambient temperatures are at their highest during the afternoons (Figure 3), so the observed tendency suggesting that LT cows drink more water during the PM observations may be associated with their improved ability to maintain a lower CBT compared to HT cows. Collectively, the lack of strong statistical differences in the behavioral metrics evaluated by visual observations in the present study may be attributed to the short time cows were observed during the prepartum (16 hours, including 8 hours in the far-off pen and 8 hours in the close-up pen) in addition to the small sample size (n = 48) evaluated in the study.
Despite the limited sample size, the present study detected significant trends based on the 24h automated sensor monitoring system employed, supporting the hypotheses of differences in behavior of dry cows with distinct CBT. Of note, HT cows displayed higher periods of high activity and lower periods of inactivity prepartum and diminished rumination time postpartum than LT cows. The observed differences in activity likely represent an important behavioral distinction influencing CBT (e.g., heightened activity correlating with increased heat generation). Furthermore, the trend for reduction in rumination time suggests that HT cows face health challenges following parturition. Indeed, we have previously demonstrated that dry cows classified as HT were more likely to be diagnosed with postpartum diseases than LT cows following parturition [12]. These findings support the notion that the consequences of heat stress during the dry period extend into the postpartum period, leading to a higher incidence of postpartum disorders [8].
Limited data is available regarding the use of ear surface temperature as a predictor of cow health. Stevenson et al. [10] demonstrated that ear surface temperatures, captured by the CowManager ear tags, were highly correlated with environmental conditions (r = 0.96). Furthermore, the same publication [10] reported that ear surface temperature was not different between healthy cows and cows that developed postpartum diseases. Although CBT was not significantly associated with ear surface temperature in the present study, a trend can be seen for lower ear surface temperatures in LT than HT during both the prepartum and postpartum periods (Figure 9). Further research, with an increased number of animals, is encouraged to evaluate whether ear surface temperature is a useful indicator of CBT and health traits in dairy cows. However, AMS that capture heavy breathing behavior may provide a more accurate measure of heat stress exposure than those that assess ear surface temperature [64].
The comparison of the transcriptome of WBC from HT and LT cows revealed that 16 genes were differently expressed (FDR < 0.05; Table 3 and Figure 10A). The small number of DEG observed is likely due to measuring only a single time point (blood sample collected at the time of iButton removal) from 5 cows per CBT group (HT and LT). Future studies should consider longitudinal sampling, especially at times of day when animals experience greater heat stress. In addition, a greater number of biological replicates per CBT group should be considered. Despite these limitations, the results from the present study remain informative. For instance, the top DEG (LTBP4) encodes a binding protein for TGFB. Interestingly, LTBP4 is a direct target of heat-shock protein 1 (HSP1), a major transcriptional regulator of the heat-shock response (HSR) in eukaryotic cells [65]. As a consequence of the high temperatures, HSR is induced to preserve cellular proteostasis [66]. In the current study, the expression of LTBP4 was higher in WBC of HT than LT cows, supporting the hypothesis of greater heat stress response in HT cows. The second highest DEG, haptoglobin (HP), encodes an important biomarker of inflammation and disease in dairy cattle [67]. For instance, plasma concentrations of HP protein are increased in cows with metritis compared with healthy cows [68]. Haptoglobin expression is induced by pro-inflammatory cytokines [69] and is primarily secreted by the liver [70], although HP mRNA has been detected in several tissues [37]. Notably, plasma haptoglobin concentrations have been observed to increase in dairy cows during high ambient temperatures [71], and in the present study, HP mRNA was increased in WBC of HT than LT cows, likely a reflection of greater systemic inflammation in HT cows. This is an interesting finding as we have previously shown that HT cows are more likely to develop uterine disorders (retained fetal membranes or metritis) than LT cows [9]. The third-highest DEG detected in the present study, whose expression increased in WBC of HT than LT cows was the STX1A gene, which encodes a protein part of the SNARE complex [38]. Similar to our findings that HT cows experience greater metabolic challenges, STX1A has been proposed as a potential biomarker of clinical ketosis in Holstein cows, based on an RNA-seq experiment performed in whole blood [72]. The last characterized gene that increased in WBC of HT than LT cows, RGS2, is also a direct target of the heat-shock protein 1 (HSP1). The promoter of the RGS2 gene has a binding site for HSF1, and the expression of RGS2 in smooth muscle cells from the rat aorta has been demonstrated to increase with exposure to febrile temperatures [73]. Among the genes whose expression increased in WBC of LT than HT cows (n = 11) two genes (THOC7 and PEG10) have been previously implicated with heat stress. The THOC7 gene, or THO Complex Subunit 7, encodes a protein part of the THO complex (consisting of THO2, HPR1, THOC5, THOC6, THOC7) involved in mRNA export from the nucleus. Notably, the export of heat-shock mRNAs during heat stress is entirely reliant on the function of the THO complex in Drosophila melanogaster [74] and yeast [75,76,77]. Thus, without a functional THO complex, D. melanogaster and yeast have a reduced ability to cope with heat stress. Therefore, the increased expression of THOC7 in the WBC of LT cows is likely implicated in their improved capacity to tolerate heat stress. Lastly, the paternally imprinted PEG10 gene has also been implicated in heat tolerance under heat stress in cattle [78]. To investigate the effect of cross-breeding on tolerance to heat stress, Zhang et al. [78] investigated the inheritance patterns of leukocyte transcriptome in F1 hybrid cattle (Angus males × Droughtmaster females) and their parents Red Angus (AN; B. taurus) and Droughtmaster (DR; B. indicus and B. taurus genetics) under heat stress. The physiological responses to heat stress in F1 hybrids were comparable to those in AN. Inheritance pattern analysis from the gene expression data partly explained the response to heat stress in the F1 hybrids, and the PEG10 gene was identified as a key player gene involved with the paternal dominant gene expression in the hybrids. The identification of a candidate paternally imprinted gene associated with heat stress tolerance is exciting, as it would enable farmers to rapidly disseminate this beneficial trait across a larger population through artificial insemination and targeted sire selection.

Conclusions

The current study identified important behavioral patterns in dry Holstein cows with distinct body temperatures during the summer months, a season known for inducing heat stress in dairy cattle. Despite the limited sample size, notable trends emerged from both visual assessment and automated behavioral monitoring. These findings provided valuable insights into the reasons for the observed variations in CBT among dry cows experiencing periods of heat stress. Our study also identified DEG in WBC of cows presenting distinct body temperatures. These differences in WBC gene signature may stem from genetic predispositions associated with either phenotype (e.g., tolerance or susceptibility to heat stress) or could arise from distinct physiological responses resulting from the observed behavioral differences influencing heat production or dissipation. Importantly, HT cows tended to be more active prepartum and had decreased rumination postpartum than LT cows. Because rumination time is an important predictor and indicator of dairy cow health postpartum, CBT and patterns of activity prepartum may serve as valuable predictors for the identification of dairy cows prone to postpartum health disorders.

Author Contributions

Conceptualization, L.G.D.M., and J.G.N.M.; data curation, N.F.F.B., and R.F.; investigation, N.F.F.B., R.F., I.S.R., C.G., D.D., R.S.S.O, A.L.A.S., and T.S.B.; formal analysis, N.F.F.B., L.G.D.M., and J.G.N.M.; resources, L.G.D.M., J.G.N.M, and M.C.L.; visualization, N.F.F.B., R.F., L.G.D.M., and J.G.N.M., writing—original draft preparation, N.F.F.B., R.F.; writing—review and editing, J.G.N.M, L.G.D.M., M.C.L., A.L.A.S, I.S.R., C.G., D.D., R.S.S.O, and T.S.B., supervision, L.G.D.M., J.G.N.M, M.C.L.; funding acquisition, L.G.D.M. and J.G.N.M. All authors have read and agreed to the published version of the manuscript.

Funding

This research received no external funding.

Institutional Review Board Statement

The study procedures were reviewed and approved by the Kansas State University Institutional Animal Care and Use Committee (Protocol # 4256).

Informed Consent Statement

Not applicable.

Data Availability Statement

The sequence files and associated metadata for all samples utilized in this study have been securely deposited in the NCBI Sequence Read Archive (SRA) repository (BioProject accession: PRJNA1119056).

Conflicts of Interest

The authors declare no conflict of interest.

References

  1. St-Pierre, N.R.; Cobanov, B.; Schnitkey, G. Economic Losses from Heat Stress by US Livestock Industries1. Journal of Dairy Science 2003, 86, E52–E77. [Google Scholar] [CrossRef]
  2. Gunn, K.M.; Holly, M.A.; Veith, T.L.; Buda, A.R.; Prasad, R.; Rotz, C.A.; Soder, K.J.; Stoner, A.M.K. Projected heat stress challenges and abatement opportunities for U.S. milk production. PLoS One 2019, 14, e0214665. [Google Scholar] [CrossRef] [PubMed]
  3. Bouraoui, R.; Lahmar, M.; Majdoub, A.; Belyea, R. The relationship of temperature-humidity index with milk production of dairy cows in a Mediterranean climate. Animal Research 2002, 51, 479–491. [Google Scholar] [CrossRef]
  4. Zimbelman, R.B.; Rhoads, R.P.; Rhoads, M.L.; Duff, G.C.; Baumgard, L.H.; Collier, R.J. A re-evaluation of the impact of temperature humidity index (THI) and black globe humidity index (BGHI) on milk production in high producing dairy cows. Proceedings of the Southwest Nutrition Conference. USDA Cooperative State Research, Education, and Extension Service (CSREES); 2009:158–169.
  5. De Rensis, F.; Garcia-Ispierto, I.; López-Gatius, F. Seasonal heat stress: Clinical implications and hormone treatments for the fertility of dairy cows. Theriogenology 2015, 84, 659–666. [Google Scholar] [CrossRef] [PubMed]
  6. Cook, N.B.; Mentink, R.L.; Bennett, T.B.; Burgi, K. The effect of heat stress and lameness on time budgets of lactating dairy cows. J Dairy Sci 2007, 90, 1674–1682. [Google Scholar] [CrossRef] [PubMed]
  7. Cook, N.B. Time budgets for dairy cows: how does cow comfort influence health, reproduction and productivity. Proceedings of the Penn State Dairy Cattle Nutrition Workshop 2008, 12–13. [Google Scholar]
  8. Thompson, I.M.; Dahl, G.E. Dry-period seasonal effects on the subsequent lactation. The Professional Animal Scientist 2012, 28, 628–631. [Google Scholar] [CrossRef]
  9. Scanavez, A.L.A.; Voelz, B.E.; Moraes, J.G.N.; Green, J.A.; Mendonça, L.G.D. Physiological, health, lactation, and reproductive traits of cooled dairy cows classified as having high or low core body temperature during the dry period. J Anim Sci 2019, 97, 4792–4802. [Google Scholar] [CrossRef] [PubMed]
  10. Stevenson, J.S.; Banuelos, S.; Mendonça, L.G.D. Transition dairy cow health is associated with first postpartum ovulation risk, metabolic status, milk production, rumination, and physical activity. J Dairy Sci 2020, 103, 9573–9586. [Google Scholar] [CrossRef]
  11. Karimi, M.T.; Ghorbani, G.R.; Kargar, S.; Drackley, J.K. Late-gestation heat stress abatement on performance and behavior of Holstein dairy cows. Journal of Dairy Science 2015, 98, 6865–6875. [Google Scholar] [CrossRef]
  12. Scanavez, A.L.A.; Fragomeni, B.; Rocha, L.; Voelz, B.E.; Hulbert, L.E.; Mendonça, L.G.D. Association between 4-day vaginal temperature assessment during the dry period and performance in the subsequent lactation of dairy cows during the warm season1,2. J Anim Sci 2017, 95, 5208–5217. [Google Scholar] [CrossRef] [PubMed]
  13. Sejian, V.; Bhatta, R.; Gaughan, J.B.; Dunshea, F.R.; Lacetera, N. Adaptation of animals to heat stress. Animal 2018, 12, s431–s444. [Google Scholar] [CrossRef] [PubMed]
  14. Soriani, N.; Trevisi, E.; Calamari, L. Relationships between rumination time, metabolic conditions, and health status in dairy cows during the transition period. J Anim Sci 2012, 90, 4544–4554. [Google Scholar] [CrossRef] [PubMed]
  15. Liboreiro, D.N.; Machado, K.S.; Silva, P.R.B.; Maturana, M.M.; Nishimura, T.K.; Brandão, A.P.; Endres, M.I.; Chebel, R.C. Characterization of peripartum rumination and activity of cows diagnosed with metabolic and uterine diseases. J Dairy Sci 2015, 98, 6812–6827. [Google Scholar] [CrossRef] [PubMed]
  16. Stangaferro, M.L.; Wijma, R.; Caixeta, L.S.; Al-Abri, M.A.; Giordano, J.O. Use of rumination and activity monitoring for the identification of dairy cows with health disorders: Part I. Metabolic and digestive disorders. J Dairy Sci 2016, 99, 7395–7410. [Google Scholar] [CrossRef] [PubMed]
  17. Stangaferro, M.L.; Wijma, R.; Caixeta, L.S.; Al-Abri, M.A.; Giordano, J.O. Use of rumination and activity monitoring for the identification of dairy cows with health disorders: Part II. Mastitis. J Dairy Sci 2016, 99, 7411–7421. [Google Scholar] [CrossRef] [PubMed]
  18. Stangaferro, M.L.; Wijma, R.; Caixeta, L.S.; Al-Abri, M.A.; Giordano, J.O. Use of rumination and activity monitoring for the identification of dairy cows with health disorders: Part III. Metritis. Journal of Dairy Science 2016, 99, 7422–7433. [Google Scholar] [CrossRef] [PubMed]
  19. Merenda, V.R.; Ruiz-Munoz, J.; Zare, A.; Chebel, R.C. Predictive models to identify Holstein cows at risk of metritis and clinical cure and reproductive/productive failure following antimicrobial treatment. Prev Vet Med 2021, 194, 105431. [Google Scholar] [CrossRef] [PubMed]
  20. Rial, C.; Laplacette, A.; Caixeta, L.; Florentino, C.; Peña-Mosca, F.; Giordano, J.O. Metritis and clinical mastitis events in lactating dairy cows were associated with altered patterns of rumination, physical activity, and lying behavior monitored by an ear-attached sensor. J Dairy Sci 2023, 106, 9345–9365. [Google Scholar] [CrossRef]
  21. Moretti, R.; Biffani, S.; Chessa, S.; Bozzi, R. Heat stress effects on Holstein dairy cows’ rumination. Animal 2017, 11, 2320–2325. [Google Scholar] [CrossRef]
  22. Allen, J.D.; Hall, L.W.; Collier, R.J.; Smith, J.F. Effect of core body temperature, time of day, and climate conditions on behavioral patterns of lactating dairy cows experiencing mild to moderate heat stress. J Dairy Sci 2015, 98, 118–127. [Google Scholar] [CrossRef] [PubMed]
  23. Nordlund, K.V.; Strassburg, P.; Bennett, T.B.; Oetzel, G.R.; Cook, N.B. Thermodynamics of standing and lying behavior in lactating dairy cows in freestall and parlor holding pens during conditions of heat stress. J Dairy Sci 2019, 102, 6495–6507. [Google Scholar] [CrossRef]
  24. West, J.W. Effects of heat-stress on production in dairy cattle. J Dairy Sci 2003, 86, 2131–2144. [Google Scholar] [CrossRef] [PubMed]
  25. Tapkı, İ.; Şahin, A. Comparison of the thermoregulatory behaviours of low and high producing dairy cows in a hot environment. Applied Animal Behaviour Science 2006, 99, 1–11. [Google Scholar] [CrossRef]
  26. Bouchama, A.; Knochel, J.P. Heat stroke. N Engl J Med 2002, 346, 1978–1988. [Google Scholar] [CrossRef] [PubMed]
  27. Bouchama, A.; Aziz, M.A.; Mahri, S.A.; Gabere, M.N.; Dlamy, M.A.; Mohammad, S.; Abbad, M.A.; Hussein, M. A Model of Exposure to Extreme Environmental Heat Uncovers the Human Transcriptome to Heat Stress. Sci Rep 2017, 7, 9429. [Google Scholar] [CrossRef] [PubMed]
  28. Sprecher, D.J.; Hostetler, D.E.; Kaneene, J.B. A lameness scoring system that uses posture and gait to predict dairy cattle reproductive performance. Theriogenology 1997, 47, 1179–1187. [Google Scholar] [CrossRef] [PubMed]
  29. Ferguson, J.D.; Galligan, D.T.; Thomsen, N. Principal descriptors of body condition score in Holstein cows. J Dairy Sci 1994, 77, 2695–2703. [Google Scholar] [CrossRef] [PubMed]
  30. Borchers, M.R.; Chang, Y.M.; Tsai, I.C.; Wadsworth, B.A.; Bewley, J.M. A validation of technologies monitoring dairy cow feeding, ruminating, and lying behaviors. Journal of Dairy Science 2016, 99, 7458–7466. [Google Scholar] [CrossRef]
  31. Ortega, M.S.; Moraes, J.G.; Patterson, D.J.; Smith, M.F.; Behura, S.K.; Poock, S.; Spencer, T.E. Influences of sire conception rate on pregnancy establishment in dairy cattle. Biology of Reproduction 2018, 99, 1244–1254. [Google Scholar] [CrossRef]
  32. Kim, D.; Langmead, B.; Salzberg, S.L. HISAT: A fast spliced aligner with low memory requirements. Nature Methods 2015, 12, 357–360. [Google Scholar] [CrossRef]
  33. Liao, Y.; Smyth, G.K.; Shi, W. FeatureCounts: An efficient general purpose program for assigning sequence reads to genomic features. Bioinformatics 2014, 30, 923–930. [Google Scholar] [CrossRef] [PubMed]
  34. Zhou, X.; Lindsay, H.; Robinson, M.D. Robustly detecting differential expression in RNA sequencing data using observation weights. Nucleic Acids Research, 2014; 42. [Google Scholar]
  35. Su, C.-T.; Urban, Z. LTBP4 in Health and Disease. Genes (Basel) 2021, 12, 795. [Google Scholar] [CrossRef]
  36. Kubiczkova, L.; Sedlarikova, L.; Hajek, R.; Sevcikova, S. TGF-β – an excellent servant but a bad master. Journal of Translational Medicine 2012, 10, 183. [Google Scholar] [CrossRef] [PubMed]
  37. Naryzny, S.N.; Legina, O.K. Haptoglobin as a Biomarker. Biochem Mosc Suppl B Biomed Chem 2021, 15, 184–198. [Google Scholar] [CrossRef]
  38. Luppe, J.; Sticht, H.; Lecoquierre, F.; Goldenberg, A.; Gorman, K.M.; Molloy, B.; Agolini, E.; Novelli, A.; Briuglia, S.; Kuismin, O.; Marcelis, C.; Vitobello, A.; et al. Heterozygous and homozygous variants in STX1A cause a neurodevelopmental disorder with or without epilepsy. Eur J Hum Genet 2023, 31, 345–352. [Google Scholar] [CrossRef]
  39. Masuho, I.; Balaji, S.; Muntean, B.S.; Skamangas, N.K.; Chavali, S.; Tesmer, J.J.G.; Babu, M.M.; Martemyanov, K.A. A Global Map of G Protein Signaling Regulation by RGS Proteins. Cell 2020, 183, 503–521. [Google Scholar] [CrossRef] [PubMed]
  40. El Bounkari, O.; Guria, A.; Klebba-Faerber, S.; Claußen, M.; Pieler, T.; Griffiths, J.R.; Whetton, A.D.; Koch, A.; Tamura, T. Nuclear localization of the pre-mRNA associating protein THOC7 depends upon its direct interaction with Fms tyrosine kinase interacting protein (FMIP). FEBS Letters 2009, 583, 13–18. [Google Scholar] [CrossRef] [PubMed]
  41. Kumar, R.A.; Sudi, J.; Babatz, T.D.; Brune, C.W.; Oswald, D.; Yen, M.; Nowak, N.J.; Cook, E.H.; Christian, S.L.; Dobyns, W.B. A de novo 1p34.2 microdeletion identifies the synaptic vesicle gene RIMS3 as a novel candidate for autism. Journal of Medical Genetics 2010, 47, 81–90. [Google Scholar] [CrossRef]
  42. Nishida, J.; Miyazono, K.; Ehata, S. Decreased TGFBR3/betaglycan expression enhances the metastatic abilities of renal cell carcinoma cells through TGF-β-dependent and -independent mechanisms. Oncogene 2018, 37, 2197–2212. [Google Scholar] [CrossRef]
  43. Higa, L.A.; Wardley, J.; Wardley, C.; Singh, S.; Foster, T.; Shen, J.J. CNKSR2-related neurodevelopmental and epilepsy disorder: a cohort of 13 new families and literature review indicating a predominance of loss of function pathogenic variants. BMC Med Genomics 2021, 14, 186. [Google Scholar] [CrossRef] [PubMed]
  44. Dietzsch, A.N.; Al-Hasani, H.; Altschmied, J.; Bottermann, K.; Brendler, J.; Haendeler, J.; Horn, S.; Kaczmarek, I.; Körner, A.; Krause, K.; Landgraf, K.; Le Duc, D.; et al. Dysfunction of the adhesion G protein-coupled receptor latrophilin 1 (ADGRL1/LPHN1) increases the risk of obesity. Sig Transduct Target Ther 2024, 9, 1–14. [Google Scholar] [CrossRef]
  45. Vukic, M.; Chouaref, J.; Della Chiara, V.; Dogan, S.; Ratner, F.; Hogenboom, J.Z.M.; Epp, T.A.; Chawengsaksophak, K.; Vonk, K.K.D.; Breukel, C.; Ariyurek, Y.; San Leon Granado, D.; et al. CDCA7-associated global aberrant DNA hypomethylation translates to localized, tissue-specific transcriptional responses. Science Advances 2024, 10, eadk3384. [Google Scholar] [CrossRef]
  46. Ono, R.; Kobayashi, S.; Wagatsuma, H.; Aisaka, K.; Kohda, T.; Kaneko-Ishino, T.; Ishino, F. A retrotransposon-derived gene, PEG10, is a novel imprinted gene located on human chromosome 7q21. Genomics 2001, 73, 232–237. [Google Scholar] [CrossRef]
  47. Gomez, A.; Cook, N.B. Time budgets of lactating dairy cattle in commercial freestall herds. J Dairy Sci 2010, 93, 5772–5781. [Google Scholar] [CrossRef]
  48. Kaufman, E.I.; LeBlanc, S.J.; McBride, B.W.; Duffield, T.F.; DeVries, T.J. Association of rumination time with subclinical ketosis in transition dairy cows. J Dairy Sci 2016, 99, 5604–5618. [Google Scholar] [CrossRef] [PubMed]
  49. Kaufman, E.I.; Asselstine, V.H.; LeBlanc, S.J.; Duffield, T.F.; DeVries, T.J. Association of rumination time and health status with milk yield and composition in early-lactation dairy cows. J Dairy Sci 2018, 101, 462–471. [Google Scholar] [CrossRef]
  50. Kanjanapruthipong, J.; Junlapho, W.; Karnjanasirm, K. Feeding and lying behavior of heat-stressed early lactation cows fed low fiber diets containing roughage and nonforage fiber sources. J Dairy Sci 2015, 98, 1110–1118. [Google Scholar] [CrossRef] [PubMed]
  51. Antanaitis, R.; Džermeikaitė, K.; Bespalovaitė, A.; Ribelytė, I.; Rutkauskas, A.; Japertas, S.; Baumgartner, W. Assessment of Ruminating, Eating, and Locomotion Behavior during Heat Stress in Dairy Cattle by Using Advanced Technological Monitoring. Animals (Basel) 2023, 13, 2825. [Google Scholar] [CrossRef]
  52. Kanjanapruthipong, J.; Junlapho, W.; Karnjanasirm, K. Feeding and lying behavior of heat-stressed early lactation cows fed low fiber diets containing roughage and nonforage fiber sources. J Dairy Sci 2015, 98, 1110–1118. [Google Scholar] [CrossRef]
  53. Rulquin, H.; Caudal, J.P. Effects of lying or standing on mammary blood flow and heart rate of dairy cows. Ann Zootech 1992, 41, 101. [Google Scholar] [CrossRef]
  54. Munksgaard, L.; Jensen, M.B.; Pedersen, L.J.; Hansen, S.W.; Matthews, L. Quantifying behavioural priorities—effects of time constraints on behaviour of dairy cows, Bos taurus. Applied Animal Behaviour Science 2005, 92, 3–14. [Google Scholar] [CrossRef]
  55. Berger, H.; Lietzau, M.; Tichy, A.; Herzog, K. Investigations of mammary and uterine blood flow in relation to milk yield, postpartum disease, and pregnancy result in dairy cows. Theriogenology 2016, 86, 1906–1912. [Google Scholar] [CrossRef] [PubMed]
  56. McWilliams, C.J.; Schwanke, A.J.; DeVries, T.J. Is greater milk production associated with dairy cows who have a greater probability of ruminating while lying down? JDS Commun 2022, 3, 66–71. [Google Scholar] [CrossRef] [PubMed]
  57. Piñeiro, J.M.; Menichetti, B.T.; Barragan, A.A.; Relling, A.E.; Weiss, W.P.; Bas, S.; Schuenemann, G.M. Associations of pre- and postpartum lying time with metabolic, inflammation, and health status of lactating dairy cows. J Dairy Sci 2019, 102, 3348–3361. [Google Scholar] [CrossRef] [PubMed]
  58. Proudfoot, K.L.; Huzzey, J.M. A first time for everything: The influence of parity on the behavior of transition dairy cows*. JDS Communications 2022, 3, 467–471. [Google Scholar] [CrossRef] [PubMed]
  59. Suthar, V.; Burfeind, O.; Bonk, S.; Voigtsberger, R.; Keane, C.; Heuwieser, W. Factors associated with body temperature of healthy Holstein dairy cows during the first 10 days in milk. J Dairy Res 2012, 79, 135–142. [Google Scholar] [CrossRef] [PubMed]
  60. Hutjens, M.F. Feed Efficiency-Impact on Economics. 2008.
  61. Adin, G.; Gelman, A.; Solomon, R.; Flamenbaum, I.; Nikbachat, M.; Yosef, E.; Zenou, A.; Shamay, A.; Feuermann, Y.; Mabjeesh, S.J.; Miron, J. Effects of cooling dry cows under heat load conditions on mammary gland enzymatic activity, intake of food and water, and performance during the dry period and after parturition. Livestock Science 2009, 124, 189–195. [Google Scholar] [CrossRef]
  62. Grummer, R.R.; Mashek, D.G.; Hayirli, A. Dry matter intake and energy balance in the transition period. Vet Clin North Am Food Anim Pract 2004, 20, 447–470. [Google Scholar] [CrossRef]
  63. Huzzey, J.M.; Veira, D.M.; Weary, D.M.; von Keyserlingk M a, G. Prepartum behavior and dry matter intake identify dairy cows at risk for metritis. J Dairy Sci 2007, 90, 3220–3233. [Google Scholar] [CrossRef]
  64. Bar, D.; Kaim, M.; Flamenbaum, I.; Hanochi, B.; Toaff-Rosenstein, R.L. Technical note: Accelerometer-based recording of heavy breathing in lactating and dry cows as an automated measure of heat load. J Dairy Sci 2019, 102, 3480–3486. [Google Scholar] [CrossRef] [PubMed]
  65. Kovács, D.; Sigmond, T.; Hotzi, B.; Bohár, B.; Fazekas, D.; Deák, V.; Vellai, T.; Barna, J. HSF1Base: a comprehensive database of HSF1 (heat shock factor 1) target genes. International Journal of Molecular Sciences 2019, 20, 5815. [Google Scholar] [CrossRef] [PubMed]
  66. Åkerfelt, M.; Morimoto, R.I.; Sistonen, L. Heat shock factors: integrators of cell stress, development and lifespan. Nature Reviews Molecular Cell Biology 2010, 11, 545–555. [Google Scholar] [CrossRef] [PubMed]
  67. Huzzey, J.M.; Duffield, T.F.; LeBlanc, S.J.; Veira, D.M.; Weary, D.M.; von Keyserlingk, M.A.G. Short communication: Haptoglobin as an early indicator of metritis. Journal of Dairy Science 2009, 92, 621–625. [Google Scholar] [CrossRef] [PubMed]
  68. Moraes, J.G.N.; Gull, T.B.; Ericsson, A.C.; Caldeira, M.O.; Evans, T.J.; Poock, S.E.; Lucy, M.C. Systemic antibiotic treatment of cows with metritis early postpartum does not change the progression of uterine disease or the uterine microbiome at 1 month postpartum. Res Sq 2024:rs.3.rs-4233045.
  69. Mitani, K.; Fujita, H.; Kappas, A.; Sassa, S. Heme Oxygenase Is a Positive Acute-Phase Reactant in Human Hep3B Hepatoma Cells. Blood 1992, 79, 1255–1259. [Google Scholar] [CrossRef] [PubMed]
  70. Shih, A.W.Y.; McFarlane, A.; Verhovsek, M. Haptoglobin testing in hemolysis: measurement and interpretation. Am J Hematol 2014, 89, 443–447. [Google Scholar] [CrossRef] [PubMed]
  71. Alberghina, D.; Piccione, G.; Casella, S.; Panzera, M.; Morgante, M.; Gianesella, M. The effect of the season on some blood metabolites and haptoglobin in dairy cows during postpartum period. Archives Animal Breeding 2013, 56, 354–359. [Google Scholar] [CrossRef]
  72. Wu, Z.-L.; Chen, S.-Y.; Qin, C.; Jia, X.; Deng, F.; Wang, J.; Lai, S.-J. Clinical Ketosis-Associated Alteration of Gene Expression in Holstein Cows. Genes (Basel) 2020, 11, 219. [Google Scholar] [CrossRef]
  73. Ota, A.; Sawai, M.; Sakurai, H. Stress-induced transcription of regulator of G protein signaling 2 (RGS2) by heat shock transcription factor HSF1. Biochimie 2013, 95, 1432–1436. [Google Scholar] [CrossRef]
  74. Rehwinkel, J.; Herold, A.; Gari, K.; Köcher, T.; Rode, M.; Ciccarelli, F.L.; Wilm, M.; Izaurralde, E. Genome-wide analysis of mRNAs regulated by the THO complex in Drosophila melanogaster. Nat Struct Mol Biol 2004, 11, 558–566. [Google Scholar] [CrossRef]
  75. Libri, D.; Dower, K.; Boulay, J.; Thomsen, R.; Rosbash, M.; Jensen, T.H. Interactions between mRNA export commitment, 3’-end quality control, and nuclear degradation. Mol Cell Biol 2002, 22, 8254–8266. [Google Scholar] [CrossRef] [PubMed]
  76. Strässer, K.; Masuda, S.; Mason, P.; Pfannstiel, J.; Oppizzi, M.; Rodriguez-Navarro, S.; Rondón, A.G.; Aguilera, A.; Struhl, K.; Reed, R.; Hurt, E. TREX is a conserved complex coupling transcription with messenger RNA export. Nature 2002, 417, 304–308. [Google Scholar] [CrossRef] [PubMed]
  77. Zenklusen, D.; Vinciguerra, P.; Wyss, J.-C.; Stutz, F. Stable mRNP formation and export require cotranscriptional recruitment of the mRNA export factors Yra1p and Sub2p by Hpr1p. Mol Cell Biol 2002, 22, 8241–8253. [Google Scholar] [CrossRef] [PubMed]
  78. Zhang, G.-W.; Wang, L.; Huang, D.; Chen, H.; Li, B.; Wu, Y.; Zhang, J.; Jiang, A.; Zhang, J.; Zuo, F. Inheritance patterns of leukocyte gene expression under heat stress in F1 hybrid cattle and their parents. Journal of Dairy Science 2020, 103, 10321–10331. [Google Scholar] [CrossRef] [PubMed]
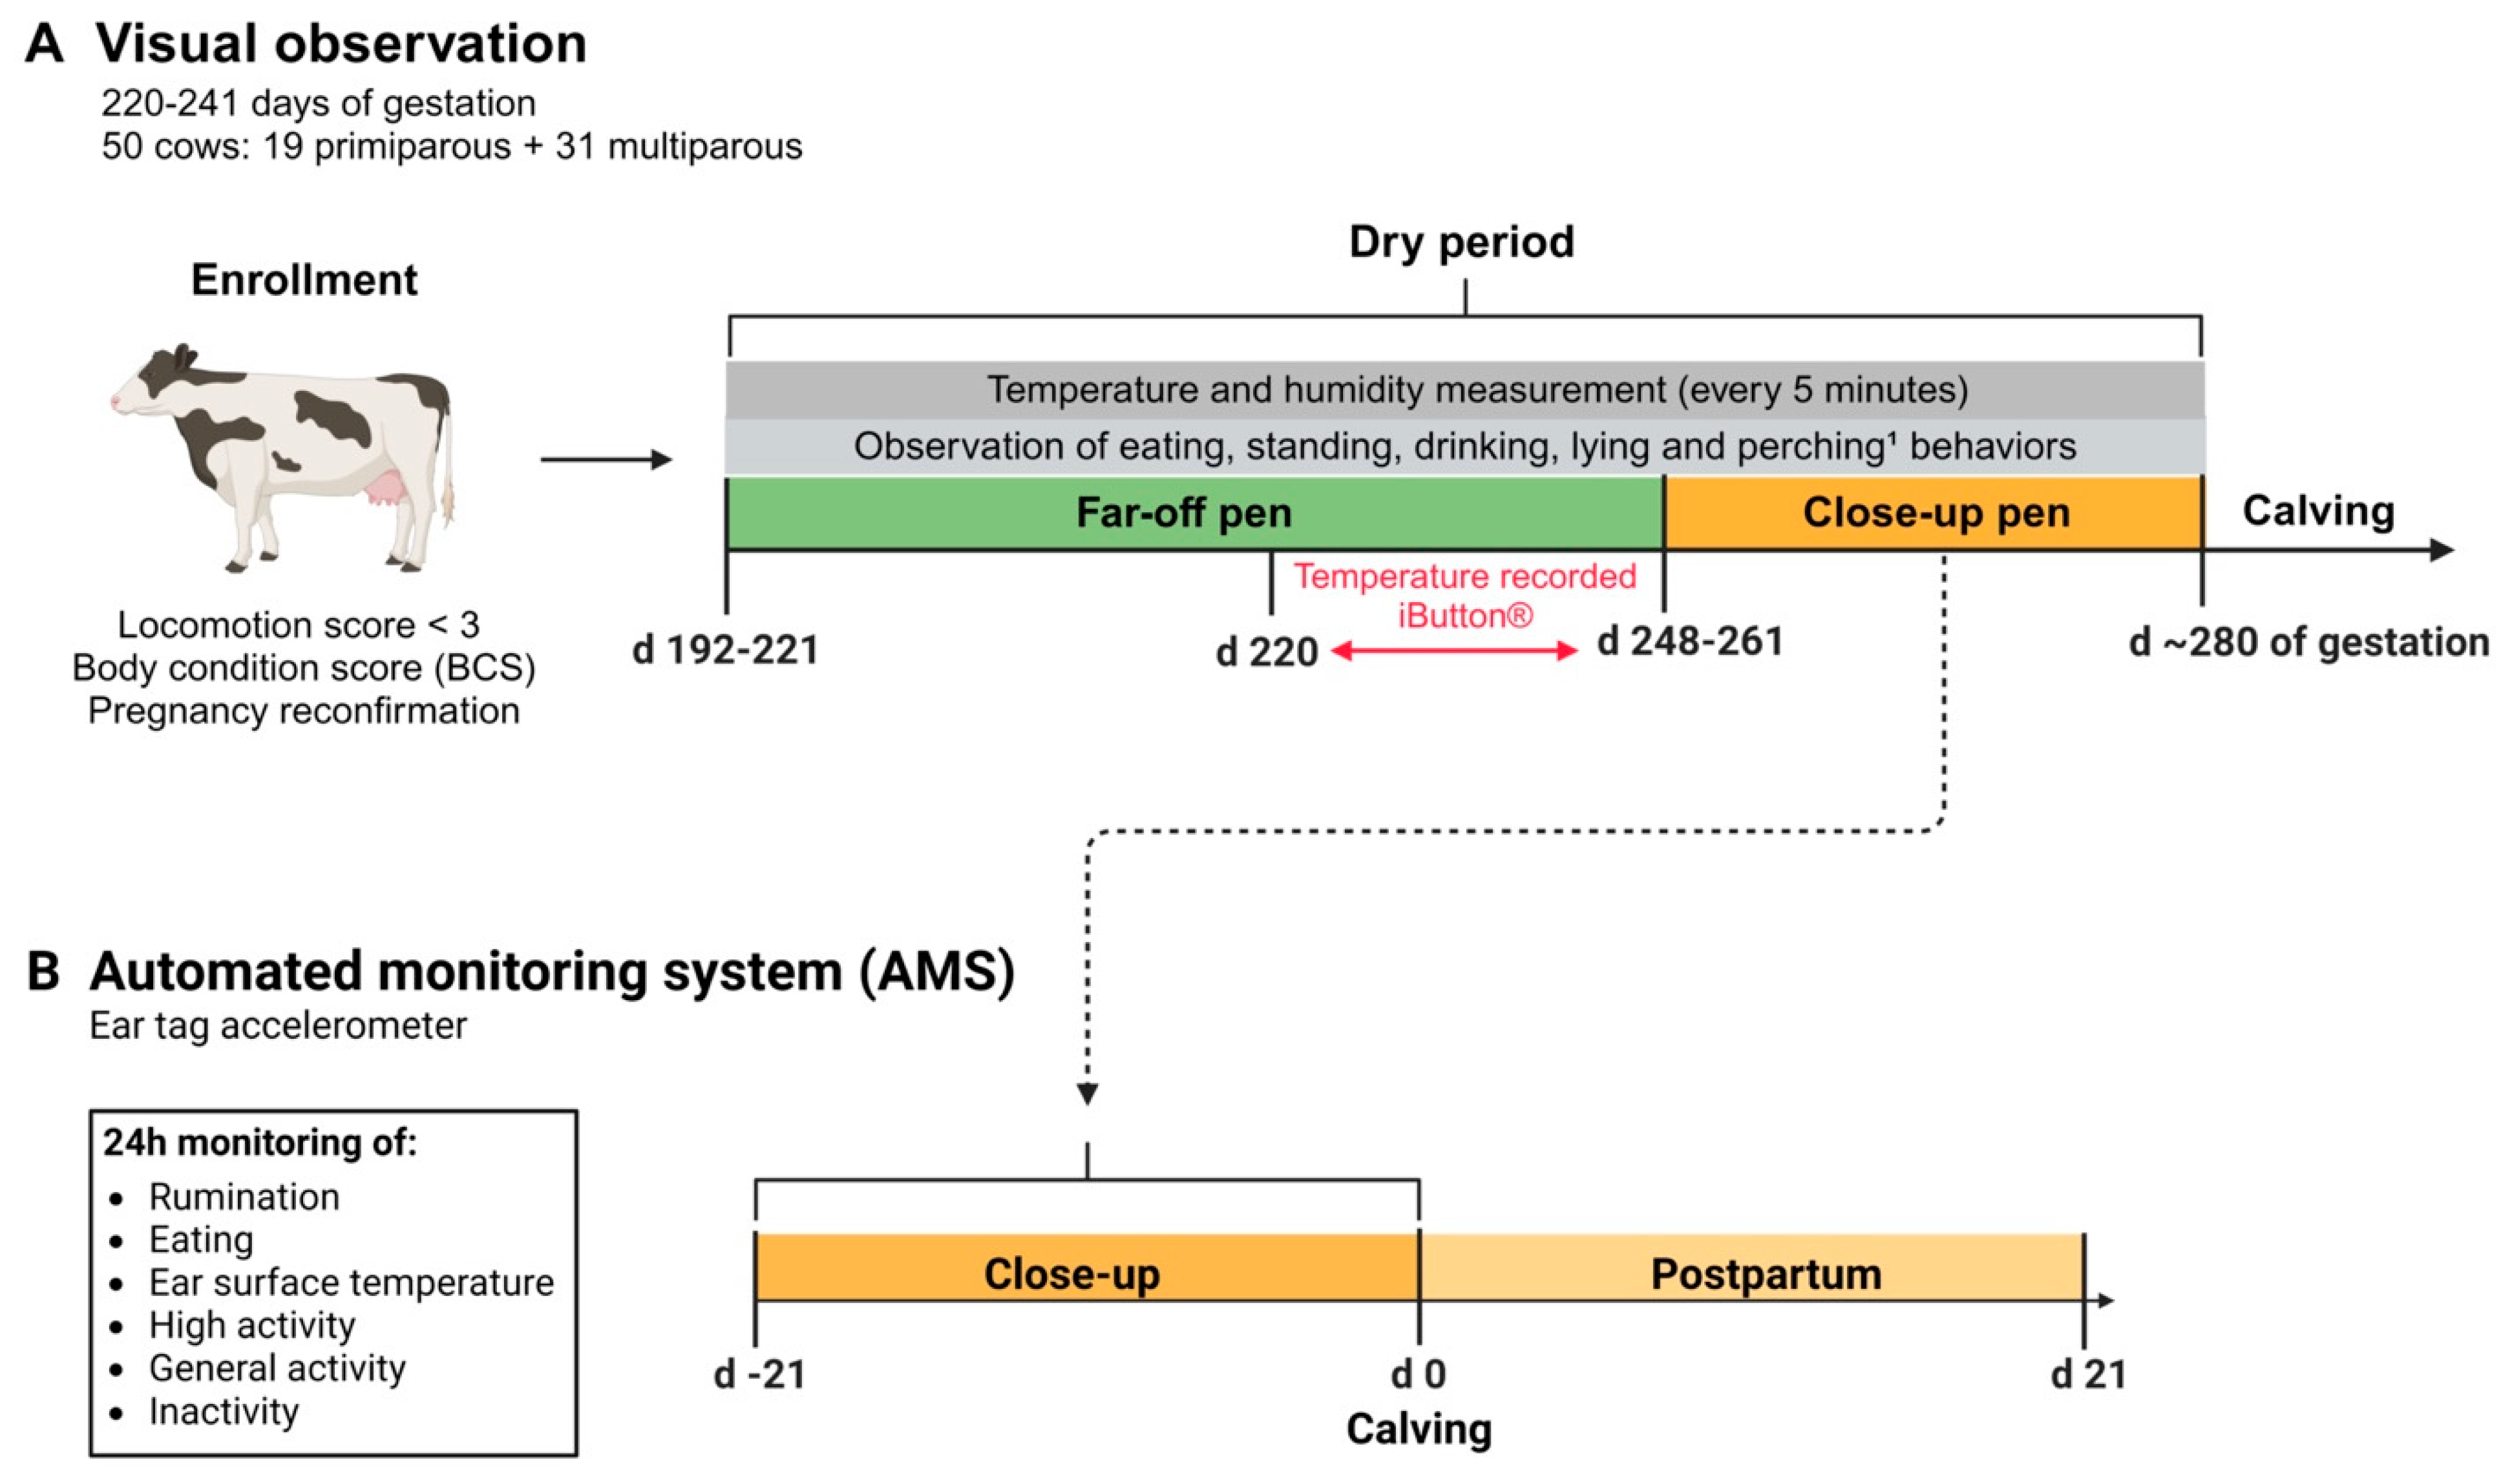
Figure 1. Schematic figure of the experimental study design. (A) 50 animals (between 220 and 241 days of gestation and with locomotion score < 3) were enrolled in the study. Lactating Holstein cows were dried off between 192 and 221 days of gestation and moved to the far-off dry pen. Core body temperature (CBT) was recorded for 7 days using a temperature logger (iButton) placed intravaginally in cows between day 220 and 241 of gestation. Cows were moved to the close-up pen between 248 and 261 days of gestation. Each cow was observed visually for 16 hours, including 8 hours in the far-off pen and 8 hours in the close-up pen. Each 8 h observation block consisted of two, 2 h morning observations (0600 to 0800 h) and two, 2 h afternoon observations (1600 to 1800 h). During the visual observations, five behaviors were recorded: eating, standing, drinking, lying, and perching.¹Perching was only recorded in the far-off pen because the close-up pen did not have free stalls. (B) Representative timeline for the automated monitoring system (AMS) employed to track. Accelerometer data on rumination, eating, activity (e.g., high activity, general activity, inactivity), and ear surface temperature were collected continuously (24h/day, on a minute-by-minute basis) from day -21 to day 21 relative to calving (day 0) and analyzed.
Preprints 110385 g001
Figure 2. Ambient temperature and humidity were monitored in both the far-off (A) and close-up (B) pens by fixing a temperature logger (HOBO U23 Pro v2, Onset Computer Corp., Pocasset, MA) in each pen. Temperature and humidity measurements were recorded every 5 min in both pens. Temperature data were downloaded from the loggers and used to calculate THI. The daily maximum (yellow line), average (black line), and minimum (blue line) THI values are represented for the days when the cows enrolled in the study were in the far-off pens (A) and close-up pens.
Preprints 110385 g002
Figure 3. Average (± SEM) core body temperature (CBT) according to hour of the day (24h format) for high-temperature (HT) and low-temperature (LT) cows. Core body temperature was recorded by attaching a temperature logger (iButton) to a blank intravaginal insert (CIDR). The insert remained intravaginally for 7 d and vaginal temperature was recorded every 5 min for each cow enrolled in the study. Temperature loggers were placed on study cows between d 225 and 239 of gestation and removed between 232 and 248 days of gestation. Data from 1,996 ± 0.7 (mean ± SEM) temperature measurements per cow are summarized. HT, black dotted line, represents cows with a vaginal temperature above the median value within replicate. LT, golden dotted line, represents cows with vaginal temperature below the median value within replicate.
Preprints 110385 g003
Figure 4. Daily minutes (least squares means ± SEM) quantified as “high activity” by the ear tag sensor from d -21 through +21 (d 0 = calving) for cows classified either as high median (HT; black line) or low median (LT; golden line) core body temperature (CBT). Data collected during the prepartum and postpartum periods were analyzed separately. CBT = HT vs LT cows.
Preprints 110385 g004
Figure 5. Daily minutes (least squares means ± SEM) quantified as “general activity” by ear tag sensor from d -21 through +21 (d 0 = calving) for cows classified either as high median (HT; black line) or low median (LT; golden line) core body temperature (CBT). Data collected during the prepartum and postpartum periods were analyzed separately. CBT = HT vs LT cows.
Preprints 110385 g005
Figure 7. Daily minutes (least squares means ± SEM) quantified as “eating” by the ear tag sensor from d -21 through +21 (d 0 = calving) for cows classified either as high median (HT; black line) or low median (LT; golden line) core body temperature (CBT). Data collected during the prepartum and postpartum periods were analyzed separately. CBT = HT vs LT cows.
Preprints 110385 g006
Figure 8. Daily minutes (least squares means ± SEM) quantified as “ruminating” by the ear tag sensor from d -21 through +21 (d 0 = calving) for cows classified either as high median (HT; black line) or low median (LT; golden line) core body temperature (CBT). Data collected during the prepartum and postpartum periods were analyzed separately. CBT = HT vs LT cows.
Preprints 110385 g007
Figure 9. Average daily ear surface temperature (least squares means ± SEM) quantified by the ear tag sensor from d -21 through +21 (d 0 = calving) for cows with either high median (HT; gray line) or low median (LT; black line) core body temperature (CBT). Data collected during the prepartum and postpartum periods were analyzed separately. CBT = HT vs LT cows.
Preprints 110385 g008
Figure 10. Volcano plot (A) highlighting the 16 differently expressed genes (DEG; FDR < 0.05; Table 3) in white blood cells (WBC) from Holstein dry cows classified as either high median (HT) or low median (LT) core body temperature (CBT). Purple dots represent DEG (n = 5) that were downregulated in WBC of LT compared to HT cows, and turquoise dots represent the upregulated genes (n = 11) in WBC of LT compared to HT cows. Violin plots (B) illustrate expression levels of the top three (LTBP4, HP, and STX1A) upregulated genes in WBC of HT compared to LT cows. .
Preprints 110385 g009
Table 1. Prepartum descriptive data (mean ± SEM) of cows classified as having low (LT) or high (HT) core body temperature before calving1.
Core body temperature (CBT)1
Item LT HT P-value
Number of cows 25 25
Percentage of multiparous cows 52.0 72.0 0.15
Lactation number at enrollment 1.7 ± 0.1 2.2 ± 0.1 0.05
Average core body temperature, °C 38.70 ± 0.03 38.94 ± 0.03 < 0.01
Days in milk at dry off 316.8 ± 9.2 315.8 ± 9.2 0.94
Days of gestation at enrollment 225.8 ± 1.1 229.0 ± 1.1 0.04
Days spent in close-up pen 26.7 ± 1.1 23.8 ± 1.1 0.05
Gestation length, d 280.1 ± 0.8 278.0 ± 0.8 0.09
1Core body temperature group (CBT): LT = cows with vaginal temperature below the median value within replicate; HT = cows with vaginal temperature above the median value within replicate. Median values were calculated separately for each of 5 replicates based on core body temperature data collected during 7 d between d 225 and 239 of gestation.
Table 2. Least squares means ± SEM of percentage of daily time spent in each activity during the 2 h visual observations in the far-off and close-up pend.
Core Body Temperature2 P-value
Item Low Temperature (LT) High Temperature (HT) CBT Time3 CBT x Time Parity CBT x Parity
Far-off
  Lying, % 46.5 ± 2.8 41.6 ± 3.1 0.24 < 0.01 0.48 0.21 0.15
  Standing, % 26.7 ± 2.7 27.6 ± 3.1 0.85 < 0.01 0.39 0.81 0.81
  Eating, % 15.3 ± 1.6 18.6 ± 1.8 0.18 < 0.01 0.96 0.69 0.96
  Drinking, %4 2.24 ± 0.4 1.8 ± 0.5 0.18 < 0.01 0.02 0.67 0.91
  Perching, %4 10.1 ± 1.6 11.5 ± 1.8 0.66 0.37 0.67 0.85 0.59
Close-up
  Lying, % 47.2 ± 2.1 49.5 ± 2.5 0.49 < 0.01 0.31 0.84 0.21
  Standing, % 36.2 ± 2.4 29.7 ± 2.7 0.35 < 0.01 0.34 0.15 0.37
  Eating, % 16.1 ± 1.3 17.0 ± 1.6 0.66 < 0.01 0.61 0.32 < 0.01
  Drinking, %4 1.8 ± 0.3 2.1 ± 0.3 0.09 < 0.01 0.50 0.01 0.04
1Cows were observed for a total of two AM sessions and two PM sessions in the far-off and close-up pens. Cows were in the far-off pen between d 220 and 261 of gestation and in the close-up pen from d 247 to 285 of gestation. 2Core body temperature group (CBT): LT = cows with vaginal temperature below the median value within replicate; HT = cows with vaginal temperature above the median value within replicate. Median values were calculated separately for each of 5 replicates based on core body temperature data collected during 7 d between d 225 and 239 of gestation. 3AM observations occurred between 0600 and 0800 h and PM observations occurred between 1600 and 1800 h. 4Data were log-transformed for analysis. The mean ± SEM from the original data (not log-transformed) are presented in the table.
Table 3. List of differently expressed genes (DEG) in white blood cells (WBC) of cows classified as having low (LT) or high (HT) core body temperature before calving1.
Stable IDs2 Gene name Gene Description FPKM (HT)3 FPKM (LT)3 P-value FDR
Increased in HT
ENSBTAG00000004757 LTBP4 Latent transforming growth factor beta binding protein 4 6.1 ± 2.6 0.2 ± 0.05 6.41 x 10^-14 9.23 x 10^-10
ENSBTAG00000006354 HP Haptoglobin 69.0 ± 12.1 20.9 ± 4.1 5.83 x 10^-8 0.0004
ENSBTAG00000017075 STX1A Syntaxin 1A 2.2 ± 0.6 0.43 ± 0.24 1.88 x 10^-6 0.009
ENSBTAG000000586334 - Immunoglobulin-like domain-containing protein5 10.8 ± 3.2 4.3 ± 2.3 1.30 x 10^-5 0.038
ENSBTAG000000343664 RGS25 Regulator of g-protein signaling 25 24.6 ± 7.0 7.1 ± 1.8 3.19 x 10^-5 0.045
Increased in LT
ENSBTAG000000091104 THOC76 THO complex subunit 7 homolog6 0.6 ± 0.1 3.5 ± 1.0 1.27 x 10^-5 0.038
ENSBTAG00000044202 CNKSR2 Connector enhancer of kinasesuppressor of Ras 2 0.02 ± 0.02 0.09 ± 0.02 1.59 x 10^-5 0.038
ENSBTAG000000540864 - Immunoglobulin V-set domain-containing protein5 6.9 ± 1.6 34.4 ± 11.6 4.06 x 10^-5 0.045
ENSBTAG00000003458 CDCA7 Cell division cycle associated 7 17.8 ± 2.6 34.5 ± 3.0 3.60 x 10^-5 0.045
ENSBTAG00000040088 SLC9B2 solute carrier family 9 member B2 4.9 ± 2.0 13.3 ± 2.6 3.54 x 10^-5 0.045
ENSBTAG000000484234 - Ig-like domain-containing protein5 4.8 ± 2.3 12.12 ± 1.9 4.66 x 10^-5 0.045
ENSBTAG00000024269 TGFBR3 Transforming growth factor beta receptor 3 2.7 ± 0.5 6.1 ± 0.8 4.43 x 10^-5 0.045
ENSBTAG00000003675 ADGRL1 Adhesion G protein-coupled receptor L1 2.5 ± 0.7 5.2 ± 0.3 2.64 x 10^-5 0.045
ENSBTAG00000059156 PEG10 Paternally expressed 10 1.2 ± 0.7 3.1 ± 0.8 4.54 x 10^-5 0.045
ENSBTAG00000018726 RIMS3 Regulating synaptic membrane exocytosis 3 0.3 ± 0.1 1.5 ± 0.4 3.43 x 10^-5 0.045
ENSBTAG00000007772 SLC29A4 Solute carrier family 29 member 4 0.1 ± 0.1 1.3 ± 0.5 5.02 x 10^-5 0.045
1 Core body temperature group (CBT): LT = cows with vaginal temperature below the median value within replicate. HT = cows with vaginal temperature above the median value within replicate. Median values were calculated separately for each of 5 replicates based on core body temperature data collected during 7 d between d 225 and 239 of gestation.2 Ensembl stable IDs (https://useast.ensembl.org/). 3 FPKM data is presented as mean ± SEM. 4 Gene name and description were unavailable in the Ensembl database (uncharacterized genes). 5 Protein information obtained from UniProt (https://www.uniprot.org/) matching Ensembl stable IDs.6Gene information obtained from the Innate DB database (https://innatedb.com/) matching Ensembl stable IDs.
Disclaimer/Publisher’s Note: The statements, opinions and data contained in all publications are solely those of the individual author(s) and contributor(s) and not of MDPI and/or the editor(s). MDPI and/or the editor(s) disclaim responsibility for any injury to people or property resulting from any ideas, methods, instructions or products referred to in the content.
Copyright: This open access article is published under a Creative Commons CC BY 4.0 license, which permit the free download, distribution, and reuse, provided that the author and preprint are cited in any reuse.
Prerpints.org logo

Preprints.org is a free preprint server supported by MDPI in Basel, Switzerland.

Subscribe

© 2024 MDPI (Basel, Switzerland) unless otherwise stated