Submitted:
25 June 2024
Posted:
27 June 2024
You are already at the latest version
Abstract
Keywords:
1. Introduction
2. Materials and Methods
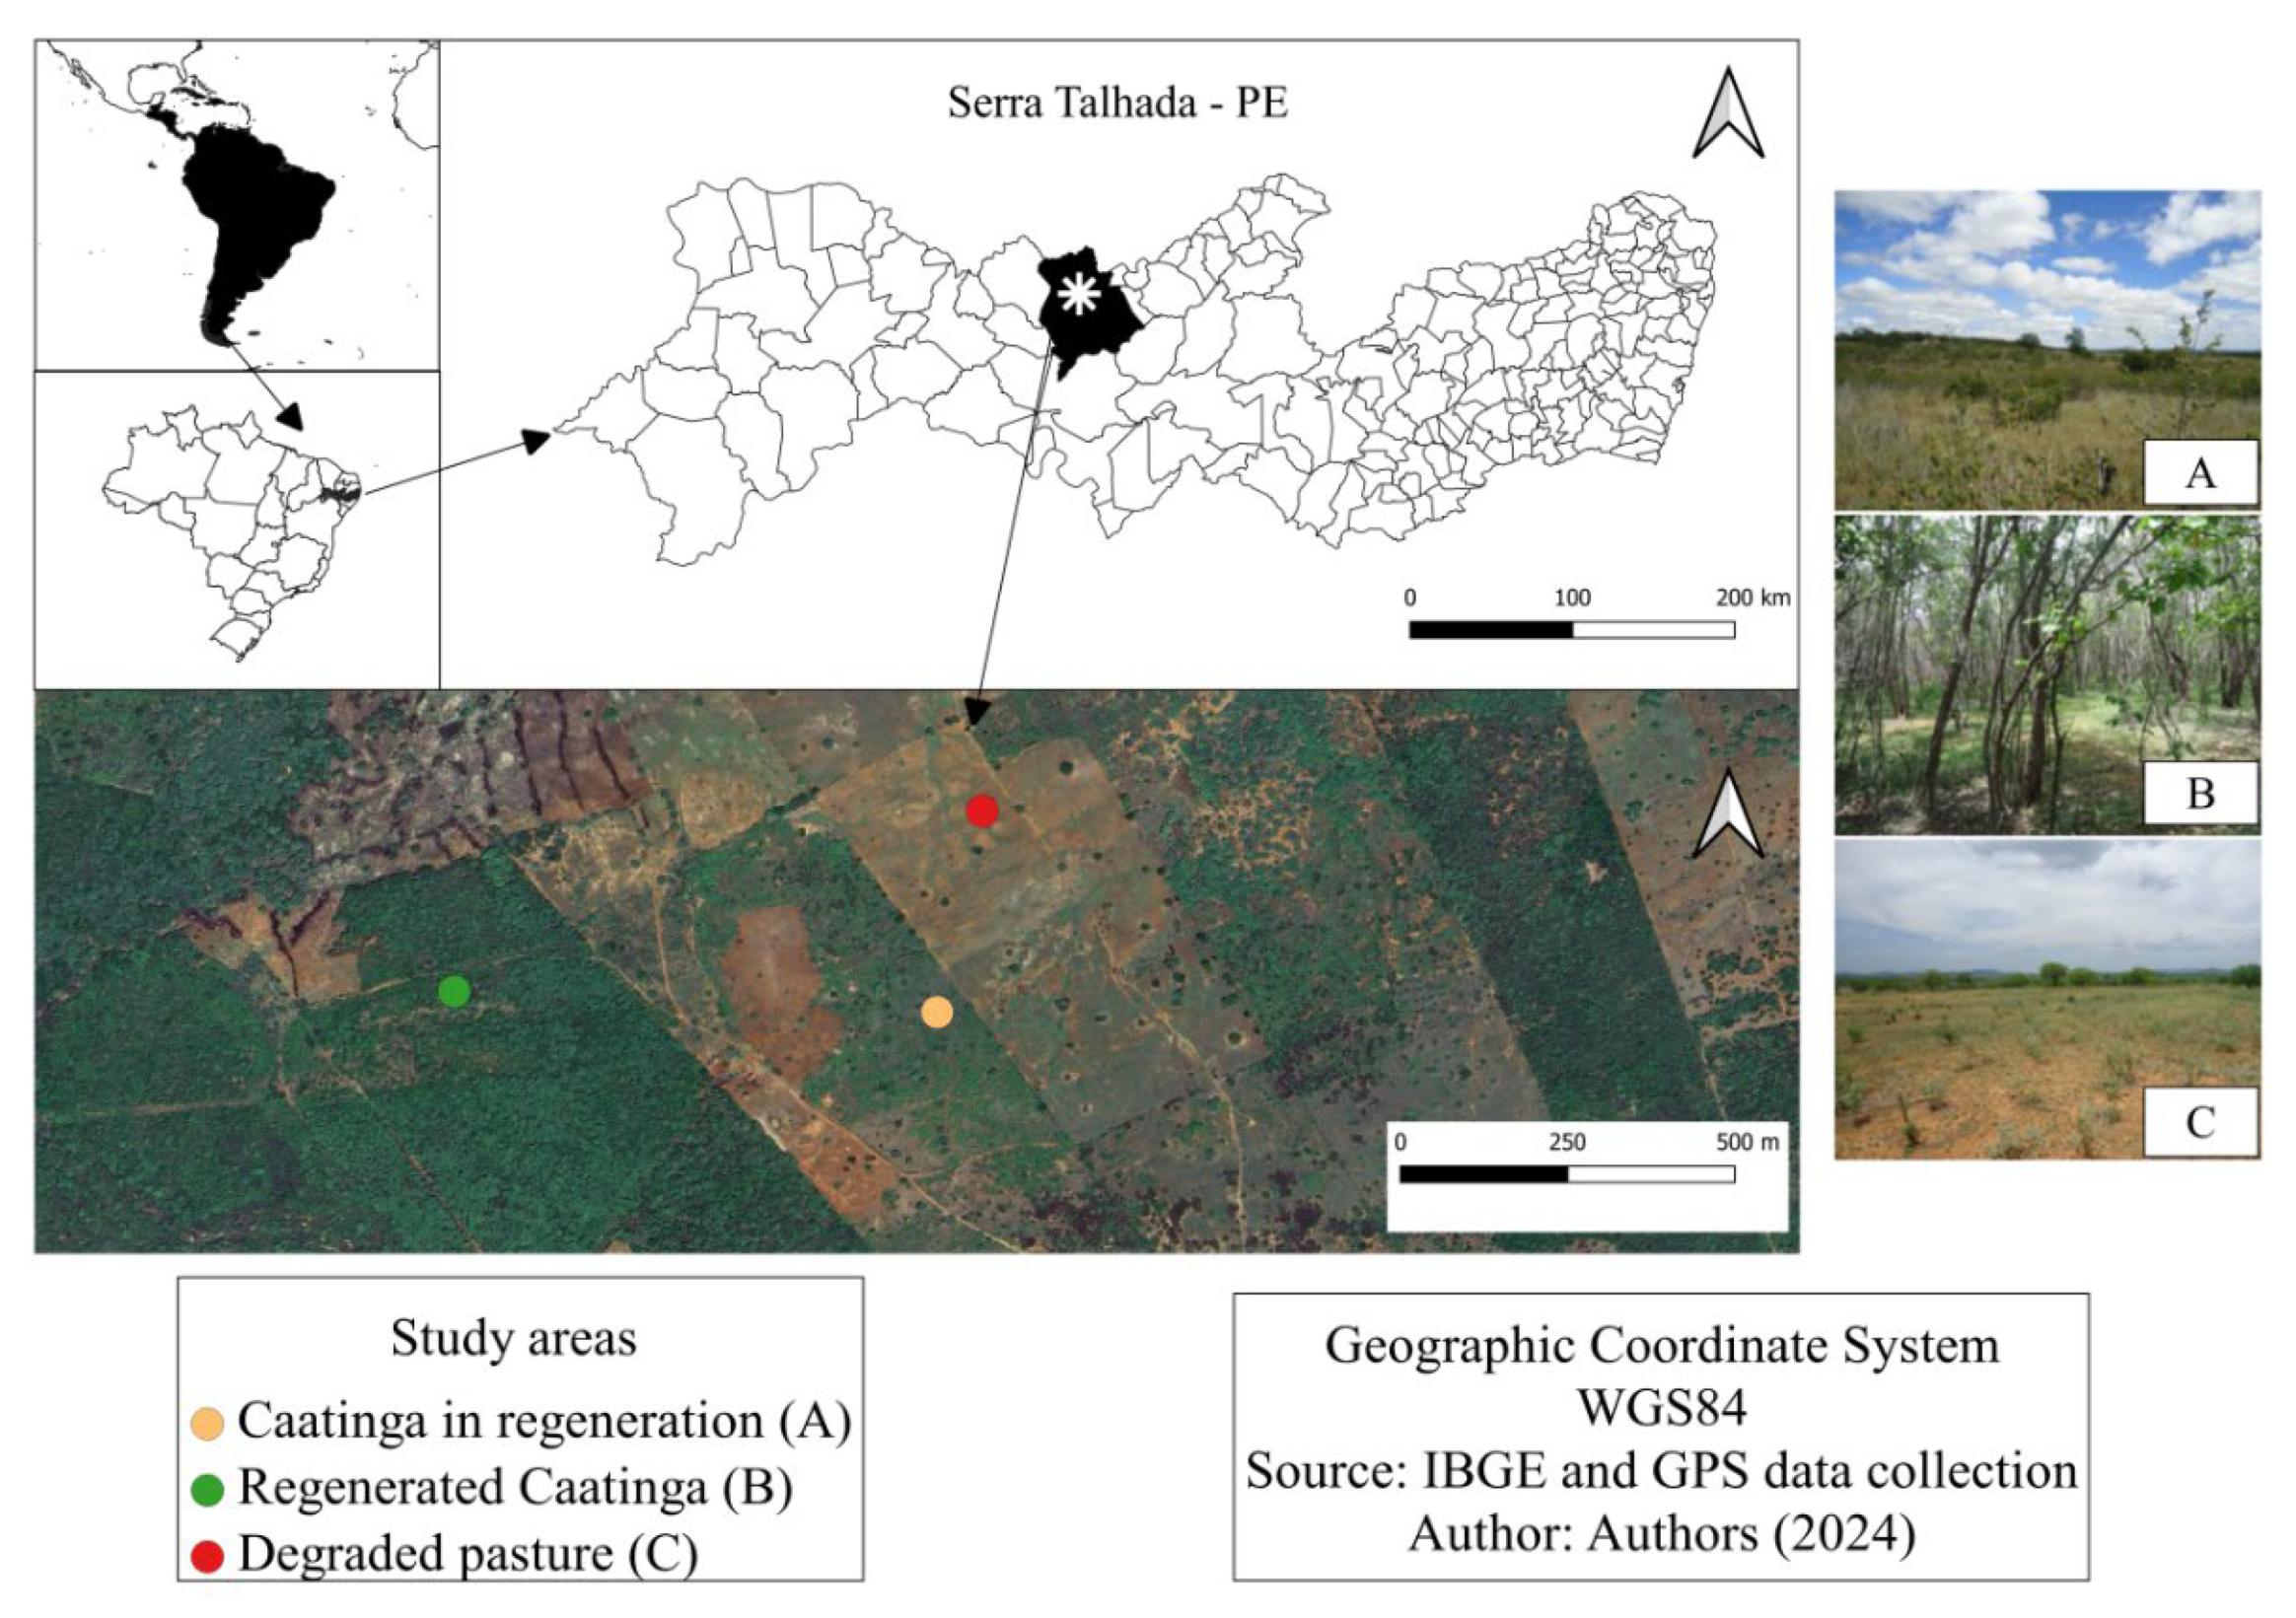
2.1. Study Area
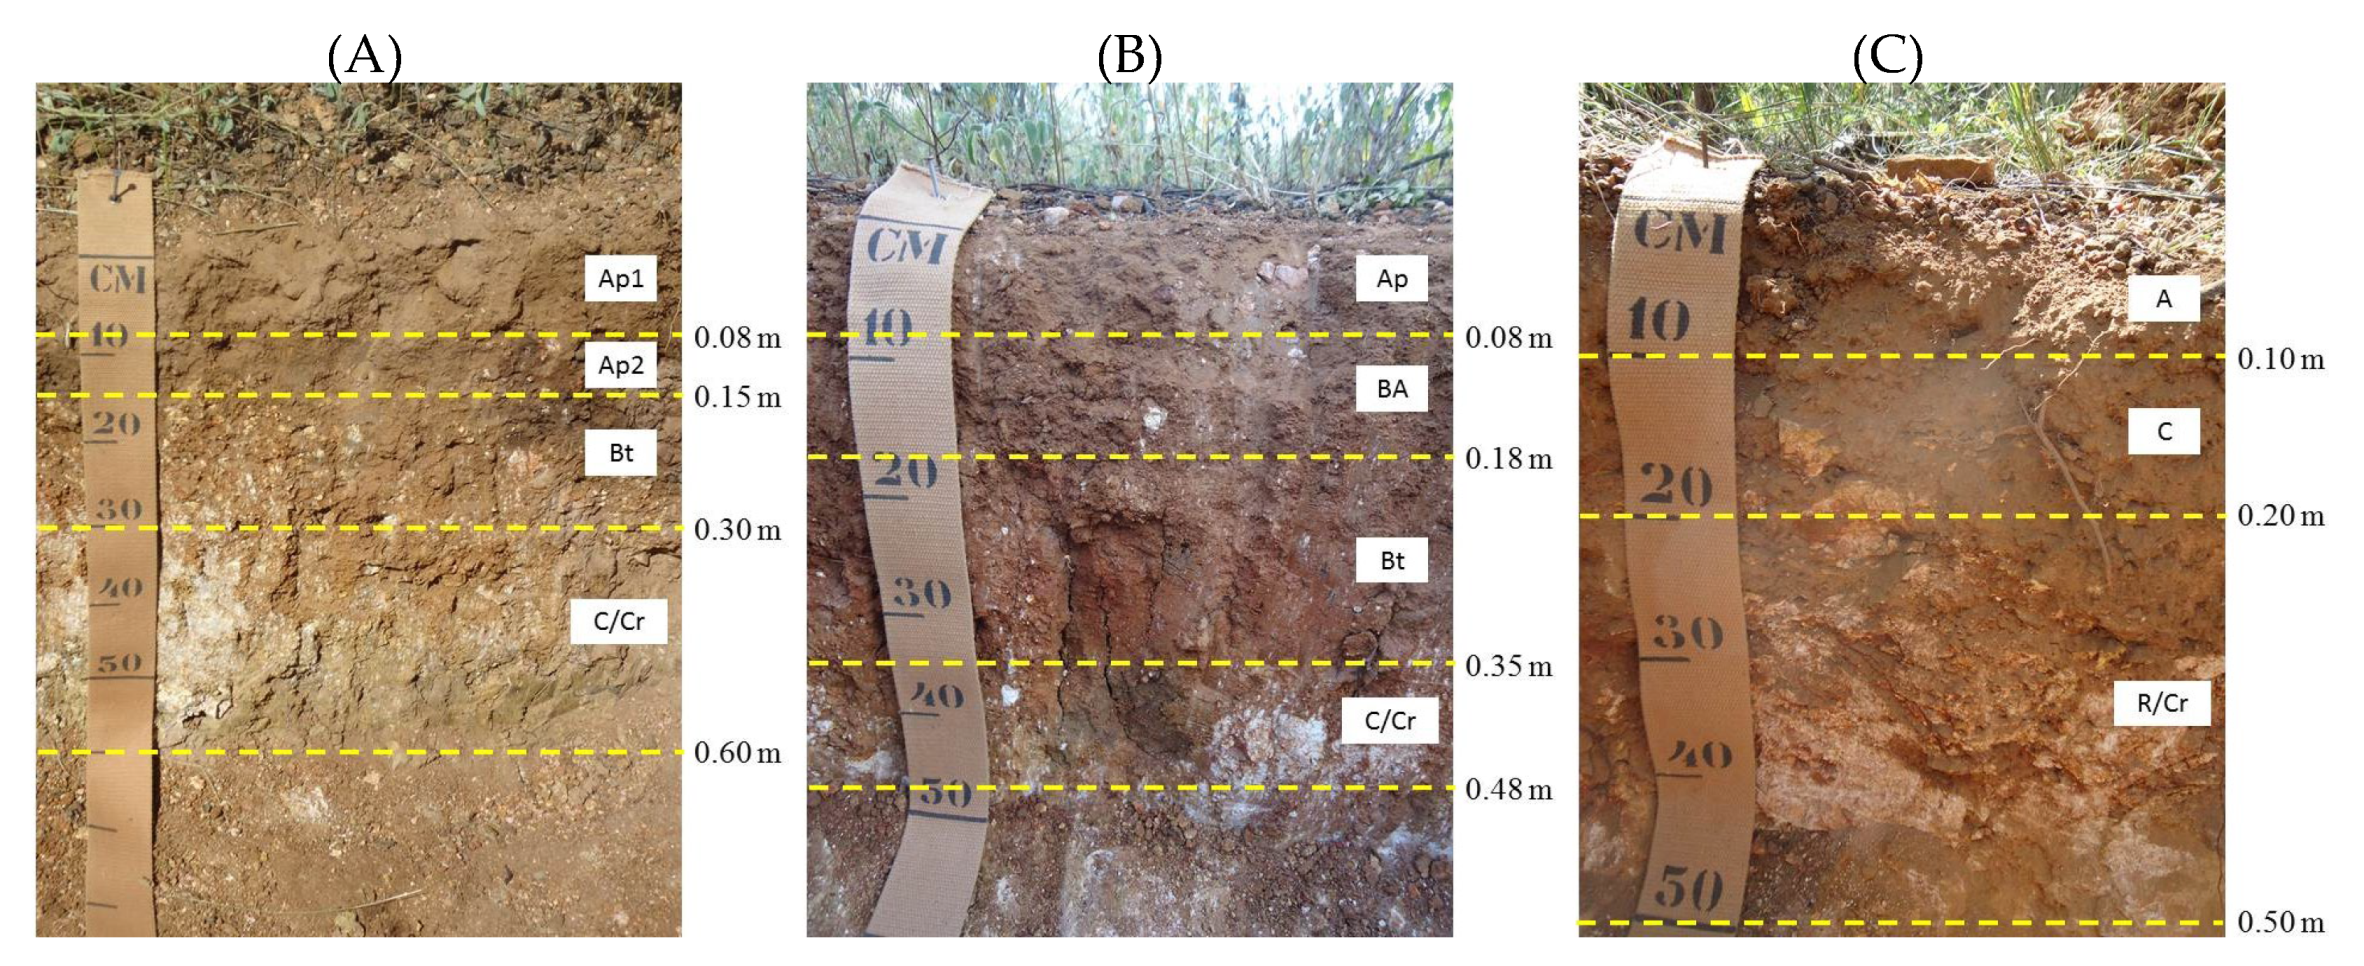
2.2. Soil Sampling
2.3. Chemical and Physical Properties Analysis
2.4. SOC, P and N Stocks
2.5. Statistical Analysis
3. Results
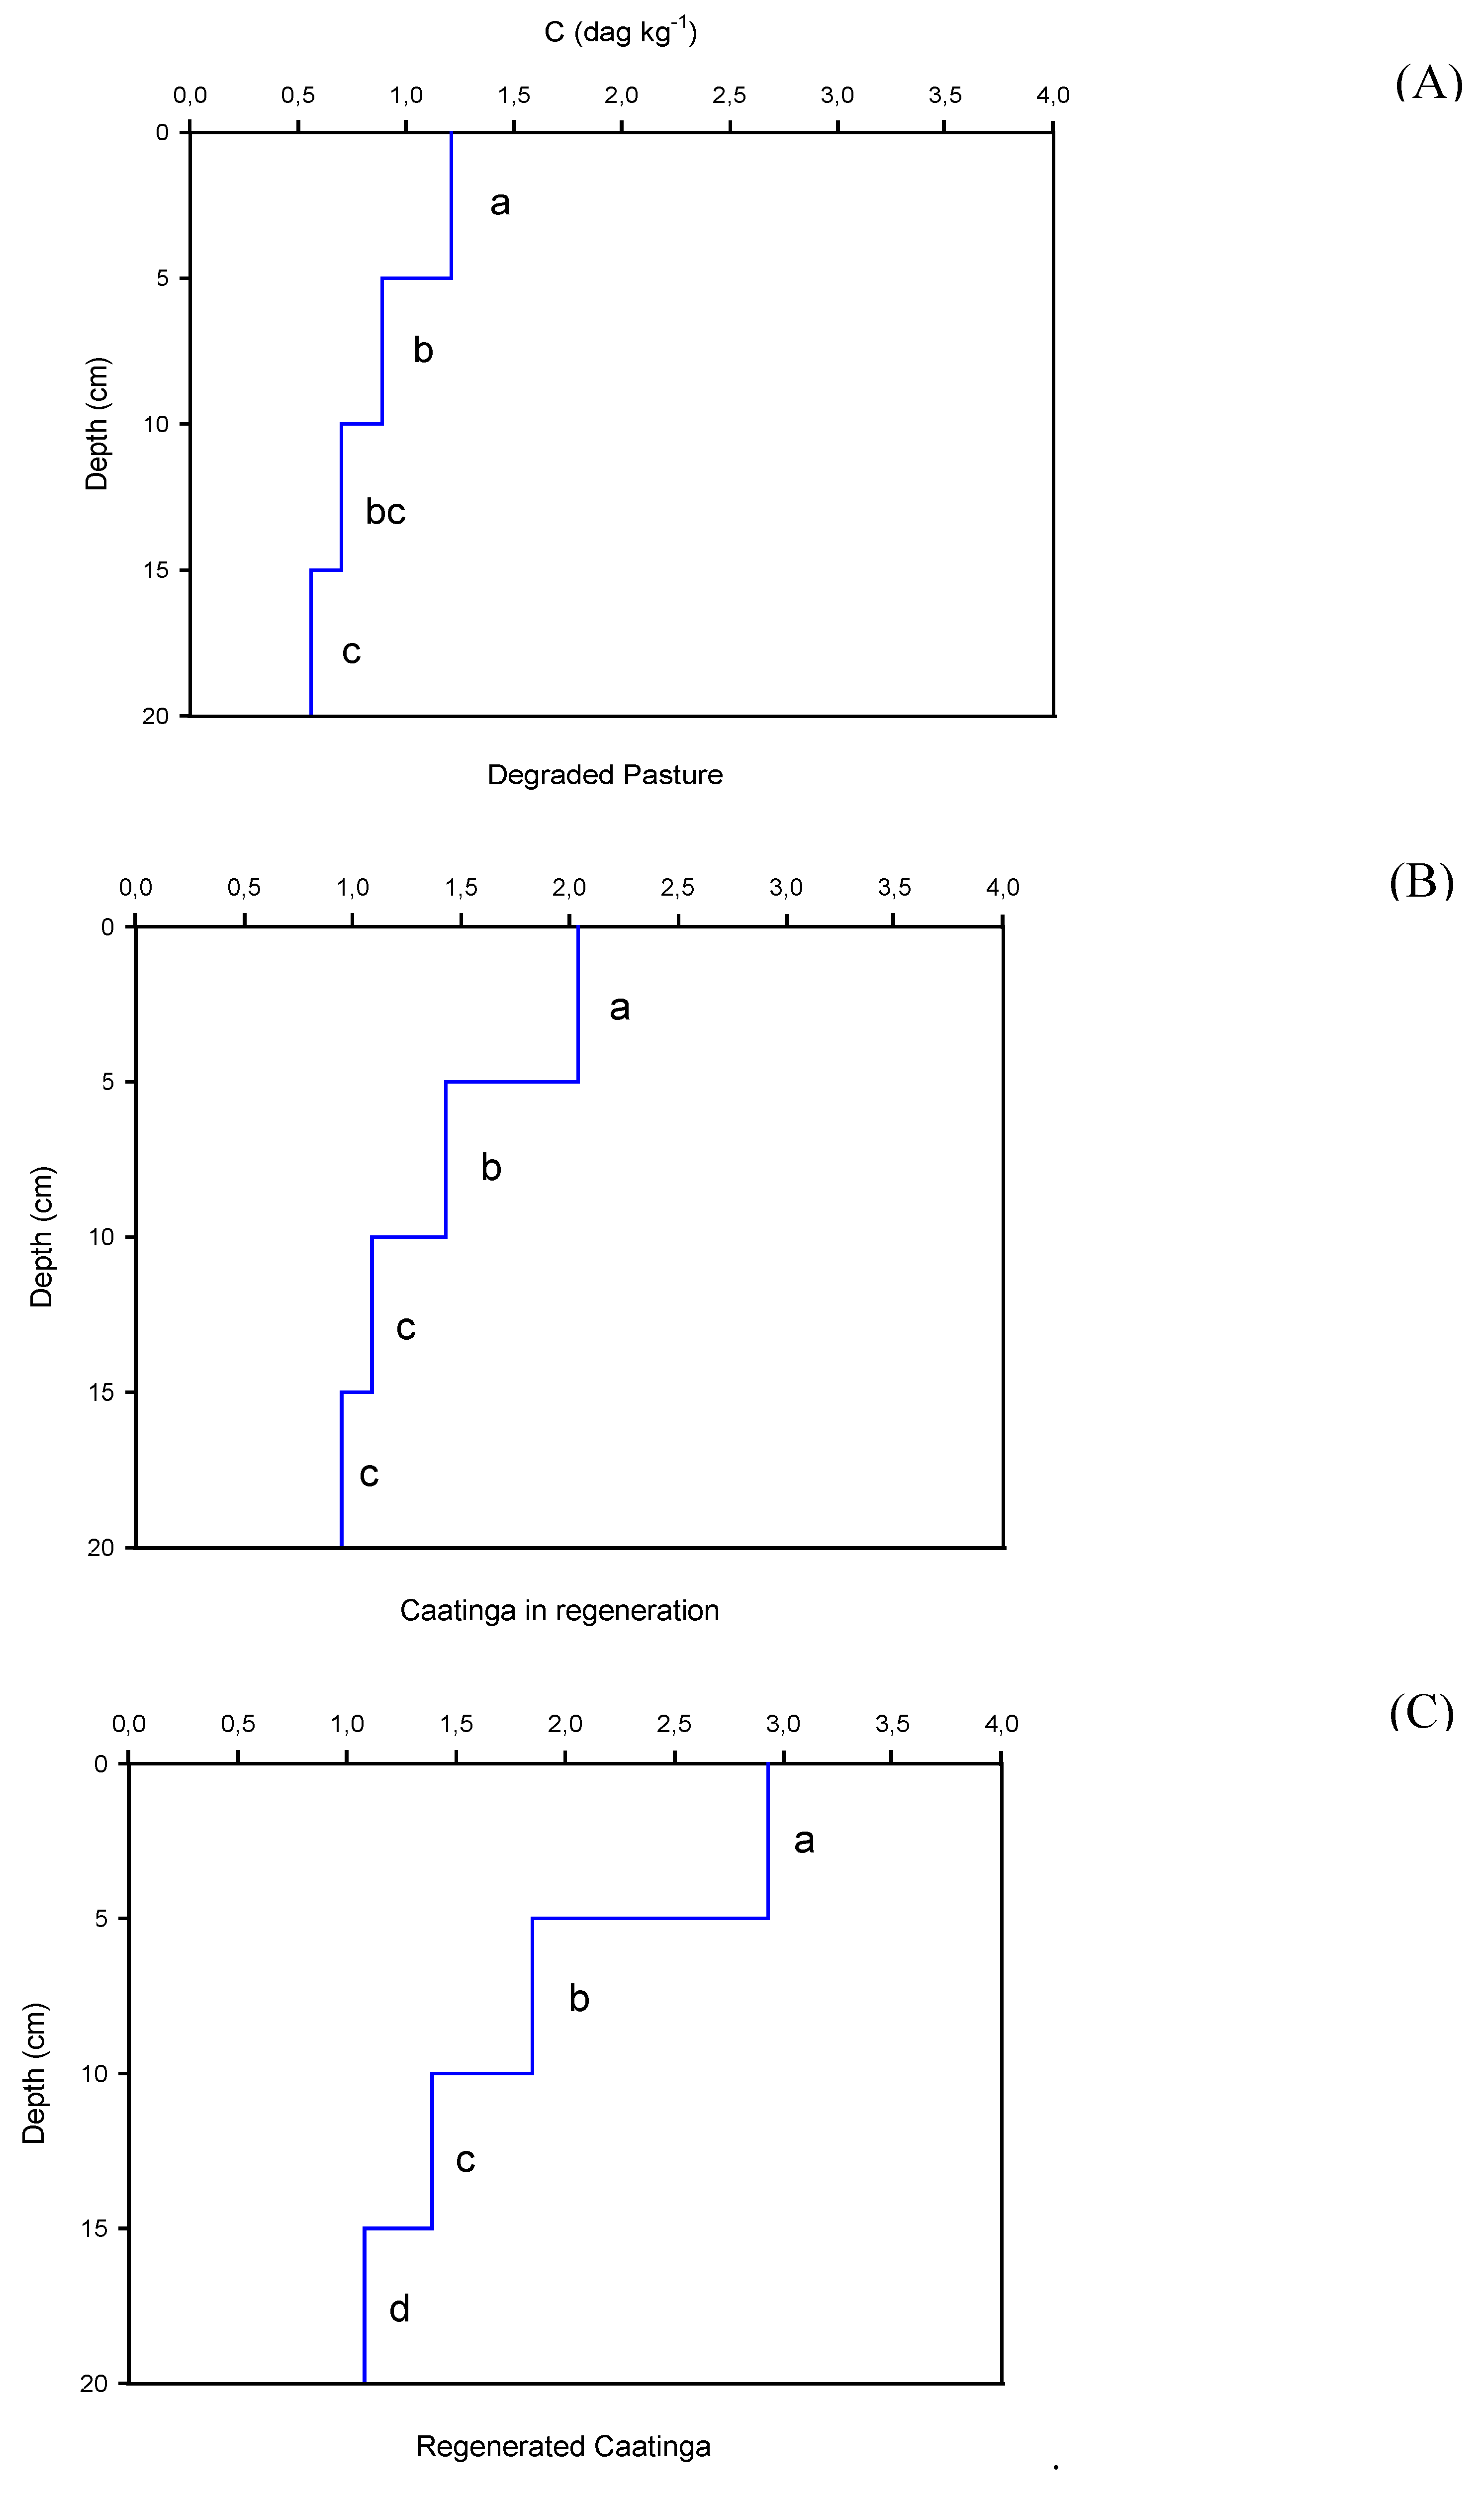
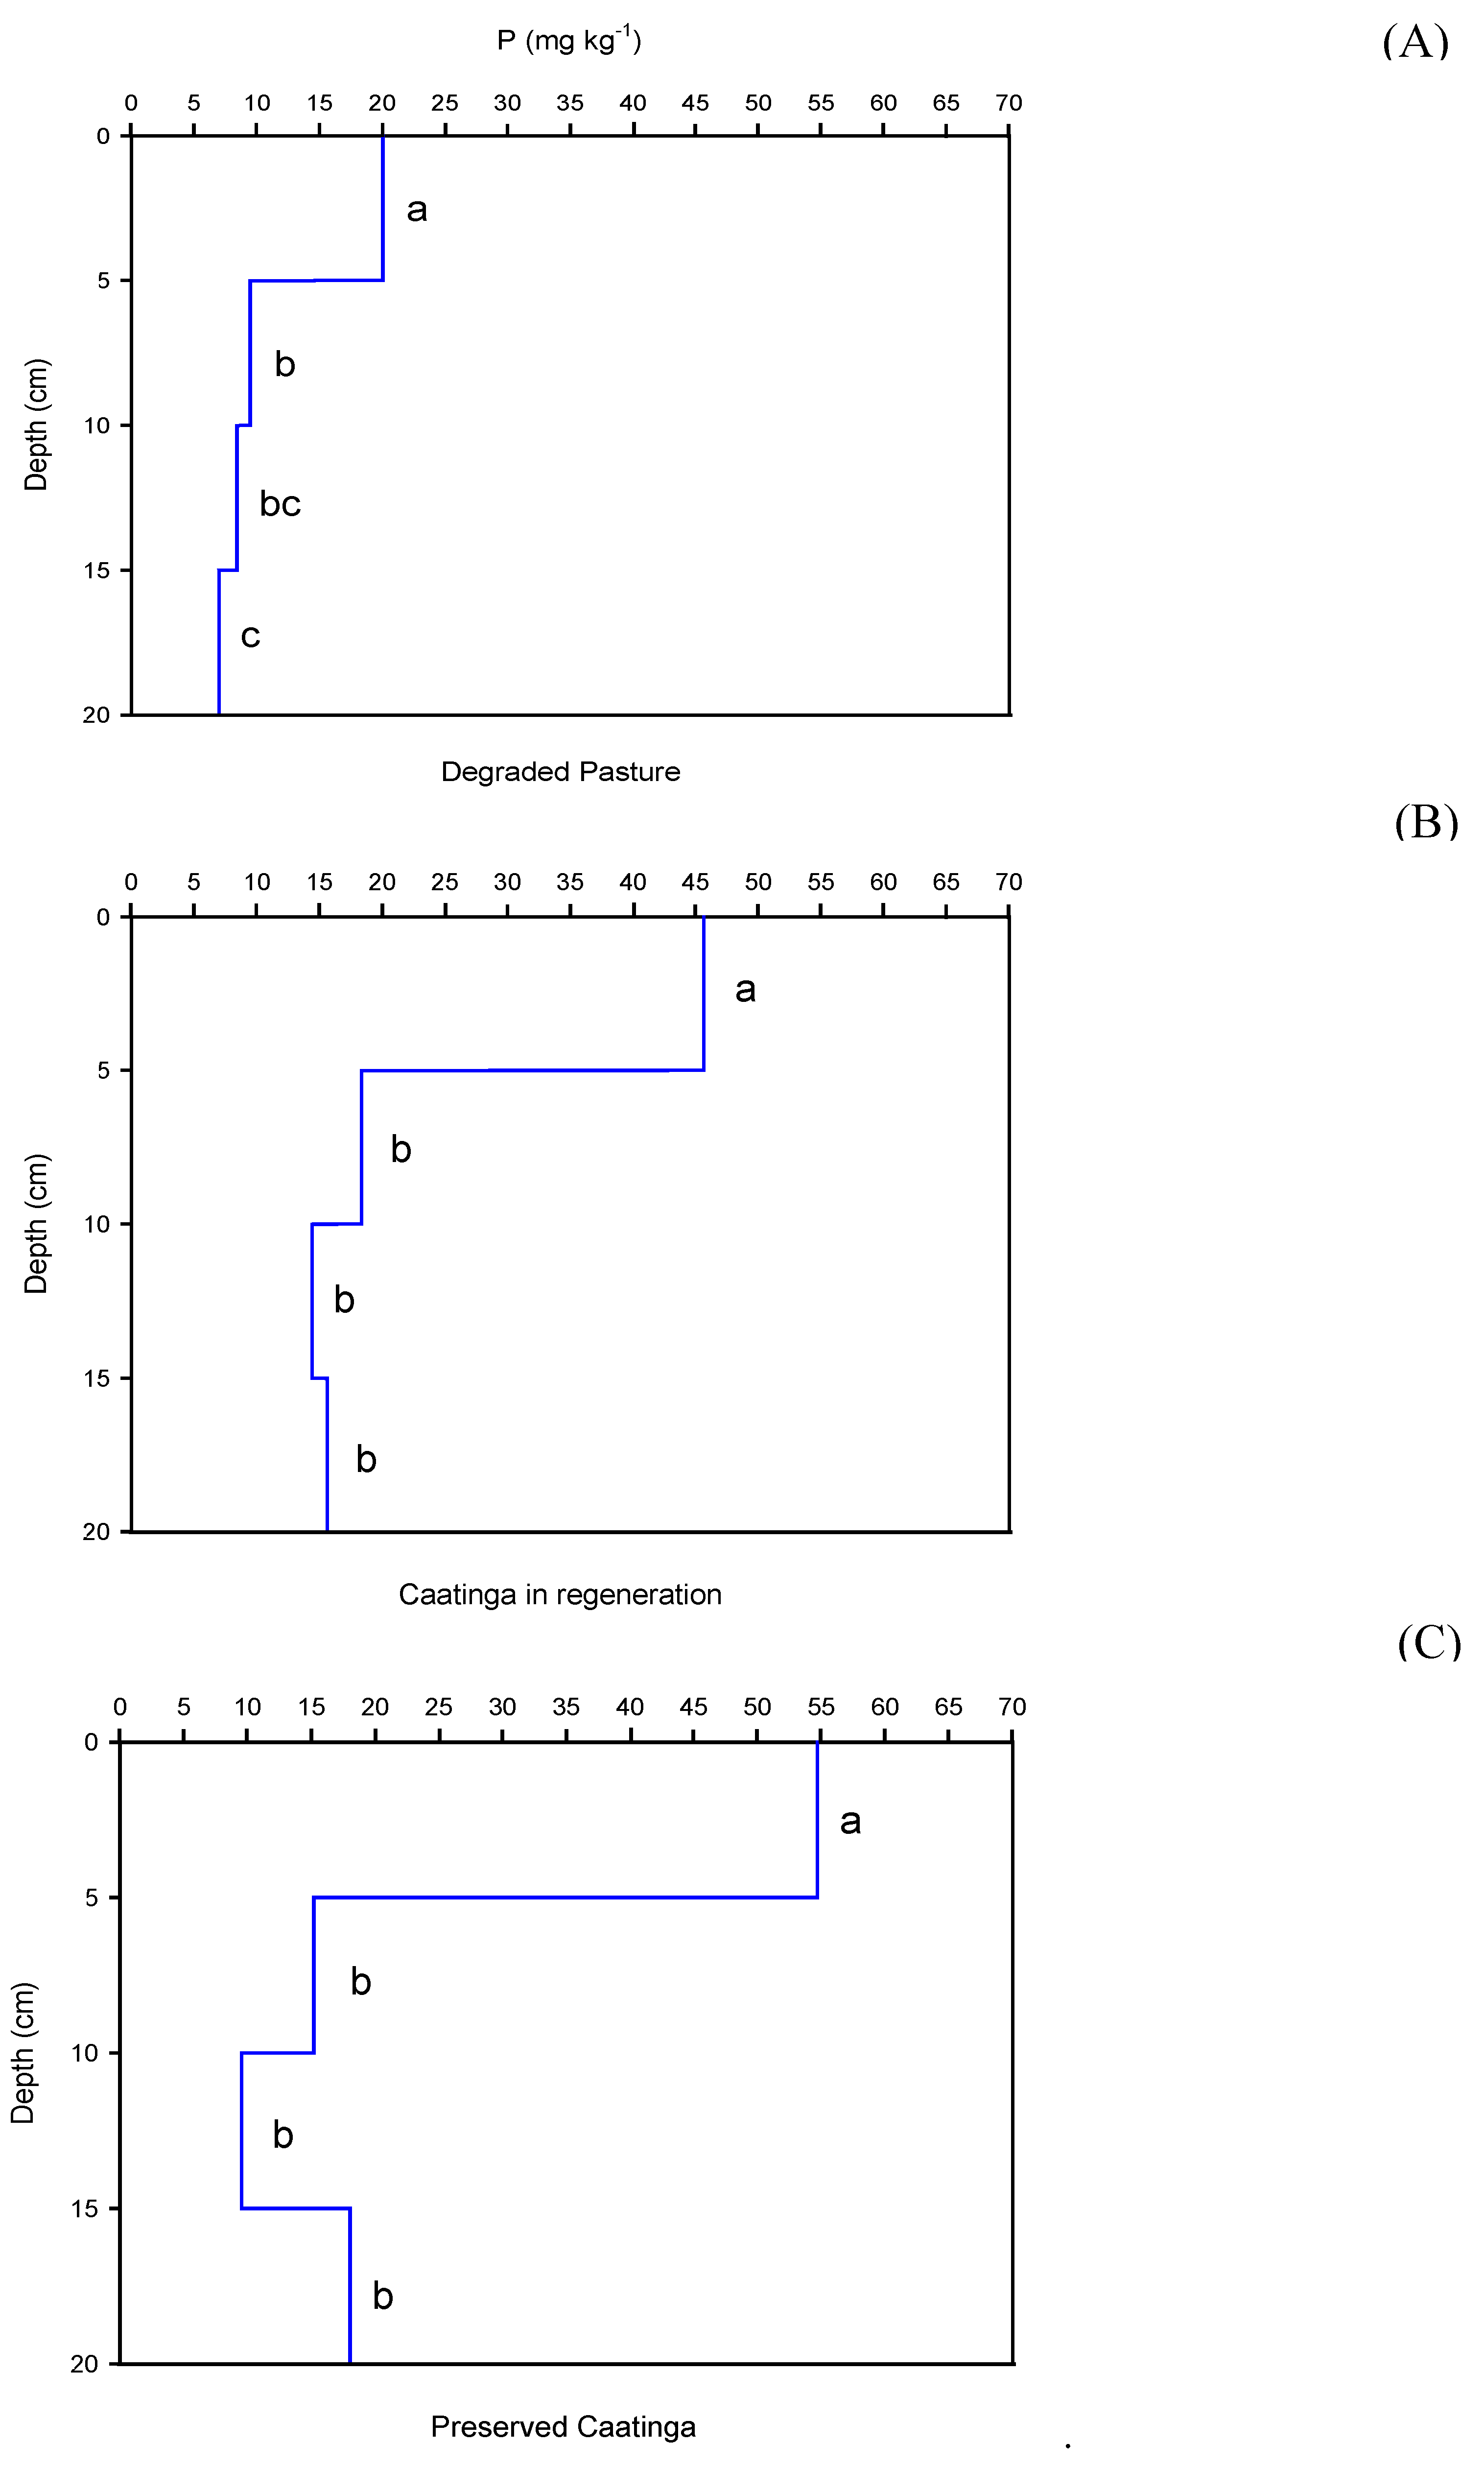
3.1. Effects of Caatinga Natural Regeneration on SOC, P and N Distribution
3.2. SOC, P and N Concentrations as Influenced by Caatinga Natural Regeneration
3.3. SOC, P and N Stocks
4. Discussion
5. Conclusions
Author Contributions
Funding
Institutional Review Board Statement
Data Availability Statement
Acknowledgments
Conflicts of Interest
References
- Soper, F.M.; McCalley, C.K.; Sparks, K.; Sparks, J.P. Soil carbon dioxide emissions from the Mojave desert: Isotopic evidence for a carbonate source. Geophys. Res. Lett. 2017, 44, 245–251. [Google Scholar] [CrossRef]
- Powers, J.S.; Feng, X.; Sanchez-Azofeifa, A.; Medvigy, D. Focus on tropical dry forest ecosystems and ecosystem services in the face of global change. Environ. Res. Lett. 2018, 13, 1–5. [Google Scholar] [CrossRef]
- Chapuis-Lardy, L.; Wrage, N.; Metay, A.; Chotte, J.; Bernoux, M. Soils, a sink for N2O? A review. Glob. Chang. Biol. 2007, 13, 1–17. [Google Scholar] [CrossRef]
- Kirschbaum, M.U.F. To sink or burn? A discussion of the potential contributions of forests to greenhouse gas balances through storing carbon or providing biofuels. Biomass and Bioenergy 2003, 24, 297–310. [Google Scholar] [CrossRef]
- Tabarelli, M.; Filgueiras, B.K.C.; Ribeiro, E.M.S.; Lopes, A.V.; Leal, I.R. Tropical dry forests. in Encyclopedia of Biodiversity, Elsevier, 2024, 294–312. [CrossRef]
- Fernandes, M.F.; Cardoso, D.; Queiroz, L.P. An updated plant checklist of the Brazilian Caatinga seasonally dry forests and woodlands reveals high species richness and endemism. J. Arid Environ. 2020, 174, 1–10. [Google Scholar] [CrossRef]
- Koch, R.; Almeida-Cortez, J.S.; Kleinschmit, B. Revealing areas of high nature conservation importance in a seasonally dry tropical forest in Brazil: Combination of modelled plant diversity hot spots and threat patterns. J. Nat. Conserv. 2017, 35, 24–39. [Google Scholar] [CrossRef]
- Leal, I.R.; Silva, J.M.C.; Tabarelli, M.; Lacher, T.E. Changing the course of biodiversity conservation in the caatinga of northeastern Brazil. Conserv. Biol. 2005, 19, 701–706. [Google Scholar] [CrossRef]
- Santos, M.G.; Oliveira, M.T.; Figueiredo, K.V.; Falcao, H.M.; Arruda, E.C.; Almeida-Cortez, J.; Antonino, A.C. Caatinga, the Brazilian dry tropical forest: can it tolerate climate changes? Theor. Exp. Plant Physiol. 2014, 26, 83–99. [Google Scholar] [CrossRef]
- Almeida, C.L.; Araújo, J.C.; Costa, M.C.G.; Almeida, A.M.M.; Andrade, E.M. Fallow reduces soil losses and increases carbon stock in Caatinga. Floresta e Ambient. 2017, 24, 1–10. [Google Scholar] [CrossRef]
- Oliveira Filho, J.S.; Vieira, J.N.; Silva, E.M.R.; Oliveira, J.G.B.; Pereira, M.G.; Brasileiro, F.G. Assessing the effects of 17 years of grazing exclusion in degraded semi-arid soils: Evaluation of soil fertility, nutrients pools and stoichiometry. J. Arid Environ. 2019, 166, 1–10. [Google Scholar] [CrossRef]
- Silva, A.R.A.; Bezerra, F.M.L.; Lacerda, C.F.; Sousa, C.H.C.; Bezerra, M.A. Physiological responses of dwarf coconut plants under water deficit in salt-affected soils. Rev. Caatinga 2017, 30, 447–457. [Google Scholar] [CrossRef]
- Sousa, F.P.; Ferreira, T.O.; Mendonça, E.S.; Romero, R.E.; Oliveira, J.G.B. Carbon and nitrogen in degraded Brazilian semi-arid soils undergoing desertification. Agric. Ecosyst. Environ. 2012, 148, 11–21. [Google Scholar] [CrossRef]
- Dong, L.; Li, J.; Sun, J.; Yang, C. Soil degradation influences soil bacterial and fungal community diversity in overgrazed alpine meadows of the Qinghai-Tibet Plateau. Sci. Rep. 2021, 11, 1–11. [Google Scholar] [CrossRef]
- Li, Y.; Wang, S.; Jiang, L.; Zhang, L.; Cui, S.; Meng, F.; Zhou, Y. Changes of soil microbial community under different degraded gradients of alpine meadow. Agric. Ecosyst. Environ. 2016, 222, 213–222. [Google Scholar] [CrossRef]
- Wang, L. Delgado-Baquerizo, M.; Zhao, X.; Zhang, M.; Song, Y.; Cai, J.; Xin, X. Livestock overgrazing disrupts the positive associations between soil biodiversity and nitrogen availability. Funct. Ecol. 2020, 34, 1713–1720. [Google Scholar] [CrossRef]
- Zhou, H.; Zhang, D.; Jiang, Z.; Sun, P.; Xiao, H.; Yuxin, W.; Chen, J. Changes in the soil microbial communities of alpine steppe at Qinghai-Tibetan Plateau under different degradation levels. Sci. Total Environ. 2019, 651, 2281–2291. [Google Scholar] [CrossRef] [PubMed]
- Macedo, R.S.; Moro, L.; Lambais, É.O.; Lambais, G.R.; Bakker, A.P. Effects of degradation on soil attributes under caatinga in the Brazilian semi-arid. Rev. Árvore 2023, 47, 1–11. [Google Scholar] [CrossRef]
- Gava, C.A.T.; Giongo, V.; Signor, D.; Fernandes-Júnior, P.I. Land-use change alters the stocks of carbon, nitrogen, and phosphorus in a Haplic Cambisol in the Brazilian semi-arid region. Soil Use Manag. 2022, 38, 953–963. [Google Scholar] [CrossRef]
- Cheng, H.; Zhou, X.; Dong, R.; Wang, X.; Liu, G.; Li, Q. Natural vegetation regeneration facilitated soil organic carbon sequestration and microbial community stability in the degraded karst ecosystem. CATENA 2023, 222, 1–10. [Google Scholar] [CrossRef]
- Souza, R.; Feng, X.; Antonino, A.; Montenegro, S.; Souza, E.; Porporato, A. Vegetation response to rainfall seasonality and interannual variability in tropical dry forests. Hydrol. Process. 2016, 30, 3583–3595. [Google Scholar] [CrossRef]
- Lin, Y.-H.; Lee, P.-C.; Menyailo, O.V.; Cheng, C.-H. Changes in soil organic carbon concentration and stock after forest regeneration of agricultural fields in Taiwan. Forests 2021, 12, 1–12. [Google Scholar] [CrossRef]
- Olsen, S.R.; Cole, C.V.; Watandbe, F.; Dean, L. Estimation of available phosphorus in soil by extraction with sodium bicarbonate; US Department of Agriculture, 1954; Volume 53.
- USSL. Diagnosis and Improvement of Saline and Alkali Soils, vol. 46, no. 6. Washington, 1954. [CrossRef]
- Mendonça, E.S.; Matos, E.S. Matéria orgânica do solo: métodos de análises. Universidade Federal de Viçosa, Brasil, Viçosa - MG, 2005, pag. 81.
- EMBRAPA, Manual de métodos de análise de solos. 3rd ed. Embrapa, Rio de Janeiro, Brazil, 2017.
- Carvalho, J.L.N.; Cerri, C.E.P.; Feigl, B.J.; Píccolo, M.C.; Godinho, V.P.; Cerri, C.C. Carbon sequestration in agricultural soils in the Cerrado region of the Brazilian Amazon. Soil Tillage Res. 2009, 103, 342–349. [Google Scholar] [CrossRef]
- Don, A.; Schumacher, J.; Freibauer, A. Impact of tropical land-use change on soil organic carbon stocks - a meta-analysis. Glob. Chang. Biol. 2011, 17, 1658–1670. [Google Scholar] [CrossRef]
- Ellert, B.H.; Bettany, J.R. Calculation of organic matter and nutrients stored in soils under contrasting management regimes. Can. J. Soil Sci. 1995, 75, 529–538. [Google Scholar] [CrossRef]
- Pessoa, L.G.M.; Miranda, M.F.A.; Calheiros, A.S.; Freire, F.J.; Freire, M.B.G.S.; Barbosa, M.D. Marangon, L.C. Soil and litter properties from a riparian to non-riparian zone in a tropical dry forest. J. Environ. Anal. Prog 2023, 285–298. [Google Scholar] [CrossRef]
- Ebrahimi, M.; Khosravi, H.; Rigi, M. Short-term grazing exclusion from heavy livestock rangelands affects vegetation cover and soil properties in natural ecosystems of southeastern Iran. Ecol. Eng. 2016, 95, 10–18. [Google Scholar] [CrossRef]
- Schulz, K.; Voigt, K.; Beusch, C.; Almeida-Cortez, J.S.; Kowarik, I.; Walz, A.; and Cierjacks, A. Grazing deteriorates the soil carbon stocks of Caatinga forest ecosystems in Brazil. For. Ecol. Manage. 2016, 367, 62–70. [Google Scholar] [CrossRef]
- Berhongaray, G.; Alvarez, R. Soil carbon sequestration of Mollisols and Oxisols under grassland and tree plantations in South America - A review. Geoderma Reg. 2019, 18, 1–10. [Google Scholar] [CrossRef]
- Hewins, D.B.; Lyseng, M.P.; Schoderbek, D.F.; Alexander, M.; Willms, W.D.; Carlyle, C.N.; Bork, E.W. Grazing and climate effects on soil organic carbon concentration and particle-size association in northern grasslands. Sci. Rep. 2018, 8, 1–9. [Google Scholar] [CrossRef]
- Stockmann, U.; Adams, M.A.; Crawford, J.W.; Field, D.J.; Henakaarchchi, N.; Jenkins, M.; Zimmermann, M. The knowns, known unknowns and unknowns of sequestration of soil organic carbon. Agric. Ecosyst. Environ. 2013, 164, 80–99. [Google Scholar] [CrossRef]
- Azevedo, A.D.; Camara, R.; Francelino, M.R.; Pereira, M.G.; Leles, P.S.S. Estoque de carbono em áreas de restauração florestal da mata atlântica. FLORESTA 2018, 48, 1–12. [Google Scholar] [CrossRef]
- Villela, D.; Mattos, E.; Pinto, A.; Vieira, S.; Martinelli, L. Carbon and nitrogen stock and fluxes in coastal Atlantic Forest of southeast Brazil: potential impacts of climate change on biogeochemical functioning. Brazilian J. Biol. 2012, 72, 633–642. [Google Scholar] [CrossRef] [PubMed]
- Althoff, T.D.; Menezes, R.S.C.; Pinto, A.S.; Pareyn, F.G.C.; Carvalho, A.L.; Martins, J.C.R.; Sampaio, E.V.D.S.B. Adaptation of the century model to simulate C and N dynamics of Caatinga dry forest before and after deforestation. Agric. Ecosyst. Environ. 2018, 254, 26–34. [Google Scholar] [CrossRef]
- Araújo Filho, R.N.; Freire, M.B.G.S.; Wilcox, B.P.; West, J.B.; Freire, F.J.; Marques, F.A. Recovery of carbon stocks in deforested caatinga dry forest soils requires at least 60 years. For. Ecol. Manage. 2018, 407, 210–220. [Google Scholar] [CrossRef]
| Study area | pH | Ca2+ | Mg2+ | Na+ | K+ | CEC1 | CS2 | TS3 | Silt | Clay |
|---|---|---|---|---|---|---|---|---|---|---|
| ________________ cmolc kg-1 ________________ | ______________ % _____________ | |||||||||
| Degraded Pasture | 6.78 | 16.38 | 4.99 | 0.44 | 0.41 | 22.22 | 38.8 | 20.8 | 21.8 | 18.6 |
| Caatinga in regeneration | 6.95 | 15.33 | 2.91 | 0.28 | 0.39 | 18.91 | 43.2 | 20.6 | 18.8 | 17.4 |
| Regenerated Caatinga | 6.48 | 11.96 | 1.81 | 0.31 | 0.41 | 14.48 | 50.2 | 22.2 | 17.4 | 10.2 |
| pH | Ca2+ | Mg2+ | Na+ | K+ | TS2 | CS3 | Silt | Clay | |
|---|---|---|---|---|---|---|---|---|---|
| SOC1 | -0.24 | -0.51 | -0.94 | -0.55 | -0.53 | 0.45 | 0.98 | -0.99* | 0.93* |
| P | 0.15 | -0.13 | -0.99* | -0.83* | -0.44 | 0.69 | 0.82 | -0.94* | 0.72* |
| N | -0.19 | -0.46 | -0.96 | -0.59 | -0.11 | 0.40 | 0.96 | -0.99* | 0.91* |
Disclaimer/Publisher’s Note: The statements, opinions and data contained in all publications are solely those of the individual author(s) and contributor(s) and not of MDPI and/or the editor(s). MDPI and/or the editor(s) disclaim responsibility for any injury to people or property resulting from any ideas, methods, instructions or products referred to in the content. |
© 2024 by the authors. Licensee MDPI, Basel, Switzerland. This article is an open access article distributed under the terms and conditions of the Creative Commons Attribution (CC BY) license (http://creativecommons.org/licenses/by/4.0/).


