Preprint
Article

Relationship between Modern ART Regimens and Immunosenescence Markers in Patients with Chronic HIV Infection

Altmetrics

Downloads

134

Views

43

Comments

0

A peer-reviewed article of this preprint also exists.

Submitted:

25 June 2024

Posted:

27 June 2024

You are already at the latest version

Alerts
Abstract
The increased life expectancy of PLHIV (People Living with HIV) and the successful highly com-bined antiretroviral therapy (cART) poses new clinical challenges regarding aging and its co-morbid condition. It is commonly believed that HIV infection "accelerates" aging. Human immunodeficiency virus type 1 (HIV-1) infection is characterised by inflammation and immune activation that persists despite cART and that may contribute to the development of co-morbid conditions. Toxicity associated with cART contributes to persistent immune dysregulation. Therefore, we aimed to compare current cART regimens in the light of premature aging to evaluate residual immune activation and inflammation in virologically suppressed patients. We studied a panel of biomarkers (IFN-γ, IL-1β, IL-12p70, IL-2, IL-4, IL-5, IL-6, IL-13, IL-18, GM-CSF, TNF-α, C-reactive protein, D-dimer, soluble CD14), which could provide a non-invasive and af-fordable approach to monitor HIV-related chronic inflammation. The results of the current study do not provide hard evidence favoring a particular cART regimen, although they show less fa-vorable regimen profile containing protease inhibitor. Our data suggests incomplete reduction of inflammation and immune activation in terms of the effective cART. It is likely that the inter-est in various biomarkers related to immune activation and inflammation as predictors of clini-cal outcomes among PLHIV will increase in the future.
Keywords: 
Subject: Medicine and Pharmacology  -   Epidemiology and Infectious Diseases

1. Introduction

In 2022, almost three-quarters (71 %) of people living with HIV (PLHIV) have undetectable viral load thanks to cART. Viral suppression enables PLHIV live long and healthy lives [1]. The proportion of HIV-1 patients over the age of 50 has increased dramatically due to improved survival and in relation to the higher number of infected people in older age groups [2]. We must not forget that these patients still have increased morbidity and mortality compared to the general population [3] even upon completion of successful cART. PLHIV show progressive immune system dysfunction similar to that observed in the elderly; that is why HIV infection is considered to be a model of accelerated immunosenescence [4].
All that raises new clinical issues regarding aging and its related co-morbid conditions in PLHIV [5], which occur more frequently in them than in general population [6,7] and in relatively young HIV-1 patients even with persistent viral suppression. They include neurocognitive disorders, cardiovascular disease (CVD), metabolic syndrome (MS), bone abnormalities, and non-HIV cancers [8]. Most of these diseases are associated with chronic inflammation and activation of immune system [9].
Microbial translocation, continued production of HIV, co-infections (e.g. CMV), loss of regulatory T cells, damage to the thymus and lymphoid infrastructure, smoking, obesity, alcohol drinking and low social status are indicated as causes [10,11,12,13]. Toxicity associated with cART also contributes to the persistent immune dysregulation, considering that even new antiretroviral drugs are not completely free of short- and long-term toxicity [14].
This made us set an objective to compare different cART regimens in PLHIV in the light of residual immune activation and dysfunction by examining a panel of biomarkers (IFN-γ, IL-1β, IL-12p70, IL-2, IL-4, IL-5, IL-6, IL-13, IL-18, GM-CSF, TNF-α, C-reactive protein, D-dimer, soluble CD14), which could provide a non-invasive and affordable approach to monitor HIV-related chronic inflammation in virologically suppressed patients. This will probably reduce morbidity and mortality resulting from non-HIV-1 related diseases and the burden on the health system.

2. Materials and Methods

2.1. Participants’ Selection

It concerns a prospective cross-sectional study conducted in Acquired Immunodeficiency Department at Specialised Acute Care Hospital for Infectious and Parasitic Diseases Prof. I. Kirov EAD - Sofia.
We involved a total of 80 individuals in the study: 17 of them taking Emtricitabine/Tenofovir alafenamide/Darunavir/Cobicistat (FTC/TAF/DRV/c); 17 of them taking Lamivudine/Tenofovir disoproxil fumarate/Doravirine (3TC/TDF/DOR); 18 of them taking Emtricitabine/tenofovir alafenamide/Bictegravir (FTC/TAF/BIC); 18 of them taking Lamivudine/Dolutegravir (3TC/DTG); and 10 of them taking Dolutegravir/Rilpivirine (DTG/RPV).
10 % (n=8) of the participants in the study were female and 90 % (n=72) were male. The uneven distribution in this study approximated the male-female ratio at the center where the participants were registered.
The following inclusion criteria were used: positive HIV status; age over 18 years; all patients involved in the study are HIV positive with persistent viral suppression (VL < 40 c/ml > 1 year).
The following exclusion criteria were used: age under 18 years; pregnancy; participants who refuse to sign informed consent; administration of non-steroidal anti-inflammatory drugs in the last 1 month; patients who do not have persistent viral suppression, i.e. who do not have VL<40c/ml > 1 year.
Each patient signs an informed consent approved by the research ethics committee at Sofia Medical University(ВК-455/31.03.2023).

2.2. Collection of Biological Material

For the purposes of biomedical research, the following serological markers, such as IFN-γ, IL-1β, IL-12p70, IL-2, IL-4, IL-5, IL-6, IL-13, IL-18, GM-CSF, TNF-α, C reactive protein, D-dimer and CD14 soluble in venous blood, will be analysed. A closed vacutainer system was used for each participant in the study, following the standard sterility procedures. We used vacutainers with a clot activator and 3-10ml blood. To determine the viral load (VL) we used EDTA tubes as anticoagulant.
Storage of biological material to study IFN-γ, IL-1β, IL-12p70, IL-2, IL-4, IL-5, IL-6, IL-13, IL-18, GM-CSF, TNF-α and soluble CD14: after collection and centrifugation, equal aliquots of serum were frozen at a temperature of -80 °C until all samples were collected for their overall analysis. C reactive protein, D-dimer and VL were examined simultaneously.

2.3. Biomarkers Measurement

For the purposes of the study, we used highly sensitive immunological Human ProcartaPlex™ Kit (Termo fisher), to measure IFN-γ, IL-1β, IL-12p70, IL-2, IL-4, IL-5, IL-6, IL-13, IL -18, GM-CSF and TNF-α proteins in combination, in the form of a multiplex panel that uses Luminex xMAP technology for protein detection and quantification. The ProcartaPlex immunological tests that we used were based on the sandwich ELISA principles. The capture antibody in the ProcartaPlex assay is conjugated to magnetic beads and is not adsorbed to the microplate well, so that the ProcartaPlex assay reagents are floating freely in the solution. Similarly, soluble CD14 was assayed with the help of CD14 Human ProcartaPlex™ Simplex Kit (Thermo fisher), using the technology described above.
We used Finecare™ CRP Rapid Quantitative Test and Finecare™ D-Dimer Rapid Quantitative Test, along with Finecare™ FIA Meter - fluorescent immunoassay for quantitative measurement of D-Dimer. We used whole human blood as a material. It is based on fluorescence immunoassay technology. The Finecare™ D-Dimer Rapid Quantitative Test uses a sandwich immunodetection method. When the sample is added to the sample well the fluorescently labeled anti-D-Dimer/anti-CRP detector on the membrane binds to the D-Dimer/CRP antigen in the blood. The mixture migrates onto the nitrocellulose matrix of the test strip and the detector antibody and D-Dimer/CRP complexes are captured by the D-Dimer/CRP antibody that has been immobilised on the test strip. Thus, if larger amount of D-Dimer/CRP antigen is contained in the sample, the more complexes are accumulated on the test strip. The fluorescence intensity of the detector antibody reflects the amount of captured D-dimer/CRP and Finecare™ FIA Meter indicates the concentration of D-dimer/CRP. The result is displayed as XXXmg/L by Finecare™ FIA Meter.

2.4. Viral Load Measurement

We used Abbott RealTime HIV-1 test. The Abbott RealTime HIV-1 Test is an in vitro reverse transcription polymerase chain reaction (RT-PCR) test for quantification of human immunodeficiency virus type 1 (HIV-1) on the m2000 automated system in human plasma taken from HIV-1 infected individuals above 40 copies/mL Reverse transcription PCR is a qualitative test for determination of HIV-1 RNA in plasma. Real Time PCR uses real-time homogeneous fluorescence detection technology.
The design of the probes included in the test is partially double-stranded and allows detection of a variety of group M subtypes and group O isolates. The assay was standardised based on a viral standard from the Virology Quality Assurance (VQA) system of the Laboratory of AIDS Clinical Trial Group [Yen-Lieberman B et al., 1996] and in accordance with the first international HIV-1-RNA (97-656) standard of the World Health Organisation (WHO) [Holmes H et al., 2001; Davis C et al., 2003]. HIV-1 viral load testing uses RT-PCR to generate an amplified product of HIV-1 RNA genome in clinical samples. A sequence unrelated to the HIV-1 target sequence was introduced into each tube at the beginning of sample preparation. This unrelated RNA sequence was amplified along with the viral genome through RT-PCR and served as an internal control (IC) to demonstrate that the process was properly conducted in each sample. The amount of HIV-1 was measured at each cycle using fluorescently labeled oligonucleotide probes. Probes do not produce a signal unless they are associated with the target product.
The entire work process was performed according to the manufacturers' recommendations.

2.5. Statistical Methods

The quantitative variables are presented with median and interquartile range (25th and 75th percentiles), due to their non-Gaussian distribution. The distribution pattern was evaluated using Kolmogorov-Smirnov test. Spearman's rank correlation coefficient was used to evaluate relationships between quantitative variables.
Mean values of two groups were compared with those obtained upon completion of Mann-Whitney U test, and mean values of more than two groups were compared with those obtained upon completion of Kruskal-Wallis test. Р-values <0.05 were considered to be statistically significant. All analyses were performed, using IBM SPSS Statistics 26.

3. Results

This section may be divided by subheadings. It should provide a concise and precise description of the experimental results, their interpretation, as well as the experimental conclusions that can be drawn.

3.1. Relationship between the Studied Indicators And Duration of cART

IFN-γ was found to be related with the duration of cART through a weak and inverse relationship, i.e. the increased duration of the therapy leads to decreased value of IFN-γ (Spearman's rho=-0.271, p=0.015). (Table 1) IL-4 was moderately strongly positively related to the duration of cART (Spearman's rho=0.306, p=0.006). (Table 1) D-dimer was weekly positively related to the duration of cART (Spearman's rho=0.228, p=0.043). (Table 1)

3.2. Distribution of Biomarkers Depending on the cART Regimen

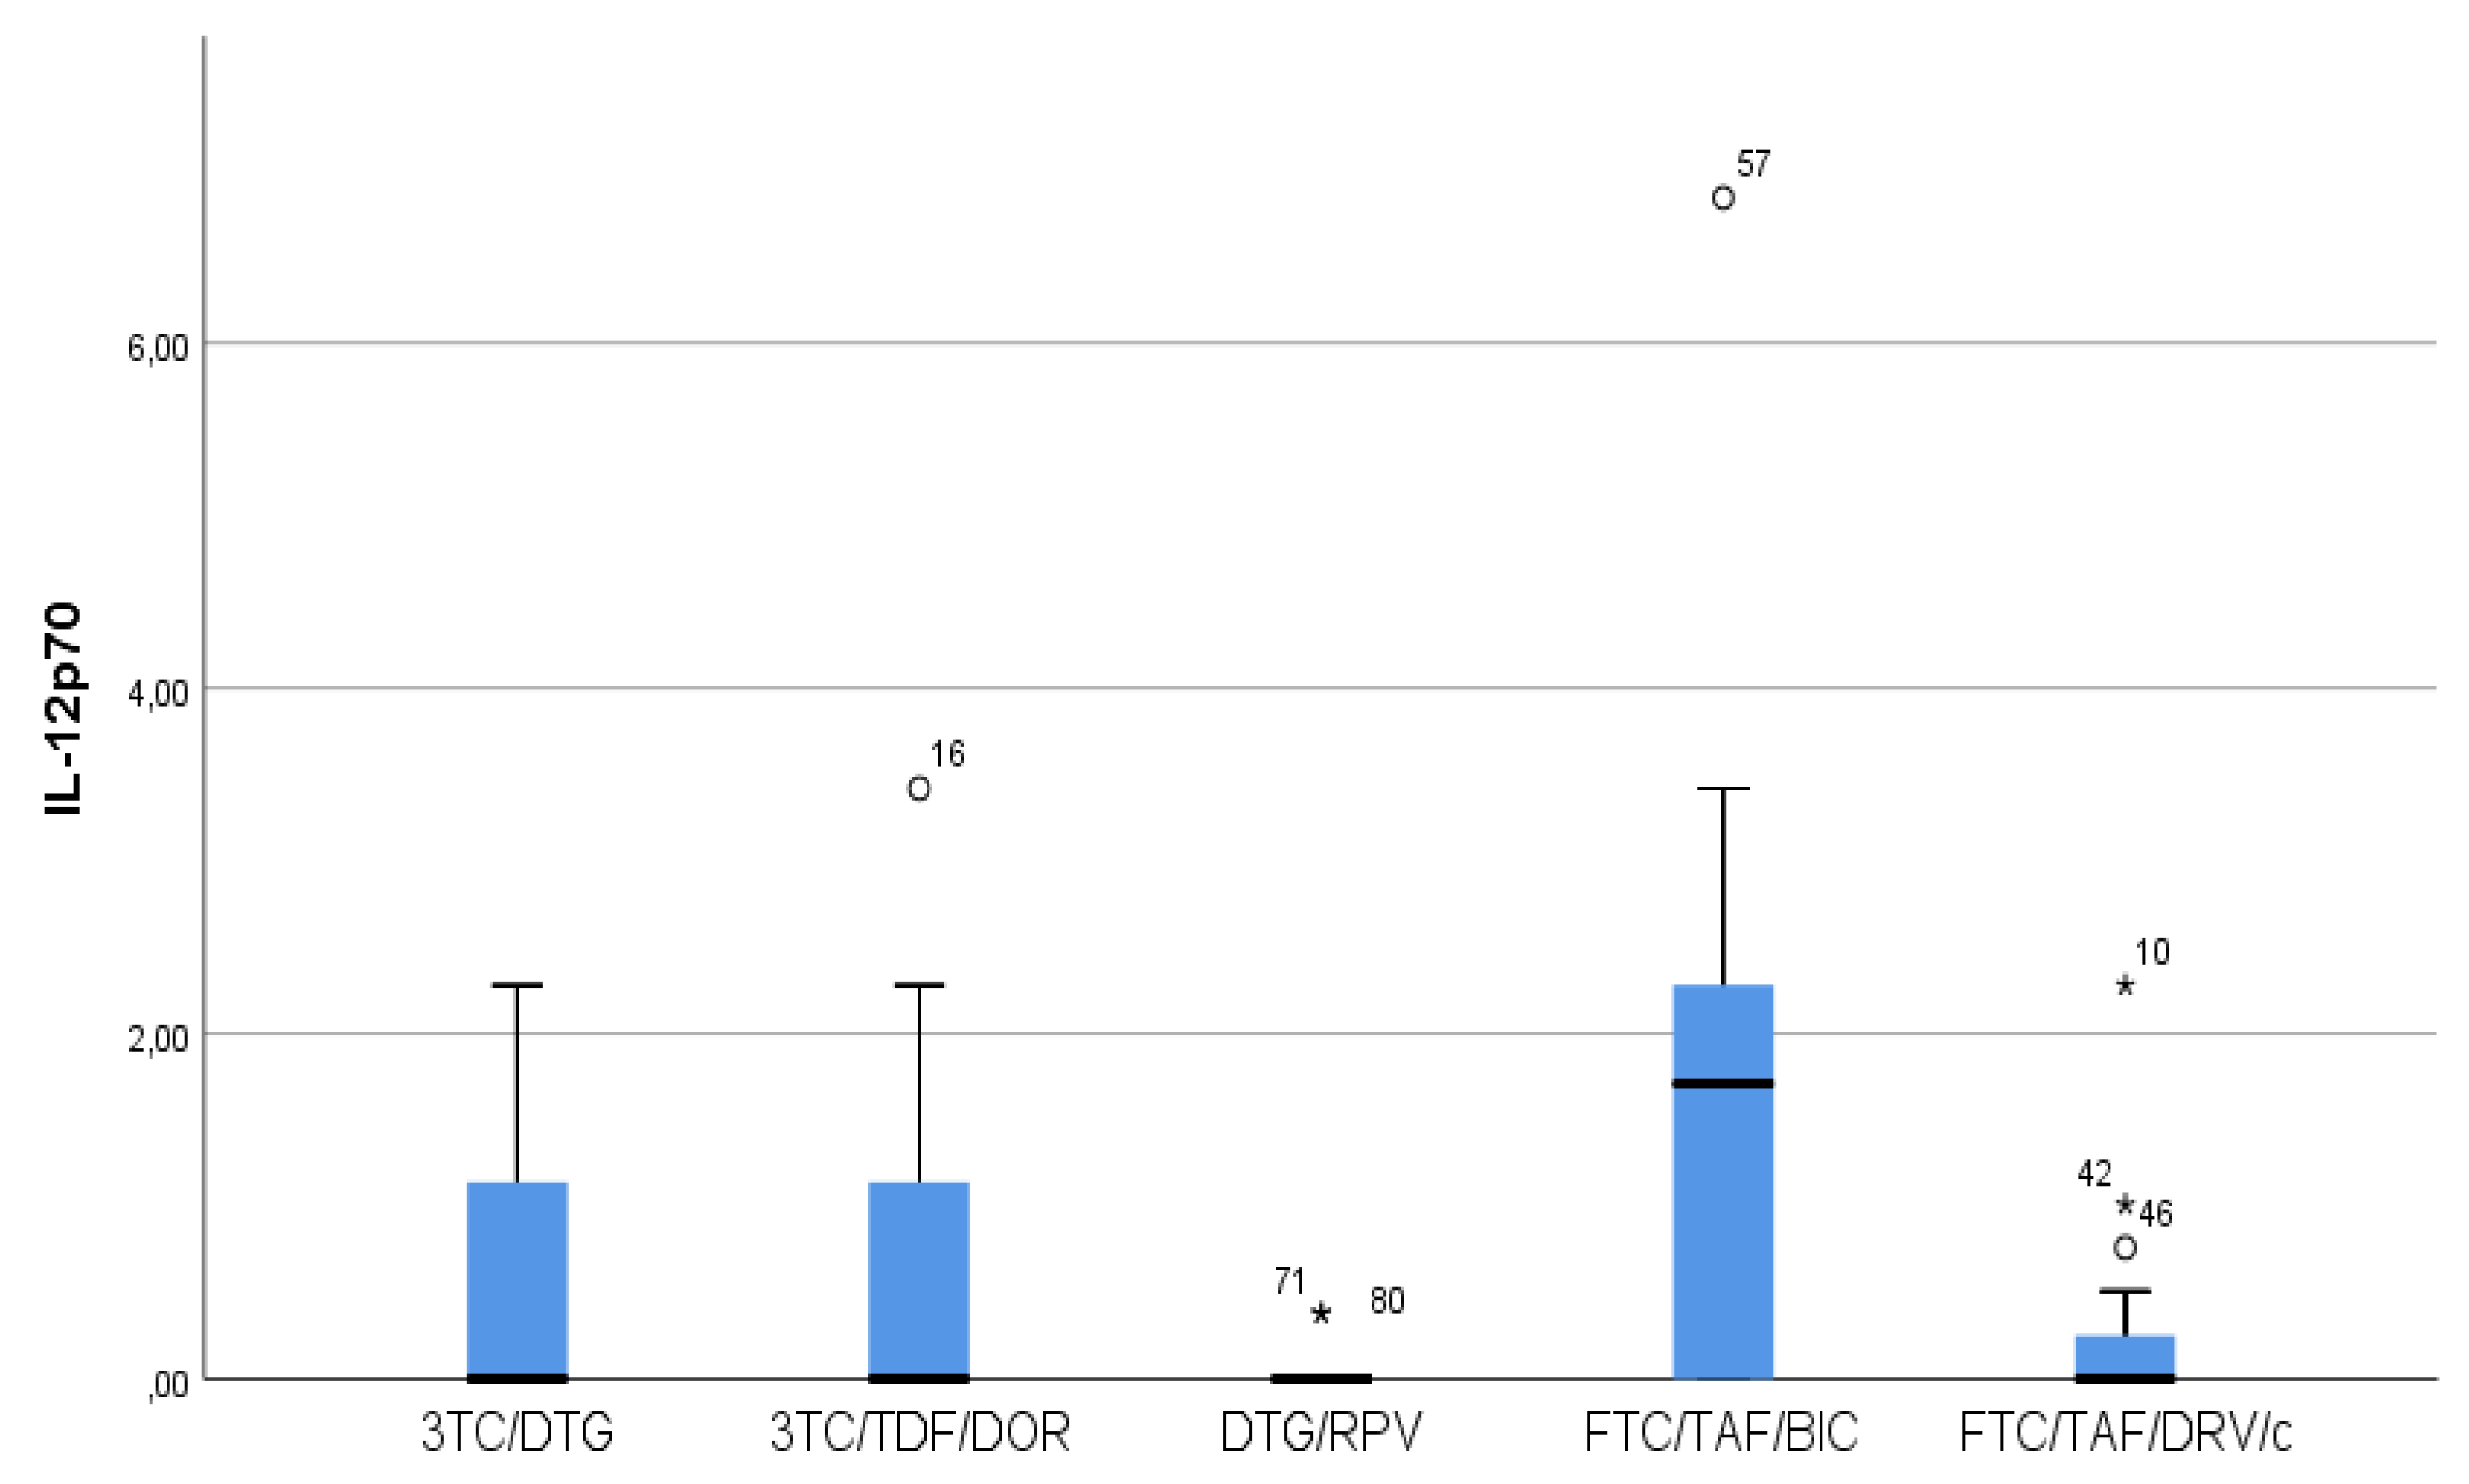
  • Lower measured values (almost null) of IFN gamma and IL12p70 were observed in DTG/RPV and FTC/TAF/DRV/c regimes compared to 3TC/DTG, 3RC/TDF/DOR and FTC/TAF/BIC regimens. (Figure 1) (Figure 2)
  • As regards IL12p70, only in the FTC/TAF/BIC regimen the median is distinctly higher, i.e. the patients from this group trend to show significantly higher values of this indicator compared to all other groups. As regards 3TC/DTG and 3TC/TFF/DOR regimens, the results are very similar. (Figure 2)
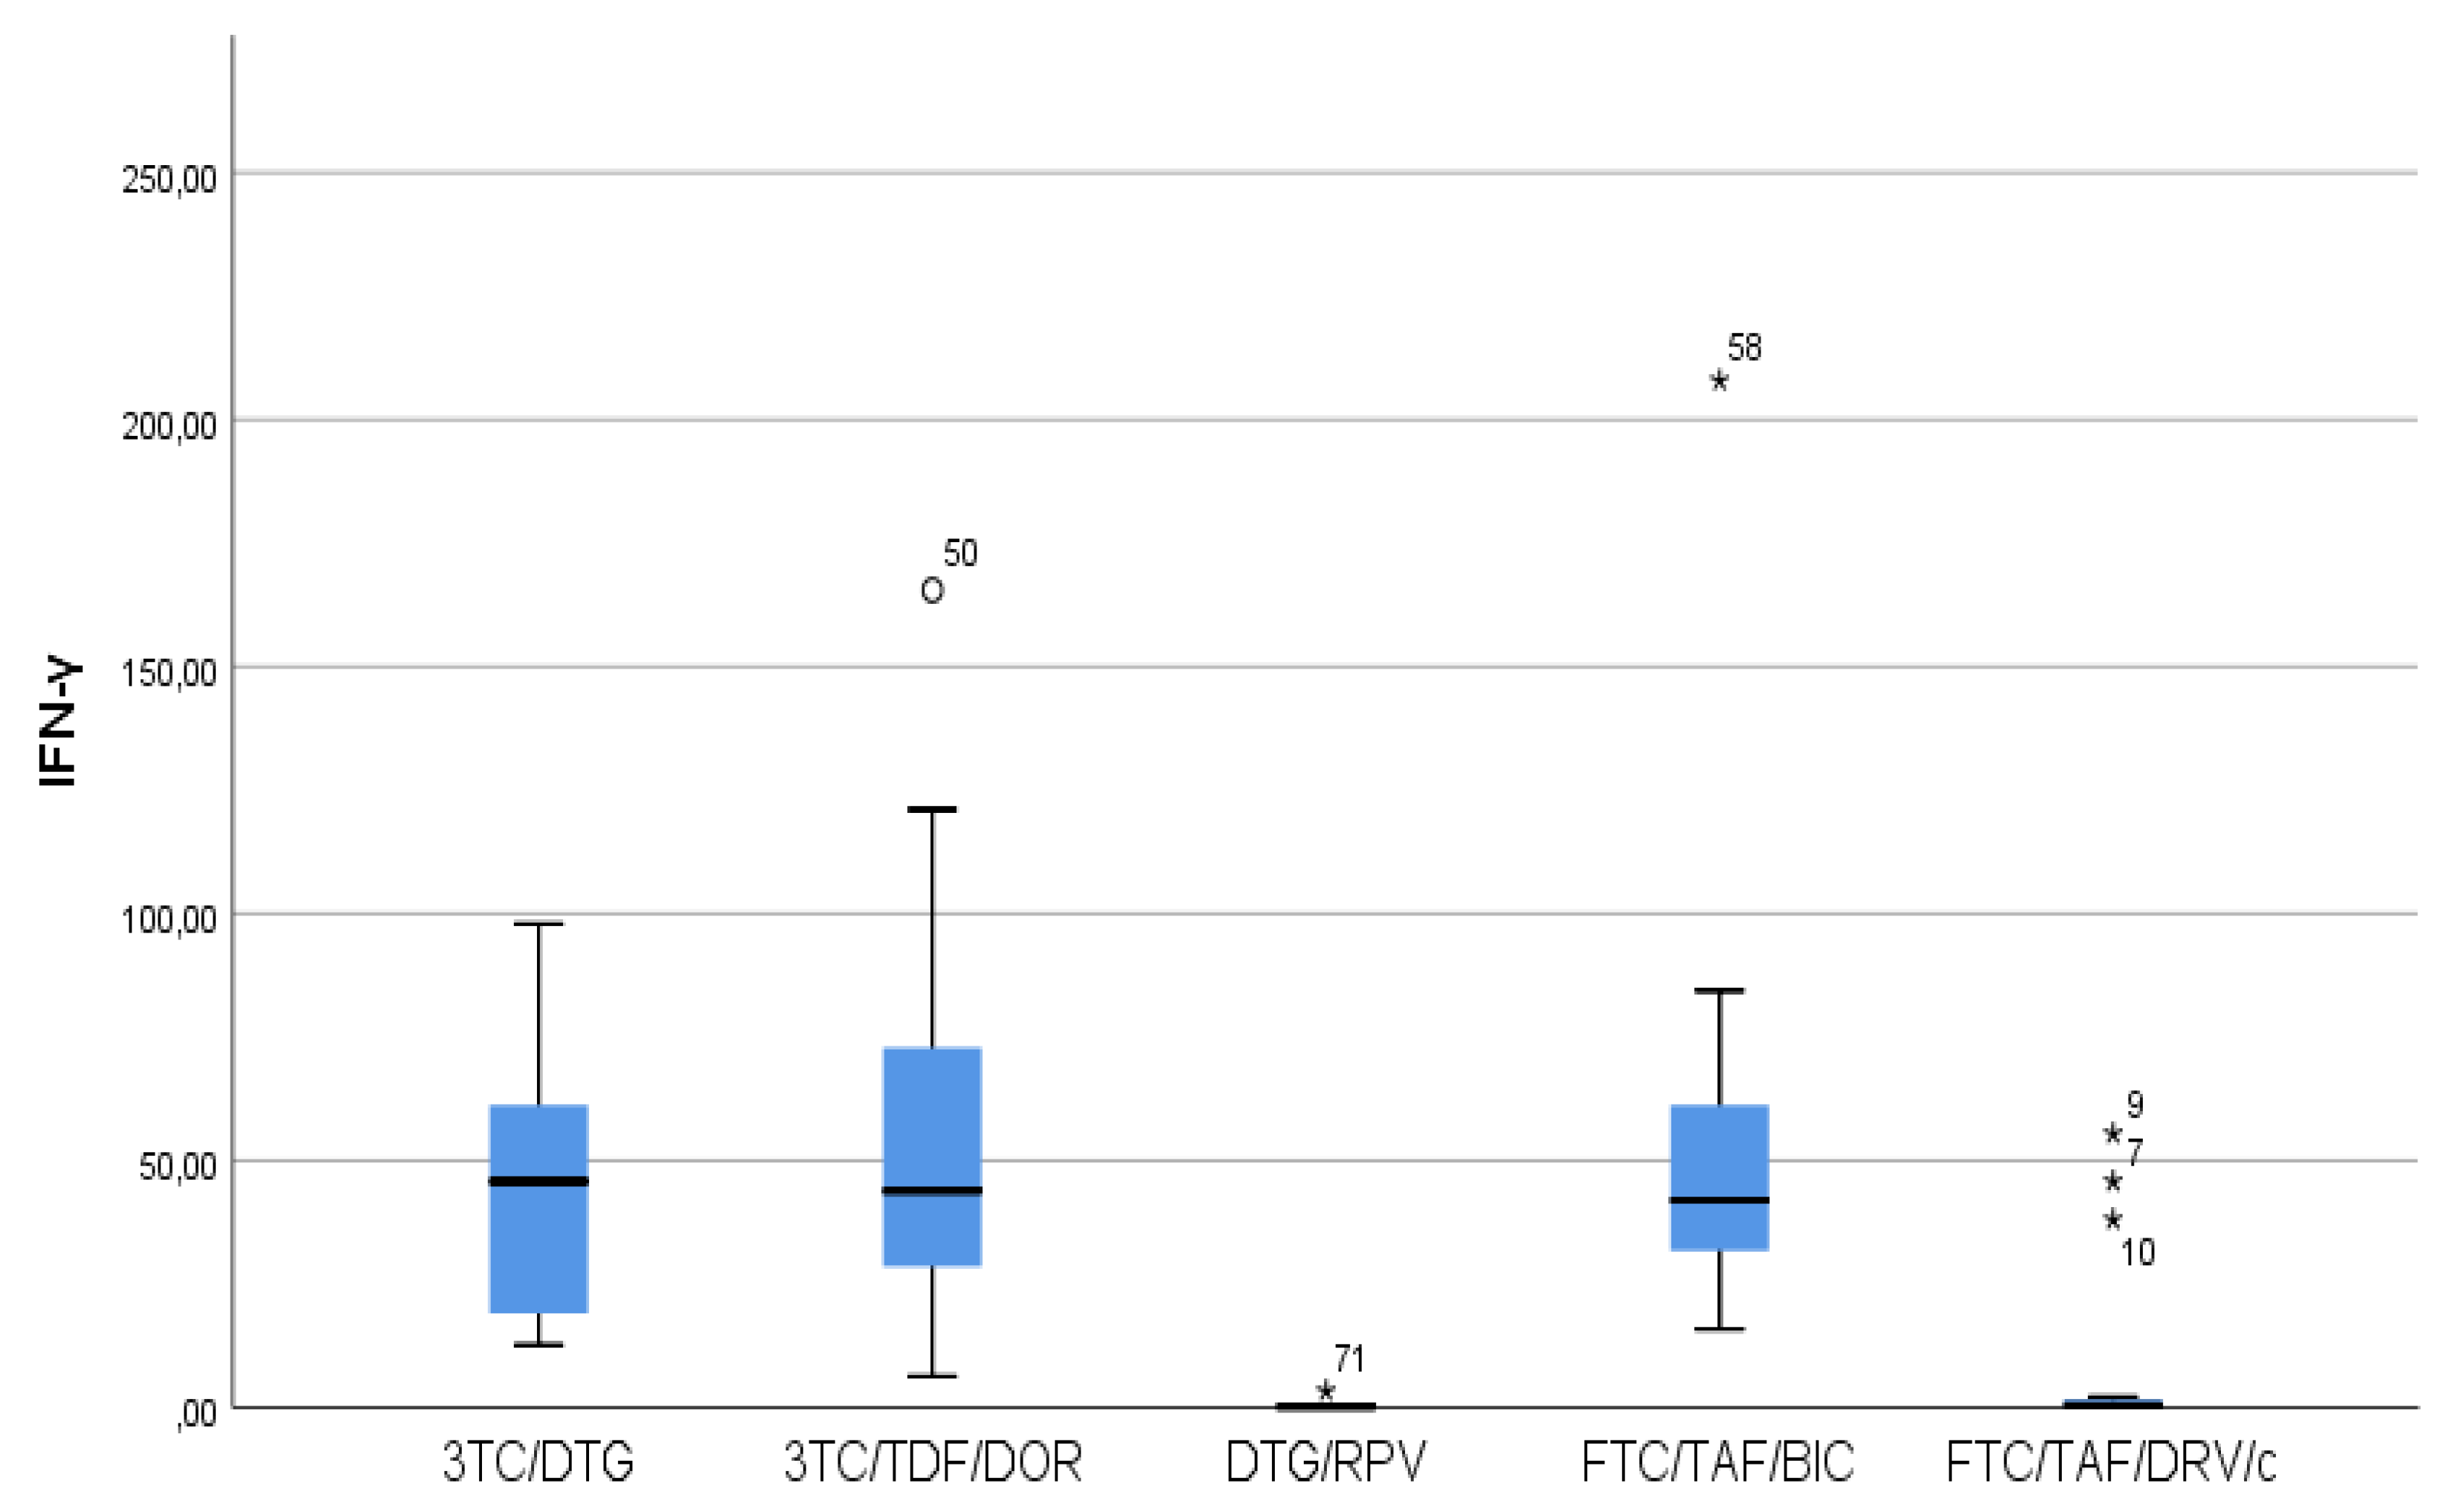
Figure 1. Distribution of IFN-γ depending on the ART regimen. Patients following DTG/RPV and FTC/TAF/DRV/c regiments had almost zero IFN-γ levels. IQR(interquartile range) is narrower for FTC/TAF/BIC regimen than 3TC/DTG and 3TC/TDF/DOR regimen, i.e. the values vary to the smallest degree.
Preprints 110346 g001
Figure 2. Distribution of IL12p70 depending on the ART regimen. The lowest IL-12p70 values were observed in DTG/RPV patients. They were followed by those following FTC/TAF/DRV/c regimen.
Preprints 110346 g002
  • IL-18 results showed that in patients following NNRTIs+NRTIs(3TC/TDF/DOR) and INIs+NRTIs(FTC/TAF/BIC and 3TC/DTG) regimens higher values than in those following INIs+NNRTIs(DTG /RPV) and Pis+NRTIs (FTC/TAF/DRV/c) regimens were observed, although we reported increased values for the other two regimens as well. (Figure 3)
  • In FTC/TAF/BIC patients lowest variation in the IL-18 values were observed and in patients in the given group close values of the studied parameter were observed, with the range corresponding approximately to the mean values of the measured parameter. Q3(75th percentile) for 3TC/TDF/DOR regimen is higher than that reported in all other groups, i.e. 25 % of the highest measured values of 3TC/TDF/DOR were higher than that reported in the other groups. (Figure 3)
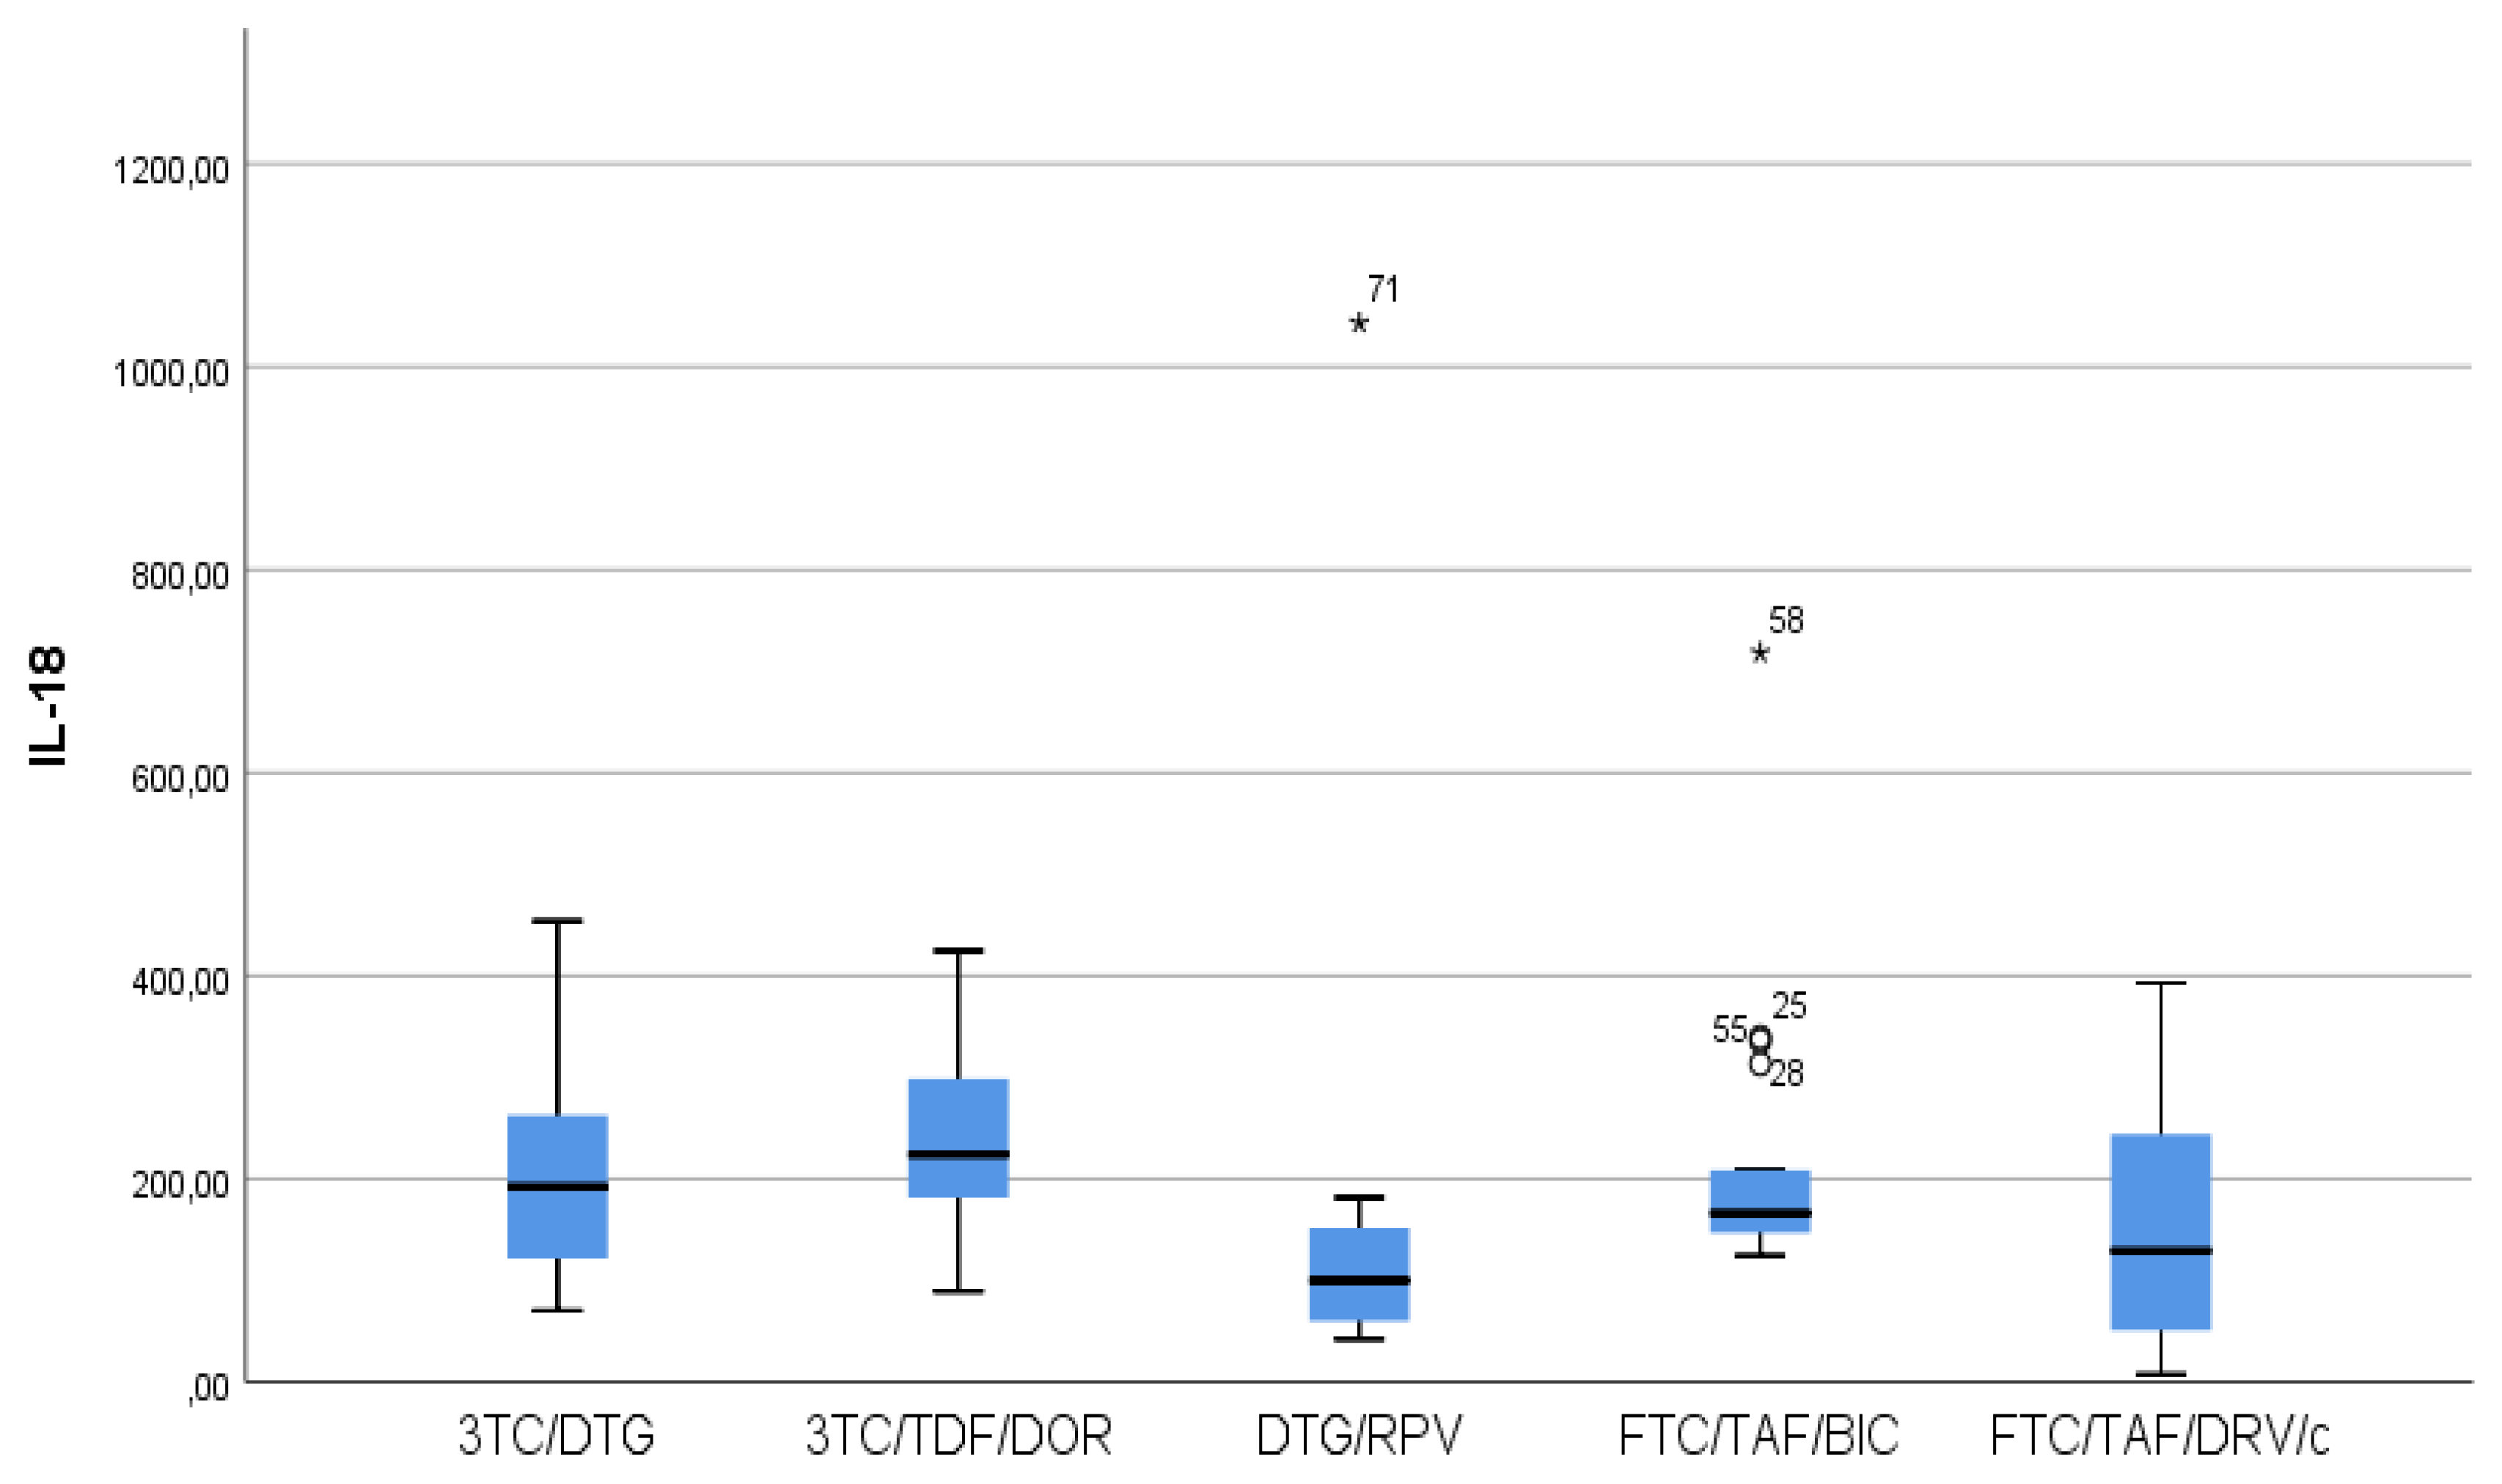
Figure 3. Distribution of IL-18 depending on the ART regimen The FTC/TAF/BIC group falls within the narrowest IQR. In this group, we observed the smallest variation in IL-18 values.
Preprints 110346 g003
  • Patients taking INIs+NRTIs (FTC/TAF/BIC and 3TC/DTG) and NNRTIs+NRTIs (3TC/TDF/DOR) showed the lowest IL-5 values (Figure 4)
  • There was a trend toward measurement of increased IL-5 values in the DTG/RPV and FTC/TAF/DRV/c groups, with these values being slightly higher for DTG/RPV regimen. ((Figure 4)
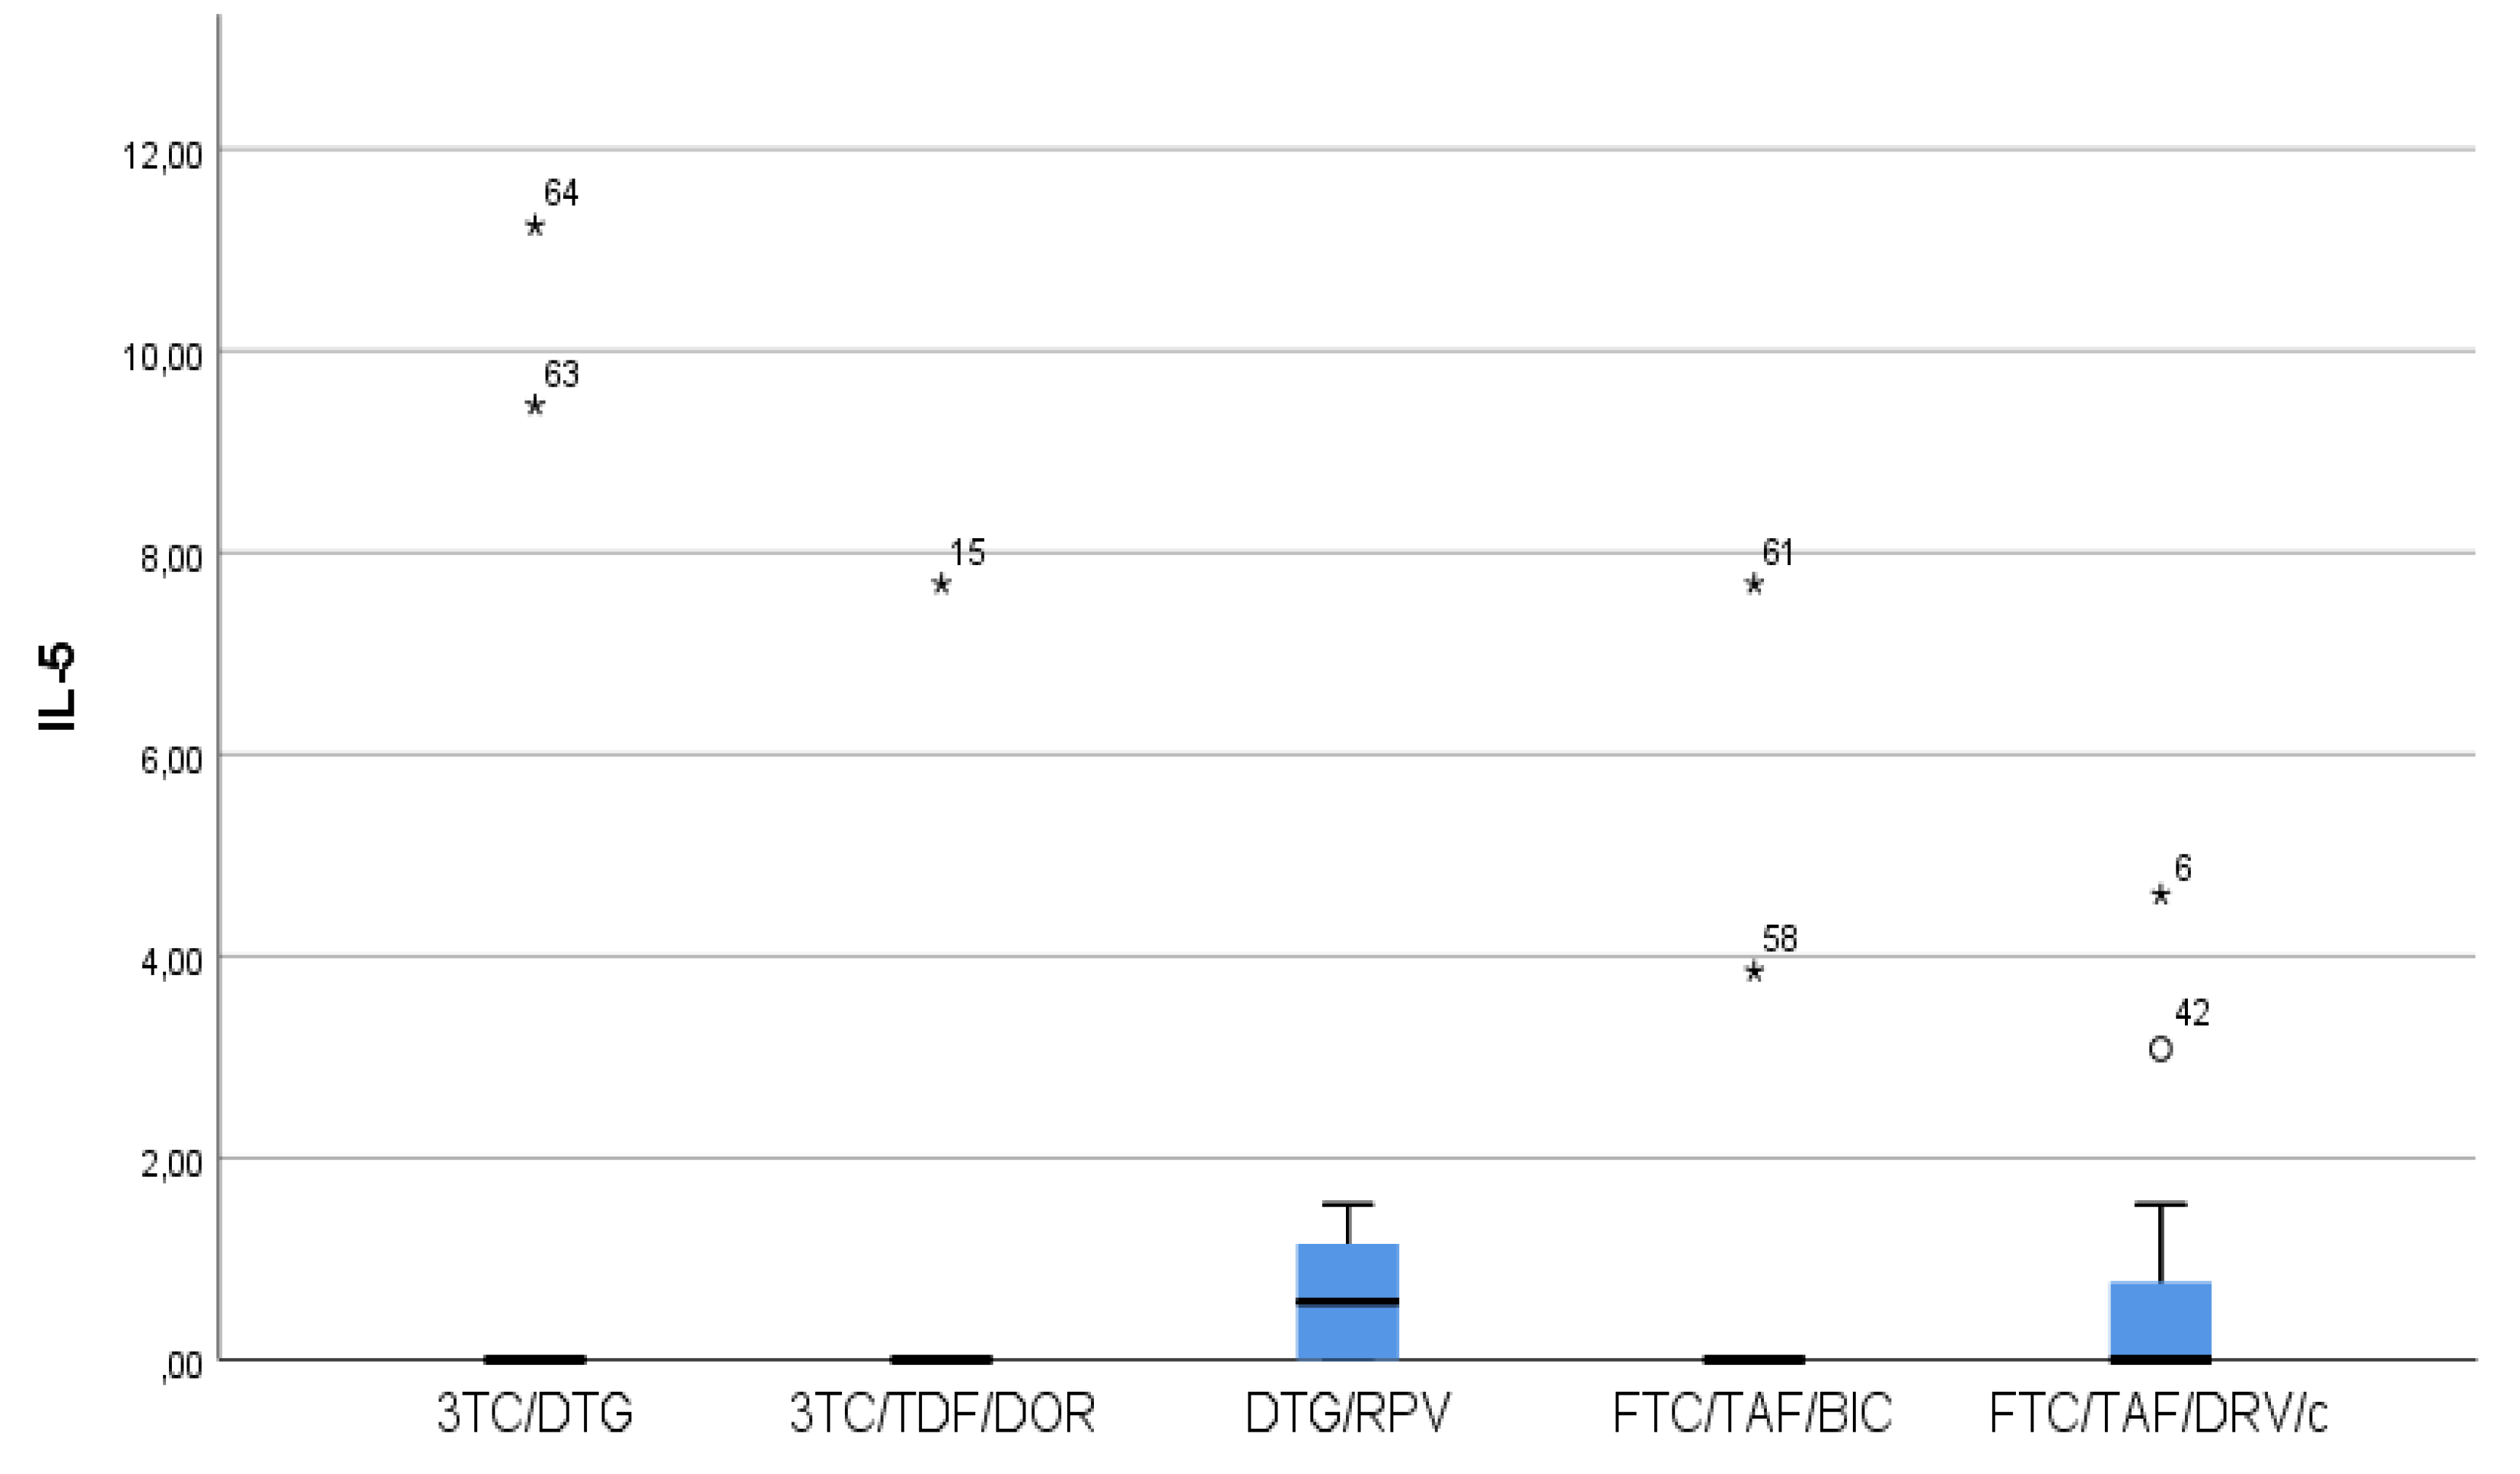
Figure 4. Distribution of IL-5 depending on the ART regimen. FTC/TAF/BIC, 3TC/DTG and 3TC/TDF/DOR had the lowest IL-5 levels. One patient in the FTC/TAF/BIC group of the patients with significantly increased IL-5 values was found to be in advanced stages of immunodeficiency, although at the time of the study he had satisfactory value of CD4 221 and type II DM. One patient in the FTC/TAF/BIC group was diagnosed with stage B of HIV infection and had very good values of CD4 854 at the time of the study and co-morbid condition duodenal ulcer. Both patients continued their treatment upon completion of another therapeutic regimen and their ART regiment had long duration - 7.5 and 6 years, respectively. All other patients with significantly increased values were in stage A and had no known co-morbid conditions.
Preprints 110346 g004
  • The highest sCD14 values were reported in Pis+NRTIs(FTC/TAF/DRV/c) regimen, i.e. in a regimen containing a protease inhibitor. We found the lowest values in patients following INIs+NRTIs (FTC/TAF/BIC and 3TC/DTG) and NNRTIs+NRTIs (3TC/TDF/DOR) regimens (Figure 5).
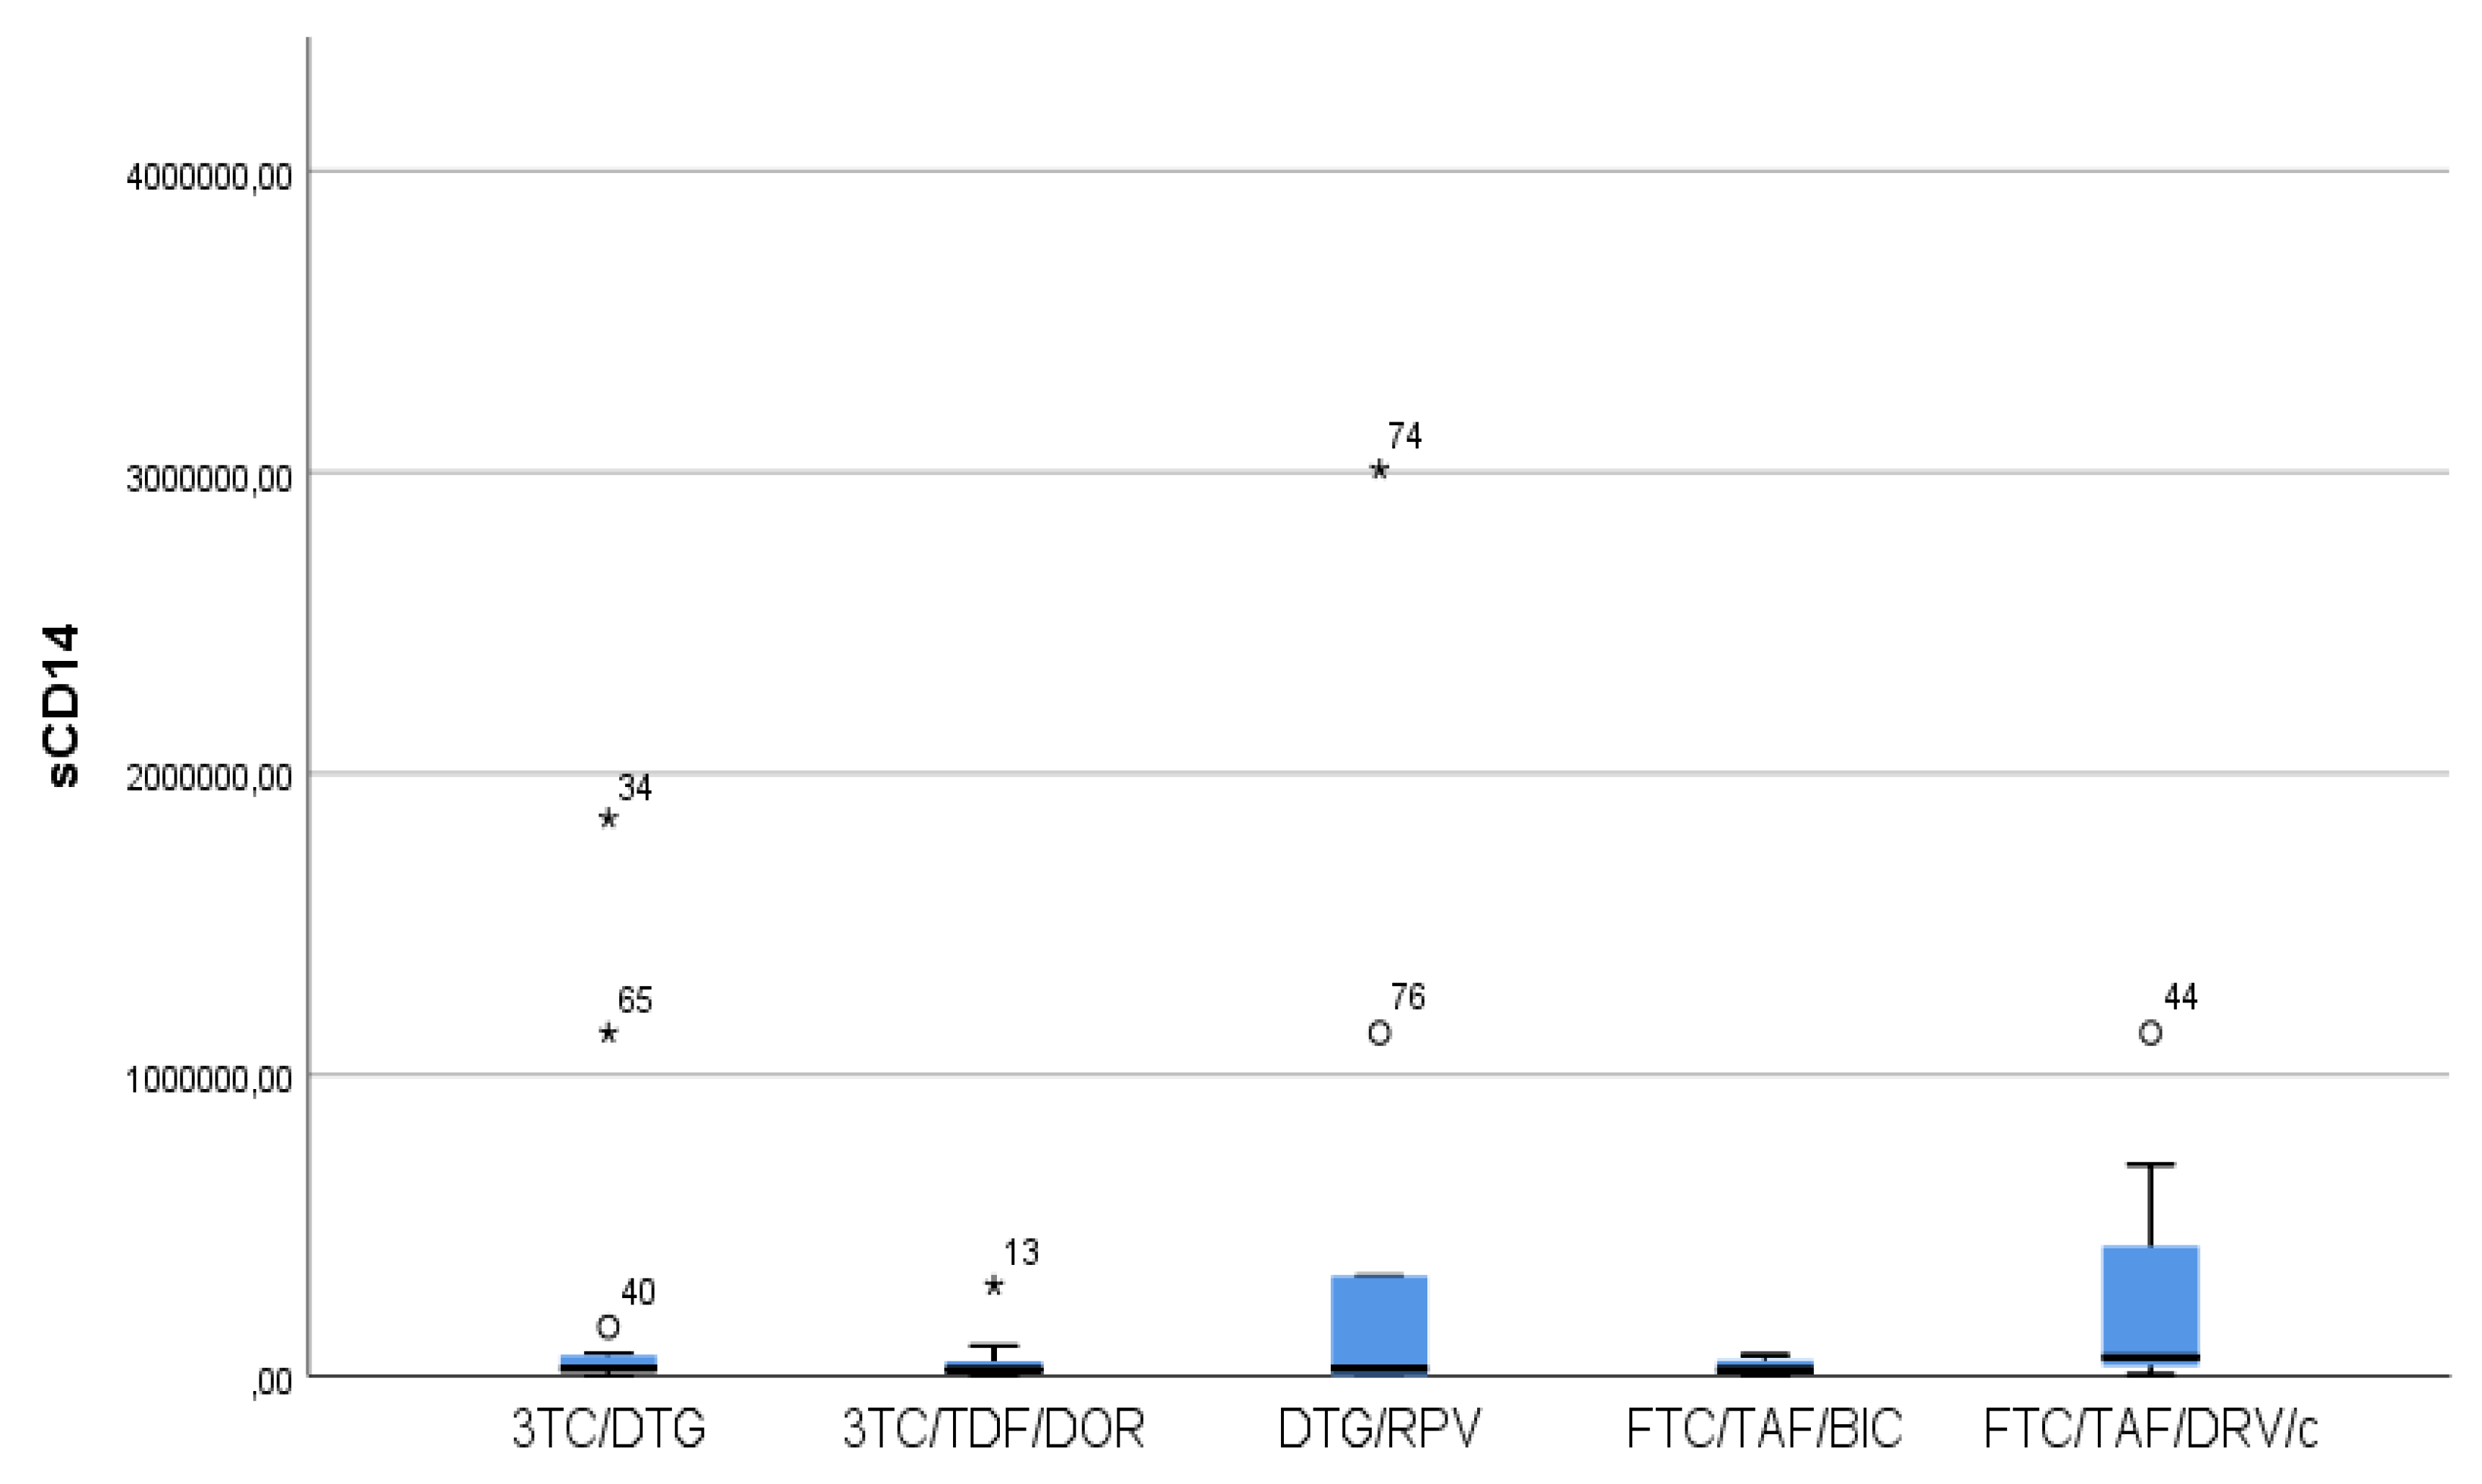
Figure 5. Distribution of sCD14 depending on the cART regimen. Increased values were observed in the regimen containing protease inhibitor and in the two-drug regimen without nucleoside analogue. In INIs+NRTIs and NNRTIs+NRTIs regimens values close to 0 were observed.
Preprints 110346 g005
  • In FTC/TAF/BIC regimen, the IQR is the widest and the median is high, which shows markedly higher values of TNF-α compared to all other groups. (Figure 6)
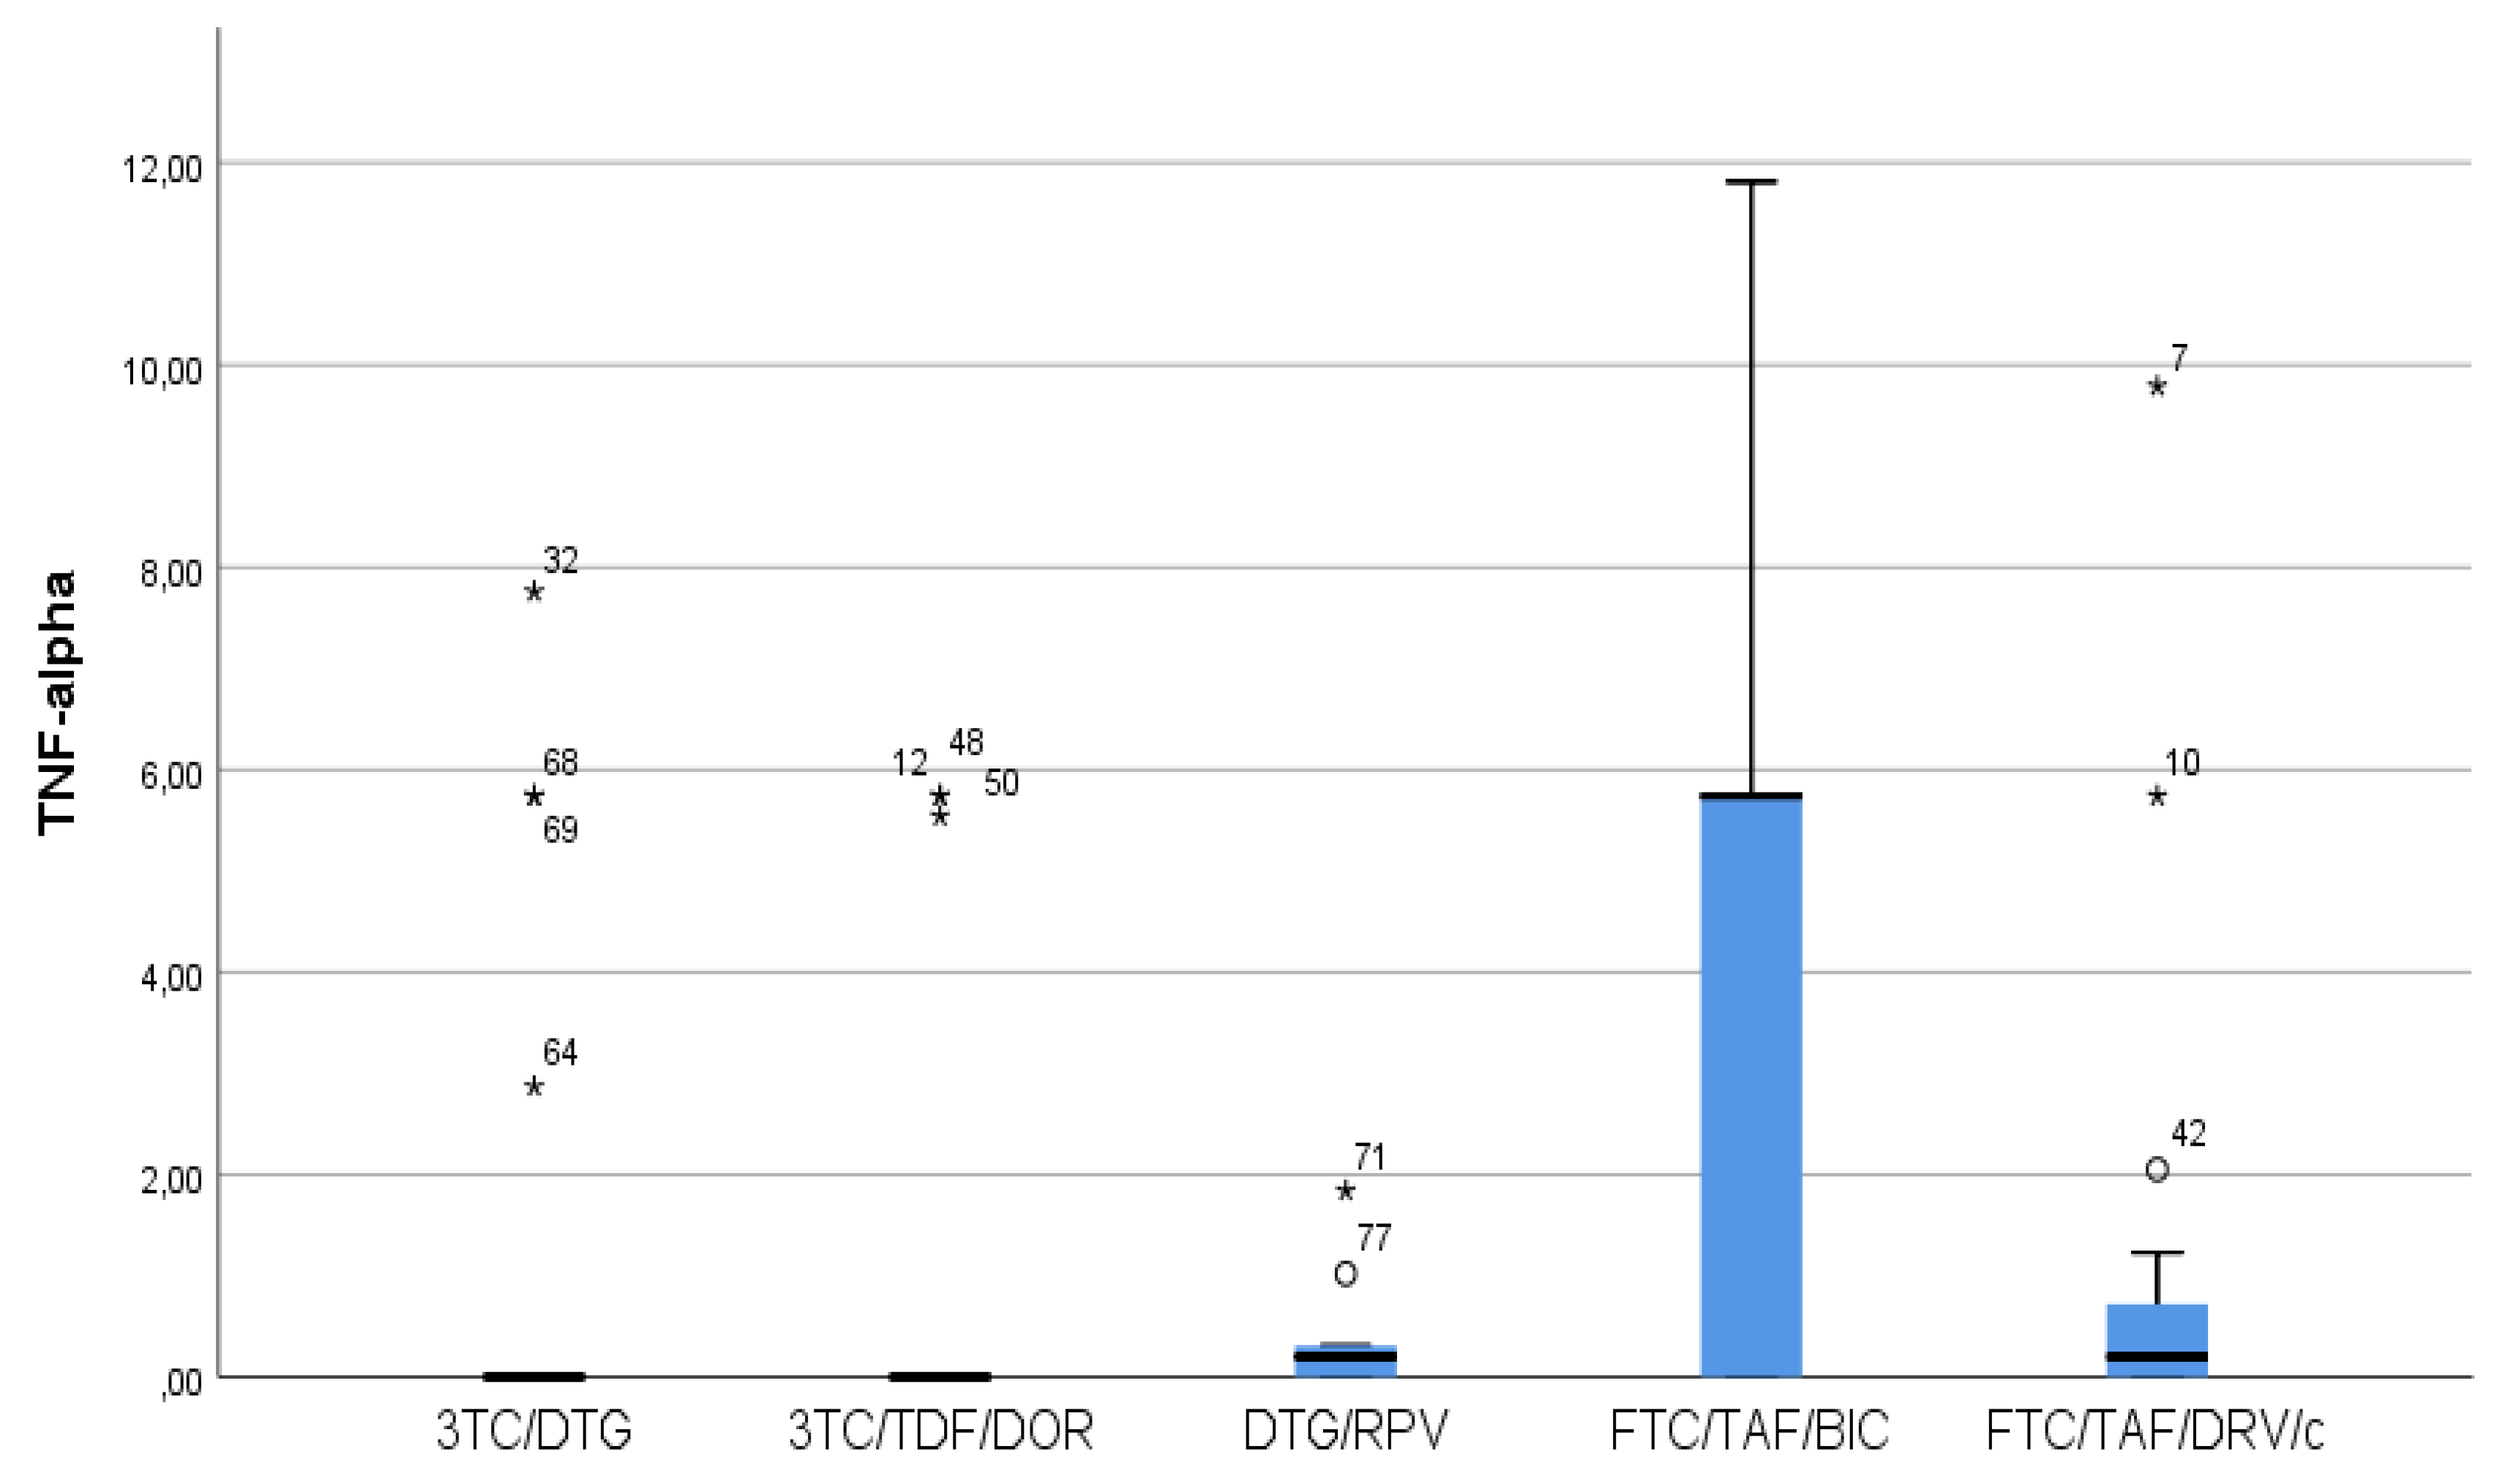
Figure 6. 3TC/DTG and 3TC/TDF/DOR regimens have the lowest values of TNF-α.
Preprints 110346 g006

3.3. Distribution of Biomarkers Depending on Presence or Absence of a Protease Inhibitor

  • We found significantly lower levels of IFN-γ in the protease inhibitor patients in the current therapy, lower levels of IL-18 and higher levels of sCD14 (Table 3).

3.4. Distribution of Biomarkers Depending on Presence of CVDs

  • No significantly different values of the indicators were proven depending on the presence of cardiovascular diseases (CVDs). (Table 4)

3.5. Relationships between the Studied Indicators

IFN-γ is strongly related to IL-18, moderately related to IL-12p70, IL-13 and IL-6, weakly related to IL-12p70 and weakly but negatively related to IL-5 (Table 5). IL-6 is moderately strongly related to IFN-γ and IL-12p70 (Table 5).
No relationship between CRP, d-dimer and sCD14 with any of the series (p>0.05) was proven. (Table 5)

4. Discussion

Lot of evidence on the presence of residual immune activation and inflammation in PLHIV was accumulated, despite the successful cART and the associated risks of comorbidity conditions and death. Evidence that despite CART the levels of a number of immune inflammation markers remain increased was also accumulated (Abino et al. 2016).
Statistically significant differences were observed in the levels of pro- and anti-inflammatory circulating cytokines that stimulate and suppress the immune system, respectively, between HIV-infected and non-HIV-infected individuals [15]. The longitudinal assessment of circulating cytokines in one study showed worse cytokine profile for cART-naïve patients compared to cART-treated patients and healthy controls. The data indicates that cART induces normalisation of IL-4, IL-6, and IL-10. INF-γ, TGF-β, and TNF-α did not fully respond to cART after 1 year of therapy [16]. The Biomarker Cohort study showed relationship between IL6, D-dimer and soluble 14 (sCD14) and mortality in both HIV positive and non-HIV positive patients [17]. Data from other studies found that interleukin-6 [IL-6], C-reactive protein [hsCRP], soluble CD14 [sCD14]), and D-dimer correlated with the overall mortality due to HIV-1 infection [18,19].
Studies comparing the modern cART regimens in light of the residual immune activation and dysregulation are of great interest [20]. For example, in one prospective study, cART-naive patients started treatment with RAL, ATV/r, or DRV/r with TDF/FTC. Patients who achieved viral suppression did not show consistent pattern in terms of the studied markers (hsCRP, D-dimer, sCD14, and IL-6) favouring any of the cART regimens [21].
Data from some sources show reduction in the microbial translocation markers in people randomised to raltegravir (RAL) compared to people randomised to non-nucleoside reverse transcriptase inhibitors (NNRTIs) [22,23,24]. Data from other sources shows that the shift toward and intensification with RAL do not definitively demonstrate significant changes in the systemic inflammation and immune activation [25,26].
Of the 13 markers examined, GM-CSF, IL-1β, IL-12p70, IL-2, IL-4, IL-5, IL-6, IL-13, IL-18, D-dimer, CRP, TNF-alpha and sCD14 at INF-γ, IL12p70, IL-18, IL-5, TNF-alpha and sCD14 we established a dependence with the ART regimen. The data shows progressive decrease, even not significant, in the baseline IFN-γ production with immunodeficiency progression [27]. cART significantly increased the plasma levels of IFN-γ [28,29] relative to the baseline levels. However, we found reduction of IFN-γ when the duration of ART increased (Spearman's rho=-0.271, p=0.015), which we explained by the residual immune activation and dysregulation that had led to immunosenescence over time. The fact that regimens containing a protease inhibitor (DRV/c) or those without a nucleoside analogуе as the basis of the therapy (DTG/RPV) showed lower IFN-γ values in our study could define some cART regimens as more effective than others, but, hovewer, further studies with a larger number of participants need to be conducted.
Exposure of monocyte-derived dendritic cells to plasma from untreated HIV-infected donors with chronic infection resulted in suppression of IL-12p70 secretion. Similar observations were made for TNFα. The suppressive effect was weaker in plasma donors following cART regimen [30]. Our explanation is that cART regimens with better efficacy will have a weaker suppressive effect on IL-12 secretion. These regimens in our study are FTC/TAF/BIC, 3TC/DTG and 3TC/TDF/DOR regimens. According to other sources, IL-12p70 is increased in HIV-positive patients compared to healthy controls [31] and is more represented among patients taking a protease inhibitor compared to those taking an integrase inhibitor [32], which is inconsistent with our results.
Markedly low levels of IL-18 were observed in cART patients who achieved viral suppression [33]. The higher serum levels of this indicator may be a useful marker in HIV-1-infected patients with metabolic disorders and in fat redistribution, as well as a sensitive predictor of cardiovascular complications in treated patients [34]. None of the regimens in the present study showed complete normalisation of IL-18 despite the observed success of ART. We report lower values of IL-18 for patients following DTG/RPV regimen, although, as regards the other markers, the relation for this regimen is inverse. This may be due to unreported comorbidity conditions, for example.
Data shows that virological non-responders have significantly increased IL-5 levels compared to ART responders. However, the values of this indicator do not completely normalise even in case of durable viral suppression with high CD4 T lymphocyte levels [35]. According to our data, higher values of IL-5 are found in patients following FTC/TAF/DRV/c and DTG/RPV regimens.
On the one hand, IL-6 values are significantly increased in case of HIV, but show no significant difference compared to the control group participants after 1 year of therapy (P > 0.05), on the other hand [16]. One study shows higher IL-6 levels in patients taking a protease inhibitor compared to patients taking efavirenz and nevirapine, although this relation is not significant for atazanavir. IL-6 does not show significant differences depending on the cART regimen in our study [36].
The higher levels of hsCRP and D-dimer are related to the higher levels of IL-6 according to some data [36]. According to our data, IL-6 is moderately strongly related to IFN-γ and Il-12p70. We do not prove any relationship between CRP, d-dimer and sCD14 with any of the series (p>0.05).
After beginning of the cART therapy, IL-4 values gradually decrease to those comparable to the healthy controls [37]. We found that IL-4 was moderately strongly positively related to the duration of cART (Spearman's rho=0.306, p=0.006). This marker may be potentially useful for assessing HIV progression.
Macrophage activation markers, such as sCD14, are associated with the risk of cardiovascular disease (CVD) in HIV-1-infected individuals [38,39,40]. However, we did not find any relation between the studied markers and presence of CVD. Data shows that sCD14 decreases more markedly in patients following RAL regiment compared to those following PI/r and NNRTI regimens [21,41,42]. These findings are consistent with our data.
The results of the current study do not provide hard evidence favoring a particular cART regimen, although they show less favorable regimen profile containing protease inhibitor. Some of the results are the same as those reported in some studies, but differ from the results reported in other studies. Moreover, we have to take into account some restrictions, such as the predominance of the male gender among the participants in the study. The design, and in particular the cross-sectional study providing information on the tested group at a certain point in time may also be considered to be a disadvantage, although some data shows a stable level of various markers of systemic inflammation 1 year after starting HART therapy, which suggests that their re-evaluation may not be necessary [43]. The small number of participants and the lack of healthy controls and patients, who do not take HART are also a disadvantage that is due to our limited budget. All of the factors above-mentioned may have influenced the results.

5. Conclusions

In general, our data suggests incomplete reduction of inflammation and immune activation under effective cART conditions. These results also highlight the need for further study of different HART regimens to confirm whether a given regimen has greater anti-inflammatory effect as a possible mean of effective prevention of long-term co-morbid conditions in the cases of HIV-1 infection. It is likely that the interest in various biomarkers related to immune activation and inflammation as predictors of clinical outcomes among PLHIV will increase in the future.

Author Contributions

Conceptualization, N.Y. and R.G.; methodology, N.Y. and D.S.; software, E.N.; validation, N.Y.; formal analysis, E.N.; investigation, S.M.; A.G.; I.A.; L.G.; A.P.; R.D.; A.G.; A.K.; resources, R.G.; data curation, R.G and D.I.; writing—original draft preparation, N.Y. and R.G.; writing—review and editing, N.Y. and S.M.; visualization, D.I. and R.Y.; supervision, N.K. and D.I.; project administration, R.G.; All authors have read and agreed to the published version of the manuscript.

Funding

This research was funded by Medical University Sofia grant number 8358/24.11.2022, contract number Д-187/03.08.2023.

Institutional Review Board Statement

The study was conducted in accordance with the Declaration of Helsinki and approved by the Institutional Review Board of the Ethics Commission(KEMINUS) of the Medical University Sofia (ВК-455/31.03.2023).

Informed Consent Statement

Informed consent was obtained from all subjects involved in the study.

Data Availability Statement

Not applicable.

Conflicts of Interest

The authors declare no conflict of interest.

References

  1. The path that ends AIDS: UNAIDS Global AIDS Update 2023. Geneva: Joint United Nations Programme on HIV/AIDS; 2023. Licence: CC BY-NC-SA 3.0 IGO.
  2. Centers for Disease Control (CDC). Monitoring selected national HIV prevention and care objectives by using HIV surveillance data: United States and 6 dependent areas–2013. HIV Surveill Suppl Rep 2015; 20:1–70.
  3. Guaraldi, G.; Orlando, G.; Zona, S.; Menozzi, M.; Carli, F.; Garlassi, E.; Berti, A.; Rossi, E.; Roverato, A.; Palella, F. Premature age-related comorbidities among HIV-infected persons compared with the general population. Clin. Infect. Dis. 2011, 53, 1120–1126. [CrossRef]
  4. Rickabaugh TM, Baxter RM, Sehl M, Sinsheimer JS, Hultin PM, Hultin LE, Quach A, Martinez-Maza O, Horvath S, Vilain E, Jamieson BD. Acceleration of age-associated methylation patterns in HIV-1-infected adults. PloS ONE. 2015;10:e0119201. [CrossRef]
  5. Guaraldi G, Prakash M, Moecklinghoff C, Stellbrink HJ. Morbidity in older HIV-infected patients: impact of long-term antiretroviral use. AIDS Rev 2014; 16:75–89.
  6. Ferrucci L, Fabbri E. Inflammageing: chronic inflammation in ageing, cardiovascular disease, and frailty. Nat Rev Cardiol. 2018;15(9):505–22. [CrossRef]
  7. Xia S, Zhang X, Zheng S, Khanabdali R, Kalionis B, Wu J, et al. An update on Inflamm-aging: mechanisms, prevention, and treatment. J Immunol Res. 2016;2016:8426874. [CrossRef]
  8. Nasi M, Pinti M, Mussini C, Cossarizza A. Persistent inflammation in HIV infection: established concepts, new perspectives. Immunol Lett 2014; 161:184–8. [CrossRef]
  9. McComsey GA, Kitch D, Daar ES, et al. Inflammation markers after randomization to abacavir/lamivudine or tenofovir/emtricitabine with efavirenz or atazanavir/ritonavir. AIDS 2012; 26:1371–85. [CrossRef]
  10. Brenchley JM, Price DA, Schacker TW, et al. Microbial translocation is a cause of systemic immune activation in chronic HIV infection. Nat Med 2006; 12:1365-1371. [CrossRef]
  11. Schacker TW, Nguyen PL, Beilman GJ, et al. Collagen deposition in HIV-1 infected lymphatic tissues and T cell homeostasis. J Clin Invest 2002; 110:1133-1139. [CrossRef]
  12. Naeger DM, Martin JN, Sinclair E, et al. Cytomegalovirus-specific T cells persist at very high levels during long-term antiretroviral treatment of HIV disease. PLoS One 2010; 5:e8886. [CrossRef]
  13. Atallah, Nathalie, et al. How healthy lifestyle factors at midlife relate to healthy aging. Nutrients 10.7 (2018): 854. [CrossRef]
  14. Schank, Madison, et al. The impact of HIV-and ART-induced mitochondrial dysfunction in cellular senescence and aging. Cells 10.1 (2021): 174. [CrossRef]
  15. Mugwe, Jane N., Michael M. Gicheru, and Joseph Mwatha. CIRCULATORY CYTOKINES AND HEMATOLOGICAL PROFILES: POSSIBLE BIOMARKERS OF HIV/AIDS DISEASE PROGRESSION. Journal of Health and Life-Sciences 5.1 (2019): 105-118. [CrossRef]
  16. Osuji, Faustina Nkechi, et al. The effects of highly active antiretroviral therapy on the serum levels of pro-inflammatory and anti-inflammatory cytokines in HIV infected subjects. Journal of biomedical science 25 (2018): 1-8. [CrossRef]
  17. So-Armah, K.A.; Tate, J.P.; Chang, C.H.; Butt, A.A.; Gerschenson, M.; Gibert, C.L.; Leaf, D.; Rimland, D.; Rodriguez-Barradas, M.C.; Budoff, M.J.; et al. Do biomarkers of inflammation, monocyte activation, and altered coagulation explain excess mortality between HIV infected and uninfected people? J. Acquir. Immune Defic. Syndr. 2016, 72, 206–213. [CrossRef]
  18. Boulware DR, Hullsiek KH, Puronen CE, et al. Higher levels of CRP, Ddimer, IL-6, and hyaluronic acid before initiation of antiretroviral therapy (ART) are associated with increased risk of AIDS or death. J Infect Dis 2011; 203:1637–46. [CrossRef]
  19. Sandler NG, Wand H, Roque A, et al. Plasma levels of soluble CD14 independently predict mortality in HIV infection. J Infect Dis 2011; 203:780–90. [CrossRef]
  20. Szymańska, B.; Jurkowska, K.; Knysz, B.; Piwowar, A. Differences in Expression of Selected Interleukins in HIV-Infected Subjects Undergoing Antiretroviral Therapy. Viruses 2022, 14, 997. [CrossRef]
  21. Kelesidis, Theodoros, et al. Changes in inflammation and immune activation with atazanavir-, raltegravir-, darunavir-based initial antiviral therapy: ACTG 5260s. Clinical Infectious Diseases 61.4 (2015): 651-660. [CrossRef]
  22. Asmuth DM, Ma ZM, Mann S, et al. Gastrointestinal-associated lymphoid tissue immune reconstitution in a randomized clinical trial of raltegravir versus non-nucleoside reverse transcriptase inhibitor-based regimens. AIDS 2012; 26:1625–34. [CrossRef]
  23. Massanella M, Negredo E, Puig J, et al. Raltegravir intensification shows differing effects on CD8 and CD4 T cells in HIV-infected HAARTsuppressed individuals with poor CD4 T-cell recovery. AIDS 2012; 26:2285–93. [CrossRef]
  24. Asmuth DM, Ma ZM, Hayes T, et al. Raltegravir (RAL) therapy is associated with reduced microbial translocation (MT) and monocyte activation in HIV infected subjects naive to antiretroviral therapy (ART). AIDS 2014 [abstract WEPE013]. In: 20th International AIDS Conference. 20–25 July 2014. Melbourne, 2014.
  25. Hatano H, Hayes TL, Dahl V, et al. A randomized, controlled trial of raltegravir intensification in antiretroviral-treated, HIV-infected patients with a suboptimal CD4+ T cell response. J Infect Dis 2011; 203:960–8. [CrossRef]
  26. Lake J, McComsey G, Hulgan T, et al. Switch to raltegravir decreases soluble CD14 in virologically suppressed overweight women: the Women, Integrase and Fat Accumulation Trial. HIV Med 2014; 15:431–41. [CrossRef]
  27. Vecchiet, Jacopo, et al. Interleukin-4 and interferon-gamma production during HIV-1 infection and changes induced by antiretroviral therapy. International Journal of Immunopathology and Pharmacology 16.2 (2003): 157-166. [CrossRef]
  28. Watanabe D, Uehira T, Yonemoto H, Bando H, Ogawa Y, et al. Sustained high levels of serum interferon- γ during HIV-1 infection: a specific trend different from other cytokines. Viral Immunol. 2010;23:619–25. [CrossRef]
  29. Reuben JM, Lee BN, Paul M, Kline MW, Cron SG, et al. Magnitude of IFNgamma production in HIV-1-infected children is associated with virus suppression. J Allergy Clin Immunol. 2002;110:255–61. [CrossRef]
  30. Miller EA, Spadaccia MR, OʼBrien MP, Rolnitzky L, Sabado R, Manches O, Frleta D, Bhardwaj N. Plasma factors during chronic HIV-1 infection impair IL-12 secretion by myeloid dendritic cells via a virus-independent pathway. J Acquir Immune Defic Syndr. 2012 Dec 15;61(5):535-44. [CrossRef]
  31. Mugwe, Jane Nyambura, Michael M. Gicheru, and Joseph Mwatha. "Plasma cytokine profiles as predictive biomarkers of HIV and AIDS progression among HIV patients attending Nakuru Provincial General Hospital, Kenya. Am. J. Med. Biol. Res. Am. J. Med. Biol. Res 4 (2016): 20-25.
  32. Maritati, Martina, et al. A comparison between different anti-retroviral therapy regimes on soluble inflammation markers: a pilot study. AIDS Research and Therapy 17 (2020): 1-7. [CrossRef]
  33. Balogun, Olayemi, et al. Effects of anti-retroviral therapy on baseline serum interleukin-18 levels in HIV–I infected patients relative to viral suppression and CD4+ gain: A prospective pilot study. BioMedicine 13.2 (2023): 24. [CrossRef]
  34. Torre, Donato, and Agostino Pugliese. Interleukin-18: a proinflammatory cytokine in HIV-1 infection. Current HIV research 4.4 (2006): 423-430. [CrossRef]
  35. Shete, Ashwini, et al. High IL-5 levels possibly contributing to HIV viremia in virologic non-responders at one year after initiation of anti-retroviral therapy. Microbial pathogenesis 143 (2020): 104117. [CrossRef]
  36. Borges, Álvaro H., et al. Factors associated with plasma IL-6 levels during HIV infection. The Journal of infectious diseases 212.4 (2015): 585-595. [CrossRef]
  37. Vecchiet J, Dalessandro M, Travasi F, Falasca K, Di Iorio A, et al. Interleukin-4 and interferon-gamma production during HIV-1 infection and changes induced by antiretroviral therapy. Int J Immunopathol Pharmacol. 2003;16:157–66. [CrossRef]
  38. Funderburg NT, Zidar DA, Shive C, et al. Shared monocyte subset phenotypes in HIV-1 infection and in uninfected subjects with acute coronary syndrome. Blood 2012; 120:4599–608. [CrossRef]
  39. Kelesidis T, Kendall MA, Yang OO, Hodis HN, Currier JS. Biomarkers of microbial translocation and macrophage activation: association with progression of subclinical atherosclerosis in HIV-1 infection. J Infect Dis 2012; 206:1558–67. [CrossRef]
  40. Burdo TH, Lo J, Abbara S, et al. Soluble CD163, a novel marker of activated macrophages, is elevated and associated with noncalcified coronary plaque in HIV-infected patients. J Infect Dis 2011; 204: 1227–36. [CrossRef]
  41. Asmuth DM, Ma ZM, Mann S, et al. Gastrointestinal-associated lymphoid tissue immune reconstitution in a randomized clinical trial of raltegravir versus non-nucleoside reverse transcriptase inhibitor-based regimens. AIDS 2012; 26:1625–34. [CrossRef]
  42. Massanella M, Negredo E, Puig J, et al. Raltegravir intensification shows differing effects on CD8 and CD4 T cells in HIV-infected HAARTsuppressed individuals with poor CD4 T-cell recovery. AIDS 2012; 26:2285–93. [CrossRef]
  43. Wada, Nikolas Itaru, et al. "The effect of HAART-induced HIV suppression on circulating markers of inflammation and immune activation." Aids 29.4 (2015): 463-471. [CrossRef]
Table 1. Relationship between the studied indicators and duration of cART.
GM-CSF IFN-γ IL-1β IL-12p70 IL-13 IL-18 IL-2 IL-4 IL-5 IL-6 TNF-alpha CRP d-dimer sCD14
Duration of cАРТ (years) rho 0,116 -0,271 0,030 -0,069 -0,087 -0,067 0,266 0,164 0,306 0,057 0,146 0,058 0,228 0,148
p 0,305 0,015 0,793 0,545 0,442 0,556 0,017 0,147 0,006 0,615 0,197 0,610 0,043 0,219
Table 3. Distribution in the levels of different cytokines depending on the presence or absence of a protease inhibitor. Darunavir-containing regimen showed markedly lower levels of IFN-γ, lower levels of IL-18 with small difference and markedly higher levels of sCD14.
PIs
no yes
Median Percentile 25 Percentile 75 Median Percentile 25 Percentile 75 p
GM-CSF 0 0 0 0 0 0 0,944
IFN-γ 38,09 19,04 61,25 0,4 0,1 1,69 <0,001
IL-1β 0 0 0,34 0,04 0 0,17 0,670
IL-12p70 0 0 2,28 0 0 0,25 0,187
IL-13 0 0 3,22 0 0 0 0,076
IL-18 175,56 124,54 262,48 129,04 50,7 244 0,023
IL-2 0 0 3,52 1,17 0 2,34 0,557
IL-4 0 0 3,33 0,83 0 1,67 0,242
IL-5 0 0 0 0 0 0,77 0,155
IL-6 2,11 0 6,33 0 0 7,91 0,269
TNF-alpha 0 0 5,74 0,2 0 0,72 0,780
CRP 7,04 4,4 12,3 6,6 4,9 13,12 0,725
d-dimer 0,17 0,1 0,25 0,17 0,16 0,22 0,768
sCD14 23998,51 6101,95 59594,53 61862,52 33129,88 431246,6 0,008
Table 4. Distribution in the levels of different cytokines depending on the presence or absence of CVDs.
CVDs
no yes
Median Percentile 25 Percentile 75 Median Percentile 25 Percentile 75 p
GM-CSF ,00 ,00 ,00 ,00 ,00 ,00 ,445
IFN-γ 30,15 ,65 54,50 34,47 17,45 74,76 ,456
IL-1β ,04 ,00 ,34 ,02 ,00 ,26 ,739
IL-12p70 ,00 ,00 1,14 ,57 ,00 1,14 ,874
IL-13 ,00 ,00 1,34 ,00 ,00 1,61 ,876
IL-18 160,48 120,79 253,89 172,18 129,79 280,53 ,642
IL-2 ,00 ,00 3,52 ,00 ,00 2,34 ,726
IL-4 ,00 ,00 2,29 ,00 ,00 ,42 ,450
IL-5 ,00 ,00 ,00 ,00 ,00 ,00 ,127
IL-6 2,11 ,00 6,33 3,17 ,00 10,27 ,487
TNF-alpha ,00 ,00 2,46 ,00 ,00 5,74 ,972
CRP 7,00 4,53 12,46 7,31 4,19 11,95 ,833
d-dimer ,18 ,11 ,24 ,15 ,10 ,22 ,446
sCD14 36759,55 6253,50 74012,82 18241,71 8706,53 29588,44 ,184
Table 5. Relationship between the studied indicators.
GM-CSF IFN-γ IL-1β IL-12p70 IL-13 IL-18 IL-2 IL-4 IL-5 IL-6 TNF-alpha CRP d-dimer sCD14
GM-CSF Spearman's rho 1,000 -0,003 0,154 0,179 0,105 -0,179 0,294 0,094 -0,133 0,329 0,265 0,008 -0,123 -0,220
p 0,980 0,174 0,111 0,356 0,112 0,008 0,405 0,240 0,003 0,018 0,942 0,279 0,065
IFN-γ Spearman's rho -0,003 1,000 0,209 0,453 0,351 0,692 -0,192 -0,011 -0,242 0,387 0,166 -0,018 -0,015 -0,223
p 0,980 0,063 0,000 0,001 0,000 0,087 0,924 0,031 0,000 0,141 0,878 0,895 0,061
IL-1β Spearman's rho 0,154 0,209 1,000 0,163 0,109 0,086 0,249 0,242 0,017 0,280 0,289 0,006 -0,054 -0,072
p 0,174 0,063 0,147 0,335 0,448 0,026 0,031 0,879 0,012 0,009 0,958 0,634 0,548
IL-12p70 Spearman's rho 0,179 0,453 0,163 1,000 0,220 0,282 -0,113 0,152 -0,070 0,315 0,155 0,119 -0,076 -0,114
p 0,111 0,000 0,147 0,050 0,011 0,319 0,180 0,537 0,004 0,169 0,295 0,503 0,343
IL-13 Spearman's rho 0,105 0,351 0,109 0,220 1,000 0,237 0,163 0,199 -0,052 0,202 0,126 0,247 -0,073 -0,057
p 0,356 0,001 0,335 0,050 0,034 0,149 0,077 0,650 0,072 0,264 0,028 0,523 0,635
IL-18 Spearman's rho -0,179 0,692 0,086 0,282 0,237 1,000 -0,297 0,085 0,008 0,248 0,095 0,019 -0,087 -0,165
p 0,112 0,000 0,448 0,011 0,034 0,008 0,453 0,944 0,027 0,400 0,871 0,444 0,169
IL-2 Spearman's rho 0,294 -0,192 0,249 -0,113 0,163 -0,297 1,000 0,133 0,129 0,102 0,123 0,135 0,204 -0,134
p 0,008 0,087 0,026 0,319 0,149 0,008 0,240 0,253 0,369 0,275 0,236 0,072 0,264
IL-4 Spearman's rho 0,094 -0,011 0,242 0,152 0,199 0,085 0,133 1,000 0,129 0,217 0,072 0,056 -0,038 0,163
p 0,405 0,924 0,031 0,180 0,077 0,453 0,240 0,255 0,053 0,528 0,626 0,742 0,176
IL-5 Spearman's rho -0,133 -0,242 0,017 -0,070 -0,052 0,008 0,129 0,129 1,000 -0,132 0,105 0,114 0,168 0,004
p 0,240 0,031 0,879 0,537 0,650 0,944 0,253 0,255 0,244 0,354 0,315 0,140 0,971
IL-6 Spearman's rho 0,329 0,387 0,280 0,315 0,202 0,248 0,102 0,217 -0,132 1,000 0,240 0,130 -0,095 -0,007
p 0,003 0,000 0,012 0,004 0,072 0,027 0,369 0,053 0,244 0,032 0,254 0,405 0,956
TNF-alpha Spearman's rho 0,265 0,166 0,289 0,155 0,126 0,095 0,123 0,072 0,105 0,240 1,000 0,042 0,081 -0,137
p 0,018 0,141 0,009 0,169 0,264 0,400 0,275 0,528 0,354 0,032 0,711 0,479 0,254
CRP Spearman's rho 0,008 -0,018 0,006 0,119 0,247 0,019 0,135 0,056 0,114 0,130 0,042 1,000 0,114 -0,050
p 0,942 0,878 0,958 0,295 0,028 0,871 0,236 0,626 0,315 0,254 0,711 0,316 0,682
d-dimer Spearman's rho -0,123 -0,015 -0,054 -0,076 -0,073 -0,087 0,204 -0,038 0,168 -0,095 0,081 0,114 1,000 0,063
p 0,279 0,895 0,634 0,503 0,523 0,444 0,072 0,742 0,140 0,405 0,479 0,316 0,602
sCD14 Spearman's rho -0,220 -0,223 -0,072 -0,114 -0,057 -0,165 -0,134 0,163 0,004 -0,007 -0,137 -0,050 0,063 1,000
p 0,065 0,061 0,548 0,343 0,635 0,169 0,264 0,176 0,971 0,956 0,254 0,682 0,602
Disclaimer/Publisher’s Note: The statements, opinions and data contained in all publications are solely those of the individual author(s) and contributor(s) and not of MDPI and/or the editor(s). MDPI and/or the editor(s) disclaim responsibility for any injury to people or property resulting from any ideas, methods, instructions or products referred to in the content.
Copyright: This open access article is published under a Creative Commons CC BY 4.0 license, which permit the free download, distribution, and reuse, provided that the author and preprint are cited in any reuse.
Prerpints.org logo

Preprints.org is a free preprint server supported by MDPI in Basel, Switzerland.

Subscribe

© 2024 MDPI (Basel, Switzerland) unless otherwise stated