1. Introduction
1.1. Context of Building Energy Performance
The negative impact of global human activities on the natural environment is well-documented and continues to escalate. The relentless consumption of nonrenewable resources, coupled with emissions to air, water, and soil, places significant pressure on Earth's ecosystems and jeopardizes the prospects for sustainable development for future generations. Paradoxically, despite a marked increase in awareness regarding the necessity of integrating sustainability principles into all economic activities, the overall environmental burden has continued to grow [
1,
2]. Despite increased societal awareness and efforts, this trend underscores the complexity and challenges of achieving meaningful environmental progress.
One of the most significant negative impacts on the future development of humankind is the current rate of natural resource consumption. Global consumption rates exceed the Earth's capacity to renew its raw material stocks by 70% [
3,
4]. Another critical environmental issue is the extent to which our daily activities influence global temperature value. Currently, global warming is considered the foremost and most pressing issue concerning the environmental dimension of sustainable development. According to the Intergovernmental Panel on Climate Change (IPCC) in its Sixth Assessment Report, the global surface temperature in 2020 was 1.1˚C higher than preindustrial levels [
5]. According to the IPCC report, the average annual greenhouse gas (GHG) emissions recorded between 2010 and 2019 surpassed those of previous decades. However, the growth rate of these emissions in the last decade was 1.3% per year, which is lower than the 2.1% per year recorded during 2000-2009.
Despite increased awareness of the adverse effects of GHGs on global warming in recent years, specific economic sectors continue to struggle with identifying and implementing practical solutions to enhance environmental performance. Currently, in the European Union (EU), energy production and consumption account for approximately 75% of total GHG emissions. Within this context, the construction sector is responsible for nearly 40% of the EU's total energy consumption [6-12]. Additionally, an analysis of sector-specific activities reveals that the built environment contributes to 36% of the EU's GHG emissions [
10,
11,
13,
14]. Given these statistics, the construction industry is rightly identified as a critical sector for mitigating the overall negative environmental impacts at the EU level. This sector plays a significant role in achieving the EU's declared objective of becoming climate-neutral by 2050 [
6,
7].
To achieve the objectives of the Green Deal, the European Union's strategic framework for significantly reducing the adverse global effects of climate change, it is essential to fully understand the impact of existing and future building stock on GHG emissions. In Europe, the built-up area is estimated to encompass approximately 25 billion square meters, with about 10 billion square meters completed before 1960 and over 15 billion square meters by 1990. Further analysis indicates that eight out of ten European buildings were constructed before 1990 [
15]. Considering the energy efficiency standards mandated by current building codes, 75% of the existing built environment is entirely energy inefficient [
14,
15]. Additionally, since design and execution standards enforcing energy efficiency were adopted post-1970, it can be concluded that infrastructure built before this period fails to meet the expected minimum energy performance levels [
15]. An evaluation of the standardized usage duration of buildings reveals that approximately 85% of the current building stock in the European Union, representing about 220 million units, was constructed before 2001. Despite advanced physical wear as per current technical regulations, almost the entire existing stock is projected to still be in use by 2050 [
12].
In addition to the high energy consumption encountered in buildings, which partially originates from the extraction and manufacture of construction materials, buildings consume significant amounts of energy during their operational phase for heating, cooling, domestic hot water production, mechanical ventilation and artificial lighting. This operational energy consumption is driven by standards that ensure residents' comfort and health safety conditions. In 2021, 6.9% of the EU population faced significant challenges maintaining adequate indoor temperatures during the cold season due to high energy costs [
16]. Therefore, beyond the fact that high energy consumption in buildings generates GHG emissions, contributing to global climate change, it also becomes increasingly expensive for occupants. Consequently, measures to renovate the existing building stock are essential. Currently, the renovation rate of the existing building stock across EU member states ranges between 0.4% and 1.2% per year [
7]. However, the rate of deep energy renovations—capable of reducing energy consumption by more than 60%—is only 0.2%, with areas lacking any renovated buildings [
13]. Furthermore, 75% of existing buildings have extremely inefficient thermal envelopes, placing significant pressure on energy consumption and increasing GHG emissions [
13,
15].
Therefore, the construction sector plays an essential role in the European Commission's roadmaps to achieve a climate-neutral continent by 2050 [
7,
13,
17]. A vital objective to be met by 2030 is the reduction of greenhouse gas emissions by 55%, a goal achievable if energy consumption for heating and cooling in the residential building sector is reduced by 18% [
13,
17]. Given that European households consume 64.4% of their energy for space heating [
18], it is imperative for professionals in building energetics to develop and implement advanced solutions to significantly enhance the energy performance of built infrastructure [19-22].
1.2. Heating Demand Calculation Approaches: ISO 52016 vs. PHPP
The calculation of heating demand, also known as the energy demand for heating, is a critical aspect of energy-efficient building design, influencing both the operational energy consumption and the overall sustainability of buildings. Two widely recognized methodologies for calculating heating demand are the ISO 52016 standard [
23] and the Passive House Planning Package (PHPP), which was developed by the Passive House Institute [
24]. While ISO 52016 provides detailed hourly and monthly calculation methods suitable for dynamic simulations, PHPP employs steady-state calculations tailored specifically for Passive House standards.
The ISO 52016-1 standard provides a comprehensive methodology for calculating buildings' heating and cooling energy needs. It includes both an hourly calculation method and a monthly calculation method, allowing for detailed dynamic simulations as well as simplified assessments depending on the specific requirements of the analysis. The hourly method, in particular, accounts for the influence of hourly and daily variations in weather, operational schedules, and user interactions, making it suitable for detailed thermal performance evaluations [
23,
25,
26,
27].
The application of ISO 52016-1, in assessing the energy demand for heating of the building envelope has been found to be efficient in several studies. Dijk [
28] and Degerfeld [
29] both highlight the advanced and improved hourly method of ISO 52016-1, which is better suited to deal with dynamic effects and provides increased accuracy. The standard's effectiveness is also demonstrated in its application to assess building cost-optimal energy performance levels in Italy [
30]. However, some variations have been observed in the heating energy needs calculated by ISO 52016-1 compared to its predecessor, ISO 13790. These variations are mainly attributed to using different surface heat transfer coefficients and modeling extra thermal radiation to the sky [
31]. Despite these variations, the overall efficiency of ISO 52016-1 in assessing energy demand for heating the building envelope is evident.
Key features of PHPP include the use of steady-state methods to estimate energy demand, which focuses on simplicity and reliability for Passive House design. It provides detailed calculations of heating and cooling demand, as well as other energy performance metrics, ensuring that buildings meet the stringent Passive House criteria. Additionally, PHPP is designed to be user-friendly, with clear guidelines and comprehensive documentation to support designers in achieving high energy performance standards [
32].
The accuracy of the PHPP in calculating energy demand for heating has been explored in several studies. Chen [
33] and Siegele [
34] found the PHPP to have acceptable precision, with the latter emphasizing the importance of a calibrated temperature for accurate results. Kang [
35] further improved the reliability and robustness of the PHPP through a bottom-up approach. Mahboob [
36] and Yu [
37] demonstrated the tool's effectiveness in assessing energy-saving potential and comparing thermal performance. However, Šteffek [
38] highlighted the impact of different computational methods on the tool's accuracy, suggesting the need for further research. Mitchell and Natarajan [
39] highlighted that normalizing measured space heating energy data by adjusting for variations in internal and external temperatures enhances the accuracy of comparisons with building models. This normalization can be achieved using PHPP and the Standard Assessment Procedure (SAP), which is the UK Government’s methodology for measuring the energy performance of dwellings, without needing site-specific assessments. Similarly, Johnston et al. [
40] show that Passive House (PH) standards reliably achieve predicted energy savings with minimal performance gaps. This reliability is attributed to stringent quality assurance and strict adherence to design standards, leading to significantly reduced space heating energy consumption compared to conventional buildings.
Comparative studies between ISO 52016 and PHPP highlight several key differences and similarities, emphasizing their advantages in different contexts. Regarding accuracy in calculations, ISO 52016's hourly method allows for more detailed and dynamic simulations compared to the steady-state approach of PHPP. This aspect can lead to more accurate energy demand predictions under varying conditions. Nevertheless, regarding usability, the PHPP is often praised for its simplicity and ease of use, making it accessible for designers focused on Passive House standards [
33,
35]. In contrast, ISO 52016, particularly the hourly method, requires more detailed input data and can be more complex to implement [
26].
1.3. The National Methodology for Calculating the Energy Performance of Buildings
In light of the recent update to the national methodology for calculating the energy performance of buildings, Mc001-2022 has adopted the monthly calculation approach from ISO 52016. The Mc001-2022 [
41] is a comprehensive calculation framework used in Romania for assessing the energy performance of buildings. This methodology is detailed in the national regulation and aligns with European directives on energy efficiency [
42].
The Mc001-2022 methodology includes several key components and calculation procedures, starting with calculating the thermal transmittance (U-value) of building envelope components, including walls, roofs, floors, windows, and doors. Additionally, thermal bridges are considered, with specific guidelines on accounting for linear and point thermal bridges in the overall heat transfer calculations. The energy needs for heating and cooling are determined based on the thermal performance of the building envelope and the efficiency of the heating, ventilation, and air conditioning (HVAC) systems. The methodology uses monthly or hourly climatic data to accurately estimate the heating and cooling demand, considering external temperatures, solar radiation, wind speed, and other relevant climatic factors. Specific boundary conditions are set for internal and external temperatures, internal heat gains, and ventilation rates to ensure a standardized approach to calculating energy performance. Although the Mc001-2022 primarily uses a monthly calculation approach, it can incorporate hourly data for more detailed simulations, especially for dynamic thermal performance assessments [
41].
Despite that ISO 52016-1 uses detailed climatic data, including hourly variations, to provide an accurate estimation of heating and cooling needs [
23], Mc001-2022 utilizes comparable climatic data but tailors it to Romanian climatic conditions [
43], ensuring that the calculations reflect local environmental factors accurately. ISO 52016-1 is designed for broad application across various climates and building types, whereas Mc001-2022 explicitly addresses the Romanian context, ensuring compliance with national regulations and standards.
Considering the discussions among specialists in the field of energy-efficient building design, various perspectives have emerged regarding the most accurate calculation method that closely reflects real-world phenomena when discussing the heat demand of a building. Heat demand is a major indicator in achieving nearly zero energy building (nZEB) levels [
42], as it directly influences the overall energy efficiency and sustainability of a building.
A crucial method to enhance the accuracy of these calculations and improve energy efficiency is the “fabric-first” approach, which prioritizes the thermal performance of the building envelope before considering mechanical systems [
44]. This strategy is vital in reducing heating demand, as it enhances thermal performance, airtightness and minimizes thermal bridging, thereby significantly lowering heat loss and the overall energy required for space heating. This approach, along with mechanical ventilation and heat recovery, solar thermal collectors, and hot water tanks, is a key strategy for reducing energy demand in green residential architecture [
45].
In this context, the present paper presents and discusses the results obtained using the PHPP [
24] and the Mc001-2022 [
43] on two residential buildings at different stages of thermal rehabilitation. In addition to the numerical simulations performed, the paper also provides a concise overview of the results obtained with both methods. Based on the derived results, the paper offers practical advice for practitioners seeking to enhance the accuracy and reliability of energy performance assessments in the building sector.
2. Materials and Methods
2.1. Description of Case Study Buildings
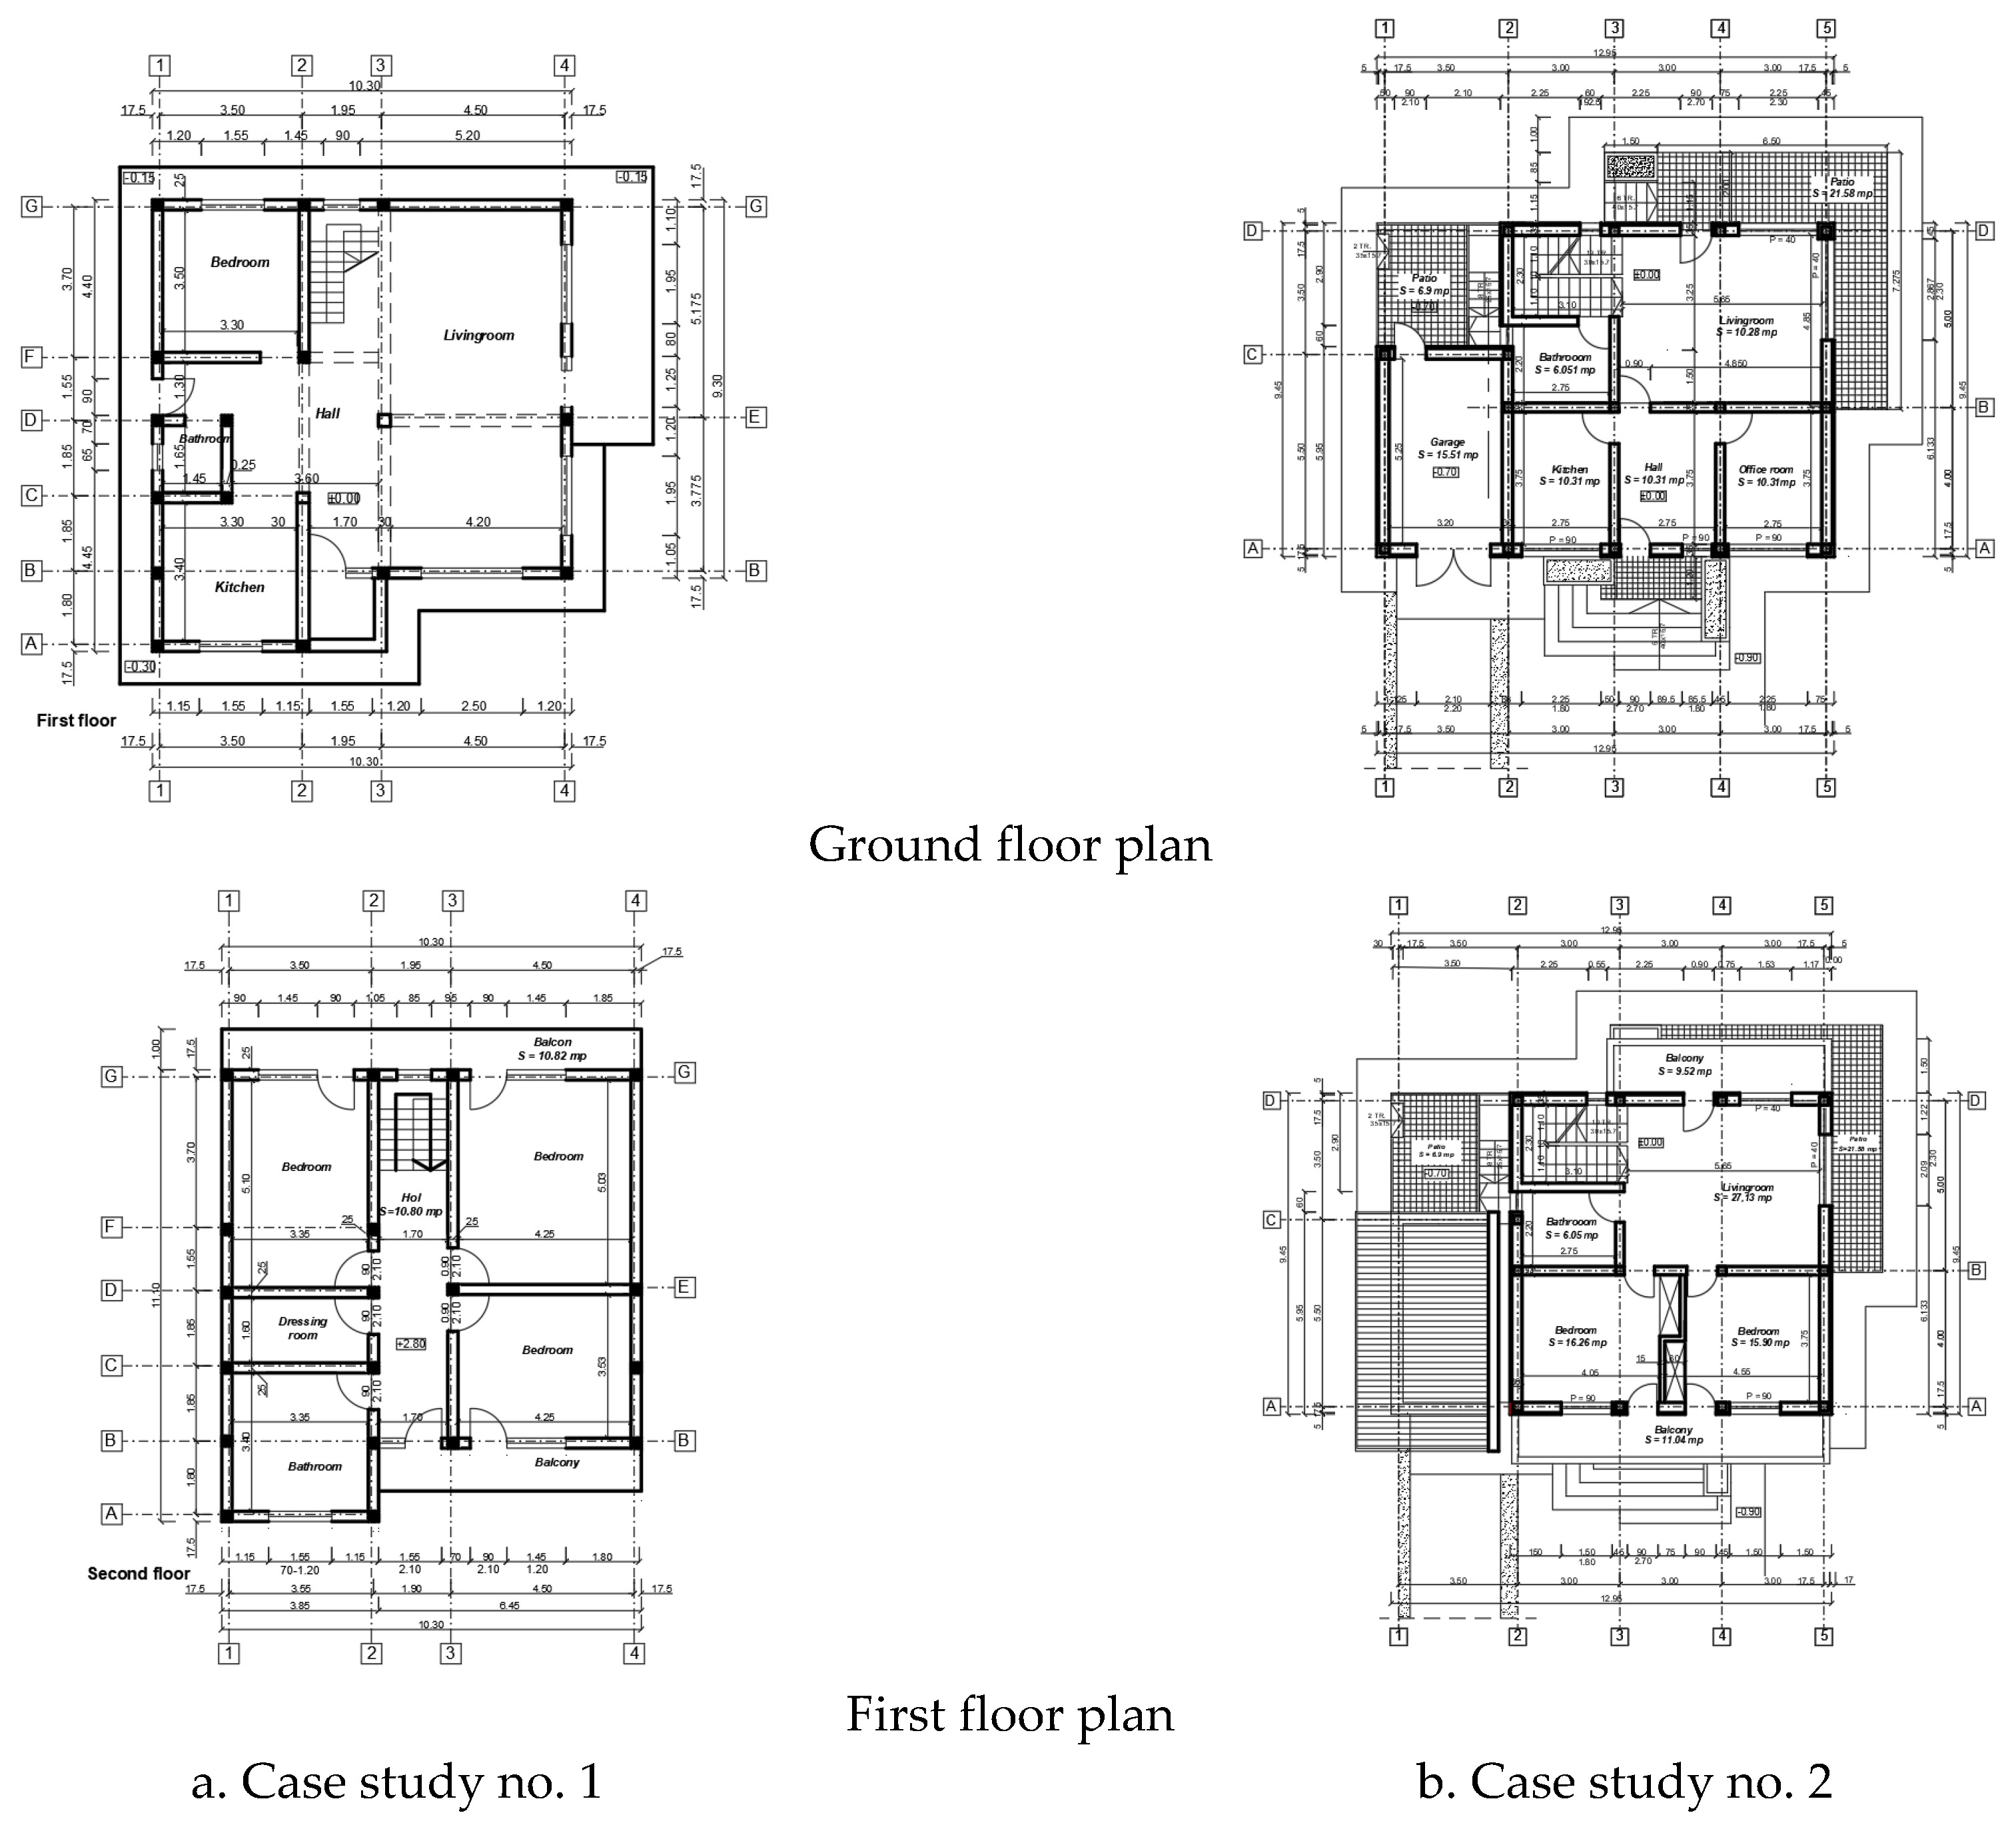
Within the framework of this research study, two residential buildings, each having a height regime of two floors (i.e., a ground floor and a first floor) and built in 2008 in Iași County, Romania, were analyzed (see
Figure 1a,b). The analysis primarily focused on assessing the heat demand of these buildings, considering various stages of thermal rehabilitation to evaluate the impact on their overall thermal performance patterns.
To facilitate the calculation of heating demands, it is essential to consider the geometrical characteristics of the two buildings under study.
Table 1 provides these details, which were used in the computation process. The thermal envelope area [m²] refers to the total surface area of all building components that separate the conditioned indoor environment from the unconditioned outdoor environment, including walls, roofs, floors, windows, and doors. This metric is crucial for understanding heat loss or gain through the building envelope. The heated interior volume [m³] indicates the total volume of the indoor space that is actively heated, which affects the building's heating load and the amount of energy required to maintain a comfortable indoor climate. The heated indoor floor area [m²] represents the total floor area of all spaces within the building that are actively heated, providing insight into the distribution and effectiveness of the heating system [
43,
46]. These parameters are essential for assessing the thermal performance of the buildings under study.
The thermal envelopes of the buildings are defined by the following components: the slabs on the ground, the external walls, the roof structure, and the external openings (i.e., windows and doors). The layers defining the opaque construction details and their corresponding thicknesses are provided in
Table 2. This data was used to determine the thermal performance of each building envelope component, represented by the thermal transmittance U [W/(m
2.K)] values for each assessed envelope element.
*According to the Romanian thermotechnical design norm C107/5-2005, when determining the thermal performance of building envelope components in contact with the ground, two soil layers with a combined thickness of 7 meters must be considered to represent local ground conditions accurately and to determine the overall thermal transfer coefficient of the floor [
47]. This requirement is essential to accurately evaluate the thermal transfer between the building and the ground, as the soil layer significantly influences the thermal transfer coefficient and, consequently, the building's energy performance. The properties of the materials considered in simulations are presented in
Table 3.
In the case studies of the numerical simulations of the VTB 4, HTB 5, and HTB 6 thermal bridges, equivalent thermal conductivities for the window frame and the glazing unit were determined. These values were derived in direct accordance with the solutions implemented in the building and their corresponding thermal transmittance.
The thermal bridges identified within the building envelope were defined following the guidelines provided by the Romanian building norm C107-2005 [
46]. The identified thermal bridges are presented in
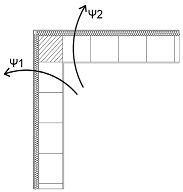
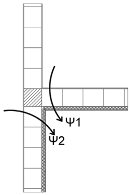
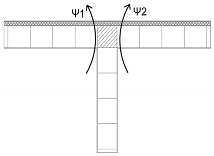
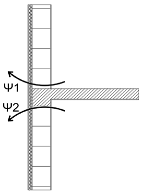
Table 4, where "V" denotes thermal bridges identified along a vertical length, and "H" denotes thermal bridges identified along a horizontal length. This classification helps distinguish the orientation and specific locations of the thermal bridges within the building envelope, ensuring a comprehensive analysis of their impact on thermal performance.
2.2. Numerical Simulation Methods and Boundary Conditions for Thermal Bridge Analysis
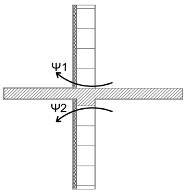
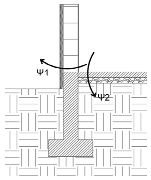
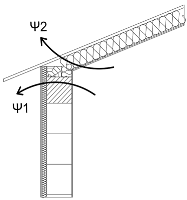
To evaluate the impact of the linear thermal bridges detailed in
Table 4, the authors conducted a series of finite element method (FEM) numerical simulations using the specialized software RDM version 7.04 [
48]. These simulations were performed under the stipulations of the Romanian building norm C107-2005 [
46] and the European standard EN ISO 10211 [
49]. Further, the calculations employed equation 1 to determine the linear heat transfer coefficient Ψ, ensuring compliance with national and international design norms for thermal performance assessment:
where:
- -
L2D – the thermal coupling coefficient obtained from a 2-D calculation of the component separating the two environments being considered [W/m·K];
- -
Uj – the thermal transmittance of the 1-D component, j, separating the two environments being considered [W/m2·K];
- -
lj – the length over which the value Uj applies [m].
The boundary conditions for the modelling and simulation were established based on the Romanian design legislation, which specifies the following values: exterior temperature Te of -18˚C (specific for Iași, classified in the III
rd climatic zone); indoor temperature Ti of 20˚C; and soil temperature at a depth of 7 meters Tp of 9˚C [47, 50].For the calculation of the considered linear thermal bridges, the values specified by the Romanian design norm [
41,
46], were as follows:
- -
RSi=0.125 [m2K/W] – for the exterior wall, the intermediary reinforced concrete slab and the roof;
- -
RSi=0.167 [m2K/W] – for the slab on the ground;
- -
RSe=0.042 [m2K/W] – for all building envelope components in contact with the exterior environment;
- -
RSe=0 [m2K/W] – for the building envelope components in contact with the ground (i.e., HTB 3 thermal bridge case).
Table 4.
Classification and details of the assessed linear thermal bridges.
2.3. Overview of Heating Demand Calculations
To assess the heating demand of the buildings, the authors utilized the PHPP version 9.6 along with the DesignPH tool. PHPP is an Excel-based tool used to determine buildings' heating demand and overall energy performance. DesignPH, an extension of PHPP, provides a 3D data entry interface to optimize the thermal performance of buildings. To calculate the heat demand using PHPP, the tool considers various parameters including the building's geometry, insulation levels, window types, ventilation system, and internal heat gains. PHPP performs a monthly balance method, considering the thermal envelope's heat losses and gains, solar gains, and internal heat sources. It calculates the specific heat demand by assessing the difference between heat losses and gains, ensuring the building maintains comfortable indoor temperatures [
51]. The results help optimize design features to meet Passive House standards for low energy consumption.
The PHPP derives its exterior boundary climatic data from multiple reliable sources to ensure proper energy balance calculations. PHPP uses local climate data specific to each project location, which is incorporated into the tool to reflect the actual environmental conditions the building will face. This data is often sourced from local meteorological stations and standardized climate datasets provided by national or international agencies [
51].
To determine the energy demand for heating according to Mc001/2022 [
41], a monthly calculation method is applied for both sensible and latent heat in heating and cooling scenarios. This method includes two main categories: the basic energy demand and the specific system energy demand. The basic energy demand calculation does not account for the influence of building systems but includes heat recovery from ventilation. The specific system energy demand calculation considers the impact of systems, such as recoverable thermal losses, set temperature corrections, and system operation duration, potentially requiring iterative calculations due to system-specific characteristics. The calculations also consider the energy exchange across the building envelope, solar gains, radiation, and internal heat and moisture sources. As previously mentioned, the boundary conditions defined by the exterior temperature monthly average values, the solar radiation intensities, and the average difference between the apparent sky temperature and air temperature are taken as defined by national design norms [41,43, 46,50].
3. Results and Discussion
3.1. Analysis of Resultant Linear Heat Transfer Coefficients
As previously mentioned, several thermal bridges were investigated, and the resulting values for the linear thermal transmittance coefficient Ψ are detailed in
Table 6. In connection with the conditions observed at the building site, the emphasis was placed on optimizing the thermal performance of the external walls by varying the existing constructive detail in terms of increasing the thermal insulation thickness in 5 cm increments from case scenario A to case scenario D, for each of the assessed buildings. The results in terms of thermal transmittance values for each assessed building envelope component are provided in
Table 5.
The resulting values, presented in
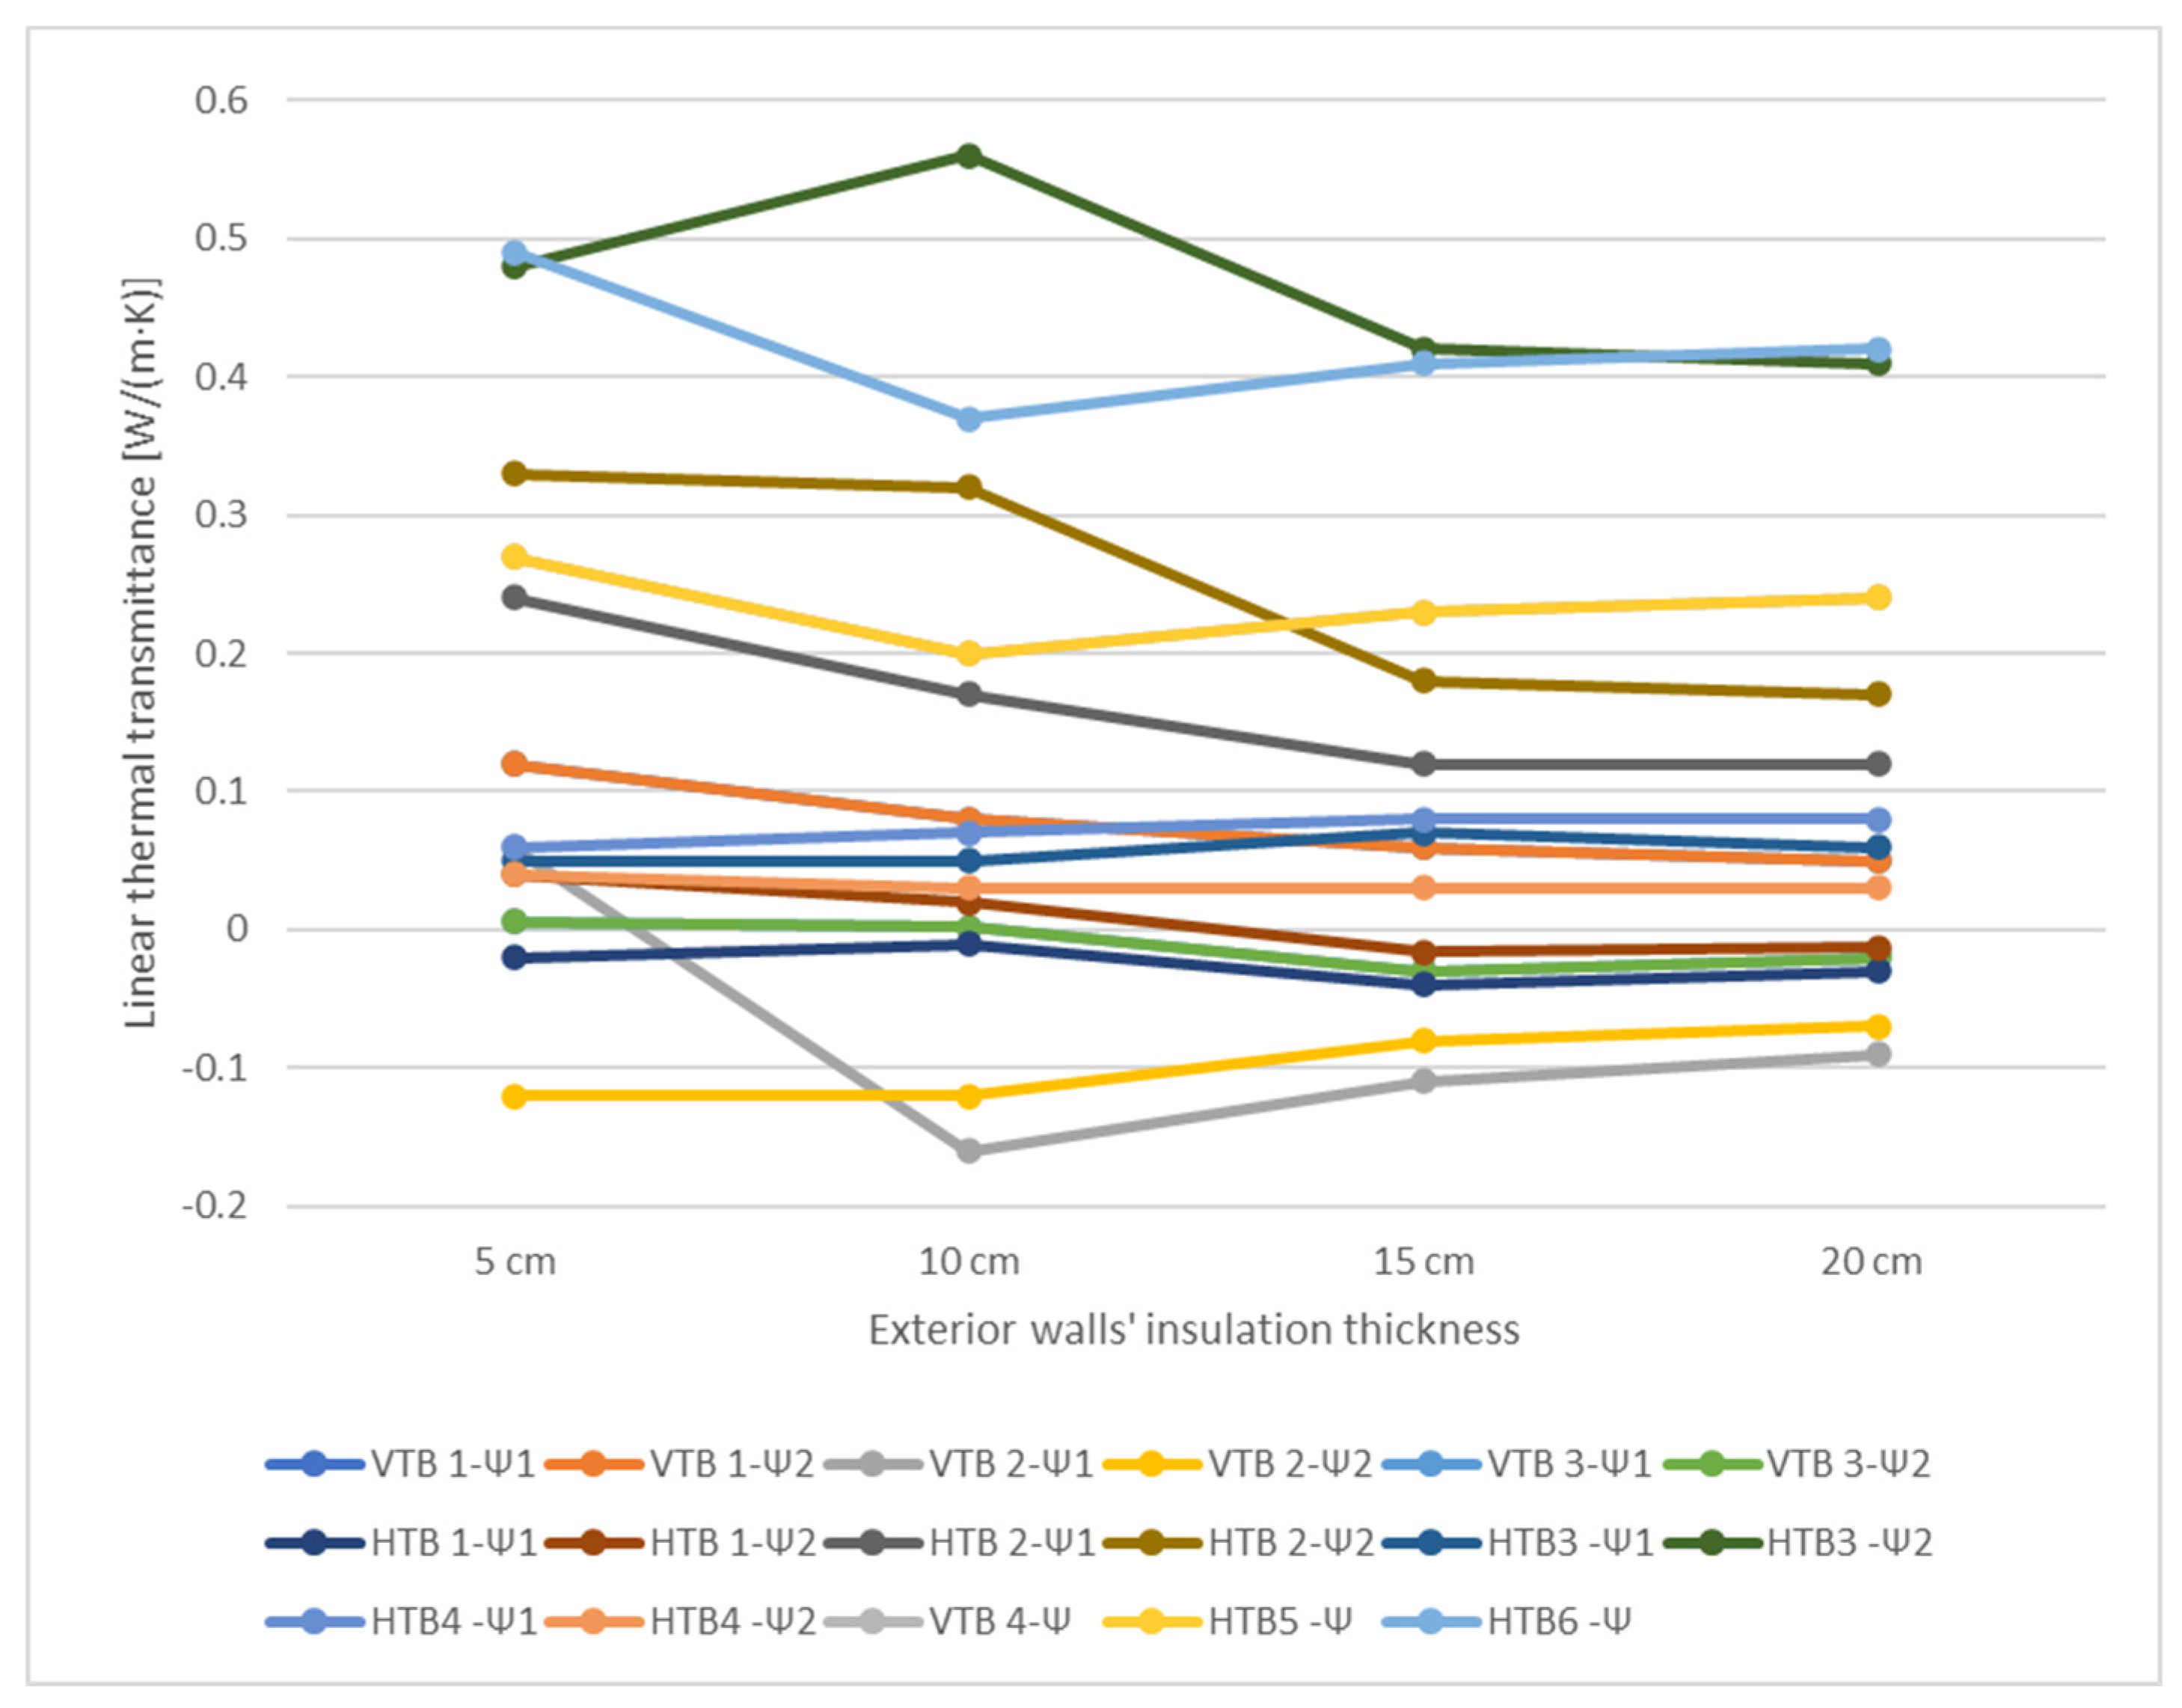
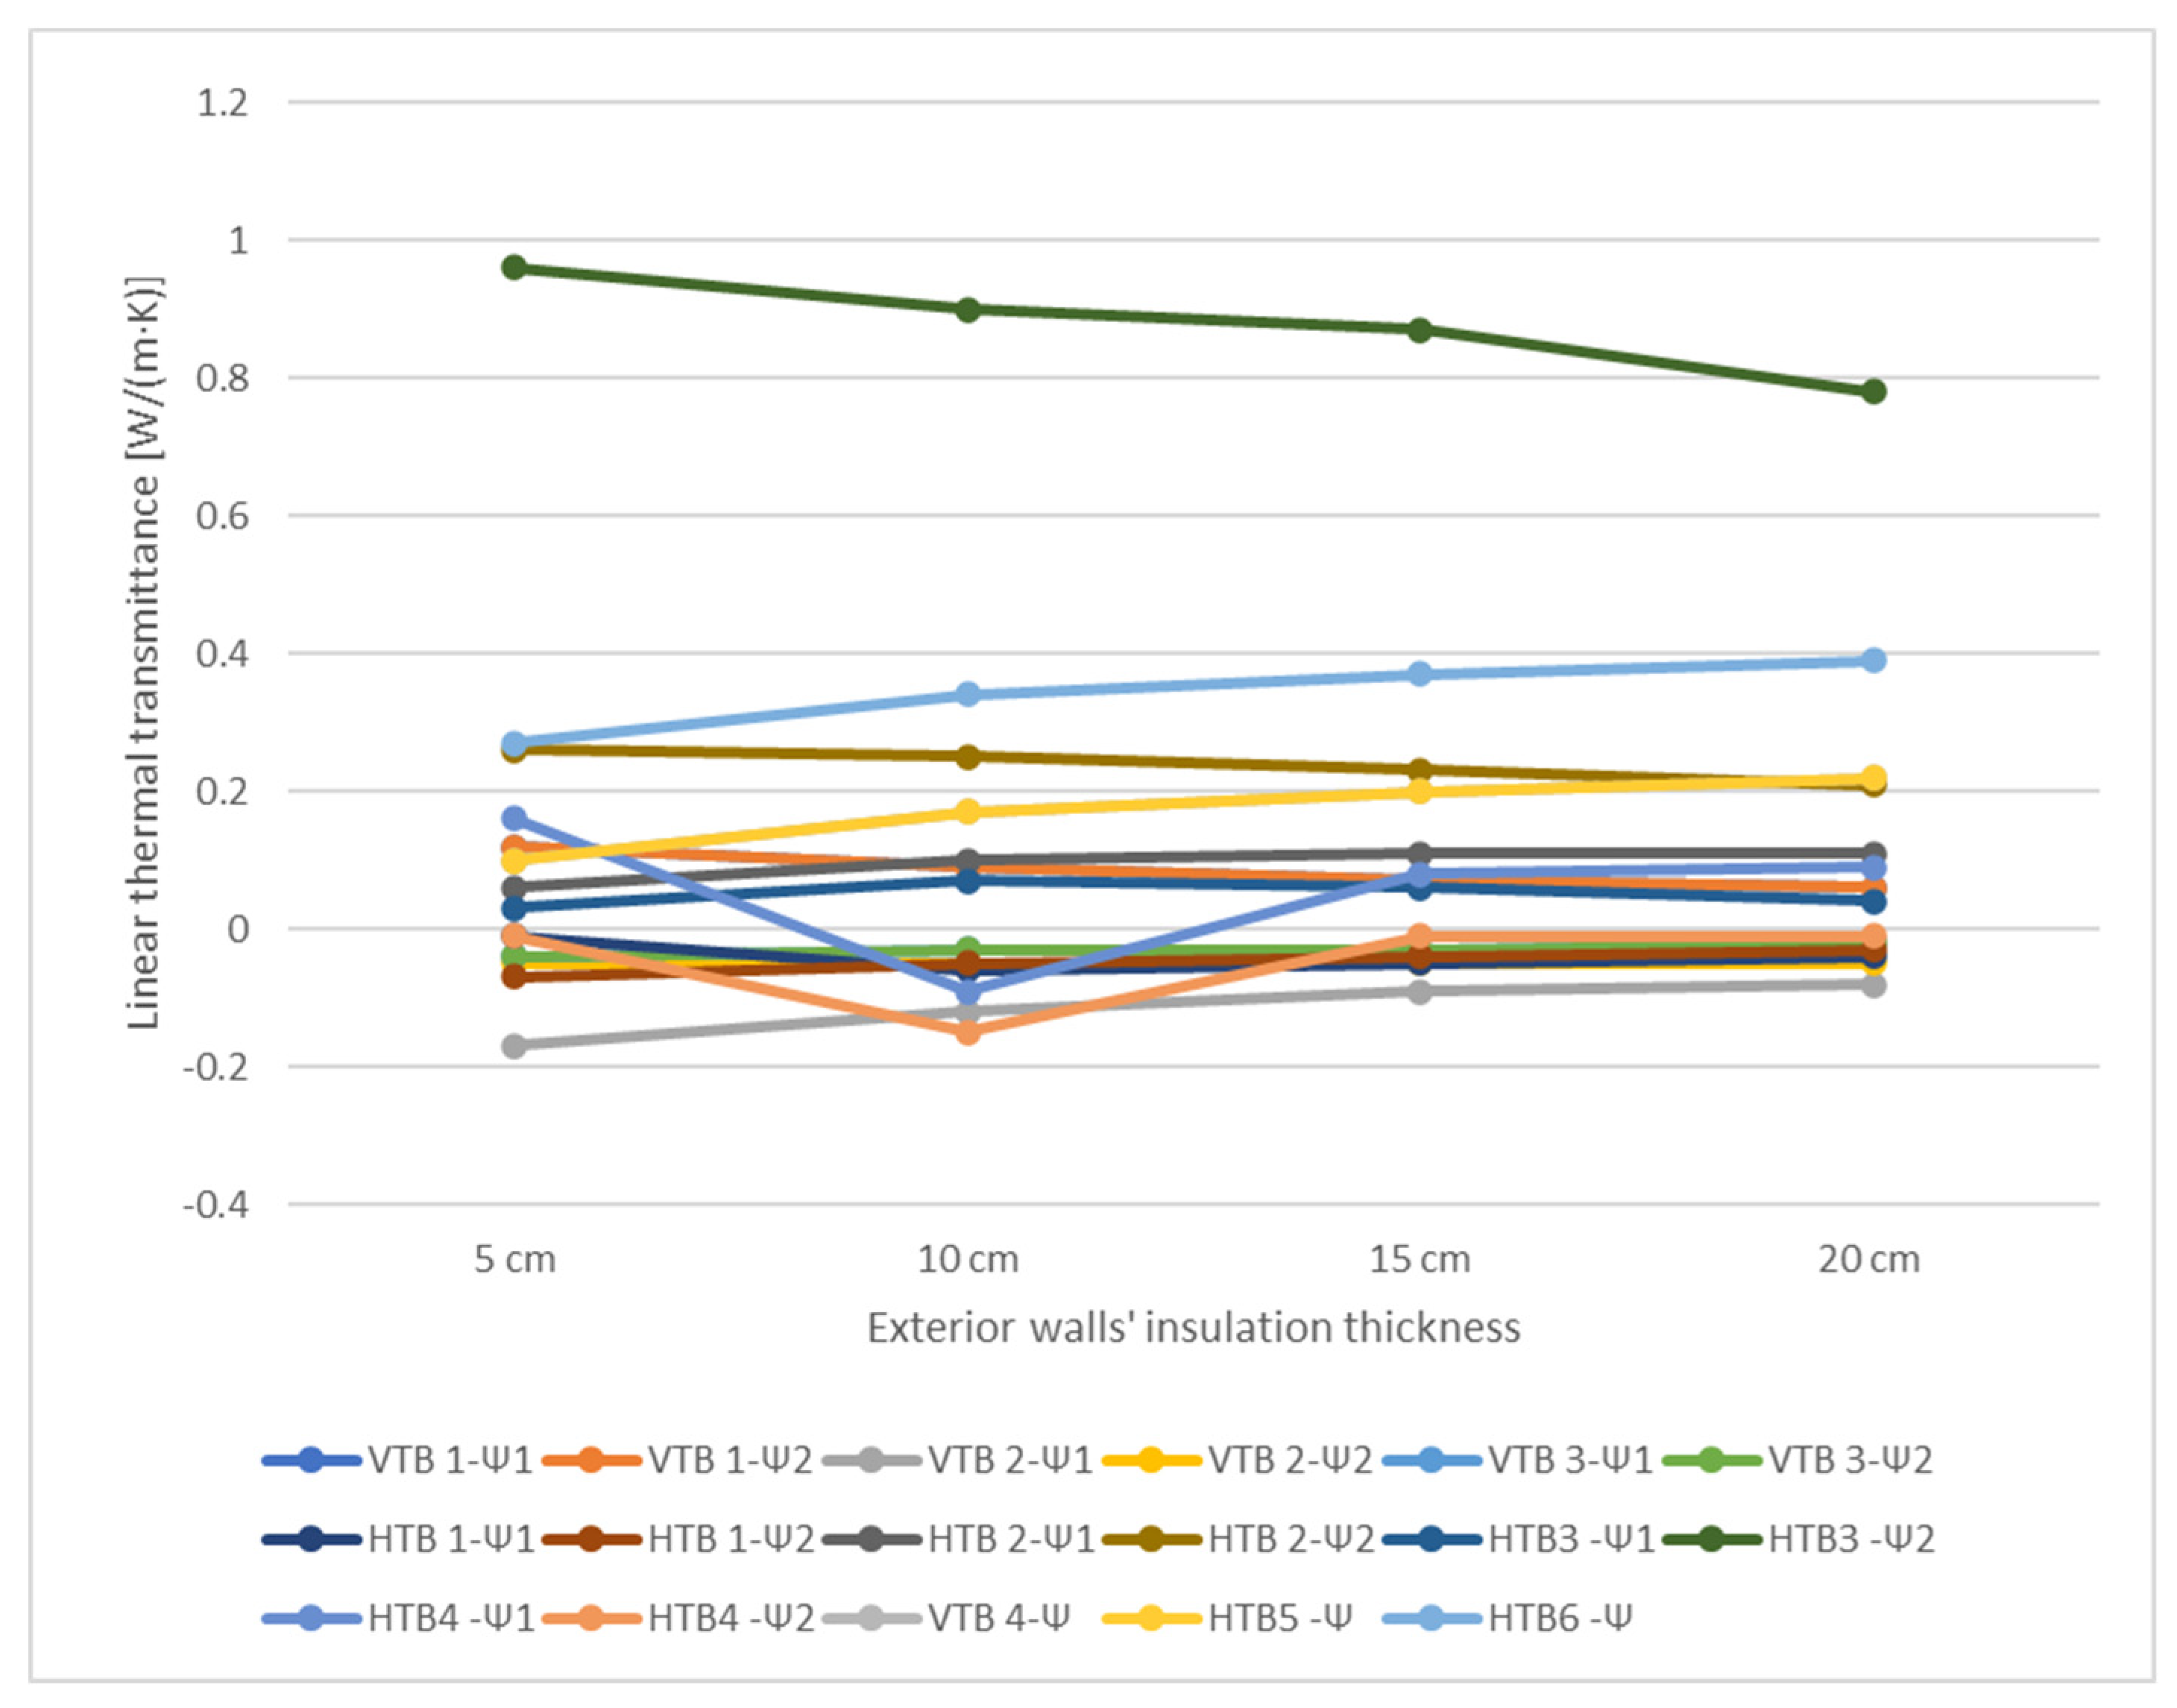
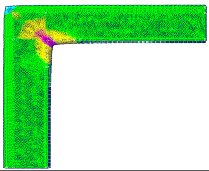
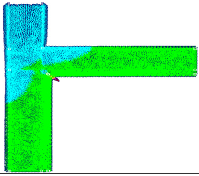
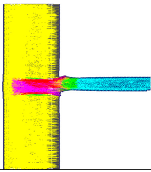
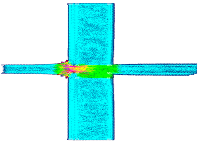
Table 6, show that in the case of the existing state of the considered buildings, almost all linear thermal bridges have a massive adverse effect in both considered case studies. A correlation between thermal bridge type and the considered numerical simulation studies is presented in
Figure 2 and
Figure 3.
The analysis of the Ψ-values obtained reveals significant variations depending on the type of thermal bridge and the thickness of the wall insulation. For instance, the exterior corner wall junctions (i.e., VTB1, VTB2, and VTB3) show a decrease in Ψ-values as the insulation thickness increases. Specifically, for VTB1, the Ψ-value decreases from 0.11 W/(m·K) with 5 cm insulation to 0.05 W/(m·K) with 20 cm insulation. Thus, a reduction of 50% for the 1st case study building and 60% for the 2nd case study building as compared to the initial case is identified. This trend is consistent across other junction types, indicating that increased insulation thickness effectively reduces thermal bridging.
For exterior wall-to-balcony junctions (i.e., HTB2), the Ψ-values are relatively high, reflecting the challenge of insulating these areas effectively. At 5 cm insulation, the Ψ-value is 0.33 W/(m·K), which reduces to 0.11 W/(m·K) at 20 cm insulation, indicating a 66% reduction in the thermal bridge negative impact. The high initial Ψ-value indicates significant heat loss through the balcony junction, which is mitigated to some extent by increasing insulation.
Exterior wall-to-ground slab junctions (i.e., HTB3) also demonstrate a reduction in Ψ-values with increased insulation, from 0.48 W/(m·K) at 5 cm to 0.21 W/(m·K) at 20 cm. These findings underscore the importance of addressing ground-related thermal bridges in improving overall thermal performance.
As will be further observed, certain thermal bridges substantially impact the final heating demand. This issue is particularly evident at the window-wall junctions due to the lack of proper thermal insulation connection to the window frame, a detail commonly addressed in high-performance energy-efficient buildings. Unfortunately, the failure to conform to this connection detail indicates that even with a significant increase in the wall insulation layer, some existing thermal bridges will not see notable improvements in Ψ- values. Consequently, this will also limit the potential reduction in the building's energy consumption.
3.2. Comprehensive Analysis of Heating Demand and Performance Discussion
3.2.1. PHPP results
This section thoroughly evaluates the heating demand calculations conducted using the PHPP version 9.6 and the Mc001/2022 methodologies, as described in
Section 2. The analysis focuses on the heating demand results derived from these tools and discusses their implications for building thermal performance.
To comprehensively assess the heating demand, the Mc001-2022 calculations were performed under both continuous operation and intermittent heating, incorporating interior temperature reductions. The continuous operation mode considers a constant set temperature for the entire period, ensuring that the heating system maintains a stable indoor environment. The methodology applies a correction factor for intermittent heating to account for periods when the set temperature is reduced [
41]. This approach aligns with the procedures outlined in SR EN ISO 52016-1 [
23]. By applying these correction factors, the Mc001-2022 methodology accurately represents the building's heating demand under realistic operating conditions, capturing the dynamic interactions between the heating system and user behavior.
Thus, a comparative analysis of the results obtained from both methodologies is conducted, examining the factors contributing to discrepancies and similarities. Further discussions also address the impact of boundary conditions, such as external temperature averages, solar radiation intensities, and the apparent sky temperature difference, on the accuracy and reliability of the heating demand assessments.
The heating demand results obtained using PHPP for the various scenarios are presented in
Table 7, and thus providing a baseline for comparison. The data reveals a clear trend: as the thermal performance of the building envelope increases, the heating demand decreases significantly in both case studies.
In scenario A, the heating demand is the highest, at 127.10 kWh/m²/year for case study no. 1 and 166.90 kWh/m²/year for case study no. 2. This high demand reflects the insufficient thermal performance of the inadequate thermotechnical dimensioning of the constructive details of building envelope components.
As the insulation thickness increases in Scenario B, the heating demand drops significantly, with a reduction of approximately 22.8% for Case Study No. 1 and 18.4% for Case Study No. 2. This reduction demonstrates the positive impact of additional insulation on the building envelope thermal performance and consequently on the energy efficiency of the building.
Further increases in insulation thickness in Scenario C result in even lower heating demands, corresponding to reductions of approximately 33.1% and 19.7%, respectively, compared to Scenario A. This continued decline underscores the importance of enhanced insulation in reducing energy consumption. When comparing Scenario B to Scenario C, the additional insulation results in further reductions of 13.3% for Case Study No. 1 and 1.6% for Case Study No. 2.
Finally, in Scenario D, the heating demand reaches its lowest value, translating to reductions of approximately 36.2% for Case Study No. 1 and 23.2% for Case Study No. 2. These results highlight the substantial energy savings that can be achieved through significant improvements in the thermal performance of building envelope components.
When comparing Scenario C to Scenario D, there are further reductions in heating demand of 4.6% for Case Study No. 1 and 4.3% for Case Study No. 2. While these percentages might seem modest, they can be better highlighted when considering the overall energy consumption for heating the building.
The incremental reduction from Scenario C to Scenario D is significant in maintaining low energy consumption levels, which is essential for buildings aiming to meet high energy performance standards. For instance, the additional insulation helps minimize heat loss further, thereby reducing the overall energy demand for heating. This improvement contributes to achieving an A class energy efficiency rating and aligns with the stringent requirements for nearly Zero Energy Building (nZEB) levels [
41], which are designed to minimize energy usage and promote sustainability. Moreover, the reductions in heating demand facilitate a decrease in primary energy consumption, making it easier for residential buildings in climatic zone III to comply with nZEB standards. Considering that the III
rd climatic zone is characterized by specific climatic conditions that can significantly influence energy requirements, it is essential to ensure optimal insulation and minimize thermal bridges. These actions are critical steps to achieve the mentioned targets and enhance the building's energy performance.
3.2.2. Mc001 results
To comprehensively understand the impact of different calculation methodologies on heating demand, comparing the results obtained from both PHPP and Mc001-2022 approaches is essential. In this analysis, calculations with Mc001-2022 are presented for two scenarios: the first scenario uses the external climate conditions as specified by PHPP, while the second scenario employs the external climate conditions mandated by national design legislation. This approach allows for analyzing the consistency and reliability of the heating demand assessments across different methodologies and climatic data sources. Therefore,
Table 8 provides the heating demand results calculated using Mc001-2022 with PHPP climatic data.
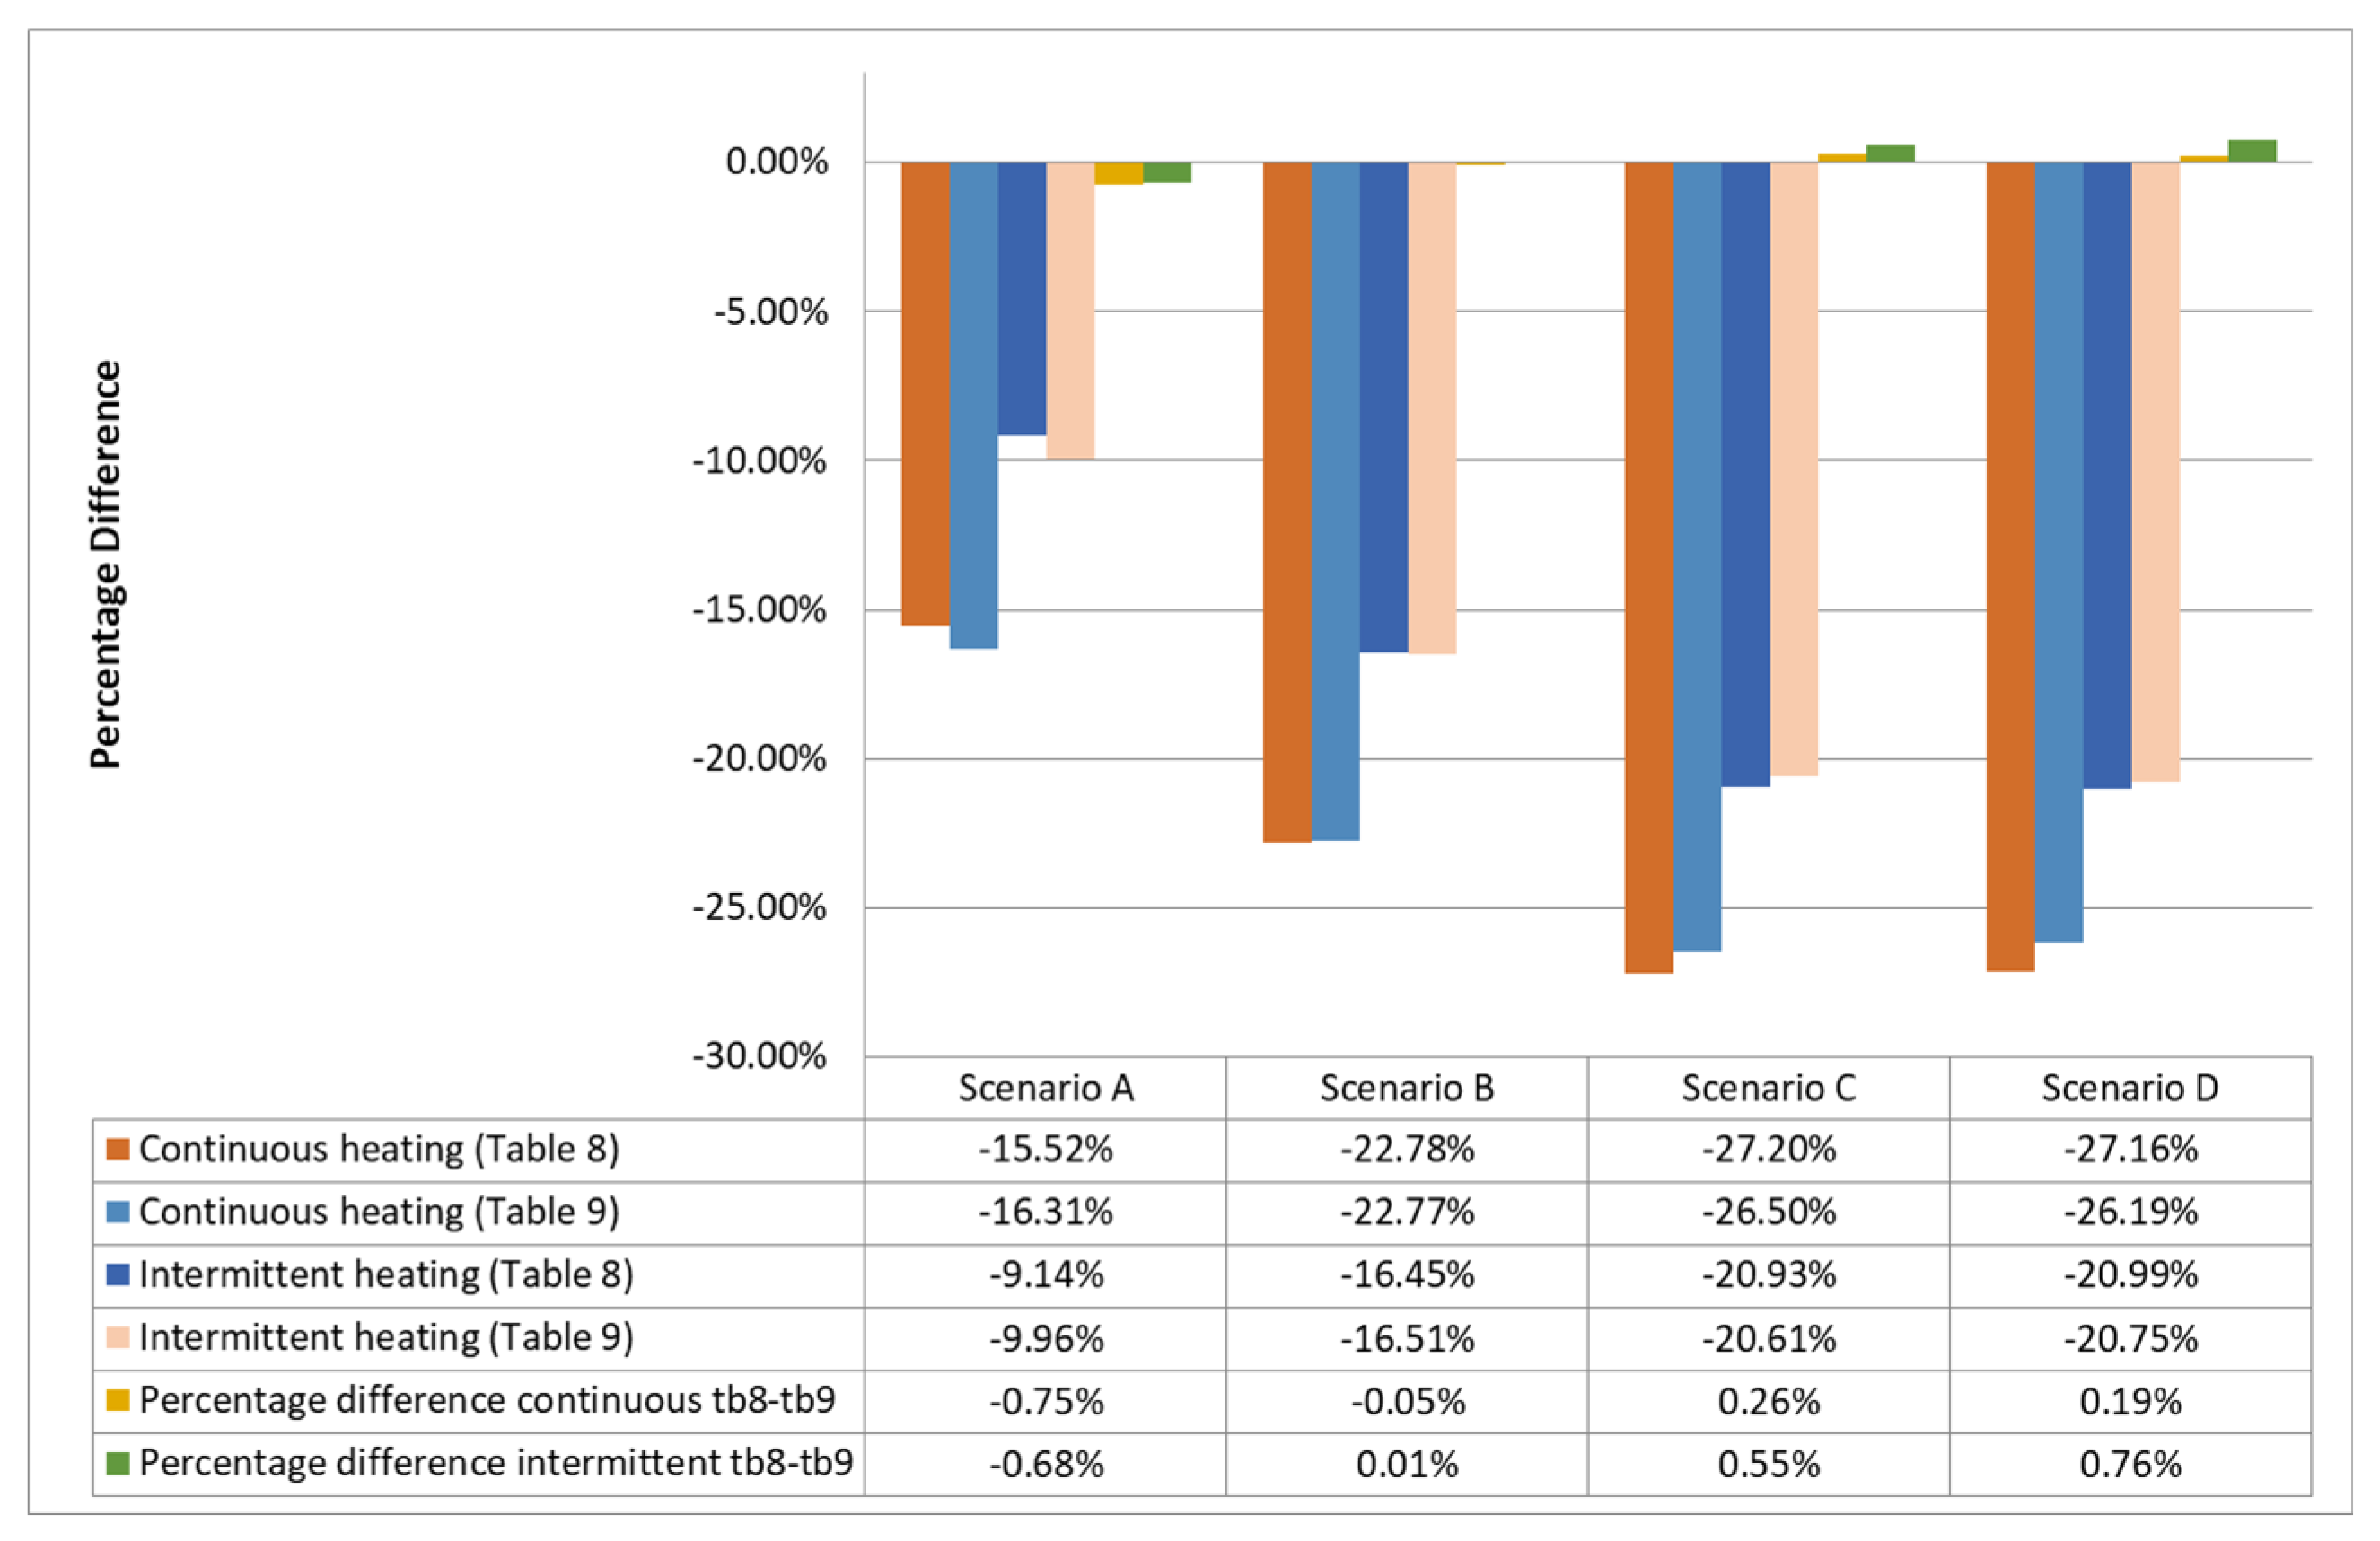
The comparative analysis for Case Study No. 1 reveals the following (see
Figure 4): In Scenario A, the Mc001-2022 methodology shows an increase in heating demand compared to PHPP, with a difference of approximately 15.5% for continuous heating and an increase of approximately 9.1% for intermittent heating. In Scenario B, continuous heating using Mc001-2022 is higher by approximately 22.8% compared to PHPP, and intermittent heating demand is approximately 16.4% higher. Scenario C indicates a 27.2% higher heating demand for continuous heating and a 21.0% higher demand for intermittent heating when using Mc001-2022 compared to PHPP. Finally, in Scenario D, the Mc001-2022 methodology shows a 27.1% increase in continuous heating demand and a 21.0% increase in intermittent heating demand compared to PHPP.
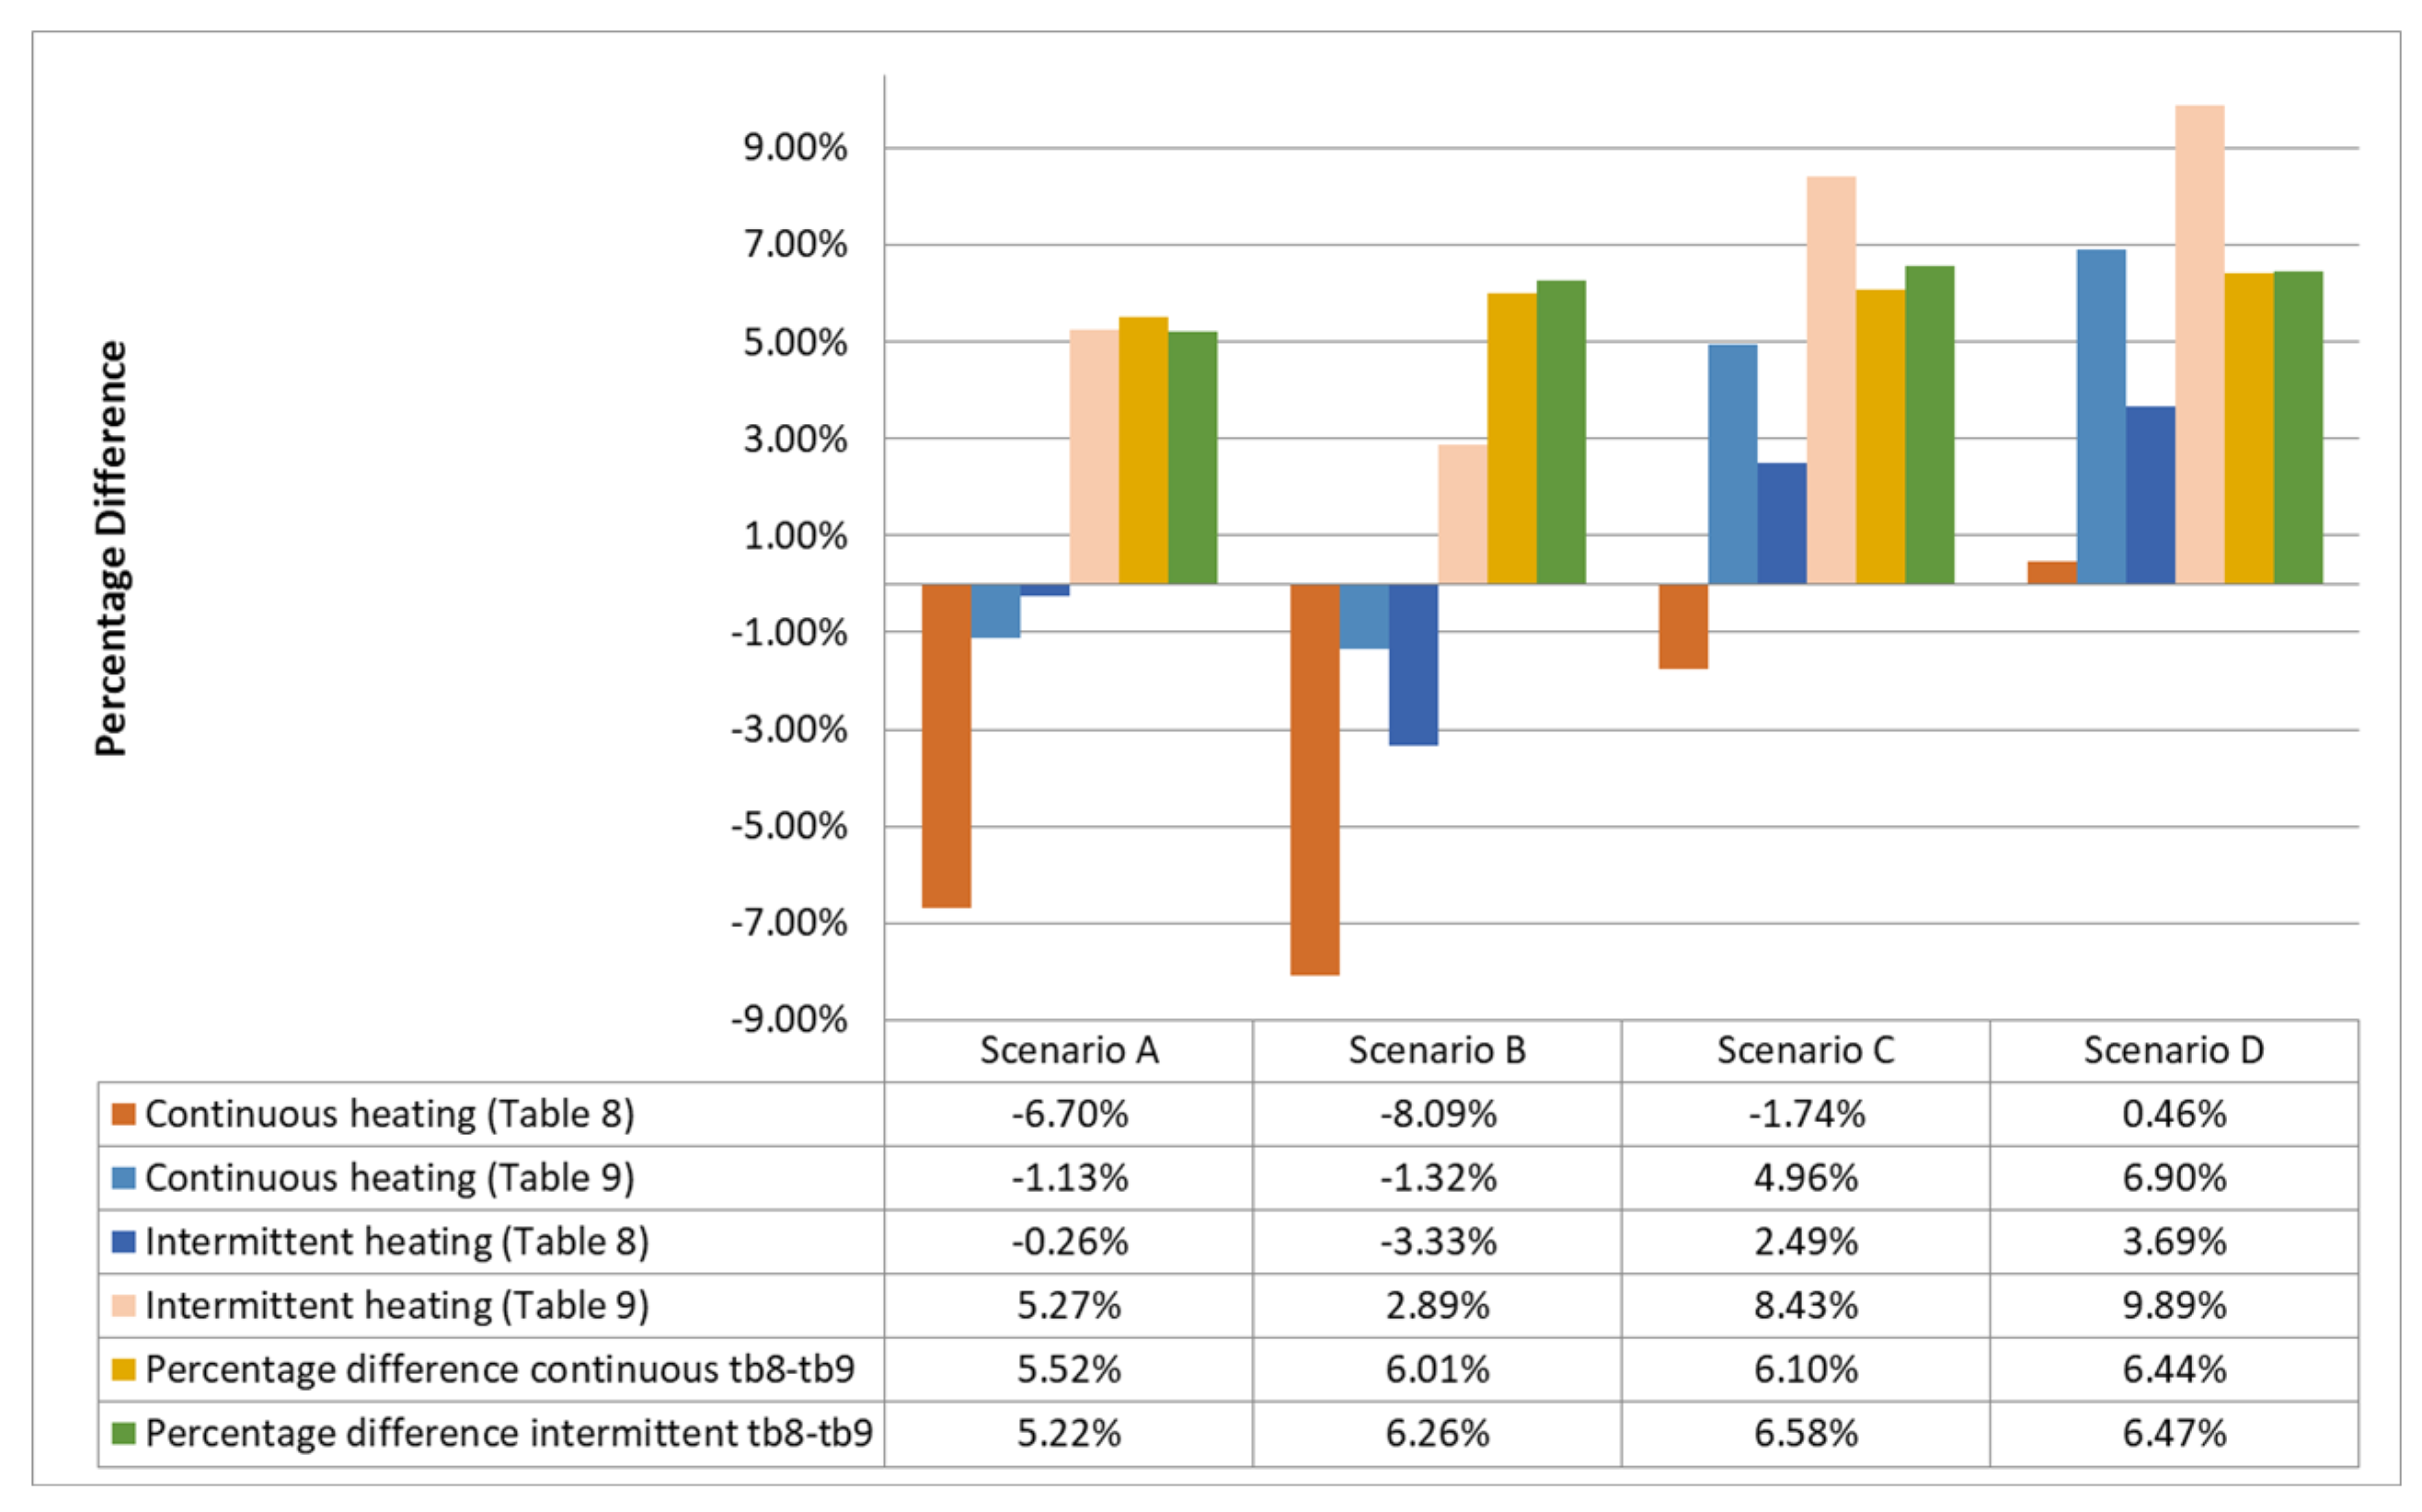
The differences indicate an interesting trend when comparing Mc001-2022 results with PHPP results for Case Study No. 2. In Scenario A, the intermittent heating demand is higher by 0.3% compared to PHPP, suggesting a higher heating demand prediction when temperature setbacks are considered. Similarly, in Scenario B, the intermittent heating demand is higher, with an increase of 3.3%, while in Scenarios C and D, a decrease of 2.5% and 3.7%, respectively, is seen compared to PHPP results. For the continuous heating case, the differences also show a consistent increase for Scenarios A, B, and C, with values equal to 6.7%, 8.1%, and 1.7%, respectively, while for Scenario D, a slight decrease of 0.5% compared to PHPP is observed.
The continuous heating for Case Study No. 1, shows a significant increase compared to intermittent heating across all scenarios: Scenario A has a continuous heating demand that is 5.9% higher than intermittent heating, Scenario B shows a 5.4% higher demand, Scenario C indicates a 5.2% higher demand, and Scenario D reveals a 5.1% higher demand. Comparably, for Case Study No. 2, the continuous heating demand is consistently higher than the intermittent heating demand across all scenarios. The increases range from 3.4% in Scenario D to 6.4% in Scenario A. This indicates that maintaining a constant indoor temperature without setbacks (continuous heating) generally requires more energy than allowing temperature setbacks (intermittent heating).
In analyzing the heating demand results from
Table 9 compared to
Table 7, there are significant differences between continuous and intermittent heating scenarios across both case studies (see
Figure 5). For Case Study No. 1, the continuous heating demand shows an increase of 16.3% in Scenario A, identified as a minimum difference, and an increase of 26.2% in Scenario D, identified as a maximum difference when compared to PHPP results. Similarly, the minimum increase for intermittent heating is 10.0% in Scenario A and the maximum is 20.7% in Scenario D.
For Case Study No. 2, the results take a different turn. For continuous heating, the demand shows a maximum increase of 1.3% in Scenario B and a maximum decrease of 6.9% in Scenario D compared to PHPP results. For intermittent heating, the demand shows a minimum decrease of 2.89% in Scenario B and a maximum decrease of 9.9% in Scenario D compared to PHPP results. These findings highlight the variability in heating demand predictions between the Mc001-2022 methodology and PHPP across different scenarios and case studies.
For Case Study No. 1, when comparing continuous and intermittent heating, one can see that the values are higher within a percentage of 4.5% to 5.7%, similar to the results from
Table 8. For Case Study No. 2, the same trend is identified, with increases ranging from 3.3% to 6.8%, thus supporting the earlier conclusion that continuous heating consistently results in higher energy demand than intermittent heating, as mentioned in literature findings [52-54]. Nevertheless, the differences between the two cases do not exceed 7% for both case studies.
3.3. Final Discussions
The analysis of heating demand results for Case Study No. 1 and Case Study No. 2 reveals distinct trends in how the Mc001-2022 and PHPP methodologies predict energy requirements. For Case Study No. 1, continuous heating demands calculated by Mc001-2022 are consistently higher than those calculated by PHPP, with increases ranging from 15.5% to 27.2%. Similarly, intermittent heating demands are also higher, with increases ranging from 9.1% to 21.0%. These findings highlight the robustness of Mc001-2022 in capturing the complexities of continuous operation and intermittent heating scenarios for the analyzed building.
In contrast, Case Study No. 2 shows a different trend. For continuous heating, Mc001-2022 shows a maximum increase of 8.1% in Scenario B (
Table 8) and a maximum decrease of 6.9% in Scenario D (
Table 9) compared to PHPP results. For intermittent heating, the demand shows a maximum increase of 3.3% in Scenario B (
Table 8) and a maximum decrease of 9.9% in Scenario D (
Table 9) compared to PHPP results. These variations emphasize the sensitivity of heating demand predictions to different climatic data sources, case studies and calculation methodologies.
The differing trends in heating demand results between the two case study buildings indicate that there is no "one-size-fits-all" solution for energy performance assessment. The external boundary conditions play a crucial role in determining heating demand. For Case Study No. 1, the climatic conditions used in PHPP (
Table 8) were closer to those mandated by design legislation in Mc001-2022 (
Table 9). However, the average difference between the apparent sky temperature and the air temperature and the solar radiation intensities used to get the results in
Table 8 differed from those used in calculating the values in
Table 9. Thus, it indicated that even slight variations in climatic data can lead to significant differences in heating demand predictions.
A range of studies have highlighted the same issue regarding the sensitivity of heating demand predictions to different climatic data sources. Mahdavi et al. [
55] noted that different weather data sets can lead to significant fluctuations in the predicted heating and cooling energy demands of buildings. In contrast, standard climate indicators like heating and cooling degree days can impact buildings' heating and cooling loads. Maučec et al. [
56] mentioned that one of the critical design parameters impacting the energy demand for heating of timber buildings was the internal set-point temperature in moderate and cold climates. De Masi et al. [
57] also highlighted that using different weather data sources resulted in significant deviations in estimated energy consumption and energetic and environmental indexes, which can lead to inaccuracies in energy savings values and, consequently, affect retrofit approaches.
Another notable factor contributing to the differences in results between
Table 7,
Table 8 and
Table 9 is how PHPP calculates the building's thermal capacity and applies set temperature corrections. The simplified method from the SR EN ISO 52016-1 standard [
23], adopted in Mc001-2022, allows users to select the value of the internal thermal capacity based on a range from very light to very massive for monthly calculations. This flexibility can lead to discrepancies between the two calculation methodologies, as the choice of thermal capacity class significantly influences the heating demand outcomes.
Similar findings were identified in the literature, where Ferrari [
58] mentioned that the thermal capacity of building components has a decisive contribution to energy savings in both winter and summer conditions, contrary to common belief. Thus, the materials defining the building envelope components play a crucial role in assessing buildings' real heat transfer process. Muñoz et al. [
58] mentioned that the specific heat capacity of building materials is an essential factor, although commonly overlooked in building energy performance calculations. Varying the specific heat capacity of building materials can lead to significant energy savings, potentially up to 20%. Additionally, Simpson et al. [
60] performed a sensitivity analysis on heating a typical UK dwelling. They found that the internal set-point temperature is a critical design parameter impacting the energy demand for heating, highlighting the importance of considering detailed thermal properties in retrofit design. Similar conclusions were also highlighted by Imam et al. [
61], who noted that practitioners involved in energy modeling should agree on the importance of model parameters in the design activity.
Comparing the results from Mc001-2022 using PHPP climatic data from
Table 8 and nationally validated climatic data from
Table 9, does not consistently show that nationally validated data provides closer estimates to PHPP values. For Case Study No. 1, continuous and intermittent heating demands using PHPP climatic data as well as nationally validated climatic data, are higher than PHPP values. However, Case Study No. 2 has a mix of increases and decreases, indicating that the impact of using different climatic data sources varies depending on the case study and scenario.
These insights underscore the importance of selecting appropriate methodologies and climatic data sources tailored to the specific characteristics and requirements of each building. While Mc001-2022 may provide a more detailed analysis of operational dynamics, PHPP offers a dedicated framework for evaluating overall energy efficiency, particularly for Passive House standards, as also mentioned by literature [
40,
62,
63]. The findings suggest that the results from PHPP do not always indicate lower heating demands compared to Mc001-2022, highlighting the need for a careful and context-specific approach to energy performance assessment.
4. Conclusions
The construction sector significantly impacts European efforts to achieve sustainable development due to its high consumption of materials, nonrenewable energy, and emissions. The built environment has become a significant aggressor of the natural environment, mainly due to the current state of a substantial portion of the existing building stock, which is not energy efficient. In the European Union, improving the energy efficiency of buildings is a crucial regulatory target to reduce the negative environmental impact. Therefore, this study focuses on an energy renovation solution in Romania, examining the impact of improving the thermal performance of two investigated buildings. Additionally, the study compares the heating demand predictions using two methodologies, PHPP and Mc001-2022, across different climatic data sets and case studies.
The comparative study of PHPP and Mc001-2022 methodologies in predicting heating demands for existing residential buildings reveals significant variability in the results, highlighting the importance of methodological choice in energy performance assessments. The study indicates no consistent trend, where one methodology always predicts higher or lower heating demands than the other. For Case Study No. 1, Mc001-2022 generally predicted higher heating demands than PHPP, particularly for continuous heating scenarios. Thus, this suggests that Mc001-2022 might incorporate more detailed considerations of constant temperature maintenance and system interactions. Alternatively, for Case Study No. 2, the results varied more widely, with Mc001-2022 sometimes predicting higher demands and other times lower demands than PHPP. This variability underscores the sensitivity of heating demand predictions to external climatic conditions, internal set-point temperatures, and the specific characteristics of each building.
The study also highlights the impact of different climatic data sources on heating demand predictions. While using nationally validated climatic data in Mc001-2022 did not always result in closer alignment with PHPP values, it did emphasize the role of localized environmental conditions in determining energy performance. Furthermore, the differences in how PHPP and Mc001-2022 handle thermal capacity and temperature corrections play a crucial role in the discrepancies observed. The flexibility allowed in Mc001-2022 regarding the selection of internal thermal capacity can lead to significant differences in heating demand outcomes, as noted in the literature.
Overall, the findings suggest that there is no universal solution in building energy modeling. The choice of methodology and climatic data must be tailored to the specific context and requirements of each building to ensure accurate and reliable heating demand predictions. This study underscores the necessity for a nuanced and context-specific approach to energy performance assessment, taking into account the unique characteristics and operational dynamics of each building.
Author Contributions
Conceptualization, S.G.M, D.N.I. and L.M.M; methodology, S.G.M. and L.M.M.; software, S.G.M., L.M.M., I.R.V.B. and A.C.; validation, D.N.I. and L.M.M.; formal analysis, S.G.M., L.M.M and I.R.V.B.; investigation, S.G.M., L.M.M, I.R.V.B. and A.C.; resources, S.G.M., D.N.I. and L.M.M; data curation, S.G.M.; writing—original draft preparation, S.G.M, D.N.I., I.R.V.B. and L.M.M.; writing—review and editing, S.G.M, D.N.I., I.R.V.B. and L.M.M.; visualization, S.G.M. and L.M.M.; supervision, S.G.M, D.N.I. and L.M.M; project administration, D.N.I.; funding acquisition, D.N.I. All authors have read and agreed to the published version of the manuscript.
Funding
This work was supported by a grant of the Ministry of Research, Innovation and Digitization, CCCDI-UEFISCDI, project number PN-III-P2-2.1-PED-2021-4137, within PNCDI III-CT 714PED / 2022
Institutional Review Board Statement
Not applicable.
Informed Consent Statement
Not applicable.
Data Availability Statement
Not applicable.
Acknowledgments
In this section, you can acknowledge any support given which is not covered by the author contribution or funding sections. This may include administrative and technical support, or donations in kind (e.g., materials used for experiments).
Conflicts of Interest
The authors declare no conflict of interest.
References
- Nature. The world’s plan to make humanity sustainable is failing. Science can do more to save it. Nature 2023, 618, 647. Available online: https://www.nature.com/articles/d41586-023-01989-9 (accessed on 18 June 2024). [CrossRef]
- Ekins, P.; Zenghelis, D. The costs and benefits of environmental sustainability. Sustain. Sci. 2021, 16, 949–965. [Google Scholar] [CrossRef] [PubMed]
- Global Footprint Network. Available online: https://overshoot.footprintnetwork.org/ (accessed on 2 November 2023).
- Maxineasa, S.G. , Isopescu, D.N.; Baciu, I.-R.; Lupu, M.L. Environmental Performances of a Cubic Modular Steel Structure: A Solution for a Sustainable Development in the Construction Sector. Sustainability 2021, 13, 12062. [Google Scholar] [CrossRef]
- IPCC, 2023: Climate Change 2023: Synthesis Report. Contribution of Working Groups I, II and III to the Sixth Assessment Report of the Intergovernmental Panel on Climate Change [Core Writing Team, H. Lee and J. Romero (eds.)]. IPCC, Geneva, Switzerland, 184 pp. [CrossRef]
- European Commission, Directorate-General for Communication. What is the European Green Deal?. Publications Office, 2019. https://data.europa.eu/doi/10.2775/275924.
- European Commission. Communication from the Commission to the European Parliament. The European Council, The Council, The European Economic and Social Committee and the Committee of the Regions. The European Green Deal, 2019.
- Schito, E.; Lucchi, E. Advances in the Optimization of Energy Use in Buildings. Sustainability 2023, 15, 13541. [Google Scholar] [CrossRef]
- Kukharets, V.; Hutsol, T.; Kukharets, S.; Glowacki, S.; Nurek, T.; Sorokin, D. European Green Deal: The Impact of the Level of Renewable Energy Source and Gross Domestic Product per Capita on Energy Import Dependency. Sustainability 2023, 15, 11817. [Google Scholar] [CrossRef]
- Skaar, C., Labonnote N., Gradeci K. From Zero Emission Buildings (ZEB) to Zero Emission Neighbourhoods (ZEN): A Mapping Review of Algorithm-Based LCA. Sustainability 2018, 10(7), 2405. [CrossRef]
- Economidou, M., Todeschi, V., Bertoldi P., D’Agostino, D., Zangheri, P., Castellazzi, L. Review of 50 years of EU energy efficiency policies for buildings. Energy Build. 2020, 225, 110322. [CrossRef]
- D’Agostino, D., Tzeiranaki S.T., Zangheri, P., Bertoldi, P. Assessing Nearly Zero Energy Buildings (NZEBs) development in Europe. Energy Strat. Rev. 2021, 36, 100680. [CrossRef]
- European Commission, Communication from the Commission to the European Parliament, The European Council, The Council, The European Economic and Social Committee and the Committee of the Regions. A Renovation Wave for Europe - greening our buildings, creating jobs, improving lives, 2020.
- Filippidou, F. and Jimenez Navarro, J.P. Achieving the cost-effective energy transformation of Europe’s buildings, EUR 29906 EN, Publications Office of the European Union, Luxembourg, 2019, ISBN 978-92-76-12394-1. [CrossRef]
- Gkatzogias, K., Pohoryles, D., Romano, E., Bournas, D., Negro, P., Tsionis, G. and Dimova, S. Integrated seismic and energy renovation of buildings, EUR 31465 EN, Publications Office of the European Union, Luxembourg, 2023, ISBN 978-92-68-01355-7. [CrossRef]
- Eurostat. Available online: https://ec.europa.eu/eurostat/cache/visualisations/sdgs/index.html?country=EU27_2020&goal=SDG7&ind=4&chart=line (accessed on 7 November 2023).
- Council of the European Union, Fit for 55. Available online: https://www.consilium.europa.eu/en/policies/green-deal/fit-for-55-the-eu-plan-for-a-green-transition/#what (accessed on 10 November 2023).
- Eurostat. Available online: https://ec.europa.eu/eurostat/statistics-explained/index.php?title=Energy_consumption_in_households (accessed on 10 November 2023).
- Cojocaru A., Isopescu D.N., Maxineasa S.G., Petre S. Assessment of Thermal and Mechanical Properties of Cement-Based Materials. Part 1: Crumb Rubber Concrete, Buildings, Special Issue: Development and Characterization of Advanced and Sustainable Cement-Based Materials, 2023, 13(2). [CrossRef]
- Petre S.G., Isopescu D.N., Pruteanu M., Cojocaru AL. Effect of Exposure to Environmental Cycling on the Thermal Conductivity of Expanded Polystyrene. Materials 2022, 15(19).
- Maxineasa S.G., Isopescu D.N., Baciu I.-R., Lupu M.L. Environmental Performances of a Cubic Modular Steel Structure: A Solution for a Sustainable Development in the Construction Sector, Sustainability 2021, vol.13, nr.21. [CrossRef]
- Baciu I.-R., Isopescu D.N., Țăranu N., Lupu L.M., Maxineasa S.G., Comparative Analysis of the Effect of Different Types of Green Roofs over the Linear Thermal Bridges, The 8th International Conference on Modern Technologies in Industrial Engineering, ModTech 2020, IOP Conference Series: Materials Science and Engineering 2020, vol. 916. [CrossRef]
-
ISO 52016-1; Energy Performance of Buildings—Energy Needs for Heating and Cooling, Internal Temperatures and Sensible and Latent Heat Loads—Part 1: Calculation Procedures. ISO: Brussels, Belgium, 2017.
- Passive House Planning Package (PHPP). Available online: https://passivehouse.com/04_phpp/04_phpp.htm.
- van Dijk, D.; Spiekman, M. EN ISO 52016 and 52017: Calculation of the building's energy needs for heating and cooling, internal temperatures and heating and cooling load. REHVA Journal 2016, 6, 27–30. [Google Scholar]
- Campana, J.P.; Morini, G.L. BESTEST and EN ISO 52016 Benchmarking of ALMABuild, a New Open-Source Simulink Tool for Dynamic Energy Modelling of Buildings. Energies 2019, 12, 2938. [Google Scholar] [CrossRef]
- Summa, S.; Remia, G.; Sebastianelli, A.; Coccia, G.; Di Perna, C. Impact on Thermal Energy Needs Caused by the Use of Different Solar Irradiance Decomposition and Transposition Models: Application of EN ISO 52016-1 and EN ISO 52010-1 Standards for Five European Cities. Energies 2022, 15, 8904. [Google Scholar] [CrossRef]
- van Dijk, D. EN ISO 52016-1: The New International Standard To Calculate Building Energy Needs for Heating And Cooling, Internal Temperatures And Heating And Cooling Load. In Proceedings of the 16th IBPSA International Conference and Exhibition, Rome, Italy, 2–4 September 2019. Available online: https://ibpsa.org/proceedings/BS2019/BS2019_210503.pdf.
- Mauthe Degerfeld, F.B.; Ballarini, I.; De Luca, G.; Tootkaboni, M.P.; Corrado, V. Sensitivity Analysis of the Thermal Energy Need of a Residential Building Assessed by means of the EN ISO 52016 Simplified Dynamic Method. E3S Web Conference 2020, 197, 02012. [Google Scholar] [CrossRef]
- Mauthe Degerfeld, F.B.; Piro, M.; De Luca, G.; Ballarini, I.; Corrado, V. The application of EN ISO 52016-1 to assess building cost-optimal energy performance levels in Italy. Energy Rep. 2023, 10, 1702–1717. [Google Scholar] [CrossRef]
- Ballarini, I.; Costantino, A.; Fabrizio, E.; Corrado, V. The Dynamic Model of EN ISO 52016-1 for the Energy Assessment of Buildings Compared to Simplified and Detailed Simulation Methods. In Proceedings of the 16th IBPSA International Conference and Exhibition, Rome, Italy, 2–4 September 2019. Available online: https://ibpsa.org/proceedings/BS2019/BS2019_210592.pd.
- Passive House Institute. Criteria for Buildings: Passive House – EnerPHit – PHI Low Energy Building. Version 10c (IP), valid with PHPP Version 10, March 2023. Available online: https://passivehouse.com.
- Chen, M.; Gao, C.; Yu, Z.; Wang, J. Optimization Design Method Based on Energy Balance Calculations for Passive House. IOP Conference Series: Earth and Environmental Science 2020, 555, 012081. [Google Scholar] [CrossRef]
- Siegele, D., Dermentzis, G., Leonardi, E., Ochs, F., & Ksiezyk, A. Simulation Assisted Monitoring of a Multi-Family House – a Renovation Case Study. Proceedings of Building Simulation 2017: 15th Conference of IBPSA 2017. Unit for Energy Efficient Building, University of Innsbruck, Austria. [CrossRef]
- Kang, Y.; Ma, N.; Bunster, V.; Chang, V.W.-C.; Zhou, J. Optimizing the Passive House Planning Package simulation tool: A bottom-up dynamic approach to reduce building performance gap. Energy Build. 2022, 276, 112512. [Google Scholar] [CrossRef]
- Mahboob, M., Rashid, T. U., & Amjad, M. Assessment of Energy Saving Potential in Residential Sector of Pakistan through Implementation of NEECA and PEC Building Standards. 15th International Conference on Emerging Technologies (ICET) 2019. [CrossRef]
- Yu, S. , Kim, S., Seo, J., & Kim, S. Analysis of Energy Efficiency of Light-Weight Wood Frame House and Wooden Passive House Using PHPP. Journal of the Architectural Institute of Korea Planning & Design 2013, 29, 199–207. [Google Scholar]
- Šteffek, L. , Jelínek, P., Kalánek, J., & Ostrý, M. The Impact of the Choice of Computational Methods on the Results of Simulations of Specific Heat Consumption for Heating a Family House. Adv. Mater. Res. 2014, 899, 161–165. [Google Scholar]
- Mitchell, R. , & Natarajan, S. Normalising domestic space heating demand using post hoc models. Building Services Engineering Research and Technology 2019, 40(3), 340–359. [Google Scholar] [CrossRef]
- Johnston, D., Siddall, M., Ottinger, O., Peper, S., Feist, W. Are the energy savings of the Passive House standard reliable? A review of the as-built thermal and space heating performance of Passive House dwellings from 1990 to 2018. Energy Efficiency 2020. [CrossRef]
- Romanian Ministry of Development, Public Works and Administration. Mc001-2022 Methodology for Calculating the Energy Performance of Buildings. Monitorul Oficial al României 2023, Partea I, No. 46 bis.
- European Union. Directive (EU) 2018/844 of the European Parliament and of the Council of 30 May 2018 amending Directive 2010/31/EU on the energy performance of buildings and Directive 2012/27/EU on energy efficiency. Official Journal of the European Union 2018, L156, 75-91. Available online: https://eur-lex.europa.eu/legal-content/EN/TXT/?uri=CELEX:32018L0844.
- Ministry of Regional Development and Public Administration. Indicative Mc001 Part 6 Methodology for Calculating the Energy Performance of Buildings; Ministry of Regional Development and Public Administration: Bucharest, Romania, 2013.
- Eyre, N.; Fawcett, T.; Topouzi, M.; Killip, G.; Oreszczyn, T.; Jenkinson, K.; Rosenow, J. Fabric First: Is It Still the Right Approach? Buildings and Cities 2023, 4(1), 965–972. [Google Scholar] [CrossRef]
- Bassas, E.C.; Patterson, J.L.; Jones, P.J. A Review of the Evolution of Green Residential Architecture. Renew. Sustain. Energy Rev. 2020, 125, 109796. [Google Scholar] [CrossRef]
- C107 Norm for Thermotechnical Calculation of the Construction Elements of Buildings, Bucharest, Romania. 2005.
- Romanian Ministry of Transport, Construction, and Tourism. C107/5-2005: Normative regarding the Thermal Calculation of Building Elements in Contact with the Ground. (in Romanian).
- RDM Version 7.04. Available online: https://iut.univ-lemans.fr/ydlogi/rdm_version_7.html.
- EN ISO 10211. Thermal bridges in building construction – heat flows and surface temperatures – Detailed calculations. International Organization for Standardisation: Geneva, Switzerand, 2017.
- Ministry of Transportation. Constructions and Tourism, Indicative Mc001 Parts 1,2,3 Methodology for Calculating the Energy Performance of Buildings; Ministry of Transportation: Bucharest, Romania, 2006.
- Krick, B. , Schnieders, J., & Theumer, S. (n.d.). Adapted boundary conditions for energy balance calculation. Passive House Institute. Retrieved from https://passivehouse-international.org/upload/Adapted_boundary_conditions.pdf.
- Páger, S.; Földi, L.; Géczi, G. Comparative temperature and consumption data measurement of model buildings with different thermal time constants. Therm. Sci. 2023. [Google Scholar] [CrossRef]
- Tunçbilek, E.; Komerska, A.; Arıcı, M. Optimisation of wall insulation thickness using energy management strategies: Intermittent versus continuous operation schedule. Sustain. Energy Techn. 2022. [Google Scholar] [CrossRef]
- Xu, B.; Zhou, S.; Hu, W. An intermittent heating strategy by predicting warm-up time for office buildings in Beijing. Energy Build. 2017, 155, 35–42. [Google Scholar] [CrossRef]
- Mahdavi, A.; Leinich, V.; Orehounig, K. Implications of varying weather data sets for predictions of thermal performance of buildings. In Proceedings of the PLEA 2008—25th Conference on Passive and Low Energy Architecture 2008, Dublin, Ireland, 22–24 October.
- Maučec, D.; Premrov, M.; Leskovar, V.Ž. Use of sensitivity analysis for a determination of dominant design parameters affecting energy efficiency of timber buildings in different climates. Sustain. Energy Dev. 2021. [Google Scholar] [CrossRef]
- de Masi, R.F.; Gigante, A.C.; Ruggiero, S.; Vanoli, G.P. The impact of weather data sources on building energy retrofit design: Case study in heating-dominated climate of Italian backcountry. J. Build. Perform. Simul. 2020, 13, 264–284. [Google Scholar] [CrossRef]
- Ferrari, S. Building envelope and heat capacity: Re-discovering the thermal mass for winter energy saving. Environ. Eng. Sci. 2007. [Google Scholar]
- Muñoz, P.; González, C.; Recio, R.; Gencel, O. The role of specific heat capacity on building energy performance and thermal discomfort. Case Studies in Construction Materials 2022. [Google Scholar] [CrossRef]
- Simpson, K.; Childs, P.P.; Whyte, J.K. Sensitivity analysis of heating a typical UK dwelling and implications for retrofit design. Journal of Physics: Conference Series 2021, 2042, 012148. [Google Scholar] [CrossRef]
- Imam, S.; Coley, D.; Walker, I. The building performance gap: Are modellers literate? Build. Serv. Eng. 2017, 38(3), 351–375. [Google Scholar] [CrossRef]
- Kang, Y.; Ma, N.; Bunster, V.; Chang, V.W.-C.; Zhou, J. Optimizing the Passive House Planning Package simulation tool: A bottom-up dynamic approach to reduce building performance gap. Energy Build. 2022, 276, 112512. [Google Scholar] [CrossRef]
- Finegan, E.; Kelly, G.; O’Sullivan, G. Comparative analysis of Passivhaus simulated and measured overheating frequency in a typical dwelling in Ireland. Build. Res. Inf. 2019, 48(6), 681–699. [Google Scholar] [CrossRef]
|
Disclaimer/Publisher’s Note: The statements, opinions and data contained in all publications are solely those of the individual author(s) and contributor(s) and not of MDPI and/or the editor(s). MDPI and/or the editor(s) disclaim responsibility for any injury to people or property resulting from any ideas, methods, instructions or products referred to in the content. |
© 2024 by the authors. Licensee MDPI, Basel, Switzerland. This article is an open access article distributed under the terms and conditions of the Creative Commons Attribution (CC BY) license (http://creativecommons.org/licenses/by/4.0/).
